A Simple Model for Explaining Galaxy Rotation Curves


1
Institute of Physics, Maria Curie-Sklodowska University, pl. Marii Curie-Sklodowskiej 1, 20-031 Lublin, Poland
2
Department of Physics, West University of Timişoara, V. Pârvan Ave. 4, Timişoara RO-300223, Romania
3
Institute for Theoretical Physics, University of Wroclaw, pl. M. Borna 9, 50-204 Wroclaw, Poland
*
Author to whom correspondence should be addressed.
Galaxies 2018, 6(3), 70; https://doi.org/10.3390/galaxies6030070
Submission received: 7 June 2018
/
Revised: 2 July 2018
/
Accepted: 4 July 2018
/
Published: 13 July 2018
Abstract
:A new simple expression for the circular velocity of spiral galaxies is proposed and tested against HI Nearby Galaxy Survey (THINGS) data set. Its accuracy is compared with the one coming from MOND.
1. Introduction
The current Standard Cosmological Model, the so-called ΛCDM model [1,2], together with astronomical observations, indicates that there is about of dust matter which we know exists. From it we are able to detect only which is baryonic described by the Standard Model of particle physics. The rest of it is so-called Dark Matter [3,4,5,6] which is supposed to explain the flatness of rotational galaxies’ curves [7,8,9,10,11].
Nowadays, there are two main competing ideas for explaining the Dark Matter problem. The first one consists in modifying the geometric part of the gravitational field equations (see e.g., [12,13,14,15]) while the other one introduces weakly interacting particles which have failed to be detected [16]. Despite this, it is also believed that these two ideas do not contradict each other and could be combined together in some future successful theory.
If Dark Matter exists, it interacts only gravitationally with visible parts of our universe, and it seems to also have an effect on the large scale structure of our Universe [17,18]. There are some models which have faced the problem of this unknown ingredient. The famous one is called Modified Newtonian Dynamics (MOND) [19,20,21,22,23,24,25]—it has already predicted many galactic phenomena and this is why it is very popular among astrophysicists. It has already a relativistic version: the so-called Tensor/Vector/Scalar (TeVeS) theory of gravity [26,27]. The MOND result is also obtained when one considers an effect caused by a reaction of dark energy to the presence of baryonic particles [28,29]. Another approach is to consider Extended Theories of Gravity (ETGs) in which one modifies the geometric part of the field equations [30,31,32]. There were also attempts to obtain MOND result from ETGs, see for example [33,34,35,36,37,38]. The Weyl conformal gravity [39,40,41] is another interesting proposal for explaining rotation curves. Moreover, we would also like to mention the existence of a model based on large scale renormalization group effects and a quantum effective action [42,43,44]. In this work we will not consider any concrete theory of gravitation from which we provide the equation ruling the motion of galactic stars. Starting from the standard form of the geodesic equation, a formula for the rotational velocity will be derived. We will also present how our simple model matches the astrophysical data and how it possesses some similarities to the ones appearing in the literature. At the end we will draw our conclusions. The metric signature convention is (−, +, +, +).
2. Proposed Model
The standard expression of the quadratic velocity for a star moving on a circular trajectory around the galactic center is simply obtained from the GR in the weak field and small velocity approximations. One assumes that the orbit of a star in a galaxy is circular which is in a good agreement with astronomical observations [45]. Thus the relation between the centripetal acceleration and the velocity is simply:
A test particle as we treat a single star in our considerations satisfies the geodesic equation
Although the velocity of stars moving around the galactic center is very high, when compared with the speed of light, it turns out that they are still much smaller so we deal with the condition . It means that in the spherical-symmetric parametrization the velocities satisfy
where . Taking into account Equation (3) and considering the week field limit of Equation (2) together with (static spacetime), we obtain
Inserting Equation (4) into (1) one gets
with being a Newtonian potential (see for example [46]) such that finally we have
where G is gravitational constant while the mass M is usually assumed to be r-dependent, that is, one deals with some matter distribution depending on a concrete model. Let us assume the following simple distribution of mass in a galaxy [47]
with the total galaxy mass, the core radius and the observed scale length of the galaxy. The matter distribution in Equation (7) without the term containing the square root was also used in Reference [48]. Since the GR prediction on the shapes of galaxies’ curves coming from (6) failed against the observation data, one looks for some modification. The first one which appears in one’s mind is to consider a bit more complicated mass distribution which can also include Dark Matter halo in his form as well as different galaxy structure, for example disk, or other shapes.
We would like to perform a bit of a different approach, that is, let us modify the geometry part by, for example, considering effective quantities that could be obtained from Extended Theories of Gravity. There are many works following this approach which inspired us to examine a below toy model. The most interesting ones which do not assume the existence of any Dark Matter according to the authors are the following:
- The Modified Newtonian Dynamics (MOND) [22] (see also similar result in [49] and reviews in [19,24,25,38]). It is the most spread modification among astronomers since it is very simple, does not include any exotic ingredients (Dark Matter) and the most important, it is in good agreement with observations. The MOND velocity is given bywhere 1.2 × 10− ms−2 is the critical acceleration. Equation (8) is obtained from the Milgrom’s acceleration formulausing the standard interpolation functionIn the limit , the MOND formalism gives asymptotic constant velocities
- Our previous result [47], coming from Starobinsky model [51] considered in Palatini formalism which is the simplest example of EPS interpretation [52]where we assumed the order of as taken from cosmological considerations [53], is energy density obtained from mass distribution provided by the model and (7), see the details in [47].
We immediately observe that all these modifications coming from different models of gravity possess a feature which can be simply written as
where the unknown function depends on the radial coordinate and some parameters. In this manner, the function is treated as a deviation from the Newtonian limit of General Relativity.
Our task now is to find a suitable function which takes into account and reproduces the observed flatness of galaxy rotation curves. Moreover, at short distances (at least the size of the Solar System) the velocity from Equation (15) should have as a limit the Newtonian result . This imposes some constraints on the function .
3. A Particular Example
We have seen in the previous section that there are many alternatives to General Relativity which possess extra terms that improve the behavior of the galaxy curves. Moreover, many of them can have the same weak field limit producing the same result (15). Thus, one can explain the observed galaxy rotation curves using the Equation (15) without the assumption on the existence of Dark Matter.
In this section we would like to propose a model for fitting the galaxy rotation curves data observed astronomically. As we will see, the model fits quite well the data set of galaxies obtained from THINGS: The HI Nearby Galaxy Survey catalogue [54,55], on which our analysis is performed.
A very simple model that fits well the data (as can be seen from Figure 1 and Figure 2) is obtained by choosing
where b and are two parameters. The idea of including additionally term in the gravitational force without or with the Yukava potential, which improves the behaviour of the theoretically obtained curves, was already discussed in [56,57,58,59].
In the non-relativistic limit, the circular velocity and the gravitational potential are related through the usual formula , from which it follows immediately that
The dependence on in the potential was also reported in References [42,43,44,49,60]. Moreover, we observe that in the limit both Equations (17) and (18) reduce to their usual Newtonian expressions. It should also be mentioned that the considered form (17) can cause problems with lensing effect if one finds out the relativistic version of the model. There is a proposed mechanism in [61] which allows to interpolate between the short and long distance ranges in order to avoid the divergence of the effective mass when . It also takes into account the necessity of rescaling the gravitational mass (which appears because of the constant b) in order to save the desired properties of the model when we consider it in the case of the Solar System.
Using the matter distribution (7) and identifying the parameter contained in the Equation (17) with the galaxy scale length , the final rotational velocity of stars moving in circular orbits is
One can immediately deduce an important feature of the above formula, namely that in the limit of large radii we obtain flat rotation curves, similar to what happens in MOND theories [22,23,24] (see also Equation (11) above)
From the analysis of the 18 THINGS galaxies sample we have found to give good fit results for the rotation curves. The plots in Figure 1 and the best fit results from Table 1 are obtained using the value . As in [48] the value (for HSB galaxies) and (LSB galaxies) give good fit results. By allowing to be a free parameter, slightly better fits results can be obtained. In this case a preliminary analysis indicates that for HSB galaxies and for LSB galaxies. However, in order to keep the free parameters to a minimum we have chosen here to fix the value of .
If we replace the matter distribution (7) in the Equation (17) with the one coming from the spherical version of the exponential disc profile [45]
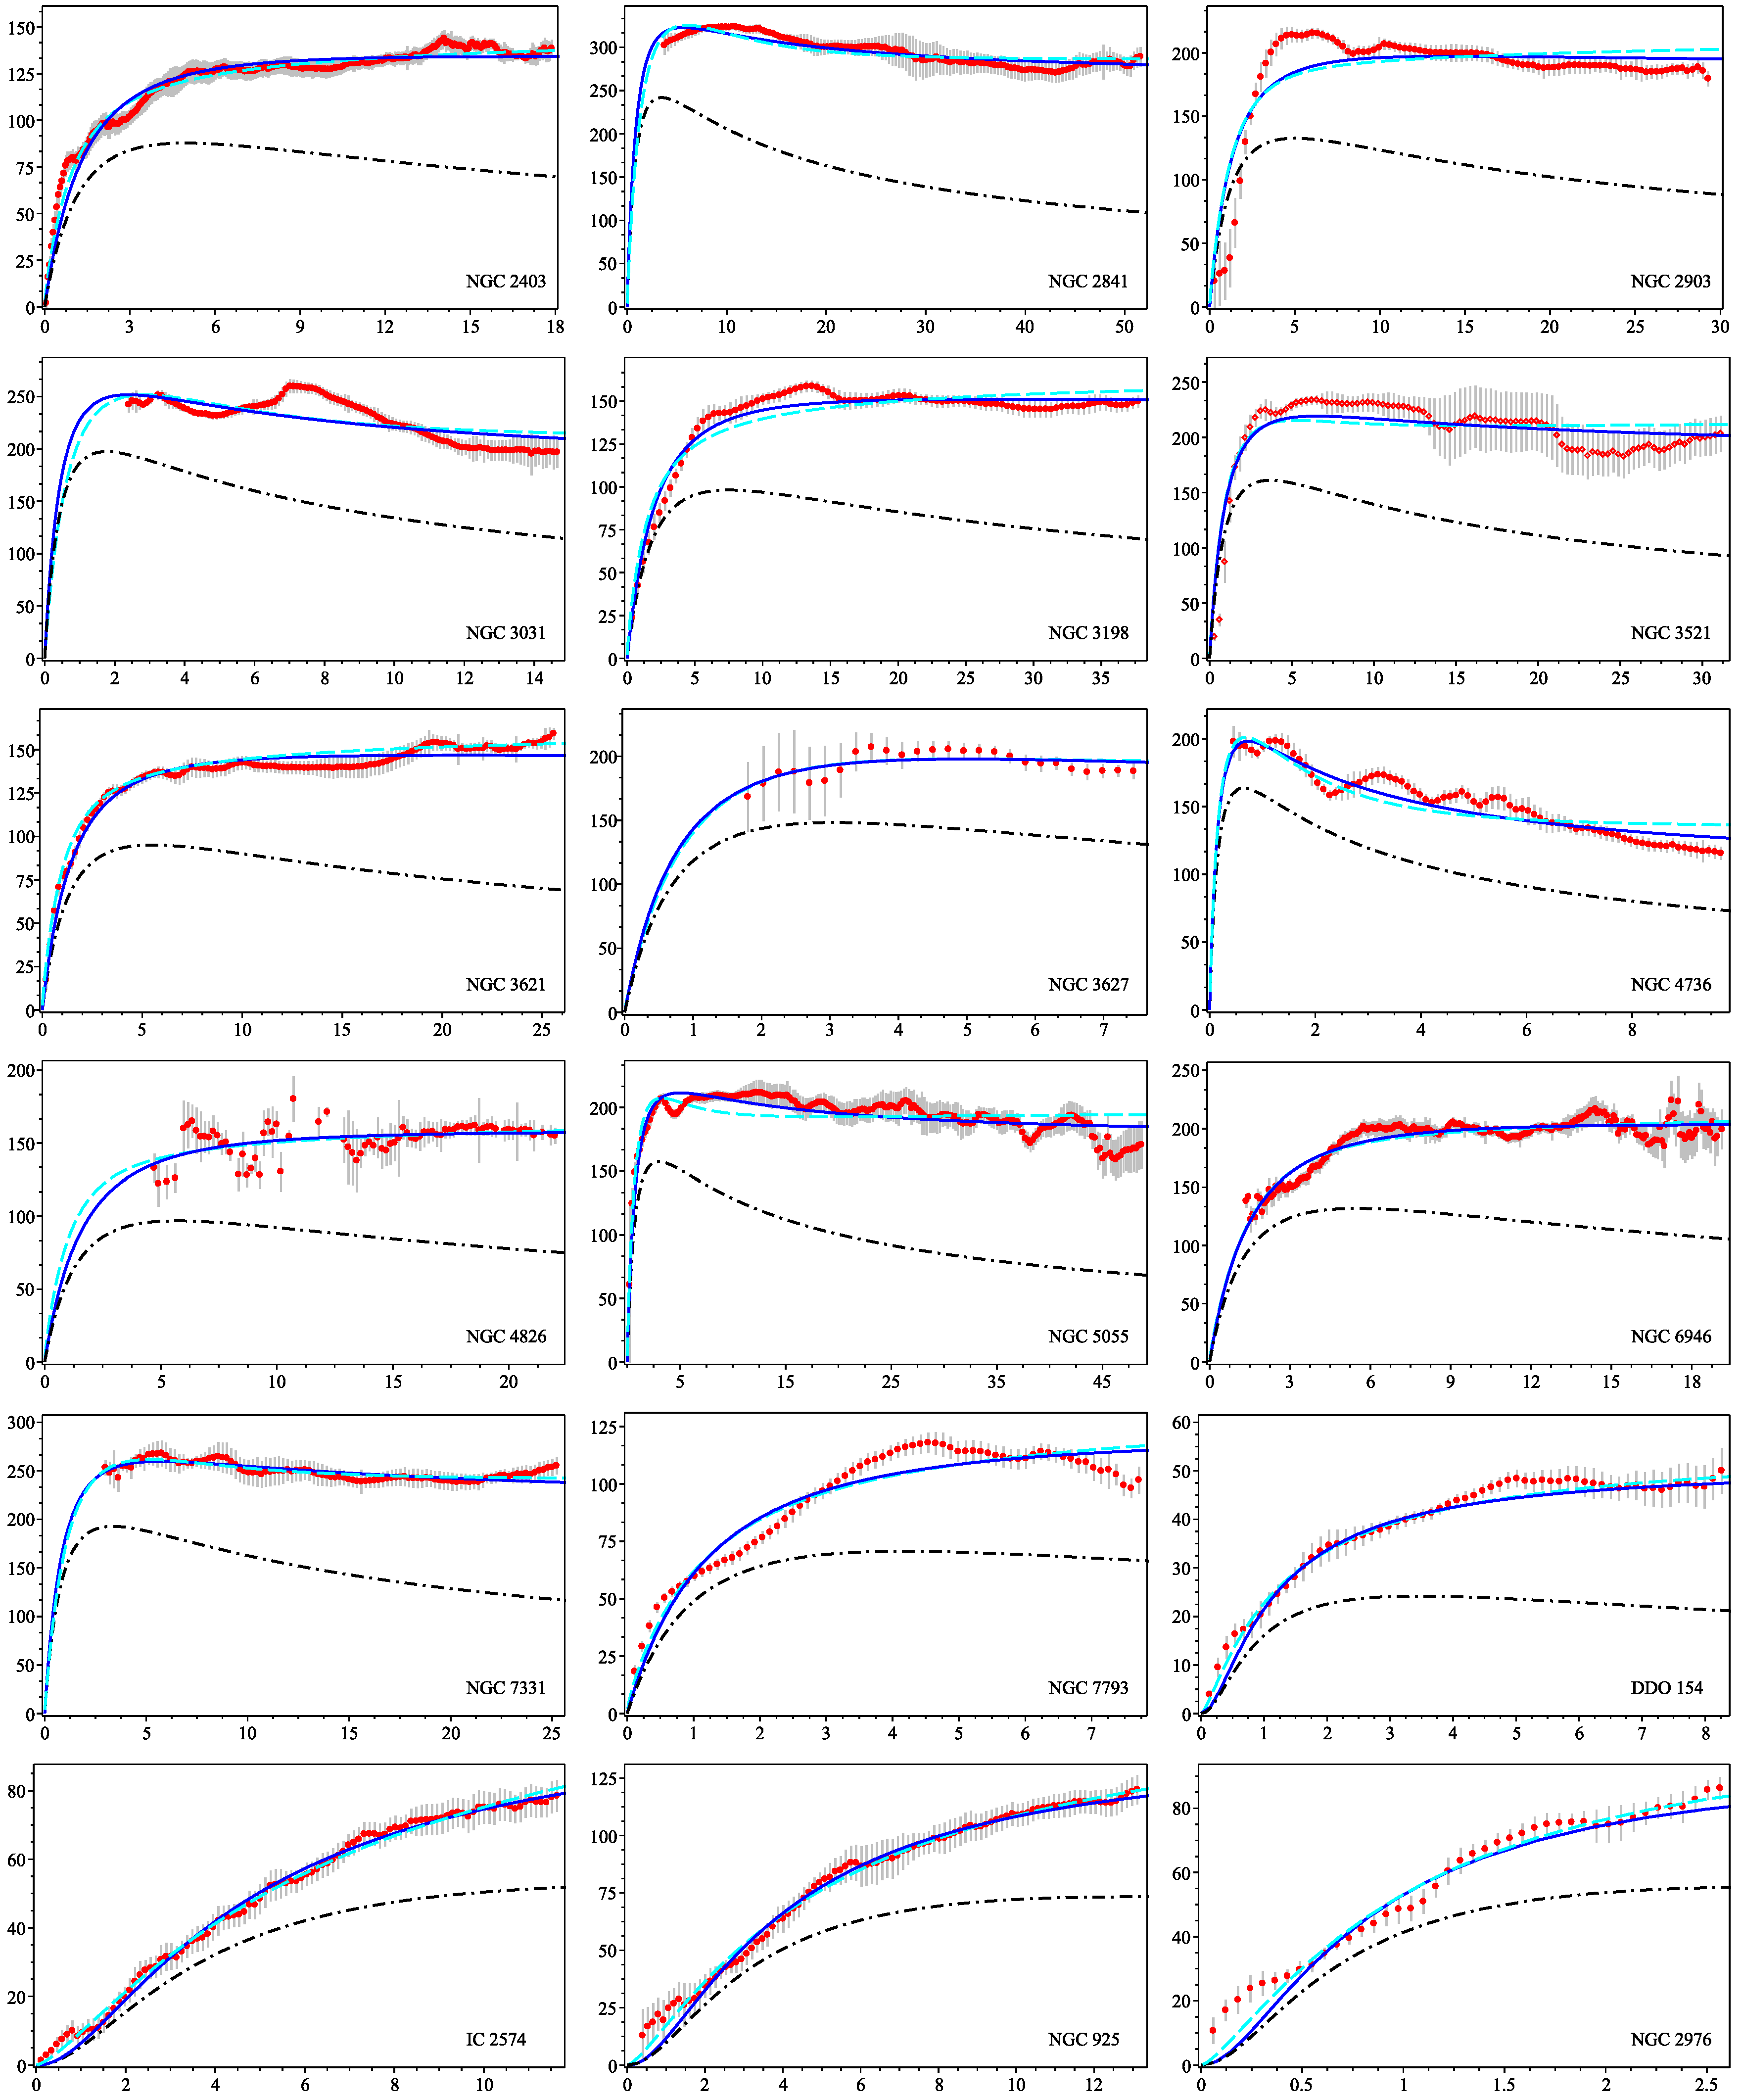
we can then fit the rotation curves using only as a free parameter. The resulted predicted values for the stellar mass of the galaxies are given in Table 2 together with the corresponding rotation curves in Figure 2. By combining the mass distributions (7) and (21) a “core-disk” model can be obtained. However, the resulted masses will be much lower that in the cases when the core mass distribution and the disk profile are considered to be independent. In Figure 3 we compare the resulted rotation curves using the three mass distributions for two galaxies.
The Tully-Fisher Relation
The empirical observational relation between the observed luminosity of a galaxy and the fourth power of the last observed velocity point is known as the Tully-Fisher relation [62]
which can be rewritten as
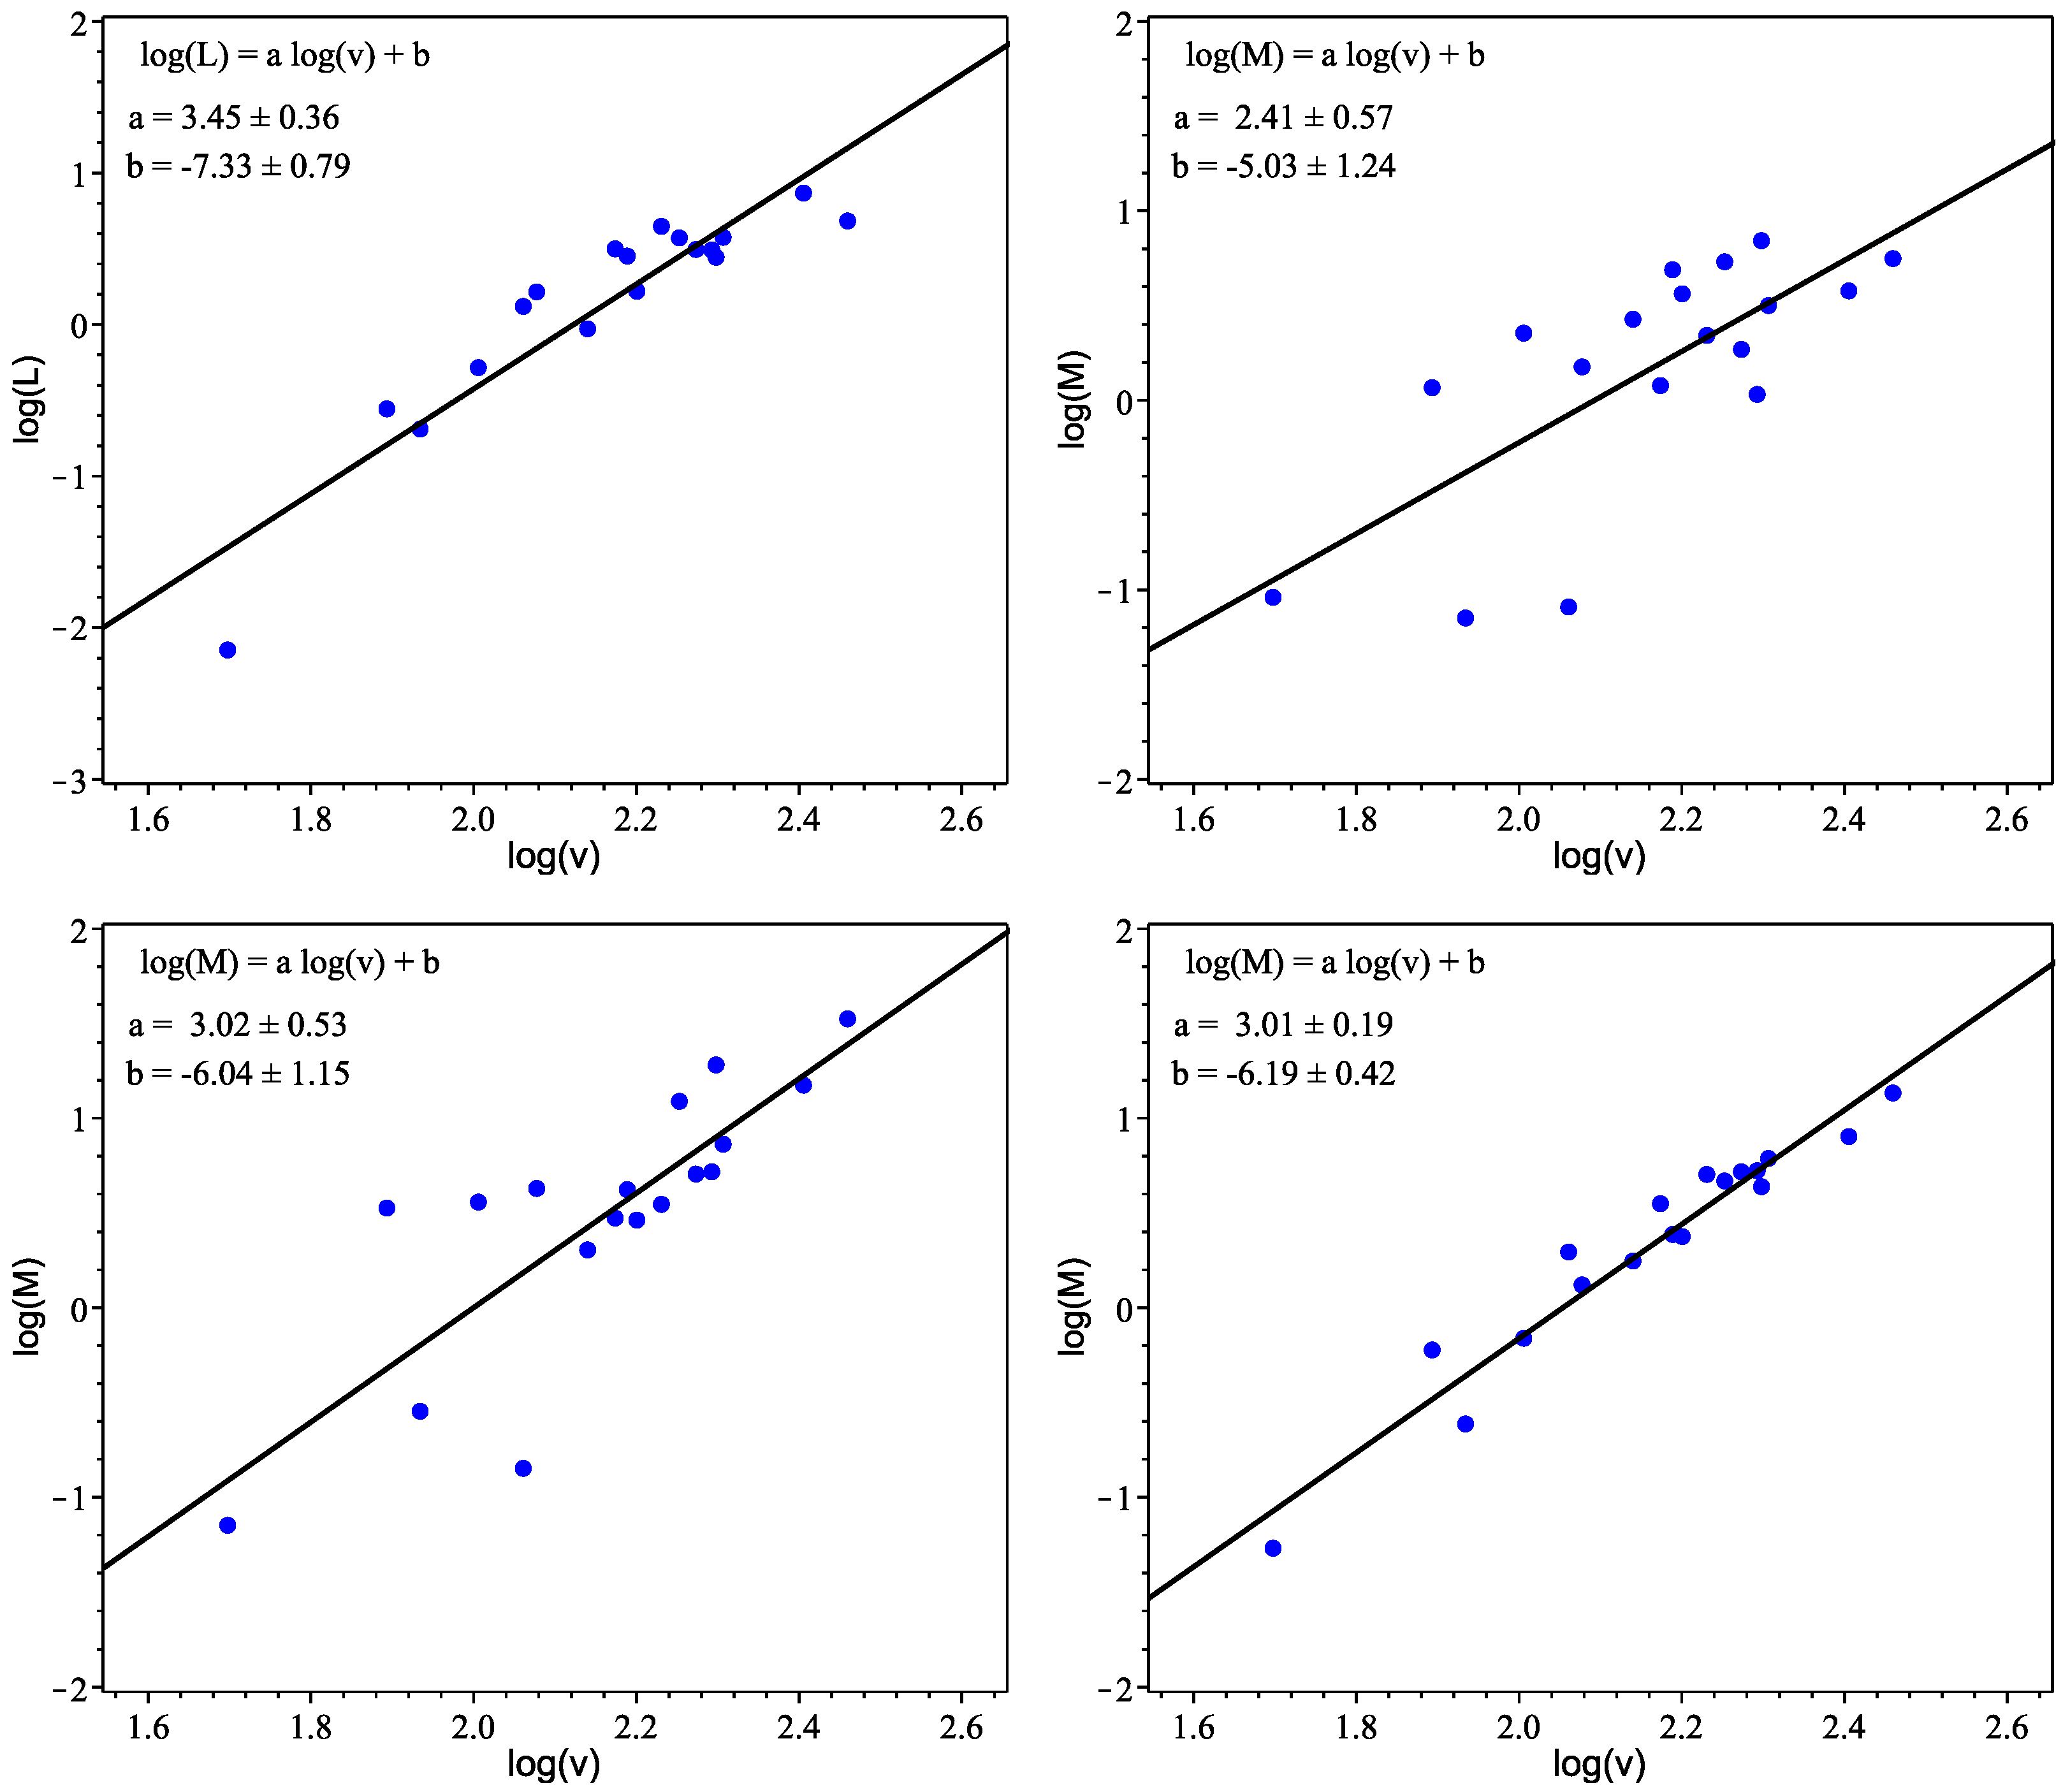
In the Figure 4 we have presented the observational Tully-Fisher relation (top-left panel) together with the fits of the parametric model given by the Equation (17) using the mass distribution (7) in the right-top panel and the spherical version of the exponential disk mass distribution (21) in the right-bottom panel, respectively. The left-bottom panel presents the Tully-Fisher relation coming from MOND mass predictions.
4. Discussion and Conclusions
In the presented paper we have considered the possible explanation of observed galactic rotation curves by the assumption that the observed effect of the flatness can be explained by some alternative theory of gravity which introduces an extra term which we called . This term can be treated as a deviation from the Newtonian limit of GR.
Our results are presented in Table 1 and Table 2 together with the plots in Figure 1 and Figure 2. Although we would like to consider this contribution like something coming from a slightly different geometry appearing in the modified Einstein field equations, it can be also thought of as some extra field, for example the scalar one which has recently been considered as an agent of the cosmological inflation [63,64,65,66]. This choice for in (16) could be explained by considering two conformally related metrics (the GR metric and a “dark metric” [67,68]) as proposed in [47]. However, so far we have not been able to find a suitable metric . This means that one needs to know a form of a lagrangian in the case of Palatini gravity in order to know the form of the dark metric.
From now on we shall compare the new phenomenological model proposed in Section 2 for explaining flat galaxy rotation curves with the widely accepted MOND model.
Let us start analyzing the predictions from Table 1. Comparing Column (7) and Column (3) from the Table 1 we observe that in all galaxies of the sample (excepting NGC4826 and NGC7793) the predicted core radius is smaller than the galaxy length scale . The same is true for MOND (excepting galaxies NGC7793, DDO154 and IC2574). The ratio between the predicted MOND mass in Column (10) and the predicted mass in Column (6) is in the interval (0.4, 8.1) such that for 13 out of 18 galaxies the MOND mass is higher.
The stellar mass-to-light ratio (denoted ) is usually estimated in the literature [69,70,71] by using color-to-mass-to-light ratio relations (CMLR) of the type
are two parameters and i is the band of the measured data. Then using the observed luminosity in the corresponding band, an estimate of the stellar mass is obtained. In [70] the authors use CMLR and four stellar population synthesis models [71,72,73,74] to compute the stellar mass for a sample of 40 galaxies, including 13 of the THINGS galaxies used in this paper. Comparing our predicted stellar mass from the Table 1, Column (6) with the values from the Table 3 in [70] and/or the values from the Tables 3 and 4 in [54] we have found that for five galaxies the predicted mass in Column (6) is in very good agreement, for seven galaxies the mass is higher, while for four of the galaxies the mass is slightly lower. Looking now at the values of Column (9) in the Table 1 and Column (5) in the Table 2 we can say that the values of are in agreement with what is expected based on stellar population models [70]. However, using the spherical mass distribution (21) for LSB galaxies does not result in good fits for the rotational curves.
In Column (8) and Column (12) of Table 1 the values of reduced are presented. These values were computed using the standard definition: , where N is the number of observational velocity data points; n is the number of parameters to be fitted; and
Taking all of the above into account, one arrives to the conclusion that the new model (which does not assume the existence on any type of Dark Matter) proposed in this paper gives very good flat rotation curves fits of the 18 THINGS galaxies in the data sample. Moreover, when compared with MOND, the difference between the two set of fits is small and thus one is not able to say which model is better than the other one for the explanation of the rotation curves.
We had not had any concrete theory in mind when we wanted to check our assumptions on the modification term . Since we have been influenced by the results obtained by the others (briefly described in Section 2), we wanted to find much simpler modification apart from MOND which also provides a required shape of the galaxies’ curves. Therefore now, when we have shown that observational data does not exclude the obtained result (19), it is stimulating to think about existing theories of gravity.
The proposed model presented in this paper (enclosed in Equation (19)) can be viewed for now as a phenomenological model, until a concise theory of gravity from which it can be derived, will be found or constructed. We started to tackle this task, thus working on a given theory of gravity which produces a simple modification of the quadratic velocity is a topic of our current research.
References
Author Contributions
All authors contributed to Conceptualization, Methodology and writing the draft of the paper.
Funding
A.W. was partially supported by the grant of the Polish National Science Center (NCN) DEC-2014/15/B/ST2/00089. C.A.S. was partially supported by a grant of the Romanian Ministry of National Education and Scientific Research, RDI Programme for Space Technology and Advanced Research—STAR, project number 181/20.07.2017.
Acknowledgments
This work made use of THINGS, “The HI Nearby Galaxy Survey” (Walter et al. 2008). We would like to thank Fabian Walter and Erwin de Blok for helping us in obtaining the RC data from the THINGS catalogue. This article is based upon work from the COST Action CA15117, supported by COST (European Cooperation in Science and Technology).
Conflicts of Interest
The authors declare no conflict of interest.
References
- Ostriker, J.P.; Steinhardt, P.J. The observational case for a low-density Universe with a non-zero cosmological constant. Nature 1995, 377, 600–602. [Google Scholar] [CrossRef]
- Peebles, P.J.E. Tests of cosmological models constrained by inflation. Astrophys. J. 1984, 284, 439–444. [Google Scholar] [CrossRef]
- Joyce, A.; Lombriser, L.; Schmidt, F. Dark Energy Versus Modified Gravity. Ann. Rev. Nucl. Part. Sci. 2016, 66, 95–122. [Google Scholar] [CrossRef] [Green Version]
- Plank 2015 Results. Available online: https://www.cosmos.esa.int/web/planck/publications (accessed on 13 July 2018).
- Sanders, R.H. The Dark Matter Problem: A Historical Perspective; Cambridge University Press: Cambridge, UK; New York, NY, USA, 2010. [Google Scholar]
- Trimble, V. Existence and nature of dark matter in the universe. Annu. Rev. Astron. Astrophys. 1987, 25, 425–472. [Google Scholar] [CrossRef]
- Rubin, V.C.; Kent Ford, W., Jr. Rotation of the Andromeda Nebula from a Spectroscopic Survey of Emission Regions. Astrophys. J. 1970, 159, 379. [Google Scholar] [CrossRef]
- Rubin, V.C.; Kent Ford, W., Jr.; Thonnard, N. Rotational properties of 21 SC galaxies with a large range of luminosities and radii, from NGC 4605 (R = 4 kpc) to UGC 2885 (R = 122 kpc). Astrophys. J. 1980, 238, 471–487. [Google Scholar] [CrossRef]
- Karukes, E.V.; Salucci, P. The universal rotation curve of dwarf disc galaxies. Mon. Not. R. Astron. Soc. 2017, 465, 4703–4722. [Google Scholar] [CrossRef]
- Salucci, P.; Lapi, A.; Tonini, C.; Gentile, G.; Yegorova, I.; Kleinet, U. The universal rotation curve of spiral galaxies—II. The dark matter distribution out to the virial radius. Mon. Not. R. Astron. Soc. 2007, 378, 41–47. [Google Scholar] [CrossRef]
- Sofue, Y.; Rubin, V. Rotation Curves of Spiral Galaxies. Ann. Rev. Astron. Astrophys. 2001, 39, 137–174. [Google Scholar] [CrossRef] [Green Version]
- Capozziello, S.; De Laurentis, M. Extended Theories of Gravity. Phys. Rep. 2011, 159, 167–321. [Google Scholar] [CrossRef]
- Capozziello, S.; Faraoni, V. Beyond Einstein Gravity: A Survey of Gravitational Theories for Cosmology and Astrophysics; Springer Science and Business Media: Berlin, Germany, 2010; Volume 170. [Google Scholar]
- Nojiri, S.; Odintsov, S.D. Dark energy, inflation and dark matter from modified F(R) gravity. In Problems of Modern Theoretical Physics : A Volume in Honour of Prof. I.L.Buchbinder in the Occasion of His 60th Birthday; Tomsk State Pedagogical University Press: Tomsk, Russia, 2008. [Google Scholar]
- Nojiri, S.; Odintsov, S.D. Unified cosmic history in modified gravity: From F(R) theory to Lorentz non-invariant models. Phys. Rep. 2011, 505, 59–144. [Google Scholar] [CrossRef]
- Bertone, G.; Hooper, D.; Silk, J. Particle dark matter: Evidence, candidates and constraints. Phys. Rep. 2005, 405, 279–390. [Google Scholar] [CrossRef]
- Davis, M.; Efstathiou, G.; Frenk, C.S.; White, S.D. The evolution of large-scale structure in a universe dominated by cold dark matter. Astrophys. J. 1985, 292, 371–394. [Google Scholar] [CrossRef]
- Refregier, A. Weak Gravitational Lensing by Large-Scale Structure. Annu. Rev. Astron. Astrophys. 2003, 41, 645–668. [Google Scholar] [CrossRef] [Green Version]
- Bekenstein, J.D. The modified Newtonian dynamics—MOND and its implications for new physics. Contemp. Phys. 2006, 47, 387–403. [Google Scholar] [CrossRef] [Green Version]
- McGaugh, S.S.; De Blok, W.J.G. Testing the Hypothesis of Modified Dynamics with Low Surface Brightness Galaxies and Other Evidence. Astrophys. J. 1998, 499, 66. [Google Scholar] [CrossRef] [Green Version]
- McGaugh, S.S. Novel Test of Modified Newtonian Dynamics with Gas Rich Galaxies. Phys. Rev. Lett. 2011, 106, 121303. [Google Scholar] [CrossRef] [PubMed]
- Milgrom, M. A modification of the Newtonian dynamics as a possible alternative to the hidden mass hypothesis. Astrophys. J. 1983, 270, 365–370. [Google Scholar] [CrossRef]
- Milgrom, M. A modification of the Newtonian dynamics—Implications for galaxies. Astrophys. J. 1983, 270, 371–389. [Google Scholar] [CrossRef]
- Milgrom, M. The MOND paradigm. arXiv, 2008; arXiv:0801.3133. [Google Scholar]
- Sanders, R.H.; McGaugh, S.S. Modified Newtonian Dynamics as an Alternative to Dark Matter. Annu. Rev. Astron. Astrophys. 2002, 40, 263–317. [Google Scholar] [CrossRef] [Green Version]
- Bekenstein, J.D. Relativistic gravitation theory for the modified Newtonian dynamics paradigm. Phys. Rev. D 2004, 70, 083509. [Google Scholar] [CrossRef]
- Moffat, J.W.; Toth, V.T. Rotational velocity curves in the Milky Way as a test of modified gravity. Phys. Rev. D 2015, 91, 043004. [Google Scholar] [CrossRef]
- Cadoni, M.; Casadio, R.; Giusti, A.; Muck, W.; Tuveri, M. Effective fluid description of the dark universe. Phys. Lett. B 2018, 776, 242–248. [Google Scholar] [CrossRef]
- Cadoni, M.; Casadio, R.; Giusti, A.; Tuveri, M. Emergence of a dark force in corpuscular gravity. Phys. Rev. D 2018, 97, 044047. [Google Scholar] [CrossRef] [Green Version]
- Iorio, L.; Ruggiero, M.L. Solar System tests of some models of modified gravity proposed to explain galactic rotation curves without dark matter. Sch. Res. Exchange 2008, 2008, 968393. [Google Scholar] [CrossRef]
- Sebastiani, L.; Vagnozzi, S.; Myrzakulov, R. Static spherically symmetric solutions in mimetic gravity: Rotation curves and wormholes. Class. Quantum Gravity 2016, 33, 125005. [Google Scholar]
- Capozziello, S.; Cardone, V.F.; Trois, A. Dark energy and dark matter as curvature effects? J. Cosmol. Astropart. Phys. 2006, 2006, 001. [Google Scholar] [CrossRef]
- Barrientos, E.; Mendoza, S. A relativistic description of MOND using the Palatini formalism in an extended metric theory of gravity. Eur. Phys. J. Plus 2016, 131, 367. [Google Scholar] [CrossRef]
- Barvinsky, A.O. Dark matter as a ghost free conformal extension of Einstein theory. J. Cosmol. Astropart. Phys. 2014, 2014, 014. [Google Scholar] [CrossRef]
- Bernal, T.; Capozziello, S.; Hidalgo, J.C.; Mendoza, S. Recovering MOND from extended metric theories of gravity. Eur. Phys. J. C 2011, 71, 1794. [Google Scholar] [CrossRef]
- Bruneton, J.P.; Esposito-Farese, G. Field-theoretical formulations of MOND-like gravity. Phys. Rev. D 2007, 76, 124012. [Google Scholar] [CrossRef]
- Esposito-Farese, G. Motion in Alternative Theories of Gravity. Fundam. Theor. Phys. 2011, 162, 461–489. [Google Scholar]
- Famaey, B.; McGaugh, S.S. Modified Newtonian Dynamics (MOND): Observational Phenomenology and Relativistic Extensions. Living Rev. Relativ. 2012, 15, 10. [Google Scholar] [CrossRef] [PubMed]
- Mannheim, P.D.; O’Brien, J.G. Impact of a Global Quadratic Potential on Galactic Rotation Curves. Phys. Rev. Lett. 2011, 106, 121101. [Google Scholar] [CrossRef] [PubMed]
- Mannheim, P.D.; O’Brien, J.G. Fitting galactic rotation curves with conformal gravity and a global quadratic potential. Phys. Rev. D 2012, 85, 124020. [Google Scholar] [CrossRef]
- Mannheim, P.D. Alternatives to dark matter and dark energy. Prog. Part. Nucl. Phys. 2006, 56, 340–445. [Google Scholar] [CrossRef] [Green Version]
- Rodrigues, D.C.; Letelier, P.S.; Shapiro, I.L. Galaxy rotation curves from general relativity with renormalization group corrections. J. Cosmol. Astropart. Phys. 2010, 2010, 020. [Google Scholar] [CrossRef]
- Rodrigues, D.C.; de Oliveira, P.L.; Fabris, J.C.; Gentile, G. Modified gravity models and the central cusp of dark matter haloes in galaxies. Mon. Not. R. Astron. Soc. 2014, 445, 3823–3838. [Google Scholar] [CrossRef] [Green Version]
- Rodrigues, D.C.; Mauro, S.; de Almeida, A.O.F. Solar System constraints on renormalization group extended general relativity: The PPN and Laplace-Runge-Lenz analyses with the external potential effect. Phys. Rev. D 2016, 94, 084036. [Google Scholar] [CrossRef] [Green Version]
- Binney, J.; Tremaine, S. Galactic Dynamics, 2nd ed.; Princeton University Press: Princeton, NY, USA, 2008. [Google Scholar]
- Weinberg, S. Gravitation and Cosmology: Principles and Applications of the General Theory of Relativity, 1st ed.; John Wiley & Sons: Hoboken, NJ, USA, 1972. [Google Scholar]
- Sporea, C.A.; Borowiec, A.; Wojnar, A. Galaxy rotation curves via conformal factors. Eur. Phys. J. C 2018, 78, 308. [Google Scholar] [CrossRef] [PubMed]
- Brownstein, J.R.; Moffat, J.W. Galaxy Rotation Curves without Nonbaryonic Dark Matter. Astrophys. J. 2006, 636, 721–741. [Google Scholar] [CrossRef] [Green Version]
- Mendoza, S.; Olmo, G.J. Astrophysical constraints and insights on extended relativistic gravity. Astrophys. Space Sci. 2015, 357, 133. [Google Scholar] [CrossRef]
- Capozziello, S.; Cardone, V.F.; Trois, A. Low surface brightness galaxy rotation curves in the low energy limit of Rn gravity: No need for dark matter? Mon. Not. R. Astron. Soc. 2007, 375, 1423–1440. [Google Scholar] [CrossRef]
- Starobinsky, A.A. A new type of isotropic cosmological models without singularity. Phys. Lett. B 1980, 91, 99–102. [Google Scholar] [CrossRef]
- Ehlers, J.; Pirani, F.A.E.; Schild, A. The Geometry of Free Fall and Light Propagation, in General Relativity; ORaifeartaigh, L., Ed.; Clarendon: Oxford, UK, 1972. [Google Scholar]
- Stachowski, A.; Szydlowski, M.; Borowiec, A. Starobinsky cosmological model in Palatini formalism. Eur. Phys. J. C 2017, 77, 406. [Google Scholar] [CrossRef]
- De Blok, W.J.G.; Walter, F.; Brinks, E.; Trachternach, C.; Oh, S.H.; Kennicutt, R.C., Jr. High-resolution rotation curves and galaxy mass models from THINGS. Astron. J. 2008, 136, 2648. [Google Scholar] [CrossRef]
- Walter, F.; Brinks, E.; De Blok, W.J.G.; Bigiel, F.; Kennicutt, R.C., Jr.; Thornley, M.D.; Leroy, A. THINGS: The HI Nearby Galaxy Survey. Astrophys. J. 2008, 136, 2563. [Google Scholar] [CrossRef]
- Finzi, A.; Pirani, F.A.E. On the Validity of Newton’s Law at a Long Distance. Mon. Not. R. Astron. Soc. 1963, 127, 21–30. [Google Scholar] [CrossRef]
- Tohline, J.E. Stabilizing a Cold Disk with a l/r Force Law. In Symposium-International Astronomical Union; Cambridge University Press: Cambridge, UK, 1983; Volume 100, pp. 205–206. [Google Scholar]
- Sanders, R.H. Anti-gravity and galaxy rotation curves. Astron. Astrophys. 1984, 136, L21–L23. [Google Scholar]
- Kuhn, J.R.; Kruglyak, L. Non-Newtonian Forces and the Missing Mass Problem. Astrophys. J. 1987, 313, 1–12. [Google Scholar] [CrossRef]
- Minguzzi, E. Possible relation between galactic flat rotational curves and the Pioneers’ anomalous acceleration. New Astron. 2006, 12, 142–145. [Google Scholar] [CrossRef] [Green Version]
- Acedo, L. Modified Newtonian Gravity as an Alternative to the Dark Matter Hypothesis. Galaxies 2017, 5, 74. [Google Scholar] [CrossRef]
- Tully, R.B.; Verheijen, M.A.; Pierce, M.J.; Huang, J.S.; Wainscoat, R.J. The Ursa Major Cluster of Galaxies. I. Cluster Definition and Photometric Data. Astrophys. J. 1996, 112, 2471. [Google Scholar]
- Linde, A.D. A new inflationary universe scenario: A possible solution of the horizon, flatness, homogeneity, isotropy and primordial monopole problems. Phys. Lett. B 1982, 108, 389–393. [Google Scholar] [CrossRef]
- Linde, A.D. Chaotic inflation. Phys. Lett. B 1983, 129, 177–181. [Google Scholar] [CrossRef]
- Linde, A.D. Hybrid inflation. Phys. Rev. D 1994, 49, 748. [Google Scholar] [CrossRef]
- Guth, A.H. Inflationary universe: A possible solution to the horizon and flatness problems. Phys. Rev. D 1981, 23, 347–356. [Google Scholar] [CrossRef]
- Capozziello, S.; De Laurentis, M.; Francaviglia, M.; Mercadante, S. From Dark Energy & Dark Matter to Dark Metric. Found. Phys. 2009, 39, 1161–1176. [Google Scholar] [Green Version]
- Fatibene, L.; Francaviglia, M. Mathematical Equivalence versus Physical Equivalence between Extended Theories of Gravitations. Int. J. Geom. Methods Mod. Phys. 2014, 11, 1450008. [Google Scholar] [CrossRef]
- Bell, E.F.; de Jong, R.S. Stellar Mass-to-Light Ratios and the Tully-Fisher Relation. Astrophys. J. 2001, 550, 212. [Google Scholar] [CrossRef]
- McGaugh, S.S.; Schombert, J.M. Color-Mass-to-Light-Ratio Relations for Disk Galaxies. Astrophys. J. 2014, 148, 77. [Google Scholar] [CrossRef]
- Zibetti, S.; Charlot, S.; Rix, H.-W. Resolved stellar mass maps of galaxies—I. Method and implications for global mass estimates. Mon. Not. R. Astron. Soc. 2009, 400, 1181–1198. [Google Scholar] [CrossRef]
- Bell, E.F.; McIntosh, D.H.; Katz, N.; Weinberg, M.D. The Optical and Near-Infrared Properties of Galaxies. I. Luminosity and Stellar Mass Functions. Astrophys. J. Suppl. Ser. 2003, 149, 289. [Google Scholar] [CrossRef]
- Into, T.; Portinari, L. New colour–mass-to-light relations: The role of the asymptotic giant branch phase and of interstellar dust. Mon. Not. R. Astron. Soc. 2013, 430, 2715–2731. [Google Scholar] [CrossRef]
- Portinari, L.; Sommer-Larsen, J.; Tantalo, R. On the mass-to-light ratio and the initial mass function in disc galaxies. Mon. Not. R. Astron. Soc. 2004, 347, 691–719. [Google Scholar] [CrossRef] [Green Version]
Figure 1.
(color online) Rotational velocities in km/s (y axis) at a certain distance in kpc (x axis) from the center of the galaxy. The blue curves RC are obtained from the parametric fit of Equation (19) in the case of 18 THINGS galaxies. The proprieties of the galaxies in the sample can be found in Table I from Reference [55]. The full (blue) curve are the rotation curves obtained using Equation (19); the (red) full circles are the observed data points where the vertical (grey) lines represent the error bars; the contribution due to the Newtonian term is given by the dash-dotted (black) lines, while the dashed (cyan) lines give the MOND rotation curves. The numerical values resulted from the fits are given in Table 1.

Figure 2.
(color online) Rotational velocities in km/s (y axis) at a certain distance in kpc (x axis) from the center of the galaxy. The blue curves RC are obtained from the parametric fit of Equation (19) in the case of HSB THINGS galaxies. The full (green) curve is the rotation curves obtained using the spherical mass distribution (21); the (red) full circles are the observed data points where the vertical (grey) lines represent the error bars; the contribution due to the Newtonian term is given by the dash-dotted (black) lines, while the dashed (blue) lines give rotation curves obtained using the mass distribution in Equation (7). The numerical values resulted from the fits are given in Table 2.
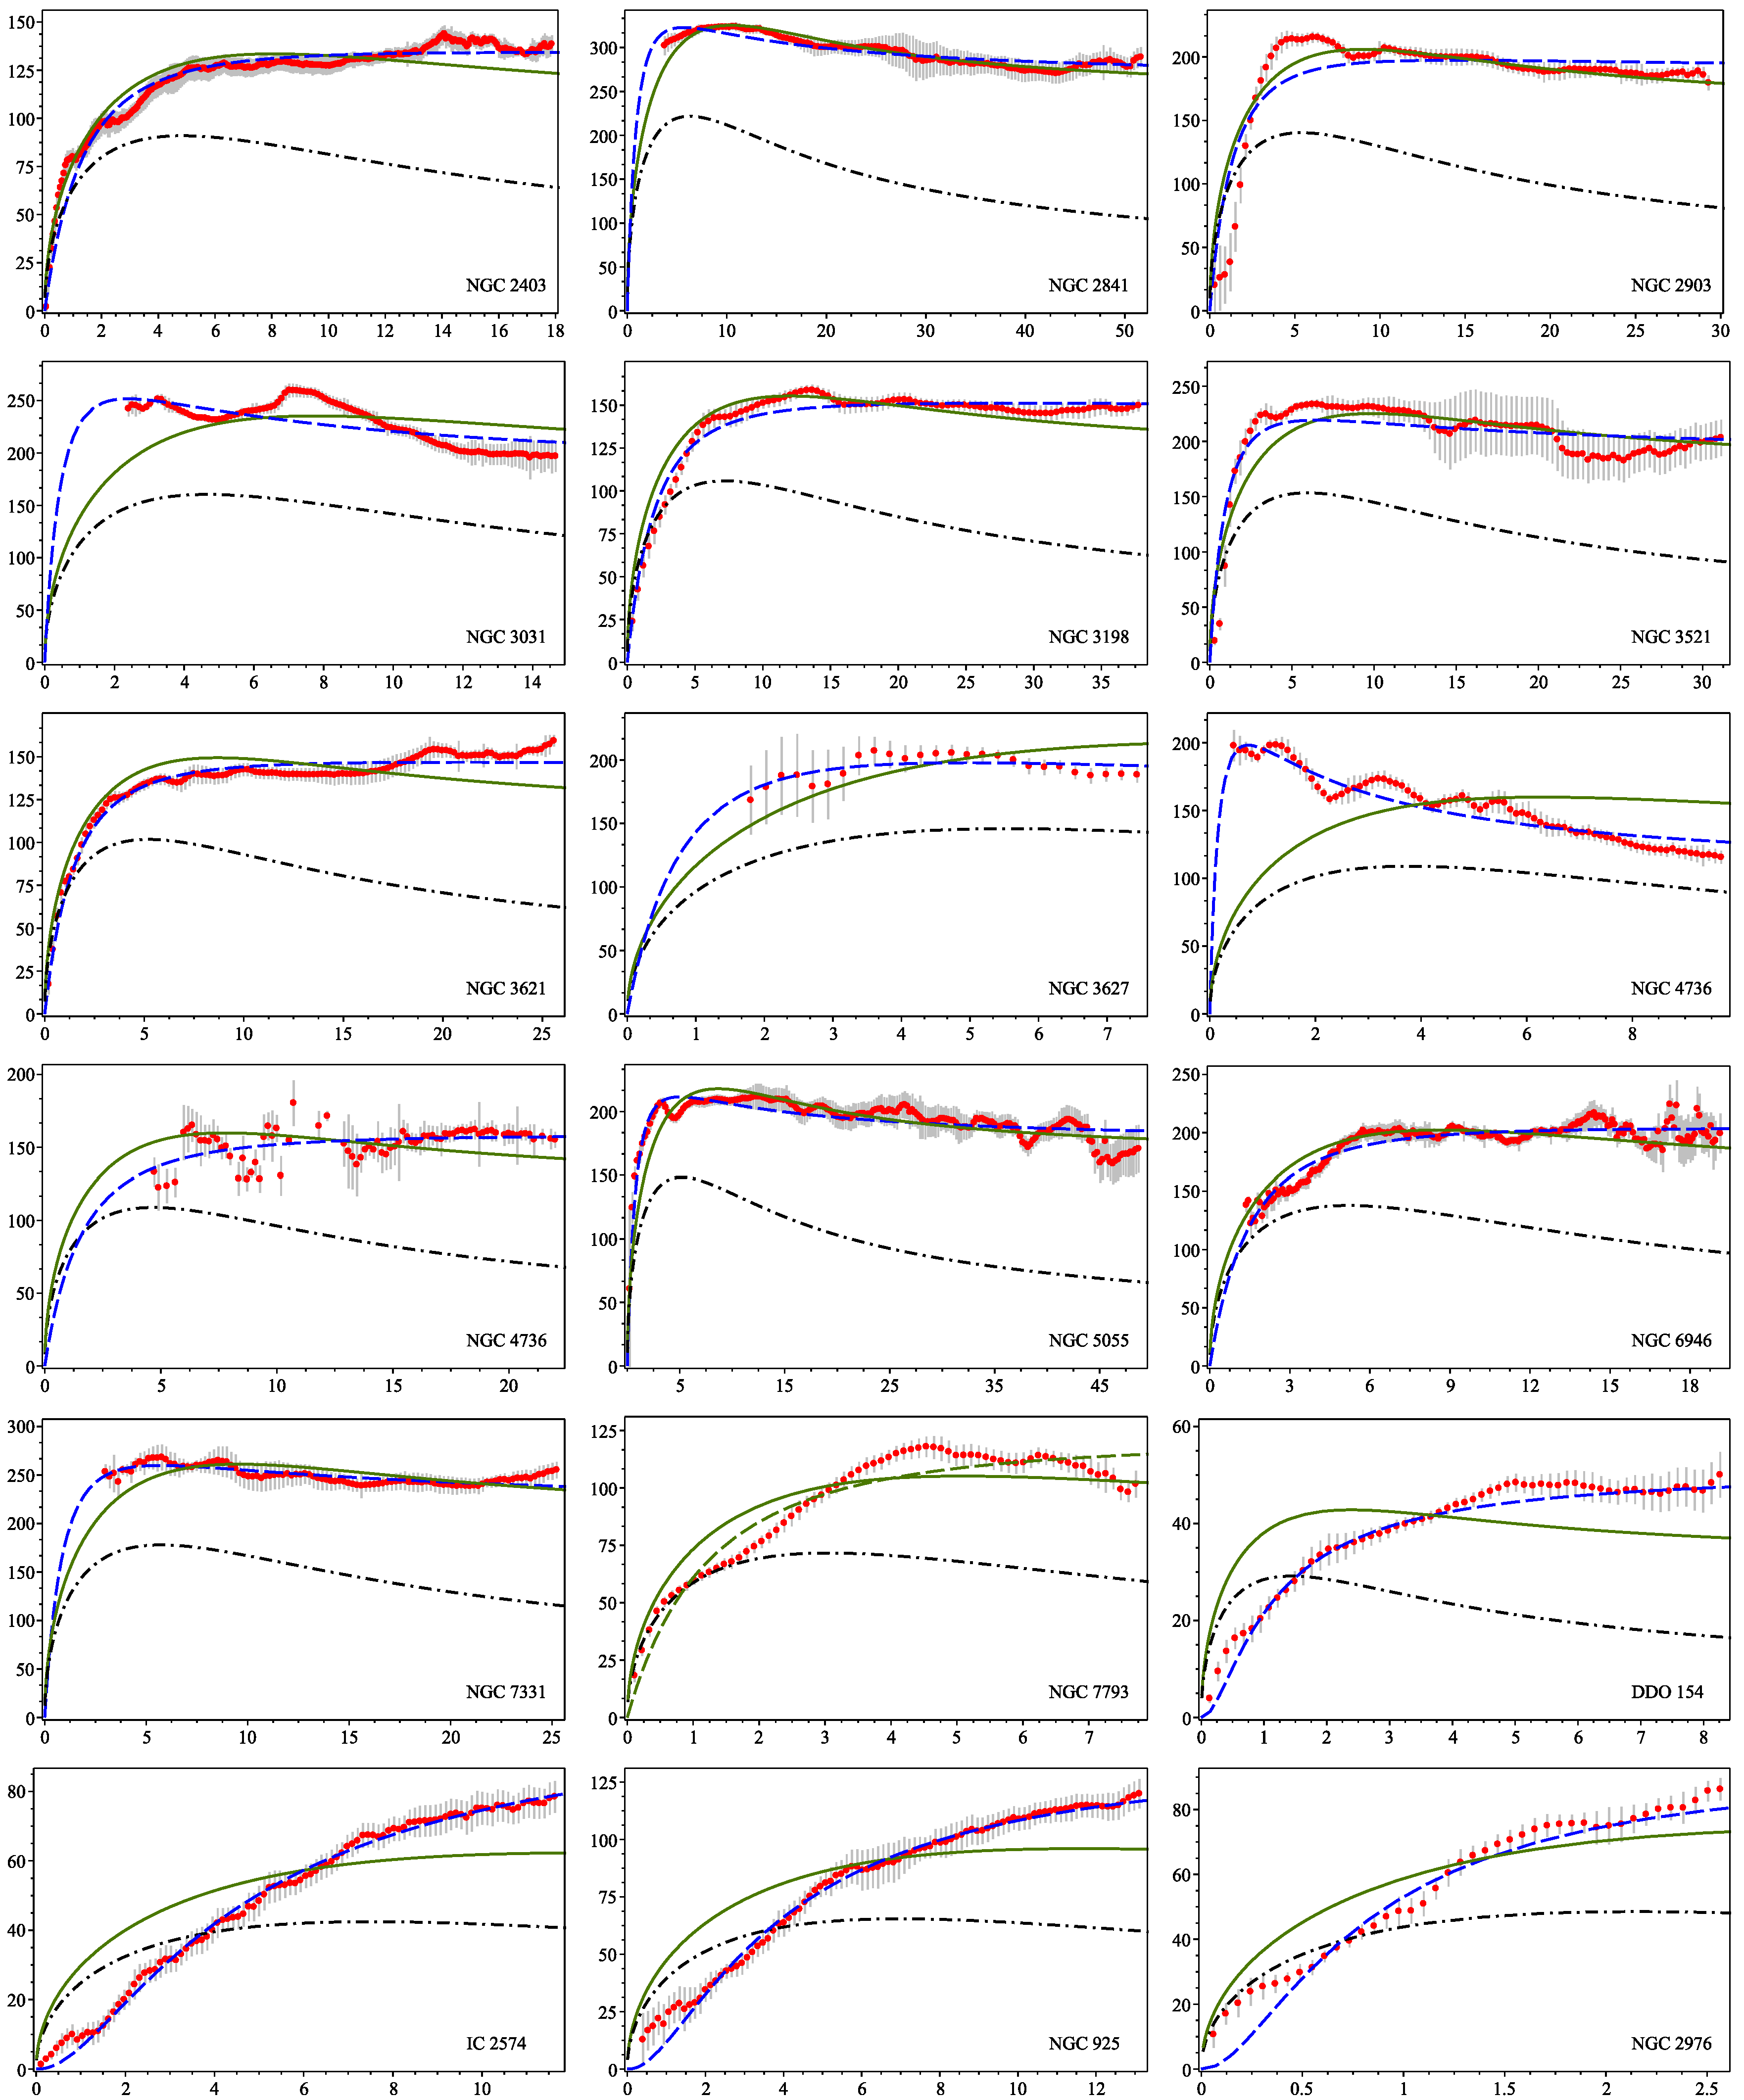
Figure 3.
(color online) Comparison of rotation curves obtained using the “core” mass distribution (7) (cyan dash-dot curve), the observed data (red full circles with vertical grey lines (error bars)), the disk profile (21) (green dash curve) and the “core-disk” mass distribution (blue solid curve) together with its Newtonian contribution (black dotted curve).
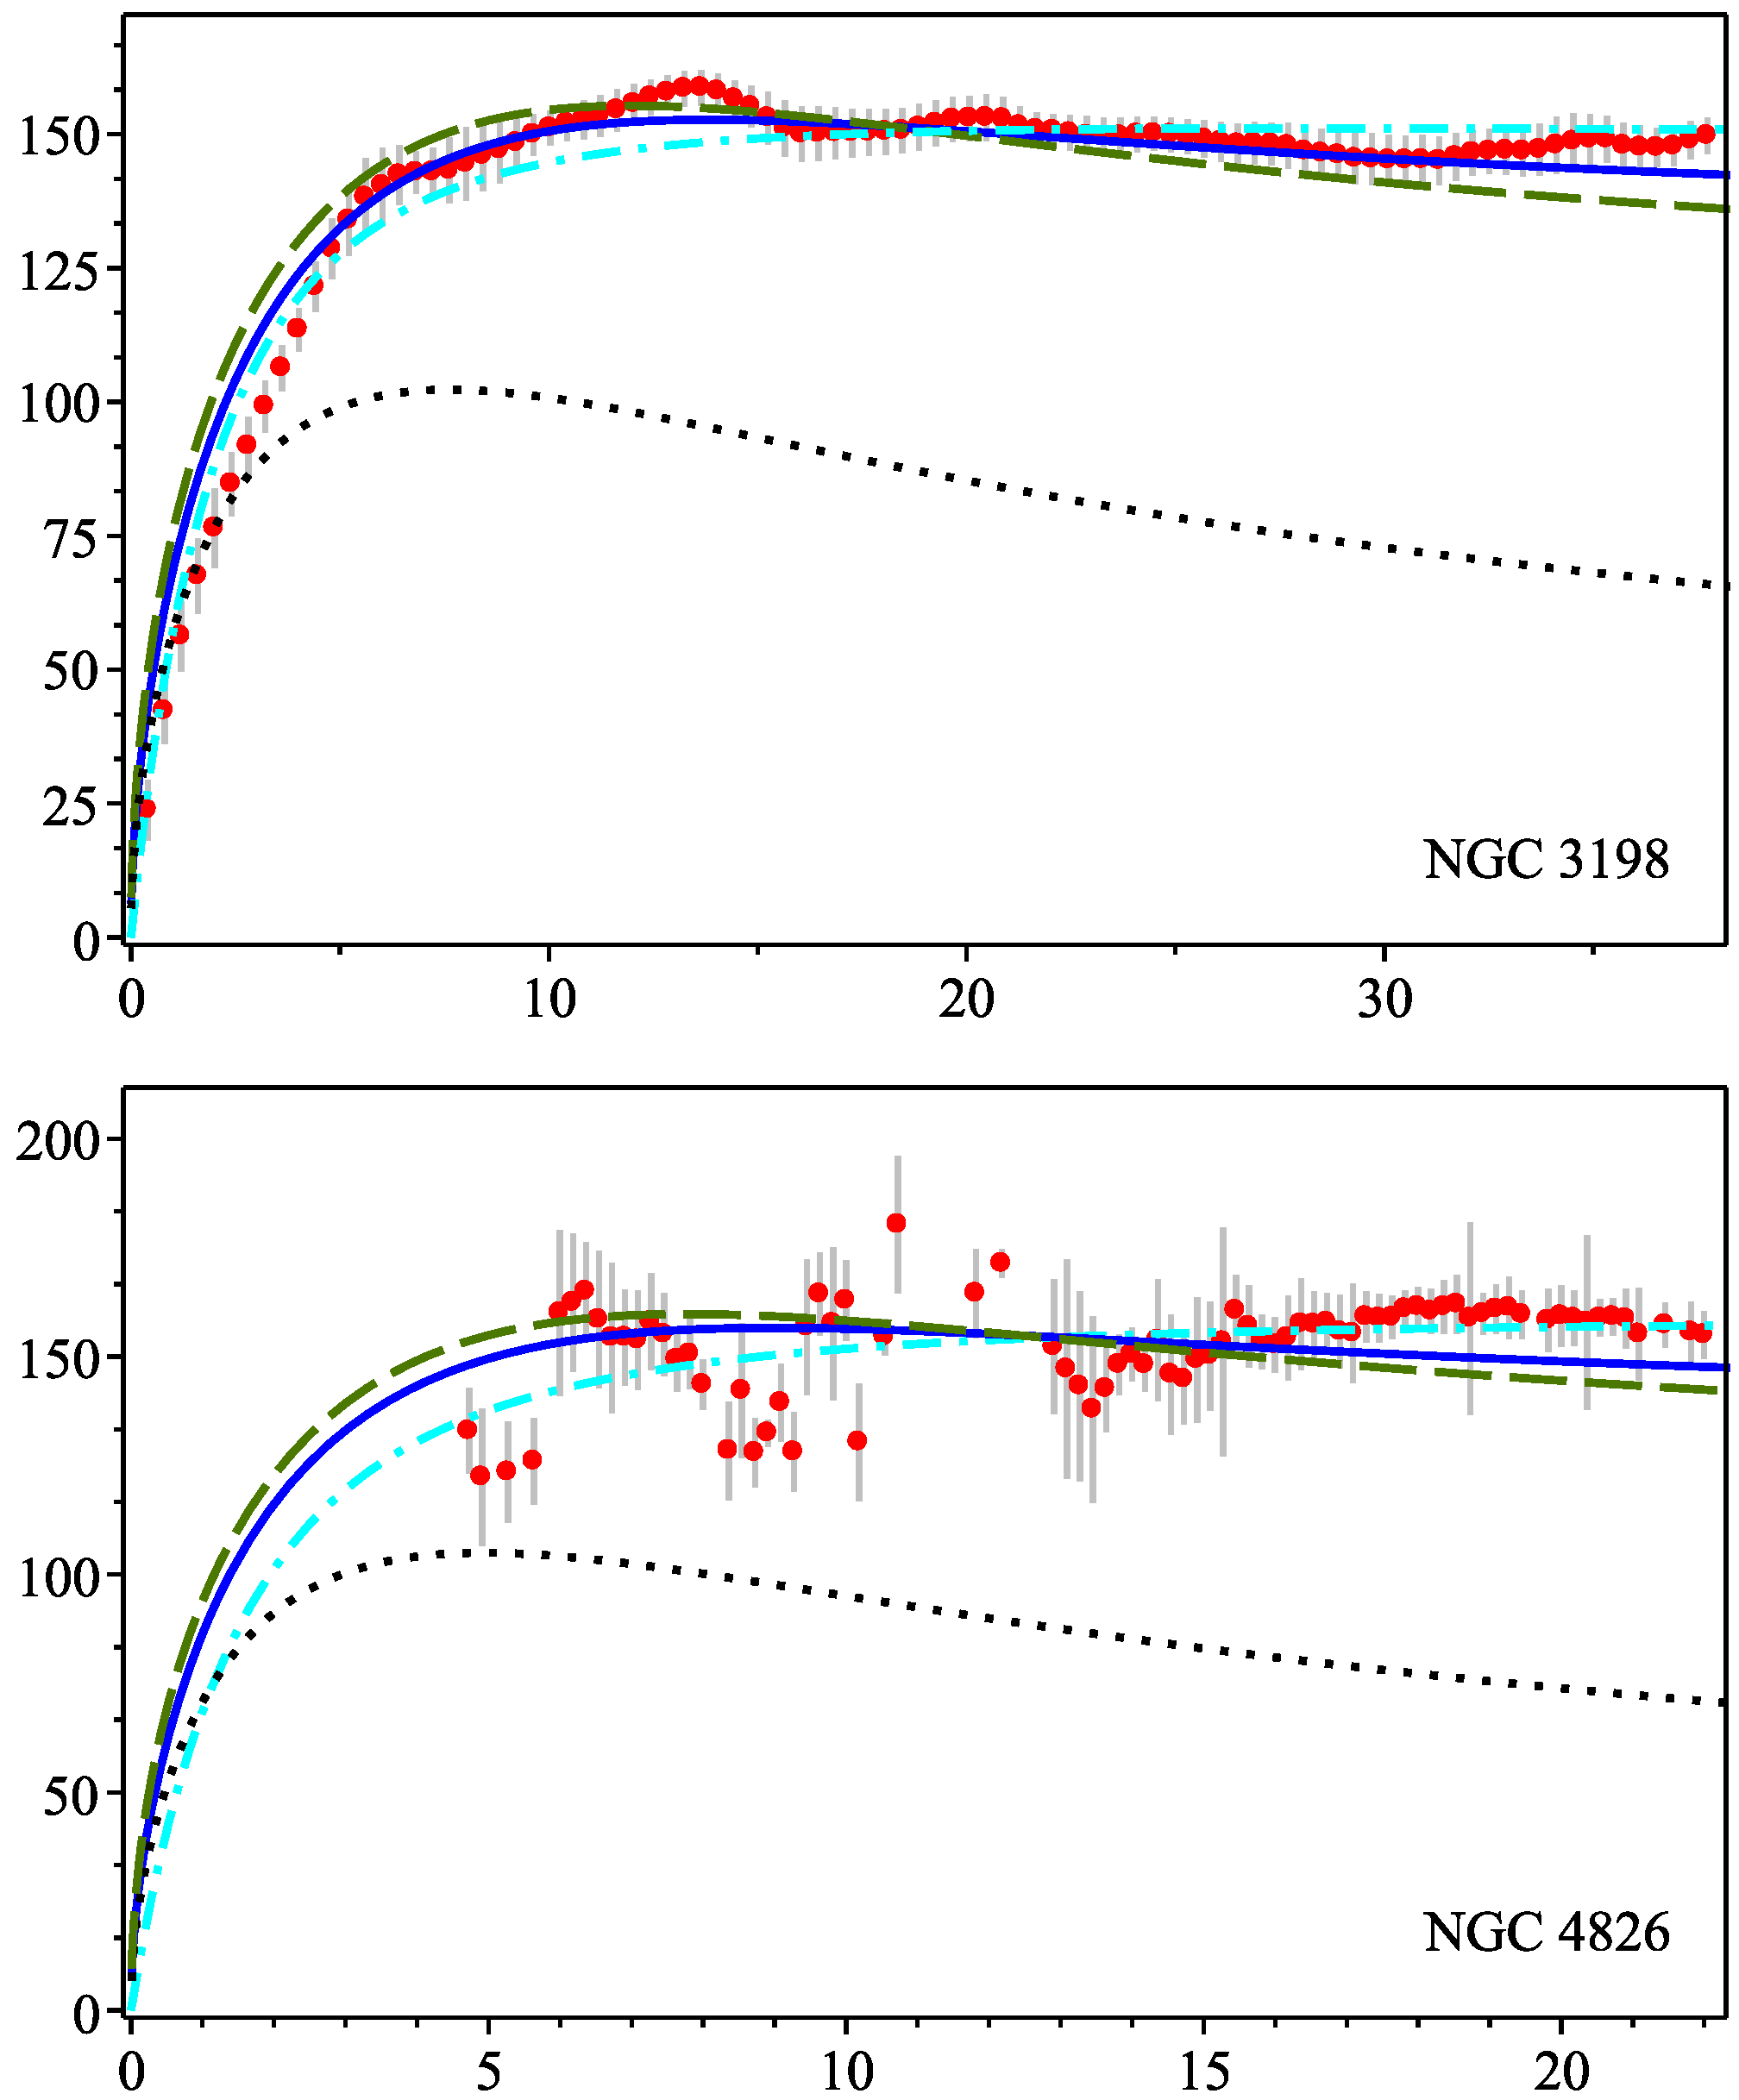
Figure 4.
(color online) The Tully-Fisher relation. Left-top panel: the observed B-band Tully-Fisher relation. Vertical axis gives the base 10 logarithm of the observed luminosity (in units of , respectively ) and the horizontal axis is the base 10 logarithm of the last observed velocity (in km/s). Left-bottom panel: best fit Tully-Fisher relation parameterized by in the case of MOND. Right-top panel: Tully-Fisher best fit for the masses resulted from the parametric model given by Equation (17) using the mass distribution (7), respectively. Right-bottom panel: Tully-Fisher relation obtained using the spherical version of the exponential disk mass distribution (21). The value of M used in the plots is the total mass of a given galaxy: .


Table 1.
Best fit results according to Equation (19) using the parametric mass distribution Equation (7). These numerical values correspond to rotation curves presented in Figure 1. Column (1) name of galaxy; Column (2) distance; Column (3) measured scale length of the galaxy; Column (4) base ten logarithm of total gas mass given by , with the data taken from [55]; Column (5) galaxy luminosity in the B-band calculated from [55]; Column (6) base ten logarithm of the predicted stellar mass of the galaxy (obtained by subtracting from the best-fit results for the total mass ); Column (7) the predicted core radius ; Column (8) reduced ; Column (9) the stellar mass-to-light ratio calculated by subtracting the mass of the gas from the total mass and then dividing it by the B-band luminosity; Column (10) base ten logarithm of MOND predicted mass of the galaxy; Column (11) the MOND predicted core radius ; Column (12) MOND reduced ; and Column (13) the MOND stelar mass-to-light ratio.
| MOND | ||||||||||||
|---|---|---|---|---|---|---|---|---|---|---|---|---|
| Galaxy | ||||||||||||
| Mpc | kpc | kpc | kpc | |||||||||
| (1) | (2) | (3) | (4) | (5) | (6) | (7) | (8) | (9) | (10) | (11) | (12) | (13) |
| HSB type | ||||||||||||
| NGC 2403 | 3.2 | 2.7 | 9.53 | 0.921 | 10.36 | 2.48 | 1.32 | 2.49 | 10.21 | 2.06 | 0.69 | 1.78 |
| NGC 2841 | 14.1 | 3.5 | 10.06 | 4.742 | 10.64 | 1.73 | 1.11 | 0.92 | 11.50 | 2.81 | 1.71 | 6.71 |
| NGC 2903 | 8.9 | 3.0 | 9.76 | 3.664 | 10.67 | 2.51 | 5.30 | 1.29 | 11.06 | 2.85 | 7.94 | 3.14 |
| NGC 3031 | 3.6 | 2.6 | 9.68 | 3.049 | 9.76 | 0.88 | 5.63 | 0.19 | 10.66 | 1.37 | 6.07 | 1.52 |
| NGC 3198 | 13.8 | 4.0 | 10.13 | 3.106 | 10.58 | 3.76 | 1.61 | 1.23 | 10.19 | 2.96 | 3.99 | 0.50 |
| NGC 3521 | 10.7 | 3.3 | 10.03 | 3.698 | 10.31 | 1.84 | 5.19 | 0.55 | 10.78 | 2.09 | 6.31 | 1.65 |
| NGC 3621 | 6.6 | 2.9 | 9.97 | 1.629 | 10.42 | 2.75 | 1.49 | 1.63 | 10.28 | 2.29 | 0.85 | 1.17 |
| NGC 3627 | 9.3 | 3.1 | 9.04 | 3.076 | 10.23 | 1.53 | 0.83 | 0.56 | 10.68 | 1.87 | 0.91 | 1.59 |
| NGC 4736 | 4.7 | 2.1 | 8.72 | 1.294 | 8.42 | 0.32 | 2.50 | 0.02 | 8.93 | 0.34 | 5.18 | 0.07 |
| NGC 4826 | 7.5 | 2.6 | 8.86 | 2.779 | 10.67 | 2.85 | 1.57 | 1.71 | 10.61 | 2.27 | 1.61 | 1.46 |
| NGC 5055 | 10.1 | 2.9 | 10.08 | 4.365 | 9.98 | 1.50 | 1.24 | 0.22 | 10.35 | 1.47 | 2.54 | 0.51 |
| NGC 6946 | 5.9 | 2.9 | 9.74 | 2.729 | 10.80 | 2.74 | 1.52 | 2.31 | 11.26 | 3.29 | 1.61 | 6.70 |
| NGC 7331 | 14.7 | 3.2 | 10.08 | 7.244 | 10.40 | 1.68 | 0.37 | 0.35 | 11.13 | 2.31 | 0.24 | 1.86 |
| NGC 7793 | 3.9 | 1.7 | 9.07 | 0.511 | 10.32 | 2.09 | 4.65 | 4.13 | 10.53 | 2.29 | 4.23 | 6.73 |
| LSB type | ||||||||||||
| DDO 154 | 4.3 | 0.8 | 8.68 | 0.007 | 8.62 | 0.69 | 1.01 | 6.00 | 8.34 | 0.83 | 0.59 | 3.14 |
| IC 2574 | 4.0 | 4.2 | 9.29 | 0.273 | 9.98 | 3.07 | 0.52 | 3.49 | 10.49 | 4.86 | 0.30 | 11.40 |
| NGC 925 | 9.2 | 3.9 | 9.78 | 1.614 | 9.34 | 2.62 | 0.31 | 0.54 | 10.55 | 3.61 | 0.25 | 2.22 |
| NGC 2976 | 3.6 | 1.2 | 8.27 | 0.201 | 8.71 | 0.58 | 2.19 | 0.26 | 9.41 | 0.75 | 1.37 | 1.30 |
Table 2.
Best fitting results using Equations (17) and (21). The corresponding rotation curves are given in Figure 2. Column (1) is the name of the galaxy; Column (2) the galaxy type; Column (3) gives best-fit results for the predicted galaxy stelar mass; Column (4) gives the values of reduced ; and Column (5) gives the stelar mass-to-light ratio.
| Galaxy | Type | () | () | |
|---|---|---|---|---|
| (1) | (2) | (3) | (4) | (5) |
| NGC 2403 | HSB | 10.15 | 3.88 | 1.51 |
| NGC 2841 | HSB | 11.08 | 0.55 | 2.58 |
| NGC 2903 | HSB | 10.60 | 2.10 | 1.09 |
| NGC 3031 | HSB | 10.67 | 15.01 | 1.55 |
| NGC 3198 | HSB | 10.33 | 3.55 | 0.69 |
| NGC 3521 | HSB | 10.69 | 6.18 | 1.34 |
| NGC 3621 | HSB | 10.14 | 10.41 | 0.86 |
| NGC 3627 | HSB | 10.70 | 4.94 | 1.63 |
| NGC 4736 | HSB | 10.27 | - | 1.46 |
| NGC 4826 | HSB | 10.36 | 3.14 | 0.83 |
| NGC 5055 | HSB | 10.57 | 2.99 | 0.86 |
| NGC 6946 | HSB | 10.57 | 2.55 | 1.37 |
| NGC 7331 | HSB | 10.82 | 1.84 | 0.92 |
| NGC 7793 | HSB | 9.75 | 12.47 | 1.09 |
| DDO 154 | LSB | 7.69 | 21.17 | 0.71 |
| IC 2574 | LSB | 9.59 | 18.47 | 1.43 |
| NGC 925 | LSB | 9.83 | 10.98 | 0.42 |
| NGC 2976 | LSB | 9.34 | 12.98 | 1.10 |
© 2018 by the authors. Licensee MDPI, Basel, Switzerland. This article is an open access article distributed under the terms and conditions of the Creative Commons Attribution (CC BY) license (http://creativecommons.org/licenses/by/4.0/).
Share and Cite
MDPI and ACS Style
Wojnar, A.; Sporea, C.A.; Borowiec, A. A Simple Model for Explaining Galaxy Rotation Curves. Galaxies 2018, 6, 70. https://doi.org/10.3390/galaxies6030070
AMA Style
Wojnar A, Sporea CA, Borowiec A. A Simple Model for Explaining Galaxy Rotation Curves. Galaxies. 2018; 6(3):70. https://doi.org/10.3390/galaxies6030070
Chicago/Turabian StyleWojnar, Aneta, Ciprian A. Sporea, and Andrzej Borowiec. 2018. "A Simple Model for Explaining Galaxy Rotation Curves" Galaxies 6, no. 3: 70. https://doi.org/10.3390/galaxies6030070
Note that from the first issue of 2016, this journal uses article numbers instead of page numbers. See further details here.