The SLUGGS Survey: Understanding Lenticular Galaxy Formation via Extended Stellar Kinematics


Centre for Astrophysics and Supercomputing, Swinburne University of Technology, Hawthorn 3122, Melbourne, Australia
Galaxies 2017, 5(2), 26; https://doi.org/10.3390/galaxies5020026
Submission received: 4 May 2017
/
Revised: 22 May 2017
/
Accepted: 26 May 2017
/
Published: 30 May 2017
(This article belongs to the Special Issue On the Origin (and Evolution) of Baryonic Galaxy Halos)
Abstract
:We present the latest published and preliminary results from the SLUGGS Survey discussing the formation of lenticular galaxies through analysis of their kinematics. These include a comparison of the measured stellar spin of low-mass lenticular galaxies to the spin of remnant galaxies formed by binary merger simulations to assess whether a merger is a likely formation mechanism for these galaxies. We determine that while a portion of lenticular galaxies have properties consistent with these remnants, others are not, indicating that they are likely “faded spirals”. We also present a modified version of the spin–ellipticity diagram, which utilises radial tracks to be able to identify galaxies with intermediate-scale discs. Such galaxies often have conflicting morphological classifications, depending on whether photometric or kinematic measurements are used. Finally, we present preliminary results on the total mass density profile slopes of lenticular galaxies to assess trends as lower stellar masses are probed.
1. Introduction
Lenticular galaxies share similarities with both elliptical galaxies (in that they are quenched systems) and spiral galaxies (in that many lenticular galaxies have large-scale discs). The manner in which these systems form is still not entirely understood, and it is likely that multiple processes contribute to their formation. Simulations have shown that it is possible to form a lenticular galaxy through binary mergers of disc galaxies. In addition, environmental processes such as ram pressure stripping, galaxy harassment, and starvation have been proposed as mechanisms by which to transform spiral galaxies into lenticulars as they fall into galaxy clusters.
We analyse the kinematics of lenticular galaxies studied within the SLUGGS survey that extend to ∼2–3 effective radii () with the aim of identifying whether merger or environmental processes are more dominant in shaping lenticular (S0) galaxies. We focus in particular on low-mass (i.e., ) lenticular galaxies.
2. Results
2.1. Comparison of Observations with Binary Merger Simulations
For each of the galaxies in the SLUGGS survey (both elliptical and lenticular), we measured the stellar spin within within [1], given by
where i represents each pixel within the selected aperture. This aperture was selected because leading binary merger simulations make such measurements for simulated galaxies. We then compared these values, as plotted within Figure 1. The left panel compares our results with the simulations of [2], while the right panel compares our results with [3]. The merger progenitors in the simulations of the left panel are shown as the grey region, and the coloured regions in the lower region of the plot indicate the merger remnants. While these remnants coincide well with the SLUGGS elliptical galaxies, they do not coincide with the region occupied by SLUGGS lenticular galaxies. Instead, it seems that the progenitor galaxies themselves have more in common with these lenticular galaxies. In the right-hand panel, the progenitor galaxies are shown as cyan stars. These progenitors have a greater stellar spin than those of the [2] progenitor galaxies, and as a result, the remnant galaxies also have a slightly increased stellar spin. The result of this increase is that a portion of the observed lenticular galaxies are consistent with the merger remnants.
However, around half of the S0 galaxies still have a stellar spin greater than those of the merger remnants. We interpret this to indicate that these galaxies are unlikely to have been formed by a merger of two galaxies, and rather due to environmental processes that transformed a spiral into a lenticular. The CALIFA sample of spiral galaxies [3] has been included in Figure 1, which highlights that spiral galaxies themselves occupy a large part of this parameter space. It is notable that the SLUGGS S0 sample and the CALIFA spiral galaxies have a very similar distribution—another indicator that S0 galaxies may have formed through a “fading” of spiral galaxies.
2.2. Annular Measurements of Stellar Spin
In addition to measuring the total stellar spin of galaxies, it is useful to measure the change in stellar spin with radius, as has been done in numerous studies. This is often done simply by measuring the total stellar spin within a specified aperture, using Equation (1). Plotting these measurements against radius gives an aperture-based stellar spin profile. However, since each measurement is flux-weighted, the stellar spin measured in the outer regions of the galaxy will be more highly weighted towards the spin in the central regions, making it difficult to distinguish changes in spin with greater radii. As described in [1], we rather make these measurements over isophotal annuli.
Using this technique, a number of galaxies in the SLUGGS survey were noted [1] to have strongly downturning stellar spin profiles at larger radii. For such galaxies, the traditional diagram only conveys the behaviour in the central regions. Hence, we have presented a modified version of this diagram in the form of a spin–ellipticity track [4]. Figure 2 shows what such tracks look like for both a typical lenticular galaxy (NGC 1023) and a typical elliptical galaxy (NGC 4365). While ellipticals generally tend to have a low spin and ellipticity at all radii, resulting in stagnant tracks, lenticular galaxies have large-scale discs that result in both spin and ellipticity increasing with radii, resulting in tracks that tend to go from the bottom-left to the top-right regions of the parameter space. For galaxies with downturning spin profiles, these tracks look rather different, as shown in Figure 3.
The four galaxies from the SLUGGS survey identified as having downturning stellar spin profiles are NGC 821, NGC 3377, NGC 4278, and NGC 4473 [1]. What the spin–ellipticity tracks have in common for each of these galaxies is that they rise in the central regions, and then turn back on themselves at larger radii. For NGC 821, NGC 3377, and NGC 4278, the tracks turn back on themselves in the anticlockwise direction; however, due to the double-sigma nature of NGC 4473, the downturn in ellipticity occurs at a larger radius than the downturn in spin, resulting in a clockwise track. Figure 3 also features a velocity map for galaxy NGC 3377, which highlights that the highly rotating nature of the central region of this galaxy does not extend into its outskirts.
2.3. Preliminary Results Measuring Mass Density Profile Slopes of Low-Mass S0 Galaxies
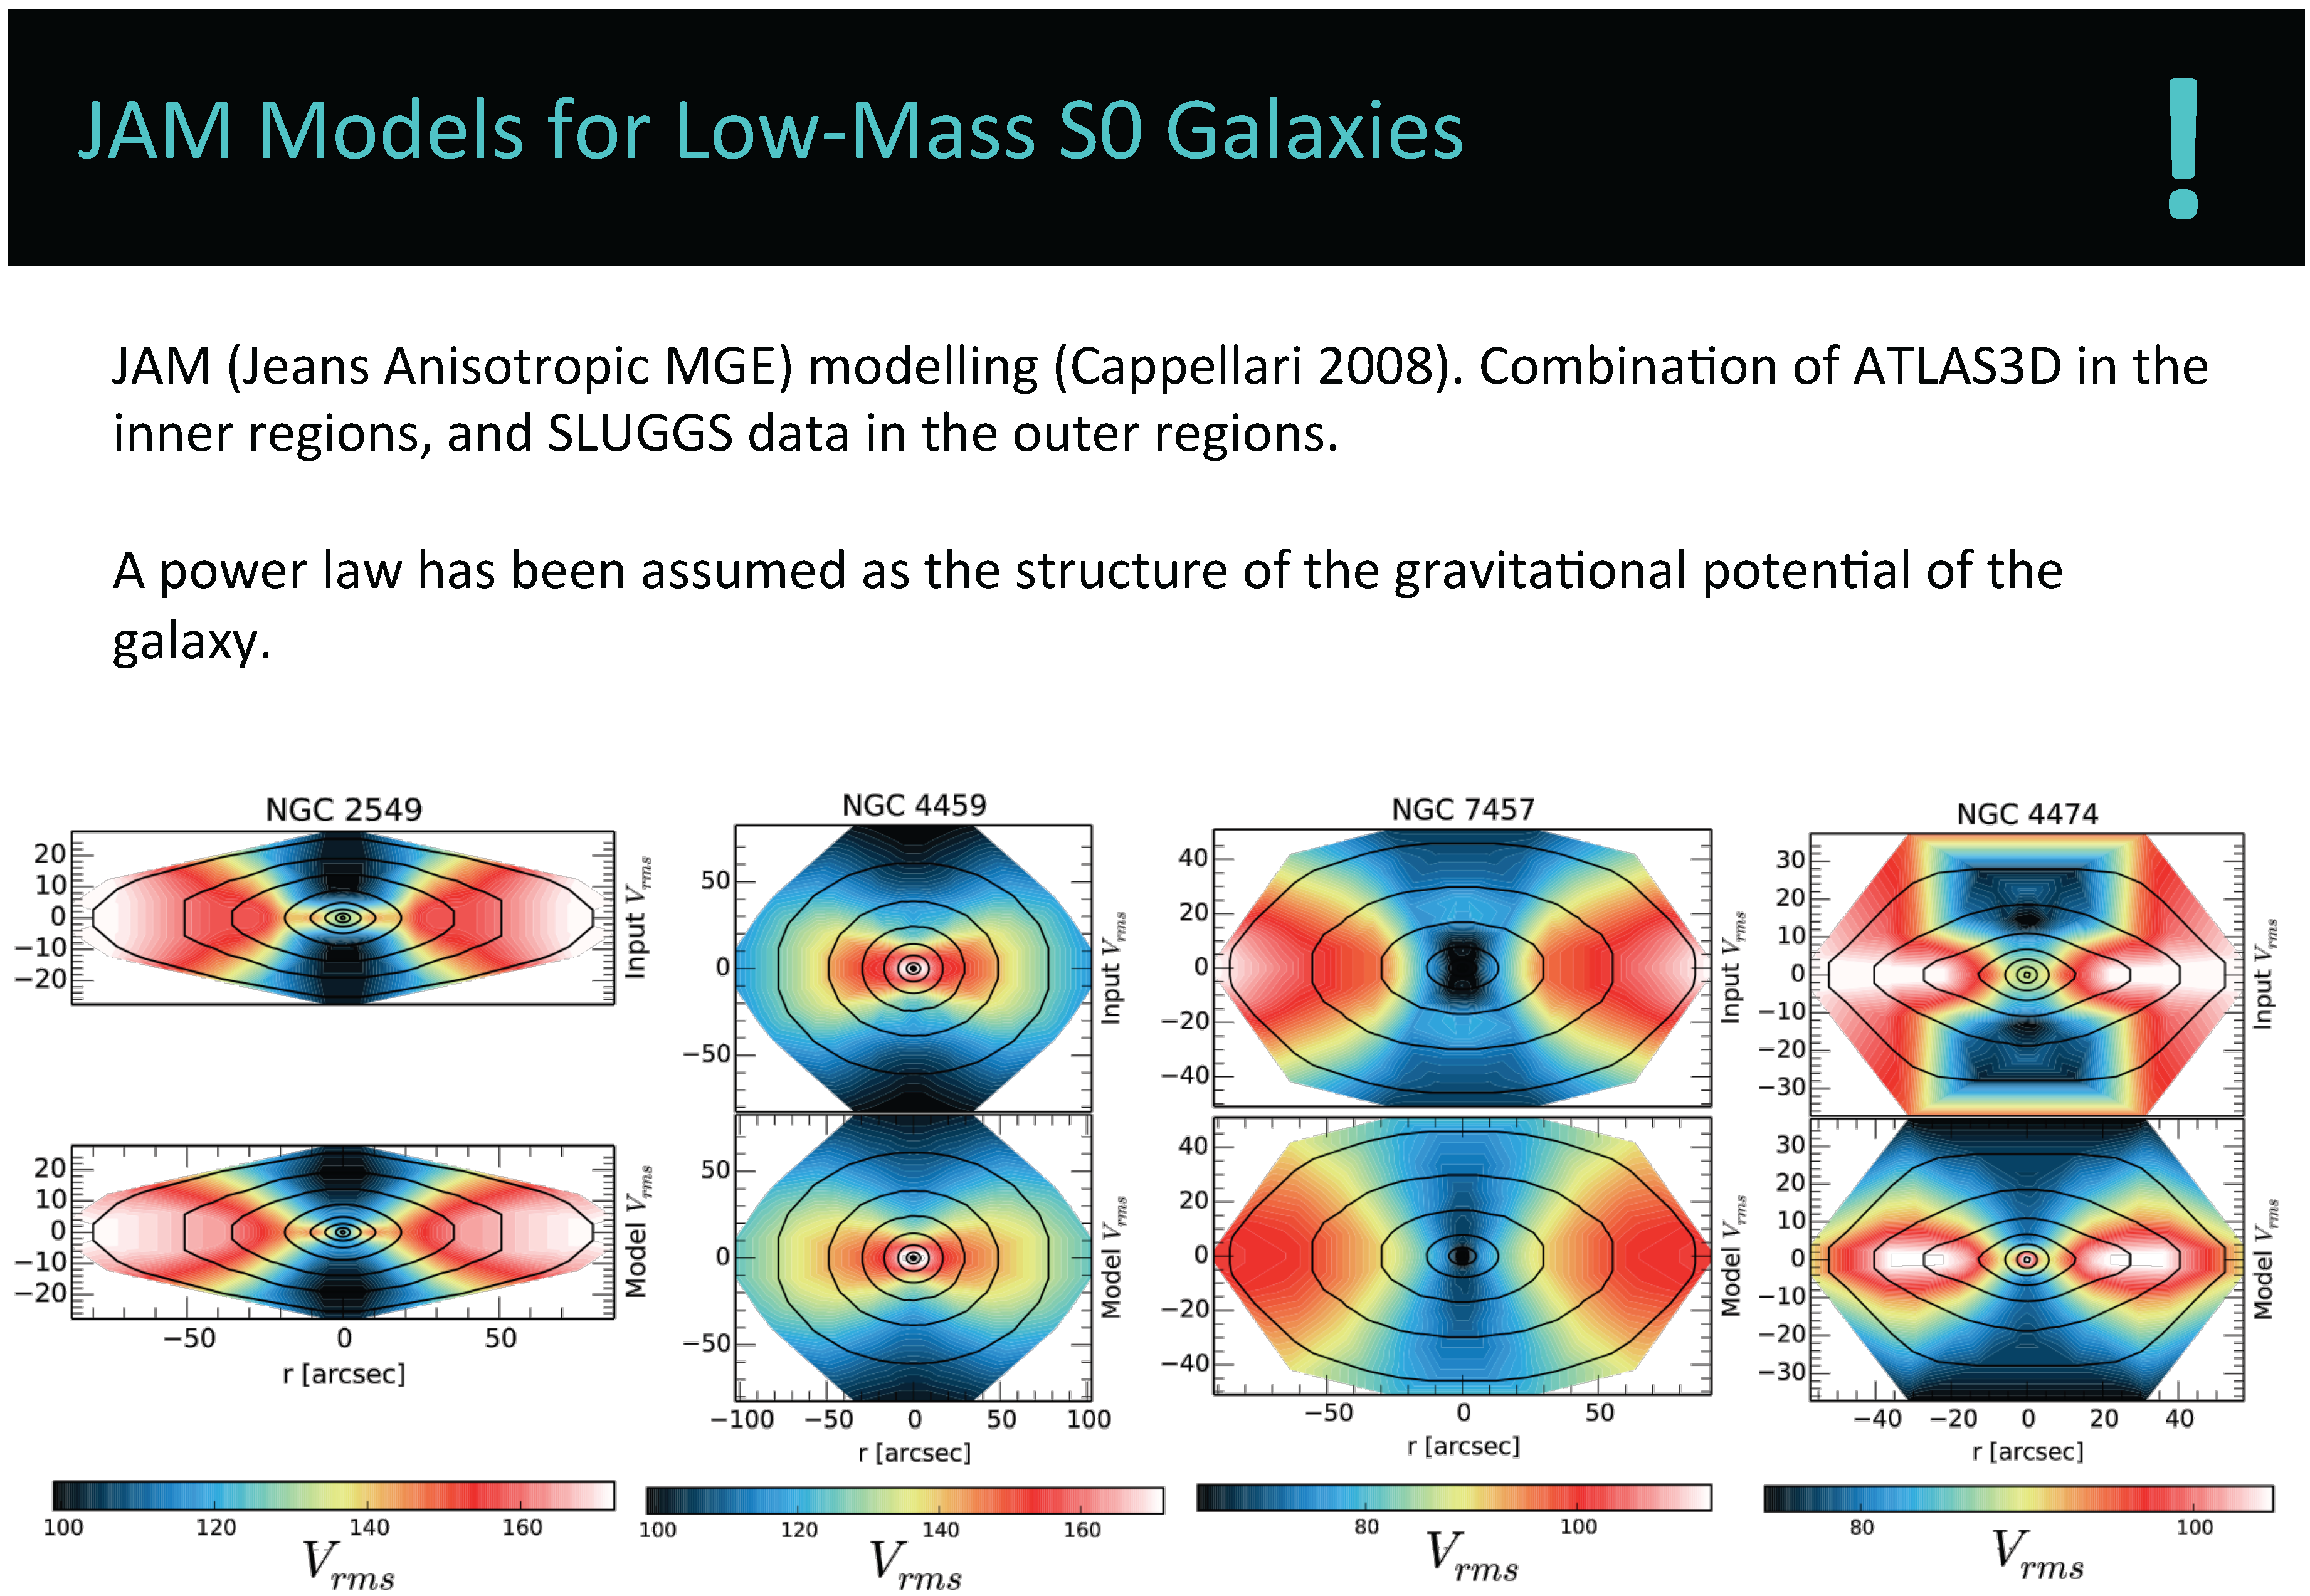
A property of galaxies thought to provide information on their formation histories is the total mass density profile slope, referred to as . Since this is a value that depends on the total mass and not only the stellar component of the galaxy, dynamical modelling is essential. We apply JAM (Jeans Anisotropic MGE1) modelling [6], which utilises the Jeans equations in an MCMC (Markov Chain Monte Carlo) fashion. The input to the JAM code is the observed map of each galaxy. The model matches to these maps are shown in Figure 4.
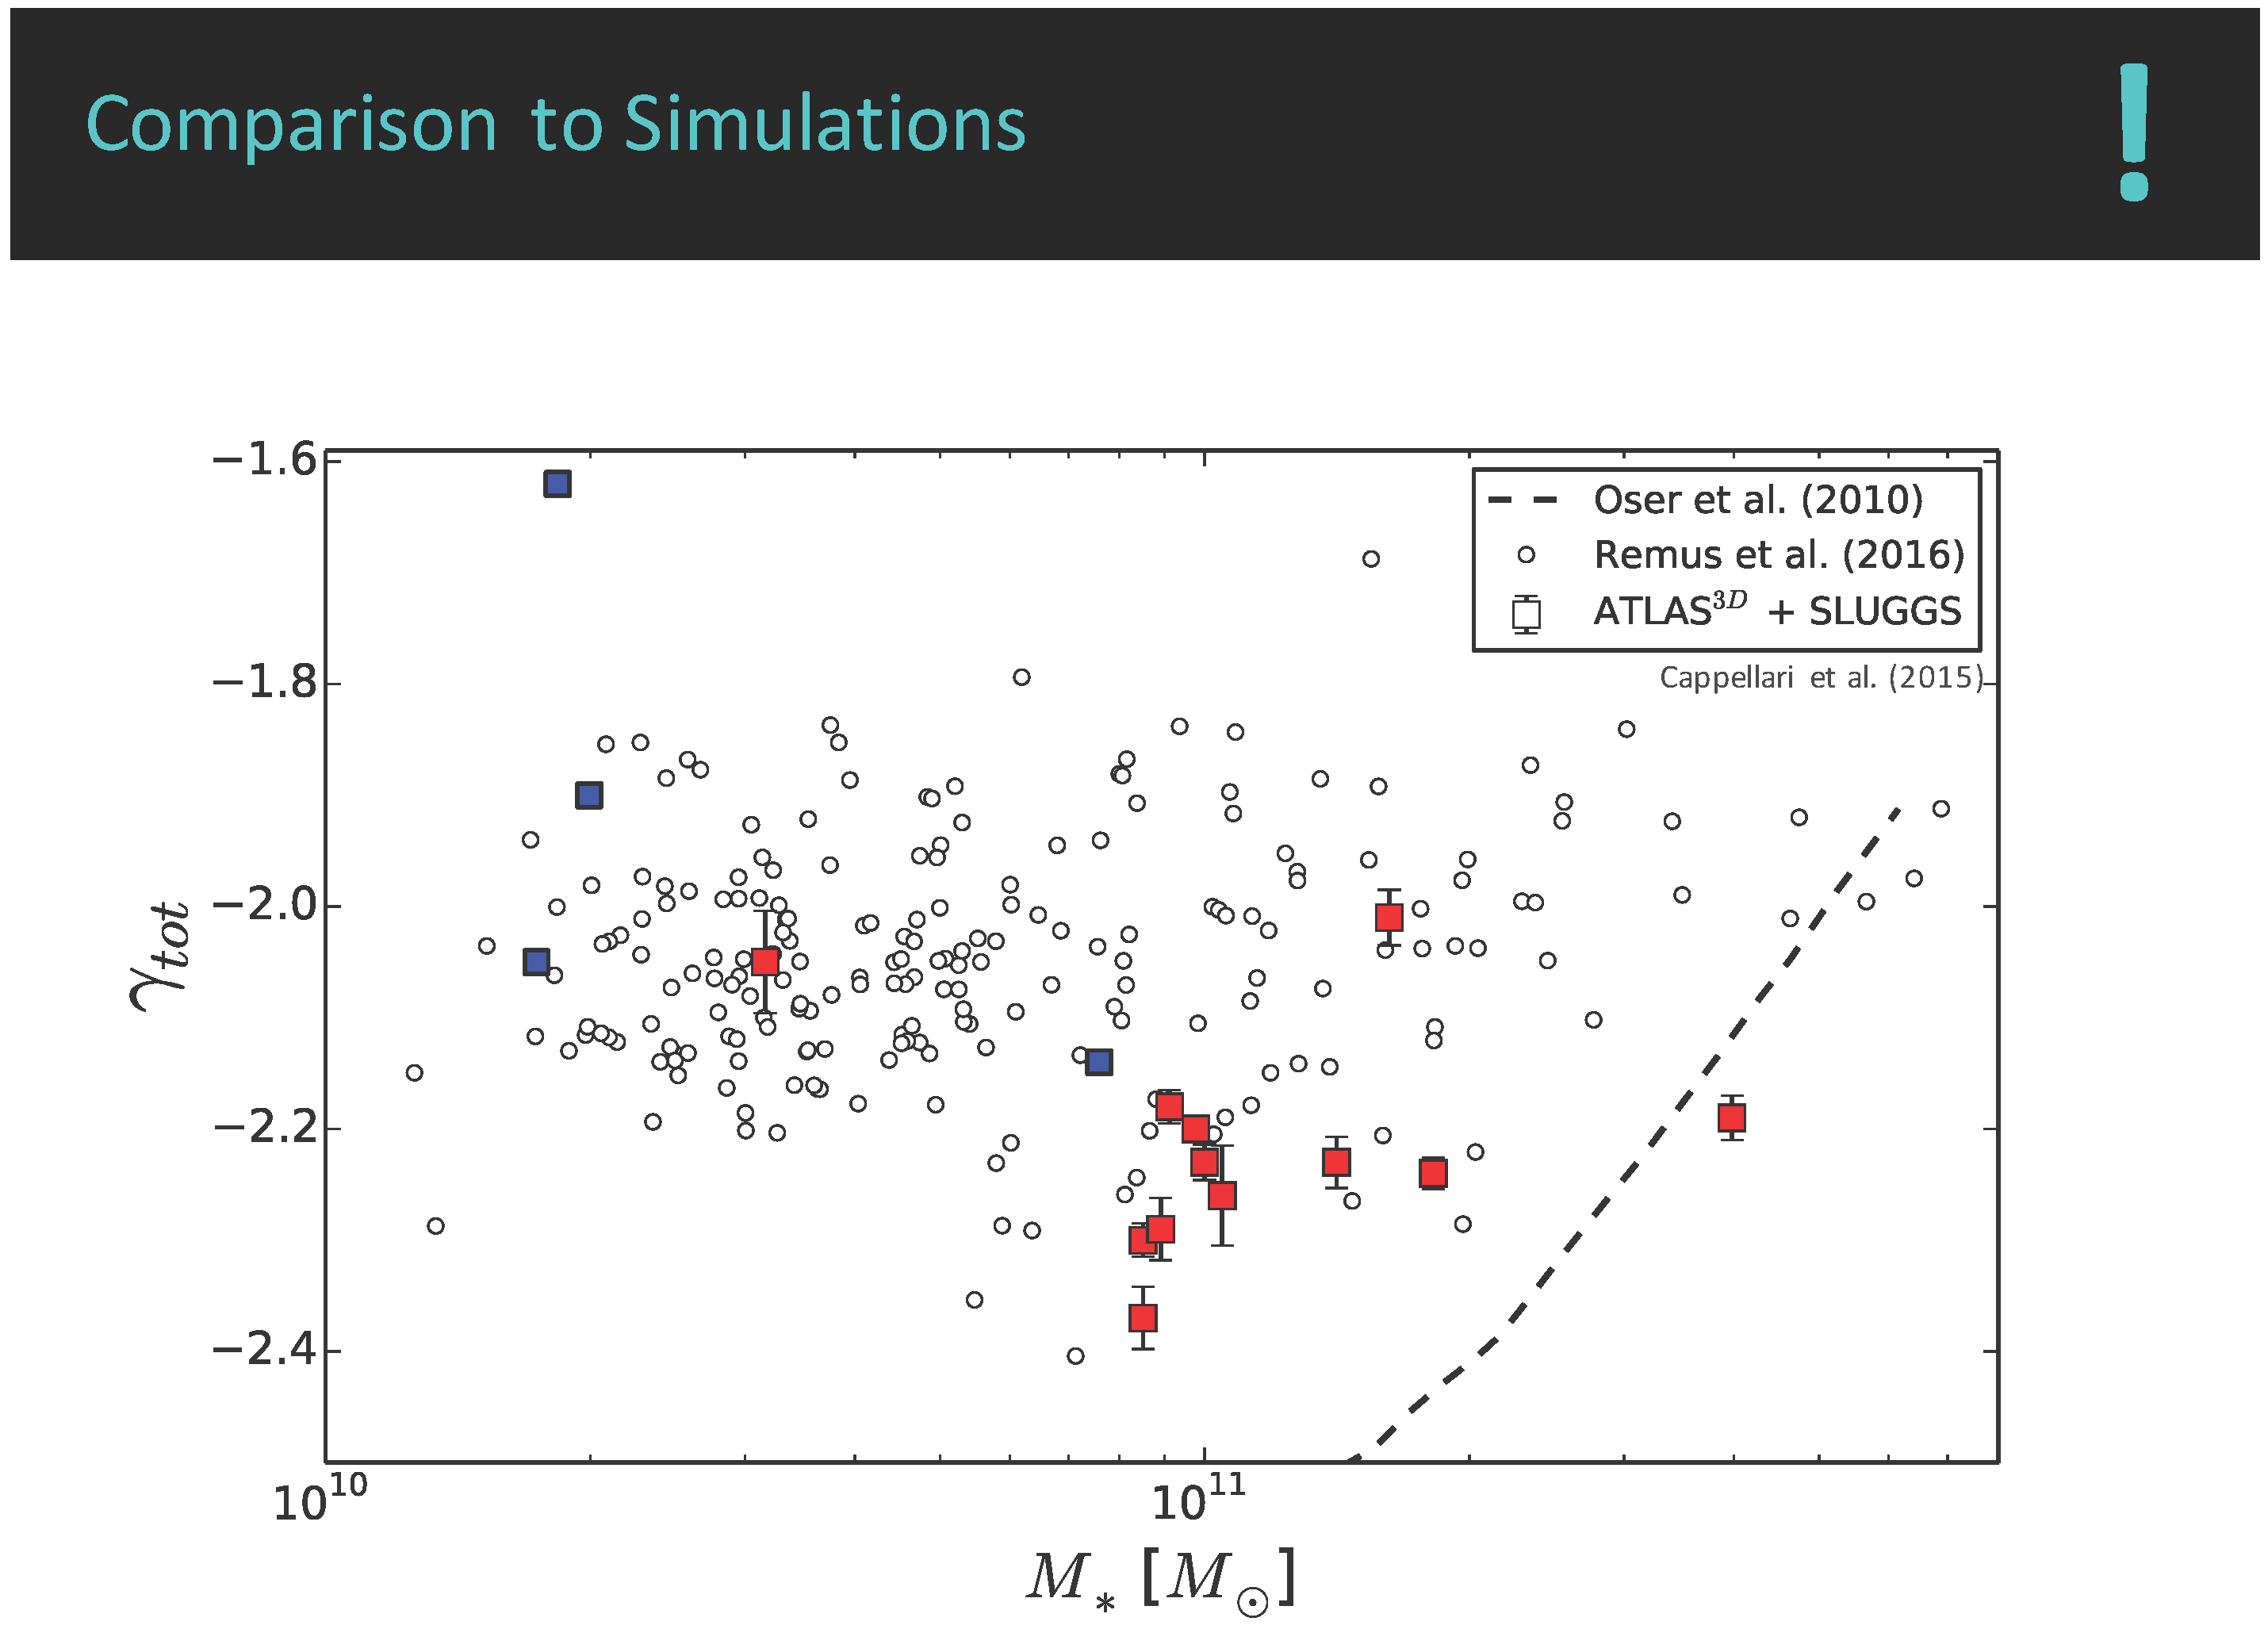
Preliminary values of for these galaxies are plotted in blue against in Figure 5. In addition, the values for the higher-mass sample of the SLUGGS survey are plotted in red [7], and simulated results by [8] are plotted in open circles. The dashed line includes early theoretical predictions by [9], which are in disagreement with the observational results. We attribute this to the lack of AGN feedback in these simulations. It can be seen that there is a clear agreement between the observational measurements and the simulated data of [8]—an indication of the improvement in predictions of newer theoretical work. While more galaxies are required in order to make conclusions about any trends in below , it seems as though values tend to increase (become more shallow) at lower stellar masses.
A shallower slope is often attributed to a history of accretion, where minor mergers added mass to the outskirts of galaxies over time to make the total mass density slope less steep. This is not a likely explanation for why lower- galaxies have shallower slopes, as it is generally the most massive galaxies in the universe that have experienced the most accretion.
3. Summary
Comparison of extended stellar kinematics of low-mass lenticular galaxies indicates that while a portion of them are consistent with being formed by the merger of two disc galaxies, this is not the case for the full sample. This comparison highlights that—for low-mass S0s in particular—these galaxies are likely “faded” spirals that have transformed from spirals to S0s through environmental processes.
We have additionally identified a modified version of the spin–ellipticity diagram which presents radial tracks of individual galaxies, rather than single aperture values, to describe the behaviour of the galaxy. This representation of the kinematic and photometric data makes it very straightforward to identify galaxies with intermediate-scale discs at a glance.
Finally, we presented preliminary results using JAM modelling to measure the total mass density profile slope of a selection of low-mass lenticular galaxies. These preliminary results seem to hint that at lower stellar masses, the values become larger, indicating a shallower density slope. While a shallower slope is often explained by the presence of accretion events in the galaxy’s past, this is unlikely to be the cause for increasingly shallow density slopes at lower stellar masses.
Acknowledgments
S.B. gratefully thanks the entire SLUGGS team for their contributions and assistance provided for the work presented in these proceedings. S.B. would also like to acknowledge the Astronomical Society of Australia for providing funding towards attendence at the conference On the Origin and Evolution of Baryonic Galaxy Halos.
Conflicts of Interest
The authors declare no conflict of interest.
References
- Bellstedt, S.; Forbes, D.A.; Foster, C.; Romanowsky, A.J.; Brodie, J.P.; Pastorello, N.; Alabi, A.; Villaume, A. The SLUGGS survey: Using extended stellar kinematics to disentangle the formation histories of low-mass S0 galaxies. Mon. Not. Roy. Astron. Soc. 2017, 467, 4540–4557. [Google Scholar] [CrossRef]
- Bois, M.; Emsellem, E.; Bournaud, F.; Alatalo, K.; Blitz, L.; Bureau, M.; Cappellari, M.; Davies, R.L.; Davis, T.A.; de Zeeuw, P.T.; et al. The ATLAS3D project—VI. Simulations of binary galaxy mergers and the link with fast rotators, slow rotators and kinematically distinct cores. Mon. Not. Roy. Astron. Soc. 2011, 416, 1654–1679. [Google Scholar] [CrossRef]
- Querejeta, M.; Eliche-Moral, M.C.; Tapia, T.; Borlaff, A.; Rodríguez-Pérez, C.; Zamorano, J.; Gallego, J. Formation of S0 galaxies through mergers. Bulge-disc structural coupling resulting from major mergers. Astron. Astrophys. 2015, 573, A78. [Google Scholar] [CrossRef]
- Bellstedt, S.; Graham., A.W.; Forbes, D.A.; Romanowsky, A.J.; Brodie, J.P.; Strader, J. The SLUGGS Survey: Trails of SLUGGS galaxies in a modified spin-ellipticity diagram. Mon. Not. Roy. Astron. Soc. 2017. accepted. [Google Scholar]
- Emsellem, E.; Cappellari, M.; Krajnovic, D.; Alatalo, K.; Blitz, L.; Bois, M.; Bournaud, F.; Bureau, M.; Davies, R.L.; Davis, T.A.; et al. The ATLAS3D project—III. A census of the stellar angular momentum within the effective radius of early-type galaxies: Unveiling the distribution of fast and slow rotators. Mon. Not. Roy. Astron. Soc. 2011, 414, 888. [Google Scholar] [CrossRef]
- Cappellari, M. Measuring the inclination and mass-to-light ratio of axisymmetric galaxies via anisotropic Jeans models of stellar kinematics. Mon. Not. Roy. Astron. Soc. 2008, 390, 71–86. [Google Scholar] [CrossRef]
- Cappellari, M.; Romanowsky, A.J.; Brodie, J.P.; Forbes, D.A.; Strader, J.; Foster, C.; Kartha, S.S.; Pastorello, N.; Pota, V.; Spitler, L.R.; et al. Small Scatter and Nearly Isothermal Mass Profiles to Four Half-light Radii from Two-dimensional Stellar Dynamics of Early-type Galaxies. Astrophys. J. Lett. 2015, 804, L21. [Google Scholar] [CrossRef]
- Remus, R.-S.; Burkert, A.; Dolag, K.; Johansson, P.H.; Naab, T.; Oser, L.; Thomas, J. The Dark Halo–Spheroid Conspiracy and the Origin of Elliptical Galaxies. Astrophys. J. 2013, 766, 71. [Google Scholar] [CrossRef]
- Oser, L.; Ostriker, J.P.; Naab, T.; Johansson, P.H.; Burkert, A. The Two Phases of Galaxy Formation. Astrophys. J. 2010, 725, 2312–2323. [Google Scholar] [CrossRef]
| 1 | Multi Gaussian Expansion. |
Figure 1.
Stellar spin against ellipticity for SLUGGS galaxies, compared with results from two different binary merger simulations. (a) Comparing with the simulations of [2]. Grey shaded region shows the distribution of merger progenitors, while the other shaded regions indicate the different types of remnants produced by the simulations. (b) Comparison with the simulations of [3]. Cyan stars depict the merger progenitors, while grey triangles represent merger remnants.
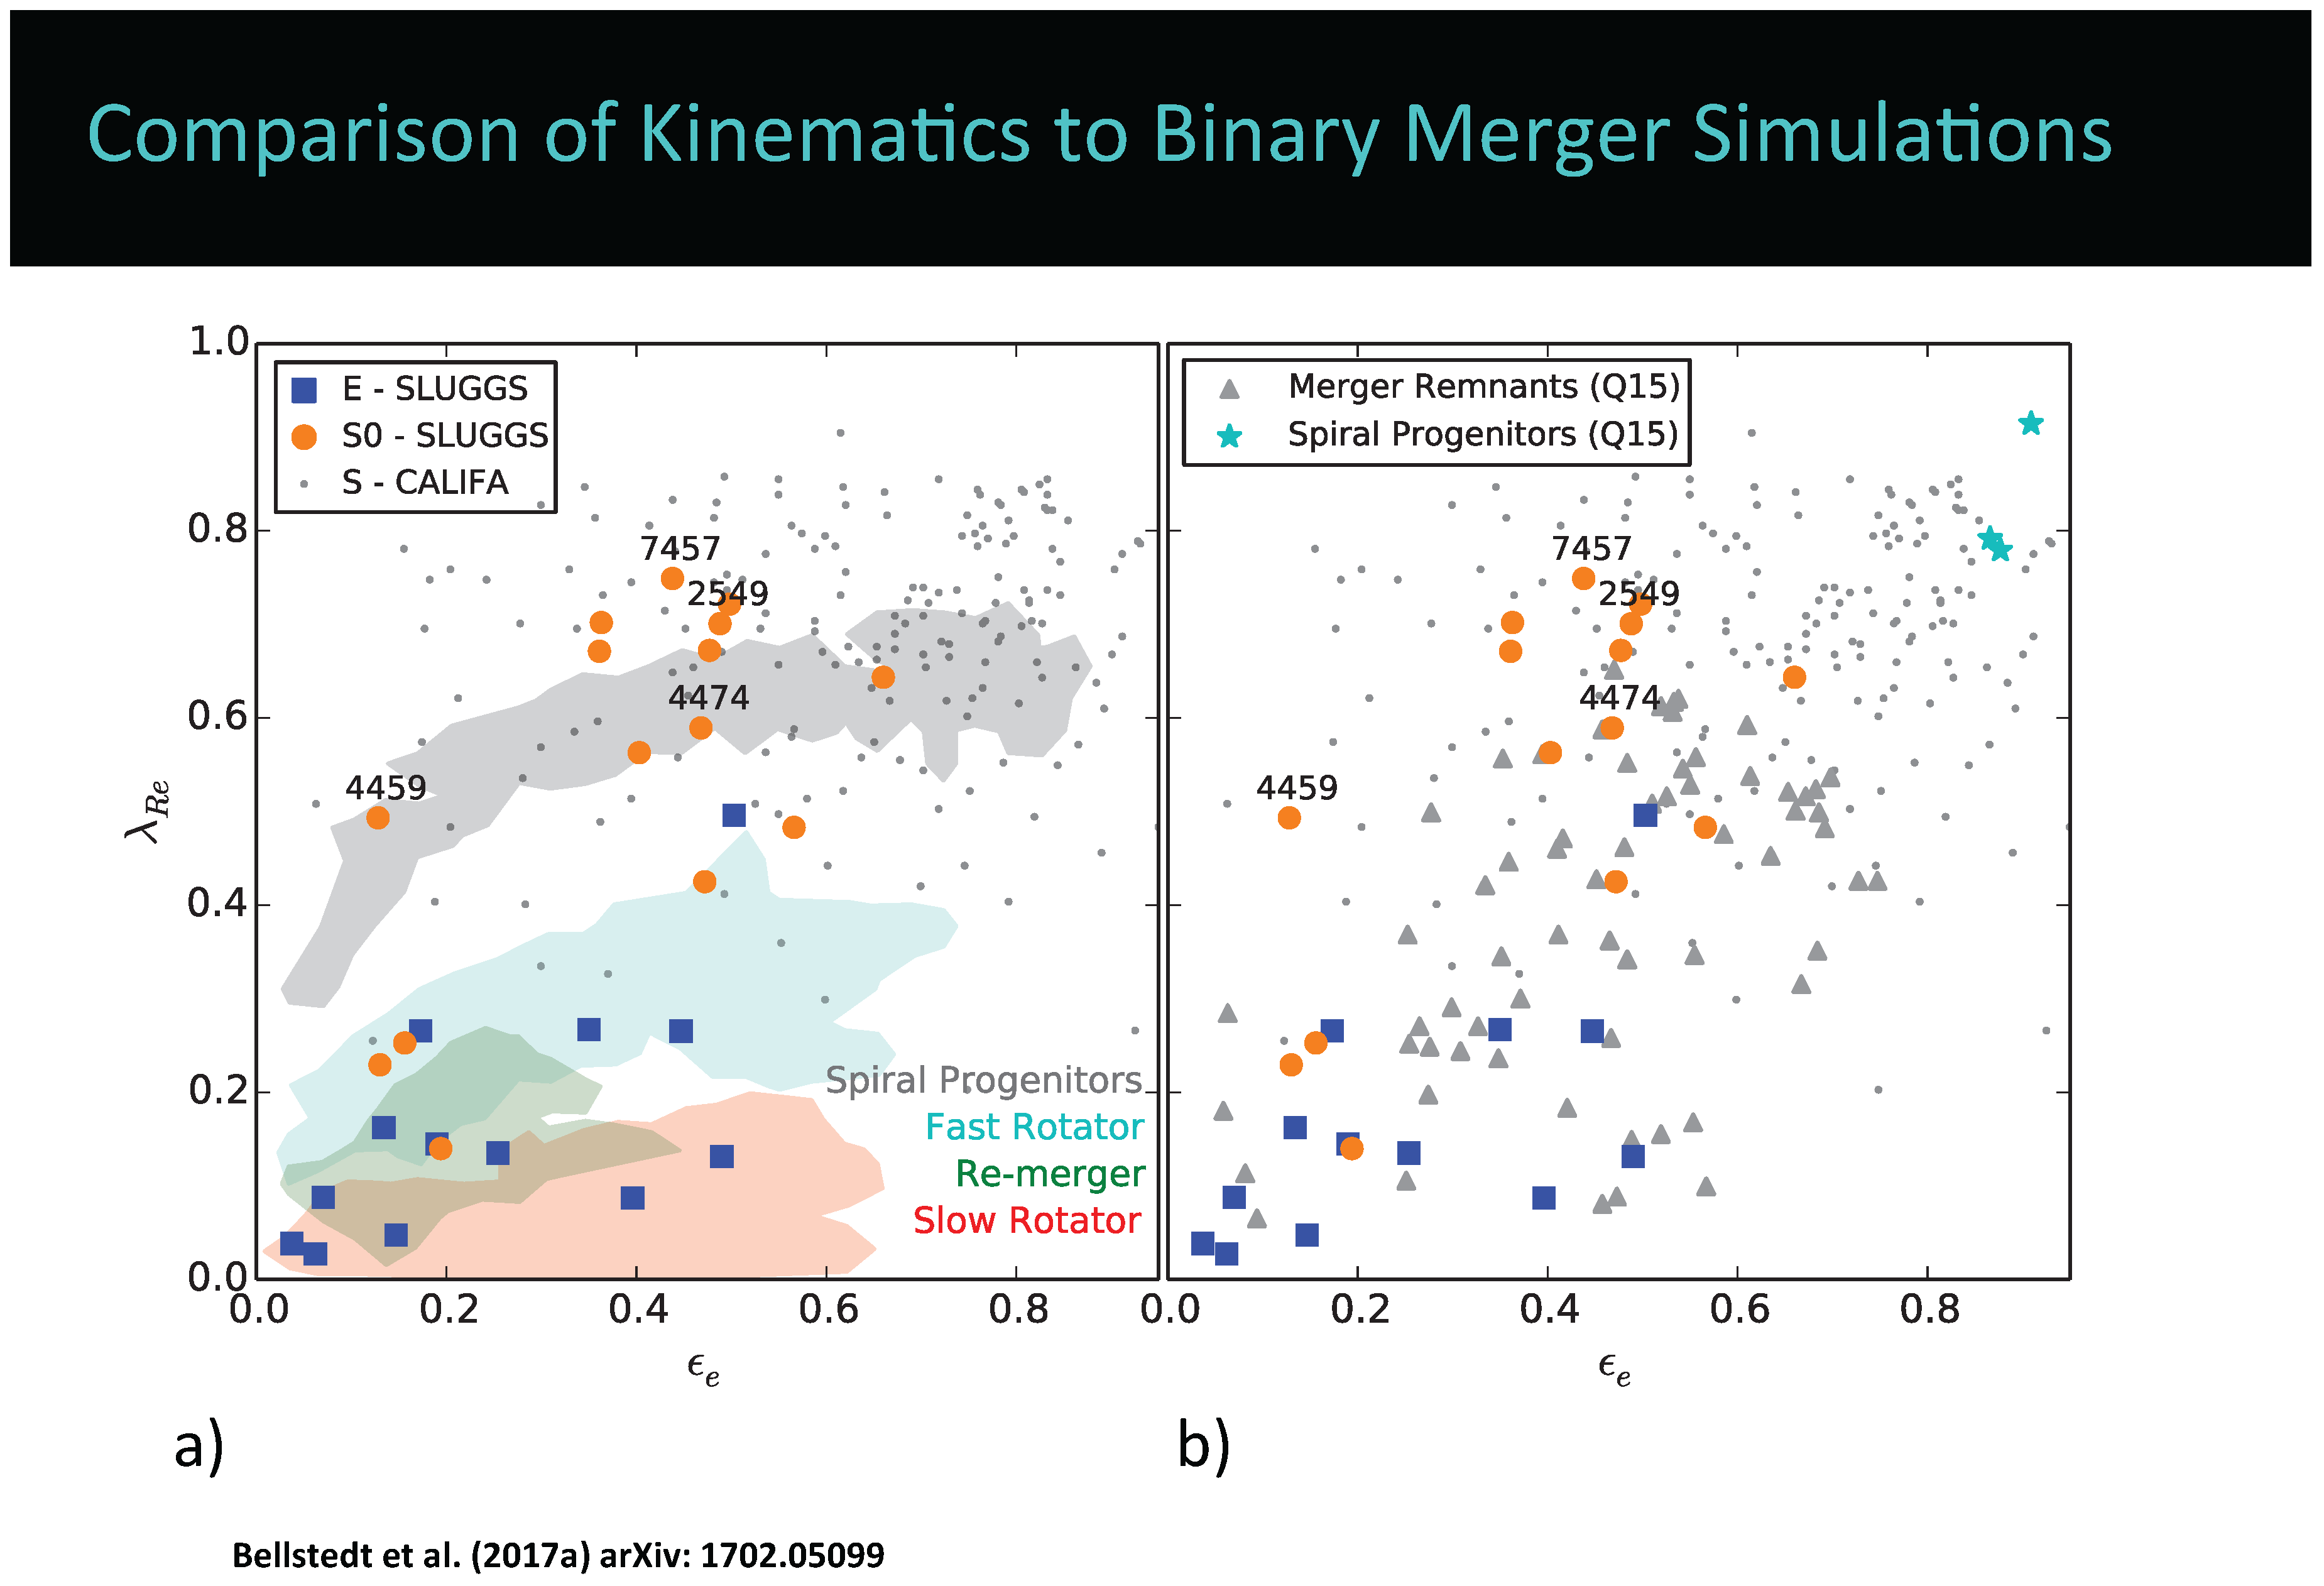
Figure 2.
Example spin–ellipticity tracks for “typical” lenticular and elliptical galaxies. In addition to the SLUGGS tracks, we include the central aperture-based value from the Survey [5].
Figure 2.
Example spin–ellipticity tracks for “typical” lenticular and elliptical galaxies. In addition to the SLUGGS tracks, we include the central aperture-based value from the Survey [5].
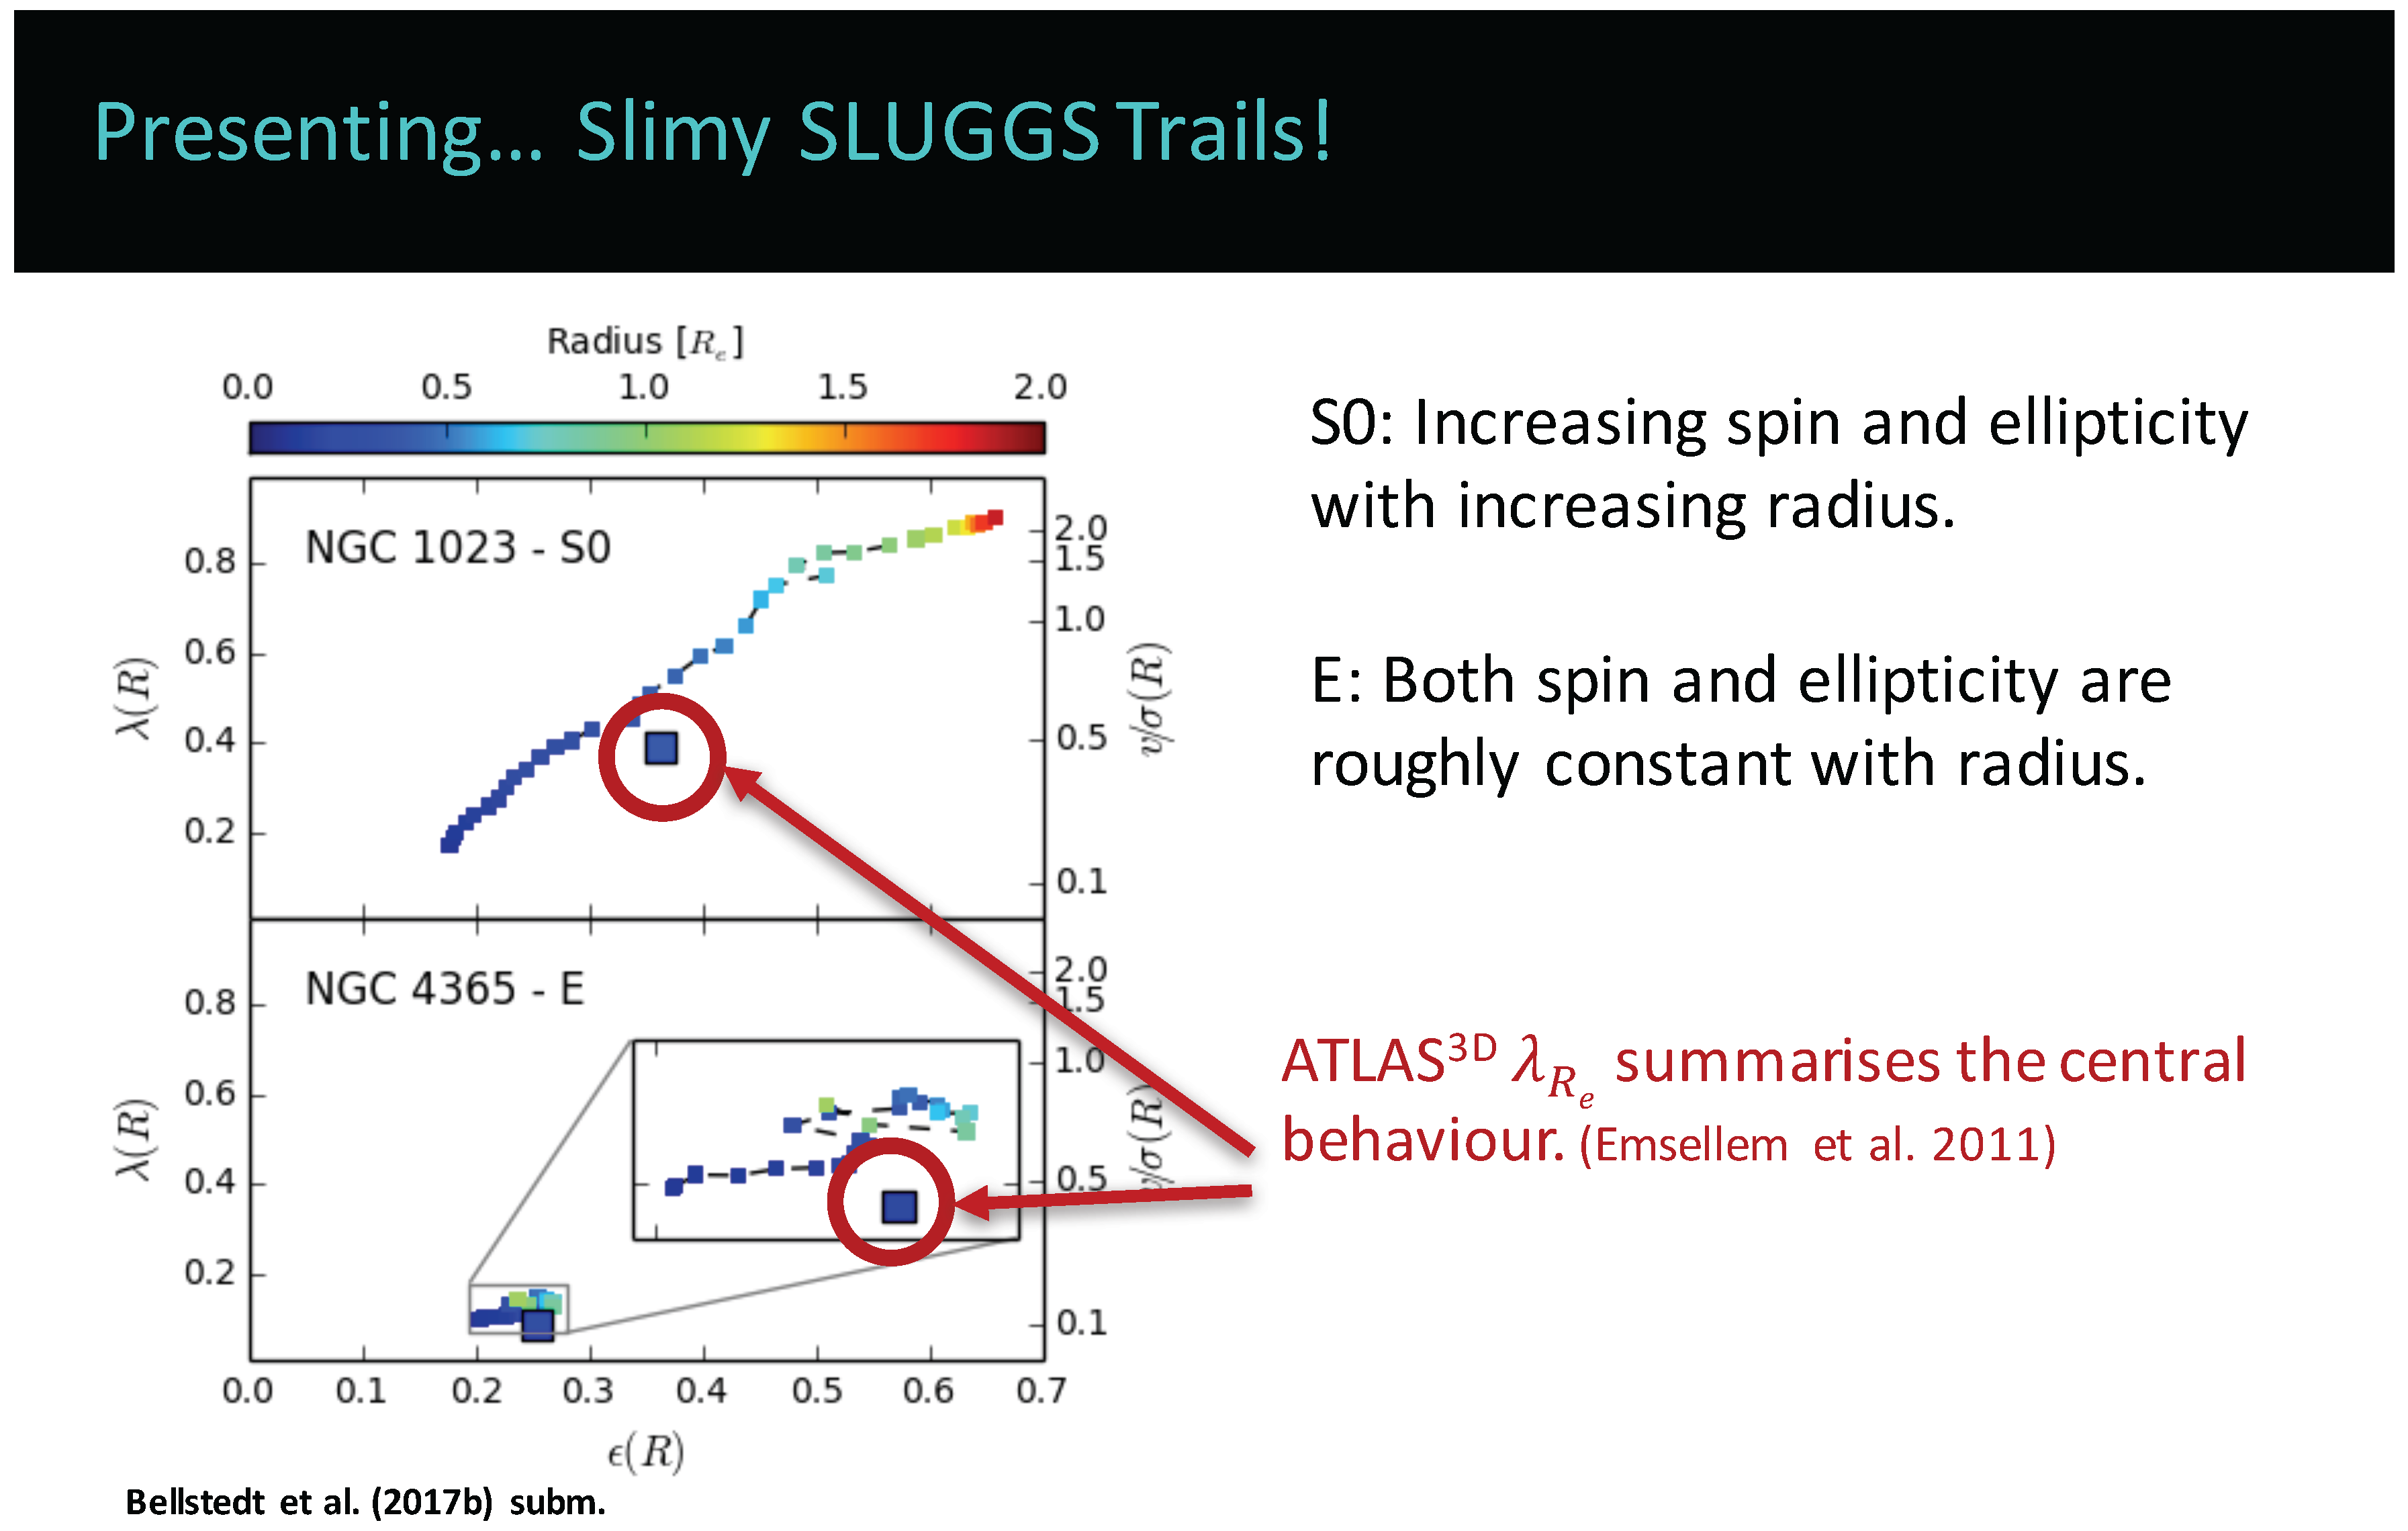
Figure 3.
Spin–ellipticity diagrams for the four SLUGGS galaxies with downturning profiles at larger radii. Note how the inner behaviour is akin to that of S0 galaxies, whereas the tracks at higher radii turn back to the region generally occupied by E galaxies. The right-hand figure is the velocity map for NGC 3377, which shows how the rotating nature of the galaxy does not extend to its outer regions.
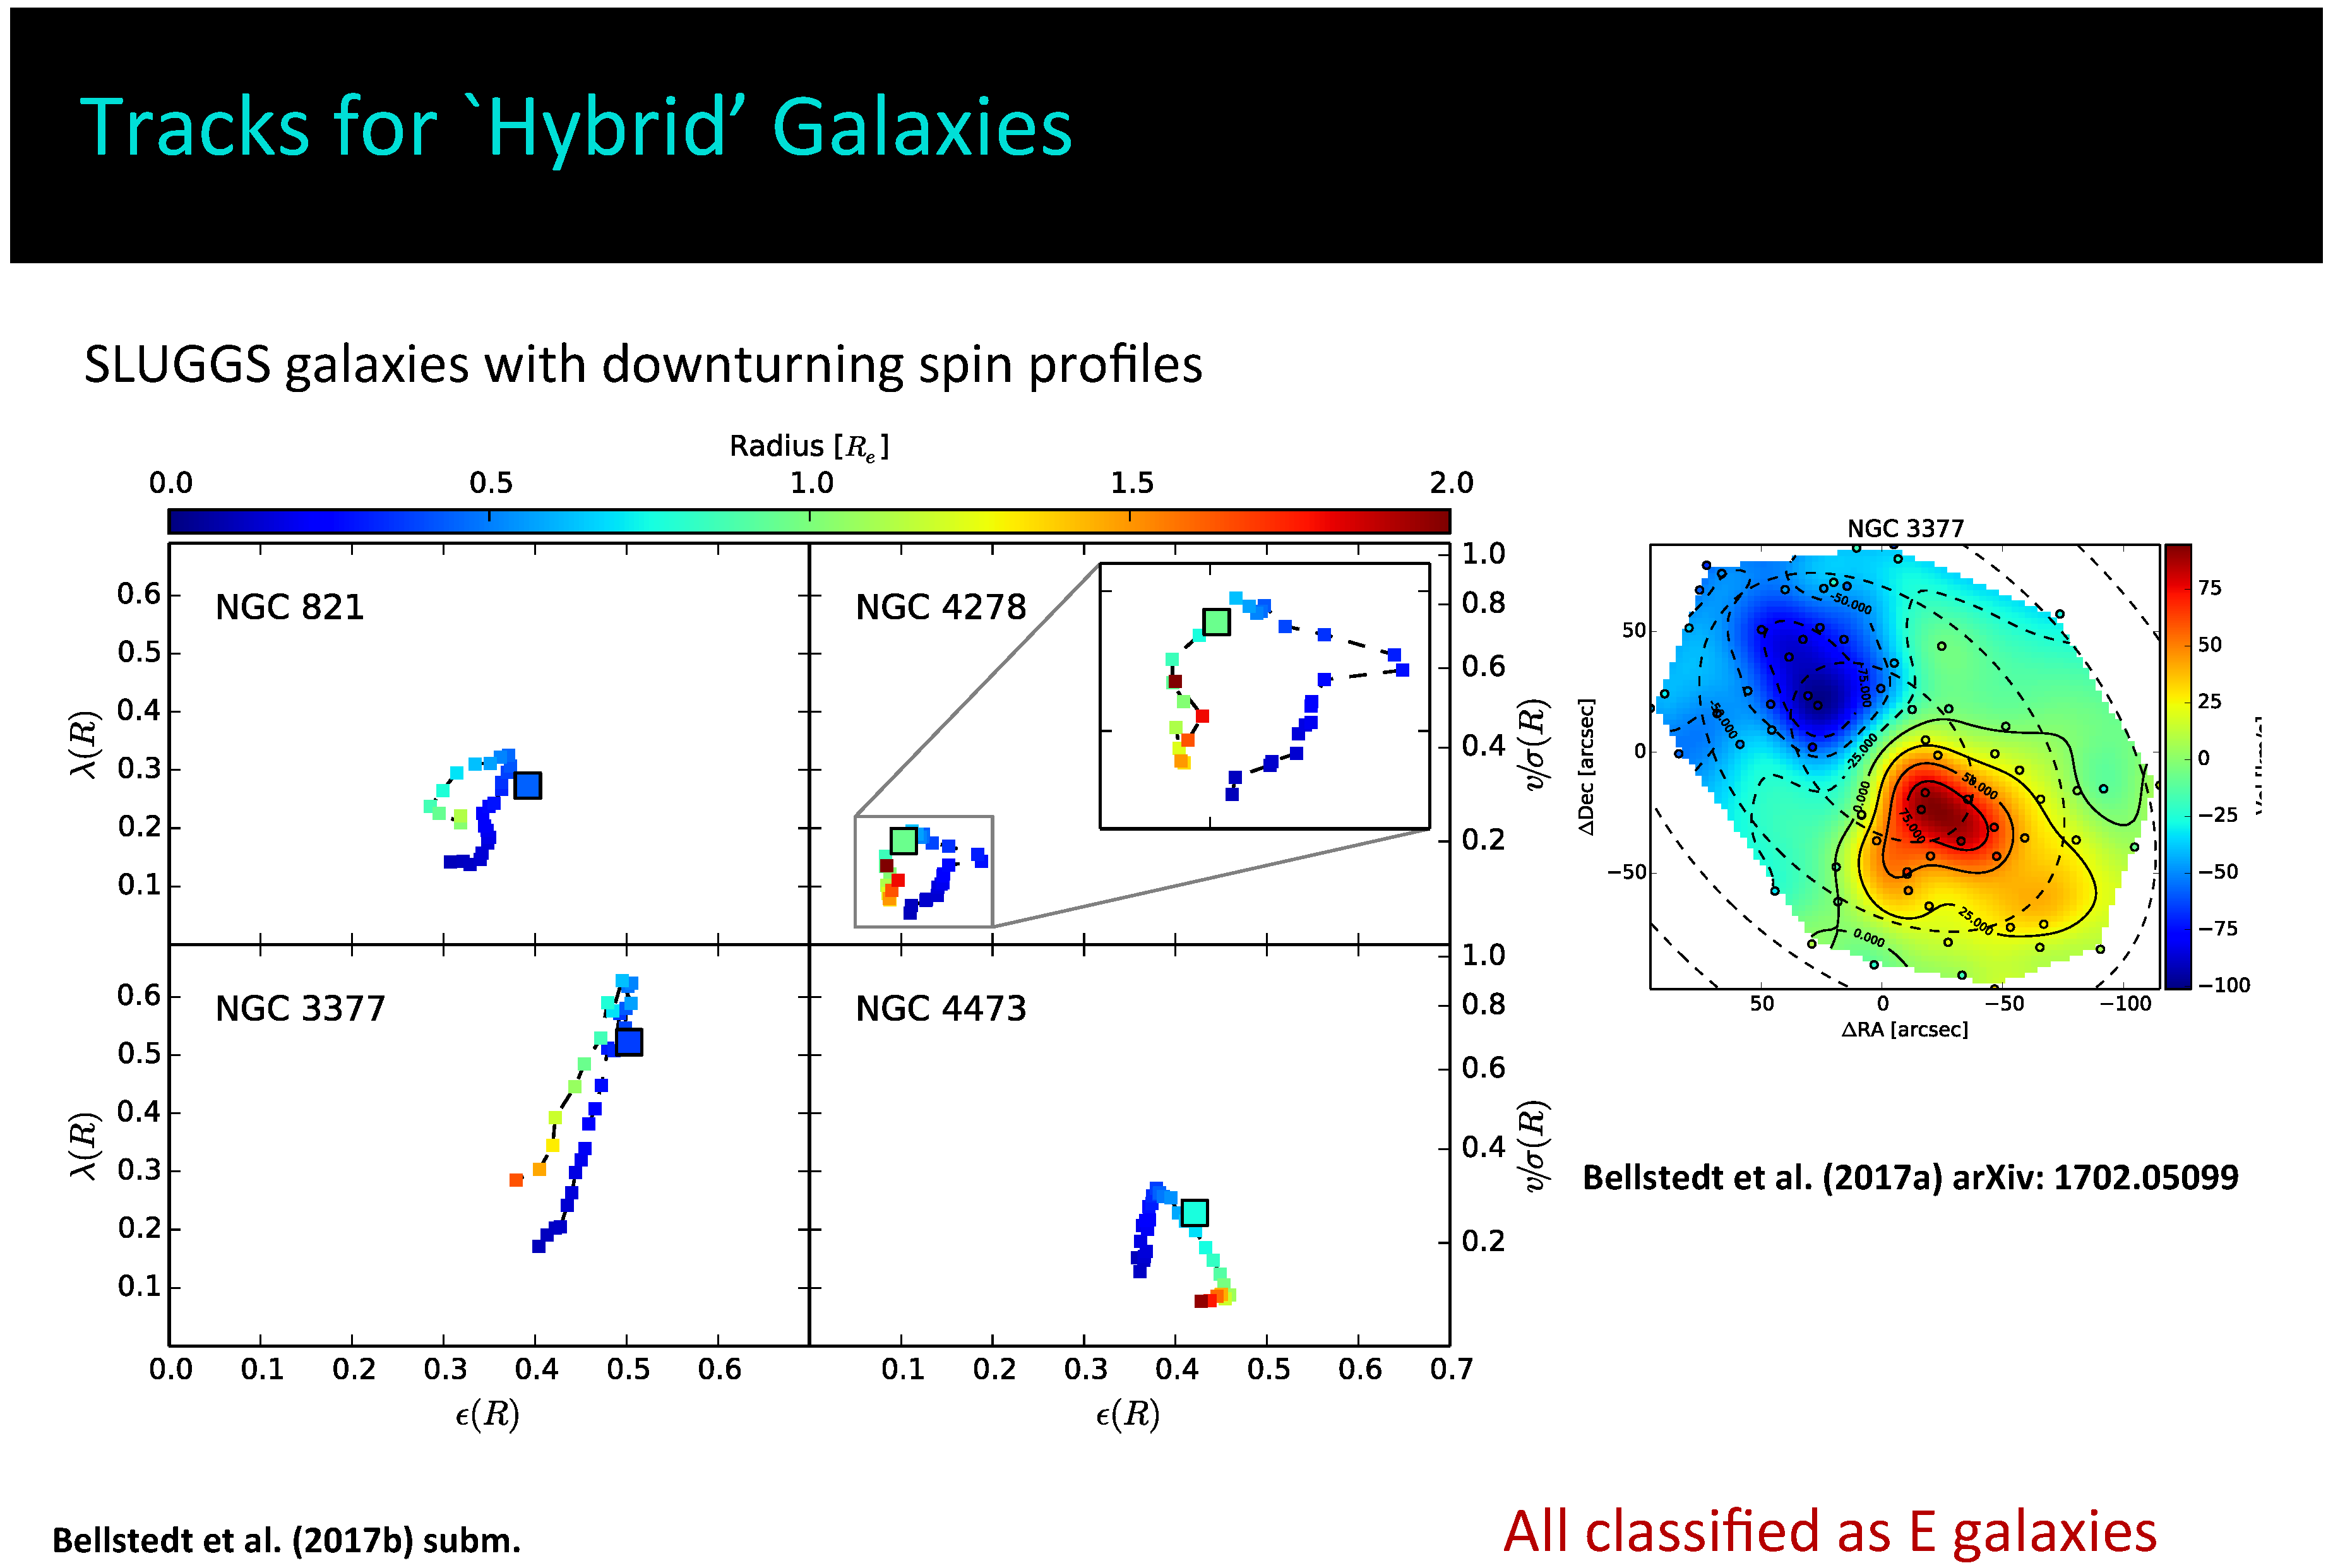
Figure 4.
Preliminary JAM maps of four lenticular galaxies of the SLUGGS survey.

© 2017 by the author. Licensee MDPI, Basel, Switzerland. This article is an open access article distributed under the terms and conditions of the Creative Commons Attribution (CC BY) license (http://creativecommons.org/licenses/by/4.0/).
Share and Cite
MDPI and ACS Style
Bellstedt, S. The SLUGGS Survey: Understanding Lenticular Galaxy Formation via Extended Stellar Kinematics. Galaxies 2017, 5, 26. https://doi.org/10.3390/galaxies5020026
AMA Style
Bellstedt S. The SLUGGS Survey: Understanding Lenticular Galaxy Formation via Extended Stellar Kinematics. Galaxies. 2017; 5(2):26. https://doi.org/10.3390/galaxies5020026
Chicago/Turabian StyleBellstedt, Sabine. 2017. "The SLUGGS Survey: Understanding Lenticular Galaxy Formation via Extended Stellar Kinematics" Galaxies 5, no. 2: 26. https://doi.org/10.3390/galaxies5020026
Note that from the first issue of 2016, this journal uses article numbers instead of page numbers. See further details here.