1. Introduction
Optical spectroscopy of blazars has been classically used to classify objects between two major categories: BL Lacs and FSRQs. However, it is well known that spectral characteristics may vary, yielding different classifications of the same object depending on the activity level. It is expected that several mechanisms may contribute in different proportions to the optical emission: synchrotron radiation from the jet, disk and broad line region (BLR) emission is distinct from the host galaxy stellar population. The goal of this work is to investigate which mechanisms contribute most to the observed optical emission by looking at the long-term variability of the spectral shape and luminosity. Based on a large dataset of spectra obtained during a period of almost 10 years we used a statistical approach to search for the minimum number of components capable of reproducing the observed variability.
2. The Data
Data were retrieved from the public archive of the ground-based observational support program to the Fermi mission (
http://james.as.arizona.edu/~psmith/Fermi/), conducted at Steward Observatory (University of Arizona). Data consists of a temporal set of low-resolution spectra, extending from 4000 Å to 7500 Å, obtained with the SPOL spectropolarimeter at the 1.5 m Kuiper and 2.3 m Bok telescopes [
1]. We have analysed all flux-calibrated spectra from 2008 to April 2015
1. Our dataset consists of about 5000 spectra, belonging to 25 blazars.
3. Spectral Characterisation
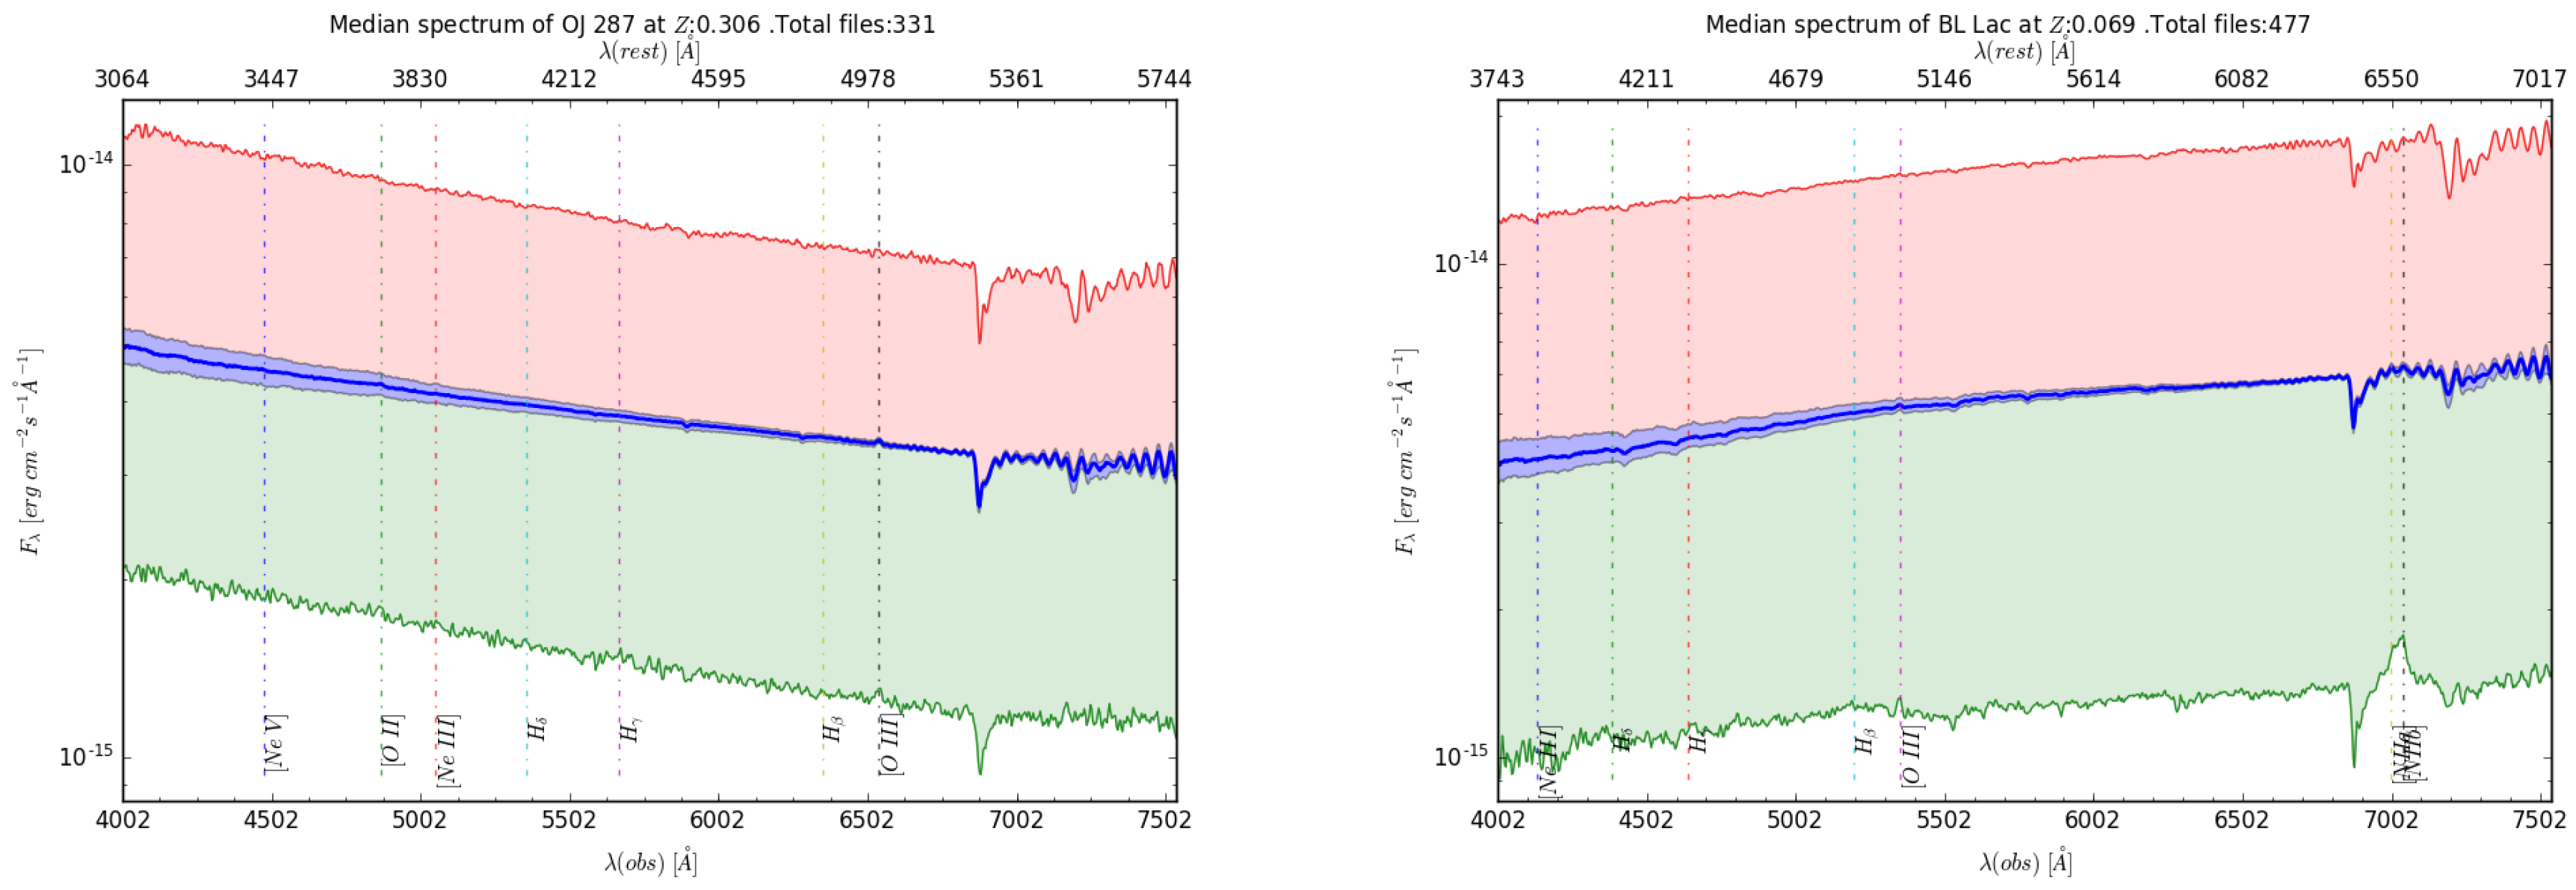
Our first approach was to obtain a representative spectrum of each target, computed as the median value for each wavelength. Three different classes of objects can be identified according to the features observed in the representative spectrum:
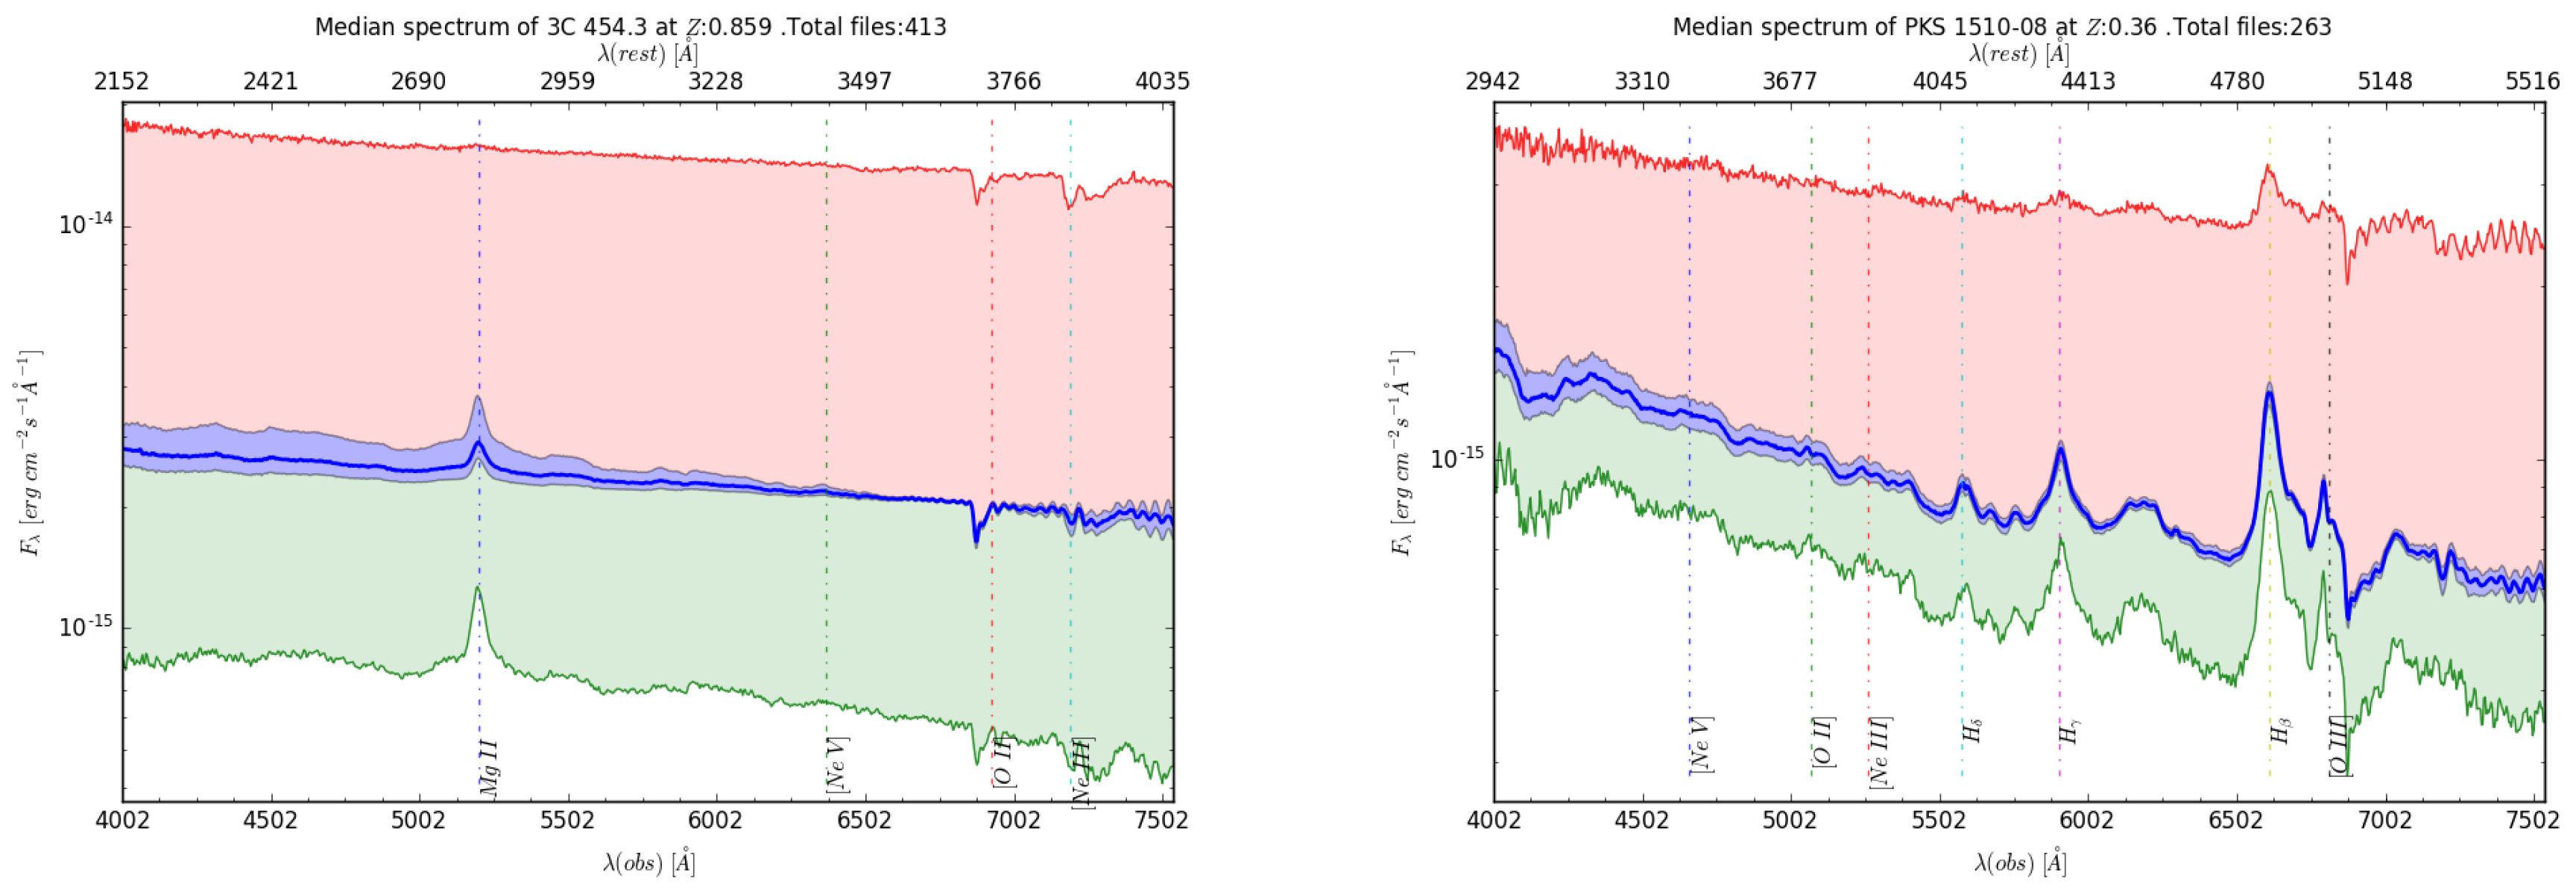
i—those showing prominent emission lines (see
Figure 1), or
FSRQ type;
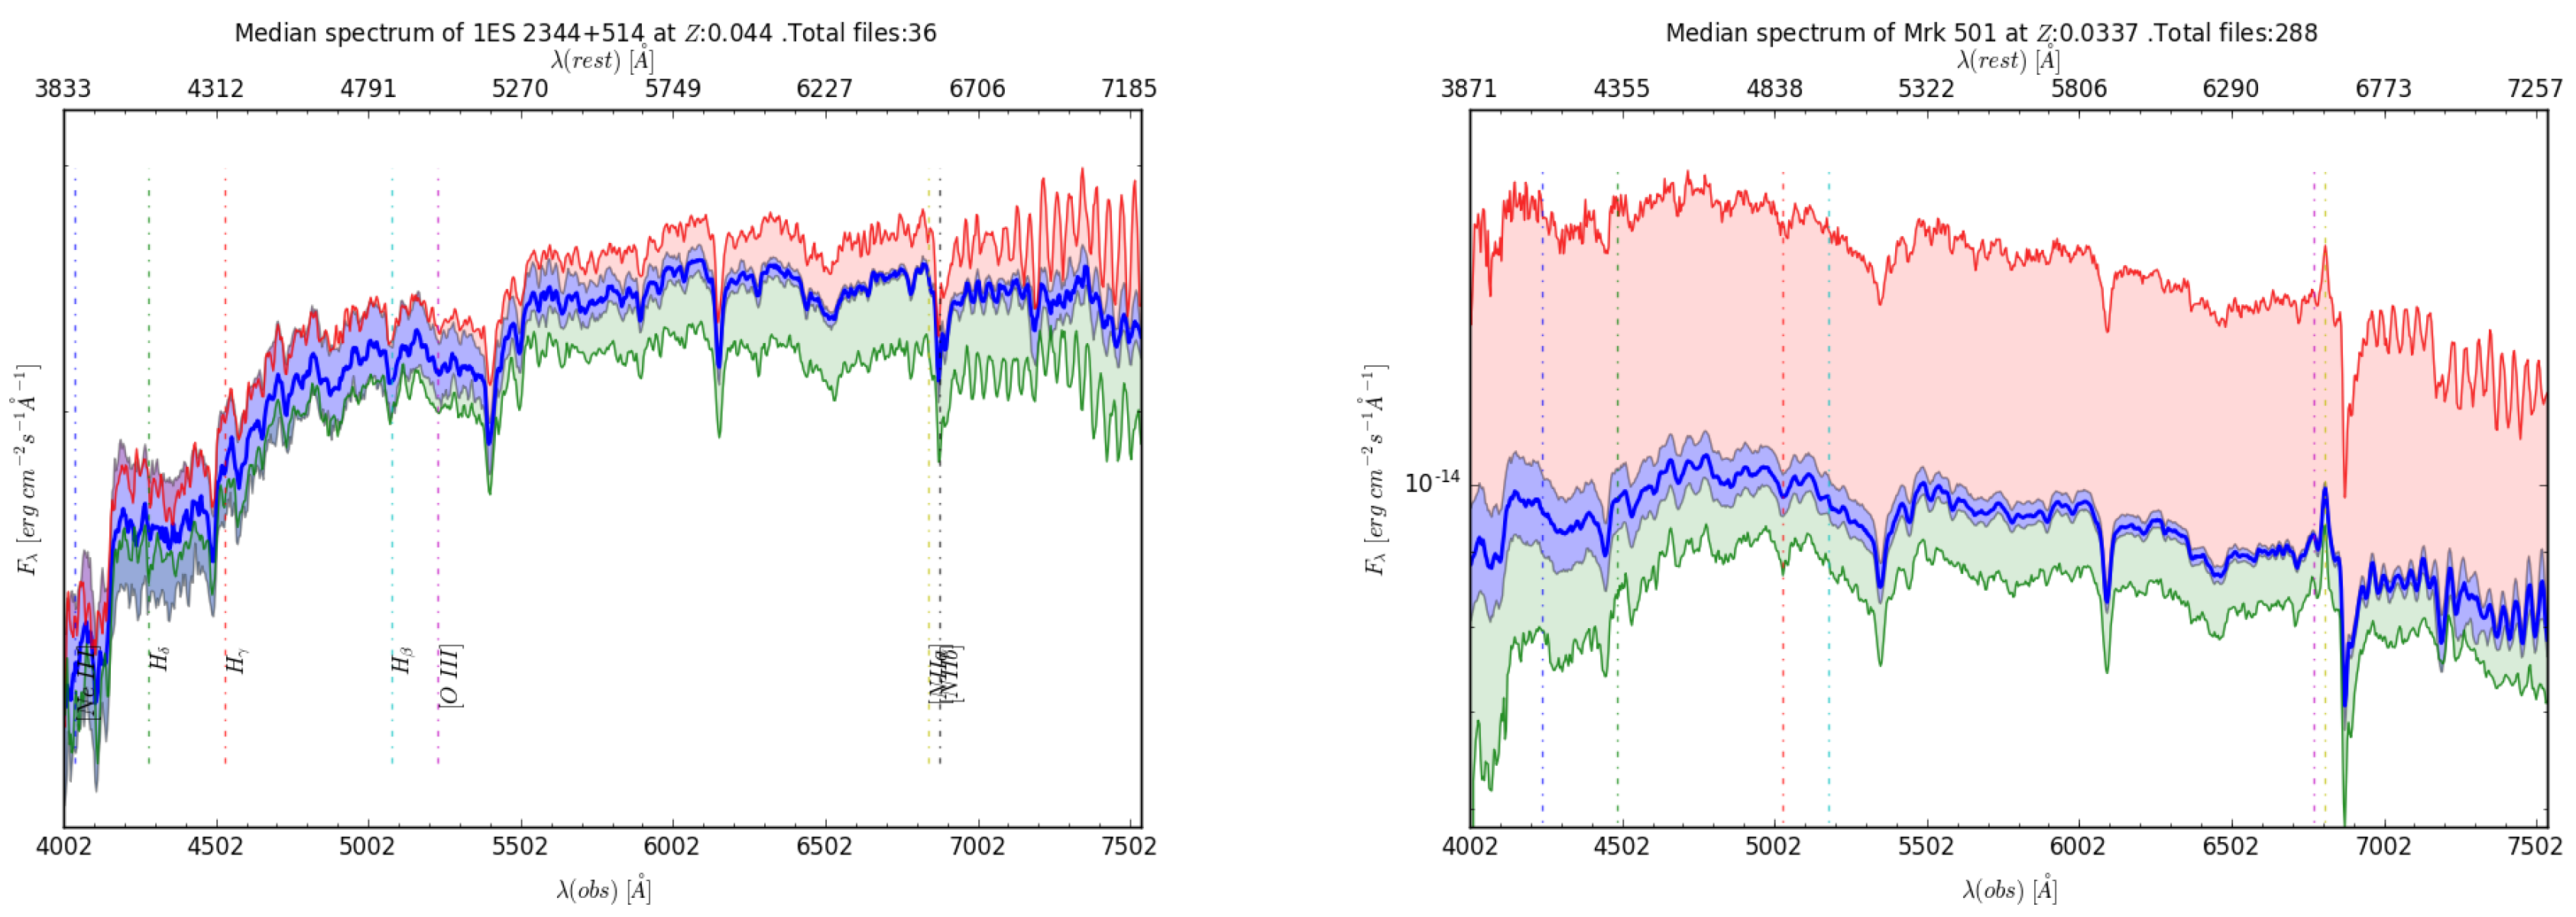
ii—those with a featureless spectrum (see
Figure 2), or
BL Lac type;
iii—finally those dominated by the stellar population (see
Figure 3), or
host galaxy type. Spectral features can be reliably identified and measured. We have sorted the objects of our sample into BL Lac and FSRQ, applying the standard criterion
[
2] to the representative spectrum. The full sample and classification will be published elsewhere. Nonetheless, the object classification is not fully meaningful, given the strong observed variability. As an example, we show in
Figure 2 the variation of the optical spectrum of BL Lac. It can be noticed that emission lines emerge only at low activity stages.
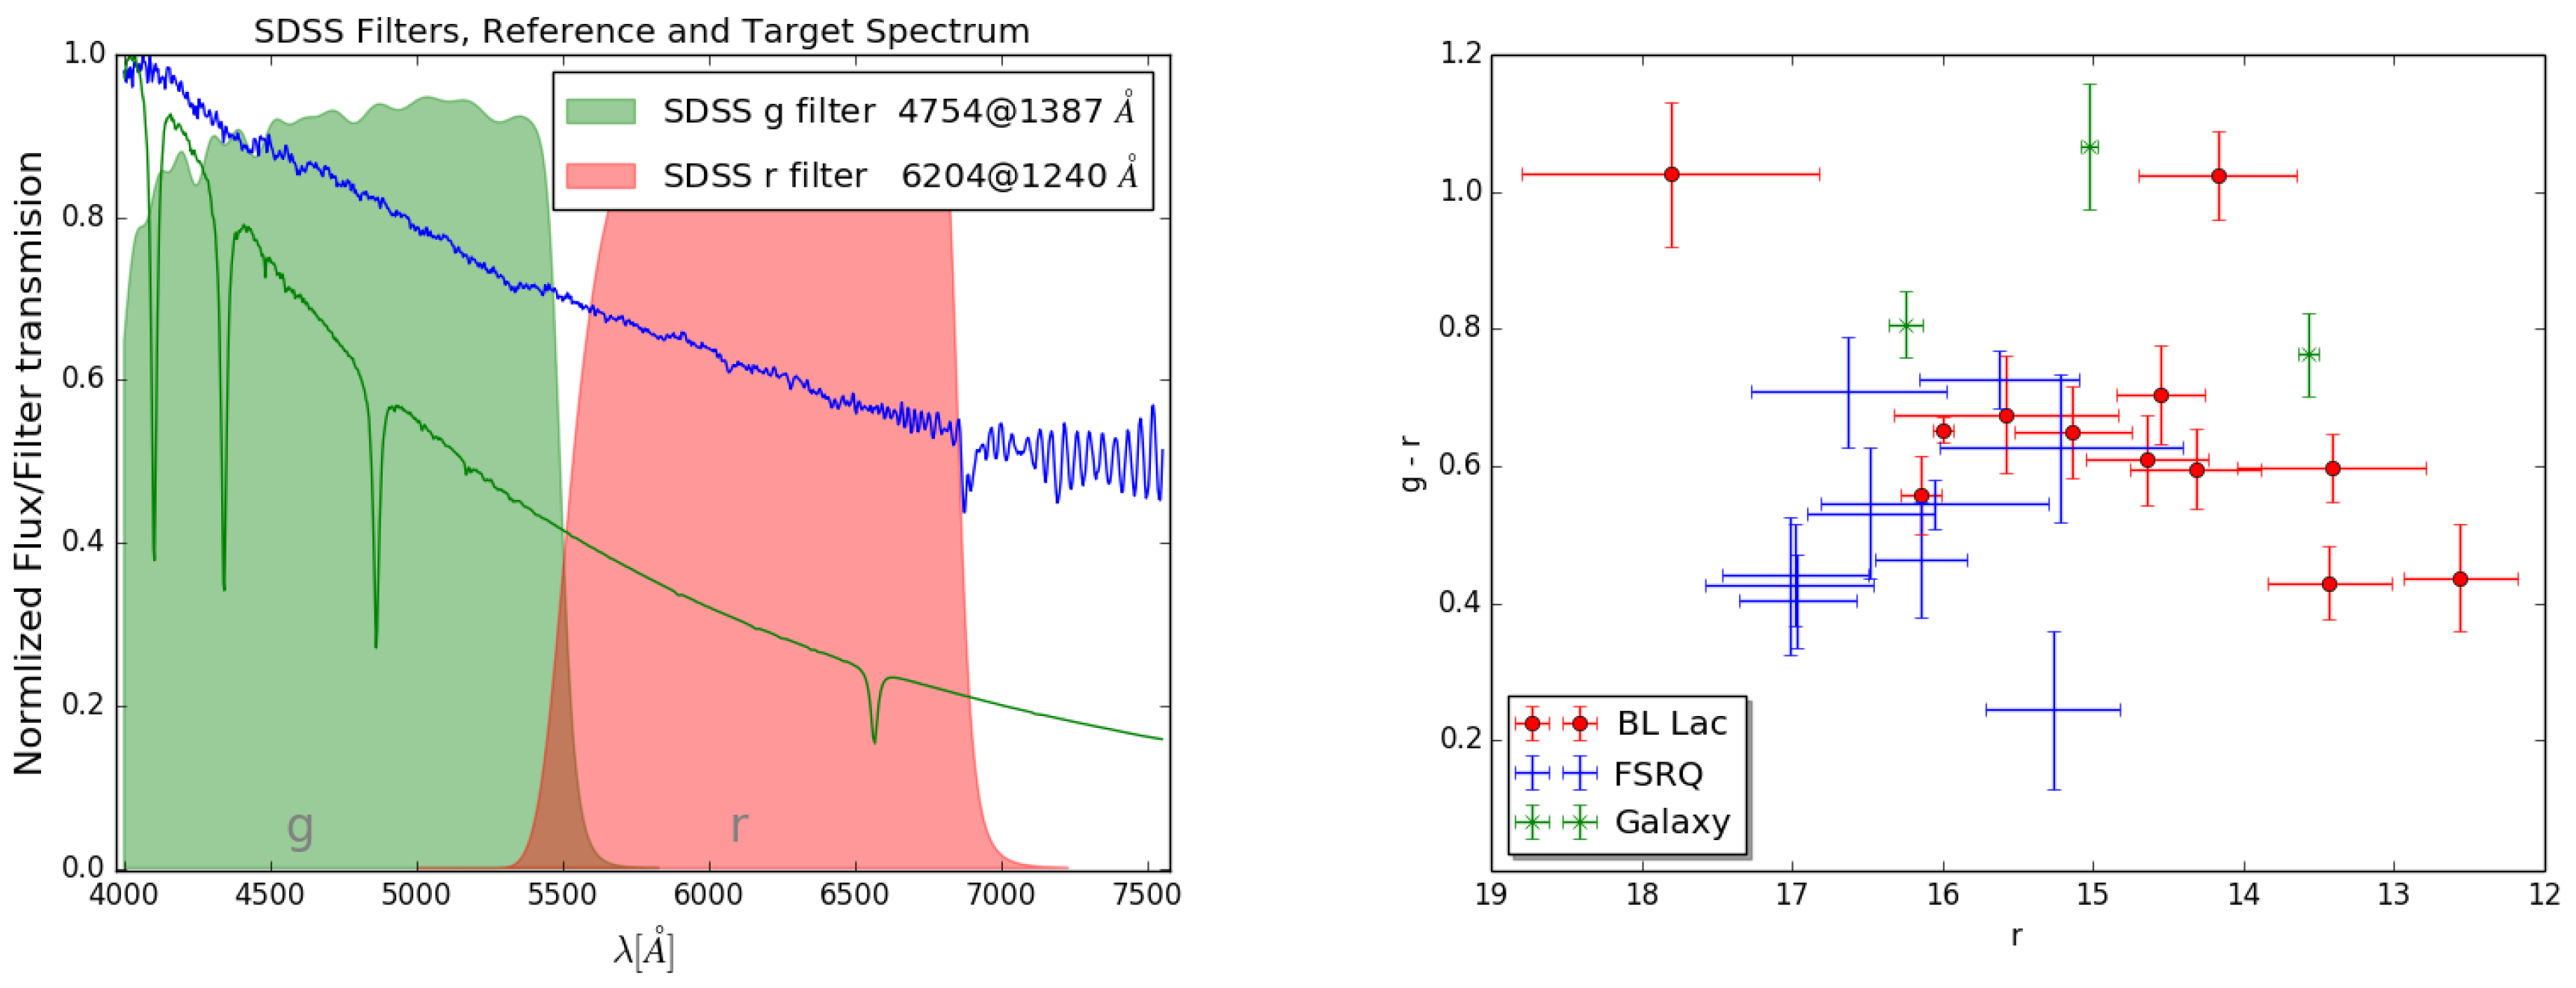
4. Synthetic Photometry
We have computed synthetic photometry from all flux-calibrated spectra. The range covered by the spectra nicely spans the transmission curves of the SDSS
g filter in the blue and
r in the red (see
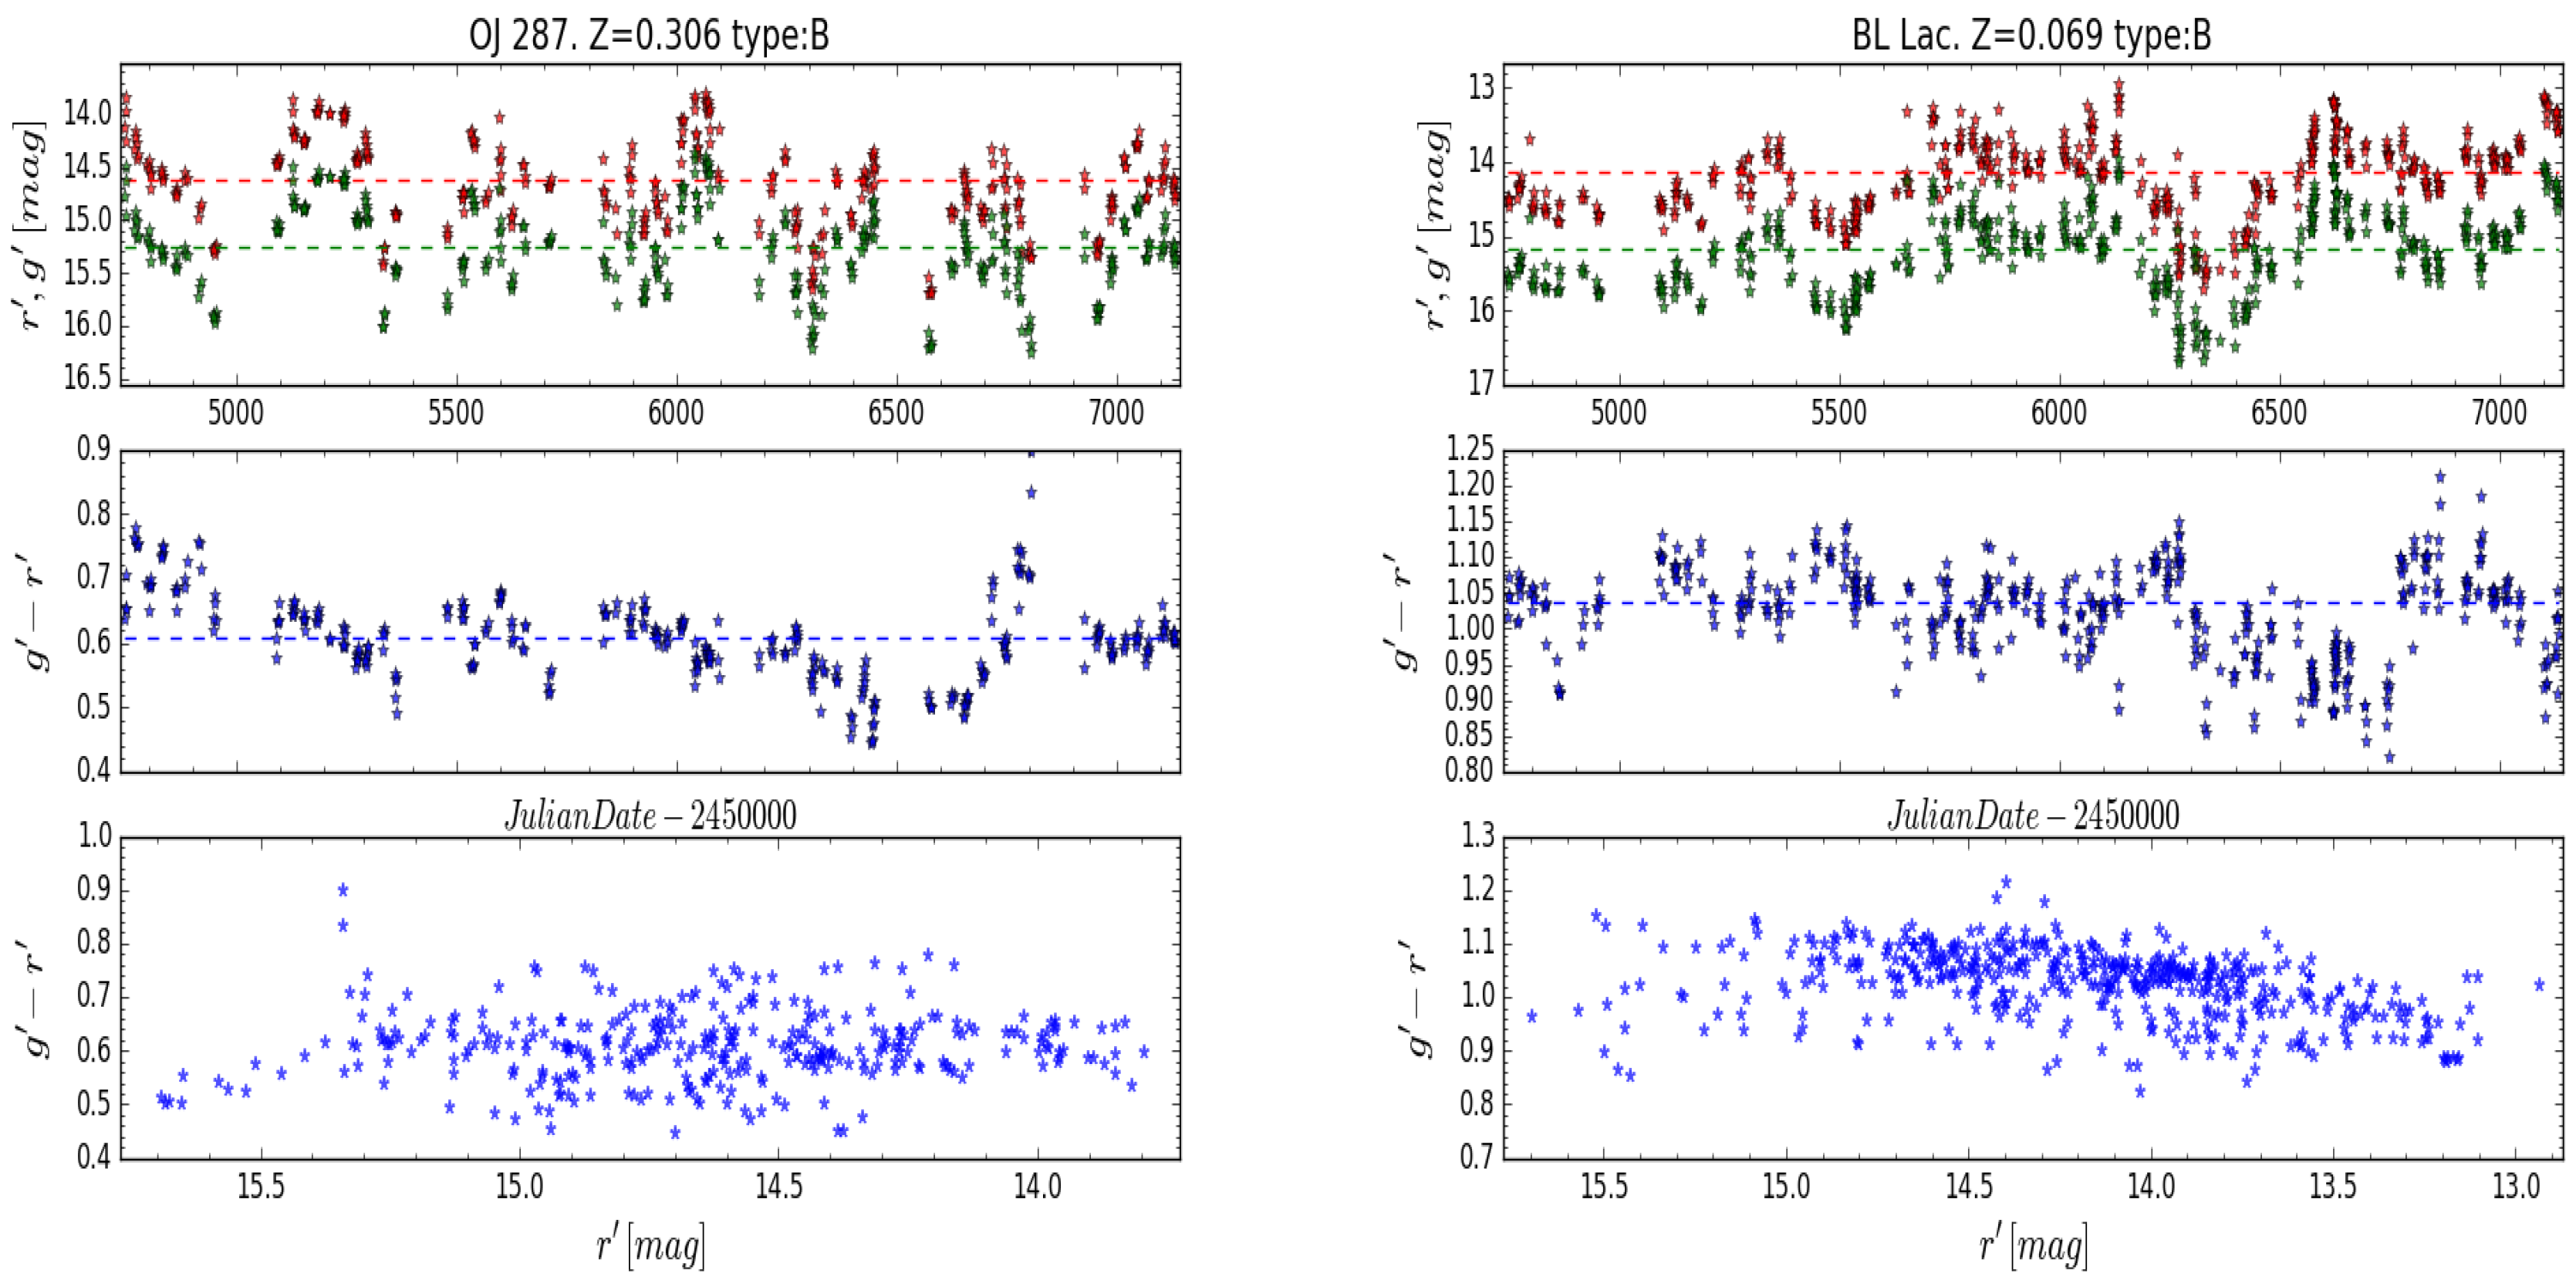
Figure 4). First we have built a colour-magnitude diagram including the whole dataset for all objects in our sample (see
Figure 4). It can be seen that BL Lacs are generally redder than FSRQs, showing larger flux variations but similar colour changes. For those objects where the stellar population dominates the spectrum, the colour varies whereas the flux remains almost constant. Regarding the brightness range, the more distant objects appear as the fainter ones, as expected.
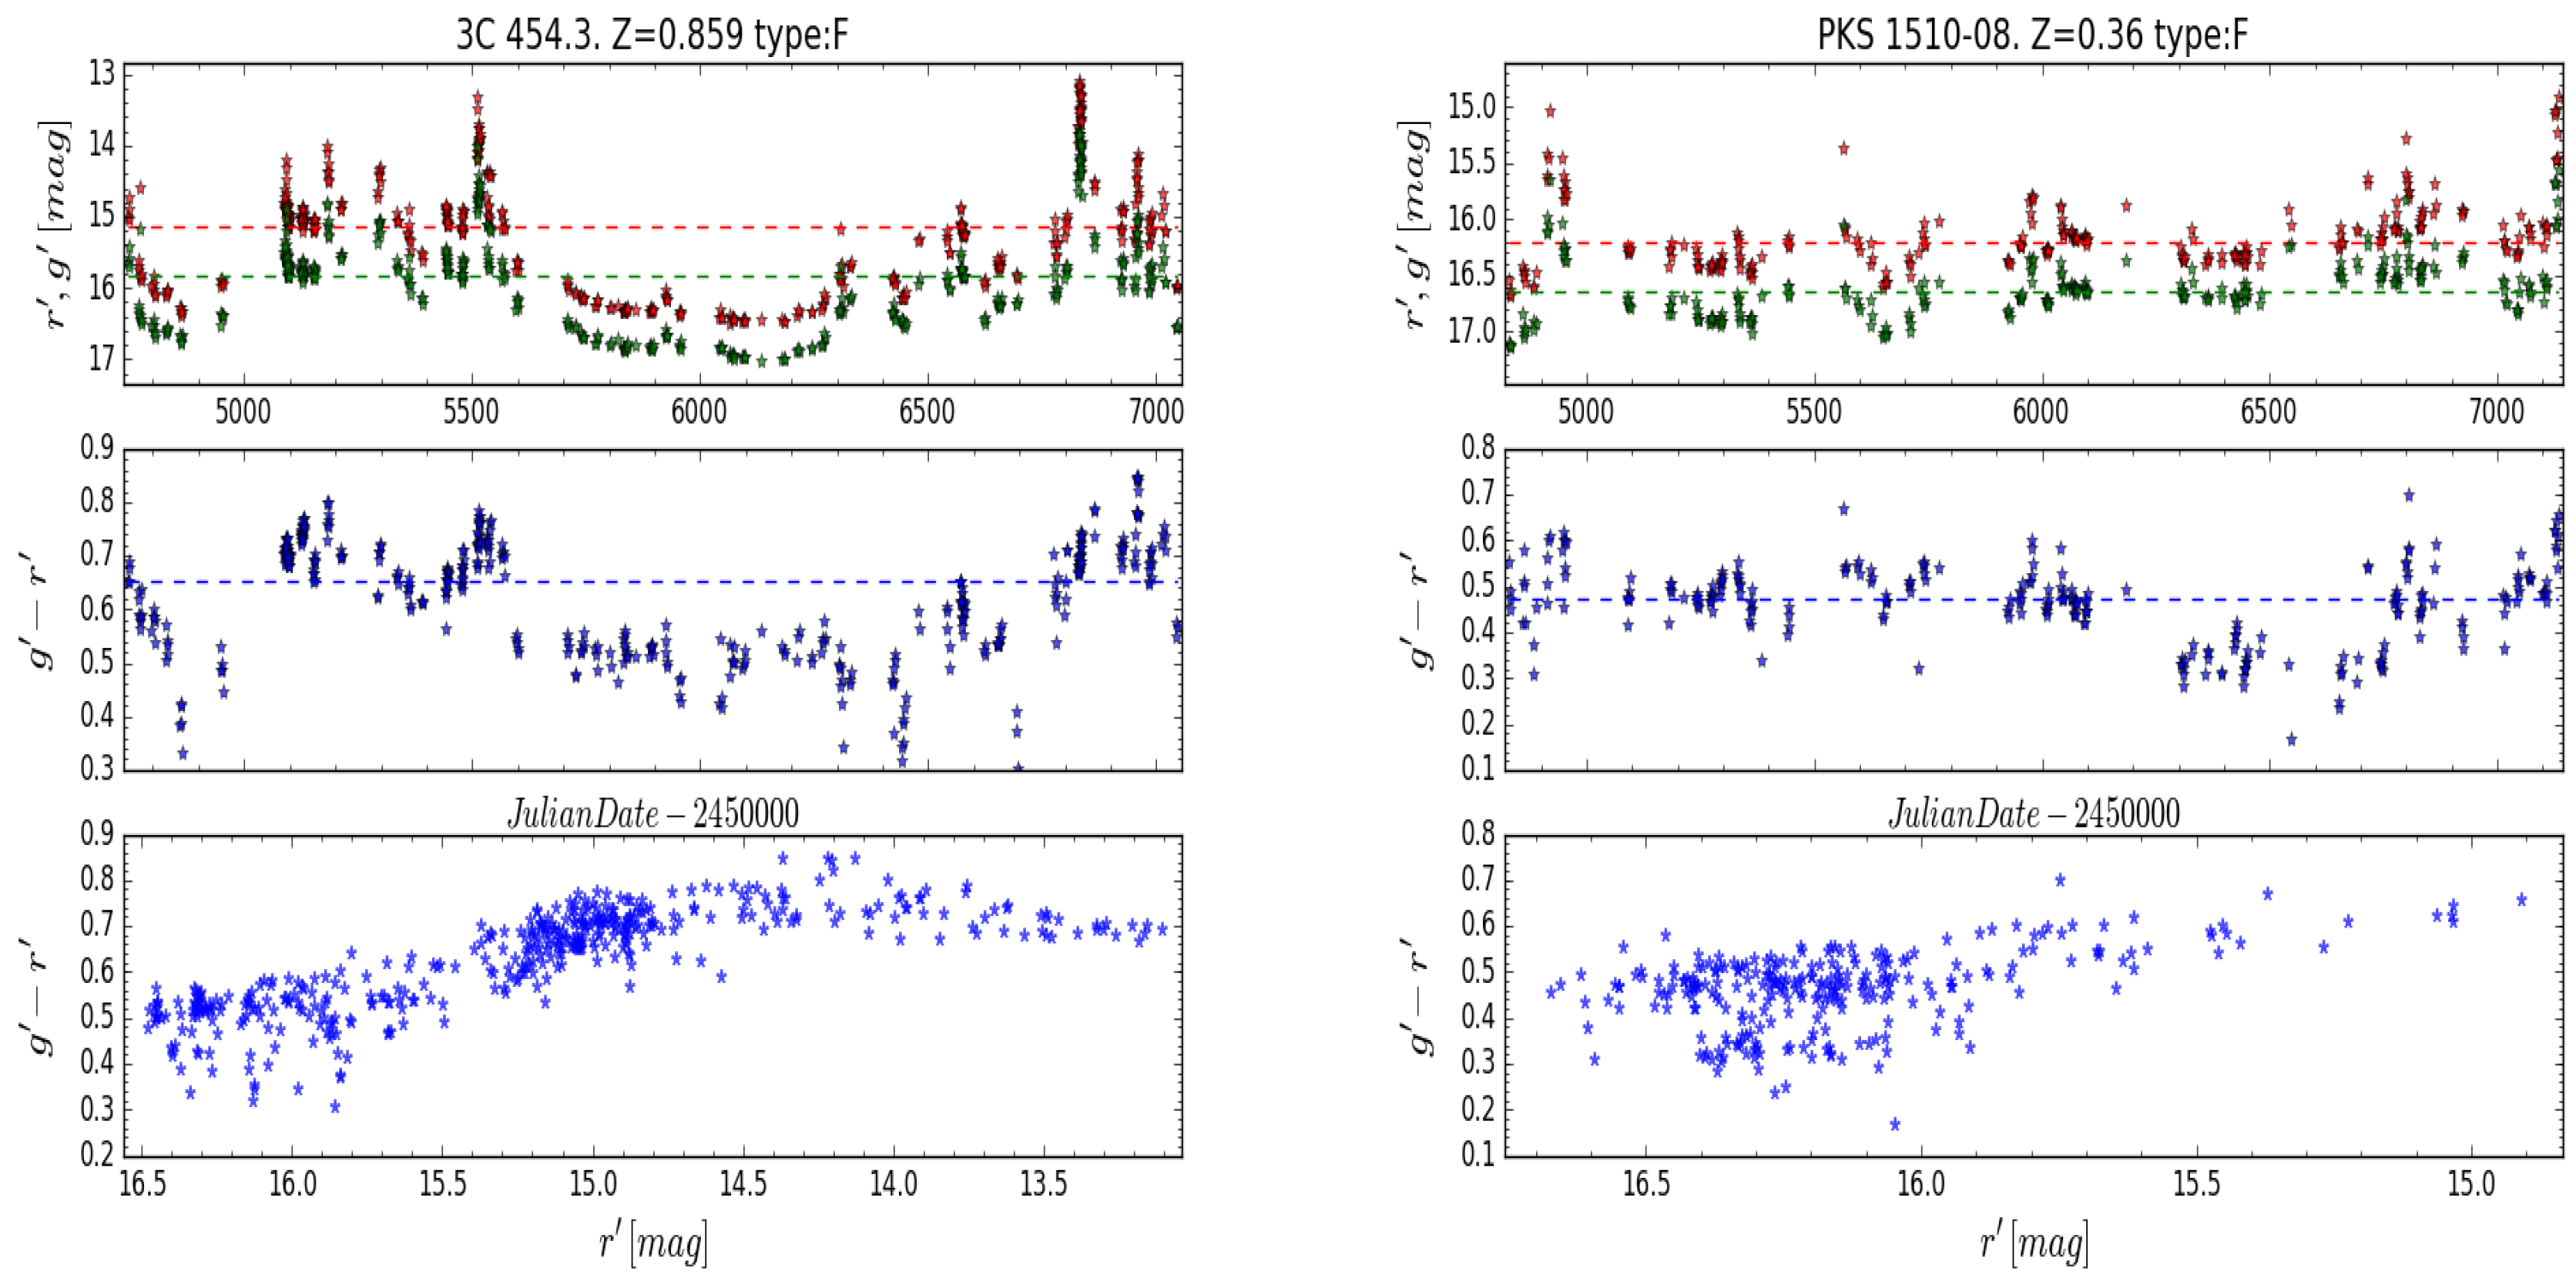
We have also looked at the brightness and colour variations with time. The observed behaviour depends on the object class: in general terms, FSRQs exhibit a trend to become redder when brighter (RWB). In contrast, BL Lacs tend to become bluer when brighter (BWB). However when FSRQs get very bright, they change to show a BWB trend (see
Figure 5). This fact was recognized by [
3] and referred to as a “saturation effect”. This can be explained by two different contributions in the optical: thermal emission from the accretion disk dominant in the blue region and the jet emission (variable) in the red one. At low flux levels the spectrum is blue and dominated by the disk, then it becomes redder when the red emission from the jet raises up to a certain level, when “saturation effect” takes place. Above this level, the jet emission dominates and the behaviour resembles those observed in BL Lac, i.e., BWB. This behaviour is explained by the dominance of a third variable and blue color component [
4]. The same effect can be seen in BL Lac-type objects (see
Figure 6), although the magnitude when the effect occurs is less well determined, in some cases only upper limits can be established.
5. Spectral Decomposition
Given the availability of a large number of spectra obtained for each object, it is meaningful to adopt an statistical approach to search the relevant physical mechanisms capable of explaining the observed variability. It is expected that a combination of a few physical components (synchrotron, accretion disk and stellar population emission) can reproduce the observed flux and colour variations. For that purpose we have explored a mathematical technique called Non-Negative Matrix Factorization (NMF).
The NMF method: Techniques such as PCA (Principal Components Analysis) have been used to decompose a multivariate dataset into a set of successive orthogonal components that explain the maximum amount of variance [
5,
6]. The goal is to project the data to a lower-dimensional space that preserves most of the variance. The main inconvenience of PCA is that components can be positive or negative, which is meaningless in many physical cases. Instead, other techniques such as NMF can be applied to ensure positive components. NMF has been applied in face recognition, genes pattern discovery [
7] and to spectral data analysis in astronomical context [
8]. Mathematically, the problem corresponds to factorising a matrix into two matrices of lower dimension and with positive values
. A main hypothesis of PCA or NMF decomposition is that each spectrum can be decomposed into a linear combination of a certain number of components.
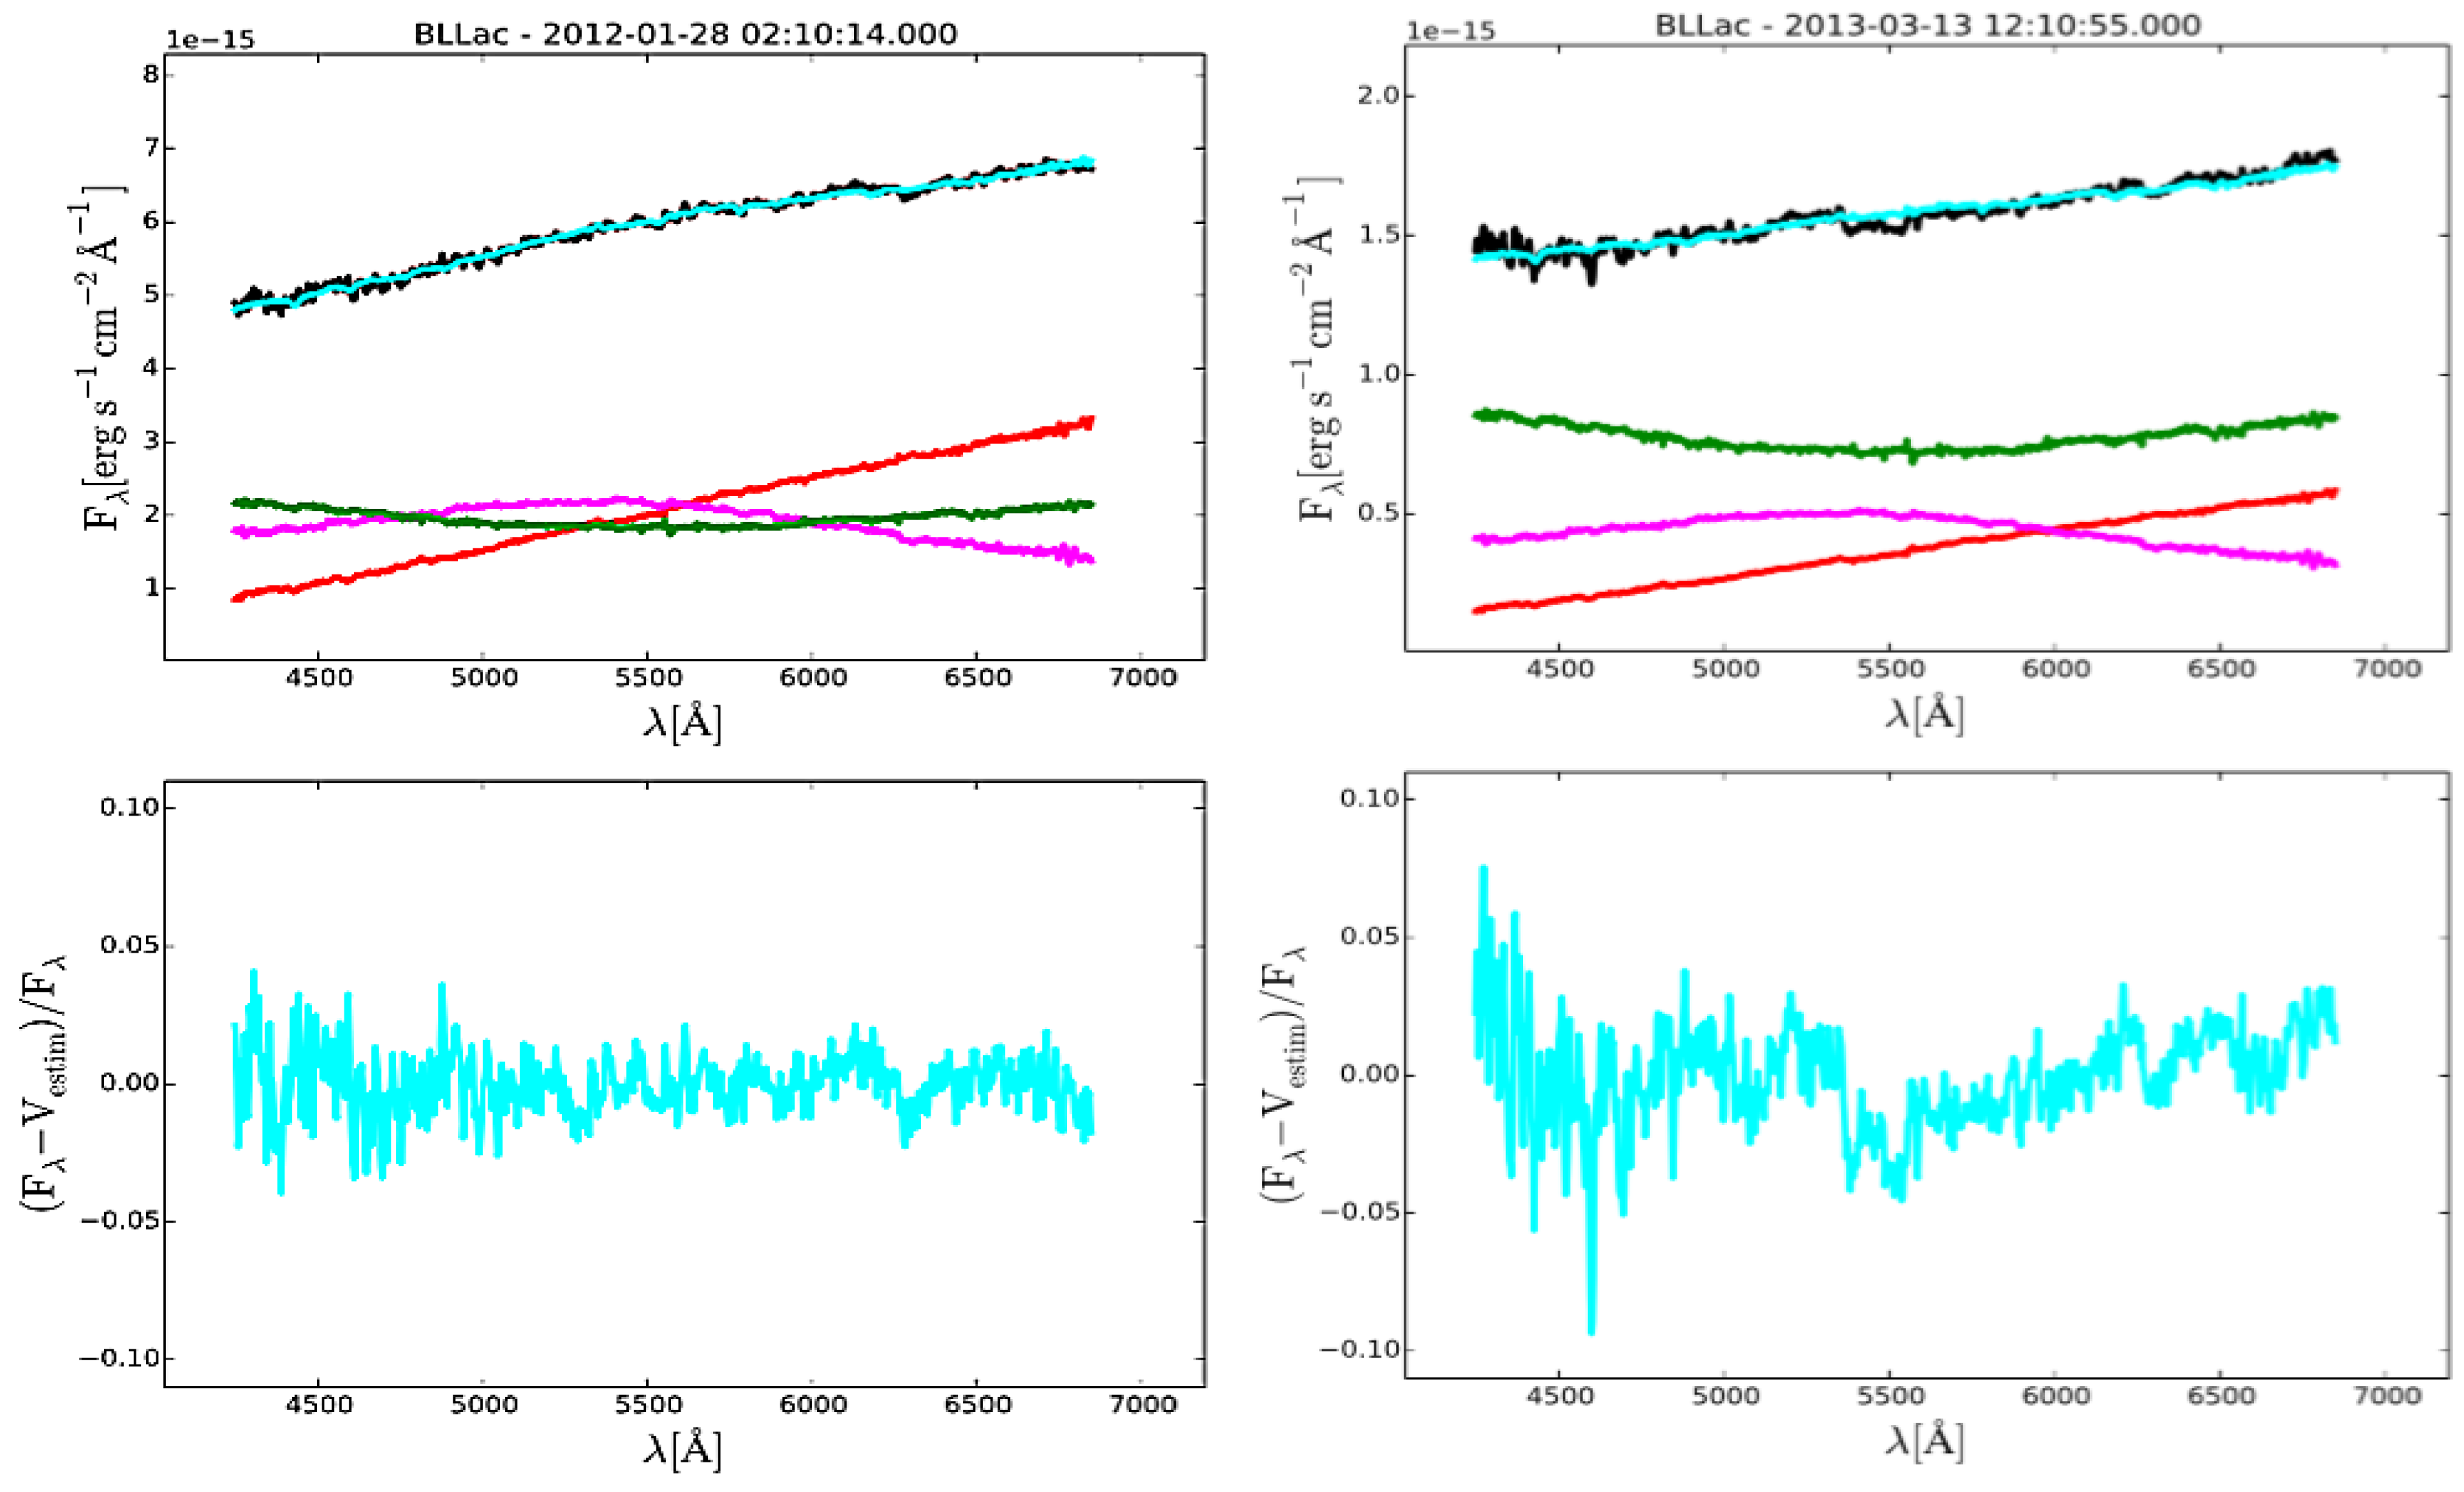
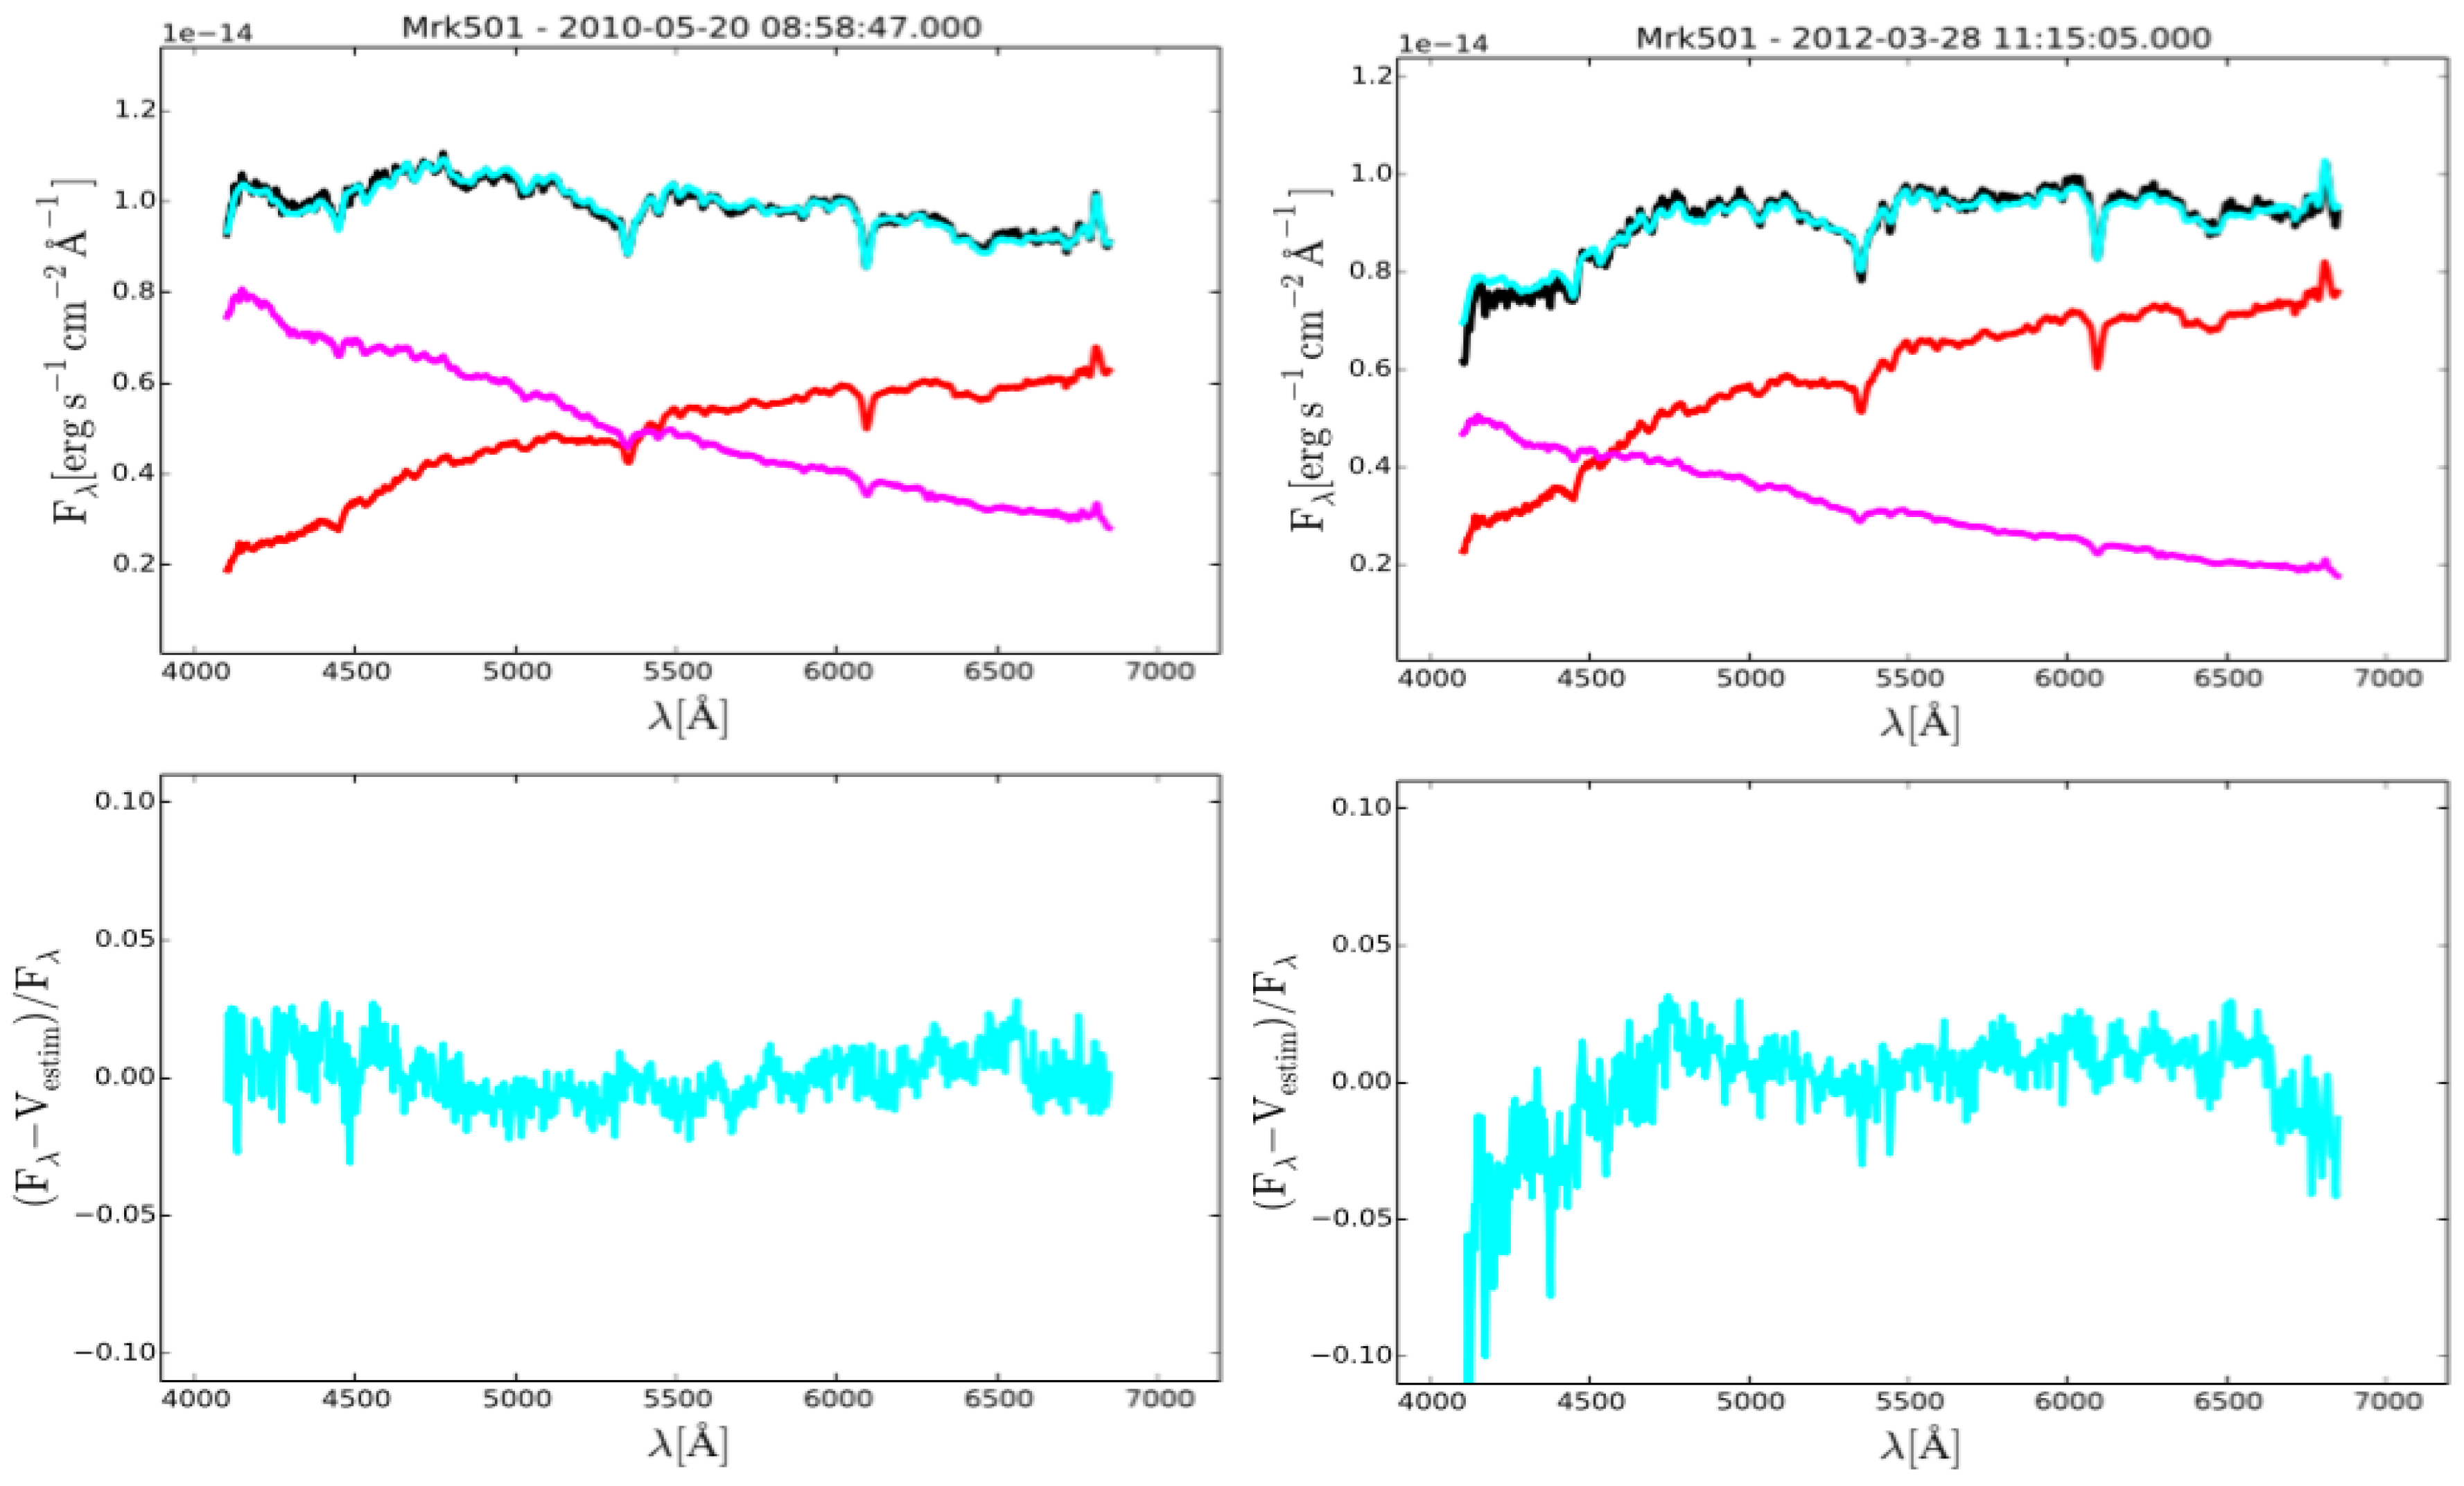
We have applied the NMF method for objects in the sample with at least 50 observations. The minimum number of components has been selected based on various criteria: the capability to reproduce observed spectra, to avoid components with similar spectral shape as well as the smoothness of each component. For most cases we found a minimum number of 2 or 3. Here we present two examples of spectral decomposition using NMF: BL Lac and Mrk 501 (
Figure 7 and
Figure 8). In the case of BL Lac, the best results are obtained with three components: the red one can be identified with the synchrotron emission extending to radio frequencies, whereas the green and magenta ones may correspond to disk emission or to another synchrotron peaking in the UV. In the low state the most intense component is the green one, whereas in the high state the red one dominates. In the case of Mrk 501, the best results are obtained with two components: the magenta one could be identified with a variable synchrotron emission, whereas the red one is dominated by the stellar population, which does not vary noticeably.
Caveats: It is worth mentioning that it is possible that not all components found by the NMF decomposition correspond to a physical mechanism. Furthermore, each component is assumed to remain spectrally constant, which may not be always true, for example when the peak of synchrotron emission is within the optical range and moves along the wavelength. In these cases, an intrinsic variation in the spectral shape has to be reproduced by more than one component. On the other hand we plan to explore further the uniqueness of the components, NMF is an iterative process and there could be more than one combination of components capable of reproducing the observed variability.
Acknowledgments
Data from the Steward Observatory spectropolarimetric monitoring project were used. This program is supported by Fermi Guest Investigator grants NNX08AW56G, NNX09AU10G, NNX12AO93G, and NNX15AU81G.
Author Contributions
All authors contributed actively to the paper.
Conflicts of Interest
The authors declare no conflicts of interest.
References
- Smith, P.S.; Montiel, E.; Rightley, S.; Turner, J.; Schmidt, G.D.; Jannuzi, B.T. Coordinated Fermi/Optical Monitoring of Blazars and the Great 2009 September Gamma–ray Flare of 3C 454.3. arXiv, 2009; arXiv:0912.3621. [Google Scholar]
- Stickel, M.; Padovani, P.; Urry, C.M.; Fried, J.W.; Kuehr, H. The complete sample of 1 Jansky BL Lacertae objects. I–Summary properties. Astrophys. J. 1991, 374, 431–439. [Google Scholar] [CrossRef]
- Villata, M.; Raiteri, C.M.; Balonek, T.J.; Aller, M.F.; Jorstad, S.G.; Kurtanidze, O.M.; Nicastro, F.; Nilsson, K.; Aller, H.D.; Arai, A.; et al. The unprecedented optical outburst of the quasar 3C 454.3. The WEBT campaign of 2004–2005. Astron. Astrophys. 2006, 453, 817–822. [Google Scholar] [CrossRef]
- Ikejiri, Y.; Uemura, M.; Sasada, M.; Ito, R.; Yamanaka, M.; Sakimoto, K.; Arai, A.; Fukazawa, Y.; Ohsugi, T.; Kawabata, K.S.; et al. Photopolarimetric Monitoring of Blazars in the Optical and Near-Infrared Bands with the Kanata Telescope. I. Correlations between Flux, Color, and Polarization. Publ. Astron. Soc. Jpn. 2011, 63, 639–675. [Google Scholar] [CrossRef]
- Kendall, M.G. Multivariate Analysis; Griffin: London, UK, 1975. [Google Scholar]
- Parker, M.L.; Fabian, A.C.; Matt, G.; Koljonen, K.I.I.; Kara, E.; Alston, W.; Walton, D.J.; Marinucci, A.; Brenneman, L.; Risaliti, G. Revealing the X-ray variability of AGN with principal component analysis. Mon. Not. R. Astron. Soc. 2015, 447, 72–96. [Google Scholar] [CrossRef]
- Brunet, J.P.; Tamayo, P.; Golub, T.R.; Mesirov, J.P. Metagenes and molecular pattern discovery using matrix factorization. Proc Natl. Acad. Sci. USA 2004, 101, 4164–4169. [Google Scholar] [CrossRef] [PubMed]
- Pauca, V.P.; Piper, J.; Plemmons, R.J. Nonnegative matrix factorization for spectral data analysis. Linear Algebra Appl. 2006, 416, 29–47. [Google Scholar] [CrossRef]
© 2016 by the authors. Licensee MDPI, Basel, Switzerland. This article is an open access article distributed under the terms and conditions of the Creative Commons Attribution (CC BY) license ( http://creativecommons.org/licenses/by/4.0/).

