Article

Correlation Analysis of Delays between Variations of Gamma-Ray and Optical Light Curves of Blazars

by Karen E. Williamson 1,*, Svetlana G. Jorstad 1,2, Alan P. Marscher 1, Valeri M. Larionov 2,3,4, Iván Agudo 1,5, Arkady A. Arkharov 3, Dmitry A. Blinov 2,6, Carolina Casadio 5, José L. Gómez 5, Vladimir A. Hagen-Thorn 2,4, Manasvita Joshi 1, Tatiana S. Konstantinova 2, Evgenia N. Kopatskaya 2, Elena G. Larionova 2, Liudmilla V. Larionova 2, Michael P. Malmrose 1, Ian M. McHardy 7, Sol N. Molina 5, Daria A. Morozova 2, Brian W. Taylor 1,8 and Ivan S. Troitsky 2add Show full author list remove Hide full author list
1
Institute for Astrophysical Research, Boston University, 725 Commonwealth Avenue, Boston, MA 02215, USA
2
Astronomical Institute, St. Petersburg State University, Universitetskij Pr. 28, Petrodvorets, 198504 St. Petersburg, Russia
3
Main (Pulkovo) Astronomical Observatory of RAS, Pulkovskoye shosse, 60, 196140 St. Petersburg, Russia
4
Isaac Newton Institute of Chile, St. Petersburg Branch, 198504 St. Petersburg, Russia
5
Instituto de Astrofísica de Andalucía, CSIC, Apartado 3004, 18080 Granada, Spain
6
Department of Physics, University of Crete, 71003 Heraklion, Greece
7
Department of Physics and Astronomy, University of Southampton, Southampton SO17 1BJ, UK
8
Lowell Observatory, Flagstaff, AZ 86001, USA
*
Author to whom correspondence should be addressed.
Galaxies 2016, 4(4), 64; https://doi.org/10.3390/galaxies4040064
Submission received: 14 July 2016 / Revised: 11 November 2016 / Accepted: 15 November 2016 / Published: 23 November 2016
(This article belongs to the Special Issue Blazars through Sharp Multi-wavelength Eyes)

Abstract

:
We have been performing multi-wavelength monitoring of a sample of γ -ray blazars since the launch of the Fermi Gamma-ray Space Telescope in 2008. We present γ -ray and optical light curves for several quasars and BL Lac objects from the sample to illustrate different patterns of variability. We investigate correlations between γ -ray and R-band light curves and, if these are statistically significant, determine delays between variations at the two wavebands. Such time delays can reveal the relative locations of the emitting regions in AGN jets and the origin of the high-energy photons. We present preliminary results of this analysis. Of the 29 blazars with sufficient time coverage, 17 display a significant, singular, correlated time lag when tested over the entire 7-year period. Of these sources, the six that exhibit a consistent time lag across a majority of epochs of high activity have lags of 0 ± 7 days; the 11 without consistency across epochs of high activity generally display longer mean lags, with γ -ray leading optical. Eleven sources display no significant singular correlation over either the entire 7-year period or across shorter intervals. No significant difference is apparent between the BL Lac objects and FSRQs. Even after 7 years of monitoring, our correlation analysis remains plagued with uncertainties due to insufficient data.

1. Introduction

We present preliminary results from a correlation analysis on the 13 BL Lac objects and 21 quasars monitored by the Boston University blazar team and collaborators since August 2008. Here, we focus on correlations between γ -ray and optical light curves. The γ -ray light curves at 0.1–200 GeV are constructed from data provided by the Fermi Large Area Telescope (LAT). Optical light curves are represented by data in R-band, which has the best time coverage in observations combined from different telescopes (Table 1 presents the legend for the observatories.) Most correlation studies of blazars have focused on singular events of contemporaneous multi-wavelength outbursts. With a 7-year accumulation of data, we examine correlations over multiple periods of high activity in a number of blazars, testing for evidence of consistency.
Prevailing models for γ -ray production (e.g., [1,2,3]) explain the origin of γ -rays by inverse Compton upscattering of infrared to ultraviolet photons by relativistic electrons that also emit synchrotron optical—ultraviolet photons. The sources of seed photons and locations of the emission zones continue to be debated (e.g., [4]). Therefore, correlation analysis—especially determination of delays between variations—between γ -ray and optical light curves is key to understanding where and how high-energy emission is produced in blazar jets. It is particularly interesting to determine whether there are consistent correlations among different blazars and for different events in an individual blazar.

2. Results

In the external-radiation inverse Compton model, we expect no optical/high-energy lag, while in the synchrotron self-Compton model, light-travel delays of the seed photons can cause the high-energy flux to lag [8]. A delay of optical variations with respect to γ -rays suggests stratification of the emission region with respect to energy. For this analysis, we limit our lag times to ±50 days, since for longer delays aliasing is problematic.
For each blazar, we classify the results as follows: (1) The object displays a statistically significant, single correlation when tested over the entire 7-year period (“Overall Correlation”, OC); (2) The majority of individual epochs of high activity display a similar correlation (“Consistent Individual Correlations”, CIC).
Table 2 displays the preliminary results of our analysis. We quote the time lag as determined by the z-transformed discrete correlation function (ZDCF) maximum likelihood method [9] if the bootstrap analysis also gives a significance exceeding a 2-σ probability. Five sources (0528+134, 1127-145, 1406-076, 1611+343, and 3C446) did not have sufficient coverage of data to determine correlations. From each classification, we display one object’s light curves and correlation results in Figure 1, Figure 2, Figure 3 and Figure 4.
Although the ZDCF algorithm has been shown to effectively determine correlations of unevenly sampled data, both the binning of the Fermi data and the gaps in optical observations affect the resolution of lag times. Most of our Fermi data during periods of high activity have been binned over 1–3 days, low activity over 7 days. The uncertainty of a time lag is derived as the FWHM of the ZDCF peak and cannot be less than the binning interval.

3. Method

We perform the correlation analysis using the ZDCF and Maximum Likelihood PLIKE algorithm [10]. We verify the significance of the correlation by comparing with the statistics of correlations of 3000 pairs of bootstrapped artificial light curves (ALC).
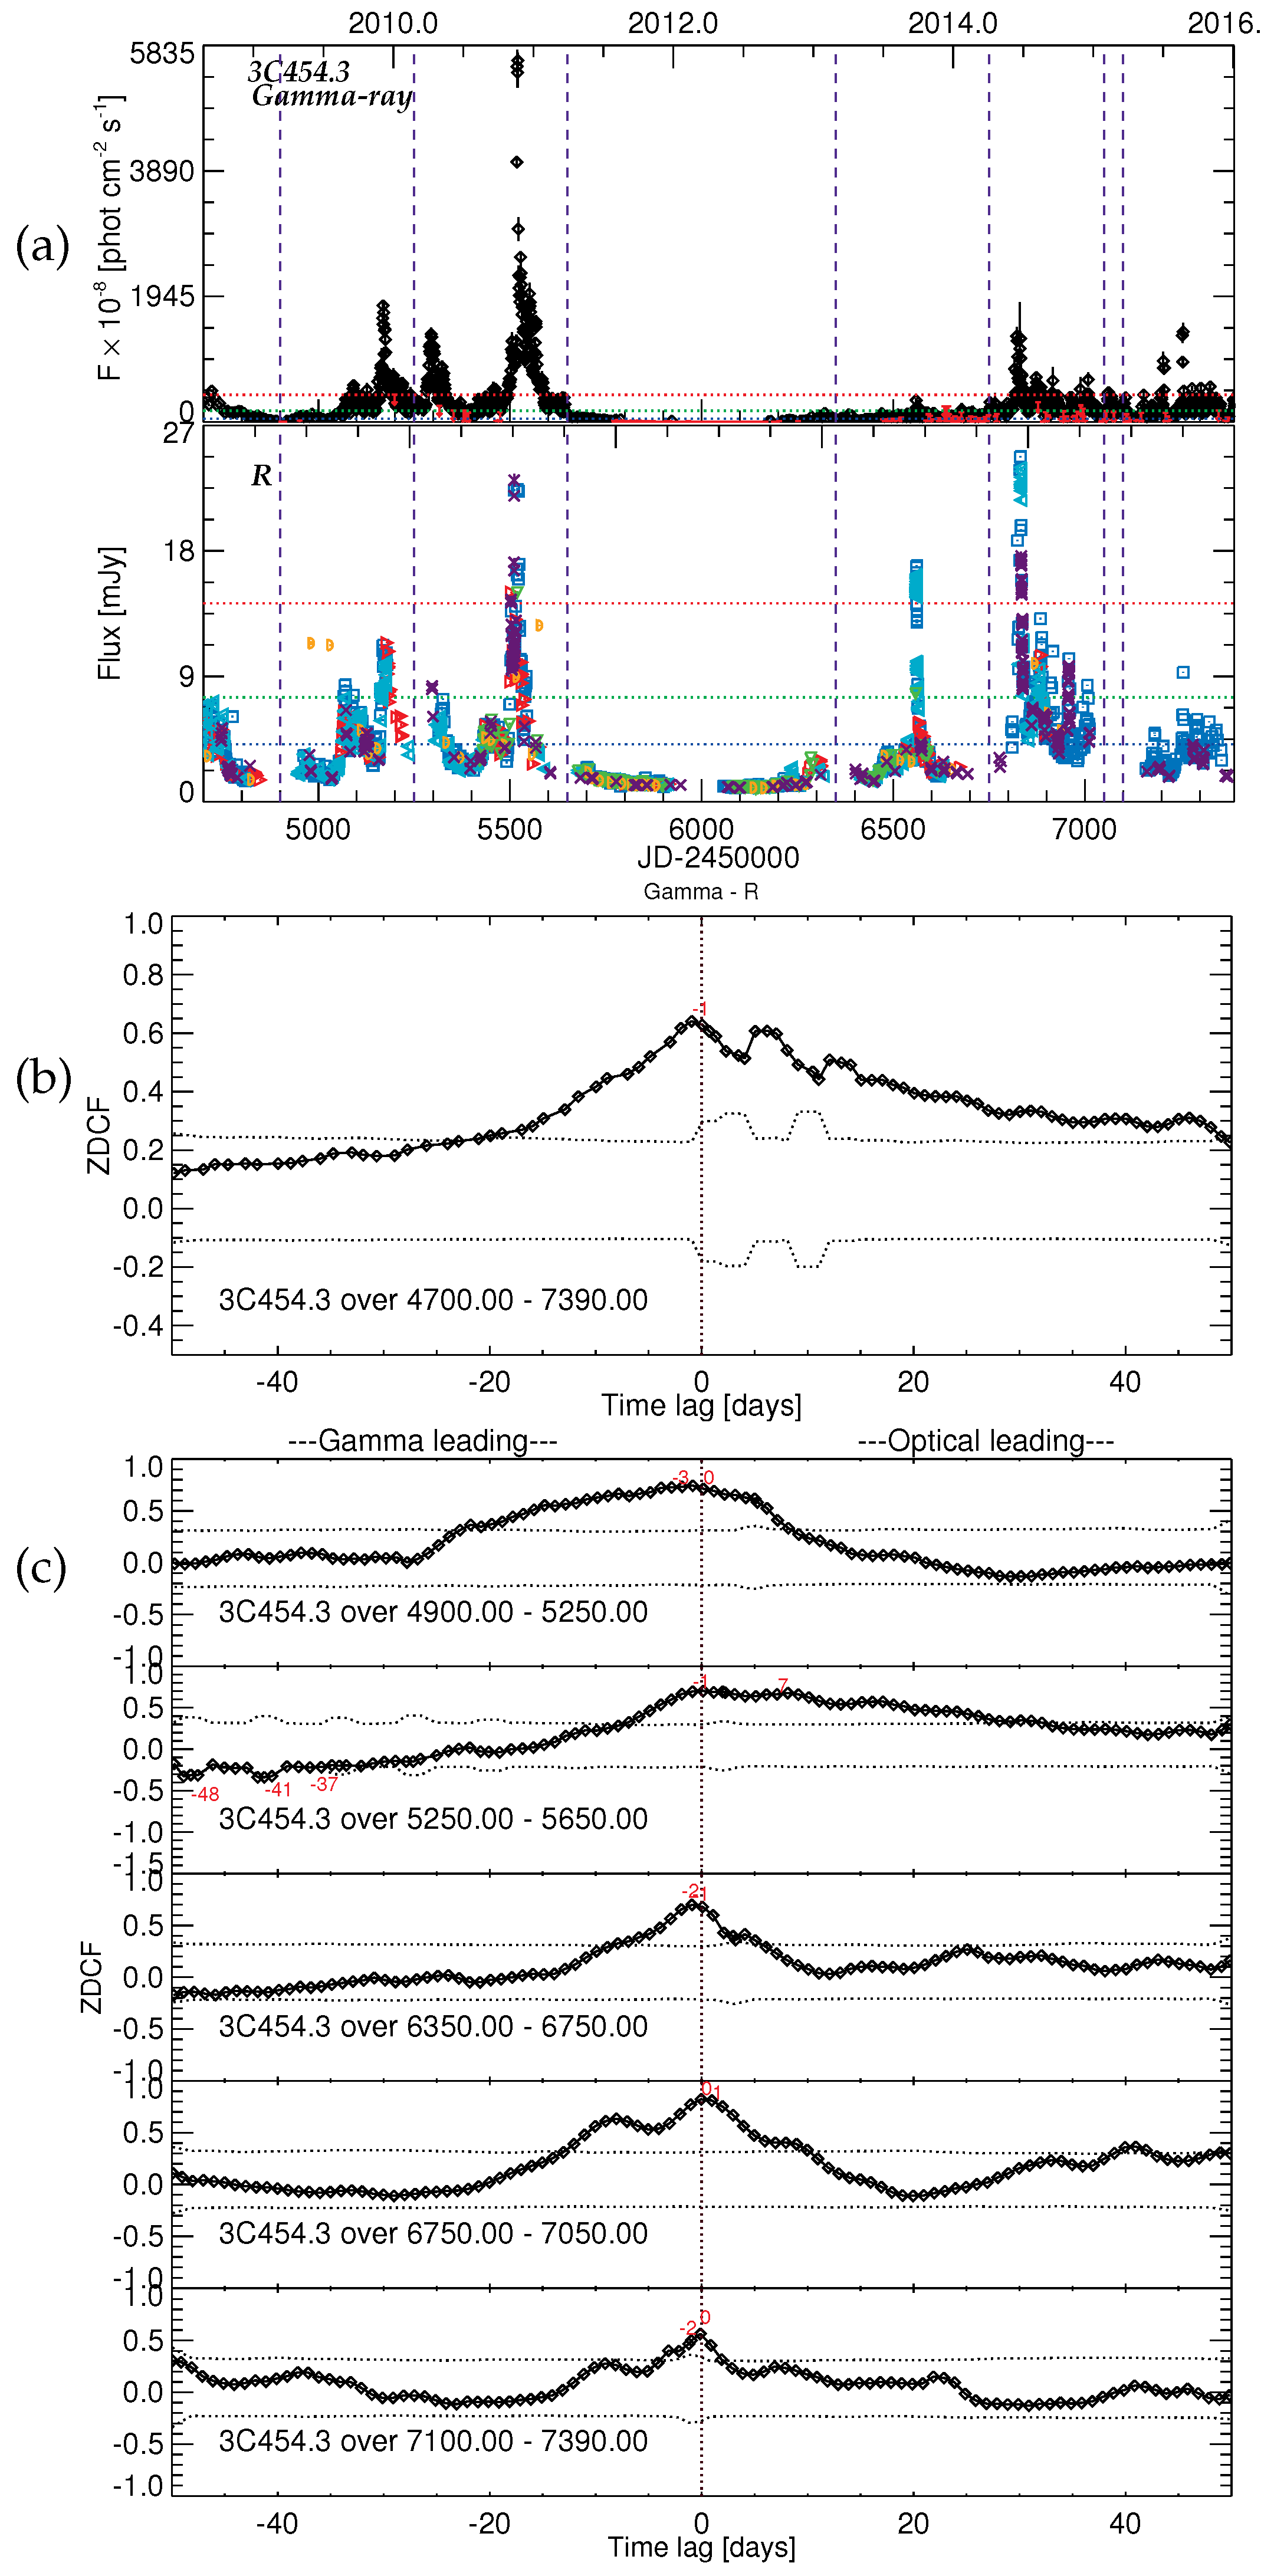
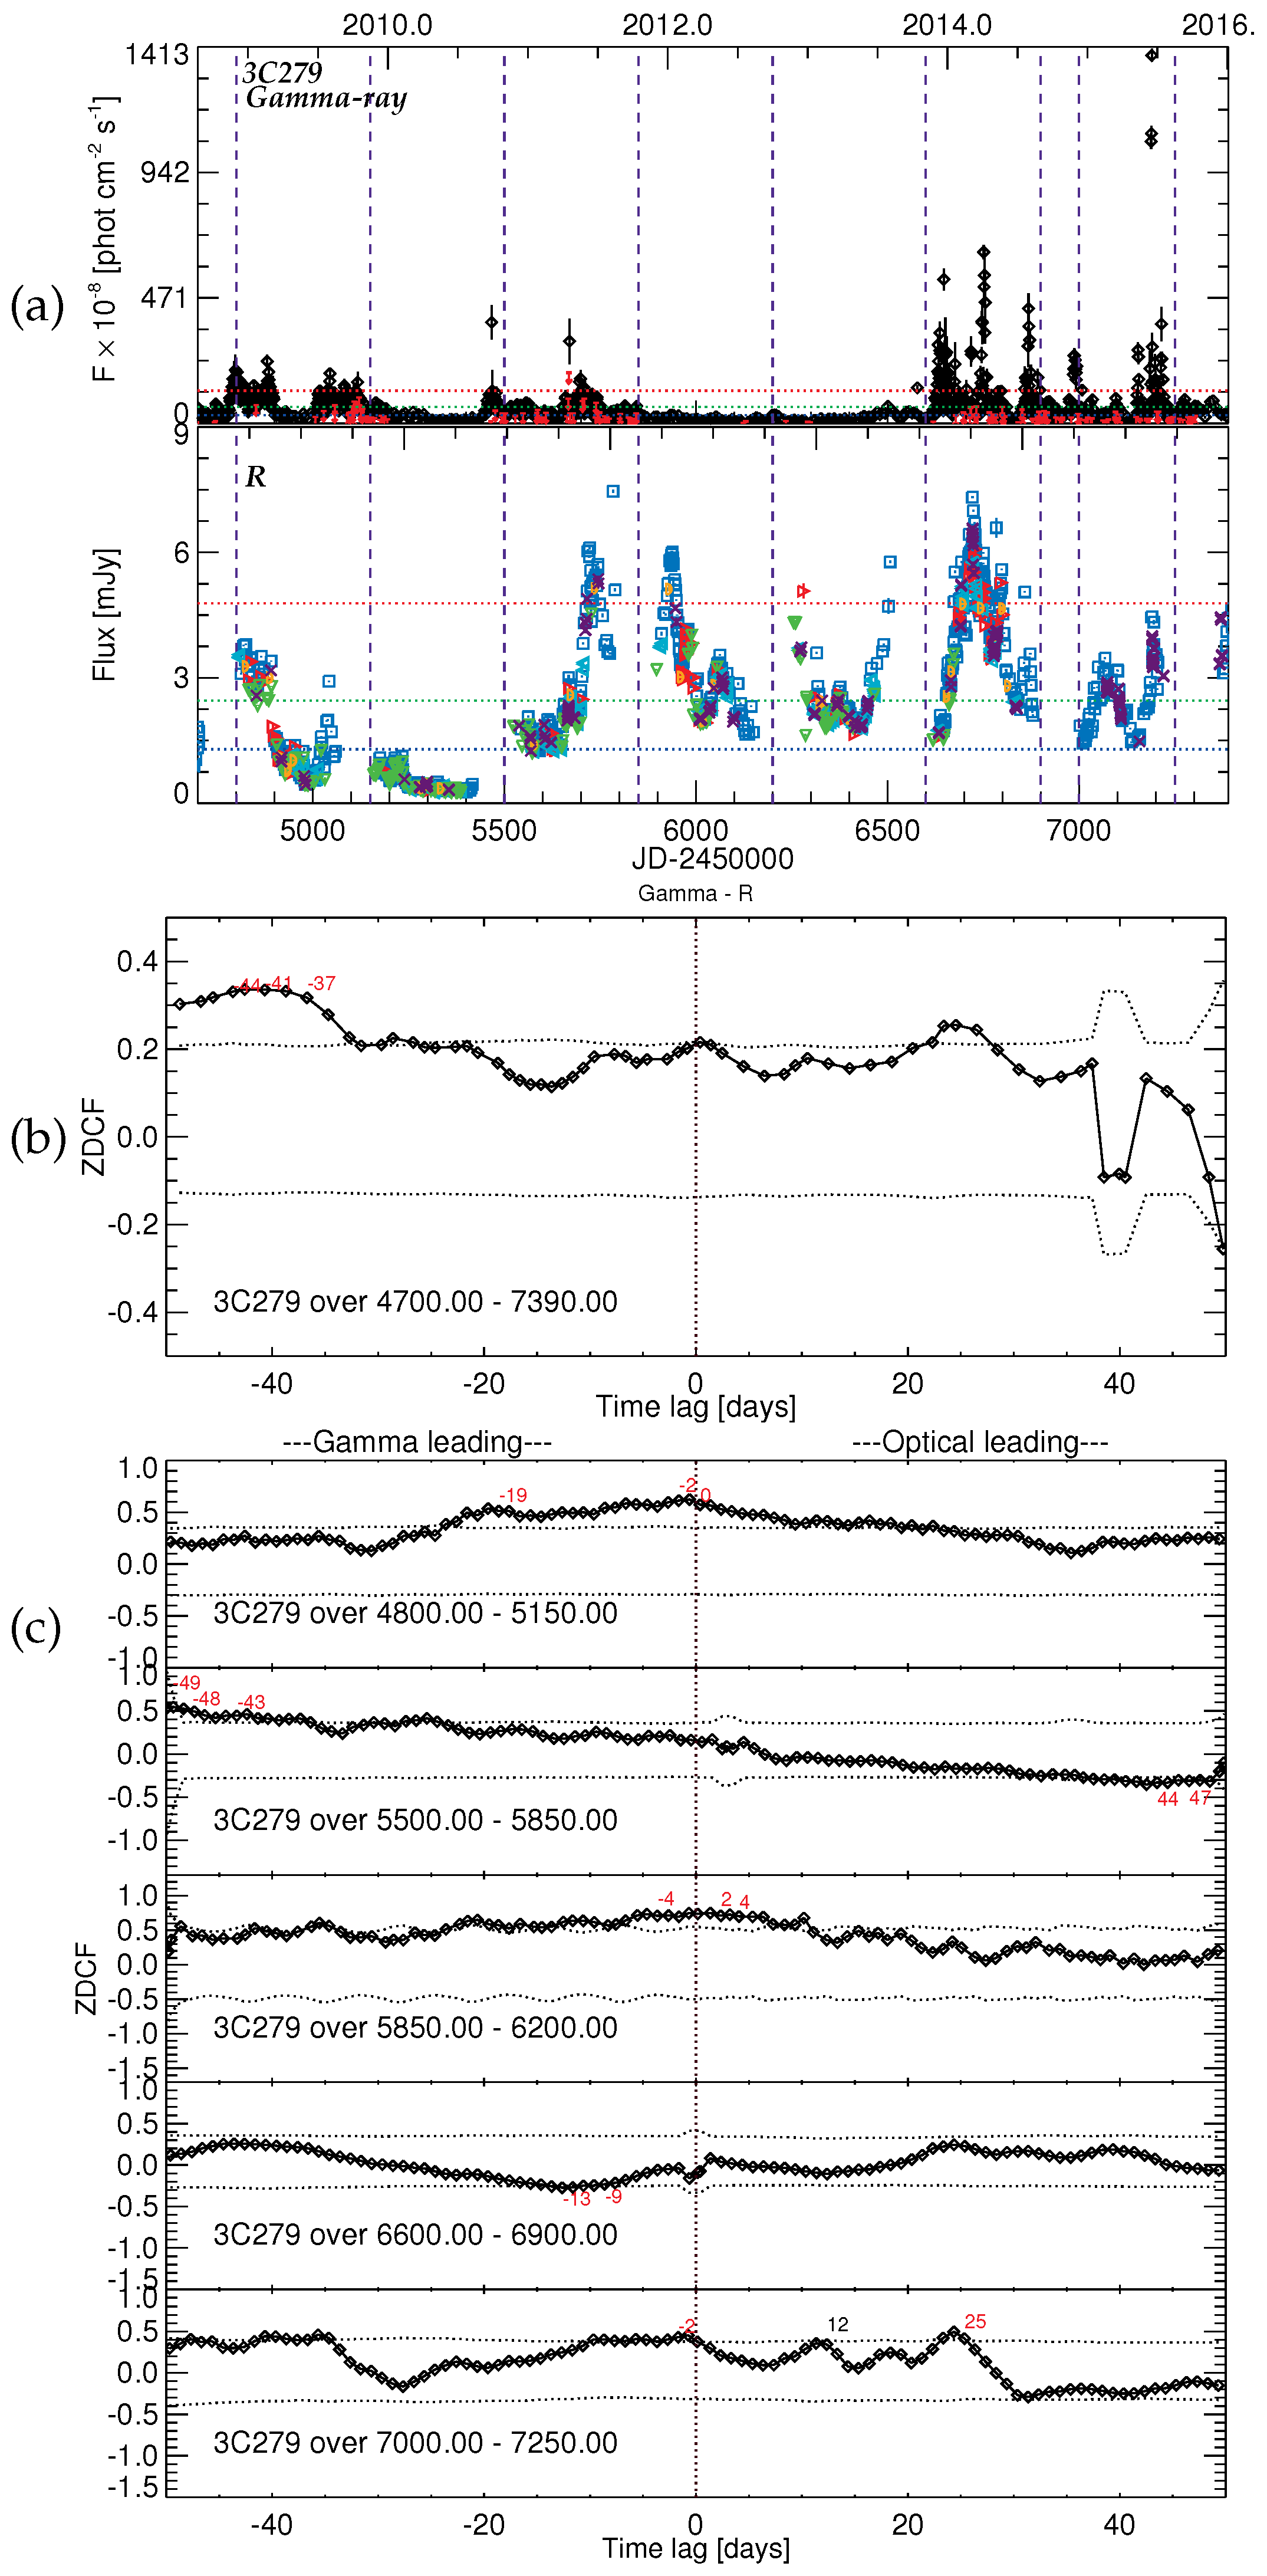
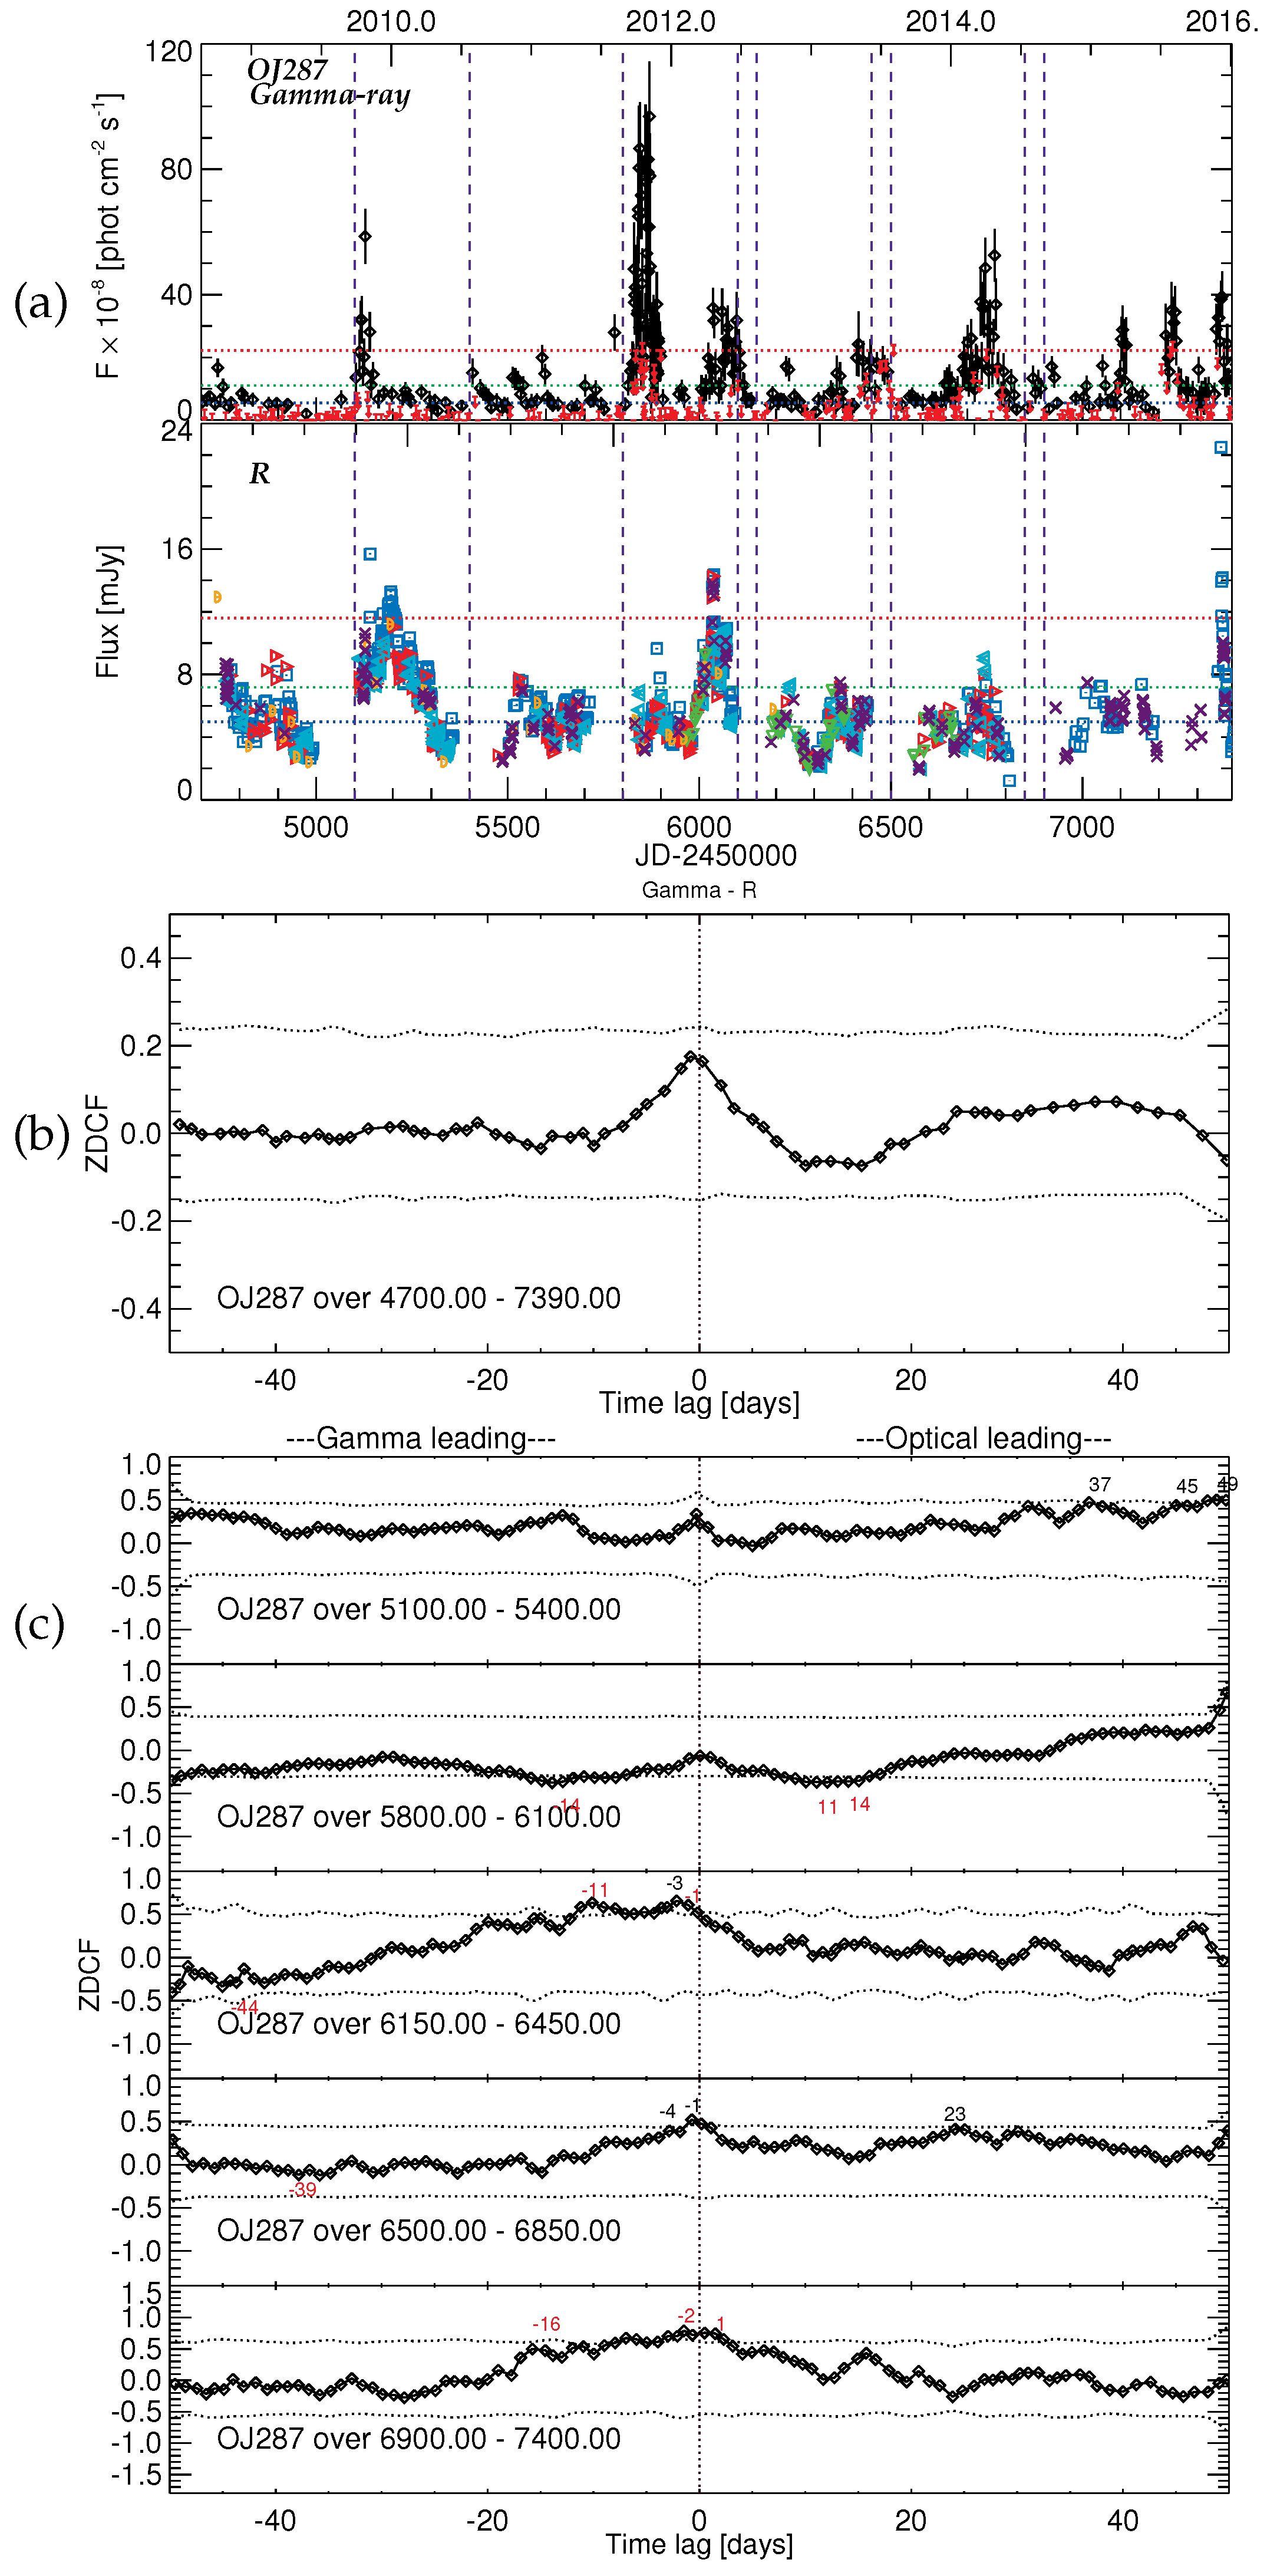
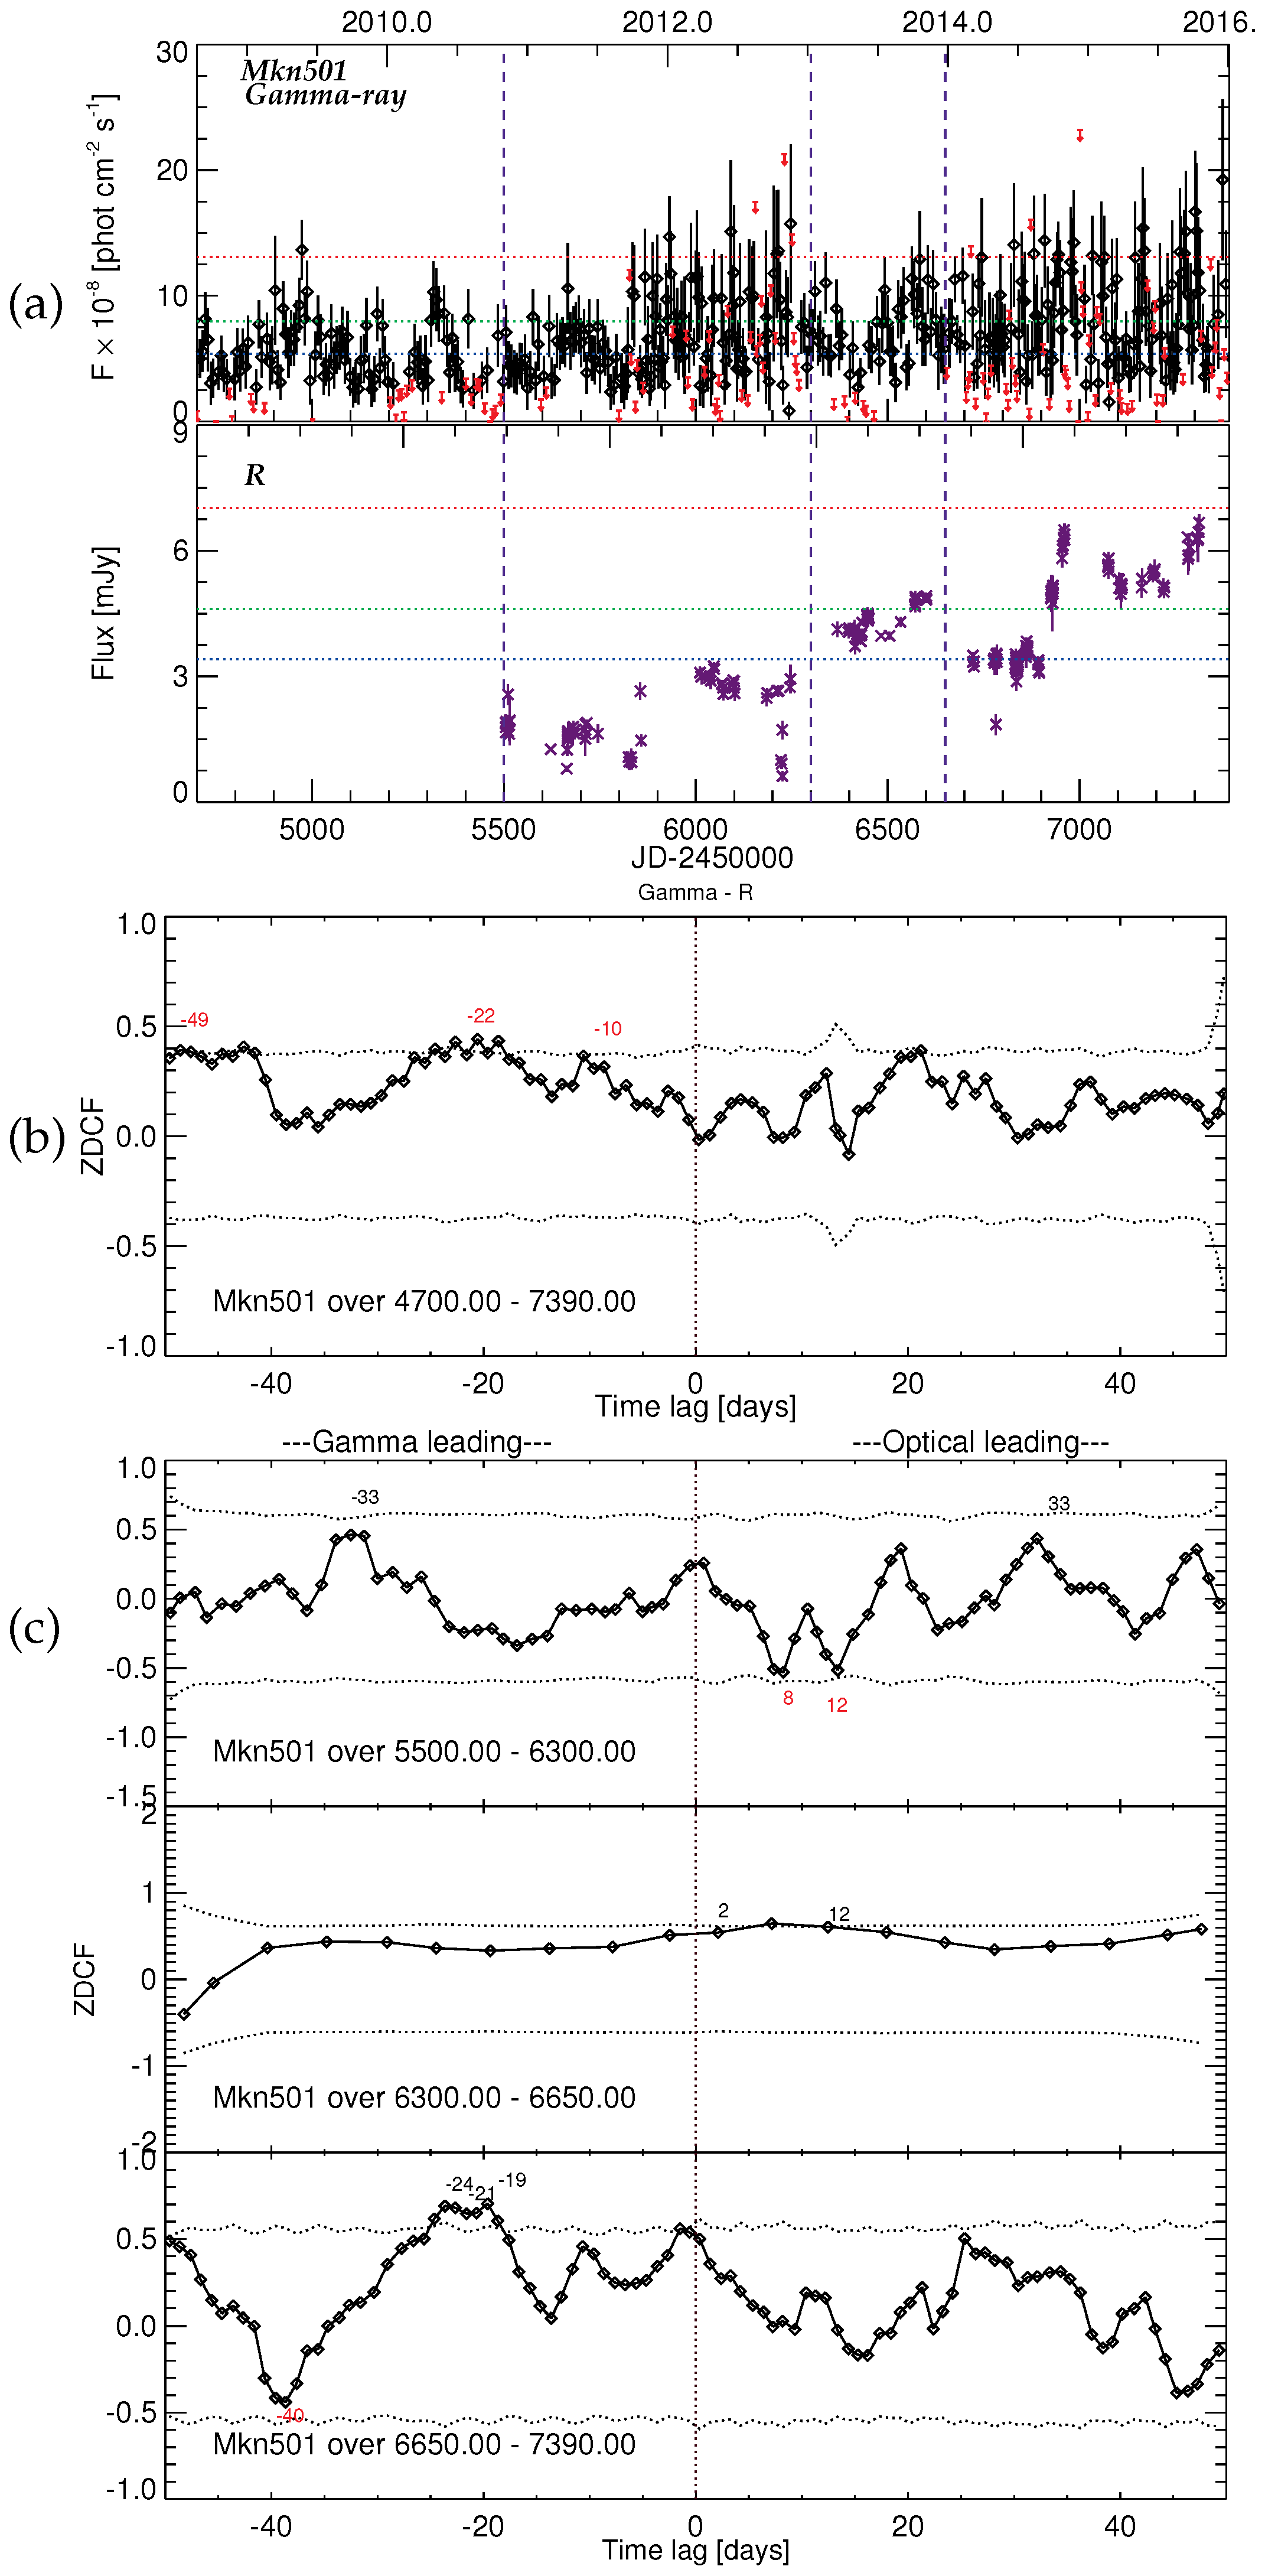
  • Each object’s active periods are identified based on the light curve behavior (details can be found in [11]).
  • Most γ -ray active periods with fluxes exceeding F ν + 3 σ w ν are re-reduced, allowing the photon index to vary and binning on a shorter time interval. Optical data are binned into 1-day periods.
  • For each source, the ZDCF is calculated for the entire time span of observations and for each active period.
  • Each ALC is built by randomly selecting and randomly placing active periods, preserving the observational dates by either using the closest observed point, if within 7 days, or interpolating the data.
  • After the active periods have been placed in the ALC, the remaining observational fluxes are randomly selected and randomly placed on the remaining observational dates.
  • The ALCs are randomly paired and sent through the ZDCF for analysis.
  • Results of the ZDCF analysis of ALCs are used to derive 1-, 2-, and 3-σ probabilities to obtain a given coefficient of correlation by chance.

4. Summary

Our preliminary results reveal a statistically significant correlation for 7-year light curves in seven BL Lacs and 10 FSRQs. Generally, the 17 sources exhibiting a consistent OC correspond to either γ -ray leading optical outbursts or zero time lag within the uncertainty. The six sources consistent in both OC and CIC display lag times of 0 ± 7 days, while the 11 sources consistent in OC but not CIC generally have longer lag times.
In many cases, the classification is somewhat uncertain. For example, 1510-089 exhibits statistically significant correlations at two lag times (−12 days and 1 day), although one also could classify it as a single, broad correlation. However, the individual-period plots display patterns that support each peak. OJ287 displays an apparent correlation of −1 day, but it is not statistically significant according to our bootstrap analysis. Many objects (e.g., Mrk421) have prolonged periods of high γ -ray activity, causing broad correlations over a range of lag times. No significant difference in behavior is seen between the BL Lacs and the quasars.

Acknowledgments

This study was supported by NASA Fermi Guest Investigator grant NNX14AQ58G and NASA Swift Guest Investigator grant NNX15AR34G. The research at St. Petersburg State University was partly funded by RFBR grants 16-32-00036, 15-02-00949 and SPbSU grant 6.38.335.2015. The research at the IAA-CSIC is supported by the Spanish Ministry of Economy and Competitiveness (MINECO) grant AYA2013-40825-P. I.A. acknowledges support by a Ramón y Cajal grant of MINECO. The Swift effort at PSU is supported by NASA contract NAS5-00136. The PRISM camera at Lowell Observatory was developed by K. Janes et al. at BU and Lowell Observatory, with funding from the NSF, BU, and Lowell Observatory. The Liverpool Telescope is operated on the island of La Palma by Liverpool John Moores University in the Spanish Observatorio del Roque de los Muchachos of the Instituto de Astrofisica de Canarias, with funding from the UK Science and Technology Facilities Council. The Calar Alto Observatory is jointly operated by the Max-Planck-Institut für Astronomie and the Instituto de Astrofísica de Andalucía-CSIC. This study is partly based on data taken and assembled by the WEBT collaboration and stored in the WEBT archive at the Osservatorio Astronomico di Torino—INAF (http://www.oato.inaf.it/blazars/webt/).

Author Contributions

Karen E. Williamson performed the correlation analysis and high-energy data reduction. Svetlana G, Jorstad performed the optical observations and reduction. She and Alan P. Marscher lead the international blazar monitoring team and contributed their vast knowledge of blazar behavior in both the conceptional framework of the analysis and in the interpretation of the results. The remaining authors contributed optical observations and reductions.

Conflicts of Interest

The authors declare no conflict of interest.

Abbreviations

The following abbreviations are used in this manuscript:
MDPIMultidisciplinary Digital Publishing Institute
DOAJDirectory of open access journals
ZDCFz-transformed discrete correlation function
ALCartificial light curves
OCOverall Correlation
CICConsistent Individual Correlation

References

  1. Sikora, M.; Stawarz, Ł.; Moderski, R.; Nalewajko, K.; Madejski, G.M. Constraining Emission Models of Luminous Blazar Sources. Astrophys. J. 2009, 704, 38–50. [Google Scholar] [CrossRef]
  2. Ghisellini, G.; Tavecchio, F. Canonical high-power blazars. Mon. Not. R. Astron. Soc. 2009, 397, 985–1002. [Google Scholar] [CrossRef]
  3. Dermer, C.D.; Finke, J.D.; Krug, H.; Böttcher, M. Gamma-Ray Studies of Blazars: Synchro-Compton Analysis of Flat Spectrum Radio Quasars. Astrophys. J. 2009, 692, 32–46. [Google Scholar] [CrossRef]
  4. Nalewajko, K.; Begelman, M.C.; Sikora, M. Constraining the Location of Gamma-Ray Flares in Luminous Blazars. Astrophys. J. 2014, 789, 161. [Google Scholar] [CrossRef]
  5. Jorstad, S.G.; Marscher, A.P.; Larionov, V.M.; Agudo, I.; Smith, P.S.; Gurwell, M.; Lähteenmäki, A.; Tornikoski, M.; Markowitz, A.; Arkharov, A.A.; et al. Flaring Behavior of the Quasar 3C 454.3 Across the Electromagnetic Spectrum. Astrophys. J. 2010, 715, 362–384. [Google Scholar] [CrossRef]
  6. Larionov, V.M.; Jorstad, S.G.; Marscher, A.P.; Raiteri, C.M.; Villata, M.; Agudo, I.; Aller, M.F.; Arkharov, A.A.; Asfandiyarov, I.M.; Bach, U.; et al. Results of WEBT, VLBA and RXTE monitoring of 3C 279 during 2006–2007. Astron. Astrophys. 2008, 492, 389–400. [Google Scholar] [CrossRef]
  7. Agudo, I.; Molina, S.N.; Gómez, J.L.; Marscher, A.P.; Jorstad, S.G.; Heidt, J. Mapcat: Monitoring AGN with Polarimetry at the Calar Alto Telescopes. Int. J. Mod. Phys. Conf. Ser. 2012, 8, 299. [Google Scholar] [CrossRef]
  8. Sokolov, A.; Marscher, A.P.; McHardy, I.M. Synchrotron Self-Compton Model for Rapid Nonthermal Flares in Blazars with Frequency-dependent Time Lags. Astrophys. J. 2004, 613, 725–746. [Google Scholar] [CrossRef]
  9. Alexander, T. Is AGN Variability Correlated with Other AGN Properties? ZDCF Analysis of Small Samples of Sparse Light Curves. In Astronomical Time Series; Maoz, D., Sternberg, A., Leibowitz, E.M., Eds.; Springer: Dordrecht, The Netherlands, 1997; Volume 218, p. 163. [Google Scholar]
  10. Alexander, T. Improved AGN light curve analysis with the z-transformed discrete correlation function. 2013; arXiv:1302.1508. [Google Scholar]
  11. Williamson, K.E.; Jorstad, S.G.; Marscher, A.P.; Larionov, V.M.; Smith, P.S.; Agudo, I.; Arkharov, A.A.; Blinov, D.A.; Casadio, C.; Efimova, N.V.; et al. Comprehensive Monitoring of Gamma-Ray Bright Blazars. I. Statistical Study of Optical, X-Ray, and Gamma-Ray Spectral Slopes. Astrophys. J. 2014, 789, 135. [Google Scholar] [CrossRef]
Figure 1. Sample light curves and correlation plots of 3C454.3. Panels (a) contain the light curves of the data across energy bands. The sources of the data are indicated by symbols and colors identified in Table 1. Vertical dashed lines indicate the epochs selected for analysis. Panels (b) contain the results of the correlation analysis over the entire period of available data and Panels (c) display a series of correlation results analyzed over shorter periods (as indicated in Panels (a)). The highest significantly correlated time lags from the bootstrap analysis are labeled in red if greater than 3σ, black if exceeding 2σ. Dotted lines are ± 2 σ .
Galaxies 04 00064 g001
Figure 2. Sample light curves and correlation plots of 3C279. See Figure 1 for details.
Galaxies 04 00064 g002
Figure 3. Sample light curves and correlation plots of OJ287. See Figure 1 for details.
Galaxies 04 00064 g003
Figure 4. Sample light curves and correlation plots of Mkn501. See Figure 1 for details.
Galaxies 04 00064 g004
Table 1. List of Observatories Providing Measurements for this Study.
Symbol Telescope
ShapeColorObservatory (Telescope or Monitoring Program) and LocationDiameterWavebands
Space-based
blackFermi Gamma Ray Space Telescope (LAT) γ -ray (0.1 GeV–200 GeV)
Ground-based
×indigoLowell Observatory (Perkins Telescope), Flagstaff, Arizona a 1.83 mB, V, R, I
light blueCrimean Astrophysical Observatory (AZT-8) b 0.70 mB, V, R, I
greenObservatorio del Roque de los Muchachos2.00 mR
(Liverpool Telescope), La Palma, Spain a
Galaxies 04 00064 i001orangeCalar Alto Observatory (MAPCAT), Andalucía, Spain c 2.20 mR
blueCerro Tololo Inter-American Observatory (SMARTS),0.90–1.50 mB, V, R, J, K
Cerro Tololo, Chile d
redSt. Petersburg University (LX-200), St. Petersburg, Russia b 0.40 mB, V, R, I
a: Data reduction is performed with the ESO software package MIDAS (European Southern Observatory, Garching bei M ünchen, Germany); refer to [5]; b: Data reduction details provided in [6]; c: Monitoring AGN with Polarimetry at the Calar Alto Telescopes (MAPCAT); data reduction details provided in [7]; d: The Small and Moderate Aperture Research Telescope System (SMARTS) daily monitoring program; refer to http://www.astro.yale.edu/smarts/.
Table 2. Correlation Classification. Time lags in days are in parentheses; a negative value denotes γ -ray leading optical variations.
Consistent Individual Correlations:Consistent Individual Correlations:
−−Yes −−−−No −−
BL LacFSRQBL LacFSRQ
Overall Correlation: Yes0716+714 (-1)1633+382 (0)0235+164 (-6)0336-019 (-10)
BL Lac (-1)1730-130 (2)0954+658 (-1)0420-014 (-12)
CTA102 (0)1219+285 (-11)0827+243 (-22)
3C454.3 (0)1749+096 (0)1222+216 (-23)
Mkn421 (-13)1622-297 (+1)
3C279 (-43)
Overall Correlation: NoOJ287 (-1) 0735+1780836+710
0829+0461156+295
1055+0181308+326
Mkn5011510-089
3C66A3C273
3C345

