
Through the Looking Glass: Faraday Conversion in Turbulent Blazar Jets

Institute for Astrophysical Research, Boston University, 725 Commonwealth Avenue, Boston, MA 02215, USA
Galaxies 2016, 4(4), 50; https://doi.org/10.3390/galaxies4040050
Submission received: 15 July 2016
/
Revised: 30 September 2016
/
Accepted: 15 October 2016
/
Published: 25 October 2016
(This article belongs to the Special Issue Blazars through Sharp Multi-wavelength Eyes)
Abstract
:Faint levels of circular polarization (Stokes V) have been detected in several relativistic jets. While typically less than a few percent, circular polarization can give us critical insight into the underlying nature of the jet plasma. Circular polarization can be produced through a process known as linear birefringence, in which initially linearly polarized emission produced in one region of the jet is altered by Faraday rotation as it propagates through other regions of the jet with distinct magnetic field orientations. Recently, Marscher has developed the Turbulent Extreme Multi-Zone (TEMZ) model for blazar emission, in which turbulent plasma crossing a standing shock in the jet is represented by a collection of thousands of individual plasma cells, each with distinct magnetic field orientation. In order to test whether the TEMZ model can reproduce circularly polarized radiation at levels comparable to those observed in blazars, I have developed a numerical algorithm to solve the full Stokes equations of polarized radiative transfer. I have embedded this algorithm into the ray-tracing code RADMC3D (http://ascl.net/1202.015). RADMC3D was originally developed to model continuum radiative transfer in dusty media. This code, however, has been written in a modularized fashion that allows the user to specify the physics that is incorporated into the radiative transfer. I have replaced RADMC3D’s thermal emission and absorption coefficients with non-thermal coefficients pertaining to polarized synchrotron emission. This code is applied to ray-tracing through the 3-D TEMZ computational grid. Here I present a suite of synthetic polarized emission maps that highlight the effect that thousands of distinct cells of plasma within a jet can have on the observed linear and circular polarization.
1. Introduction
What is the composition of a relativistic extragalactic jet? This longstanding question in extragalactic astrophysics has remained unanswered because the emission from extragalactic jets is predominantly non-thermal in nature, taking the form of a featureless synchrotron power-law spectrum devoid of spectral lines. The absence of spectral features in the jet emission makes characterization of the jet plasma highly challenging. The synchrotron emission from jets, however, is highly polarized, giving us insight into the underlying magnetic field structure that is thought to collimate and launch these ultra-high-powered outflows. Faint levels of circularly polarized emission (Stokes V) have been detected in a number of relativistic jets (most notably 3C 279 [1]). This form of polarized emission—while typically <0.5 % of the total intensity (Stokes I)—gives us a critical insight into the underlying nature of the jet plasma [2]. Unlike linearly polarized emission, which can be altered by Faraday rotation in magnetized plasma external to the jet, circularly polarized emission is produced either intrinsically within the relativistic jet plasma or through Faraday conversion (again, a process intrinsic to the jet).
A measurement of the fractional circular polarization () emanating from a vector-ordered field within the jet can, in theory, probe the charge asymmetry of leptons within the jet plasma (i.e., the ratio of the number of positrons to protons within the jet plasma). Motivated by observations of variability in the polarized emission of blazars, Marscher 2014 [3] has developed the Turbulent Extreme Multi-Zone (TEMZ) model for blazar emission. The TEMZ model consists of thousands of individual cells of plasma that propagate relativistically across a standing shock in the jet (Figure 1). Each cell of plasma within the model is randomly assigned a magnetic field strength and orientation that combines a turbulent component with an underlying ordered component. The aggregate of the emission from these cells is able to reproduce (in a statistical sense) the degree of linearly polarized emission that is typically seen in blazars, as well as the variability observed in the orientation of that polarization (see [3]). The turbulent nature of the magnetic field within the TEMZ grid naturally creates a birefringent environment in which circularly polarized emission can potentially be produced through Faraday conversion. The question then follows: Can TEMZ reproduce circularly polarized emission at the percent levels seen in some blazars?
2. Polarized Radiative Transfer
In order to answer the above question, I have developed a numerical algorithm to solve the full Stokes equations of polarized radiative transfer (summarized in [4,5]). In particular, I solve the following matrix along individual rays passing through the TEMZ grid:
In the matrix above, , , , and are the frequency-dependent Stokes parameters, while , and represent frequency-dependent emission and absorption coefficients for the four Stokes parameters. The effects of Faraday rotation and conversion are governed by the and terms, respectively. Finally, the path length through each cell of plasma is given by l. This matrix has an analytic solution outlined in [4]. I apply this analytic solution along individual rays passing through the TEMZ grid (depicted by a red line in Figure 1), following the polarized radiative transfer from cell to cell. I have embedded this polarized radiative transfer scheme into the ray-tracing code RADMC3D. This code allows me to cast thousands of rays through the TEMZ grid, producing synthetic maps of the resultant polarized emission.
3. Results
3.1. Ray-Tracing through an Ordered Magnetic Field
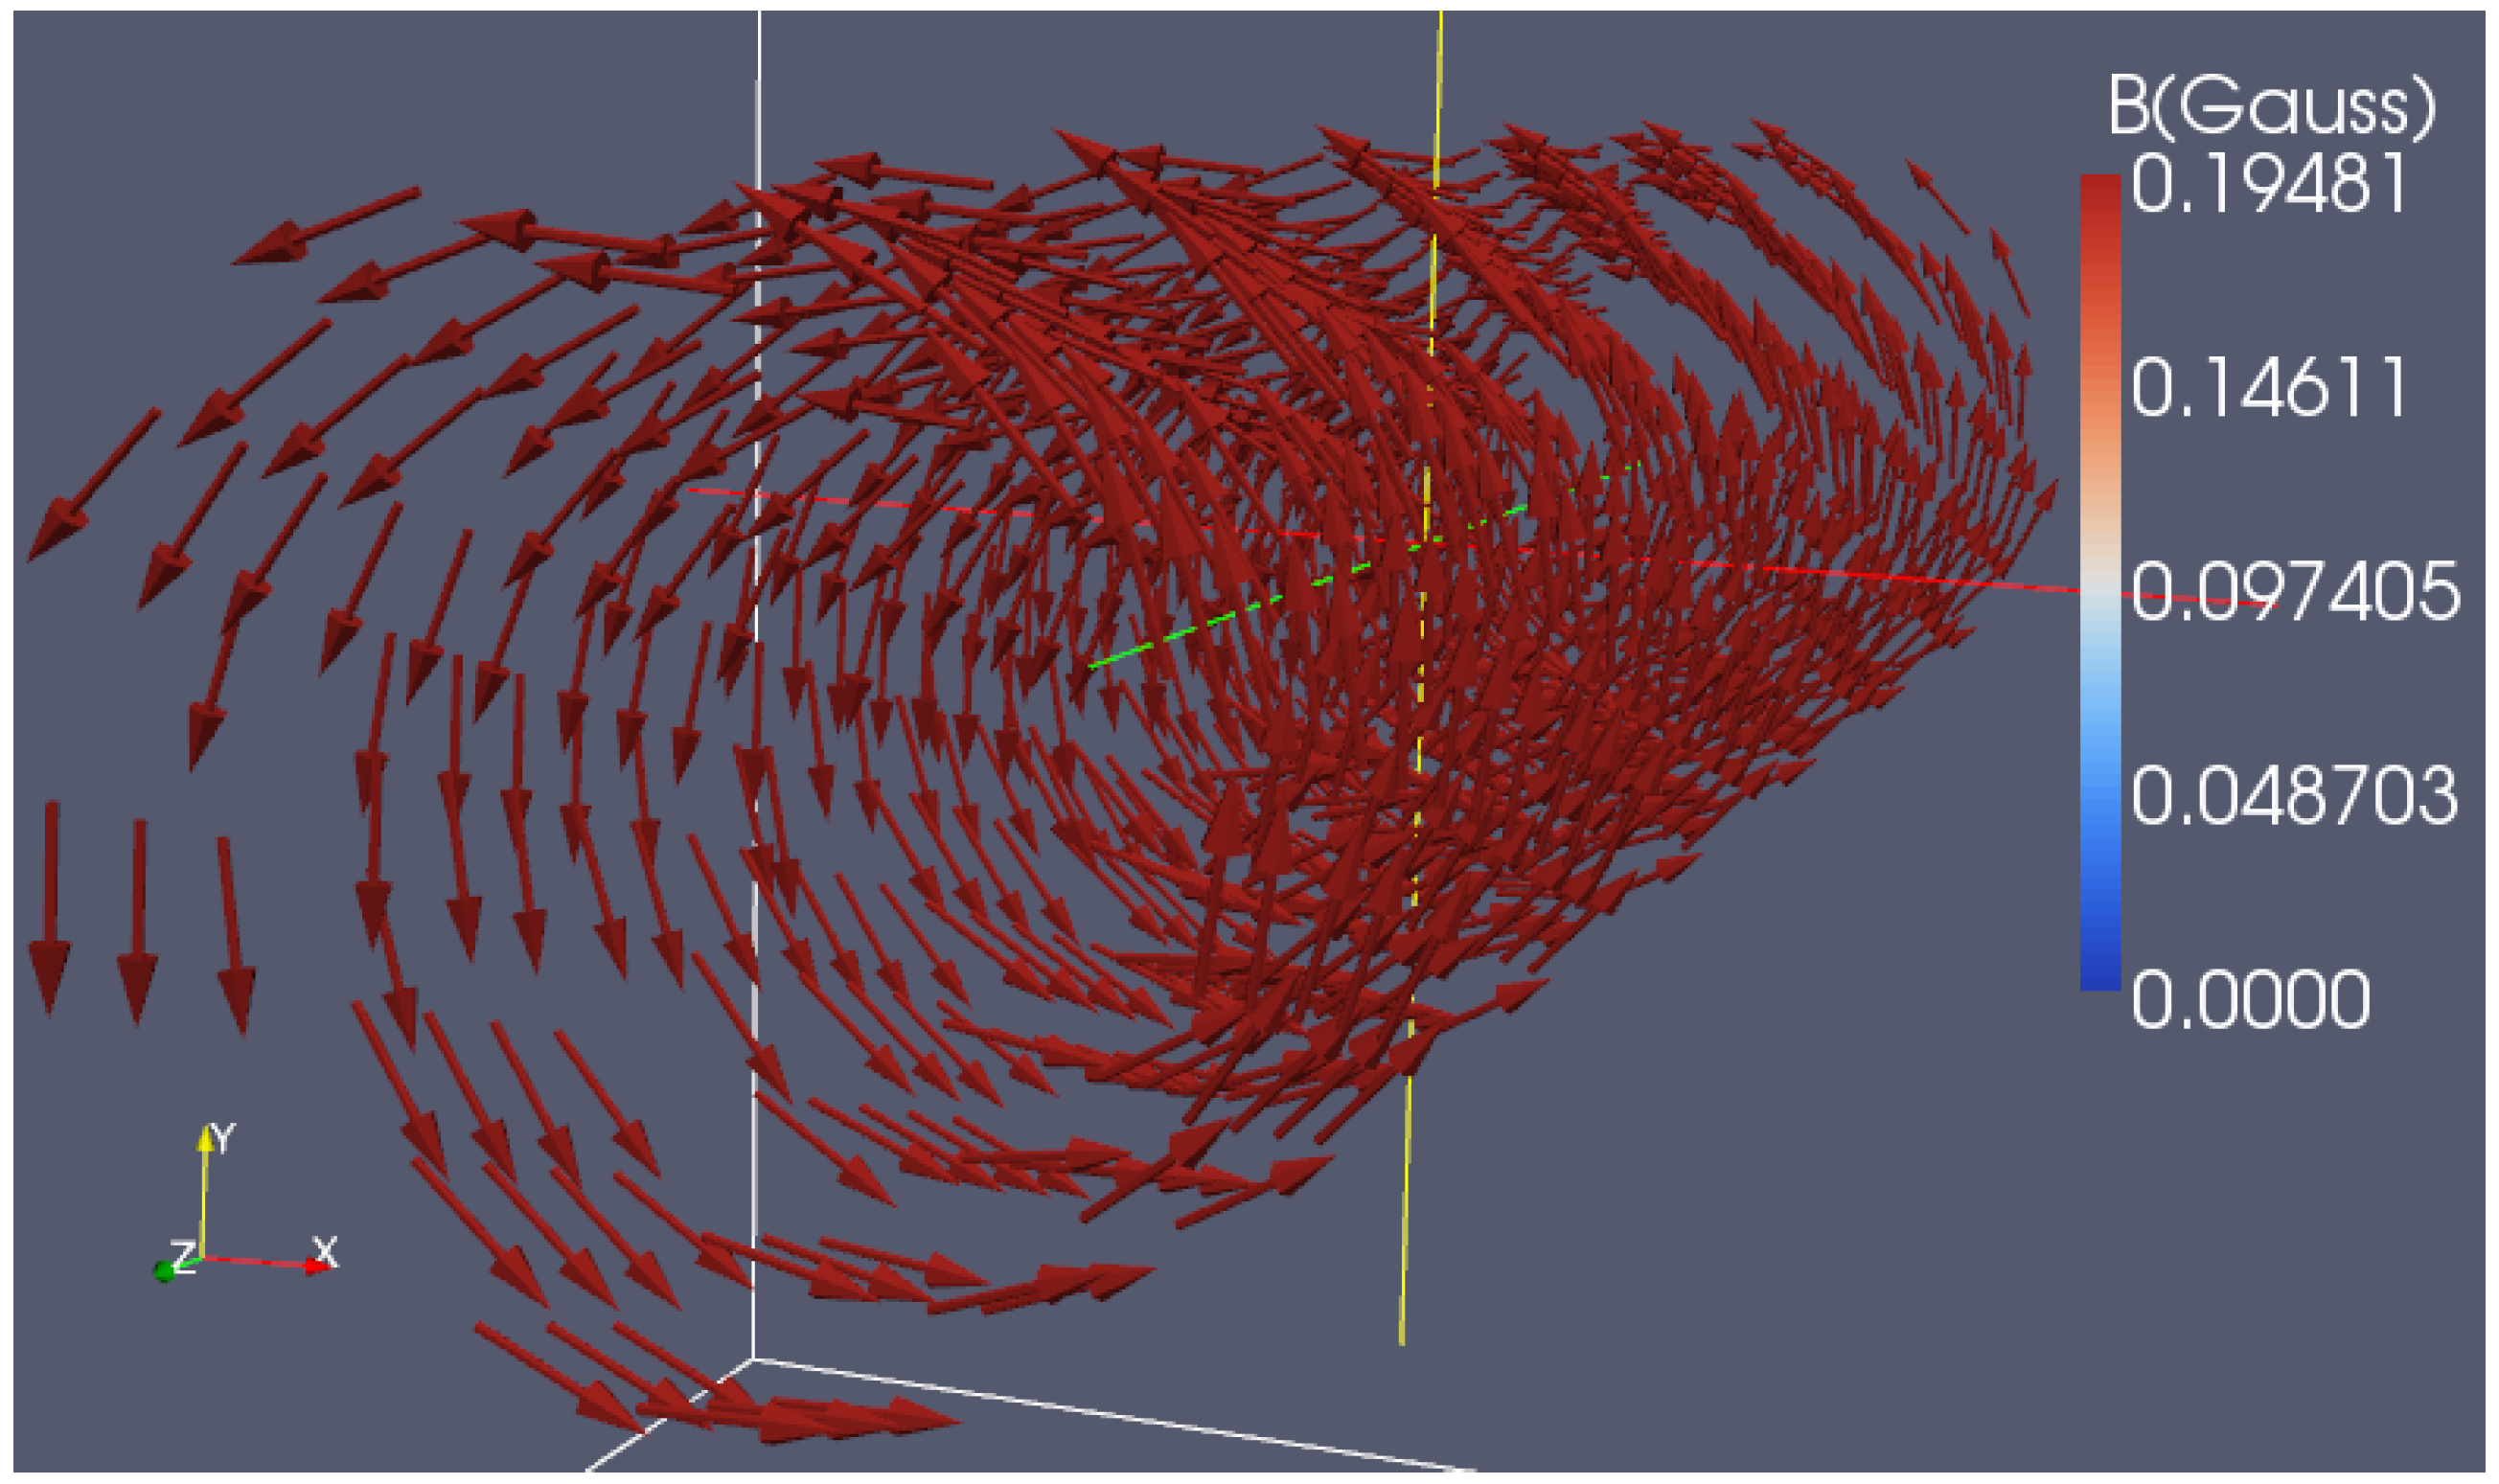
The level of turbulence within the TEMZ model is a free parameter. The user can “tune” the ratio of the ordered to the disordered magnetic field in the TEMZ computational grid. As an initial test of my polarized radiative transfer algorithm, I performed a ray-tracing calculation through the vector-ordered magnetic field shown in Figure 2. For this calculation (and the calculations below), the TEMZ grid was made up of over individual plasma cells grouped into eight concentric cylindrical shells, forming the recollimation shock depicted in Figure 1. These cells of plasma were then mapped onto a uniform cartesian grid through which the ray-tracing calculation was performed. This grid was input into the RADMC3D code, which cast individual rays forming pixel maps of the resultant polarized emission. RADMC3D uses a first-order cell-based scheme in which the path length (l) through each cell is determined, and all plasma quantities are zone-centered. The image maps from this first ray-trace are shown in Figure 3. The angle of inclination of the jet to our line-of-sight was set to , and the jet was given a bulk Lorentz factor of . Each plasma cell was assigned a characteristic length scale of pc. An underlying electron power-law energy distribution, , was assumed to hold over an energy range to . A constant spectral index of was applied throughout the grid.
The value of is computed on a cell-by-cell basis in the TEMZ model, and is subject to the effects of shock acceleration and radiative cooling. The upper limit of the electron power-law distribution was set to . Figure 3 shows maps of the fractional circular polarization () emanating from the ordered TEMZ grid. In contrast to observations, both positive and negative circularly polarized emission is present simultaneously in these synthetic maps. The levels of circular polarization in the above maps reach ∼3%. The highest levels of circular polarization observed to emanate from a blazar are ∼2%–4% in 3C 84 [6]. These preliminary results are encouraging, but the magnetic field structure used here is highly idealized and is unlikely to be realized in the astrophysical context of a blazar jet. These are also localized levels of circular polarization and cannot be directly compared to observations. Below, I explore (§3.2) the effect that convolving these synthetic maps with a Gaussian beam (indicative of the resolution attainable with an interferometric array) has on both the sign and the levels of the observed emission (see Figures 5 and 6).
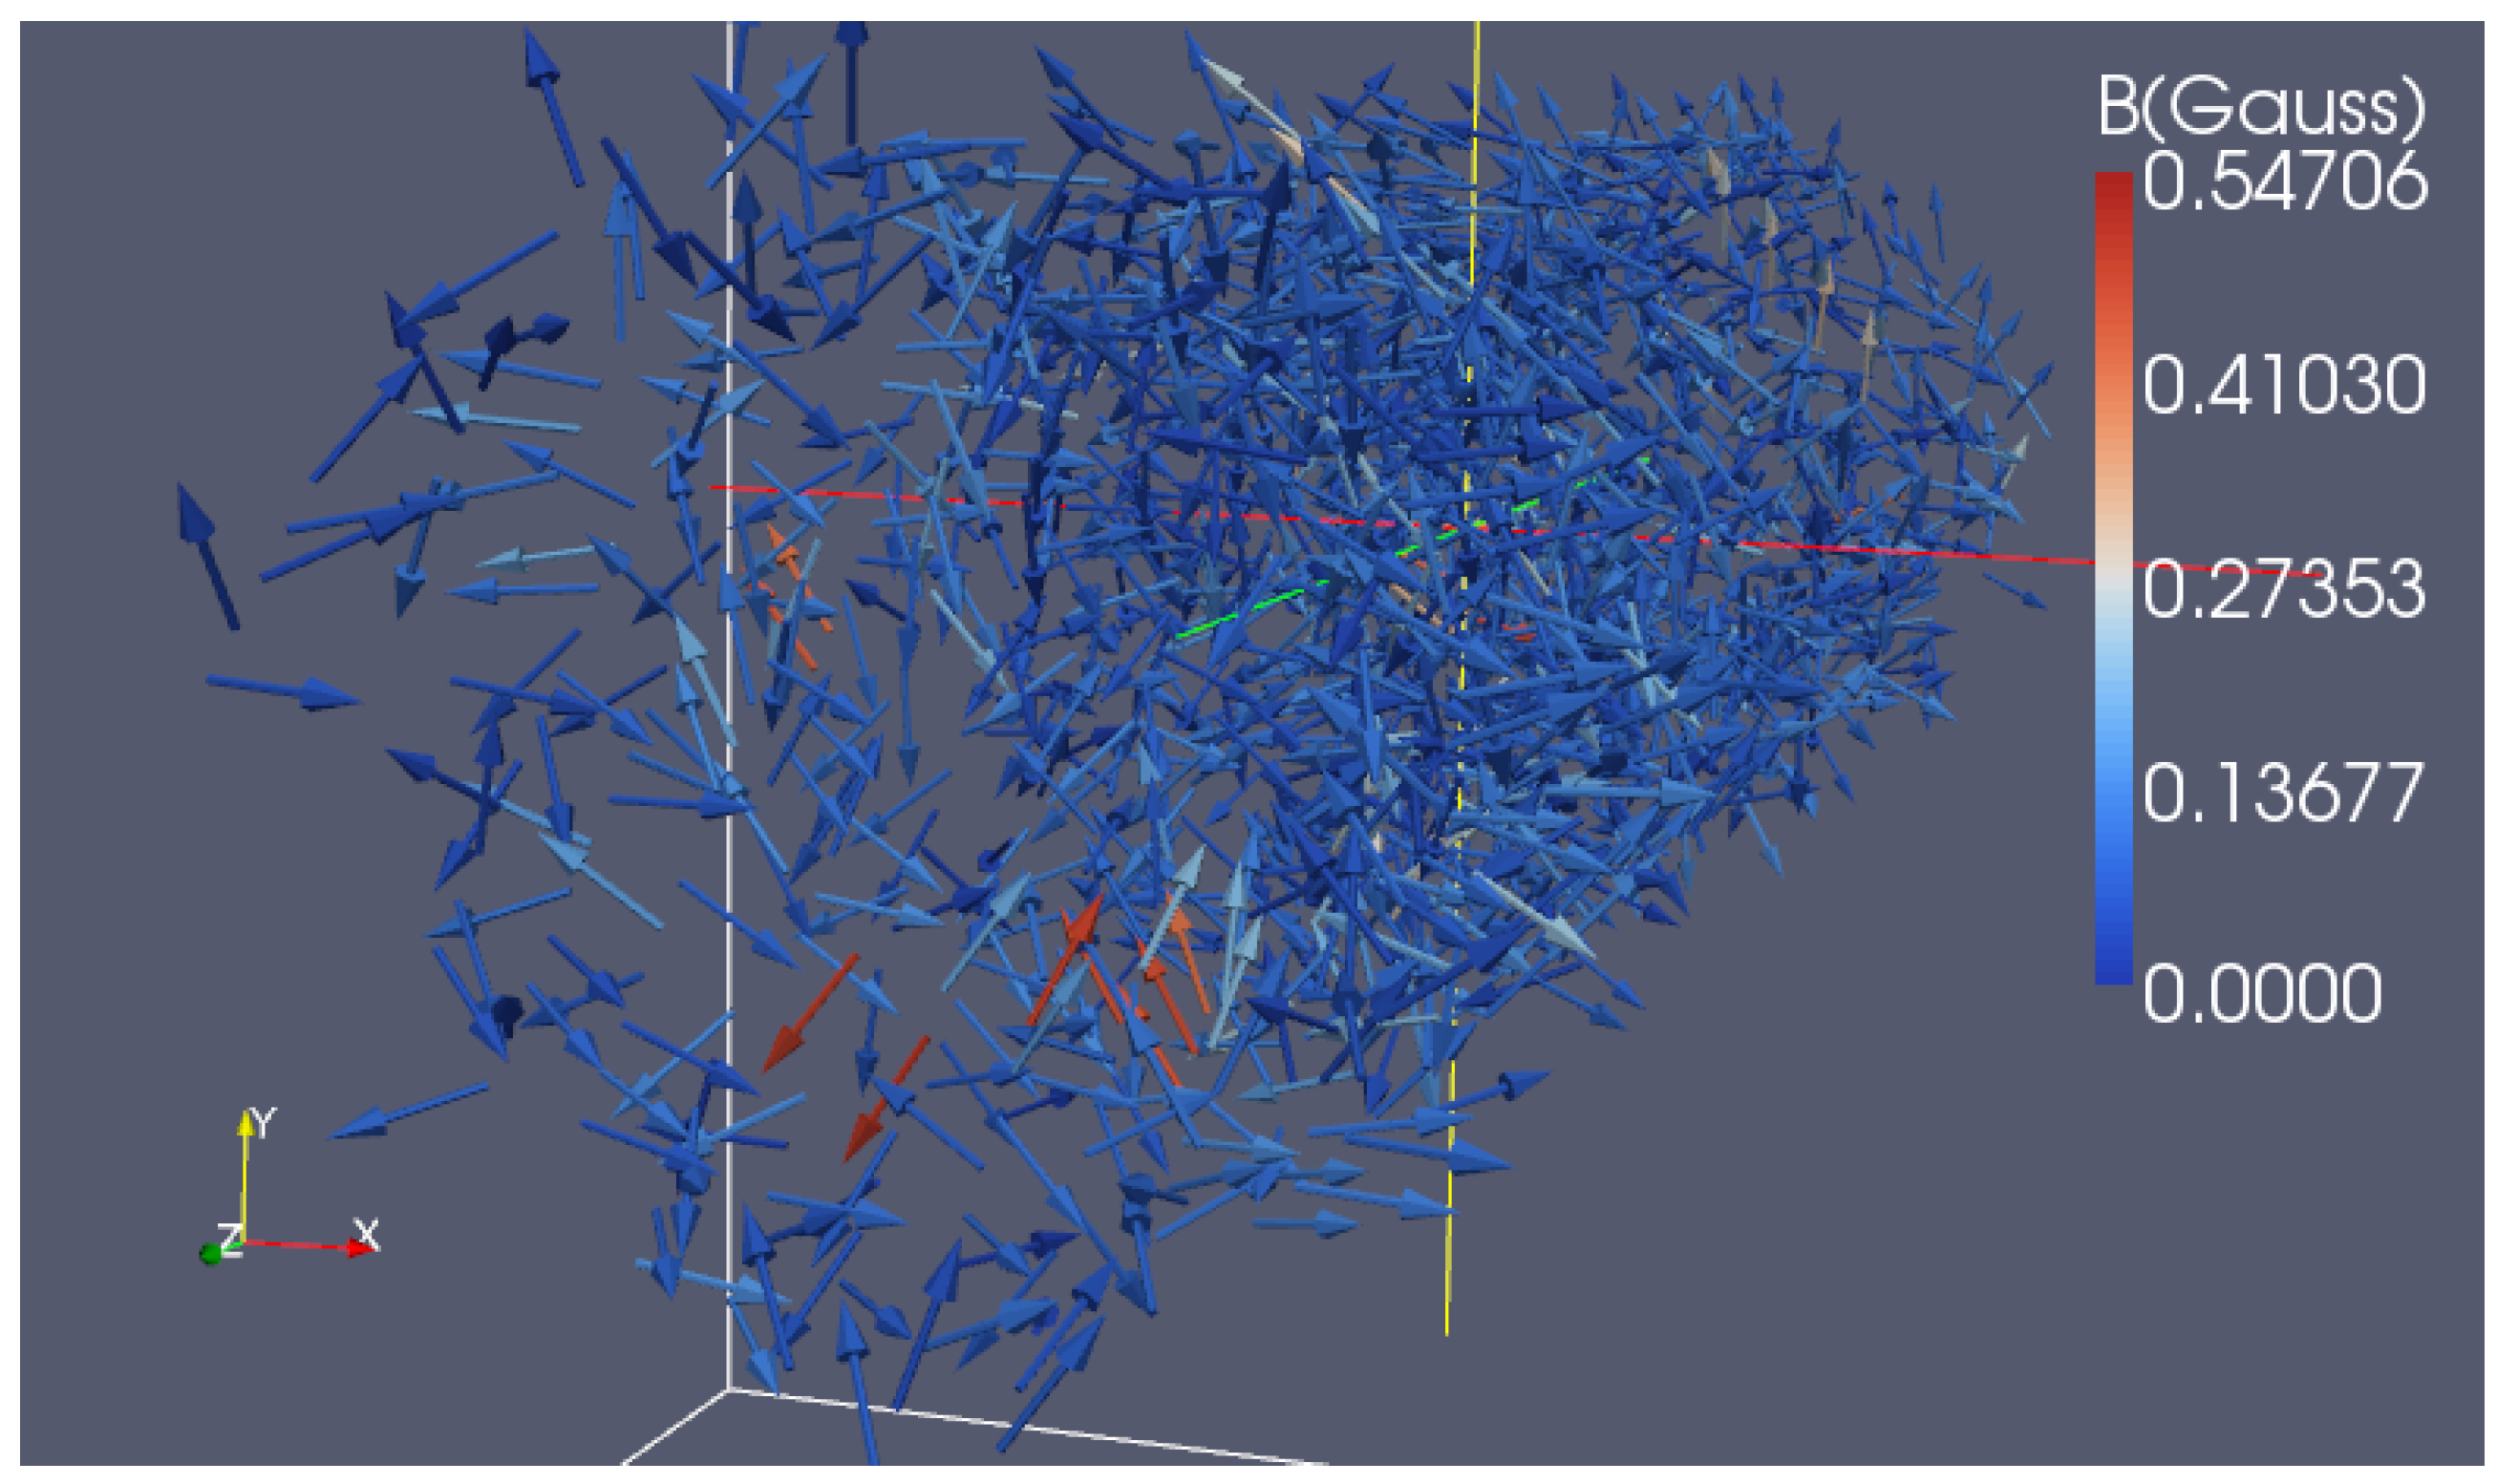
3.2. Ray-Tracing through a Disordered Magnetic Field
I then proceeded to explore the effect that a more turbulent jet environment would have on the observed levels of circular polarization. Figure 4 illustrates the more disordered magnetic field used in my second calculation. I expect that the increased disorder in the field will increase the birefringence of the jet plasma (leading to increased Faraday conversion), but will also lead to depolarization of the emission due to the lack of a systematic vector-ordered magnetic field component. The interplay between these two effects will govern the level of circular polarization produced in the TEMZ grid. The image maps from this second ray-trace are shown in Figure 5 and Figure 6. I have convolved these resultant images with a circular Gaussian beam with a full-width-half-maximum of . The increased turbulence in this simulation is evident in every image. The integrated level of circular polarization (, shown in the middle panel of Figure 6) reaches ∼2.6%, which is still in rough agreement with observations of circular polarization in blazars [6]. However, I have observed very localized levels of fractional circular polarization that can reach as high as ∼14% in a disordered (upstream of the shock) TEMZ grid (a topic of discussion to be presented in a future paper). These localized regions of extreme circular polarization get “washed out” in the convolved images. Returning to my original question: Can TEMZ reproduce circularly polarized emission at the percent levels seen in some blazars? The levels of present in Figure 3 and Figure 6 would seem to indicate that the answer to this question is yes.
4. Future Research
The next step to take with this research is to begin to explore how changes in the composition of the plasma can affect the observed levels of circular polarization. The calculations presented above have assumed a pure electron–proton plasma within the jet. Some admixture of positrons within the jet plasma should also be explored. I also plan on studying what changes in the TEMZ model parameters (of which there are dozens) affect quantifiable changes in the levels of circular polarization. These tests will be crucial in assessing how useful circular polarization can actually be in discerning the underlying nature of the jet plasma. I also plan on creating synthetic multi-frequency observations of the TEMZ model in order to form circular polarization spectra, , to be used as a means of probing whether the observed circular polarization is produced intrinsically within the plasma or, as suggested above, is produced through Faraday conversion. Finally, my polarized radiative transfer scheme has been written in a robust fashion that will allow it to be used in ray-tracing through other types of numerical jet simulations. All the routine requires is a three-dimensional distribution of magnetic fields and electron number densities from which full polarization emission maps can be produced. I would welcome the opportunity to collaborate on further synthetic polarimetric imaging studies.
Conflicts of Interest
The author declares no conflict of interest.
References
- Homan, D.C.; Lister, M.L.; Aller, H.D.; Aller, M.F.; Wardle, J.F.C. Full polarization spectra of 3C 279. Astrophys. J. 2009, 696, 328. [Google Scholar] [CrossRef]
- Homan, D.C.; Attridge, J.M.; Wardle, J.F.C. Parsec-scale circular polarization observations of 40 blazars. Astrophys. J. 2001, 556, 113. [Google Scholar] [CrossRef]
- Marscher, A.P. Turbulent, extreme multi-zone model for simulating flux and polarization variability in blazars. Astrophys. J. 2014, 780, 87. [Google Scholar] [CrossRef]
- Jones, T.W.; O’Dell, S.L. Transfer of polarized radiation in self-absorbed synchrotron sources. I. Results for a homogeneous source. Astrophys. J. 1977, 214, 522–539. [Google Scholar] [CrossRef]
- Jones, T.W. Polarization as a probe of magnetic field and plasma properties of compact radio sources-Simulation of relativistic jets. Astrophys. J. 1988, 332, 678–695. [Google Scholar] [CrossRef]
- Homan, D.C.; Wardle, J.F.C. High levels of circularly polarized emission from the radio jet in NGC 1275 (3C 84). Astrophys. J. 2004, 602, L13. [Google Scholar] [CrossRef]
- Lyutikov, M.; Pariev, V.I.; Gabuzda, D.C. Polarization and structure of relativistic parsec-scale AGN jets. Mon. Not. R. Astron. Soc. 2005, 360, 869–891. [Google Scholar] [CrossRef]
Figure 1.
A schematic representation of the Turbulent Extreme Multi-Zone (TEMZ) model—reproduced from [3]. The radio core of a blazar is modeled as a collection of thousands of turbulent cells of plasma moving relativistically across a standing shock. The red line depicts how, along a given sight-line through the TEMZ grid, an individual ray will pierce multiple cells of plasma, each with distinct magnetic field orientation.
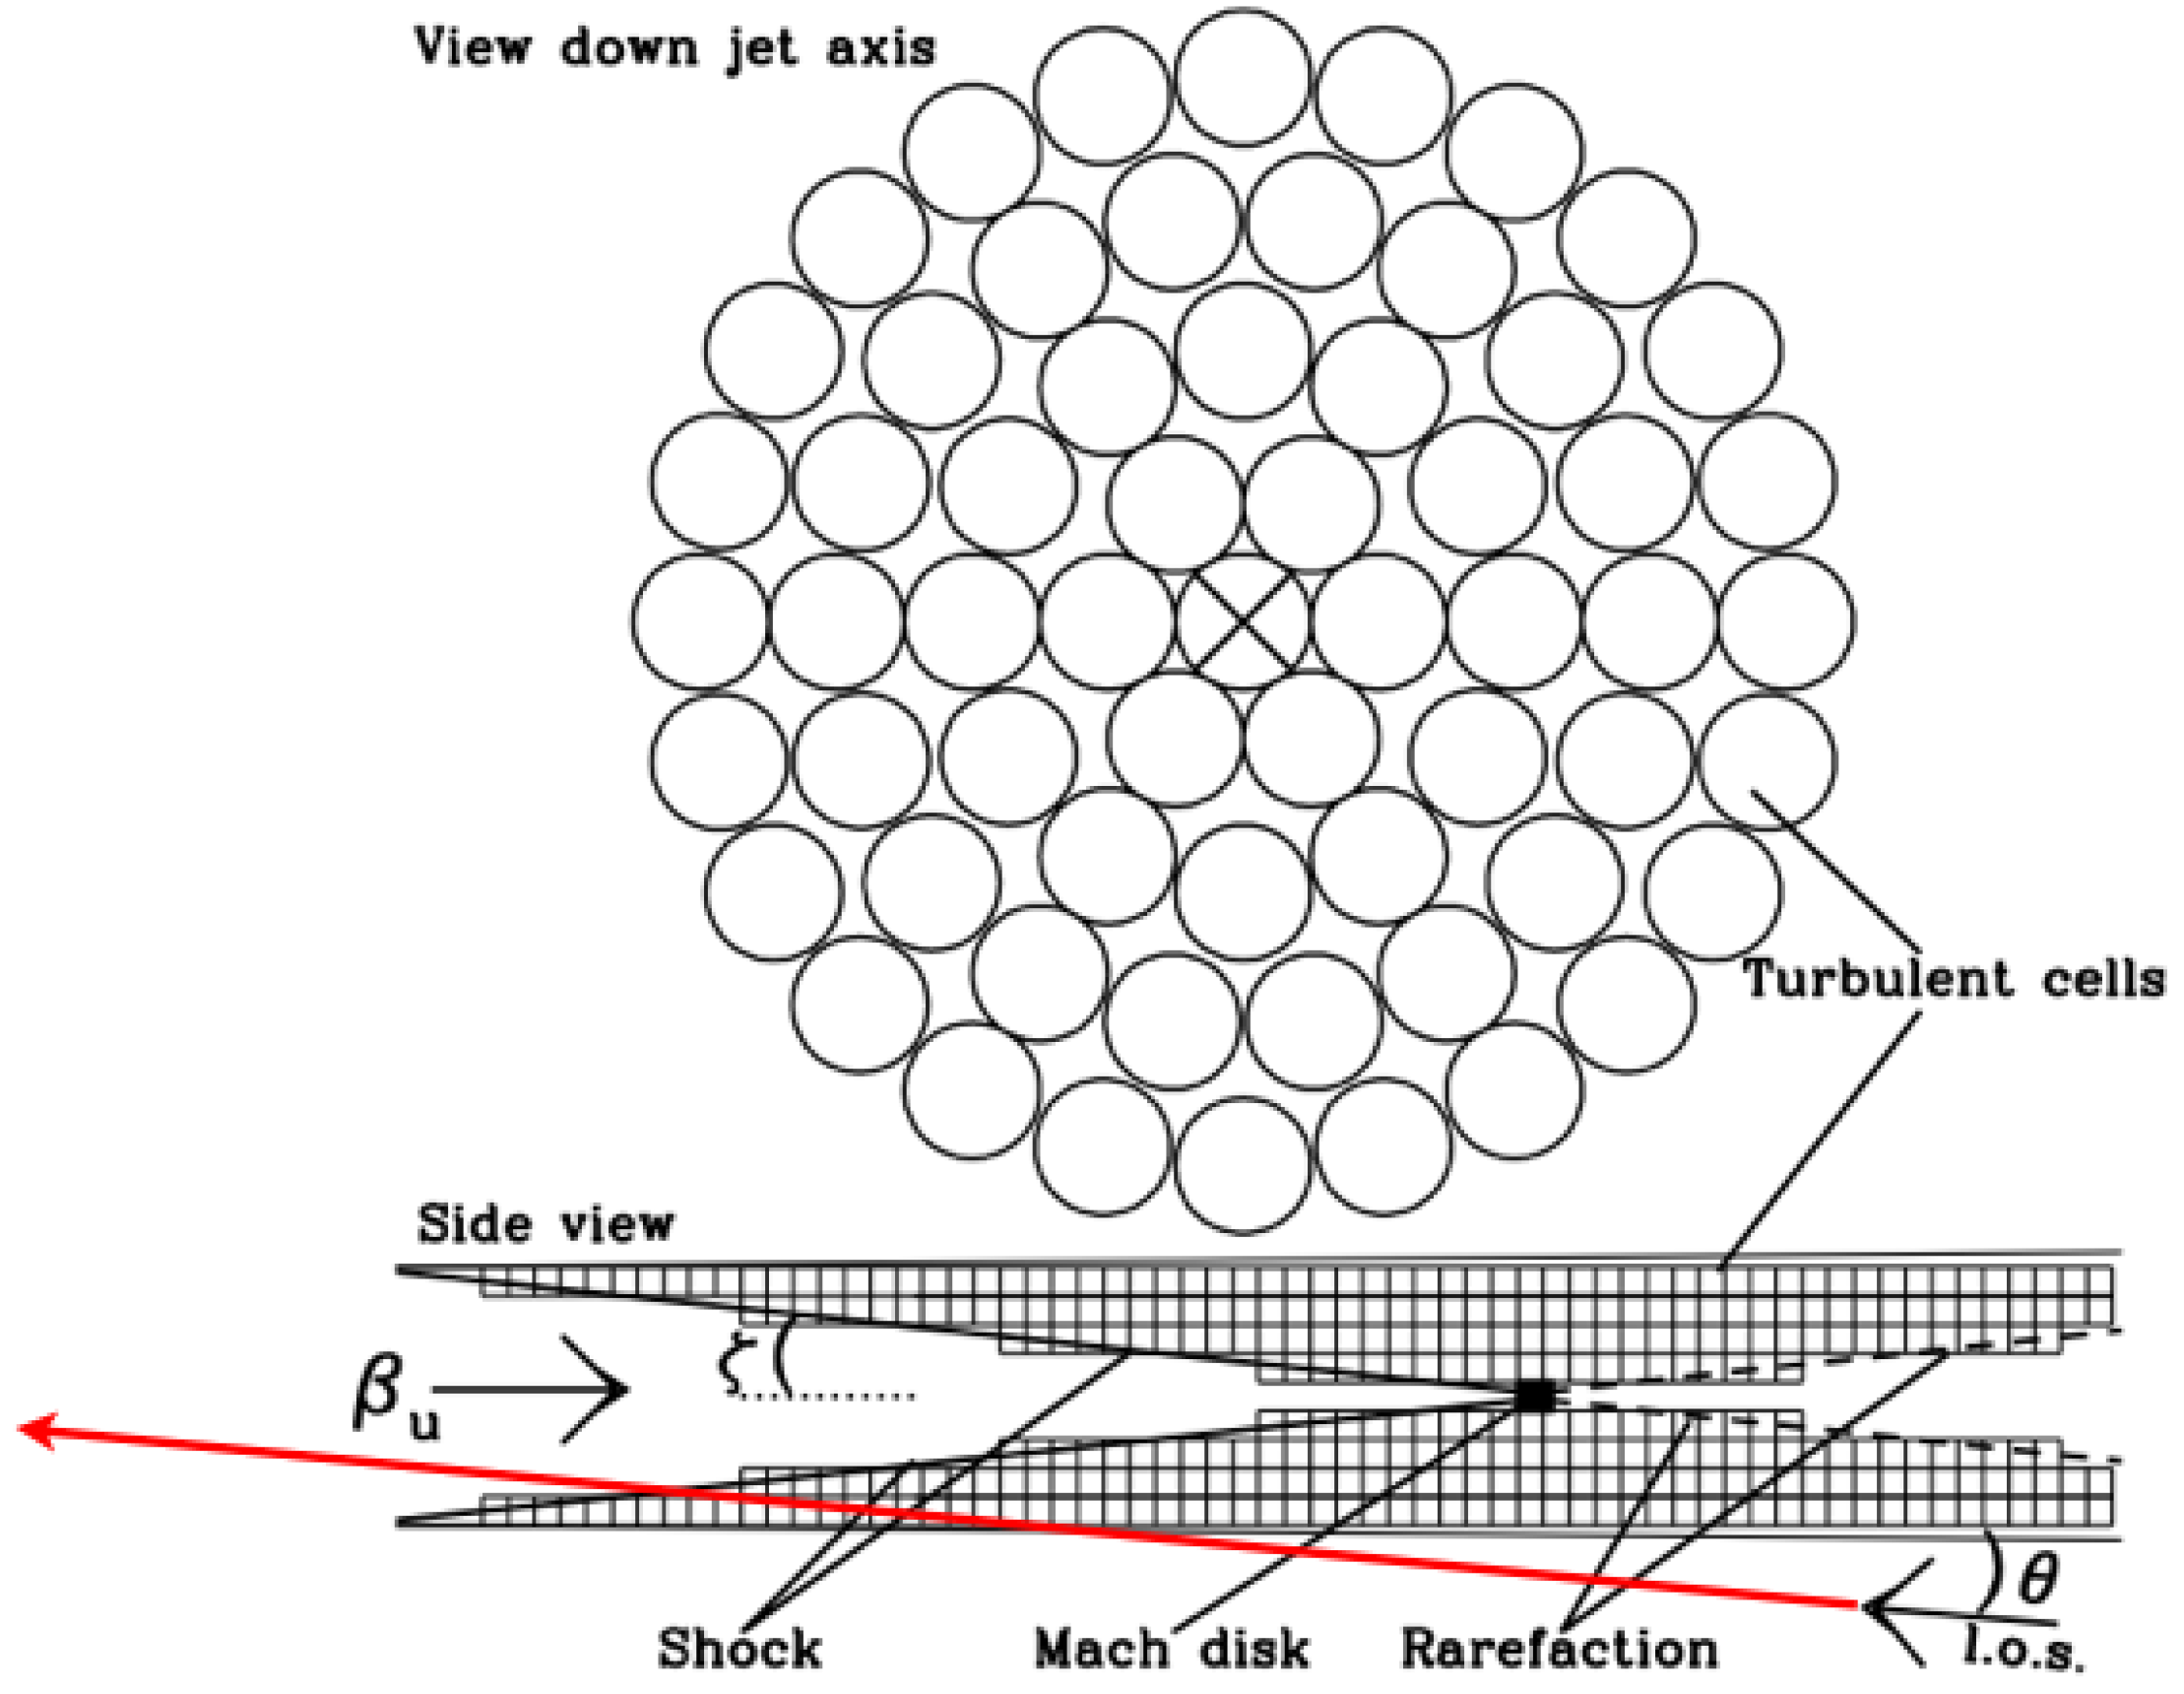
Figure 2.
A rendering of the three-dimensional distribution of well-ordered magnetic field within the TEMZ grid. Each vector depicts the magnetic field orientation within an individual plasma cell, and is color-coded according to the strength of the field (see color bar to the right).
Figure 2.
A rendering of the three-dimensional distribution of well-ordered magnetic field within the TEMZ grid. Each vector depicts the magnetic field orientation within an individual plasma cell, and is color-coded according to the strength of the field (see color bar to the right).

Figure 3.
(Upper panel)—A rendering of the total intensity (Stokes I) in the co-moving frame highlighting the structure of the TEMZ computational grid; (Middle panel)—A plot of the fractional circular polarization in the co-moving frame highlighting the different regions within the jet that produce positive/negative circular polarization; (Lower panel)—A plot of the fractional circular polarization (in the observer’s frame) at an observing frequency of 43 GHz.
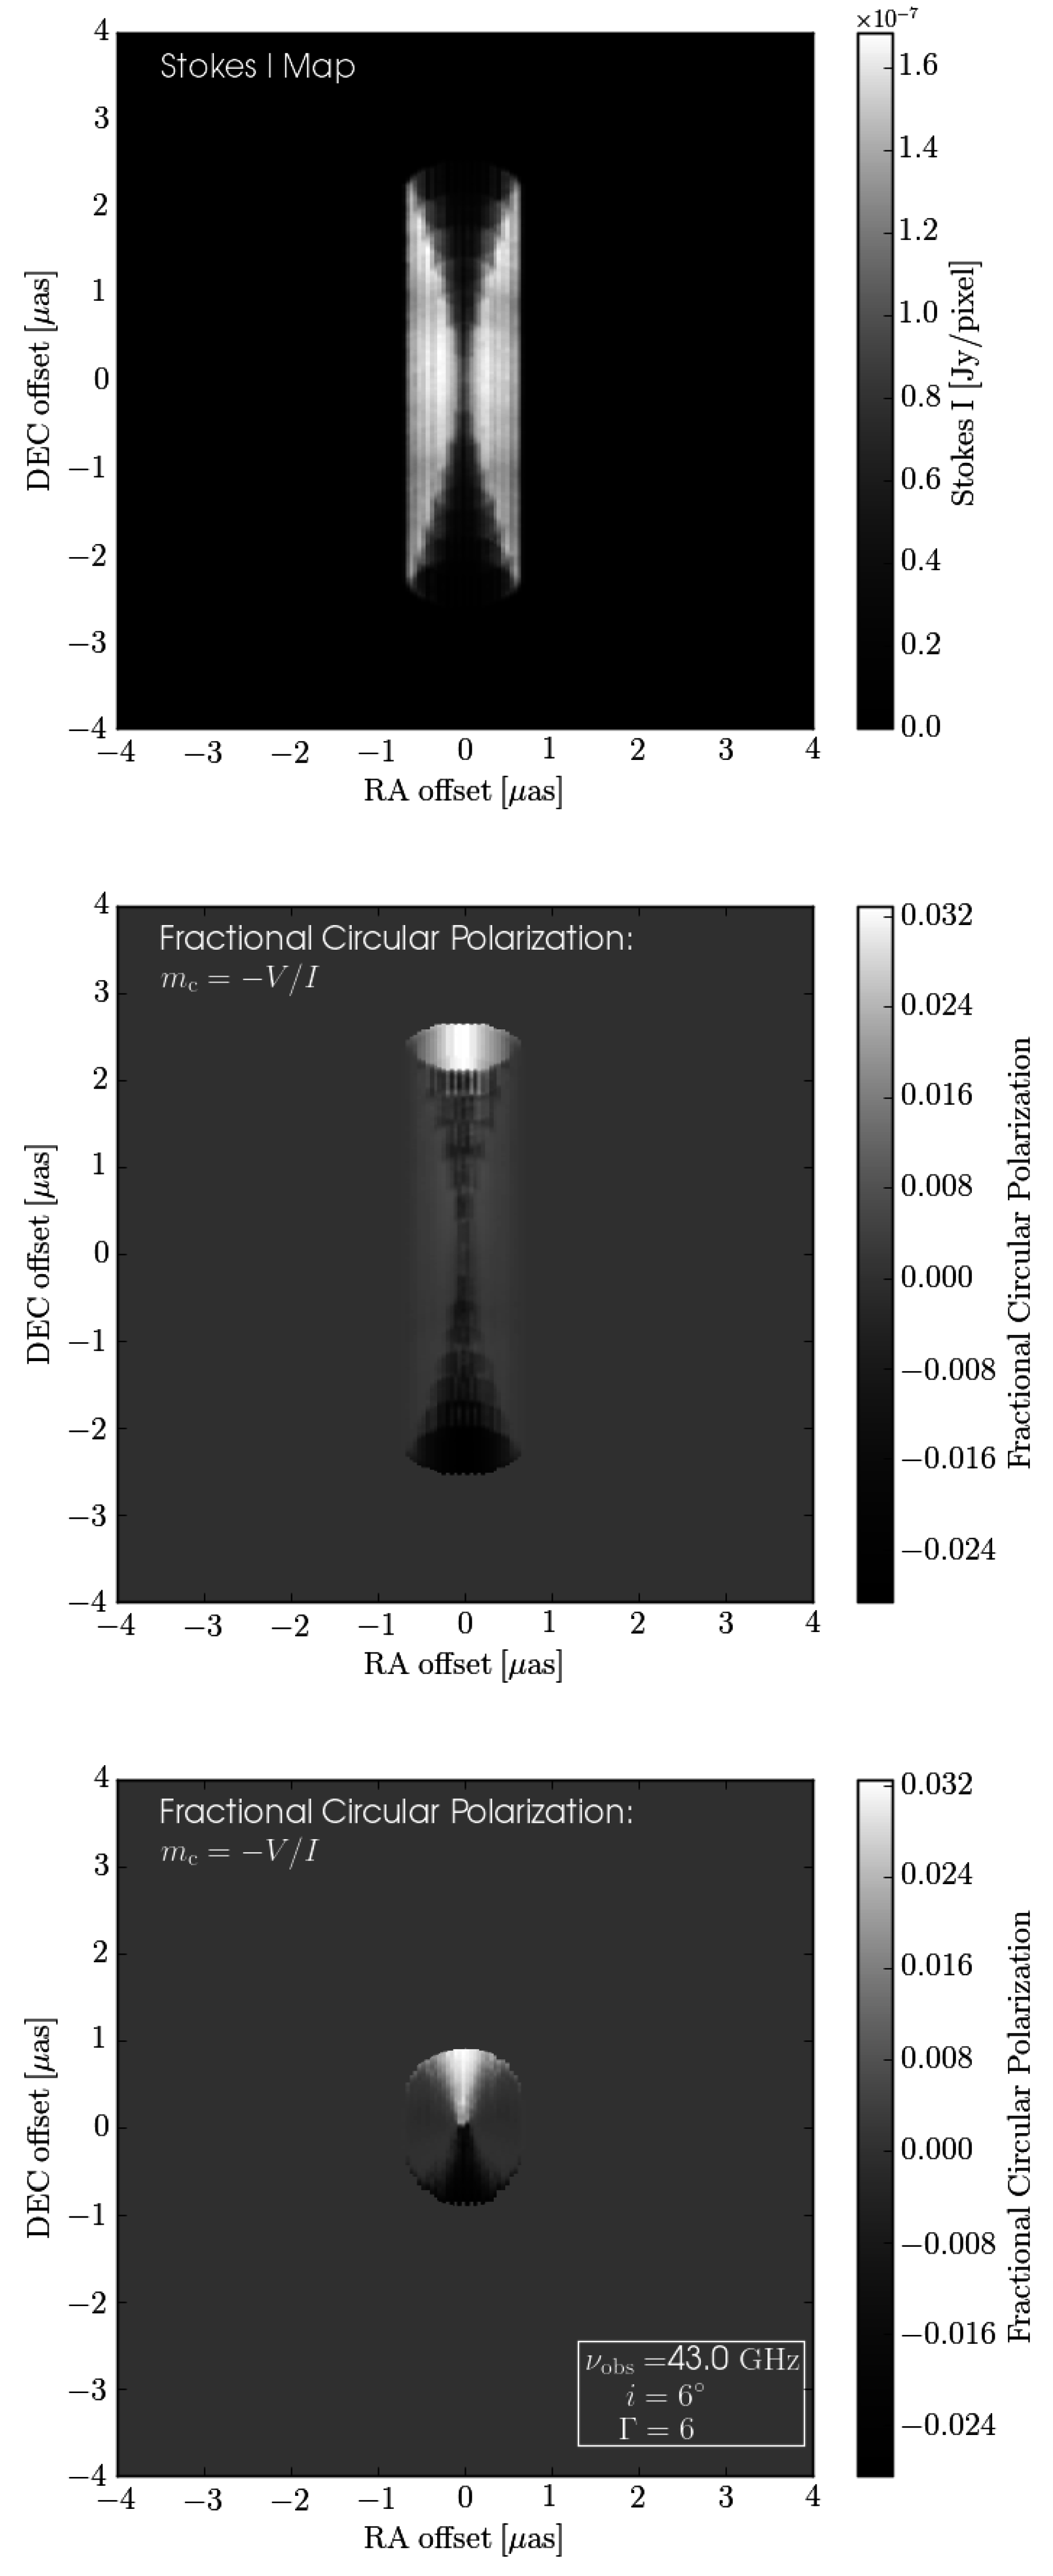
Figure 4.
A rendering of the three-dimensional distribution of disordered magnetic field within a turbulent TEMZ grid. As in Figure 2, each vector depicts the magnetic field orientation within an individual plasma cell, and is color-coded according to the strength of the field (see color bar to the right).

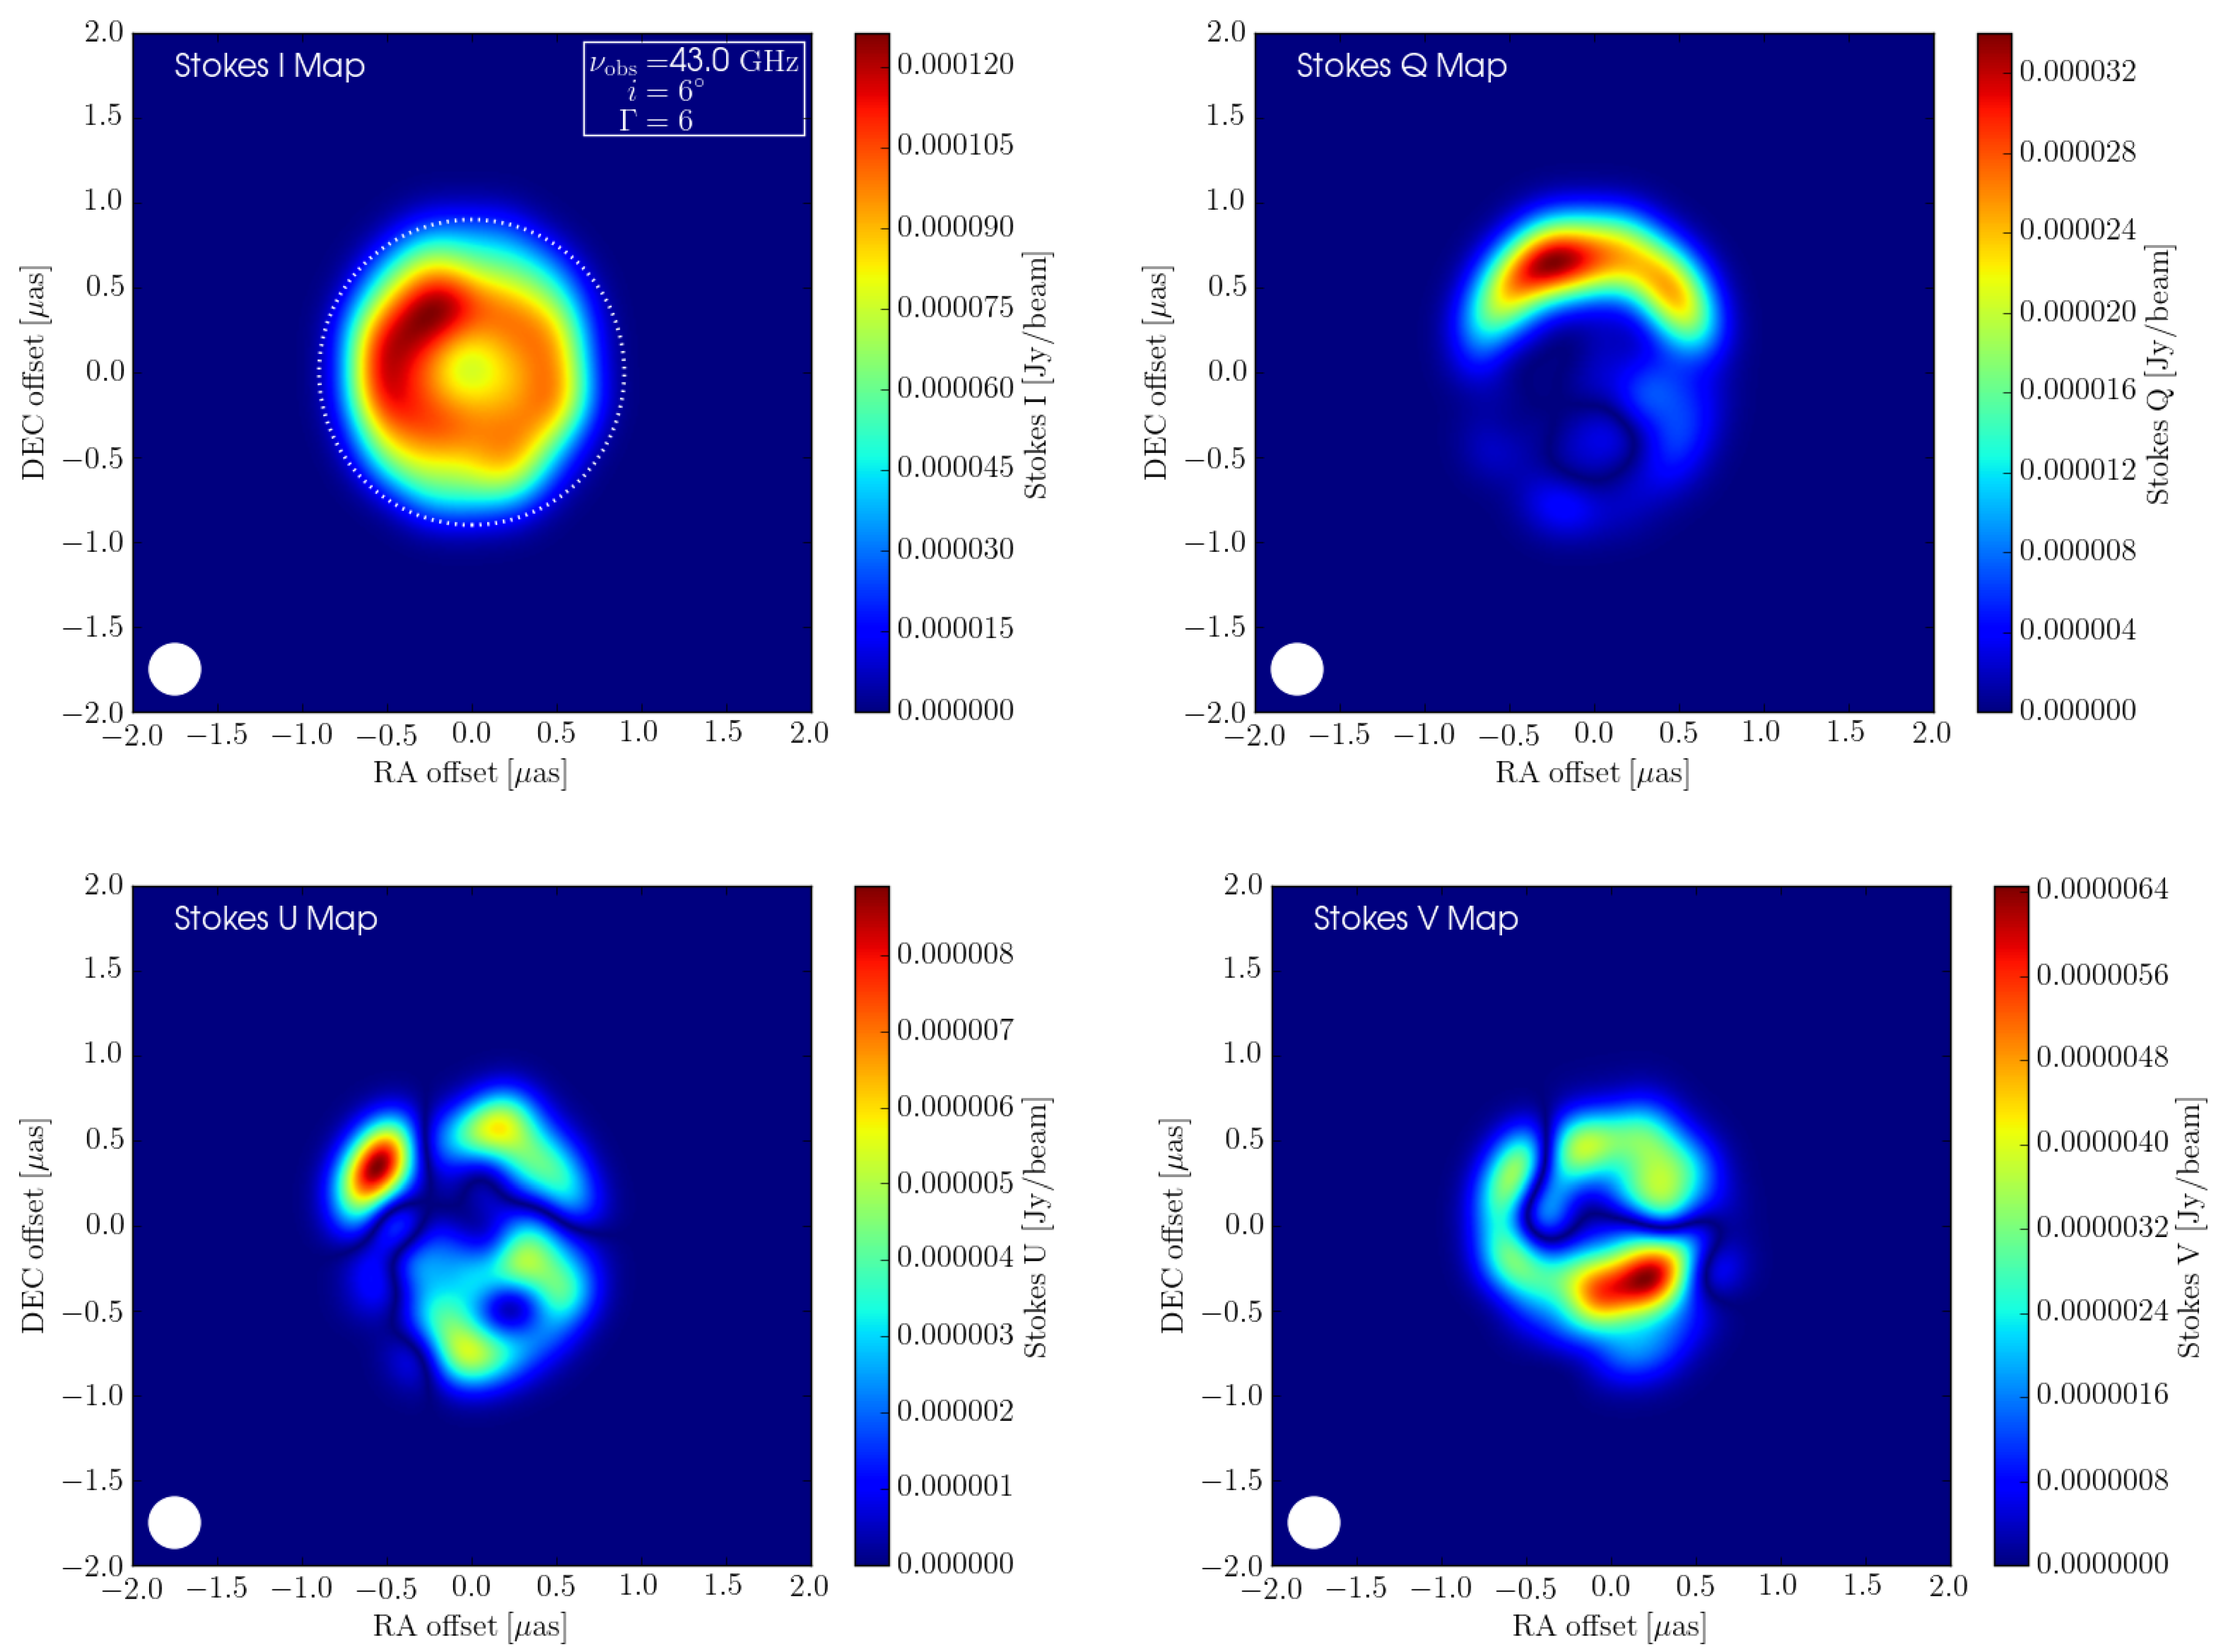
Figure 5.
(Upper left)—Stokes I emission map at an observing frequency of 43 GHz. The white dashed circle defines an arbitrary region within which I compute fractional circular () and linear () polarization (presented in Figure 6). (Upper right)—Stokes Q emission map. (Lower left)—Stokes U emission map. (Lower right)—Stokes V emission map. The above images have all been convolved with the circular Gaussian beam shown in the lower left.

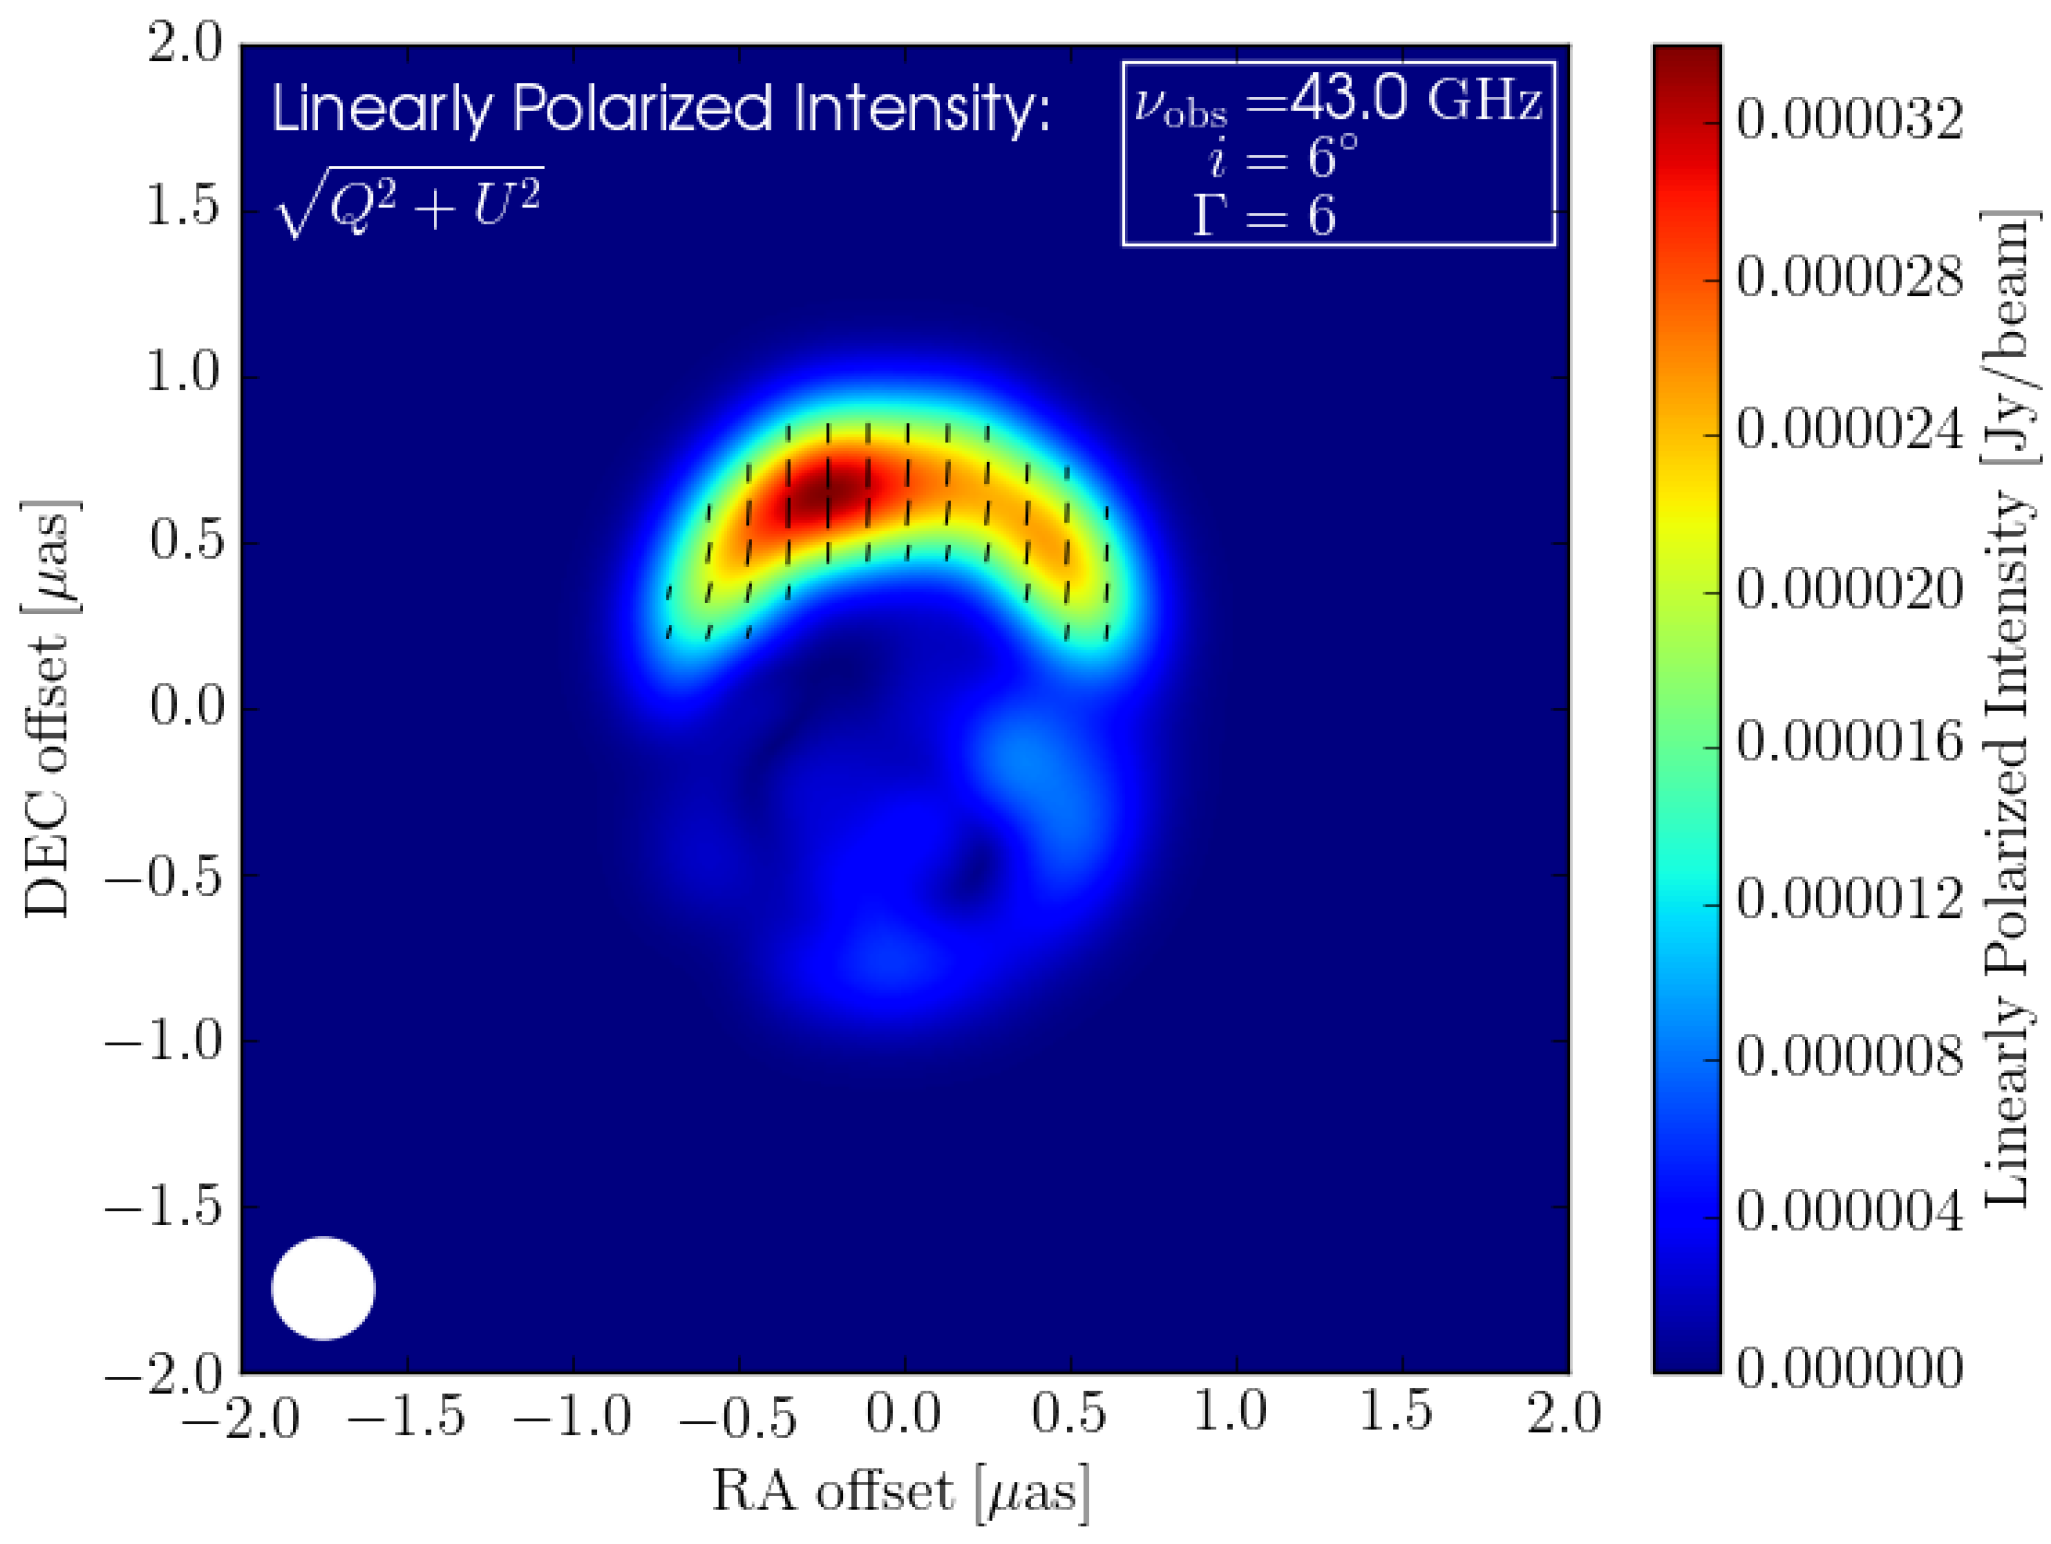
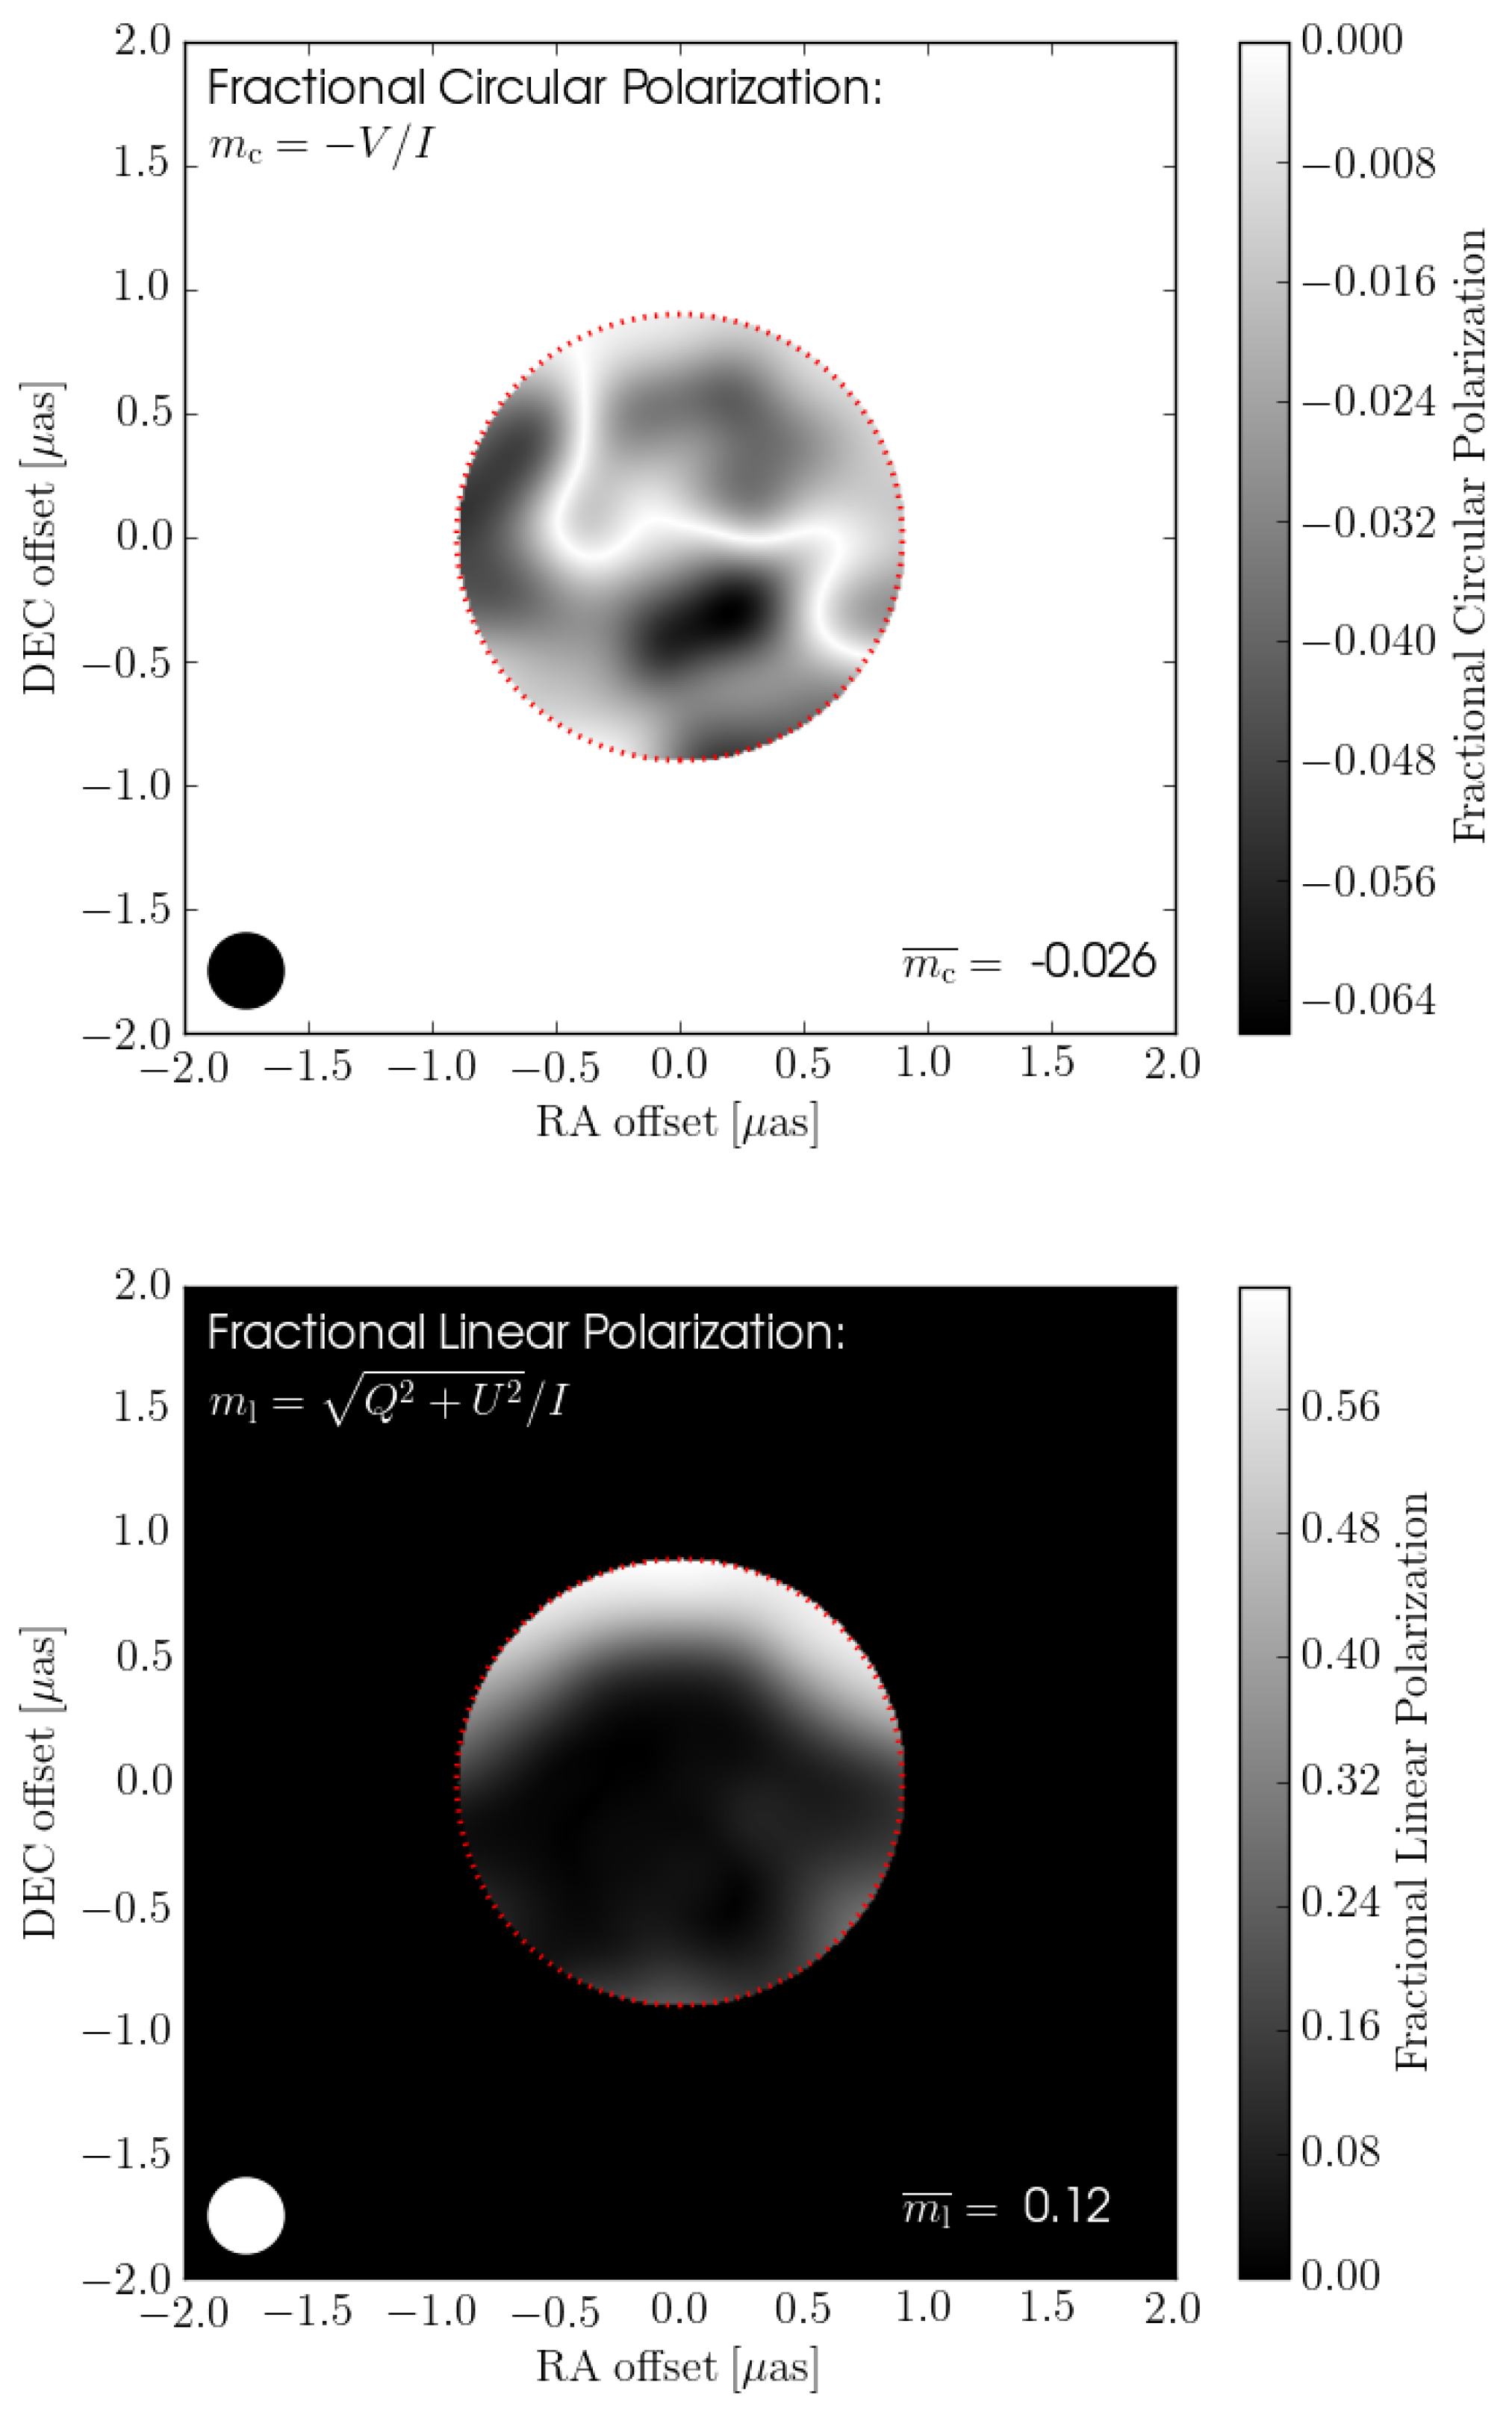
Figure 6.
(Upper panel)—A rendering of the linearly polarized intensity of the disordered TEMZ grid, as seen at an observing frequency of 43 GHz. The electric vector position angles (EVPAs) illustrate the orientation of the linearly polarized emission as projected onto the plane of the sky, and are shown as black line segments. The effects of relativistic aberration (as outlined in [7]) on the orientation of these EVPAs have been included in my radiative transfer calculations. (Middle panel)—A plot of the observed fractional circular polarization with an integrated value () shown in the lower right. (Lower panel)—A plot of the observed fractional linear polarization with an integrated value () shown in the lower right. The above images have all been convolved with the circular Gaussian beam, shown in the lower left.


© 2016 by the author; licensee MDPI, Basel, Switzerland. This article is an open access article distributed under the terms and conditions of the Creative Commons Attribution (CC-BY) license (http://creativecommons.org/licenses/by/4.0/).
Share and Cite
MDPI and ACS Style
MacDonald, N.R. Through the Looking Glass: Faraday Conversion in Turbulent Blazar Jets. Galaxies 2016, 4, 50. https://doi.org/10.3390/galaxies4040050
AMA Style
MacDonald NR. Through the Looking Glass: Faraday Conversion in Turbulent Blazar Jets. Galaxies. 2016; 4(4):50. https://doi.org/10.3390/galaxies4040050
Chicago/Turabian StyleMacDonald, Nicholas Roy. 2016. "Through the Looking Glass: Faraday Conversion in Turbulent Blazar Jets" Galaxies 4, no. 4: 50. https://doi.org/10.3390/galaxies4040050
Note that from the first issue of 2016, this journal uses article numbers instead of page numbers. See further details here.