Article

Observations of the Structure and Dynamics of the Inner M87 Jet

1
National Radio Astronomy Observatory, Socorro, NM 87801, USA
2
Department of Physics & Astronomy, The University of Alabama, Tuscaloosa, AL 35487, USA
3
MPIA, 69117 Heidelberg, Germany
4
Goddard Space Flight Center, Astrophysics Science Division, 8800 Greenbelt Road, Greenbelt, MD 20771, USA
5
ISR-2, MS-D436, Los Alamos National Laboratory, P.O. Box 1663, Los Alamos, NM 87545, USA
6
Max Plank Institute für Radioastronomie, Auf dem Huegel 69, 53121 Bonn, Germany
7
Kapteyn Astronomical Institute, PO Box 800, 9700 AV Groningen, The Netherlands
8
Institut für Experimentalphysik, Universität Hamburg, Luruper Chaussee 149, 22761 Hamburg, Germany
*
Author to whom correspondence should be addressed.
Galaxies 2016, 4(4), 46; https://doi.org/10.3390/galaxies4040046
Submission received: 1 September 2016 / Revised: 5 October 2016 / Accepted: 8 October 2016 / Published: 18 October 2016
(This article belongs to the Special Issue Blazars through Sharp Multi-wavelength Eyes)

Abstract

:
M87 is the best source in which to study a jet at high resolution in gravitational units because it has a very high mass black hole and is nearby. The angular size of the black hole is second only to Sgr A*, which does not have a strong jet. The jet structure is edge brightened with a wide opening angle base and a weak counterjet. We have roughly annual observations for 17 years plus intensive monitoring at three week intervals for a year and five day intervals for 2.5 months made with the Very Long Baseline Array (VLBA) at 43 GHz. The inner jet shows very complex dynamics, with apparent motions both along and across the jet. Speeds from zero to over 2c are seen, with acceleration observed over the first 3 milli-arcseconds. The counterjet decreases in brightness much more rapidly than the main jet, as is expected from relativistic beaming in an accelerating jet oriented near the line-of-sight. Details of the structure and dynamics are discussed. The roughly annual observations show side-to-side motion of the whole jet with a characteristic time scale of about 9 years.

Graphical Abstract

1. Introduction

M87 is a dominant galaxy of the Virgo Cluster at a distance of 16.7 Mpc [1]. There is a jet emitted from the nucleus that is visible throughout the electromagnetic spectrum. It is a strong radio source, known as Virgo A, with jet and lobe structures spanning the smallest scales probed by high frequency Very Long Baseline Interferometry (VLBI) to arcminute scales probed by instruments such as the Jansky Very Large Array and LOFAR. M87 contains a very massive black hole. The mass is still uncertain with values of M B H = ( 3 . 5 0 . 7 + 0 . 9 ) × 10 9 M determined from gas dynamics [2] and ( 6.6 ± 0.4 ) × 10 9 M determined from stellar dynamics [3]. In this work, we use a mass of 6.16 × 10 9 M which is the stellar dynamic mass adjusted for our assumed distance. The assumed mass and distance give a Schwarzschild radius (R s 2 G M / c 2 ) of 122 au or 7.3 μarcsec. This is the highest angular size black hole that has a radio jet whose structure can be studied and is the second highest angular size black hole associated with any radio source, second only to Sgr A* in the center of the Milky Way. Thus M87 is the best source in which to observe the jet base region where the jet is accelerated and collimated.
The M87 jet was reported to have a wide-opening-angle base and edge brightened structure all the way to the core as seen by 43 GHz Very Long Baseline Array (VLBA [4]) observations [5]. A counterjet has been seen in most VLBA 43 GHz images [6,7,8] and confirmed in VLBA 15 GHz images [9]. These structures are also seen at 86 GHz [10]. All of the high frequency VLBI observations of M87 show that the edge-brightened structure has a parabolic shape described by r z 0.58 [11]. That parabolic shape continues to a de-projected distance of about 10 5 R s , ([11] assumed an angle to the line-of-sight θ = 14 ) near the structure named “HST1”, where it changes to conical. Unlike the structure with a radio core significantly offset from the black hole that is thought to be the situation in many blazars [12], the radio core in this much weaker source appears to align with the black hole to within roughly 20 R s (deprojected with θ 20 ) as evidenced by the counterjet structure and by astrometric evidence for the expected core shift with frequency induced by the optical depth [13].
The speed of the jet has been reported as subluminal on small scales [9,10] and as mildly superluminal (∼2c) [8]. A region of acceleration was reported on scales of a fraction of an arcsecond [14], well beyond the region covered by the 43 GHz observations. The highest superluminal speeds seen in M87 are about 6c as seen at HST1 in optical [15] and radio [16] observations. The presence of a counterjet that quickly drops below detectability is additional evidence for relativistic speeds beyond the inner couple of milli-arcseconds (mas).
In this contribution, we focus on measurement of the speed of the jet over the inner several mas based on the 2007 and 2008 observations and on results from the roughly annual observations between 1999 and 2016. The annual observations demonstrate side-to-side motions of the whole jet with a time scale of roughly 9 years. More extensive presentations of the results from the 43 GHz VLBA project will be given elsewhere soon. The main data paper with some discussion will be Walker et al. [17]. The wavelet-based velocity measurements, and much interpretation and model fitting, are in Mertens et al. [18].

2. The Observations

The 43 GHz VLBA M87 project broadly encompasses observations made under several proposals between 1999 and the present. The sensitivity of the array increased significantly during this period mainly due to bandwidth increases, especially the factor of 4 improvement in maximum bandwidth and factor of 8 improvement achieved for this project before the 2013 observations. The primary goal of the project was an explicit attempt to measure the jet speed by shortening the interval between observations. A pilot project to determine the best interval was conducted in 2006. Throughout 2007, M87 was observed every 3 weeks. Despite the pilot, that interval was determined to undersample the motions, so observations were made about every 5 days for 2.5 months in 2008. Unfortunately, the 2008 data quality is lower than for the 2007 data because of limitations in the ability of dynamic scheduling to avoid poor observing conditions when the observing dates are tightly constrained. Thus the 2007 movie, despite its limitations, remains the best resource with which to study the motions in the source [8].
The 2008 data fortuitously corresponded to a significant rise in flux density (by about 74%) from the unresolved core region—the largest flare actually caught in recent years. That flare coincided with a flare in the TeV energy regime that was observed by VERITAS, H.E.S.S. and MAGIC [19], strongly suggesting that the TeV emission was produced in the same location as the radio emission very close to the black hole. Since then, an on-going project to catch other correlated radio-TeV flares has resulted in roughly annual VLBA observations, made to check the source status near the start of each TeV observing season. There were also multiple sessions in 2010 and 2016 as a result of high energy triggers. Significant flaring was not seen, but multiple epoch images of the source structure were obtained and will be reported in Walker et al. [17]. In 2012, a TeV flare that did not reach the trigger level for the 43 GHz project was followed up at lower frequencies and a radio flare has been reported [20].
All of the data used for this project were collected by the VLBA without the use of additional antennas. The correlation was done on the VLBA correlator in Socorro, NM. Data reduction was done using AIPS. Because a side-goal of the project involved phase referencing between M84 and M87 to obtain their relative proper motions (successful, but to be reported elsewhere), the calibration included several steps not strictly needed for M87 imaging based on self-calibration. Corrections were made for improved Earth Orientation Parameters (EOP), for the ionosphere using models from the geodetic community, for atmospheric delays using the AIPS task DELZN (rates for older data, delays for data since 2008 when geodetic segments started being added), for atmospheric absorption using sec(Z) fits to the system temperatures in task APCAL, and for the bandpass shapes. The a priori gains provided by the VLBA staff were used for amplitude calibration. The imaging involved many iterations of self calibration and CLEAN. Some key capabilities of the AIPS task IMAGR that enabled production of images without excessive CLEAN artifacts were the robust weighting scheme and multi-resolution CLEAN.

3. Jet Shape

To show the overall structure as seen by the VLBA at 43 GHz, one of the best single-epoch images from the ongoing 43 GHz VLBA project [17] is shown in Figure 1. This image benefited from the use of the new wide bandwidth system on the VLBA so it has a sensitivity comparable to the stacked image shown in other publications [8] but is not subject to the smearing inherent in the stack. The image clearly shows the edge-brightened structure and presence of the counterjet that have been noted in other publications as noted in the Introduction. It also shows that the source has fine structure that varies with time as demonstrated by the smoother appearance of the stacked images.
To show the counterjet in more detail, a higher resolution version of the same image, made with uniform weighting and 30% superresolution in the N-S direction, is shown in Figure 2. It shows the counterjet clearly and the symmetry of the jet and counterjet structures.
Analysis of the detailed structure will be given in upcoming publications [17,18] while here we focus on the jet speed and long term evolution.

4. Jet Speed

A rapidly changing structure for M87 is apparent in all of the VLBA 43 GHz VLBA data. A movie made from the first 11 epochs of the 2007 data, shown in the on-line material for [8], gives a strong visual impression of rapid motions with an apparent speed in projection of about 2c. A formal measurement of the speed was not made at that time because the internal structure of the jet evolves rapidly, making it somewhat difficult to identify clear components to follow from epoch to epoch. This difficulty is compounded by the fact that the 3-week intervals undersampled the motions. Recently, two methods were used to obtain better information on the velocity field in the inner M87 jet.
The first method is a traditional effort to measure component motions. For each of the 23 epochs from 2007 and 2008, the positions and peak flux densities of the many emission peaks were measured. The positions were determined visually rather than by using formal fits which are difficult due to the complex source and blending of features. An effort was then made, also visually, to relate peaks between epochs. By doing it visually, it was possible to take into account adjoining structure such as pits and multiple peak features in component identification. For a significant fraction of the peaks, an identification with peaks in other epochs was not clear so they are not included in the velocity analysis. We caution readers that this method does suffer from the possibility that observer bias will affect the outcome. Variations on the method, that automatically determine the related features, give similar results.
To determine speeds, a least squares fit was done to each set of related features from three adjoining epochs. The statistics of the measured speeds were then examined for trends. This was done separately for the north and south sides of the jet. There were some peaks in the middle region of the jet and in the counterjet, but not enough for a reasonable analysis of speeds. A sample image, with the visually identified peaks marked, is shown in Figure 3. The core separation of all the peaks on the southern side, with a connecting line representing the fit to each set of three related peaks, is shown in Figure 4a. Figure 4b is a histogram of the measured speeds of the 3-peak segments while Figure 4c is a plot of those speeds as a function of the core distance at the start of the line segment. Both Figure 4b,c show that there is a range of speeds, with emphasis on nearly stationary peaks and peaks moving at an apparent speed of somewhat over 2c. It appears that peaks accelerate over the inner 2 mas from very slow speed near the core to higher speeds further out. The acceleration is consistent with the trend of the jet/counterjet sidedness ratio and explains why the counterjet is apparant close to the core, but rapidly fades to below detectability as the relativistic beaming increases.
The second method used to obtain the jet speed uses the Wavelet Image Segmentation and Evaluation (WISE) analysis [21]. This work, with significant analysis results, is presented in Mertens et al. [18]. The method is able to determine the velocity field in considerable detail, including being able to detect multiple, overlapping velocity fields. A presentation of the WISE results on M87 is given elsewhere in these proceedings [22]. In brief, two velocity systems are identified. One has a speed of ∼0.4c and could be associated with an instability pattern or an outer wind. The other has a speed, at larger core distances, of ∼2.3c with strong evidence for acceleration in the inner 2–3 mas. The overlapping systems suggest either stratification of the jet or the combined presence of features following the bulk speed and features indicating patterns in the flow such as shocks, instabilities, or external influences. A plot of of the velocity as a function of core distance of the faster component, that may be tied to the bulk speed, is shown in Figure 5. The acceleration shown is consistent with the results shown in Figure 4c.
Other analysis results were obtained from the WISE velocity field [18] and will only be mentioned briefly here. The speeds show a small difference for the north and south rims of the jet. This can be interpreted as a rotation with a rate of Ω 10 6 yr 1 . Such a rotation rate is consistent with the launch of the observed portion of the jet from a region of the disk about 5 R s from the black hole center. MHD modeling of the acceleration and collimation provides a good fit to the data for a Poynting flux dominated case with equipartition between Poynting and kinetic flux reached at about 3000 R s . Three methods, the sidedness and counterjet speed, the rotation analysis, and the MHD fits, independently give an angle to the line of sight of θ 18 .

5. Long Term Variations

The VLBA 43 GHz data sets span the period from 1999 to 2016 with increasing image quality over time. At least one image is available for most of the years. The images allow changes over years to be detected. Figure 6 shows a selection of 7 of the best images or image stacks from that period. The full set will be given in Walker et al. [17]. The first 3 of these images are stacks (noise-weighted mean) of multiple images from data taken near the marked time. The number of images stacked are 11 for 2007.4, 12 for 1008.1, and 6 for 1010.3. The other four images are from single epoch data but benefit from the significantly higher sensitivity of the upgraded bandwidth on the VLBA.
Sideways motions are seen in the annual images. Lines have been overlayed on each image in Figure 6 that approximate the north and south ridges in 2007. They are meant to make clear the sideways translation of the jet observed in the later epochs. Clearly the images in 2013 and 2015 have the whole body of the jet (both ridges) shifted to the north. The shift north first appears in 2011 (in the full sequence) in the region about 2 to 3 mas from the core. It then propagates outward at an apparent rate that has not been been measured carefully yet, but appears to be ∼5 mas yr 1 or near 1.3c. This is more than half the speed seen in the individual components, suggesting the effect is nearly, but not quite, ballistic, perhaps indicating a change in orientation of the jet launch. Figure 7 shows the position angle, relative to the core, of the transverse center of the jet at a core distance of 3 mas. The figure suggests an oscillation with a time scale of about 9 years superimposed on a global drift, or a much longer oscillation. With less than two full periods, it is too early to tell if the position angle variations are truly periodic, which would suggest precession. An alternative could be quasi-periodic variations in jet direction as has been seen in some 3D GRMHD simulations [23].

6. Summary

A number of conclusions about the M87 jet have been reached based on the 43 GHz VLBA observations. Some of these results have also been reported by other investigators as cited in the discussions above. The main conclusions are:
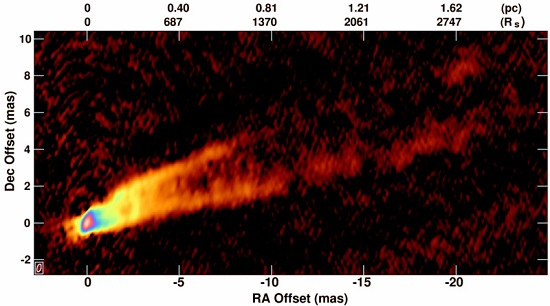
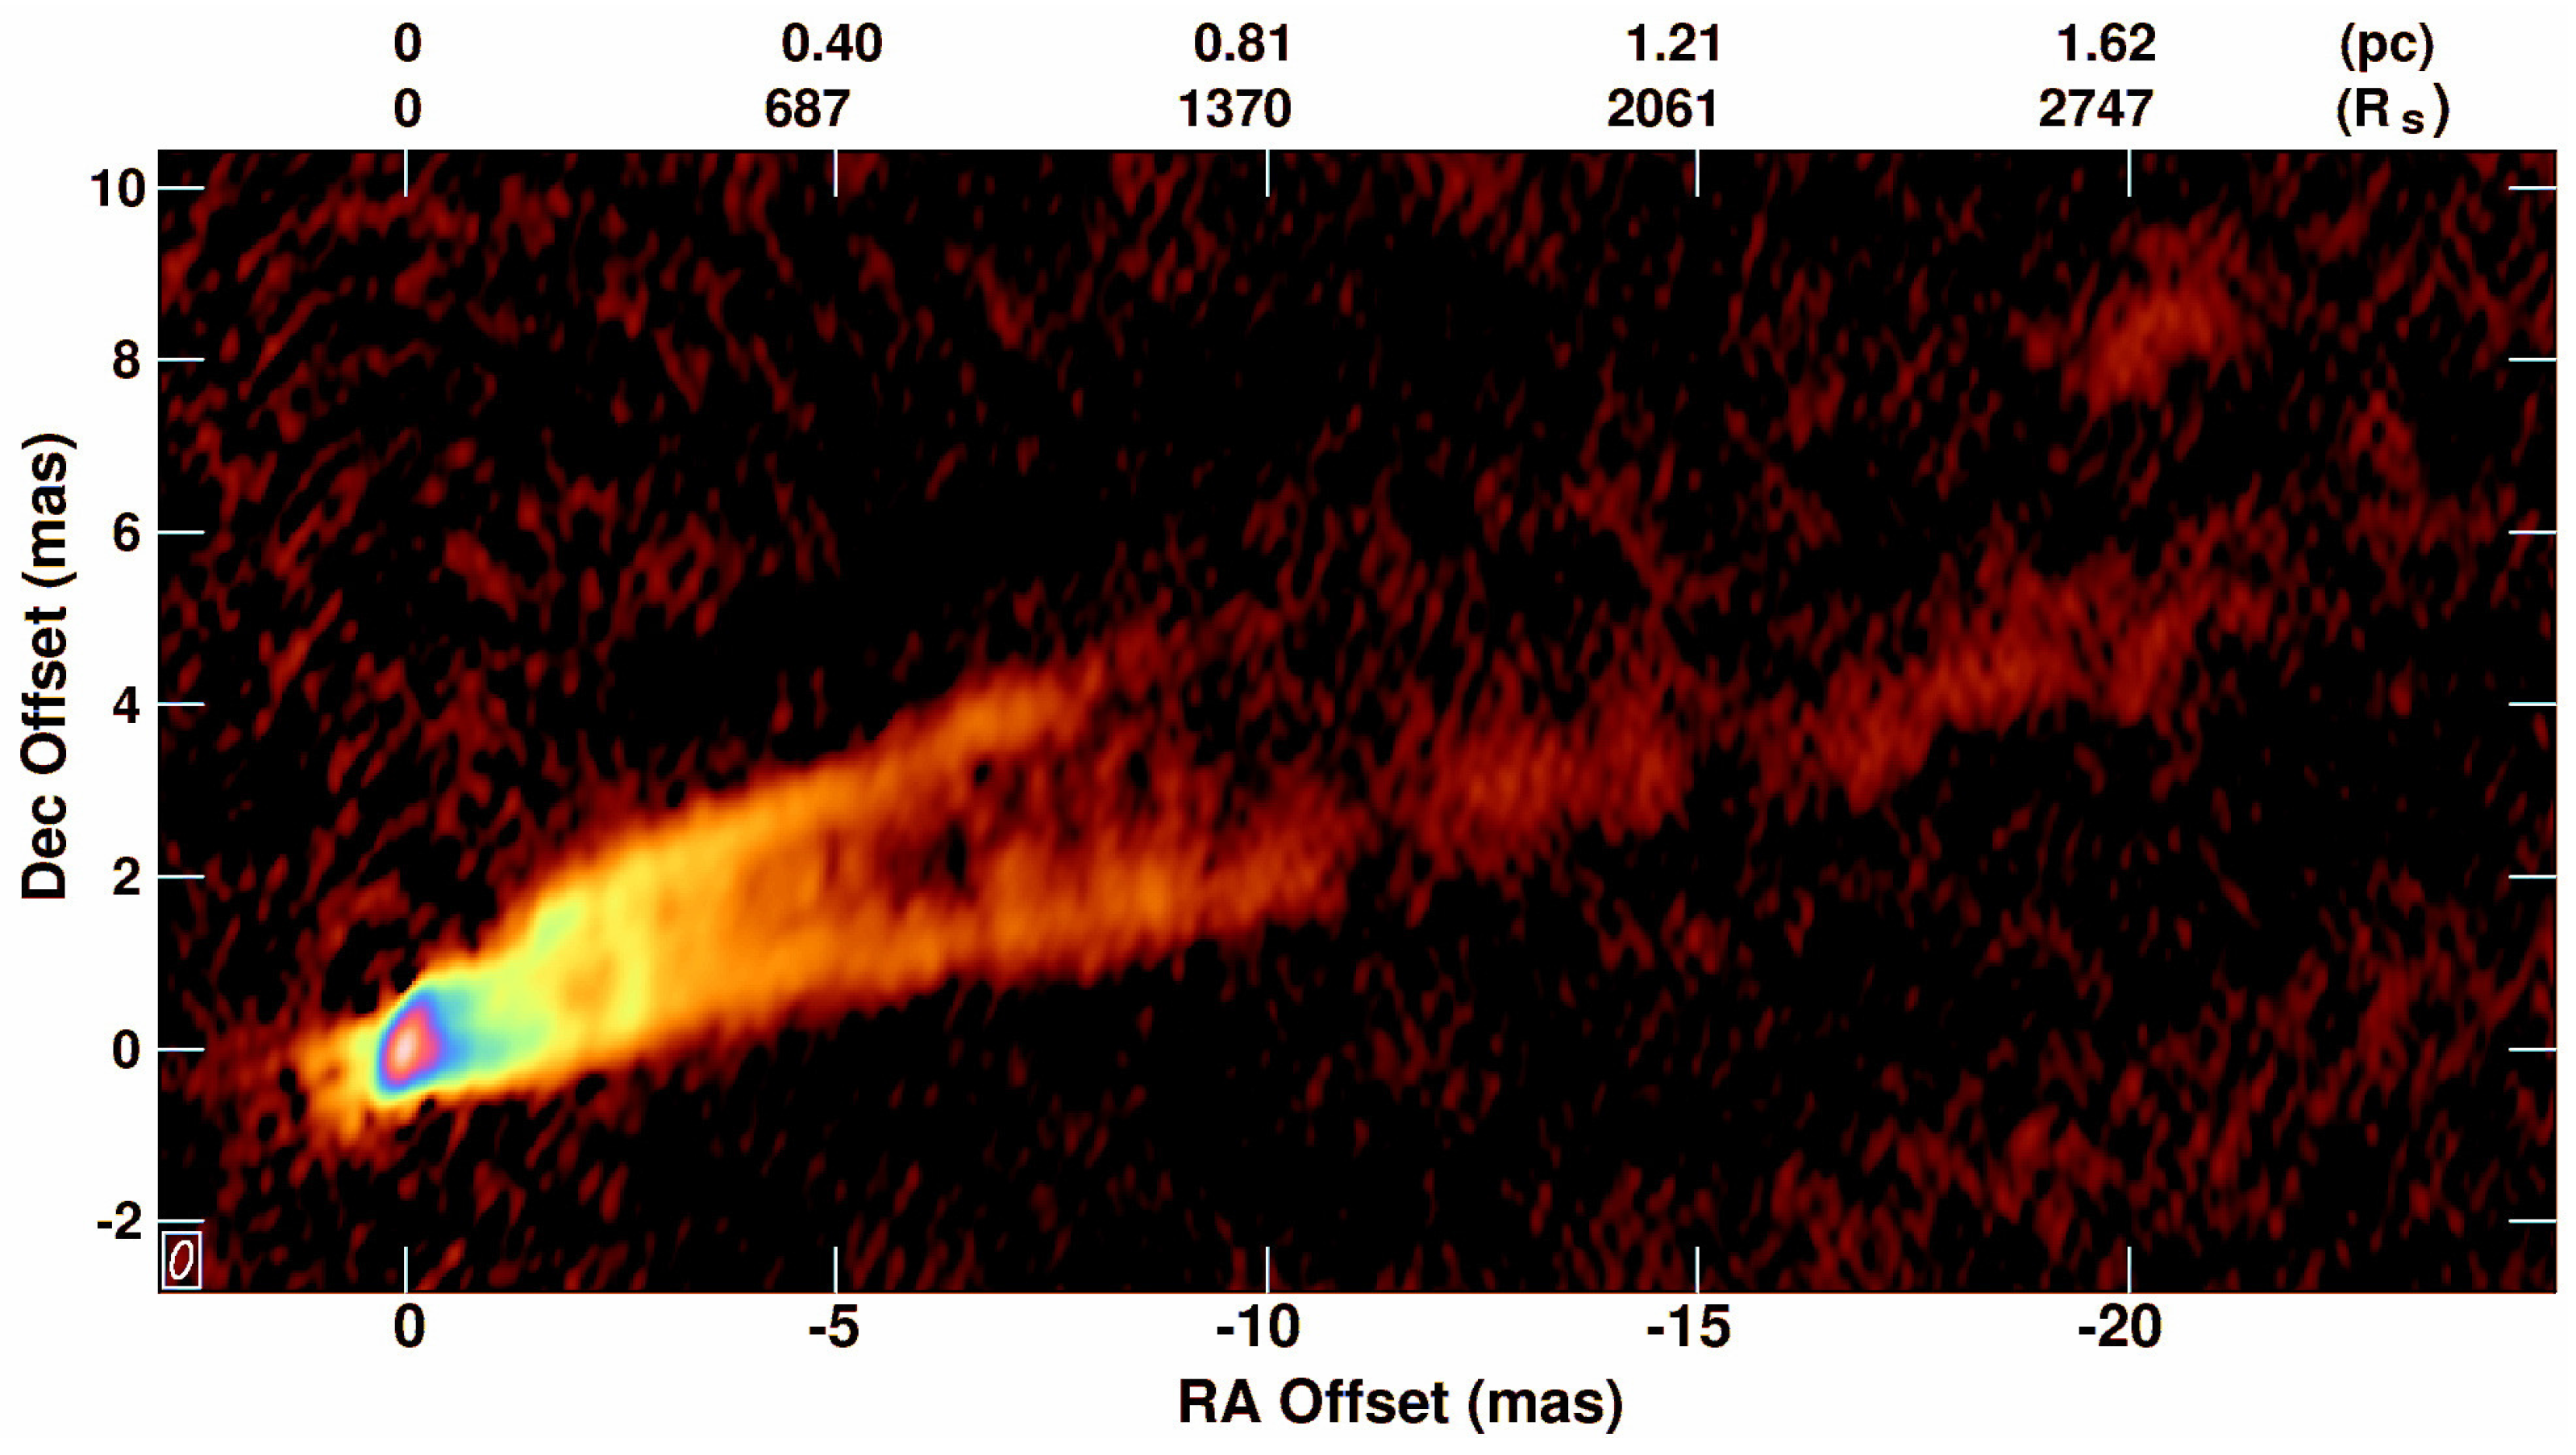
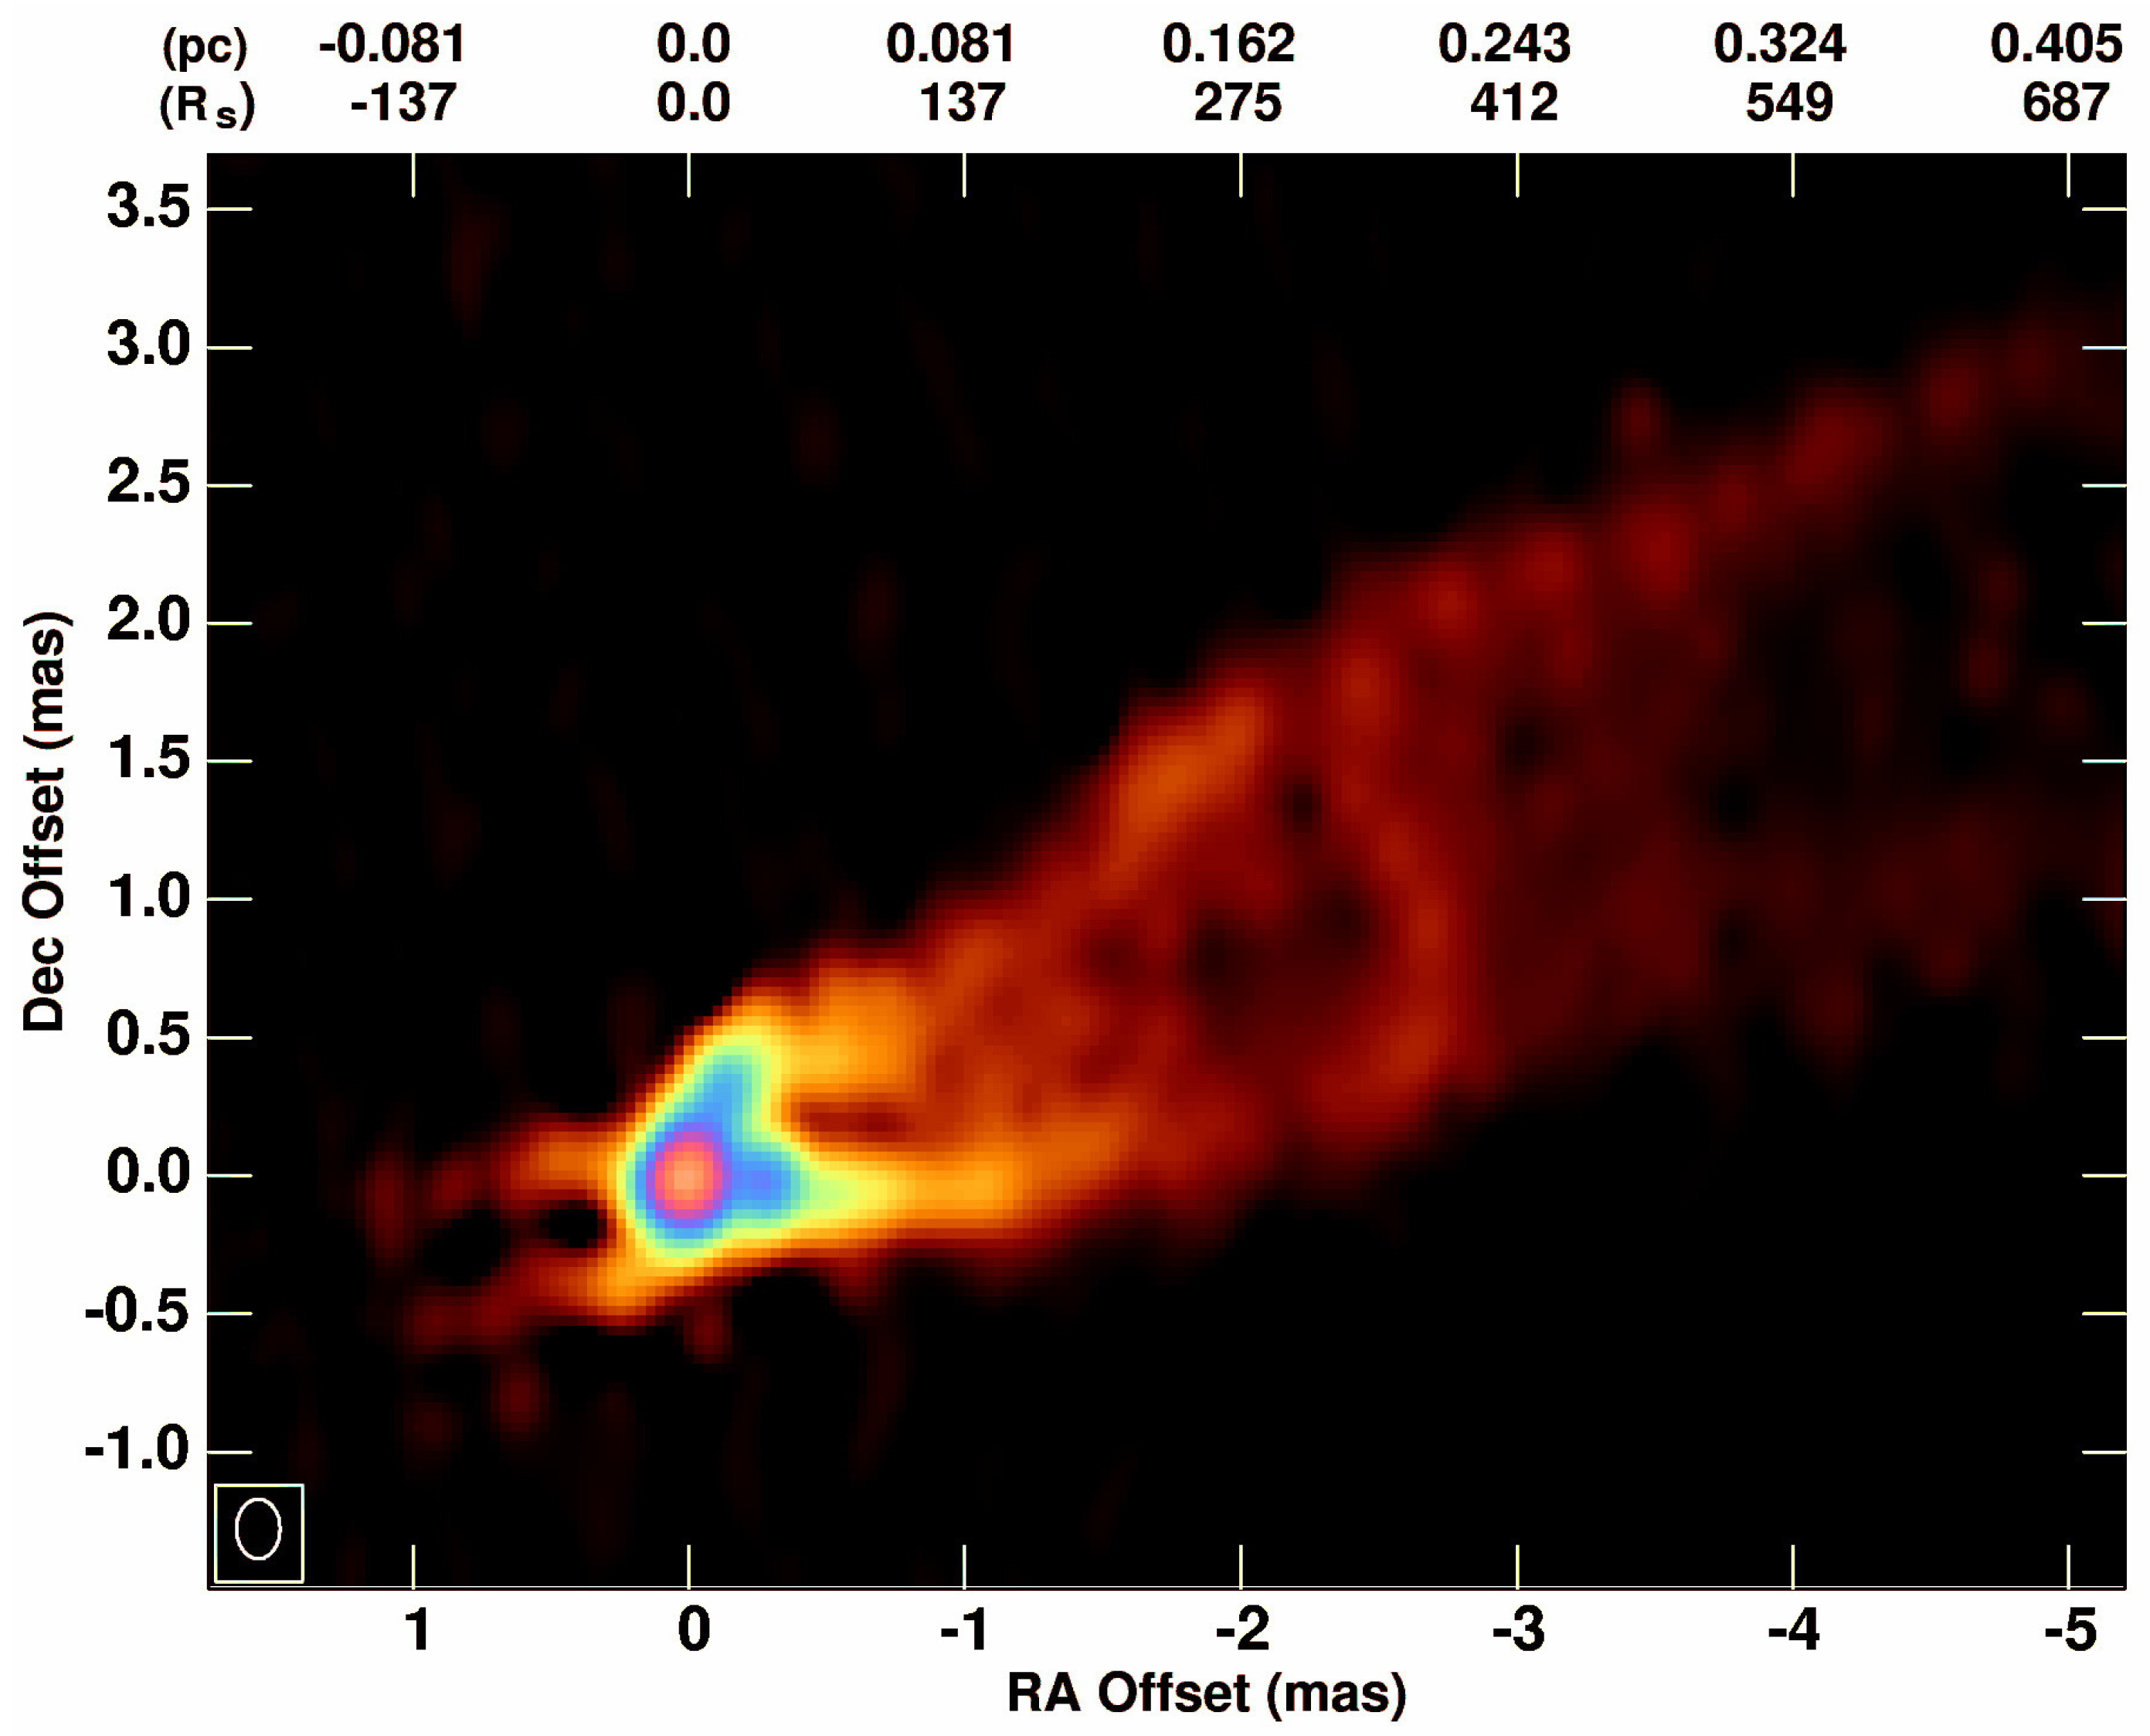
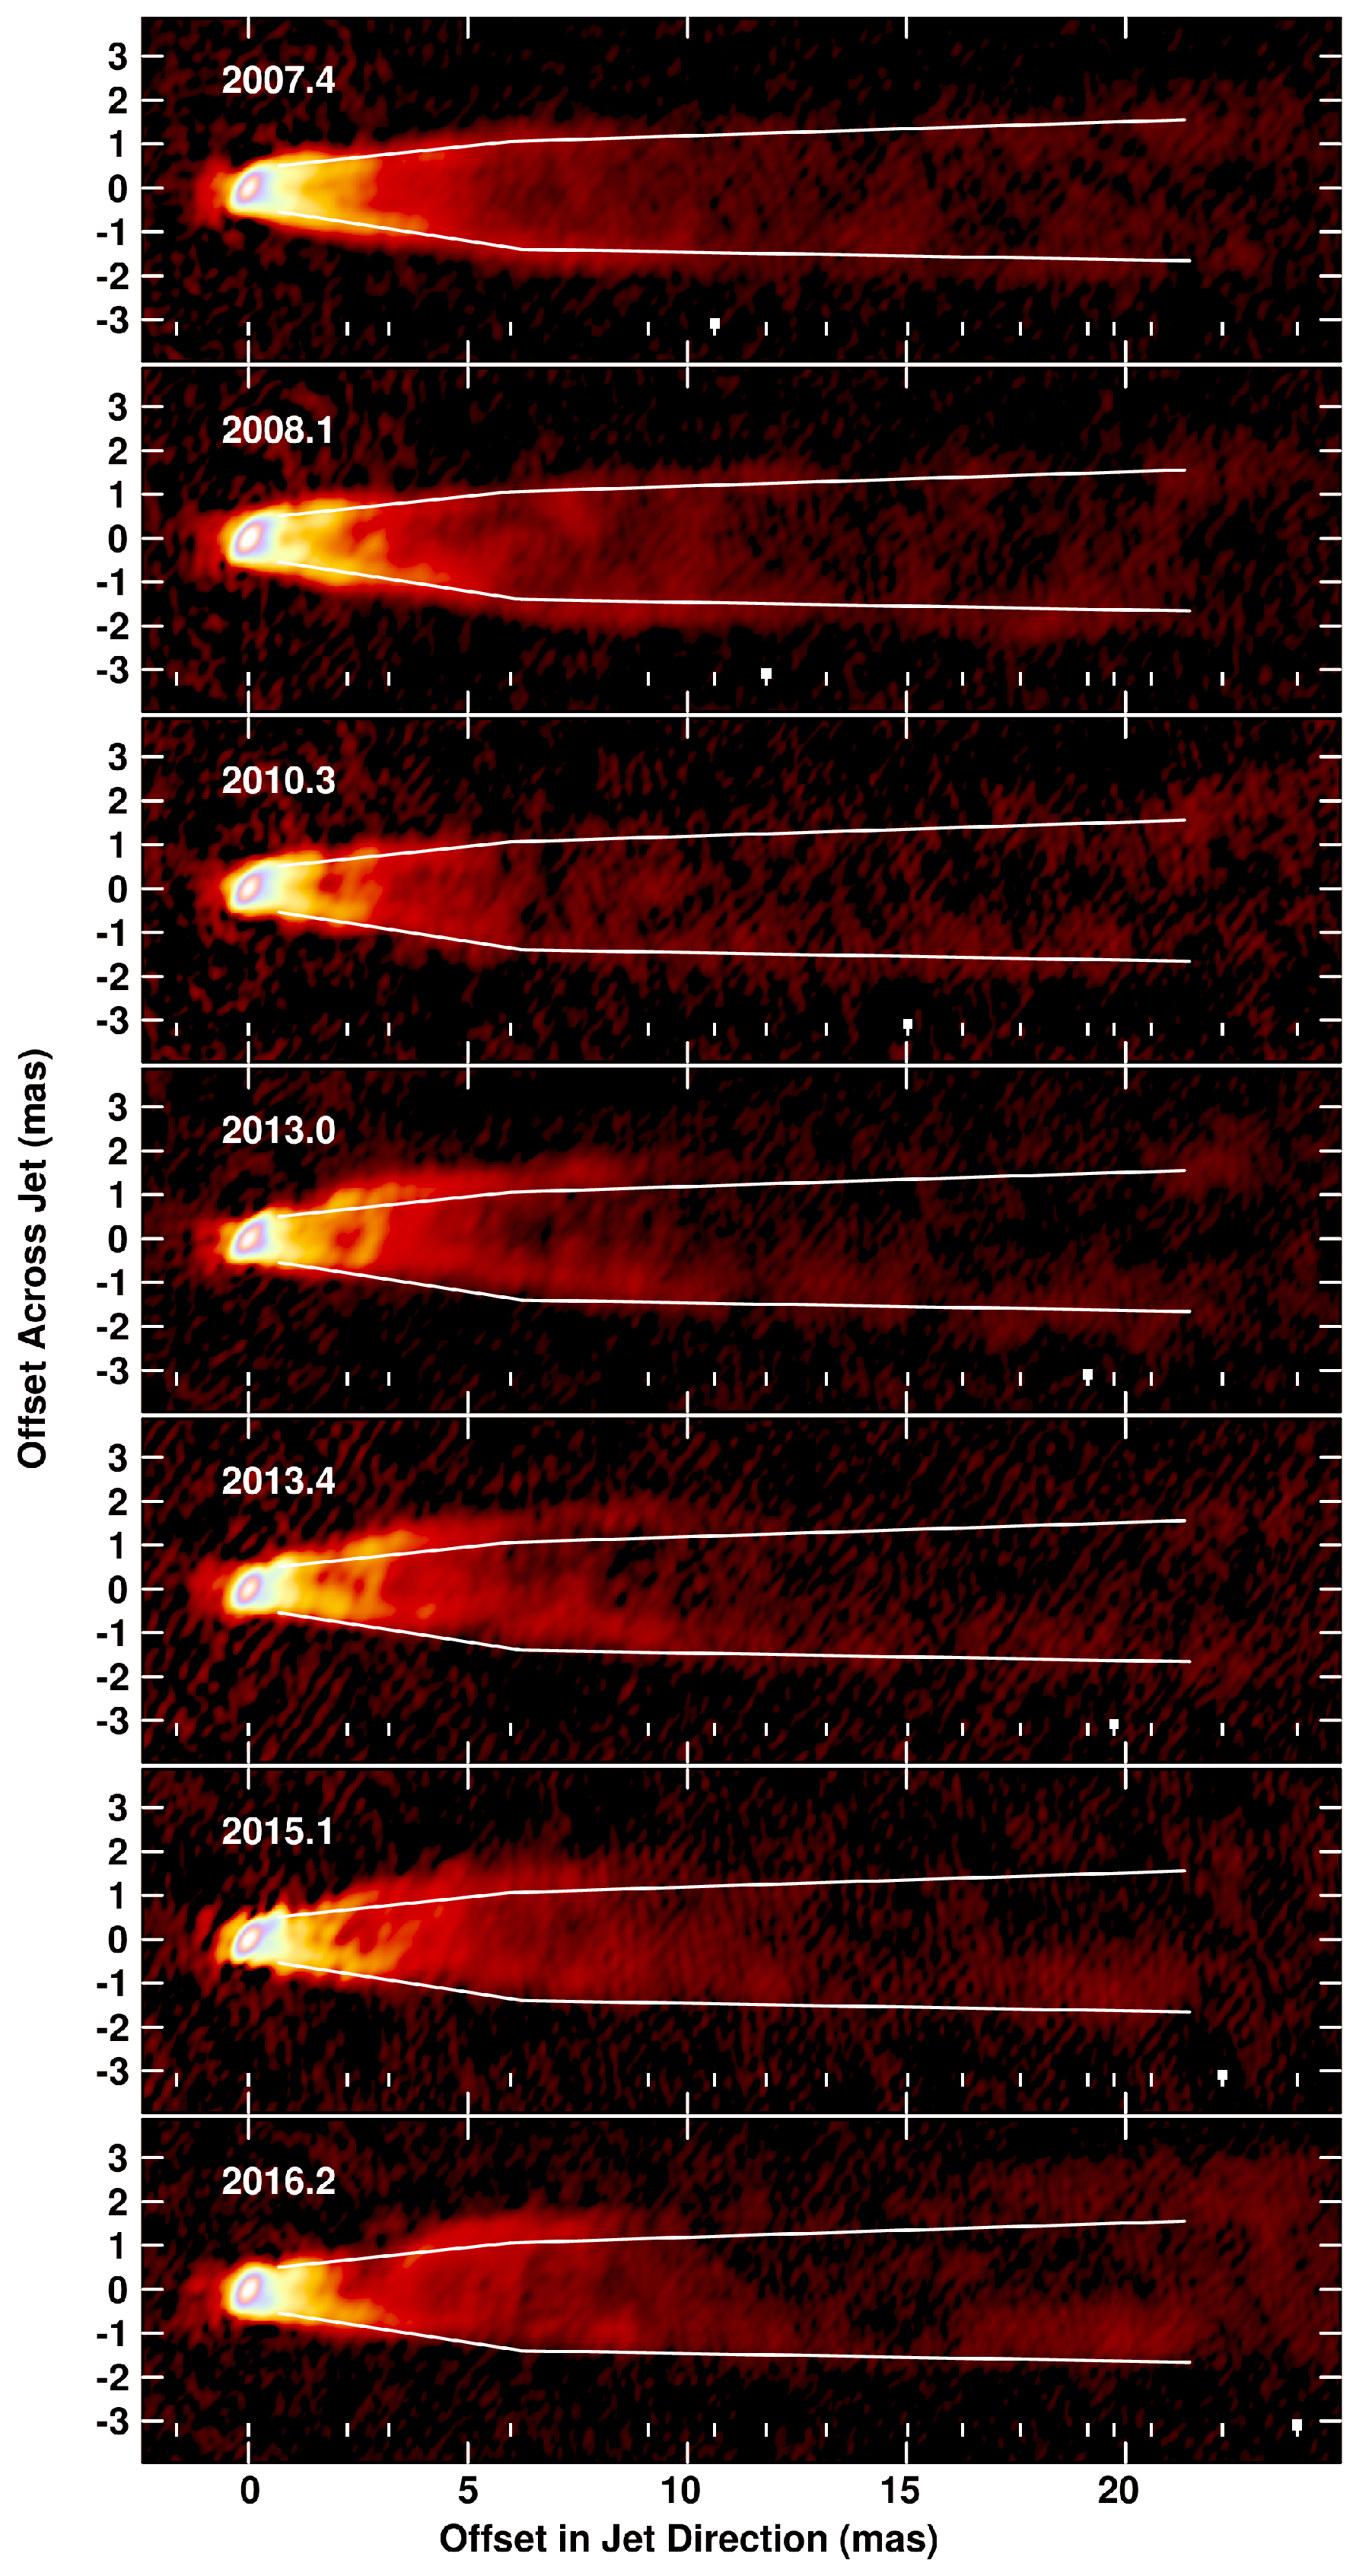
  • The jet has an edge-brightened structure with a wide opening angle at the base and a parabolic shape over the region of these observations.
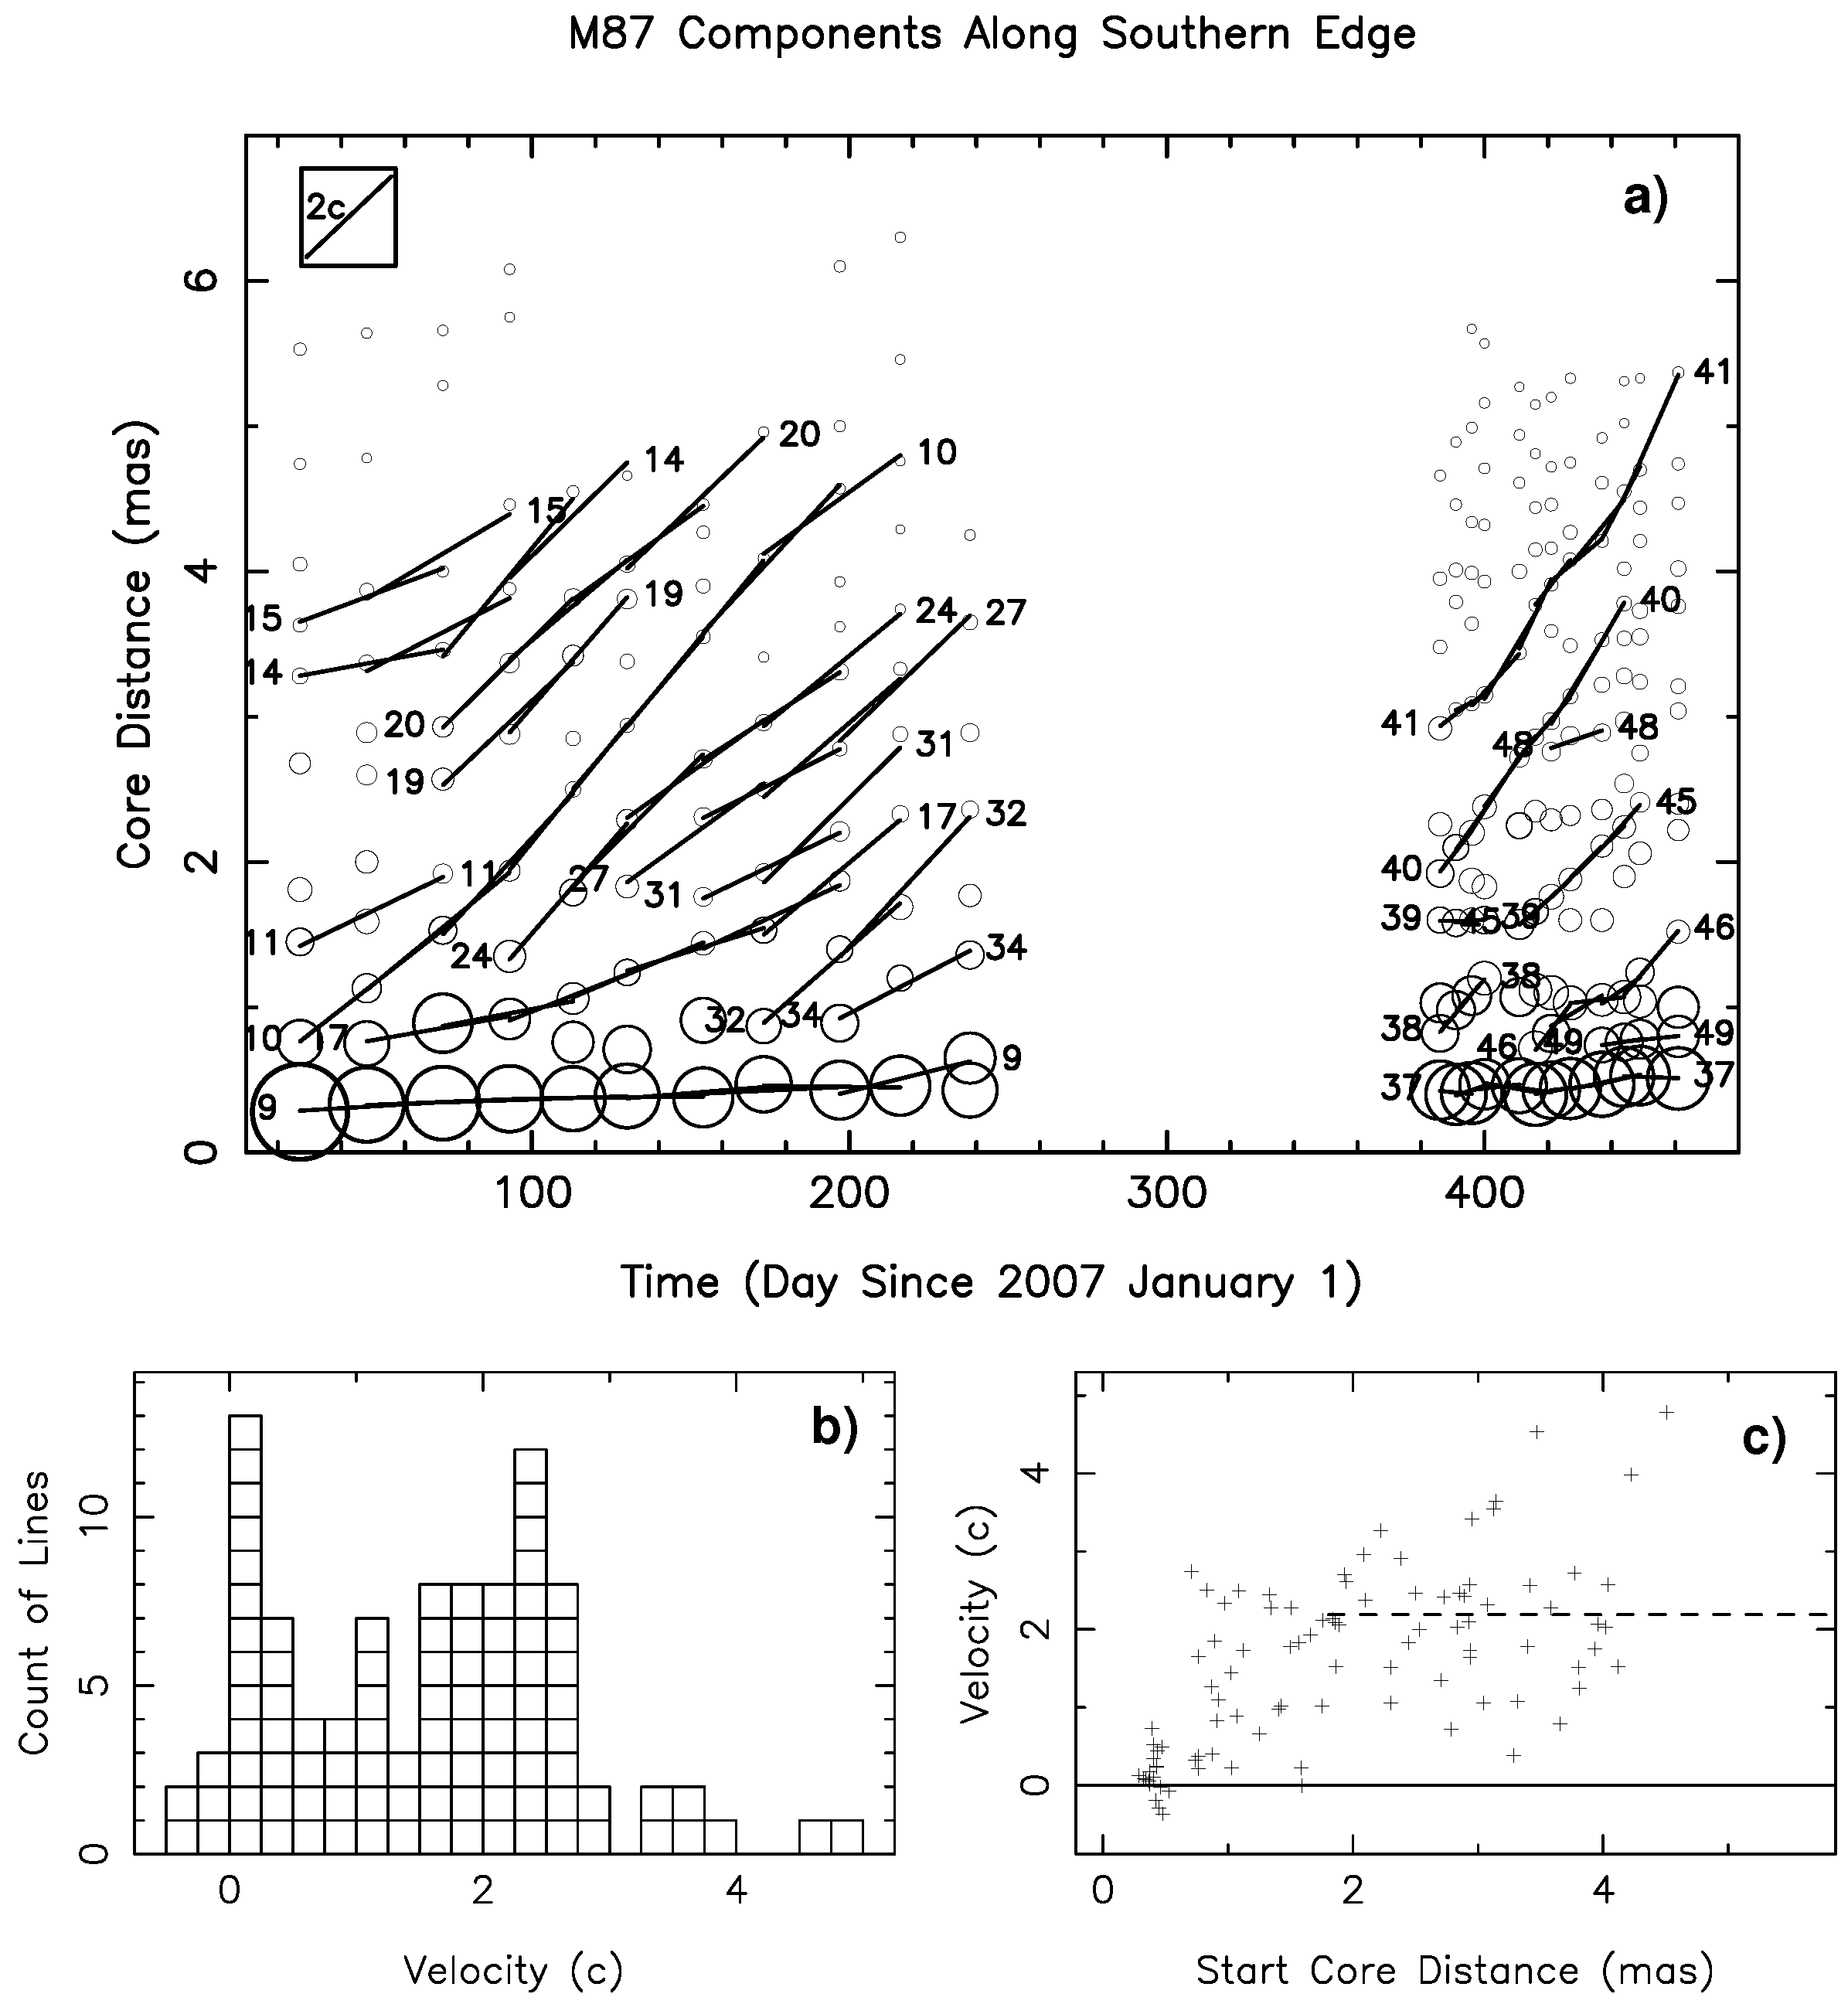
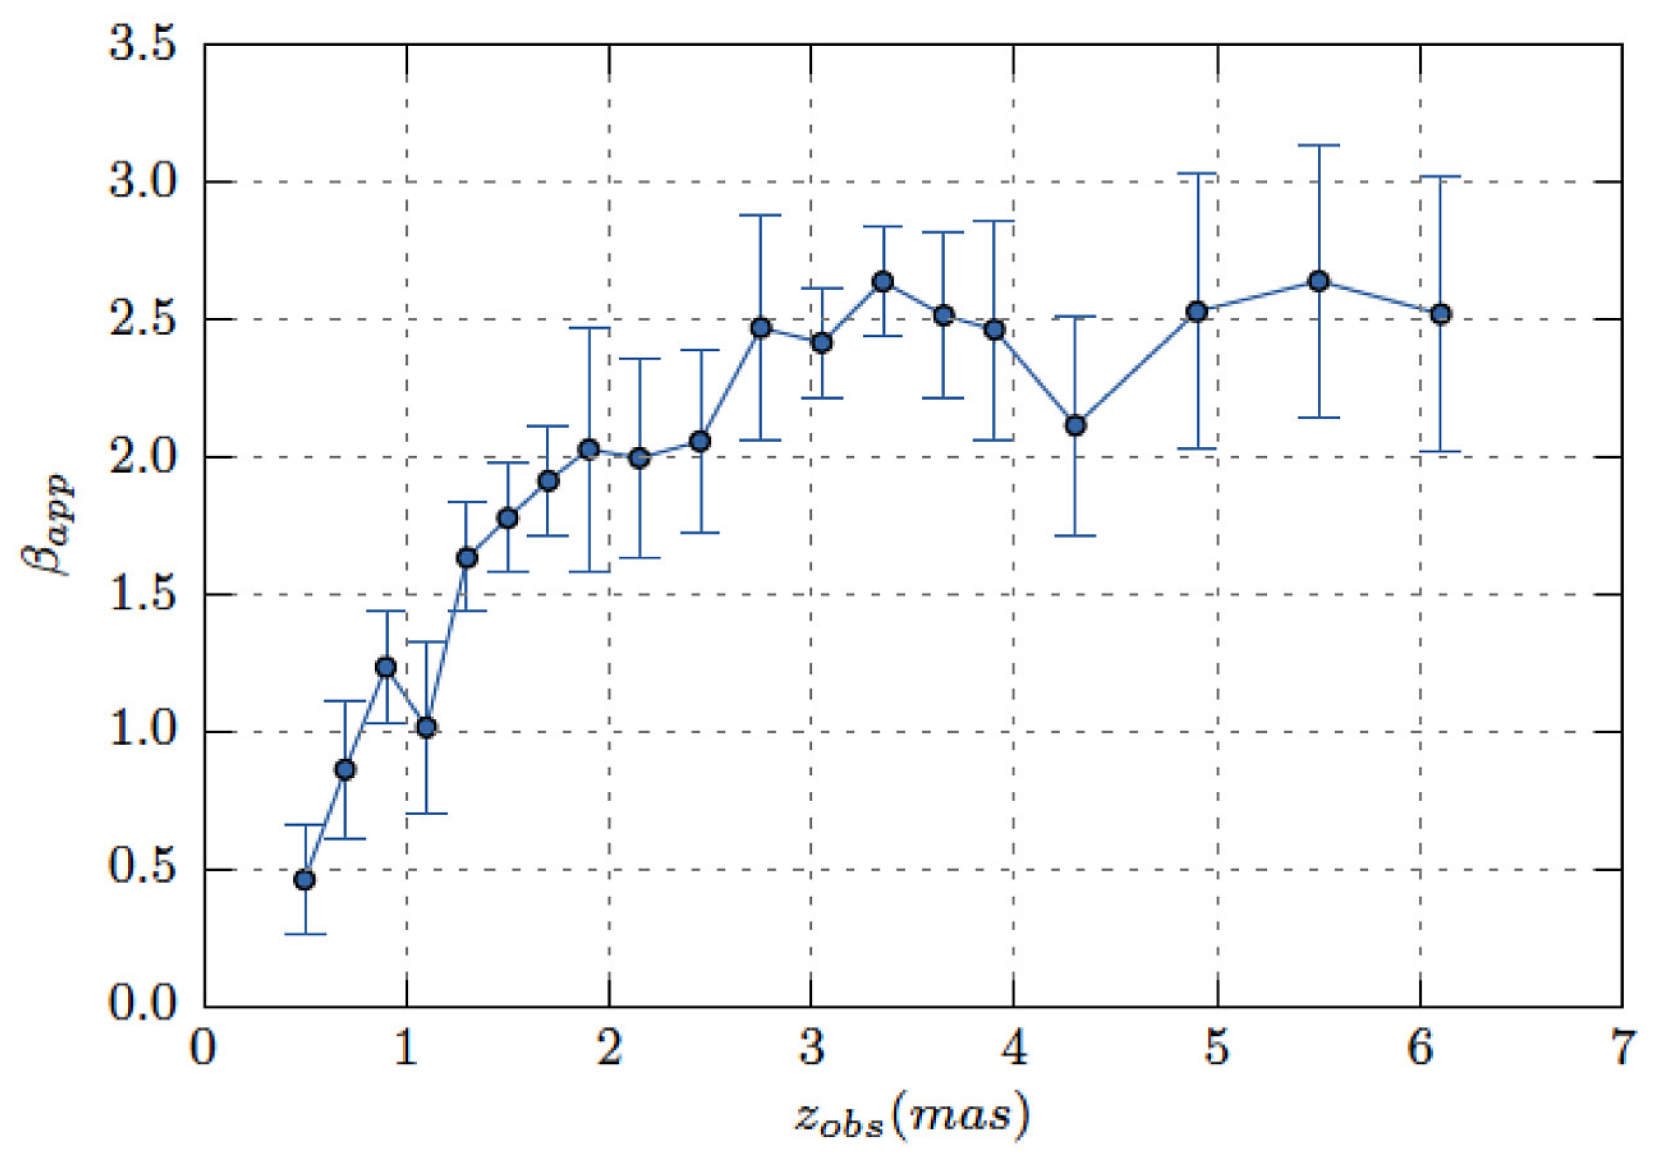
  • The velocity structure is complex, with co-existing slow moving features (∼0.4c) and superluminal features (∼2.3c). These are seen both using traditional methods of following emission peaks and through the WISE analysis.
  • The faster moving system accelerates to near its full speed over the first ∼2 mas, which is ∼0.16 pc (∼274 R s ) in projection or ∼0.52 pc (∼890 R s ) along the jet for a jet angle to the line-of-sight of 18 .
  • There is a counterjet that mirrors the structure of the main jet, but drops rapidly in brightness as would be expected in the acceleration region.
  • An angle to the line-of-sight of 18 is determined by 3 methods based on the WISE results.
  • There is a difference in the measured speed of the northern and southern rims of the jet. A possible implication is rotation of the jet with a rate of about Ω 10 6 s 1 . That, in turn, suggests the jet is launched from the disk at a radius of ∼5 R s .
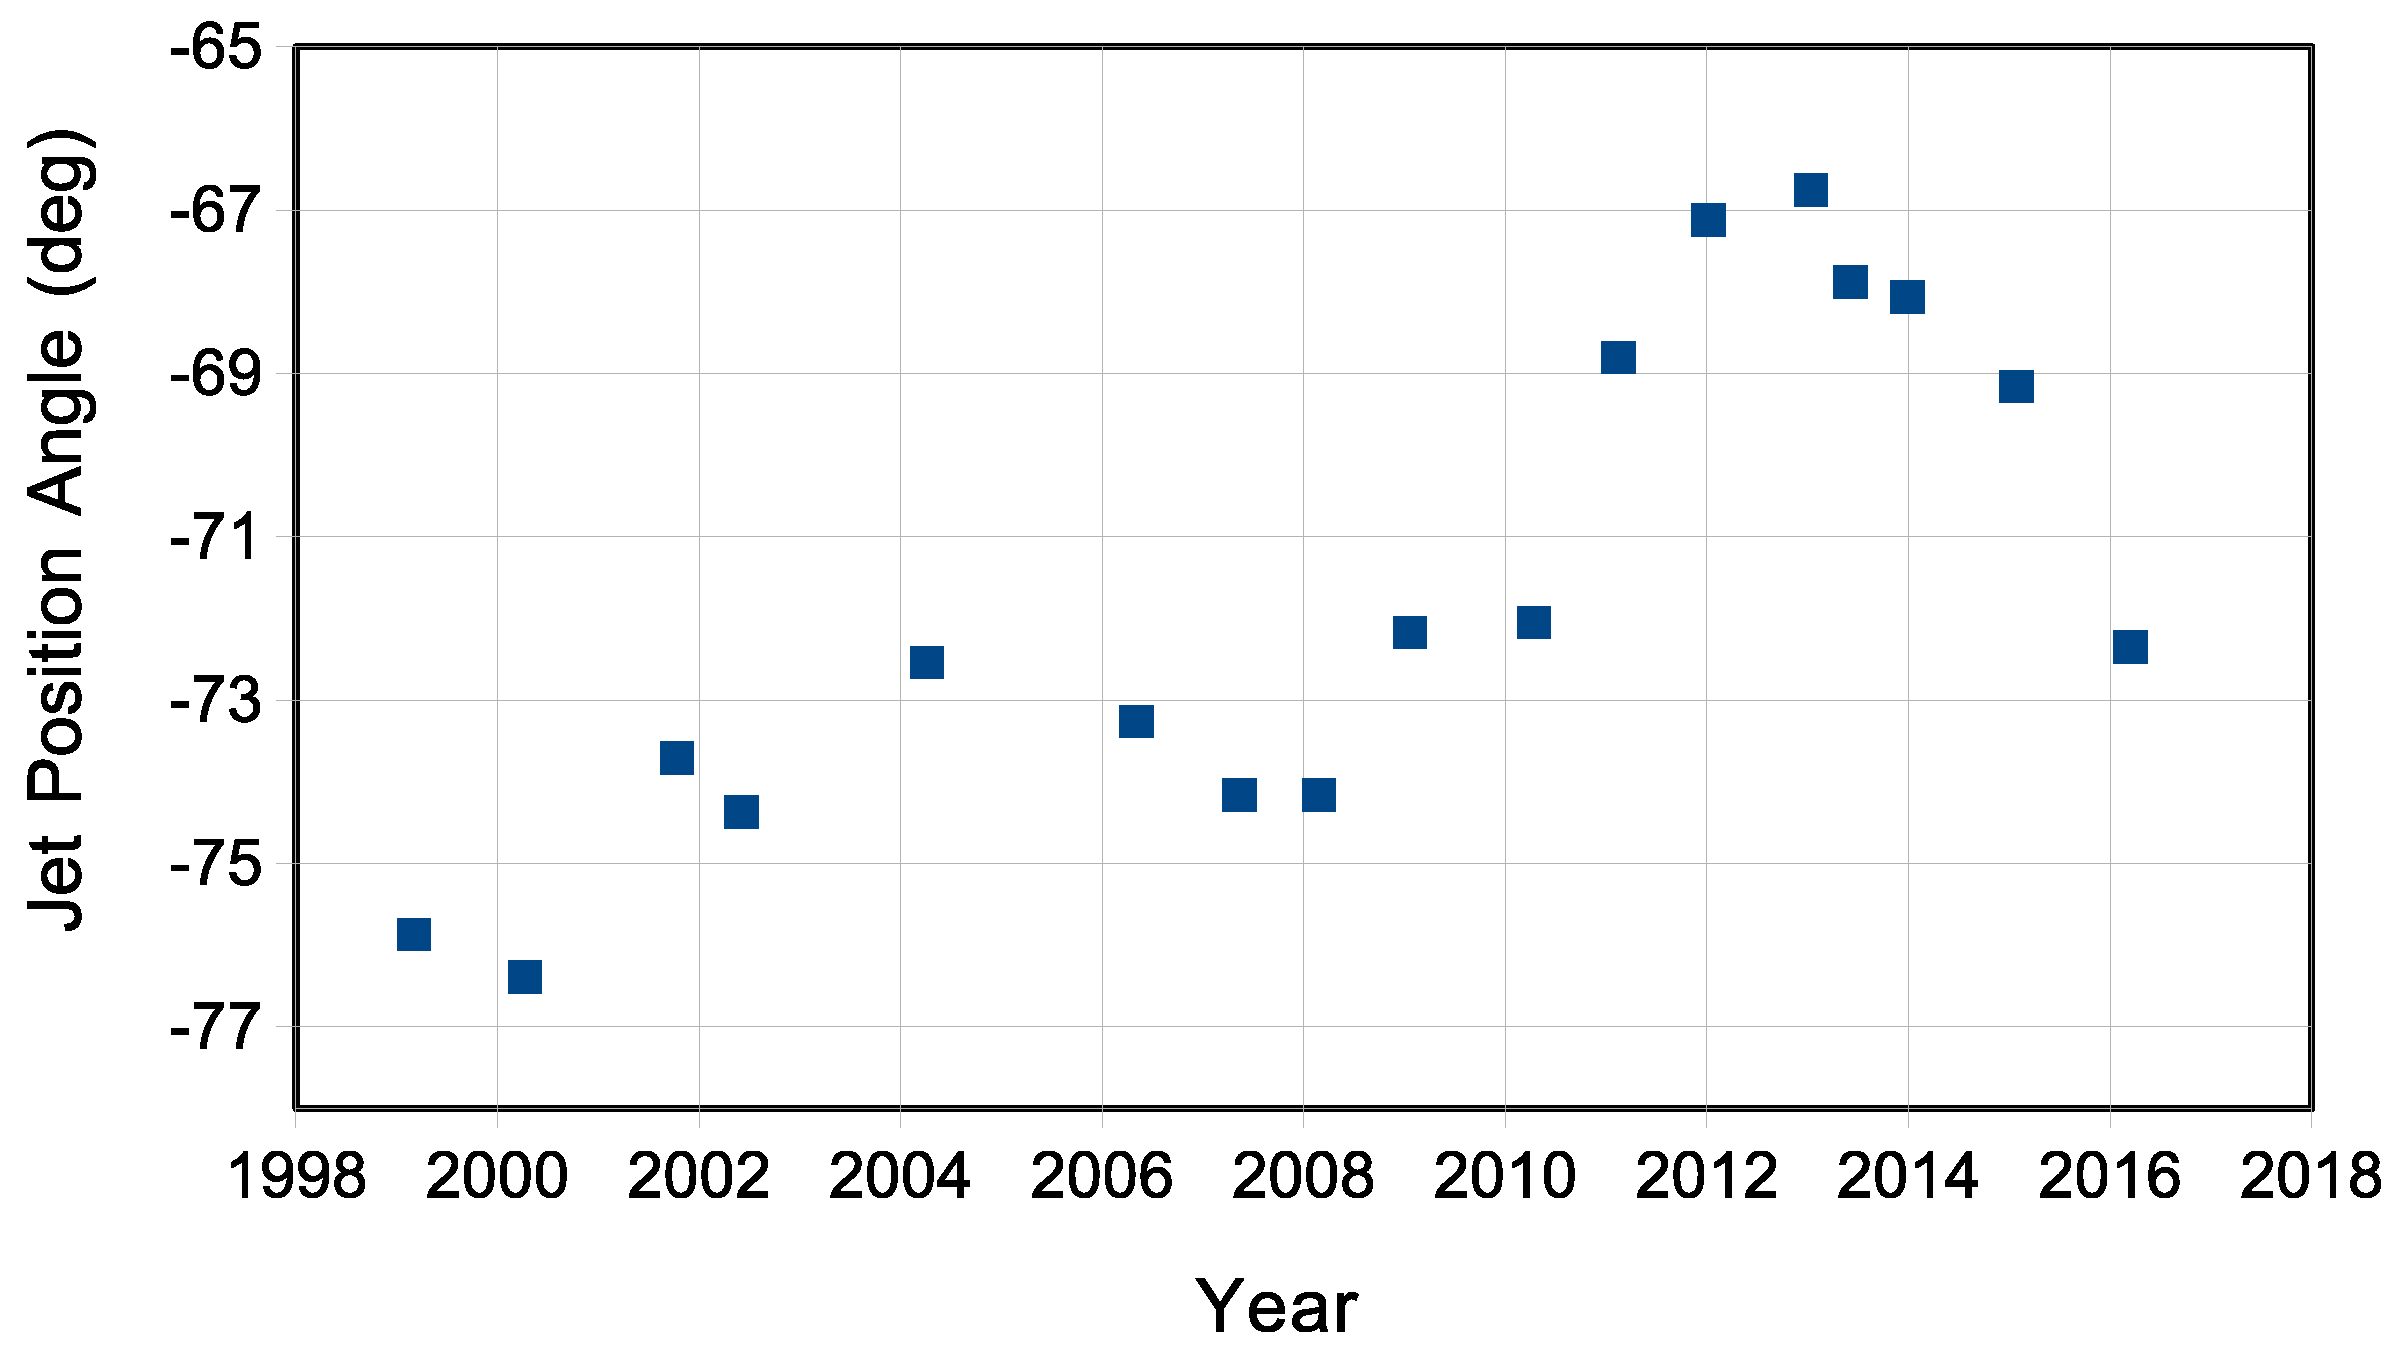
  • Roughly annual observations over 17 years show that there are side-to-side motions of the entire jet with a characteristic time scale of about 9 years.
The WISE analysis is described in detail in Mertens et al. [18]. The main presentation of the images from the M87 43 GHz VLBA project will be in Walker et al. [17]. Both of these works discuss the inferences that can be drawn from the data concerning the nature of the jet in much more detail than has been presented here. Much of the data and the movies can be found at http://www.aoc.nrao.edu/~cwalker/M87/index.html.

Acknowledgments

The Very Long Baseline Array is an instrument of the National Radio Astronomy Observatory, which is a facility of the National Science Foundation operated under cooperative agreement by Associated Universities, Inc. This work made use of the Swinburne University of Technology software correlator [24], developed as part of the Australian Major National Research Facilities Programme and operated under licence. Florent Mertens was supported for this research through a stipend from the International Max Planck Research School (IMPRS) for Astronomy and Astrophysics at the Universities of Bonn and Cologne. Chun Ly is supported by an appointment to the NASA Postdoctoral Program at the Goddard Space Flight Center, administered by Oak Ridge Associated Universities and Universities Space Research Association through contracts with NASA.

Author Contributions

R. Craig Walker, Philip E. Hardee, Fred Davies, Chun Ly, and William Junor are the long-standing group doing the 43 GHz VLBA observations of M87. Major contributions are R. Craig Walker: Planning, observing, processing, and publication. Philip E. Hardee: Theory, interpretation, and writing the main paper. Fred Davies: Data processing and M84-M87 proper motion. Chun Ly: Reduction and writeup of pre-2006 epochs. William Junor: Observion and publication of the earliest epochs. The WISE processing and results are from the thesis of Florent Mertens, supervised by Andrei Lobanov.

Conflicts of Interest

The authors declare no conflict of interest.

References

  1. Mei, S.; Blakeslee, H.P.; Côté, P.; Tonry, J.L.; West, M.J.; Ferrarese, L.; Jordán, A.; Peng, E.W.; Anthony, A.; Merritt, D. The ACS Virgo Cluster Survey. XIII. SBF Distance Catalog and the Three-Dimensional Structure of the Virgo Cluster. Astrophys. J. 2007, 655, 144. [Google Scholar] [CrossRef]
  2. Walsh, J.L.; Barth, A.J.; Ho, L.C.; Sarzi, M. The M87 Black Hole Mass from Gas-dynamical Models of Space Telescope Imaging Spectrograph Observations. Astrophys. J. 2013, 720, 86. [Google Scholar] [CrossRef]
  3. Gebhardt, K.; Adams, J.; Richstone, D.; Lauer, T.R.; Faber, S.M.; Gultenkin, K.; Murpy, J.; Tremaine, S. The Black Hole Mass of M87 from Gemini/NIFS Adaptive Optics Observations. Astrophys. J. 2011, 729, 119. [Google Scholar] [CrossRef]
  4. Napier, P.J.; Bagri, D.S.; Clark, B.G.; Rogers, A.E.E.; Romney, J.D.; Thompson, A.R.; Walker, R.C. The Very Long Baseline Array. Proc. IEEE 1993, 82, 658–672. [Google Scholar] [CrossRef]
  5. Junor, W.; Biretta, J.A.; Livio, M. Formation of the radio jet in M87 at 100 Schwarzschild radii from the central black hole. Nature 1999, 401, 891–892. [Google Scholar]
  6. Ly, C.; Walker, R.C.; Wrobel, J.M. An Attempt to Probe the Radio Jet Collimation Regions in NGC 4278, NGC 4374 (M84), and NGC 6166. Astrophys. J. 2004, 127, 119–124. [Google Scholar] [CrossRef]
  7. Ly, C.; Walker, R.C.; Junor, W. High-frequency VLBI Imaging of the Jet Base of M87. Astrophys. J. 2007, 660, 200–205. [Google Scholar] [CrossRef]
  8. Walker, R.C.; Ly, C.; Junor, W.; Hardee, P.E. A VLBA Movie of the Jet Launch Region in M87. J. Phys. Conf. 2008, 131, 012053. [Google Scholar] [CrossRef]
  9. Kovalev, Y.Y.; Lister, M.L.; Cohen, D.C.; Kellermann, K.I. The Inner Jet of the Radio Galaxy M87. Astrophys. J. 2007, 668, L27. [Google Scholar] [CrossRef]
  10. Hada, K.; Kino, M.; Doi, A.; Nagai, H.; Honma, M.; Akiyama, K.; Tazaki, F.; Lico, R.; Giroletti, M.; Giovannini, G.; et al. High-Sensitivity 86GHz (3.5mm) VLBI Observations of M87: Deep Imaging of the Jet Base at a 10 Schwarzschild-Radius Resolution. Astrophys. J. 2016, 817, 131. [Google Scholar] [CrossRef]
  11. Asada, K.; Nakamura, M. The Structure of the M87 Jet: A Transition from Parabolic to Conical Streamlines. Astrophys. J. 2012, 745, L28. [Google Scholar] [CrossRef]
  12. Marscher, A.P.; Jorstad, S.G.; D’Arcangelo, F.D.; Smith, P.S.; Williams, G.G.; Larionov, V.M.; Oh, H.; Olmstead, A.R.; Aller, M.F.; Aller, H.D.; et al. The inner jet of an active galactic nucleus as revealed by a radio-to-γ-ray outburst. Nature 2008, 452, 966–969. [Google Scholar] [CrossRef] [PubMed]
  13. Hada, K.; Doi, A.; Kino, M.; Nagai, H.; Hagiwara, Y.; Kawaguchi, N. An origen of the radio Jet in M87 at the location of the central black hole. Nature 2011, 477, 185–187. [Google Scholar] [CrossRef] [PubMed]
  14. Asada, K.; Nakamura, M.; Doi, A.; Nagai, H.; Inoue, M. Discovery of Sub- to Superluminal Motions in the M87 Jet: An Implication of Accleeration from Sub-relativistic to Relativistic Speeds. Astrophys. J. 2014, 781, L2. [Google Scholar] [CrossRef]
  15. Biretta, J.A.; Sparks, W.B.; Macchetto, F. Hubble Space Telescope Observations of Superluminal Motion in the M87 Jet. Astrophys. J. 1999, 520, 621. [Google Scholar] [CrossRef]
  16. Cheung, C.C.; Harris, D.E.; Stawarz, Ł. Superluminal Radio Features in the M87 Jet and the Site of Flaring TeV Gamma-Ray Emission. Astrophys. J. 2007, 663, L65. [Google Scholar] [CrossRef]
  17. Walker, R.C.; Hardee, P.E.; Davies, F.; Ly, C.; Junor, W. Observations of the Structure and Dynamics of the Inner M87 Jet. 2016; in preparation. [Google Scholar]
  18. Mertens, F.; Lobanov, A.P.; Walker, R.C.; Hardee, P.E. Kinematics of the jet in M87 on scales of 100–1000 Schwarzschild radii. Astron. Astrophys. 2016, in press. [Google Scholar] [CrossRef]
  19. Acciari, V.A.; The VERITAS Collaboration; the VLBA 43 GHz M87 Monitoring Team; the H.E.S.S. Collaboration; the MAGIC Collaboration. Radio Imaging of the Very-High-Energy Gamma-Ray Emission Region in the Central Engine of a Radio Galaxy. Sci. Mag. 2009, 325, 444. [Google Scholar]
  20. Hada, K.; Giroletti, M.; Kino, M.; Giovannini, G.; D’Ammando, F.; Cheung, C.C.; Beilicke, M.; Nagai, H.; Doi, A.; Akiyama, K. A Strong Radio Brightening at the Jet Base of M87 During the Elevated Very High Energy Gamma-Ray State in 2012. Astrophys. J. 2014, 788, 165. [Google Scholar] [CrossRef]
  21. Mertens, F.; Lobanov, A. Wavelet-based decomposition and analysis of structural patterns in astronomical images. Astron. Astrophys. 2015, 574, A67. [Google Scholar] [CrossRef]
  22. Lobanov, A. What’s There in Jets: Shocks and Threads or Cords and Frets? Galaxies 2016. in preparation. [Google Scholar]
  23. Tchekovskoy, A.; Narayan, R.; McKinney, J.C. Efficient generation of jets from magnetically arrested accretion on a rapidly spinning black hole. Mon. Not. R. Astron. Soc. 2011, 418, L79. [Google Scholar] [CrossRef]
  24. Deller, A.; Brisken, W.F.; Phillips, C.J.; Morgan, J.; Alef, W.; Cappallo, R.; Middelberg, E.; Romney, J.; Rottmann, H.; Tingay, S.J. DiFX-2: A More Flexible, Efficient, Robust, and Powerful Software Correlator. Publ. Astron. Soc. Pac. 2011, 123, 275. [Google Scholar] [CrossRef]
Figure 1. An image of M87 made with the Very Long Baseline Array (VLBA) at a frequency of 43 GHz based on data taken on 12 January 2013 using the upgraded VLBA at a recording bit rate of 2 Gbps. The axes are in mas from the brightest feature. Above, the axis ticks are labeled in parsecs and in Schwarzschild radii. The convolving beam is 0.43 × 0.21 mas elongated along position angle 16 .
Galaxies 04 00046 g001
Figure 2. An image of the inner portions of M87 based on the same 12 January 2013 data used for Figure 1, but made with uniform weighting to maximize resolution, and then superresolved by 30% in the N-S direction (convolved with a Gaussian beam that is 30% smaller than the central peak of the point spread function). The convolving beam used is 0.158 × 0.215 mas elongated along position angle 0 . The axes are mas from the core. The higher resolution helps delineate the structure close to the core, and emphasizes the symmetry between the jet and counterjet. Note that the sharp kink in the northern ridge at about 0.6 mas from the core is not a lasting feature of the jet.
Galaxies 04 00046 g002
Figure 3. An example VLBA image of M87 at 43 GHz. This one is based on data taken on 23 April 2007. The lowest contours are at –1, 1, 2, 2.83, 4 mJy/beam increasing from there by factors of 2 . The convolving beam is 0.43 × 0.21 mas elongated along position angle 16 . The crosses mark positions of local maxima identified visually. Images like this were created, and examined for local maxima, for 23 epochs in 2007 and 2008. The numbers identify maxima that visual examination suggests can be identified at multiple, sequenctial epochs. All of the images will be shown in Walker et al. [17].
Galaxies 04 00046 g003
Figure 4. The data, based on visual determination of component positions and of associations of components between epochs, that was used to characterize the component speeds along the southern edge of the jet. Similar data for the northern edge will be given in reference [17]. (a) The symbols show the positions of the peaks such as those shown in Figure 3 with the symbol sizes (areas) proportional to peak flux density. The numbers indicate components that were visually identified to correspond from epoch to epoch. The lines represent fits for position and speed for groups of three peaks for the presumed same feature from adjoining epochs; (b) A histogram of speeds from the three-peak fits; (c) The speeds from the three-peak fits as a function of distance from the core of the first peak.
Galaxies 04 00046 g004
Figure 5. The speed of the faster system found using the Wavelet Image Segmentation and Evaluation (WISE) analysis as a function of distance from the core [18].
Galaxies 04 00046 g005
Figure 6. A montage of the seven best images or image stacks from the set of roughly annual VLBA 43 GHz images of M87 made between 1999 and 2016. The convolving beam is the same as for Figure 1 and the images have been rotated in position angle by 18 . The lines overlaying the images mark approximately the ridge line of the bright edges of the jet in 2007. The ticks at the bottom of each frame show where the frame (bold tick) is in the full sequence. Those ticks are especially useful in the movie available at the URL listed at the end of the summary and eventually in Walker et al. [17].
Galaxies 04 00046 g006
Figure 7. The time history of the position angle (counterclockwise from north) of a line between the core and the transverse midpoint of the jet at a core distance of 3 mas. The angle is measured directly from the images, which show the jet in projection. The points are suggestive of a 9-year cycle superimposed on a drift.
Galaxies 04 00046 g007

