Article

Gamma-Ray Variability Induced by Microlensing on Intermediate Size Structures in Lensed Blazars

Department of Astrophysics, University of Łódź, Lodz PL-90236, Poland
*
Author to whom correspondence should be addressed.
Galaxies 2016, 4(3), 20; https://doi.org/10.3390/galaxies4030020
Submission received: 12 July 2016 / Revised: 24 August 2016 / Accepted: 25 August 2016 / Published: 31 August 2016
(This article belongs to the Special Issue Blazars through Sharp Multi-wavelength Eyes)

Abstract

:
Changes of the magnification ratio of images in a lensed blazar, caused by microlensing on individual stars, have been proposed as a probe of the size and velocity of the emission region in the lensed source. We study whether similar changes in the magnification ratio can be caused by the microlensing on the intermediate size structures in the lensing galaxy, namely stellar clusters and giant molecular clouds. Our numerical simulations show that changes in the magnification ratio of two images with similar time scales (as seen in QSO B0218+357) can be obtained for relativistically-moving emission regions with sizes up to 0.01 pc in the case of microlensing on clumps in giant molecular clouds.

1. Introduction

A large mass located between a source of electromagnetic radiation and the observer will bend the trajectories of the photons and thus distort the observed image. In particular, the effect known as strong gravitational lensing leads to the occurrence of multiple images of the same source. The radiation forming different images of the source will travel along different paths, undergoing a different time delay. As a consequence, in the case of time variable sources, the observer will experience the same variability pattern from the various images, but with a time delay dependent on the geometry of the source–lens–observer system.
The strong gravitational lensing on the mass distribution of the whole galaxy may be accompanied by additional effects due to individual stars in the lensing galaxy (i.e., microlensing). Microlensing affects the images on much smaller angular scales, not observable with imaging instruments, but results in changes of the magnification that can be observed (e.g., [1]). As this effect is sensitive to small changes in the size and location of the emission region, it can be used to study the morphology of sources at unprecedented distance scales. Recently, microlensing was invoked to explain the time variability displayed in the GeV band by the known gravitationally-lensed blazars PKS1830-211 [2,3] and QSO B0218+357 [4]. These authors interpret the changes in the magnification ratio of the leading and trailing component as microlensing due to individual stars in the lensing galaxy. Based on this, they put strong limits on the size of the emission region (≲ 10 14 10 15 cm) and the relative projected speed of the source and the lens, on the order of 10 3 km/s. Those findings are, however, at odds with the standard model of blazars, where the high-energy emission is generated in a compact region moving at a relativistic velocity along the jet. The relativistic velocity is in fact needed to explain the observed properties of blazars, such as high luminosity during flares, fast intrinsic variability, and, indirectly, also the lack of strong absorption of TeV gamma rays.
QSO B0218+357 is a blazar located at a redshift of 0 . 944 [5]. It is gravitationally lensed by B0218+357G [6], most probably a spiral galaxy seen face-on, located at a redshift of 0 . 68 [7]. Two distinct components A and B with an angular separation of only 335 mas and an Einstein ring of a similar size are visible in the radio image of QSO B0218+357 [8]. They are separated by a time delay of 10 . 5 ± 0 . 4 days (B lagging behind A), showing a flux ratio of the A and B components of μ A / μ B 3 . 6 [9]. A similar value for the time delay, but with a larger uncertainty of ∼1.5 days, was obtained using radio measurements over the same epoch [10]. The ratio of magnified fluxes varies from 3.7 to 2.6 over the frequency range 15.35 GHz to 1.65 GHz [11], presumably due to free–free absorption [12]. Moreover, [13] claimed a small amplitude chromatic variability of the flux ratio at radio frequencies on time scales of tens of days. In 2012, QSO B0218+357 underwent a high state in gamma rays, with a series of outbursts registered by the Fermi Large Area Telescope (LAT) in the GeV range, allowing [14] to measure the gamma-ray delay of 11 . 46 ± 0 . 16 days. Decomposition of the emission into two separated components, delayed by ∼11.5 days, revealed changes in their relative magnification ratio [4].
We investigated whether the observed variability in the magnification ratio of both components observed at GeV energies can be explained by microlensing on larger structures than stars [15]. We studied open clusters (OC), globular clusters (GC), and giant molecular clouds (GMC) as possible lenses during the 2012 high state of QSO B0218+357. The size of such objects would result in much larger regions in the source plane being magnified by a single microlensing event than for the case of individual stars. Thus, microlensing on intermediate size objects (if plausible) can relax the strong constraints on the size of the gamma-ray emission region and its velocity, making the interpretation consistent with the standard paradigm of blazars. In this contribution, we summarize our findings recently published in [15].

2. Experimental Section
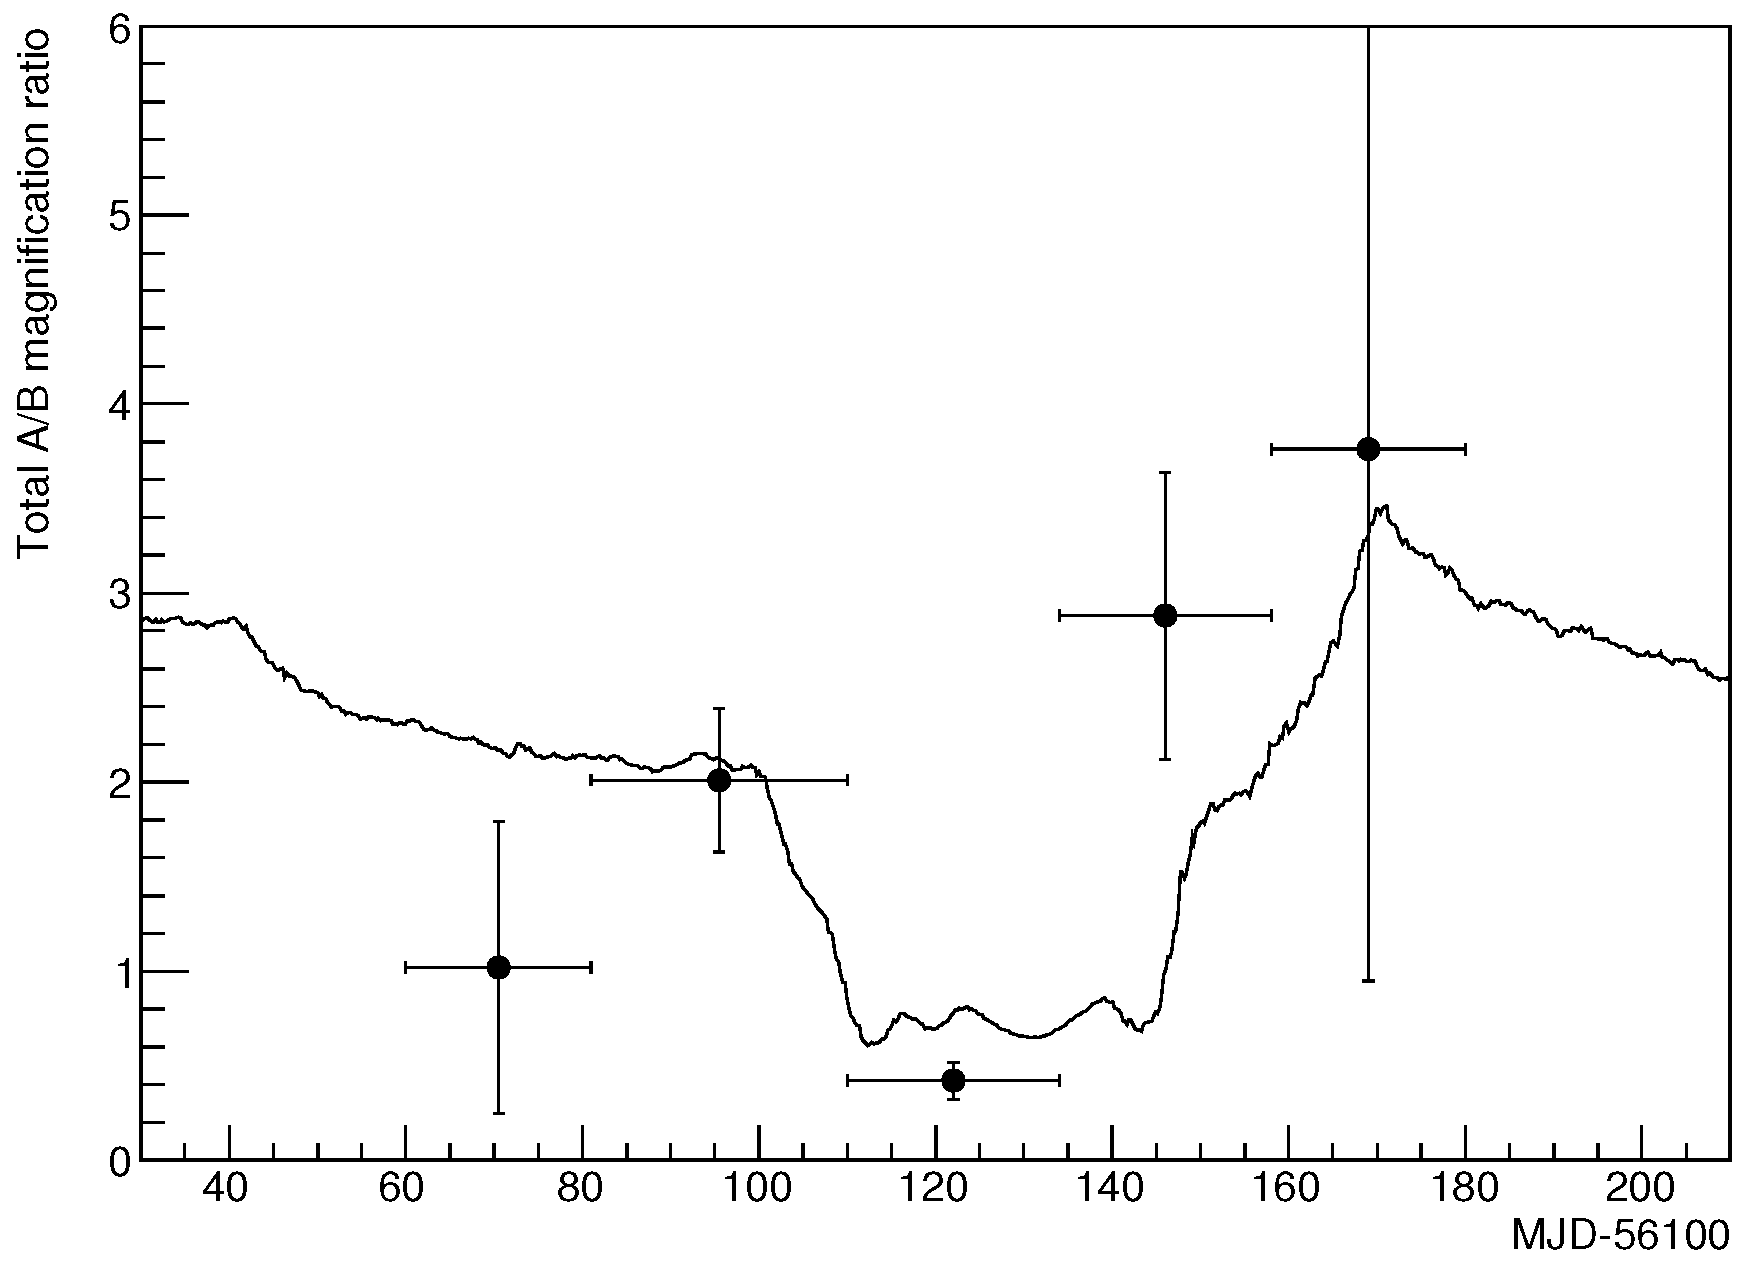
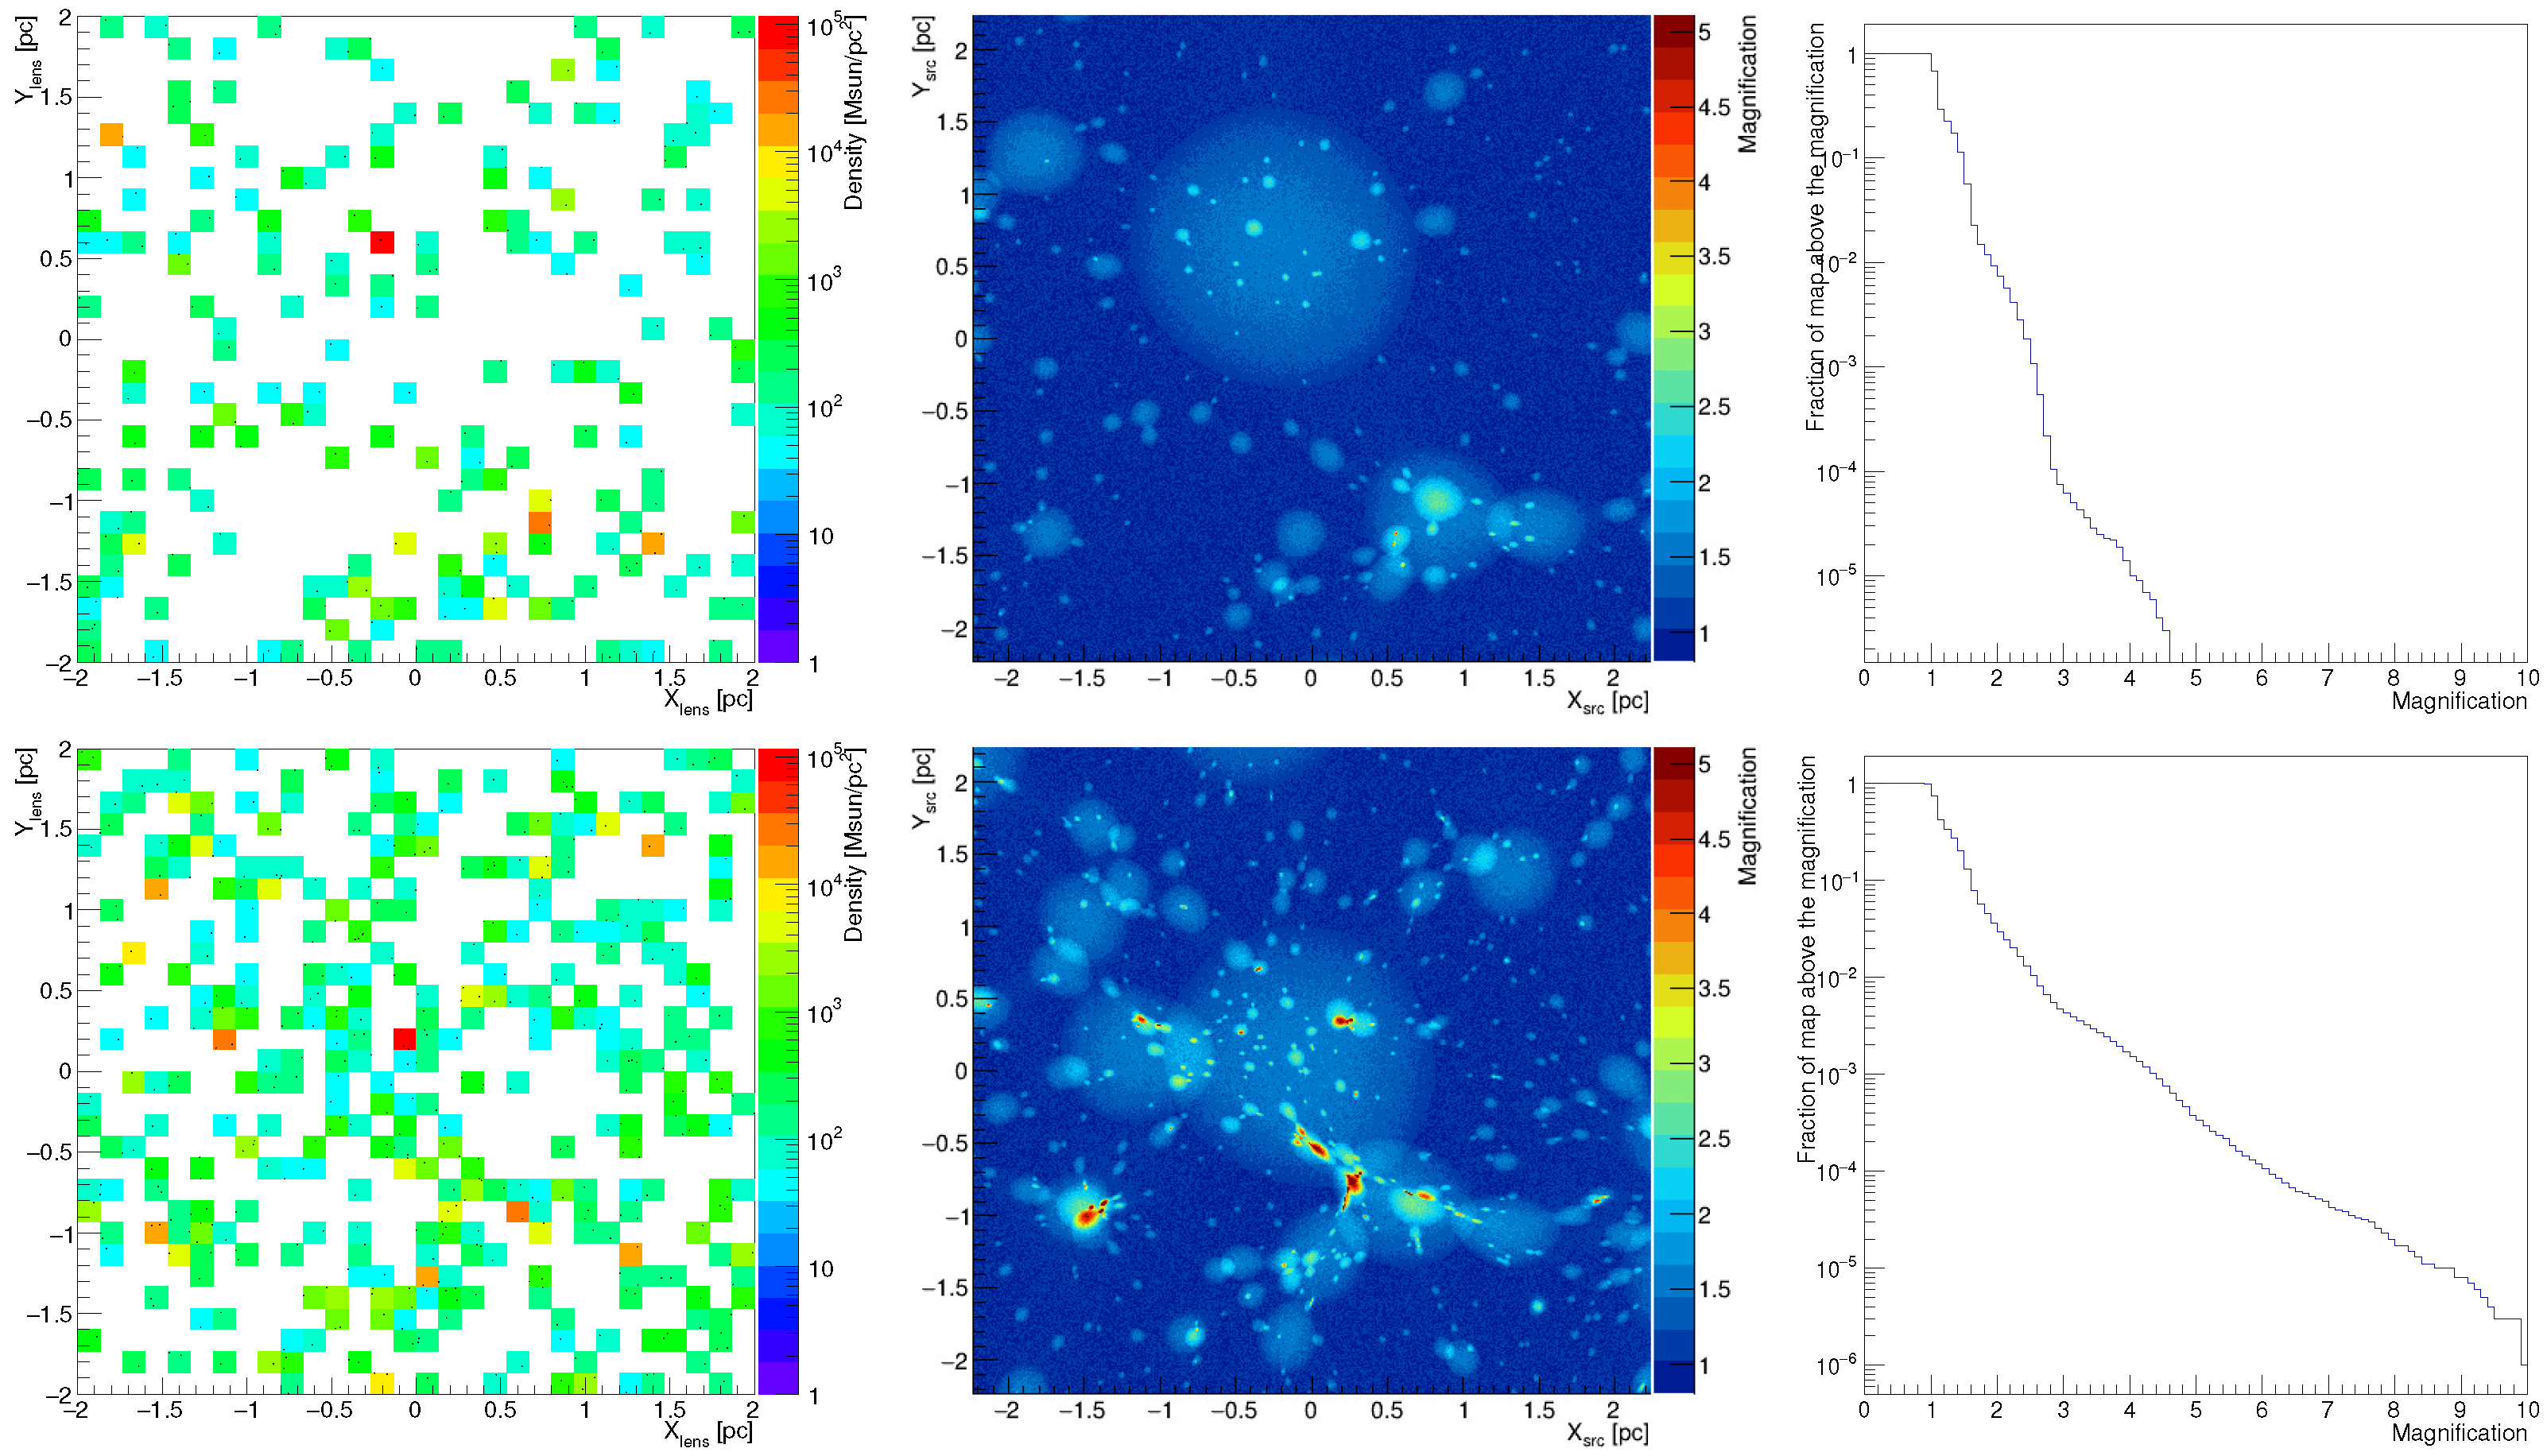
We considered lensing of QSO B0218+357 by different types of structures with intermediate size (fraction of pc to tens of pc) and mass ( 10 2 10 7 M ) [15]. In the case of a GC lens, huge magnifications (on the order of 100) are technically possible on the dense core of the GC. However, the probability of such an event is very low. In contrast, the less dense OCs do not provide coherent lensing by the whole structure, only microlensing on the caustics between more massive nearby stars.
The most promising intermediate targets for microlensing seem to be GMCs. They are large gas structures with masses on the order of 10 5 M and radii ∼20 pc [16]. In the Milky Way, there are over 10 4 GMCs, out of which 10 3 have mass above 2 × 10 5 M [17].
Since GMCs are much more irregular than star clusters (filaments, clumps, and cores can be identified, see [18] and references within), microlensing can occur on those substructures. The optical depth of a source being microlensed at a given moment by a clump in a GMC can be estimated as:
τ clump = k GMC N GMC N clump ( θ E ( M clump ) D L ) 2 r disk 2 = 2 × 10 3 k GMC 3 M GMC 10 5 M N GMC 10 4 r disk 10 kpc 2 ,
where N GMC is the number of GMC in the lensing galaxy, N clump and M clump are the number and mass of clumps in a typical GMC, and M GMC = N clump M clump . θ E ( M ) is the Einstein radius for a mass of M. The inhomogeneity factor k GMC accounts for the distribution of GMC in a lensing galaxy. Based on the H 2 distribution in our Galaxy (derived from CO measurements) [19], k GMC is expected to be on the order of unity for the A image, and on the order of ten for the B image. Note that as the projected position of the lensed source traverses the GMC, it can cross multiple individual clumps on time scales of months. Therefore, the probability of the image of a lensed source to cross a GMC—and thus being periodically magnified via microlensing on individual clumps—scales with the projected area of the GMCs, resulting in a value factor ∼60 larger than obtained in Equation (1).
Interestingly, there are independent reasons to believe that at least one of the images of QSO B0218+357 crosses a GMC in the lensing galaxy. The different reddening of the two images of QSO B0218+357 can be interpreted as an additional absorption of the leading image with the differential extinction Δ E ( B V ) = 0 . 90 ± 0 . 14 [20]. Moreover, a molecular absorption line has been detected in the leading image. It corresponds to a rather large H 2 column density of ( 0 . 5 5 ) × 10 22 cm 2 [21]. Even more interestingly, a similarly large column of absorbing gas has been also detected in the other known gravitationally lensed gamma-ray quasar PKS1830-211 [22], for which microlensing was suggested [3].
We study the possible variation of the magnification obtained in microlensing on clumps in GMCs by using a numerical simulation code based on the inverse ray shooting method (e.g., [23]). The deflection angles of individual rays are computed using the typical thin sheath approximation of the lens. The source plane is divided into a grid of cells, and the magnification is computed as the ratio of the number of rays hitting a given cell to the average number of rays emitted in the solid angle of this cell. The maps are divided in 1000 × 1000 cells, and ( 1 5 ) × 10 8 rays are simulated per map. We define the resolution of the maps as the linear size of the cells in which the magnification is computed.
For the sake of simplicity, we simulate a GMC as a spherically-symmetric structure (projected in the simulations on the XY plane of the lens) composed of individual extended clumps. We assume that each clump has a homogeneous mass density. The mass distribution function of the clumps follows a power law distribution between 0.8 M and 3 × 10 3 M with an index 1 . 7 [24]. The radius of each clump, R clump , is estimated according to the empirical correlation with its mass [24]:
R clump = 0 . 22 pc × M clump / 100 M .

3. Results

In the simulations, we use a typical mass and radius of GMC of M GMC = 2 × 10 5 M , R GMC = 20 pc. We consider two different scenarios of the distribution of clumps; homogeneous (i.e., d N clump / d V const ) and more peaked towards the centre of the GMC (i.e., d N clump / d V r 1 ). In Figure 1, we show the magnification map obtained for both cases.
The magnification map tracks the changes of the magnification of one of the images, depending on its position projected on the lens plane. For homogeneously distributed clumps in a GMC, most of the magnification happens on individual clumps. Magnifications by a factor of 2–3. can be achieved on distance scales of a fraction of pc.
In the case of a more peaked mass distribution, the microlensing is enhanced in the inner pc. A combination of multiple individual clumps can produce stronger magnifications (>5). Note that such magnifications are possible for sources with sizes up to ∼0.01 pc.

4. Discussion

If the gamma-ray emission of QSO B0218+357 is produced in the classical blob-in-jet models, apparent superluminal motion of the emission region is expected. The interpretation of the change of the magnification ratio of the two images in terms of microlensing on individual stars in the galaxy excludes such a movement [4]. On the other hand, the change in the magnification factor can also be produced by microlensing on extended structures with masses of hundreds of M . In order to explain the changes of the magnification ratio seen in the Fermi-LAT data on the time scale of 20 days, one requires features in the magnification map with a length of ∼0.1 pc for an apparent superluminal motion with proper motion of 0.2 mas/year. Such features occur naturally, due to microlensing in individual clumps of a GMC. Enhancement periods with time scales of a few tens of days can be obtained for the peaked distribution of clumps up to a magnification factor of 5 . Moreover, such a scenario operates up to much larger (up to ∼0.1 pc) sizes of the emission region in QSO B0218+357 than for the scenario presented in [4].
In order to compare the predictions of our model with the changes in the magnification ratio claimed by [4], we compute the total magnification ratio. It is calculated as the product of the strong lensing magnification (obtained at radio frequencies) and the magnification from microlensing on clumps in a GMC. In Figure 2, we show one of the possible paths obtained in the simulations, which follows the changes of the magnification ratio seen in the Fermi-LAT data.
For typical speed and size of the gamma-ray emission, the microlensing on clumps of a GMC can account for changes of the magnification ratio of similar amplitude and time scales, as observed by Fermi-LAT. We therefore conclude that microlensing occurring on clumps of a GMC is a tempting alternative to explain the variability of the magnification factor seen in the GeV gamma-ray observations of QSO B0218+357.

Acknowledgments

This work is supported by the Polish NCN No. 2014/15/B/ST9/04043 grant.

Author Contributions

Julian Sitarek conceived and developed the used simulation code and led the preparation of manuscript; Włodek Bednarek provided parameters of GMC. Both authors participated in the discussion of obtained results.

Conflicts of Interest

The authors declare no conflict of interest.

References

  1. Schneider, P.; Kochanek, C.; Wambsganss, J. Gravitational Lensing: Strong, Weak & Micro; Meylan, G., Jetzer, P., North, P., Eds.; Springer-Verlag: Berlin, Germany, 2006; p. 457. [Google Scholar]
  2. Abdo, A.A.; Ackermann, M.; Ajello, M.; Allafort, A.; Amin, M.A.; Baldini, L.; Barbiellini, G.; Bastieri, D.; Bechtol, K.; Bellazzini, R.; et al. Gamma-Ray Flaring Activity from the Gravitationally Lensed Blazar PKS 1830-211 Observed by Fermi LAT. Astrophys. J. 2015, 799, 143. [Google Scholar] [CrossRef]
  3. Neronov, A.; Vovk, I.; Malyshev, D. Central engine of a gamma-ray blazar resolved through the magnifying glass of gravitational microlensing. Nat. Phys. 2016, 11, 664–667. [Google Scholar] [CrossRef]
  4. Vovk, I.; Neronov, A. Microlensing constraints on the size of the gamma-ray emission region in blazar B0218+357. Astron. Astrophys. 2016, 586, A150. [Google Scholar] [CrossRef]
  5. Cohen, J.G.; Lawrence, C.R.; Blandford, R.D. The Redshift of the Lensed Object in the Einstein Ring B0218+357. Astrophys. J. 2003, 583, 67–69. [Google Scholar] [CrossRef]
  6. CASTLES Survey. Available online: https://www.cfa.harvard.edu/castles/ (accessed on 20 August 2016).
  7. Browne, I.W.A.; Patnaik, A.R.; Walsh, D.; Wilkinson, P.N. The Redshift of the Lensing Galaxy in the Gravitationally Lensed System B0218+35.7. Mon. Not. R. Astron. Soc. 1993, 263, L32–L36. [Google Scholar] [CrossRef]
  8. O’Dea, C.P.; Baum, S.A.; Stanghellini, C.; Dey, A.; van Breugel, W.; Deustua, S. Radio and optical observations of 0218+357—The smallest Einstein ring? Astrophys. J. 1992, 104, 1320–1330. [Google Scholar] [CrossRef]
  9. Biggs, A.D.; Browne, I.W.A.; Helbig, P.; Koopmans, L.V.E.; Wilkinson, P.N.; Perley, R.A. Time delay for the gravitational lens system B0218+357. Mon. Not. R. Astron. Soc. 1999, 304, 349–358. [Google Scholar] [CrossRef]
  10. Cohen, A.S.; Hewitt, J.N.; Moore, C.B.; Haarsma, D.B. Further Investigation of the Time Delay, Magnification Ratios, and Variability in the Gravitational Lens 0218+357. Astrophys. J. 2000, 545, 578. [Google Scholar] [CrossRef]
  11. Mittal, R.; Porcas, R.; Wucknitz, O.; Biggs, A.; Browne, I. VLBI phase-reference observations of the gravitational lens JVAS B0218+357. Astron. Astrophys. 2006, 447, 515–524. [Google Scholar] [CrossRef]
  12. Mittal, R.; Porcas, R.; Wucknitz, O. Free-free absorption in the gravitational lens JVAS B0218+357. Astron. Astrophys. 2007, 465, 405–415. [Google Scholar] [CrossRef]
  13. Martí-Vidal, I.; Muller, S. Using gravitationally lensed images to investigate the intrinsic AGN variability. Astron. Astrophys. 2016, 590, A83. [Google Scholar] [CrossRef]
  14. Cheung, C.C.; Larsson, S.; Scargle, J.D.; Amin, M.A.; Blandford, R.D.; Bulmash, D.; Chiang, J.; Ciprini, S.; Corbet, R.H.D.; Falco, E.E.; et al. Fermi Large Area Telescope Detection of Gravitational Lens Delayed γ-Ray Flares from Blazar B0218+357. Astrophys. J. Lett. 2014, 782, L14. [Google Scholar] [CrossRef]
  15. Sitarek, J.; Bednarek, W. Variability of GeV gamma-ray emission in QSO B0218+357 due to microlensing on intermediate size structures. Mon. Not. R. Astron. Soc. 2016, 459, 1959–1967. [Google Scholar] [CrossRef]
  16. Blitz, L. Giant molecular clouds. In Protostars and Planets III; University of Arizona Press: Tucson, AZ, USA, 1993. [Google Scholar]
  17. Murray, N. Star Formation Efficiencies and Lifetimes of Giant Molecular Clouds in the Milky Way. Astrophys. J. 2011, 729, 133. [Google Scholar] [CrossRef]
  18. Williams, J.P.; Blitz, L.; McKee, C.F. The Structure and Evolution of Molecular Clouds: From Clumps to Cores to the IMF. In Protostars and Planets IV; University of Arizona Press: Tucson, AZ, USA, 2000. [Google Scholar]
  19. Sanders, D.B.; Solomon, P.M.; Scoville, N.Z. Giant molecular clouds in the Galaxy. I—The axisymmetric distribution of H2. Astrophys. J. 1984, 276, 182–203. [Google Scholar] [CrossRef]
  20. Falco, E.E.; Impey, C.D.; Kochanek, C.S.; Lehár, J.; McLeod, B.A.; Rix, H.-W.; Keeton, C.R.; Muñoz, J.A.; Peng, C.Y. Dust and Extinction Curves in Galaxies with z > 0: The Interstellar Medium of Gravitational Lens Galaxies. Astrophys. J. 1999, 523, 617–632. [Google Scholar] [CrossRef]
  21. Menten, K.M.; Reid, M.J. Formaldehyde Absorption at z = 0.685 toward the “Einstein Ring” B0218+357. Astrophys. J. 1996, 465, L99–L102. [Google Scholar] [CrossRef]
  22. Wiklind, T.; Combes, F. The redshift of the gravitational lens of PKS1830-211 determined from molecular absorption lines. Nature 1996, 379, 139–141. [Google Scholar] [CrossRef]
  23. Schneider, P.; Weiss, A. The two-point-mass lens—Detailed investigation of a special asymmetric gravitational lens. Astron. Astrophys. 1986, 164, 237–259. [Google Scholar]
  24. Stutzki, J.; Guesten, R. High spatial resolution isotopic CO and CS observations of M17 SW—The clumpy structure of the molecular cloud core. Astrophys. J. 1990, 356, 513–533. [Google Scholar] [CrossRef]
Figure 1. Microlensing by a giant molecular cloud (GMC) with M GMC = 2 × 10 5 M , R GMC = 20 pc composed of homogeneously distributed clumps (top panels) or a distribution of clumps in the GMC following d N clump / d V r 1 (bottom panels). Left panels: surface density (in the reference frame of the lens) of the mass of the lens, with individual clumps marked with black points. Middle panels: magnification map in the reference frame of the source. Right panels: fraction of the map with a magnification above a given value. Individual panels reproduced from [15].
Galaxies 04 00020 g001
Figure 2. Changes of the total magnification ratio of the leading to trailing component seen in Fermi-LAT data during the 2012 high state of QSO B0218+357 (black circles, [4]). The black solid line shows the changes of the magnification ratio obtained along one of the simulated paths of the trailing image through a GMC with a mass of 2 × 10 5 M . Strong lensing with a magnification ratio of 3.6, with proper motion of 0.2 mas/year and size of the gamma-ray emission region of 0.01 pc are assumed. Figure reproduced from [15].
Galaxies 04 00020 g002

