
Assessing Tumor Response to Treatment in Patients with Lung Cancer Using Dynamic Contrast-Enhanced CT

 , , and
Abstract
:1. Introduction
2. Materials and Methods
| PubMed Search String |
| Tomography, X-ray Computed [MeSH Terms] OR CT OR “Computed Tomography” |
| AND |
| Perfusion imaging [MeSH Terms] OR Perfusion OR Dynamic OR DCE-CT OR “Dynamic contrast-enhanced” |
| AND |
| Lung Neoplasms [MeSH Terms] OR “Lung cancer” OR “Lung Neoplasms” OR “Non Small Cell Lung Cancer” OR NSCLC |
3. Results
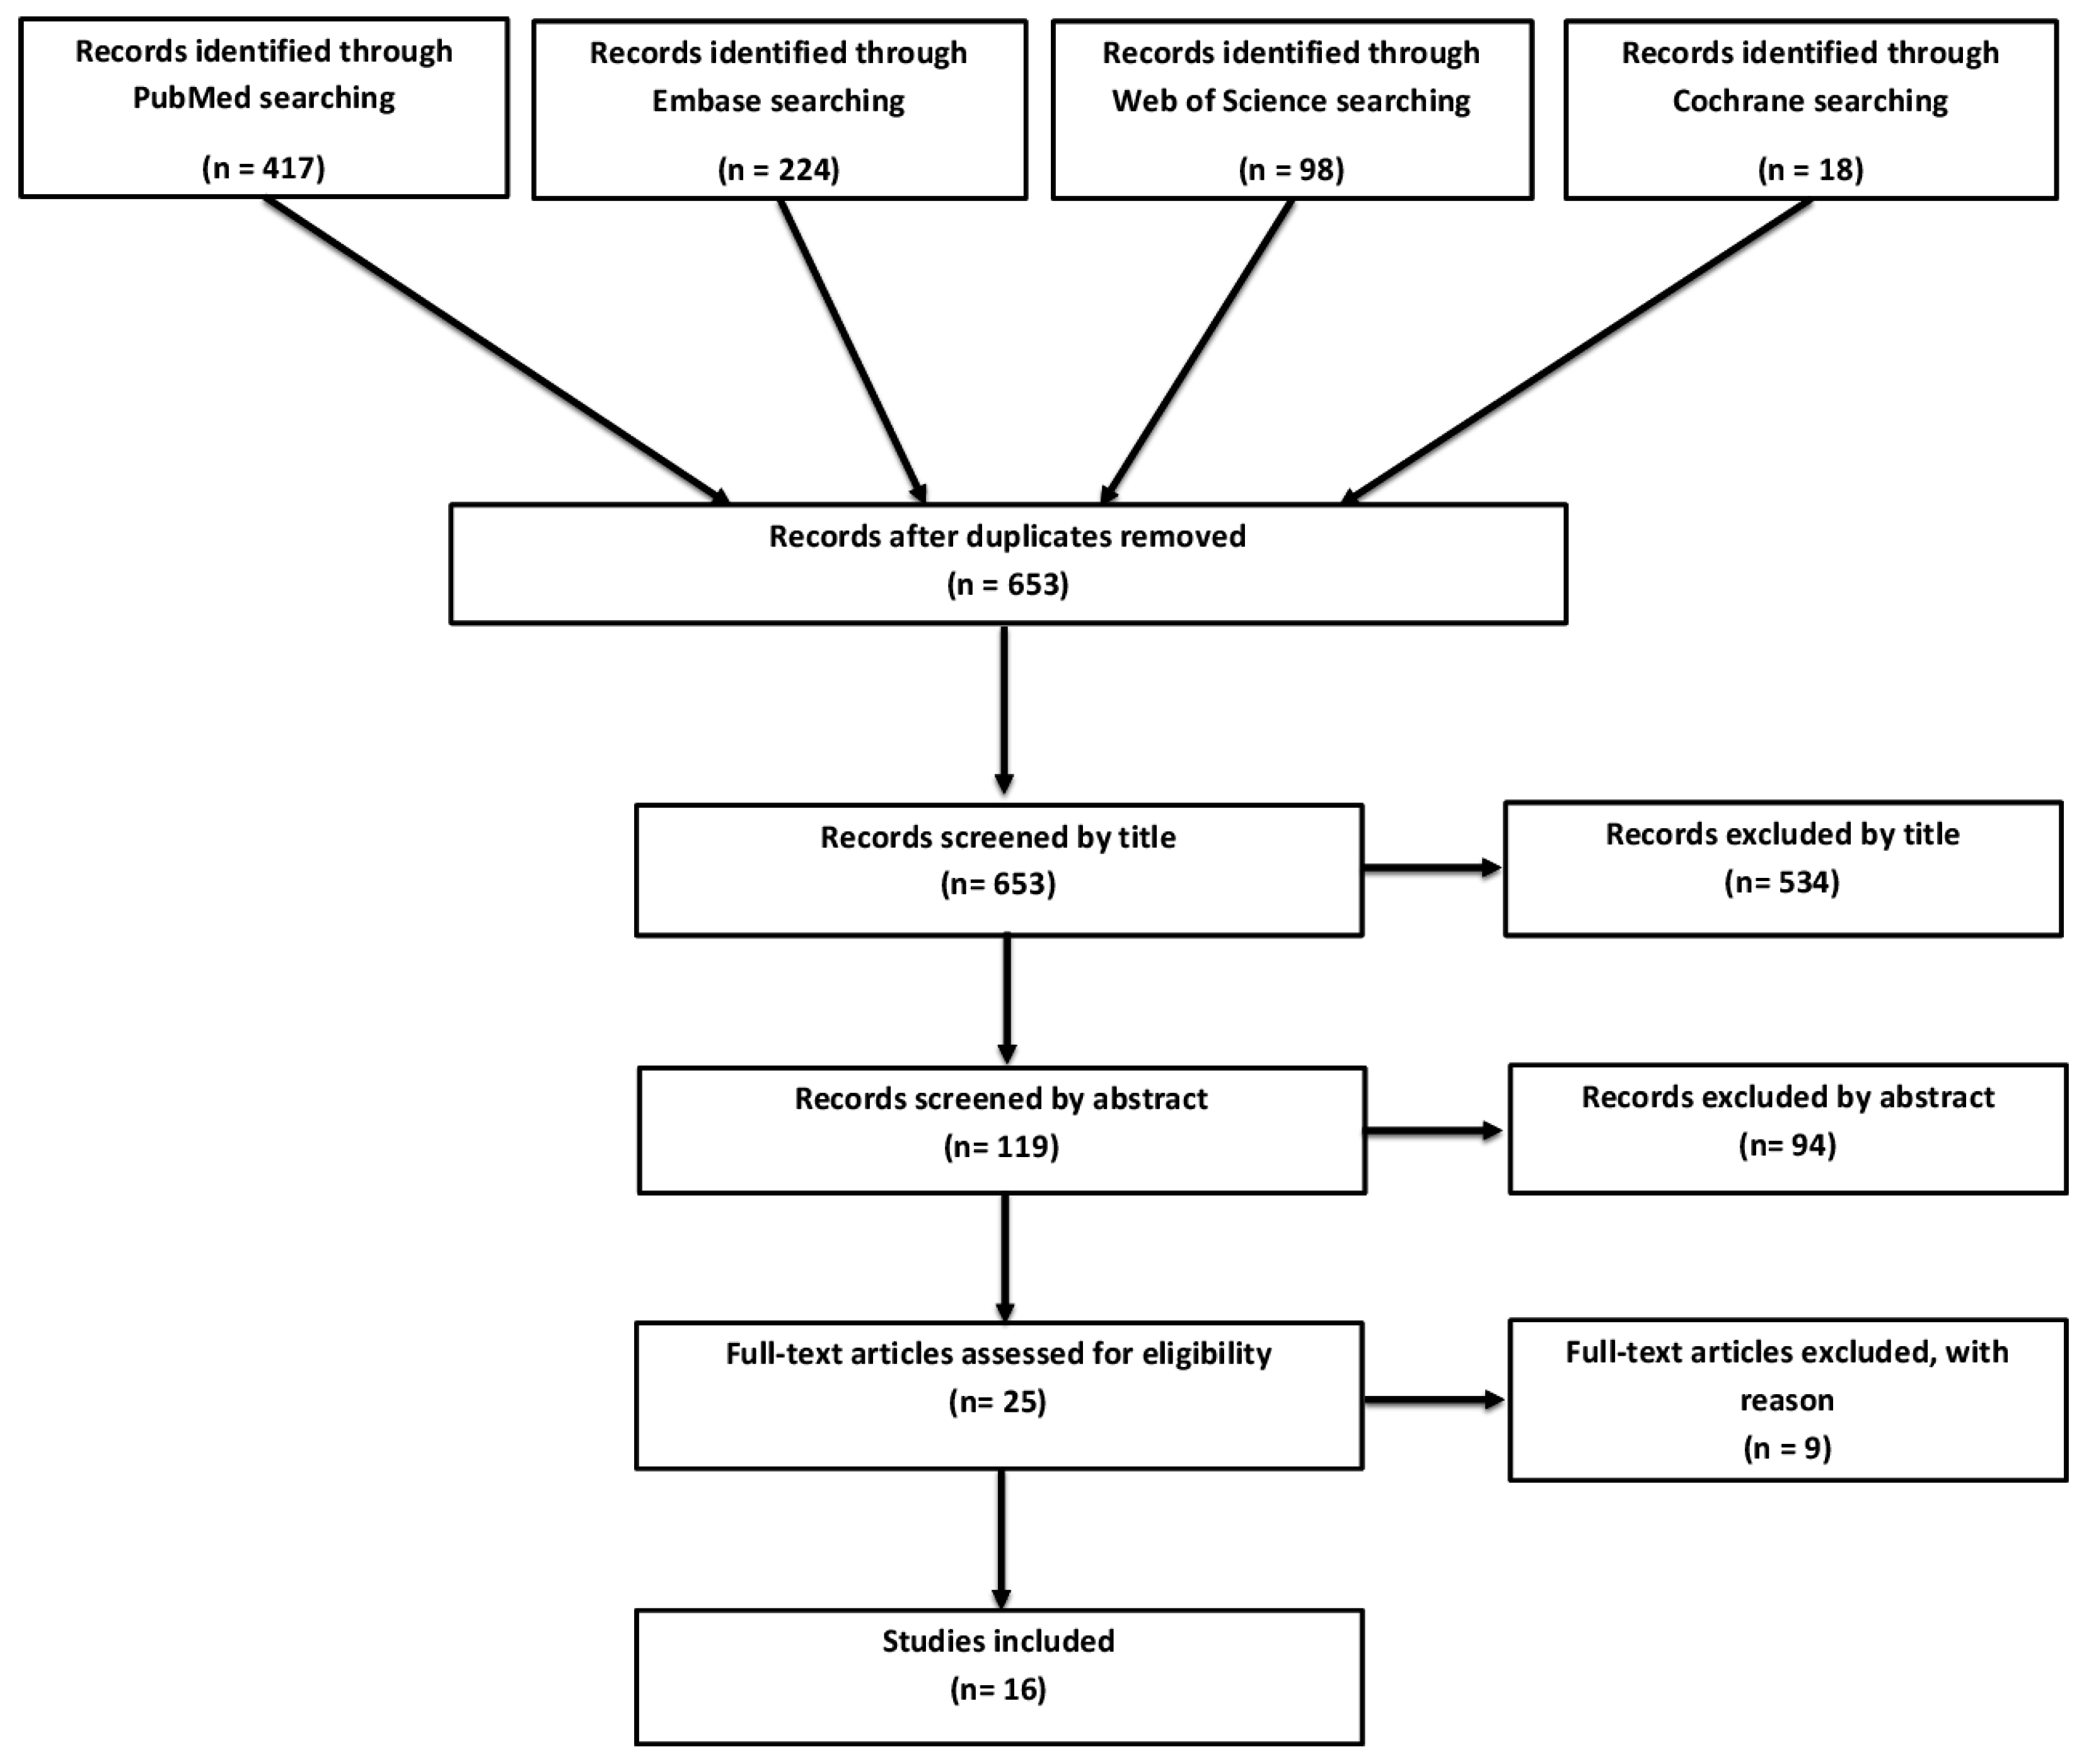
3.1. Study Selection and Overview
3.2. Systemic Chemotherapy with or without Anti-Angiogenic Drug (Seven Studies)
3.3. Radiotherapy (3 Studies)
3.4. Chemoradiotherapy (One Study)
3.5. Others (Five Studies)
3.6. Bias and Applicability
4. Discussion
Conflicts of Interest
Abbreviations
| DCE-CT | Dynamic Contrast- Enhanced Computed Tomography |
| PRISMA | Preferred Reporting Items for Systematic Reviews and Meta-Analyses |
| QUADAS | Quality Assessment of Diagnostic Accuracy Studies |
| RECIST | Response Evaluation Criteria in Solid Tumors |
| MeSH | Medical Subject Headings |
| RHES | Recombinant Human Endostatin |
| EGFR | Epidermal Growth Factor Receptor |
| NSCLC | Non-Small Cell Lung Cancer |
| SCLC | Small Cell Lung Cancer |
| CA4P | Combretastatin A4 Phosphate |
| PET | Positron Emission Tomography |
References
- Jemal, A.; Bray, F.; Center, M.M.; Ferlay, J.; Ward, E.; Forman, D. Global cancer statistics. CA Cancer J. Clin. 2011, 61, 69–90. [Google Scholar] [CrossRef] [PubMed]
- Siegel, R.L.; Miller, K.D.; Jemal, A. Cancer statistics, 2016. CA Cancer J. Clin. 2016, 66, 7–30. [Google Scholar] [CrossRef] [PubMed]
- Ahmad, A.; Gadgeel, S. Lung Cancer and Personalized Medicine; Springer International Publishing: Cham, Switzerland, 2016. [Google Scholar]
- Korpanty, G.; Smyth, E.; Sullivan, L.A.; Brekken, R.A.; Carney, D.N. Antiangiogenic therapy in lung cancer: Focus on vascular endothelial growth factor pathway. Exp. Biol. Med. 2010, 235, 3–9. [Google Scholar] [CrossRef] [PubMed]
- Schmid-Bindert, G. Update on antiangiogenic treatment of advanced non-small cell lung cancer (NSCLC). Target. Oncol. 2013, 8, 15–26. [Google Scholar] [CrossRef] [PubMed]
- Eisenhauer, E.A.; Therasse, P.; Bogaerts, J.; Schwartz, L.H.; Sargent, D.; Ford, R.; Dancey, J.; Arbuck, S.; Gwyther, S.; Mooney, M.; et al. New response evaluation criteria in solid tumours: Revised recist guideline (version 1.1). Eur. J. Cancer 2009, 45, 228–247. [Google Scholar] [CrossRef] [PubMed]
- Goh, V.; Ng, Q.S.; Miles, K. Computed tomography perfusion imaging for therapeutic assessment: Has it come of age as a biomarker in oncology? Investig. Radiol. 2012, 47, 2–4. [Google Scholar] [CrossRef] [PubMed]
- O’Connor, J.P.; Tofts, P.S.; Miles, K.A.; Parkes, L.M.; Thompson, G.; Jackson, A. Dynamic contrast-enhanced imaging techniques: Ct and mri. Br. J. Radiol. 2011, 84, S112–S120. [Google Scholar] [CrossRef] [PubMed]
- Garcia-Figueiras, R.; Goh, V.J.; Padhani, A.R.; Baleato-Gonzalez, S.; Garrido, M.; Leon, L.; Gomez-Caamano, A. CT perfusion in oncologic imaging: A useful tool? AJR Am. J. Roentgenol. 2013, 200, 8–19. [Google Scholar] [CrossRef] [PubMed]
- Miles, K.A.; Lee, T.Y.; Goh, V.; Klotz, E.; Cuenod, C.; Bisdas, S.; Groves, A.M.; Hayball, M.P.; Alonzi, R.; Brunner, T. Current status and guidelines for the assessment of tumour vascular support with dynamic contrast-enhanced computed tomography. Eur. Radiol. 2012, 22, 1430–1441. [Google Scholar] [CrossRef] [PubMed]
- Hansen, M.; Norling, R.; Lauridsen, C.; Fallentin, E.; Bæksgaard, L.; Kofoed, K.; Svendsen, L.; Nielsen, M. Computed tomography (CT) perfusion in abdominal cancer: Technical aspects. Diagnostics 2013, 3, 261–270. [Google Scholar] [CrossRef] [PubMed]
- Miles, K.A.; Griffiths, M.R. Perfusion CT: A worthwhile enhancement? Br. J. Radiol. 2003, 76, 220–231. [Google Scholar] [CrossRef] [PubMed]
- Moher, D.; Liberati, A.; Tetzlaff, J.; Altman, D.G. Preferred reporting items for systematic reviews and meta-analyses: The prisma statement. J. Clin. Epidemiol. 2009, 62, 1006–1012. [Google Scholar] [CrossRef] [PubMed]
- Whiting, P.F.; Rutjes, A.W.; Westwood, M.E.; Mallett, S.; Deeks, J.J.; Reitsma, J.B.; Leeflang, M.M.; Sterne, J.A.; Bossuyt, P.M. Quadas-2: A revised tool for the quality assessment of diagnostic accuracy studies. Ann. Intern. Med. 2011, 155, 529–536. [Google Scholar] [CrossRef] [PubMed]
- Ng, Q.S.; Goh, V.; Carnell, D.; Meer, K.; Padhani, A.R.; Saunders, M.I.; Hoskin, P.J. Tumor antivascular effects of radiotherapy combined with combretastatin a4 phosphate in human non-small-cell lung cancer. Int. J. Radiat. Oncol. Biol. Phys. 2007, 67, 1375–1380. [Google Scholar] [CrossRef] [PubMed]
- Ng, Q.S.; Goh, V.; Milner, J.; Padhani, A.R.; Saunders, M.I.; Hoskin, P.J. Acute tumor vascular effects following fractionated radiotherapy in human lung cancer:in vivo whole tumor assessment using volumetric perfusion computed tomography. Int. J. Radiat. Oncol. Biol. Phys. 2007, 67, 417–424. [Google Scholar] [CrossRef] [PubMed]
- Ng, Q.S.; Goh, V.; Milner, J.; Sundin, J.; Wellsted, D.; Saunders, M.I.; Hoskin, P.J. Quantitative helical dynamic contrast enhanced computed tomography assessment of the spatial variation in whole tumour blood volume with radiotherapy in lung cancer. Lung Cancer 2010, 69, 71–76. [Google Scholar] [CrossRef] [PubMed]
- Jiang, X.D.; Dai, P.; Qiao, Y.; Wu, J.; Song, D.A.; Li, S.Q. Clinical study on the recombinant human endostatin regarding improving the blood perfusion and hypoxia of non-small-cell lung cancer. Clin. Transl. Oncol. 2012, 14, 437–443. [Google Scholar] [CrossRef] [PubMed]
- Lind, J.S.; Meijerink, M.R.; Dingemans, A.M.; van Kuijk, C.; Ollers, M.C.; de Ruysscher, D.; Postmus, P.E.; Smit, E.F. Dynamic contrast-enhanced CT in patients treated with sorafenib and erlotinib for non-small cell lung cancer: A new method of monitoring treatment? Eur. Radiol. 2010, 20, 2890–2898. [Google Scholar] [CrossRef] [PubMed]
- Fraioli, F.; Anzidei, M.; Zaccagna, F.; Mennini, M.L.; Serra, G.; Gori, B.; Longo, F.; Catalano, C.; Passariello, R. Whole-tumor perfusion CT in patients with advanced lung adenocarcinoma treated with conventional and antiangiogenetic chemotherapy: Initial experience. Radiology 2011, 259, 574–582. [Google Scholar] [CrossRef] [PubMed]
- Sudarski, S.; Shi, J.; Schmid-Bindert, G.; Manegold, C.; Pilz, L.R.; Zhou, C.; Schoenberg, S.O.; Henzler, T. Dynamic volume perfusion computed tomography parameters versus recist for the prediction of outcome in lung cancer patients treated with conventional chemotherapy. J. Thorac. Oncol. 2015, 10, 164–171. [Google Scholar] [CrossRef] [PubMed]
- Zhao, L.; Guan, W.; Han, Y.; Zhao, Y. Comparative study on CT perfusion parameters of different types of lung cancer before and after chemoradiotherapy. J. Biol. Regul. Homeost. Agents 2014, 28, 675–681. [Google Scholar] [PubMed]
- Hegenscheid, K.; Behrendt, N.; Rosenberg, C.; Kuehn, J.P.; Ewert, R.; Hosten, N.; Puls, R. Assessing early vascular changes and treatment response after laser-induced thermotherapy of pulmonary metastases with perfusion CT: Initial experience. AJR Am. J. Roentgenol. 2010, 194, 1116–1123. [Google Scholar] [CrossRef] [PubMed]
- Fraioli, F.; Anzidei, M.; Serra, G.; Liberali, S.; Fiorelli, A.; Zaccagna, F.; Longo, F.; Anile, M.; Catalano, C. Whole-tumour CT-perfusion of unresectable lung cancer for the monitoring of anti-angiogenetic chemotherapy effects. Br. J. Radiol. 2013, 86, 20120174. [Google Scholar] [CrossRef] [PubMed]
- Tacelli, N.; Santangelo, T.; Scherpereel, A.; Duhamel, A.; Deken, V.; Klotz, E.; Cortot, A.; Lafitte, J.J.; Wallyn, F.; Remy, J.; et al. Perfusion CT allows prediction of therapy response in non-small cell lung cancer treated with conventional and anti-angiogenic chemotherapy. Eur. Radiol. 2013, 23, 2127–2136. [Google Scholar] [CrossRef] [PubMed]
- Wang, J.; Xiao, J.; Wei, X.; Wang, L.; Lin, L.; Liu, Z.; Wang, X.; Sun, B.; Li, K. Circulating endothelial cells and tumor blood volume as predictors in lung cancer. Cancer Sci. 2013, 104, 445–452. [Google Scholar] [CrossRef] [PubMed]
- Zhang, F.L.; Gao, E.Y.; Shu, R.B.; Wang, H.; Zhang, Y.; Sun, P.; Li, M.; Tang, W.; Jiang, B.Q.; Chen, S.Q.; et al. Human recombinant endostatin combined with cisplatin based doublets in treating patients with advanced nsclc and evaluation by CT perfusion imaging. Asian Pac. J. Cancer Prev. 2015, 16, 6765–6768. [Google Scholar] [CrossRef] [PubMed]
- Wang, J.; Wu, N.; Cham, M.D.; Song, Y. Tumor response in patients with advanced non-small cell lung cancer: Perfusion CT evaluation of chemotherapy and radiation therapy. AJR Am. J. Roentgenol. 2009, 193, 1090–1096. [Google Scholar] [CrossRef] [PubMed]
- Li, X.S.; Fan, H.X.; Fang, H.; Huang, H.; Song, Y.L.; Zhou, C.W. Value of whole-tumor dual-input perfusion CT in predicting the effect of multiarterial infusion chemotherapy on advanced non-small cell lung cancer. AJR Am. J. Roentgenol. 2014, 203, W497–W505. [Google Scholar] [CrossRef] [PubMed]
- Qiao, P.G.; Zhang, H.T.; Zhou, J.; Li, M.; Ma, J.L.; Tian, N.; Xing, X.D.; Li, G.J. Early evaluation of targeted therapy effectiveness in non-small cell lung cancer by dynamic contrast-enhanced CT. Clin. Transl. Oncol. 2015, 18, 47–57. [Google Scholar] [CrossRef] [PubMed]
- Coggle, J.E.; Lambert, B.E.; Moores, S.R. Radiation effects in the lung. Environ. Health Perspect. 1986, 70, 261–291. [Google Scholar] [CrossRef] [PubMed]
- Miles, K.A.; Cuenod, C.-A. Multidetector Computed Tomography in Oncology; Informa Healthcare: London, UK, 2007. [Google Scholar]
- Miles, K.A.; Charnsangavej, C.; Lee, F.T.; Fishman, E.K.; Horton, K.; Lee, T.Y. Application of CT in the investigation of angiogenesis in oncology. Acad. Radiol. 2000, 7, 840–850. [Google Scholar] [CrossRef]
- Yao, J.C.; Phan, A.; Hoff, P.M.; Chen, H.X.; Charnsangavej, C.; Yeung, S.C.; Hess, K.; Ng, C.; Abbruzzese, J.L.; Ajani, J.A. Targeting vascular endothelial growth factor in advanced carcinoid tumor: A random assignment phase ii study of depot octreotide with bevacizumab and pegylated interferon alpha-2b. J. Clin. Oncol. 2008, 26, 1316–1323. [Google Scholar] [CrossRef] [PubMed]
- Bisdas, S.; Rumboldt, Z.; Wagenblast, J.; Baghi, M.; Koh, T.S.; Hambek, M.; Vogl, T.J.; Mack, M.G. Response and progression-free survival in oropharynx squamous cell carcinoma assessed by pretreatment perfusion CT: Comparison with tumor volume measurements. AJNR Am. J. Neuroradiol. 2009, 30, 793–799. [Google Scholar] [CrossRef] [PubMed]
- Miles, K.A. Perfusion CT for the assessment of tumour vascularity: Which protocol? Br. J. Radiol. 2003, 76, S36–S42. [Google Scholar] [CrossRef] [PubMed]
- Kambadakone, A.R.; Sahani, D.V. Body perfusion CT: Technique, clinical applications, and advances. Radiol. Clin. N. Am. 2009, 47, 161–178. [Google Scholar] [CrossRef] [PubMed]
- Nakano, S.; Gibo, J.; Fukushima, Y.; Kaira, K.; Sunaga, N.; Taketomi-Takahashi, A.; Tsushima, Y.; Mori, M. Perfusion evaluation of lung cancer: Assessment using dual-input perfusion computed tomography. J. Thorac. Imaging 2013, 28, 253–262. [Google Scholar] [CrossRef] [PubMed]
- Kiessling, F.; Boese, J.; Corvinus, C.; Ederle, J.R.; Zuna, I.; Schoenberg, S.O.; Brix, G.; Schmahl, A.; Tuengerthal, S.; Herth, F.; et al. Perfusion CT in patients with advanced bronchial carcinomas: A novel chance for characterization and treatment monitoring? Eur. Radiol. 2004, 14, 1226–1233. [Google Scholar] [CrossRef] [PubMed]
- Harders, S.W.; Balyasnikowa, S.; Fischer, B.M. Functional imaging in lung cancer. Clin. Physiol. Funct. Imaging 2014, 34, 340–355. [Google Scholar] [CrossRef] [PubMed]
- Kim, D.H.; Kim, S.H.; Im, S.A.; Han, S.W.; Goo, J.M.; Willmann, J.K.; Lee, E.S.; Eo, J.S.; Paeng, J.C.; Han, J.K.; et al. Intermodality comparison between 3D perfusion CT and 18F-FDG PET/CT imaging for predicting early tumor response in patients with liver metastasis after chemotherapy: Preliminary results of a prospective study. Eur. J. Radiol. 2012, 81, 3542–3550. [Google Scholar] [CrossRef] [PubMed]
- Miles, K.A.; Griffiths, M.R.; Keith, C.J. Blood flow-metabolic relationships are dependent on tumour size in non-small cell lung cancer: A study using quantitative contrast-enhanced computer tomography and positron emission tomography. Eur. J. Nucl. Med. Mol. Imaging 2006, 33, 22–28. [Google Scholar] [CrossRef] [PubMed]
- Van Elmpt, W.; Zegers, C.M.; Reymen, B.; Even, A.J.; Dingemans, A.M.; Oellers, M.; Wildberger, J.E.; Mottaghy, F.M.; Das, M.; Troost, E.G.; et al. Multiparametric imaging of patient and tumour heterogeneity in non-small-cell lung cancer: Quantification of tumour hypoxia, metabolism and perfusion. Eur. J. Nucl. Med. Mol. Imaging 2016, 43, 240–248. [Google Scholar] [CrossRef] [PubMed]
- O’Connor, J.P.; Jackson, A.; Parker, G.J.; Roberts, C.; Jayson, G.C. Dynamic contrast-enhanced mri in clinical trials of antivascular therapies. Nat. Rev. Clin. Oncol. 2012, 9, 167–177. [Google Scholar] [CrossRef] [PubMed]
- Lee, S.M.; Lee, H.J.; Kim, J.I.; Kang, M.J.; Goo, J.M.; Park, C.M.; Im, J.G. Adaptive 4d volume perfusion CT of lung cancer: Effects of computerized motion correction and the range of volume coverage on measurement reproducibility. AJR Am. J. Roentgenol. 2013, 200, W603–W609. [Google Scholar] [CrossRef] [PubMed]
- Goh, V.; Halligan, S.; Gartner, L.; Bassett, P.; Bartram, C.I. Quantitative colorectal cancer perfusion measurement by multidetector-row CT: Does greater tumour coverage improve measurement reproducibility? Br. J. Radiol. 2006, 79, 578–583. [Google Scholar] [CrossRef] [PubMed]
- Sanghera, B.; Banerjee, D.; Khan, A.; Simcock, I.; Stirling, J.J.; Glynne-Jones, R.; Goh, V. Reproducibility of 2d and 3d fractal analysis techniques for the assessment of spatial heterogeneity of regional blood flow in rectal cancer. Radiology 2012, 263, 865–873. [Google Scholar] [CrossRef] [PubMed]
- Goh, V.; Halligan, S.; Hugill, J.A.; Bartram, C.I. Quantitative assessment of tissue perfusion using mdct: Comparison of colorectal cancer and skeletal muscle measurement reproducibility. AJR Am. J. Roentgenol. 2006, 187, 164–169. [Google Scholar] [CrossRef] [PubMed]
- Ng, C.S.; Chandler, A.G.; Wei, W.; Anderson, E.F.; Herron, D.H.; Charnsangavej, C.; Kurzrock, R. Reproducibility of perfusion parameters obtained from perfusion CT in lung tumors. AJR Am. J. Roentgenol. 2011, 197, 113–121. [Google Scholar] [CrossRef] [PubMed]


| Systemic Chemotherapy (+/− Anti-Angiogenic Drug) | ||||||||||||||
|---|---|---|---|---|---|---|---|---|---|---|---|---|---|---|
| Author, Year | Study Design | Patients | Diagnosis | Scan Parameters | Kinetic Model | Aim | Treatment | Perfusion Scan | DCE-CT* Values | Gold Standard | Results | Conclusion | ||
| Slice | kVp mAs | Contrast | ||||||||||||
| Fraioli et al. 2011 [20] | Prospective | 45 | Lung adenocarcinoma | 64 | 100 kVp 120 mAs | 90 mL | Two-compartmental (Patlak) | To determine if DCE-CT* enables evaluation of the effects of chemotherapy combined with anti-angiogenetic drug and to determine if changes in CT correlate with RECIST*. | Chemotherapy combined with anti-angiogenic drug | Baseline, 40 (n = 45) and 90 days after treatment (n = 14) | BF* BV* TTP* PS* | RECIST* | Significant decrease from baseline to follow-up in BF* (p = 0.018) and PS* (p = 0.013). | DCE-CT* may allow evaluation of lung cancer angiogenesis demonstrating alterations in vascularity following treatment. |
| Fraioli et al. 2013 [24] | Prospective | 50 | NSCLC* | 64 | 100 kVp 120 mAs | 90 mL | Two-compartmental (Patlak) | To determine if DCE-CT* can be used to evaluate the effects of chemotherapy and anti-angiogenic treatment in patients with NSCLC* and whether DCE-CT* and RECIST* before and after therapy correlate. | Non squamous carcinoma (n = 36): Chemotherapy combined with anti-angiogenic drug Squamous cell carcinoma (n = 14): Chemotherapy | Baseline and 90 days after treatment | BF* BV* TTP* PS* | RECIST* | Significant decrease from baseline to follow-up in BF* (p = 0.001) and PS* (p = 0.001) Significant difference in BV* between the subtypes. RECIST* classifications showed a difference in BF* (p = 0.001), BV* (p = 0.008) and TTP* (p = 0.007) between responder and non-responder. | Difference in DCE-CT* parameters between subtypes of lung cancer before and after treatment may play an important role in assessing early treatment response. |
| Sudarski et al. 2015 [21] | Prospective | 100 | NSCLC* (n = 84) and SCLC* (n = 16) | 128 | 80 kVp 36 mAs | 50 mL | Deconvolution | To compare DCE-CT* parameters with RECIST* for prediction of therapy response and OS* in NSCLC* and SCLC* patients treated with conventional chemotherapy. | Chemotherapy | Baseline and after treatment (within median of 44 days) | BF* BV* MTT* PS* | RECIST* | Significant decrease from baseline to follow-up in PS* (p = 0.009) and MTT* (p = 0.007). Significant higher BV* (p = 0.002), MTT* (p = 0.009) and PS* (p = 0.003) in NSCLC* patients than SCLC* patients at follow-up. A significant decrease in MTT* (p = 0.0005) in SCLC* patients between baseline and follow-up. | DCE-CT* parameters differ between NSCLC* and SCLC*. DCE-CT* values do not relate to RECIST* and do not improve prediction of OS* in patients treated with conventional chemotherapy. |
| Tacelli et al. 2013 [25] | Prospective | 40 | NSCLC* | 64 | N/A* | 108 mL | Two-compartmental (Patlak) | Can DCE-CT* depict early perfusion changes in lung cancer treated by anti-angiogenic drugs, allowing prediction of response | Group 1 (n = 17): Chemotherapy combined with anti-angiogenic drug Group 2 (n = 23): Chemotherapy | Baseline, 21 days (n = 40), 63 days (n = 34) and 126 days (n = 26) after treatment start | TVV 1 TEF 2 | RECIST* | Group 1: Significant decrease in TVV 1 and TEF 2 between baseline and all three follow-ups (p < 0.05). Significant difference in TVV 1 between responders and non-responders measured at baseline and first follow-up (p = 0.0128). | DCE-CT* can depict early changes in tumor vasculature in NSCLC* patients treated with conventional chemotherapy combined with anti-angiogenic drug. |
| Wang et al. 2013 [26] | Prospective | 74 | NSCLC* | 128 | N/A* | 100 mL | N/A* | Tumor blood volume in DCE-CT* and CEC* might predict the status of angiogenesis. The present study aimed to validate their representation as feasible predictors in non-small-cell lung carcinoma. | Group 1 (n = 38): Chemotherapy combined with anti-angiogenic drug Group 2 (n = 36): Chemotherapy | Baseline and every 6–8 weeks during treatment | BF* BV* MTT* PS* | RECIST* | Group 1: PFS* was significantly longer (p = 0.034) in the CBR 3 group at follow-up. Significant decrease in BV* (p = 0.034) at follow-up compared to baseline in non-PD*. ΔBV* is a significant (p = 0.019) indicator of PFS*. | BV* can predict anti-angiogenic efficacy and is in combination with CEC* more reliably than plain or enhanced CT alone. |
| Zhang et al. 2015 [27] | Prospective | 76 | NSCLC* | 64 | N/A* | 40 mL | N/A* | To study the effectiveness of an anti-angiogenic drug combined with chemotherapy in treating advanced NSCLC* and to evaluate outcome by DCE-CT* imaging. | Group 1 (n = 36): Anti-angiogenic drug administered from day 1 and combined with chemotherapy from day 5 Group 2 (n = 40): Anti-angiogenic drug combined with chemotherapy from the first day | Before chemotherapy start and 45–50 days later | BF* BV* MTT* PS* | RECIST* | Group 1: Significantly fewer patients with PD* (p = 0.039) compared to group 2. Significantly higher RR 4 (p = 0.032) and CBR 5 (p = 0.0045). Significantly difference in decrease of BF* (p = 0.034), BV* (p = 0.019), and PS* (p = 0.006) between group 1 and 2. Significantly difference in increase of MTT* (p = 0.0124) between the two groups. | The study suggests that an anti-angiogenic drug administrated four days before chemotherapy is better than chemotherapy combined with the anti-angiogenic from the first day. DCE-CT* could be a reasonable method for evaluating patients after treatment. |
| Zhao et al. 2014 [22] | Prospective | 25 | Lung cancer | N/A* | 120 kVp 100 mAs | 40 mL | Two-compartmental (Patlak) | To observe the changes in DCE-CT* parameters of patients with early stage lung cancer before and after chemotherapy | Chemotherapy | Baseline and 21–25 days later | BF* BV* PS* PBV* | RECIST* | Patients were divided into responders (n = 15) and non-responders (n = 10) based on a regular CT performed before treatment and 100 days later. Remission group: Significant decrease in BV* (p = 0.023) and PBV* (p = 0.005) after treatment. Non-remission group: Significant increase in BV* (p = 0.016) and PBV* (p = 0.036) after treatment. | Increase in PBV* in the early stage after chemotherapy indicates that patients are not sensitive to treatment. Decrease in PBV* indicates the opposite. Change of PBV* is valuable for assessment of effects of chemotherapy. |
| Author, Year | Study Design | Patients | Diagnosis | Scan Parameters | Kinetic Model | Aim | Treatment | Perfusion Scan | DCE-CT* Values | Gold Standard | Results | Conclusion | ||
|---|---|---|---|---|---|---|---|---|---|---|---|---|---|---|
| Slice | kVp mAs | Contrast | ||||||||||||
| Radiotherapy | ||||||||||||||
| Ng et al. 2007 [16] | Prospective | 16 | NSCLC* | 16 | 80 kVp 120 mAs | 108 mL | Two-compartmental (Patlak) | To assess the in vivo acute vascular effects of fractionated radiotherapy for human NSCLC* using DCE-CT*. | Palliative fractionated radiotherapy | Baseline, 1 week (n = 16), 2 weeks (n = 8) and 3 weeks (n = 6) later | BV* PS* | N/A* | BV* increased significantly when comparing first (p = 0.025), second (p = 0.018) and third (p = 0.002) follow-up with baseline. After second and third follow-up an increase in both BV* (p = 0.034 & p = 0.0012) and PS* (p = 0.022 & p = 0.0048) were found in the rim of tumor. | Radiation increases BV* and PS* in NSCLC* and these vascular effects are more pronounced at the rim compared to center |
| Ng et al. 2007 [15] | Prospective | 8 | NSCLC* | 16 | 80 kVp 120 mAs | 108 mL | Two-compartmental (Patlak) | To study the tumor vascular effects of radiotherapy and subsequent administration of vascular disrupting agent (CA4P) in patients with advanced NSCLC* using DCE-CT*. | Hypo-fractionated palliative radiotherapy and CA4P | Baseline, 1 week later before CA4P, 4h after CA4P and 72 h after CA4P | BV* PS* | N/A* | BV* decreased significantly four hours after CA4P (p = 0.029) which sustained to 72 h (p = 0.025). PS* increased significantly in tumor rim after second fraction (p = 0.0073). Four hours after CA4P, BV* decreased significantly more in tumor rim (p = 0.035) than tumor center (p = 0.0077). This sustained to 72 h (p = 0.014 & p = 0.012, respectively). Increase in PS* after radiotherapy correlated to reduction in BV* after CA4P at tumor rim (p = 0.020). | Radiotherapy enhances the tumor anti-vascular activity of CA4P in human non-small-cell lung cancer, resulting in sustained tumor vascular shutdown. |
| Ng et al. 2010 [17] | Prospective | 15 | NSCLC* | 16 | 80 kVp 60 mAs | 108 mL | Two-compartmental (Patlak) | To assess the distribution of BV* in lung tumor, and to establish if whole tumor assessment is more representative of the vascular effect of radiotherapy than conventional single level. | Palliative fractionated radiotherapy | Baseline and 1 week later | BV* | N/A* | BV* increased significant (p = 0.049) after radiotherapy using whole tumor evaluation but not with single tumor evaluation. | Whole tumor DCE-CT* may be a better predictor of vascular changes following therapy compared to conventional single tumor level evaluations. |
| Chemoradiotherapy | ||||||||||||||
| Wang et al. 2009 [28] | Prospective | 35 | NSCLC* | 16 or 8 | 120 kVp 50 mAs | 50 mL | N/A* | To evaluate changes in tumor perfusion values after chemo-radiation therapy, and to investigate the feasibility of DCE-CT* for prediction of early tumor response and prognosis of NSCLC*. | Chemotherapy, radiation therapy or concurrent chemoradiotherapy | Baseline (n = 35) and after two cycle chemotherapy or before the end of radiotherapy (n = 22) | BF* BV* MTT* PS* | RECIST* | BF* at baseline were significantly higher (p = 0.023) in responders than non-responders. The follow-up patients were divided into two groups due to changes in PS* after treatment. The group with decrease of PS* (n = 11) had a significant longer median PFS* (p < 0.001) and median OS* (p = 0.004) than the group with increase in PS* (n = 11). | NSCLC* with high perfusion is relatively sensitive to chemo-radiation therapy. DCE-CT* is useful in predicting early tumor response and the prognosis of NSCLC* after treatment. |
| Others | ||||||||||||||
| Hegenscheid et al. 2009 [23] | Prospective | 12 | Pulmonary metastases (n=22) | 8 | 120 kVp 115 mAs | 40 mL | Deconvolution | To use DCE-CT* to monitor early vascular changes in tumor perfusion after laser-induced thermotherapy (LITT) and to determine whether any of the perfusion parameters would predict technical success after therapy. | LITT | Baseline, 1 day and 4–6 weeks after treatment | BF* BV* MTT* PS* | RECIST* | Significant decrease in BV* (p < 0.001), BF* (p < 0.001) and PS* (p < 0.001) 1 day after treatment compared to baseline. Significant increase in MTT* (p < 0.498) 1 day after treatment compared to baseline. | DCE-CT* can be useful for assessing tumor vascularity and changes in perfusion after LITT. Significant reduction in BV*, BF* and PS* 1 day after treatment could indicate technical effectiveness. |
| Jiang et al. 2012 [18] | Randomized clinical trial | 15 | NSCLC* in patients who were hypoxia-positive indicated by SPECT/CT | 16 | 120 kVp 50–80 mAs | 40 mL | N/A* | To confirm that RHES* has a “time window” of vascular normalization also in human tumors. | Research group (n = 10): RHES* for 10 days Control group (n = 5): No treatment | 1, 5 and 10 days after treatment | BF* BV* MTT* PS* | N/A* | Research group: Significant increase in BF* (p < 0.01) from day 1 to day 5. Significant decrease in BF* (p < 0.01) from day 5 to day 10. Significant decrease in PS* (p < 0.01) from day 1 to day 5. Increase trend in PS* (p = 0.69) from day 5 to day 10. BV* in the research group were significant higher (p = 0.000) on day 5, than in the control group. PS* in the research group were significant lower (p = 0.001) on day 5, than in the control group. | The study confirms that there is a RHES* “time window” of vascular normalization in human body. |
| Li et al. 2014 [29] | Prospective | 42 | NSCLC* | 320 | 80 kVp 40 mAs | 50 mL | Single-compartmental (Maximum slope) Dual input (Aorta & Pulmonary artery trunk) | To evaluate tumor perfusion using dual-input DCE-CT* in advanced NSCLC* and to determine whether the effect of multiarterial infusion chemotherapy can be predicted in light of perfusion parameters. | Intra-arterial chemotherapy | Baseline | Bronchial flow Pulmonary flow Perfusion Index | RECIST* | At baseline responders had a significant higher bronchial flow (p = 0.02) compared to non-responders. Bronchial flow is a significant prognostic factor for PFS* (p = 0.01) and OS* (p = 0.02). | Dual-input DCE-CT* may be useful in predicting effect of treatment. Tumors with high bronchial flow may have a good response to treatment. Bronchial flow is a significant prognostic factor for PFS* and OS*. |
| Lind et al. 2010 [19] | Prospective | 23 | NSCLC* | 64 | 100 kVp 80 mAs | 50 mL | Single-compartmental (Maximum slope) | To investigate the feasibility of DCE-CT* in NSCLC* patients receiving anti-angiogenic and anti-EGFR* treatment, and to correlate tumor BF to treatment outcome. | Anti-angiogenic drug & Anti-EGFR* | Baseline, 3 (n = 23) and 6 weeks (n = 19) after treatment | BF* | RECIST* Crabb | Significant decrease in BF* from baseline to week 3 (p < 0.001) and week 6 (p < 0.001), respectively. Responders had a significant lower BF* than non-responders at 3 weeks (p = 0.03) and 6 weeks (p = 0.04). Baseline BF* was significantly lower (p = 0.012) in pt. who developed extensive cavitations than those who did not. Patients with a decrease in BF* larger than the median at week 6 tended to have a longer PFS (p = 0.06) | DCE-CT* appears to be feasible in patients with NSCLC*. This technique demonstrated a decrease in tumor BF* following anti-angiogenic and anti-EGFR* therapy. |
| Qiao et al. 2015 [30] | Prospective | 20 | NSCLC* | 64 | 100 kVp 200 mA | 1.5 mL/kg | Single-compartmental (Maximum slope) | To study the feasibility and clinical value of DCE-CT for early evaluation of targeted therapy in NSCLC*. | Anti-EGFR* | Baseline and 7 days after treatment | BF* PH* TTP* M/A* | RECIST* | Patients who were classified as PR* had a significant decrease in BF* (0.0225) after treatment. PD* had significant increase in M/A* (0.0443) and BF* (0.0268) after treatment. Patients were divided into groups of increase in BF* and decrease in BF*. The group with increase in BF* had a median PFS* of 6 weeks. The group with decrease in BF* had a median PFS* of 54 weeks. (p = 0.0001) | DCE-CT* permits early assessment of targeted therapy efficacy. Increased BF* indicates that tumor do not respond to treatment, whereas decreased BF* suggests that treatment is effective. |
| Study | Risk of Bias | Applicability Concerns | |||||
|---|---|---|---|---|---|---|---|
| Patient Selection | Index Test | Reference Standard | Flow and Timing | Patient Selection | Index Test | Reference Standard | |
| Fraioli et al. 2011 [20] | |||||||
| Fraioli et al. 2013 [24] | |||||||
| Sudarski et al. 2015 [21] | |||||||
| Tacelli et al. 2013 [25] | |||||||
| Wang et al. 2013 [26] | |||||||
| Zhang et al. 2015 [27] | |||||||
| Zhao et al. 2014 [22] | |||||||
| Ng et al. 2007 [16] | |||||||
| Ng et al. 2007 [15] | |||||||
| Ng et al. 2010 [17] | |||||||
| Wang et al. 2009 [28] | |||||||
| Hegenscheid et al. 2009 [23] | |||||||
| Jiang et al. 2012 [18] | |||||||
| Li et al. 2014 [29] | |||||||
| Lind et al. 2010 [19] | |||||||
| Qiao et al. 2015 [30] | |||||||
© 2016 by the authors; licensee MDPI, Basel, Switzerland. This article is an open access article distributed under the terms and conditions of the Creative Commons Attribution (CC-BY) license (http://creativecommons.org/licenses/by/4.0/).
Share and Cite
Strauch, L.S.; Eriksen, R.Ø.; Sandgaard, M.; Kristensen, T.S.; Nielsen, M.B.; Lauridsen, C.A. Assessing Tumor Response to Treatment in Patients with Lung Cancer Using Dynamic Contrast-Enhanced CT. Diagnostics 2016, 6, 28. https://doi.org/10.3390/diagnostics6030028
Strauch LS, Eriksen RØ, Sandgaard M, Kristensen TS, Nielsen MB, Lauridsen CA. Assessing Tumor Response to Treatment in Patients with Lung Cancer Using Dynamic Contrast-Enhanced CT. Diagnostics. 2016; 6(3):28. https://doi.org/10.3390/diagnostics6030028
Chicago/Turabian StyleStrauch, Louise S., Rie Ø. Eriksen, Michael Sandgaard, Thomas S. Kristensen, Michael B. Nielsen, and Carsten A. Lauridsen. 2016. "Assessing Tumor Response to Treatment in Patients with Lung Cancer Using Dynamic Contrast-Enhanced CT" Diagnostics 6, no. 3: 28. https://doi.org/10.3390/diagnostics6030028