1. Introduction
An elusive and controversial concept, frailty is thought to be highly prevalent in old age, particularly in those with low education and low socioeconomic status [
1]. The majority of published diagnostic criteria for frailty focus on multiple tests of physical function, for example, the widely used “Fried criteria” [
1]. According to Fried (2001), the phenotype of clinical frailty is characterized by a critical mass of three or more “core frail elements” which are: (i) weight loss >10 lbs. in past year; (ii) weak grip strength (lowest quintile); (iii) exhaustion (by self-report); (iv) slow gait speed (lowest quintile); and (v) low physical activity (lowest quintile). Similarly, Ensrud (2007) identified the frailty phenotype as having the following components: (i) unintentional weight loss; (ii) self-reported fatigue; and (iii) diminished physical activity, defined as impaired grip strength and reduced gait speed [
2]. Campbell (1997) [
3] measured frailty by using the following specific tests: (i) grip strength; (ii) chair stand; (iii) sub-maximal treadmill performance; (iv) 6 min walking test; (v) the Static Balance Test; (vi) Body Mass index (BMI); (vii) arm muscle area (to assess sarcopenia: the muscle loss associated with frailty); and (viii) the Mini Mental State Examination (MMSE) [
4] to assess cognitive impairment. Cognitive decline may lead to increased risk of physical frailty, but frailty can also precede possible later dementia. One study showed that at post-mortem, Alzheimer’s disease (AD) pathology was associated with frailty in both people with and without dementia [
5]. Risk for frailty was doubled in people with AD pathology, independent of a history of other disease and level of physical activity. Even those who were physically frail with no cognitive impairment at baseline had a higher risk of developing AD at follow-up. Frailty may thus also be an early predictor of AD risk, occurring before memory loss.
However, the fact that only the criteria developed by Campbell and colleagues [
3] include a measure of cognitive function is indicative of the uncertainty surrounding the relationship between physical frailty and cognitive decline. Physical, psychological, cognitive and social factors may all contribute to this syndrome and may need to be taken into account in its definition and treatment [
6,
7]. Including tests of psychological and cognitive status allows for identification of specific areas of potential disability, which could perhaps be targeted by specific interventions. It is often assumed that physical and cognitive/psychological decline are linked, but there are few epidemiological studies to substantiate this. If physical and cognitive abilities are linked, physical interventions may be effective in reducing cognitive decline. However, physical exercise intervention studies in the elderly have not found consistent positive effects on cognitive function [
8,
9].
Whether only one or several assessments are useful in diagnoses of frailty is also important for the complexity and cost of screening. In contrast to criteria requiring multiple and costly assessments, Abate (2007) suggested that both self-report and an objective evaluation of physical performance would be the best indicators of frailty in elderly subjects [
7]. Others also used fewer tests than those described in the criteria above. For instance, Ravaglia (2008) only used a cut-off point of 24 on the Tinetti gait and balance performance test to obtain a “frailty score” [
10]. However, their prognostic score was not adequately tested in a cohort of elderly, and sensitivity and specificity of this test needed further investigation. Syddall (2003) only examined grip strength as a single marker for frailty [
11]. Guyatt (1985) investigated participants’ performance on a 6-min walking test and concluded that this by itself was a useful and acceptable measure of functional exercise capacity, and a meaningful predictor of frailty [
12].
The present study employed widely used tests for frailty and dementia to assess whether physical and cognitive impairments affecting activities of daily living would cluster together in the elderly. Cognitive function measures included the Mini-Mental State Examination (MMSE) [
4], which is widely used in dementia diagnosis. The Hopkins Verbal Learning Test [
13,
14] is less well known, but was earlier described for its validity in diagnosing dementia in Chinese elderly from Beijing and Shanghai, using the same cut-off scores as those used in Australia, Indonesia and Oxfordshire (UK) [
13,
14,
15]. Activities of Daily living (ADL) were also assessed as they are highly relevant to quality of life and are widely used in dementia, frailty and disability diagnosis.
Tests for physical frailty, such as grip strength, gait speed and balance, were identified based on criteria mentioned above. Loss of grip strength is strongly associated with increasing chronological age [
16]. Lower grip strength is associated with incident as well as prevalent disability, and can be predictive of morbidity and mortality [
17]. Rantanen (1999) also found that hand grip strength was highly predictive of functional limitations and disability 25 years later [
17]. The Timed Get Up and Go Test (TUG) was examined in a community-based study in America and proved to be a good predictor of falls (sensitivity 87%, specificity 87%) [
18]. A community-based study conducted among elderly in Ireland concluded that lower score on the TUG test was associated with lower level of cognitive performance, including executive function, attention and memory [
19]. The results indicated that the TUG can be used to predict risk of being frail and cognitively impaired. A loss of balance can increase the risk for falls, which in turn can increase dependency, dementia risk and morbidity [
8]. The Berg balance test [
20] was also used in this study. It was developed as a clinical performance-oriented measure of functional balance specifically in elderly. It was found to be strongly related to TUG scores (
r = −0.81) [
21]. Furthermore, good discriminative ability of the Berg balance test was indicated in predicting falls in a community-based prospective study [
22].
The main aim of this study was to investigate the types and co-occurrence patterns of physical frailty, poor cognitive function and low functional independence in a cohort of elderly participants, using a data-driven approach to derive clusters of the common phenotypes of ageing. Detecting such shared patterns of age-related decline and healthy ageing may provide a useful guide for further development of assessment criteria and test selection, and help to shape intervention and plans to support healthy ageing. Finally, most frailty research has been conducted in Western countries, including Canada, the USA, Europe and Australia [
1,
23,
24,
25,
26,
27,
28,
29]. The present study investigated a cohort based in Shanghai (China), adding to frailty research in Asia where very few similar studies having been conducted [
30].
3. Results
3.1. Demographics and Cognitive Test Results
A total of 170 participants volunteered to participate. Due to missing data on 22 participants the final sample analyzed below included 148 participants. Key demographic characteristics are outlined in
Table 1, including the mean age of 74 years (range 58–92) and the mean education level of about seven years with considerable variance (SD = 4.7). 23% of the current sample had a history of smoking and 18% reported previous alcohol use. The mean MMSE score of 24.5 was well above the dementia threshold, as was the HVLT total recall score of 17.3. The demographics and cognitive test results were similar to those reported in a larger community-based study from the same area in Shanghai, China (Xu, 2015) [
14].
3.2. Correlations
A correlation analysis of 11 variables was first conducted to examine factorability including age, years of education, grip strength, Timed Up & Go (TUG) scores, 15 feet gait scores, Mini Mental Status Exam (MMSE) score, Hopkins Verbal Learning test (HVLT) immediate and delayed recall (IR and DR, respectively), Activities of Daily Living (ADL) score, Berg balance and body mass index (BMI). Due to poor correlation with the other variables BMI was removed; all other variables were significantly correlated. Age and education were significantly correlated with each other (r = −0.38, p < 0.001), and with all the outcome variables (p ≤ 0.002 in all cases). Given the high degree of correlations it was important to determine which cognitive and physical functions were particularly driven by age and/or education, and which of these were key predictors of the functionally important ADL.
To remove these underlying demographic effects, partial Pearson’s r correlations corrected for age and education with all the physical and cognitive variables are shown in
Table 2. Education-corrected age was significantly correlated with all outcome variables, with especially strong correlations with gait and MMSE scores (
r > 0.5 for both). Age-corrected education was a particularly strong predictor of the MMSE score (
r = 0.6), but also of the HVLT delayed recall (
r = 0.44) and 15 feet gait scores (
r = 0.4). Finally, the key predictors of age and education-corrected ADL were balance (
r = 0.54) and MMSE (
r = 0.41), but both gait scores were also significantly correlated (
r = 0.25) with ADL scores.
The age and education-corrected correlation coefficients between the physical and cognitive variables provide an overview of the key relationships between these domains (
Table 3). Cognitive test were internally strongly correlated, with
r ranging from 0.43 to 0.44 for MMSE and HVLT IR and DR, respectively. As expected, HVLT IR and DR scores were highly correlated at
r = 0.60. The physical ability scores were similarly internally correlated, with
r = 0.29 and 0.43 between grip strength and TUG gait and 15 feet gait scores, respectively. Berg balance scores were also significantly correlated with gait scores (
r = 0.49 and 0.52 for TUG and 15 feet gait, respectively). The two gait scores were unsurprisingly highly correlated at
r = 0.76. However, despite the significant balance—gait and grip strength—gait relationships, there was no significant correlation between grip strength and balance. Finally, no significant correlations between any of the cognitive and any of the physical variables remained after correcting for age and education.
3.3. Principal Component Analysis
The sample size of 148 was deemed to be adequate for a PCA with 10 variables as it left data 15 rows per variable. The PCA indicated that 74% of the variance was contained within the first three principal components (PCs), which were analyzed further.
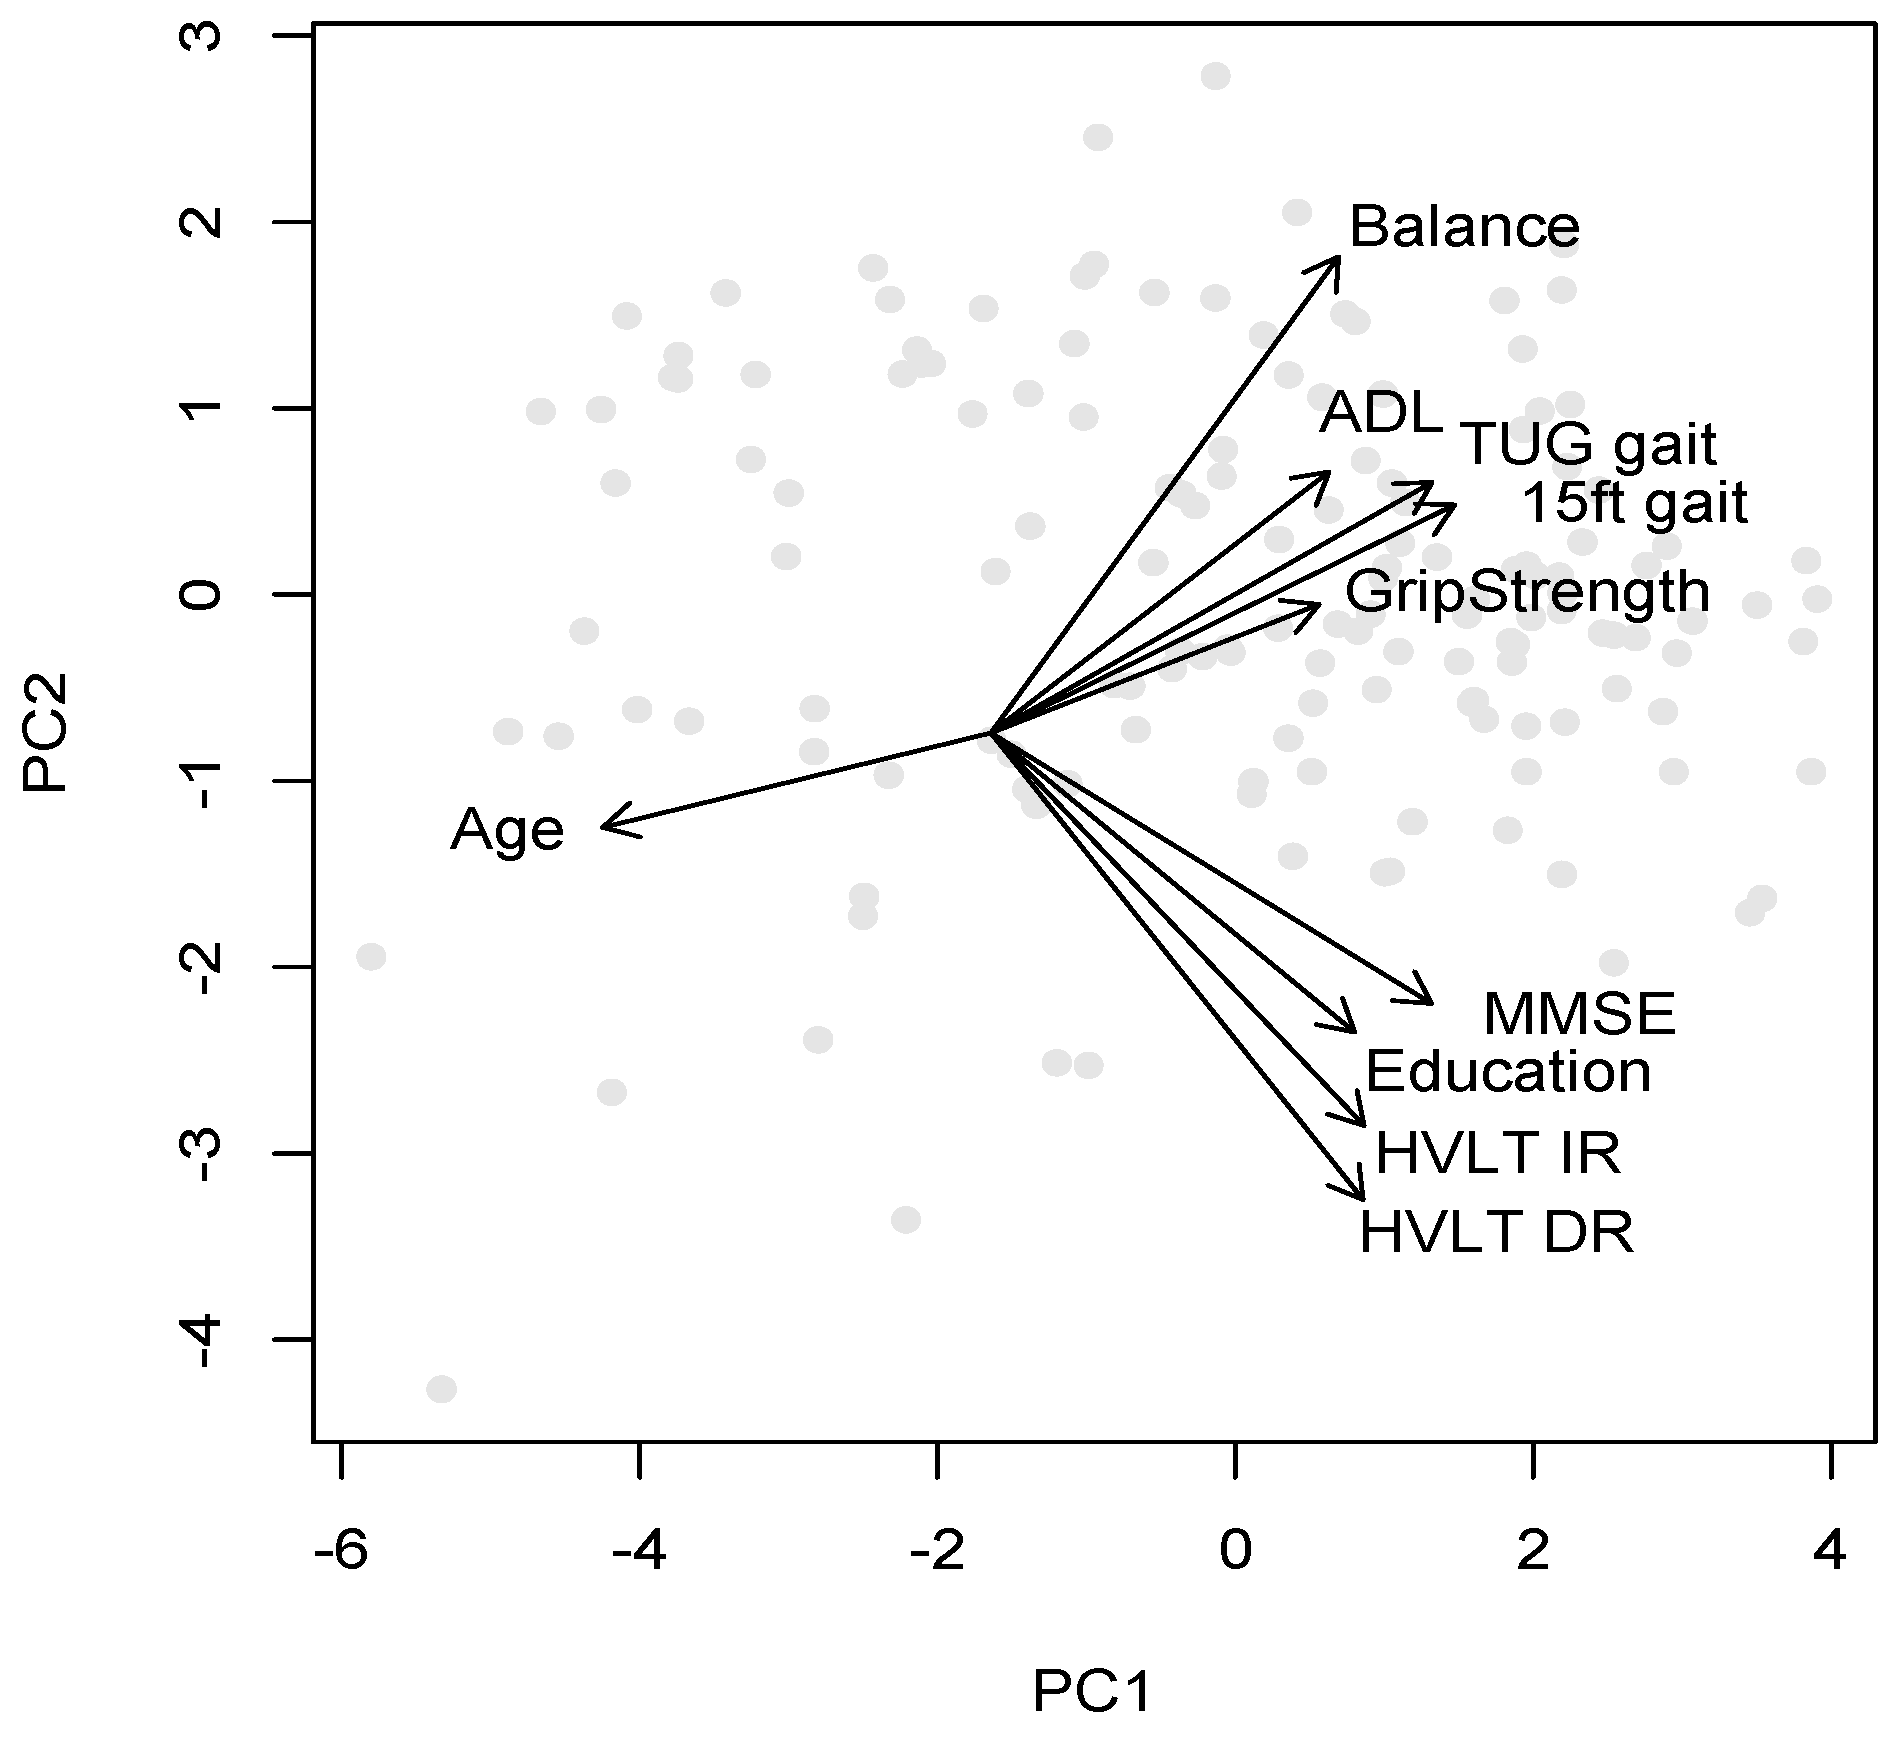
The rotation matrix results detailing the factor loadings onto the first three PCs is listed in
Table 4. If a cut-off score of 0.3 is assumed to represent a significant factor in each component, the first component included age (negative), all the cognitive scores (MMSE, and HVLT IR and DR), and the gait scores. This component explained 52% of the variance and appeared to represent age-related cognitive and physical decline, where education also plays a role, probably largely because of its correlation with age in this cohort, but also because it is a protective factor.
The second component, which explained 13% of the variance, was driven mainly by education, balance and the verbal memory scores HVLT IR and DR, with age being a relatively unimportant factor (−0.1 weight). This component hence appears to reflect largely education levels and cognitive decline, with the strong loading of balance probably reflecting neurological conditions that impact on balance and memory, rather than physical frailty per se. The third component with 8% of the variance was most strongly related to ADL scores, grip strength and balance, reflecting the importance of both of the latter functions for ADL.
The mapping of variables and participants onto the first two principal components is graphically illustrated in
Figure 1, where the origin of the variable direction arrows has been shifted to optimize readability of the variable names. This mapping forms the basis for the cluster plots in the following section, where participants and clusters are plotted along the first two components.
3.4. Cluster Analysis
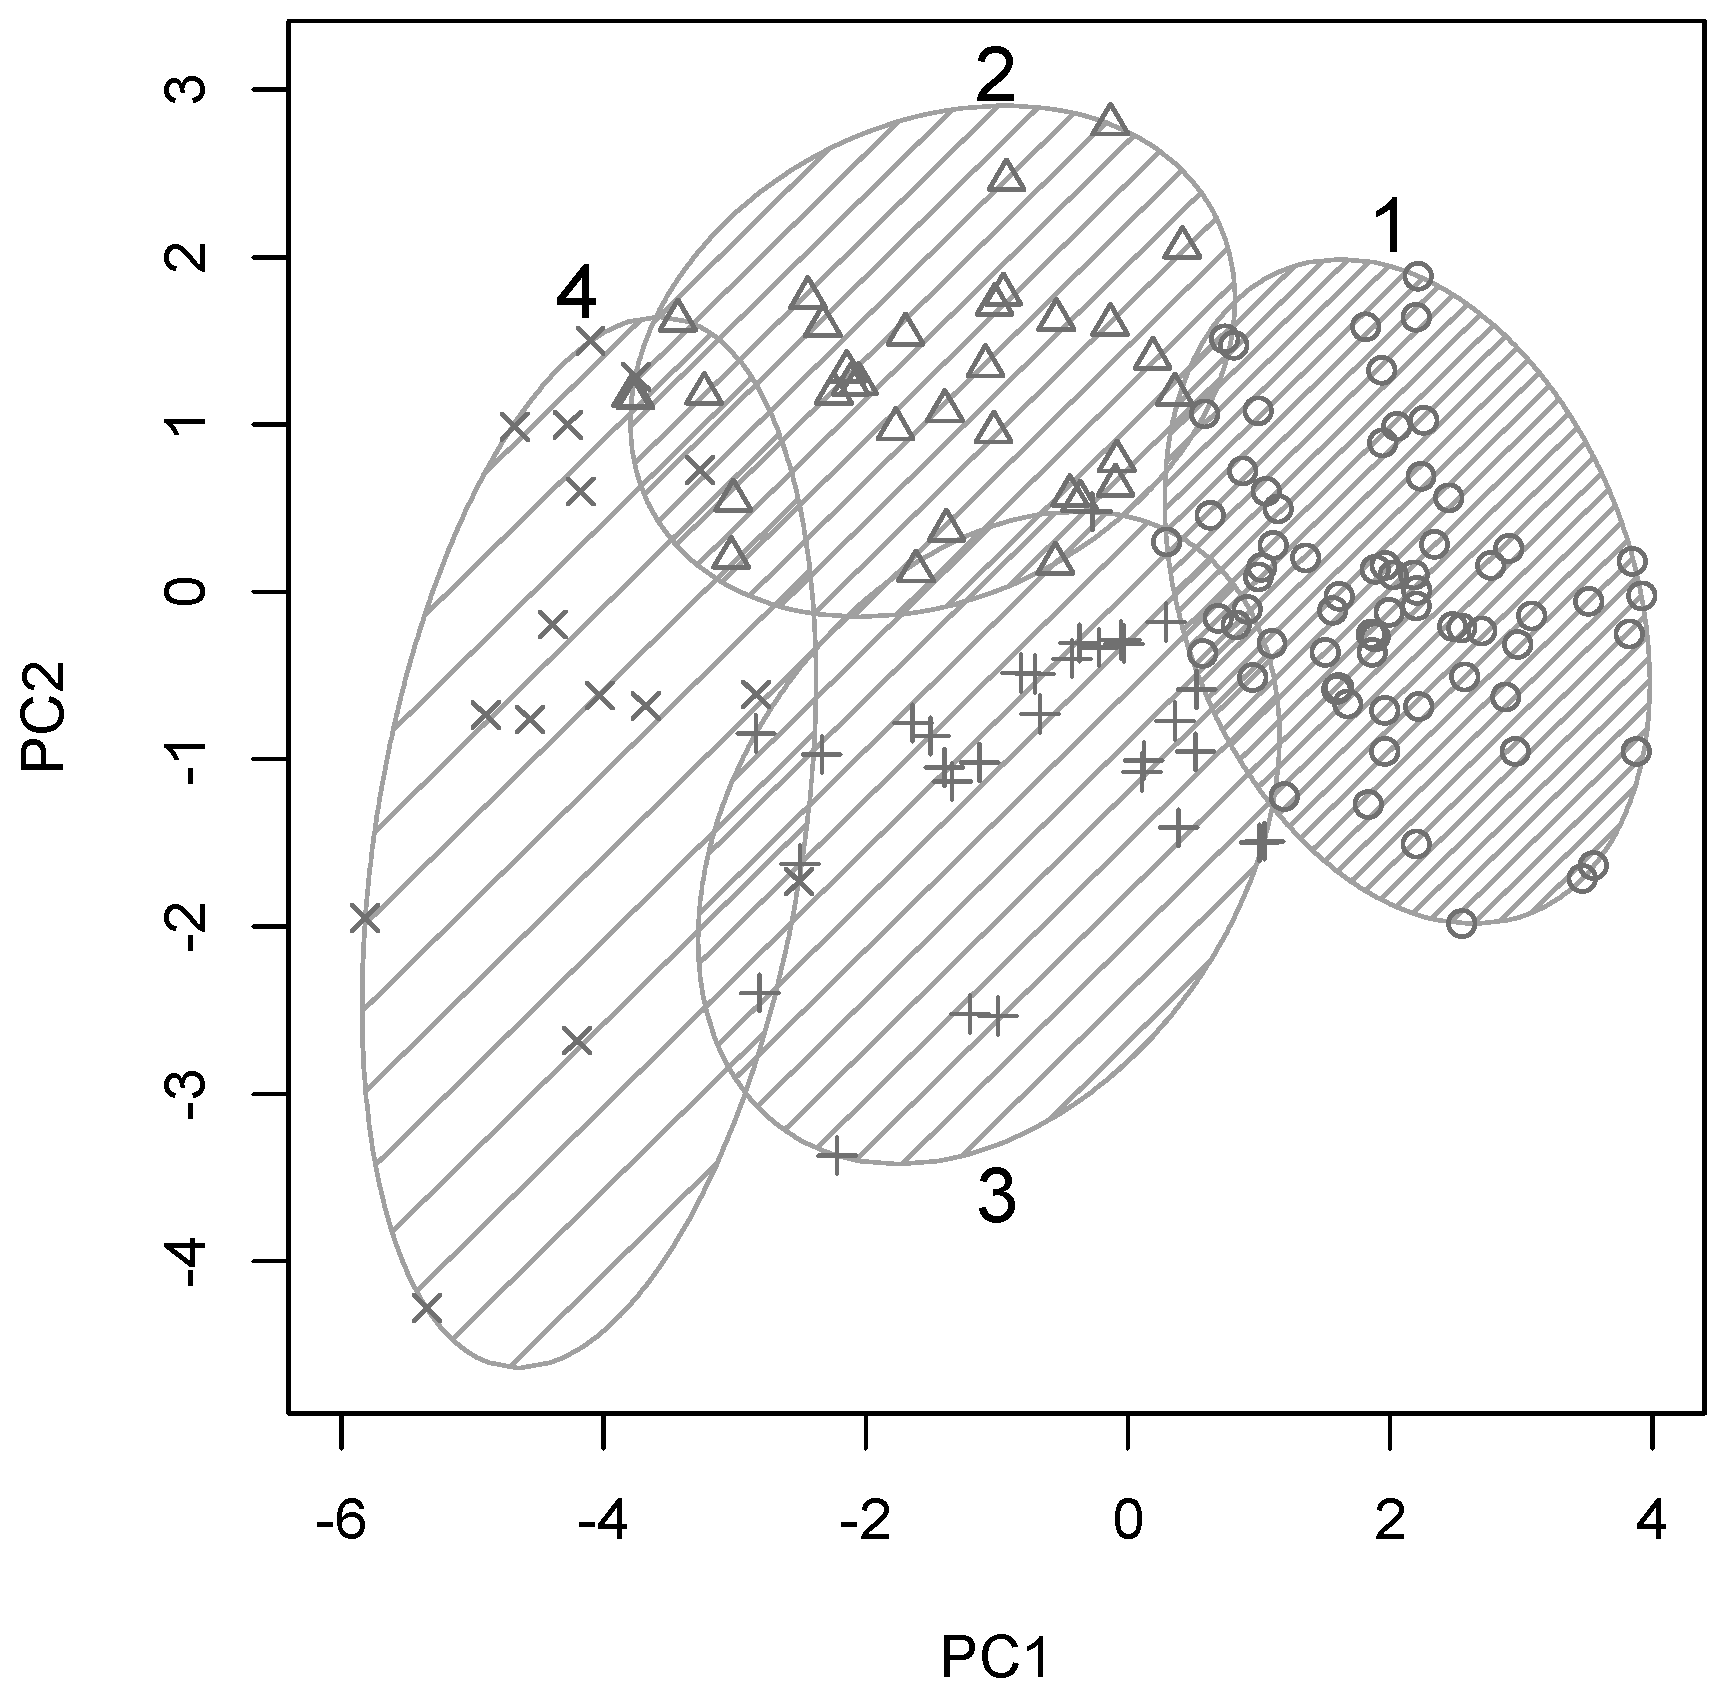
Ward’s minimum variance method was used to arrive at a hierarchical clustering structure for all participants based on their similarity across the 10 variables included in these analyses. A four-cluster solution yielded optimal cluster sizes for a systematic yet detailed group analyses, hence
k-means clustering was used to separate all participants into four optimal clusters. This clustering solution is plotted along the first two principal components in
Figure 2, with clusters shown by numbered ellipses and each participants plotted with one of four symbols to indicate cluster membership.
Cluster 1 (69/148 participants, 47%) appeared to contain the cognitively and physically healthy and mostly younger individual, as it falls on the “young end” of the PC1. At the other end of the spectrum, this cluster reflected largely age-related cognitive and physical decline as described above. Cluster 4 (16/148 participants, 11%) represented the opposite end of the spectrum and included the oldest participants with significant cognitive and physical impairments as it occupies the other end of PC1. Clusters 2 (33/148 participants, 22%) and 3 (30/148 participants, 20%) were situated in between these two extremes on PC1 and differed only with respect to their position along PC2, which was dominated by education and cognitive scores.
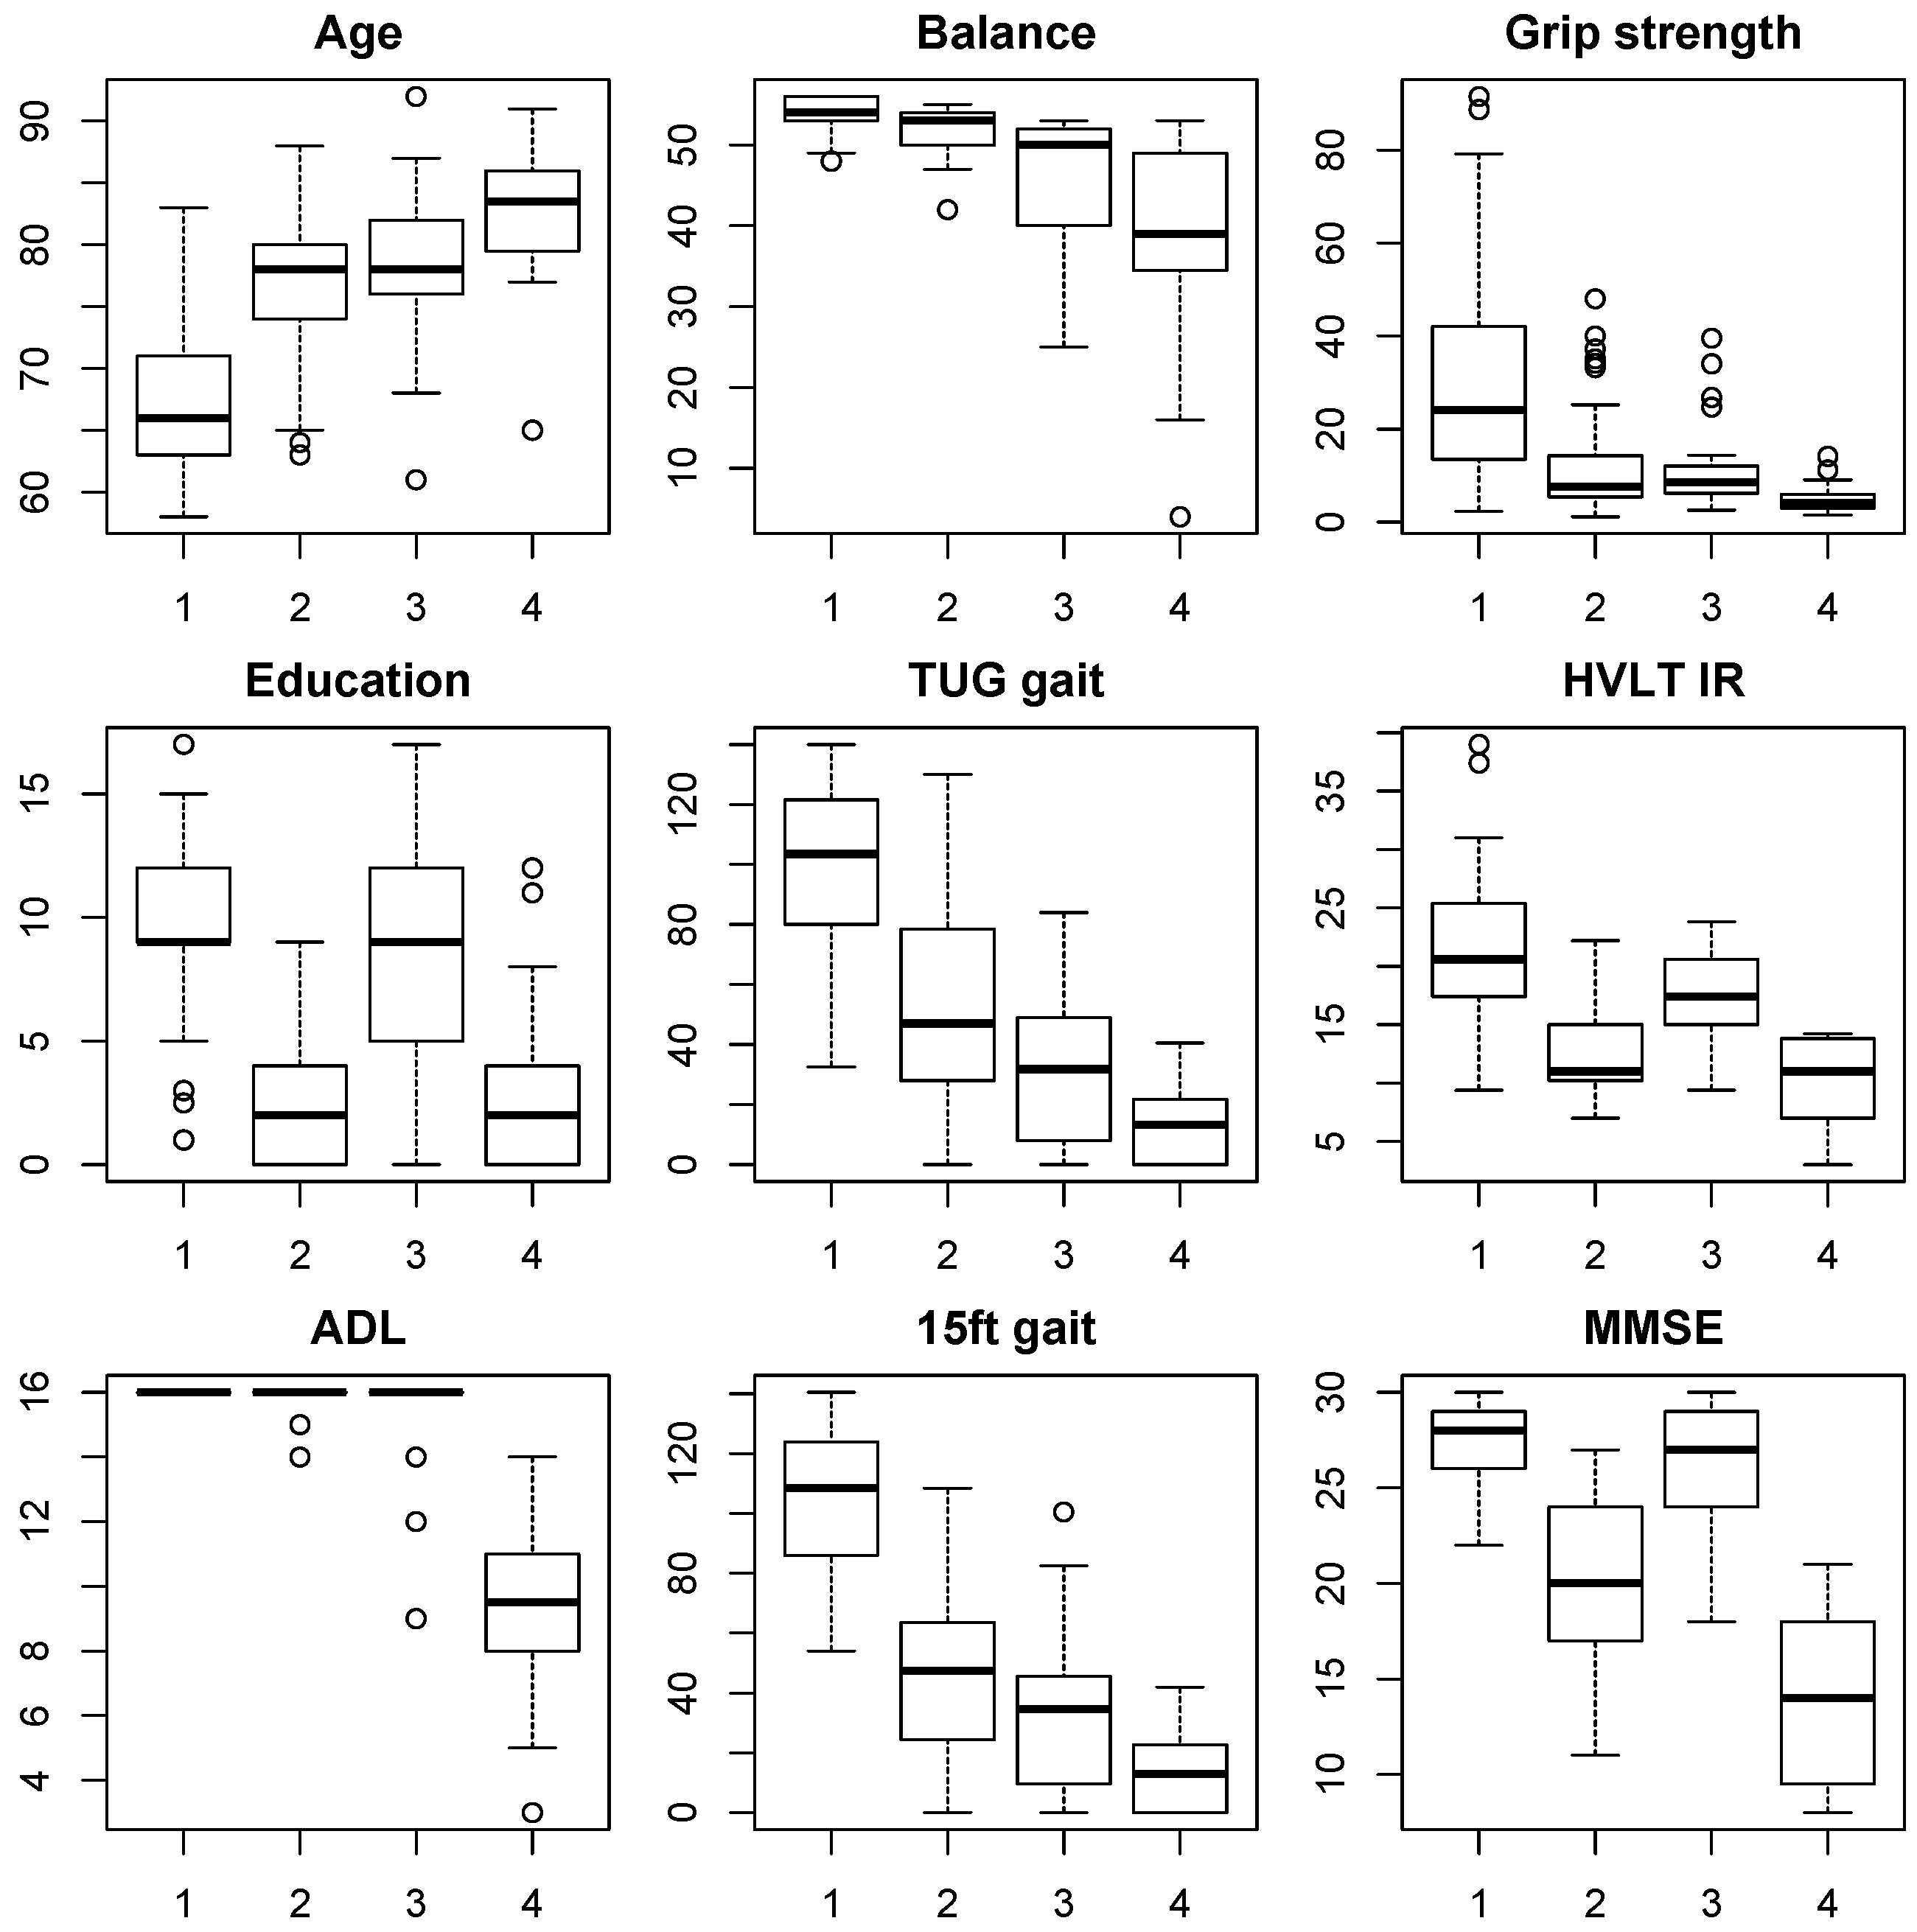
Hence, participants in clusters 2 and 3 were likely to be of similar age but with differences in education, balance and cognitive function. To investigate the characteristics of these four participant clusters in more detail, box plots of all original input variables for each of the four clusters are shown in
Figure 3.
Figure 3 of the individual outcome measures in each cluster confirmed the indications derived from the positioning along PCs 1 and 2, as described above. The majority (47%) of elderly from this Shanghai census based cohort fell into group 1, which was young-old (median age 65 years), had good levels of education (median score 9) and was physically and cognitively robust with no impairments in ADL. In contrast, group 4 (11%) contained the oldest participants (median age 83 years), had low education levels (median 2.5 years), poor ADL, balance, gait, and grip strength scores, indicating the presence of frailty. Cognitive function scores were also very low with a median MMSE score of 14 and HVLT IR score of 11, indicating the presence of dementia.
The intermediate groups 2 and 3 (22% and 20%, respectively) each had the same median age of 78 years but differed significantly with respect to education levels, with a median education score of 2.5 in cluster 2 and a median education score of 9 in cluster 3, which was directly comparable to groups 4 and 1, respectively. Despite the similar ages in cluster 2 and 3, the most apparent difference was found in cognitive function, with the median HVLT IR score of 11 and median MMSE score of 19.5 for group 2 (low education) suggesting prevalence of dementia. In contrast, cognitive function in cluster 3 (high education) remained quite robust with a median MMSE score of 27 being directly comparable to the healthy younger cluster 1 and well above the borderline cut-off for even mild cognitive impairment (24.5). Nevertheless, some early signs of cognitive decline were apparent in verbal memory function with a median HVLT IR score of 17, which was lower than the healthy cluster 1 with a score of 21.
In contrast to cognitive function, physical function scores were actually slightly better in cluster 2 than in cluster 3. Median grip strength scores are almost identical, but both gait scores medians were slightly higher in cluster 2, as were balance scores. These differences were not significant, but they illustrate the fact that the protective effect of education on cognitive functions did not extend to physical outcomes. Furthermore, there were only 2 individuals with small reductions in ADL in group 2, hence the cognitive impairment did not seem to result in significant problems with ADL in this group. Similar good preservation of ADL was found for cluster 3, indicating that overall only the oldest cluster 4 with significant impairments in both physical and cognitive function experienced significant ADL reductions in this cohort.
4. Discussion
In this study we attempted to further investigate the relationship between cognitive and physical function in older age, and their respective impacts on ADL. Partial correlation analysis revealed that age was the main predictor of physical abilities, whereas education was the strongest predictor of cognitive functions. After correcting for age and education effects, independence in ADL was strongly related to good MMSE scores, confirming the functional relevance of this widely used test of global cognitive function. Balance scores were the strongest predictor, and the gait measures were also significantly correlated with ADL scores, underlining the importance of good mobility and balance for functional independence in old age. Surprisingly, grip strength was not correlated with ADL after correcting for age and education. However, it was low in all three older clusters (2–4), and significantly correlated with age and education, as well as the gait scores. In a community-based study conducted in the UK [
11], grip strength proved to be a strongly predictive marker of frailty. In our study it was associated with gait, but not directly with reductions in ADL.
The relationship between cognitive and physical function revealed interesting patterns. First, there were significant correlations between all cognitive and physical outcome measures, which became non-significant after correcting for age and education. This implies that global cognitive function and verbal memory constitute an independent domain from physical mobility, balance and grip strength. Cognitive and physical function thus only showed related patterns of impairment because of the underlying shared determinants age and education. Hence it is important to assess memory, wider cognitive function, mobility and balance especially in older patients who are just beginning to develop signs of functional decline, as the pattern of affected domains can be quite heterogeneous.
Several studies reported that cognitive impairment was associated with physical frailty ([
6,
26,
33,
34]. Furthermore, frail persons were found to be at high risk of developing dementia, and hence poor physical function can assist in predicting dementia [
26]. However, cognitive impairment was still the strongest predictor of dementia in this study because being frail with cognitive impairment increased the risk of developing dementia by almost a factor 5, compared to being frail without cognitive impairment (OR = 4.98, 95% CI = 2.17–11.41
vs. OR = 0.74, 95% CI = 0.27–2.07) [
33]. Accordingly, Kulmala (2013) suggested that cognitive impairment should be considered to be included in the definition of frailty [
33], but results from the present cohort suggest that cognitive and physical impairment may be less related once age and education are taken into account.
In the present study, older people (>79 years of age) who performed poorly on the physical tests were also at risk of cognitive impairment, although there was large variation (cluster 4). This group of people had poor balance (Berg scale <50), impaired scores on the gait tests as well as cognitive scores in the dementia range. A large part of the age and education effects was driven by the strong contrast to the overall healthy cluster 1, where participants were younger (<70 years), had much higher levels of education, and showed no signs of any physical, cognitive or ADL impairment.
The interesting variation in ageing patterns was revealed in the clustering solution in between these two outer ends of the ageing spectrum in clusters 2 and 3, who were of a matched intermediate age (median 78 years). They were just at the cusp of showing impaired physical function, but cluster 3 had much higher education levels (median nine years
versus 2.5 in cluster 2), and correspondingly showed cognitive function levels very similar to the cognitively healthy and much younger cluster 1. In contrast, cluster 2 with low education had the same median HVLT scores as the old and impaired cluster 4, as well as MMSE scores closer to that group than cluster 3, and about half scored below even conservative cut-offs scores (15) for dementia on the MMSE. This extends the significant body of evidence that high education levels can offer significant protection against cognitive decline [
14], and that verbal memory tests are particularly sensitive to education effects [
35]. People with low education may thus show accelerated cognitive decline with age, and this needs to be corrected for in analyses [
14].
Nevertheless, after correcting for age there was a stronger partial correlation between education and MMSE scores (r = 0.6) compared to HVLT scores (r = 0.36 for IR and 0.44 for DR), suggesting that MMSE scores were more sensitive to education than HVLT scores in the present study. The lower HVLT but not MMSE scores in the cognitively more robust cluster 3 compared to the overall healthy cluster 1 may perhaps reflect differences in cognitive reserve that could have been obscured by ceiling effects on the MMSE. Such ceiling and floor effects on the HVLT may go some way towards explaining the stronger education correlation with MMSE scores, and these results should be tested in larger cohorts with a wider range of cultural and ethnic backgrounds.
A key finding was that the protective effect of education on cognition did not appear to extend to physical function, because the better educated cluster 3 actually displayed slightly lower balance and gait scores than the age-matched cluster 2, and grip strength was very similar. Nevertheless, significant positive correlations between education and grip strength and gait scores remained after correcting for age, suggesting that education may also benefit some physical functions in old age. Again, larger cohort studies, ideally with lower correlations between age and education to disambiguate both effects, should be used to further investigate the effects of education and lifestyle on physical function in older age. Like dementia, frailty should also be differentiated from the normal ageing process.
According to a review by Collard [
36], the prevalence of frailty in community studies ranged from 4.0% [
25] to 59.1% [
28], showing substantial variation. This may be due to the varied definition of frailty and use of different age groups from different socioeconomic communities and ethnicities. Others reported that the frailty rate increased gradually with an advanced age, from 4% in the 65–69 age group, to 26% in the 85 and above age group [
37], which is similar to our findings. As defined by people needing help with ADL, our data suggest a 14% prevalence of frailty in the entire cohort (over 50 years of age), and 50% in those over 85 years of age.
However, this percentage is higher compared to the only existing Asian community-based study in which a frailty rate of 4.9% was reported using Fried Frailty Index (FFI) [
30]. This rate is also higher than the figure from Fried’s study (6.9%) [
1], but significantly smaller than another study in European using the FFI [
27]. However, the pre-frailty rate in these three studies is similar to our results (40%, 46.6% and 43.5%, respectively).
The reason for this wide variation in prevalence rates is not entirely clear, e.g., whether there are ethnic differences in frailty phenotypes or the applicability of the frailty diagnostics. The Chinese cohort described here comprised elderly volunteers who survived a childhood without antibiotics and experienced periods of famine and war, which may have led to a healthy survivor and volunteer bias. Subsequent analyses should use a similar approach in cohorts of different ethnic and geographical backgrounds to investigate whether the effects found here apply to elderly people across other cultures and locations. However, prevention by identifying modifiable risk factors is likely to work best when taking regional and cultural specifics into account. For instance, Woo (2002) reported that with increasing urbanization in China in the past decades, levels of physical activity are reduced [
38]. There is also a rural-urban discrepancy in nutritional intake (e.g., 12%–18% of energy is derived from fat in rural areas
versus 20%–31% in urban areas) further exacerbating the risk for obesity and related morbidity (diabetes, heart disease, dementia). Poor nutrition and lack of activity have been associated with dementia and frailty [
1], which might suggest that frailty and cognitive impairment rates may be on the rise in Shanghai, but these factors may not apply in other locations or countries.
Another limitation of the current study is the relatively small sample size. A three-cluster solution was very stable, which essentially grouped the young and healthy separate from an intermediate (by age and cognitive/physical scores) group that included clusters 2 and 3 as described above, and an older and more impaired group similar to cluster 4. However, five or six-cluster solutions would also be possible based on statistics, but then the group size in each cluster became very small so effects became unstable and fragmented. The four-cluster solution presented here was chosen for optimal balance of detail in the group split whilst also preserving reasonable cluster sizes that allowed for a good theoretical interpretation. Larger cohort analysis with better power could investigate more refined cluster solutions to detect more detailed ageing sub-types.
Overall, the majority of participants in the present cohort were cognitively and physically healthy and reported no problems with ADL. Even though this included mostly the younger participants, it is nevertheless an encouraging sign of active and healthy ageing in this cohort. In sum, 28% of participants needed help with ADL, with the majority of this group being over 80 years of age. Significant predictors of reductions in functional independence included age, balance, global cognitive function (MMSE) and the gait measures. Cluster analysis revealed a protective effect of education on cognitive function which did not appear to extend to physical function, although several of the physical function outcome measures did show partial correlations with education after correcting for age. Evidence-based models for dementia and frailty prevention measures may be derived if the ageing clusters found here prove to be consistent in other ageing cohort studies.


