Experimental Investigation of Stainless Steel SAE304 Laser Engraving Cutting Conditions

Technical University of Crete, Department of Production Engineering & Management, Micromachining & Manufacturing Modeling Lab., University Campus Kounoupidiana, 73100 Chania, Greece
*
Author to whom correspondence should be addressed.
Machines 2018, 6(3), 40; https://doi.org/10.3390/machines6030040
Submission received: 2 July 2018
/
Revised: 22 August 2018
/
Accepted: 23 August 2018
/
Published: 3 September 2018
(This article belongs to the Special Issue Precision Machining)
Abstract
:Laser machining processes are a new entrant and a rapidly evolving type of non-conventional machining process which allows the machining of complex geometries with high precision, surface quality and productivity in a wide range of materials. Thus, the need for creating a method has emerged that will help the laser machine operator to select the optimal process parameters. In this study an experimental investigation of the effect of the process parameters on the effectiveness of the laser engraving process was held. The examined process parameters were namely the average output power, the repetition rate, and the scanning speed. For this purpose 126 experimental samples, with various combinations of process parameters using a nanosecond Nd:YAG DMG MORI Lasertec 40 laser machine on a SAE 304 stainless steel plate were made. The measured criteria which evaluated the effectiveness of the process were the removed material layer thickness and the material removal rate.
1. Introduction
The laser engraving process is a non-conventional, non-contact machining process which is rapidly evolving due to its ability to perform high-precision machining of complex geometries on a wide range of materials. The laser machining processes are gradually gaining ground over the conventional machining processes because of the advantage that there is no contact between a cutting tool and the workpiece. This means the elimination of problems like wear or failure of the cutting tools and the need to replace them periodically, which increases the production cost. Additionally, the laser machining processes facilitate the micromachining of complex geometries in workpieces with small dimensions, which would be impossible in many cases with conventional machining due to limitations from the accessibility and the minimum size of the cutting tool [1].
The basic working principle of the laser engraving process is that the laser beam machine generates laser pulses which provide a large amount of focused heat energy in the workpiece in order to cause the ablation of the material that has to be removed [2]. The manner and the amount of heat energy delivered to the material by the laser beam pulses can be changed by changing the basic process parameters, like the laser beam average power, the laser beam scanning speed, and the repetition rate of the laser pulses [3,4].
The main purpose of this project is the experimental investigation of how the laser beam machining process parameters (average output power, repetition rate, and scanning speed) affect the laser engraving of SAE 304 Stainless Steel by checking the resultant depth and the material removal rate. Laser machining processes are not as widespread as conventional ones because laser technology is at an early stage if we think that its evolution began in the early 1960s. Nevertheless, there are increasing number of research projects on laser machining providing solutions in tasks like the optimization of the generated surface quality, reducing energy consumption, increasing cutting speed, the machining of new materials, etc. Below are some research projects on laser beam machining.
Leone et al. [5] carried out an experimental research project to find the process parameters that play a decisive role in laser milling of aluminum oxide Al2O3 using a 30 W Q-switched Yb:YAG fiber laser machine, to explain the way that process parameters affect the interaction between laser beam and material, and to find the result of changing the process parameters on material removal rate and the surface quality. Kochergin et al. [6] carried out an experimental study whose main purpose was to examine the correlation between the process parameters of the laser machine and the produced surface micro geometry. For the experiments a 50 W Fiber Laser machine with a 50 μm laser spot diameter was used, and the tested materials were titanium BT1-0 and steel 12X18H10T. The process parameters tasted in the experiments were the laser pulse power, the frequency of the pulses and the pulses scanning speed. Angelastro et al. [7] conducted a study about investigating how the process parameters and building strategy affect the result of direct metal laser deposition of 227-F Colmonoy nickel alloy. They used a CO2 laser machine with a 0.3 mm laser spot diameter and a 10 mm thick plate of AISI304 steel as substrate material. Their samples were characterized in terms of roughness, adhesion, micro and macrostructure, porosity, microhardness and relative density and they performed an Analysis of Variance (ANOVA) in order to investigate the influence of the process parameters on the quality of the parts. Casalino et al. [8] performed an experimental investigation and statistical optimization of the process parameters of the selective laser melting process of the 18Ni300 maraging steel by using a Nd:YAG laser machine. They examined the hardness, the mechanical strength, and the surface roughness of the samples and showed that those values are correlated positively to the part density. Manninen et al. [9] investigated how the laser pulse length affects laser engraving effectiveness of 304 stainless steel. They used a 20 W Ytterbium Fiber Laser for the experiments. The only process parameter tested was the pulse duration in a range between 4 and 200 ns. The effectiveness of the laser engraving processes was checked by the following factors: high material removal rate, good visual quality of the machined surface, and low material temperature during the process.
2. Materials and Methods
2.1. Laser Engraving Process
In the laser engraving process a focused laser beam is scanned over the workpiece. The energy of each laser pulse is absorbed by the workpiece and this heats the material, causing melting and finally vaporizing to a gas [10,11]. The phase transition from solid to vapor is referred to as an ablation process. As the evaporated material is ejected there is a material removal which finally gives the thickness of the single removed layer. By removing multiple layers of material with a different scanning pattern for each one, a 3D shaped surface structure can be produced [12].
Figure 1a presents a schematic illustration of the laser engraving process. The laser beam spot scans the workpiece material surface in a specific, predefined way (scanning strategy) and laser beam pulses are generated periodically, causing the ablation and the removal of the target material.
The material removal is affected by the characteristics of laser beam, the properties of the workpiece and the way they both interact [13,14]. The workpiece properties depend on the material and the geometry, with the most important being density, melting-vaporizing temperatures, specific heat capacity, heat conductivity, latent heat of melting-evaporation, and absorptivity-reflectivity in solid-melting states [15]. The laser beam can be characterized by the laser machine parameters, such as laser type, wavelength, laser spot diameter, pulse duration, and the process parameters, such as average output power P, repetition rate F and scanning speed V.
Figure 1b shows a picture of the removed material depth caused by 14 successive laser beam pulses in a SAE304 stainless steel workpiece. The picture was taken using a ContourGT-K 3D Optical Microscope. The engraving was performed with a DMG MORI Lasertec 40 machine with a nanosecond Nd:YAG lamp, 1064 nm wavelength and 30 μm laser spot diameter. The process parameters were average output power P = 3.5 W, repetition rate F = 20 kHz and scanning speed V = 500 mm/s.
2.2. Experimental Work
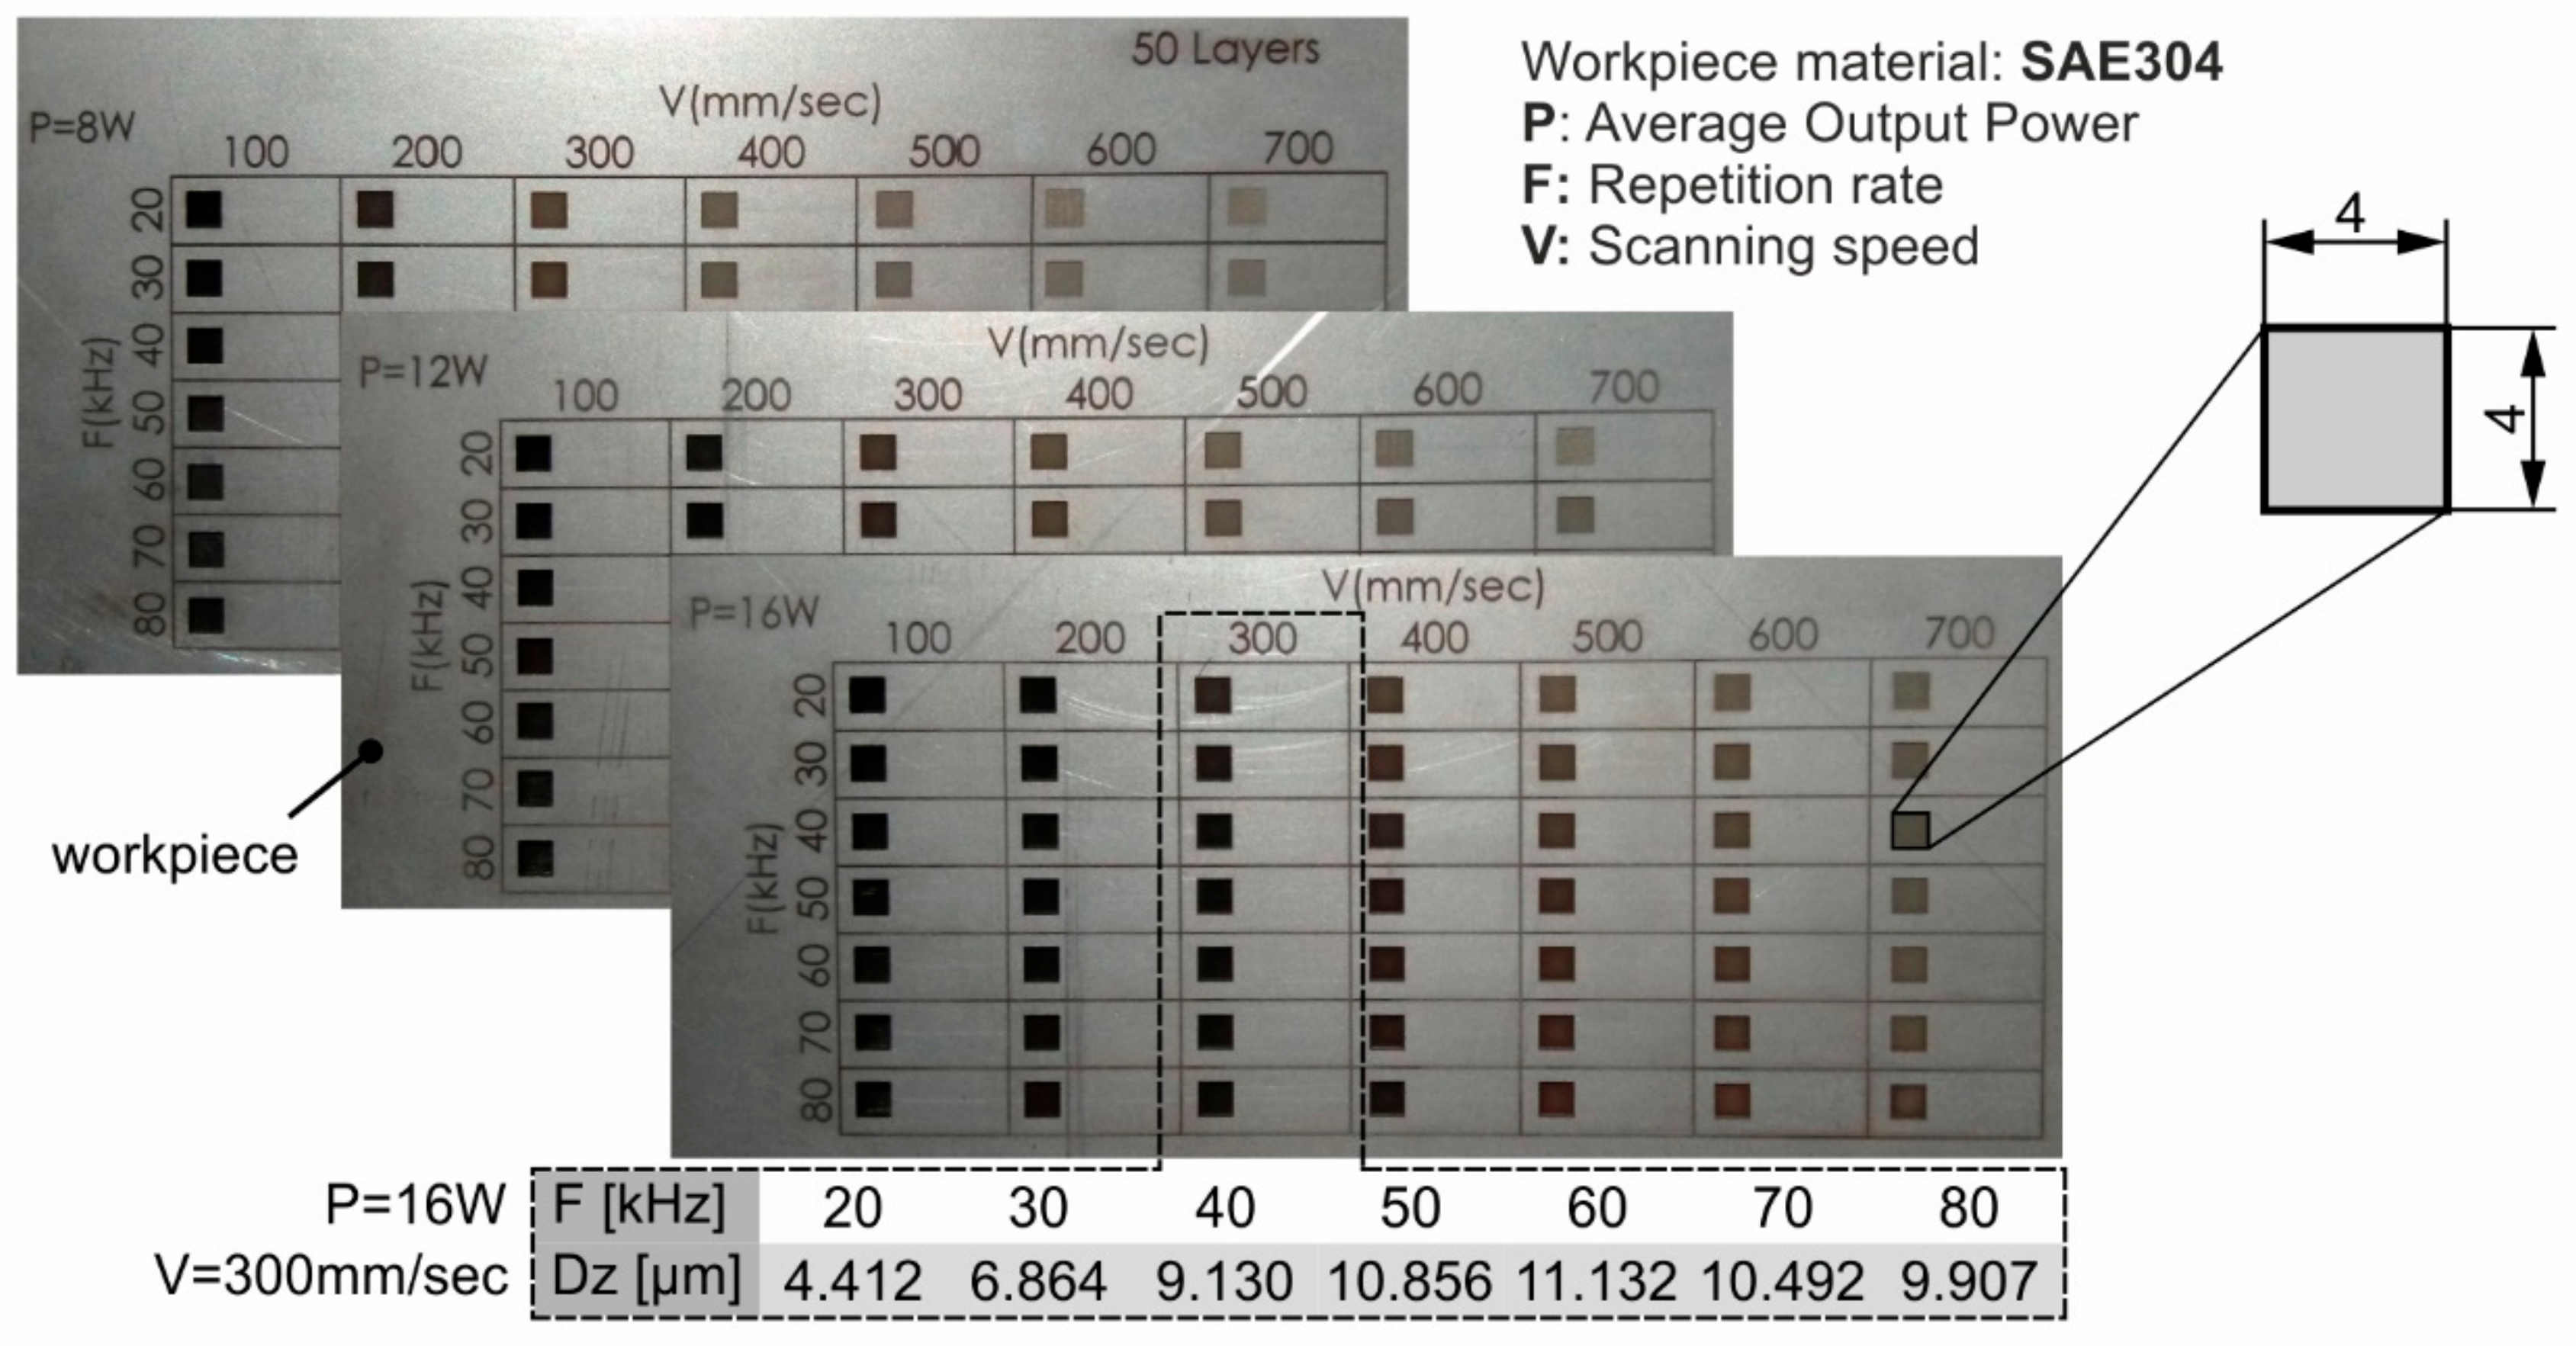
The main objective of this work is to investigate how the laser process parameters affect the removed material layer thickness and the material removal rate in the laser engraving process of AISI 304 stainless steel. For this purpose, experiments were carried out machining 4 mm × 4 mm square samples with a constant number of removed layers (50) with a total of 126 combinations of the three process parameters: average power P, repetition rate F, and scanning speed V. The experiments were performed using a DMG MORI Lasertec 40 machine and a 5 mm thickness SAE 304 stainless steel plate was used as the workpiece material. Figure 2a presents the exterior view of the machine while Figure 2b shows the table on which the workpiece is seated and the mirrors which direct the laser beams.
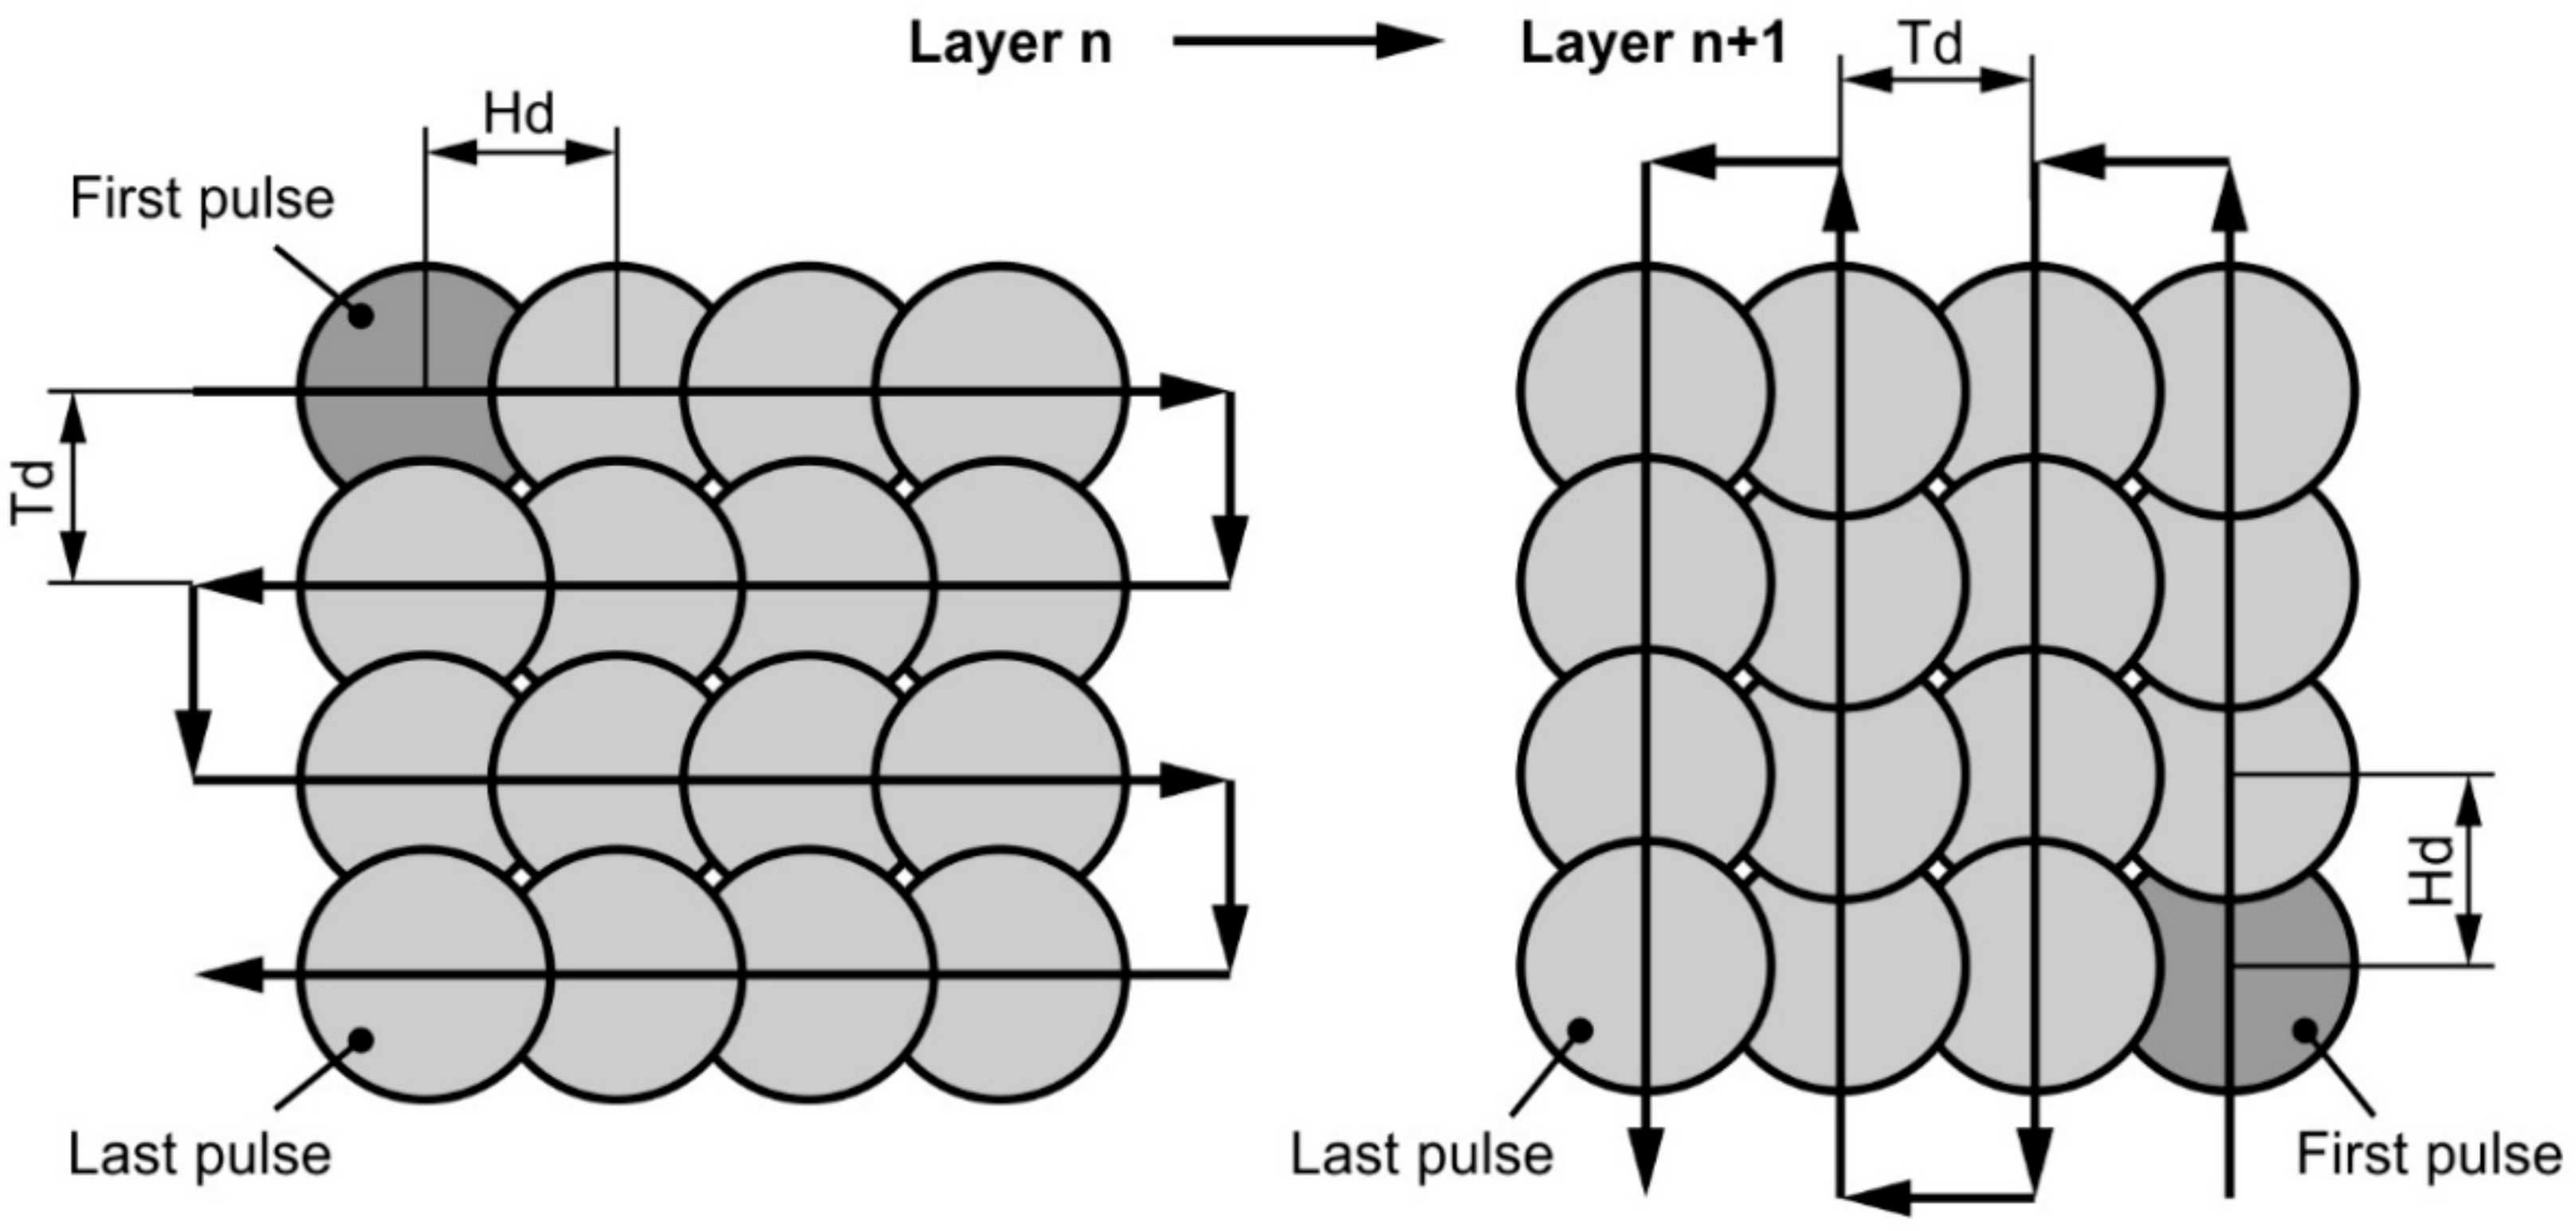
The process parameters were varied as follows: six levels for scanning speed V (200, 300, 400, 500, 600, 700 mm/s), seven levels for the repetition rate F (20, 30, 40, 50, 60, 70, 80 kHz), and three levels for the average power P (8, 12, 16 W). The scanning strategy used on each layer was cross-hatching, as shown in Figure 3. The track distance Td is the distance between two successive laser beam tracks, and the hatching distance Hd is the distance between two successive laser beam pulses in the same track. The track distance Td was set the same as the hatching distance Hd for the experiments and calculated by the following equation [16]:
where: is the hatching distance; is the scanning speed; is the repetition rate; is the track distance.
The overlap degree Od between two following laser pulses is a useful value. It shows how two successive laser beam pulses overlap each other and can be calculated from the hatching distance Hd and the laser spot diameter D by the following equation [16]:
where is the overlap degree; is the hatching distance; is the spot diameter.
The removed material layer thickness Dz for each square sample was calculated by dividing the whole square depth (measured using the laser machine probing system) by the number of layers were performed (50 layers) as shown in the following equation [16]:
where is the removed material layer thickness; is the whole square depth; is the total number of layers.
The material removal rate DV, the value that will determine the optimal processing parameters can be calculated for each combination of process parameters, be the following equation:
where is the material removal rate; is the scanning speed; is the track distance; is the removed material layer thickness.
3. Results
Figure 4 shows the produced workpieces with the different process parameters that were used.
3.1. Layer Thickness Dz
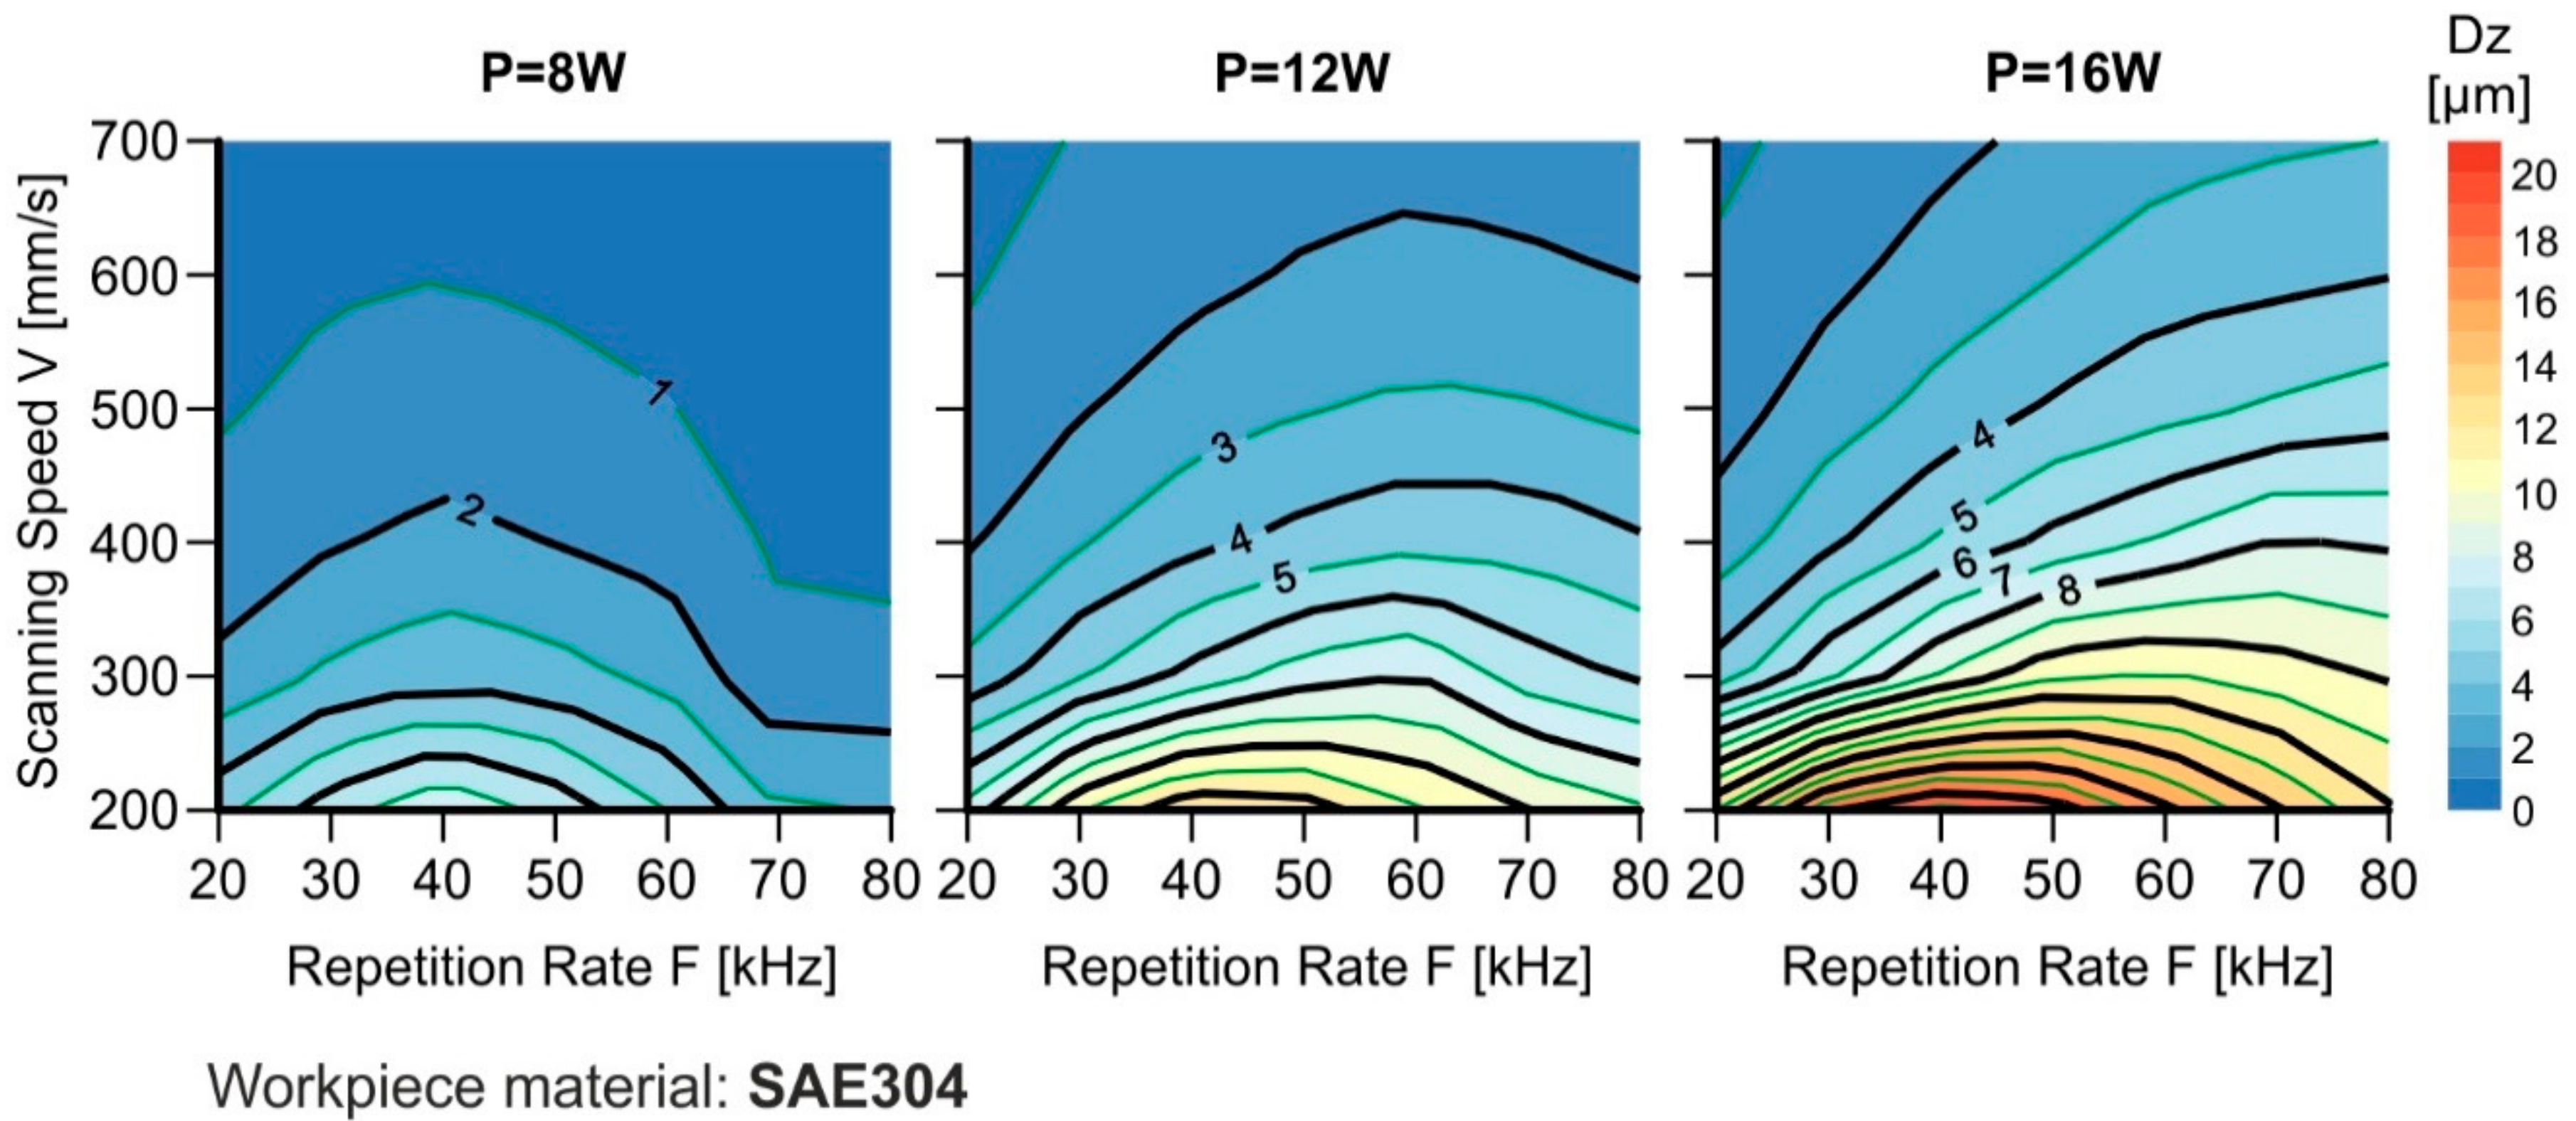
A laser machine probing system was used to measure the depth Dzn. Then the removed material layer thickness Dz was calculated for each sample using Equation (3). The results are shown in Figure 5.
Some conclusions can be drawn from the above graphs about the dependence of the removed material layer thickness Dz on the tested process parameters: average power P, repetition rate F, and scanning speed V. The maximum removed material layer thickness Dz is 19.4 μm and it is observed for process parameters: average power P = 16 W, repetition rate F = 40 kHz, and scanning speed V = 200 mm/s.
Independently of the applied average power P the maximum removed material layer thickness Dz is observed for repetition rate F = 40 kHz and scanning speed V = 200 mm/s, and it is 7.8 μm for P = 8 W, 12.9 μm for P = 12 W, and 19.4 μm for P = 16 W. As far as the average power P is concerned, it is observed that increasing the average power P while keeping the repetition rate F and the scanning speed V stable increases the removed material layer thickness Dz. As for the scanning speed V, it is observed that decreasing the scanning speed V while keeping the repetition rate F stable increases the removed material layer thickness Dz independently of the applied average power P. With regard to the repetition rate F, three cases are distinguished, depending on the applied average power P. For the low average power P = 8 W, the removed material layer thickness Dz maximizes at the repetition rate F = 40 kHz independently of the scanning speed V. For the medium average power P = 12 W, maximizing the removed material layer thickness Dz while keeping the scanning speed V stable requires a repetition rate F in the range between 40 kHz and 60 kHz, starting with the value of F = 40 kHz for low scanning speeds and reaching the value of F = 60 kHz for high scanning speeds. For the high average power P = 16 W the same behavior is observed as for the medium average power but the repetition rate F range at this time is between 40 kHz and 80 kHz, starting with the value of F = 40 kHz for low scanning speeds and reaching the value of F = 80 kHz for high scanning speeds.
3.2. Material Removal Rate DV
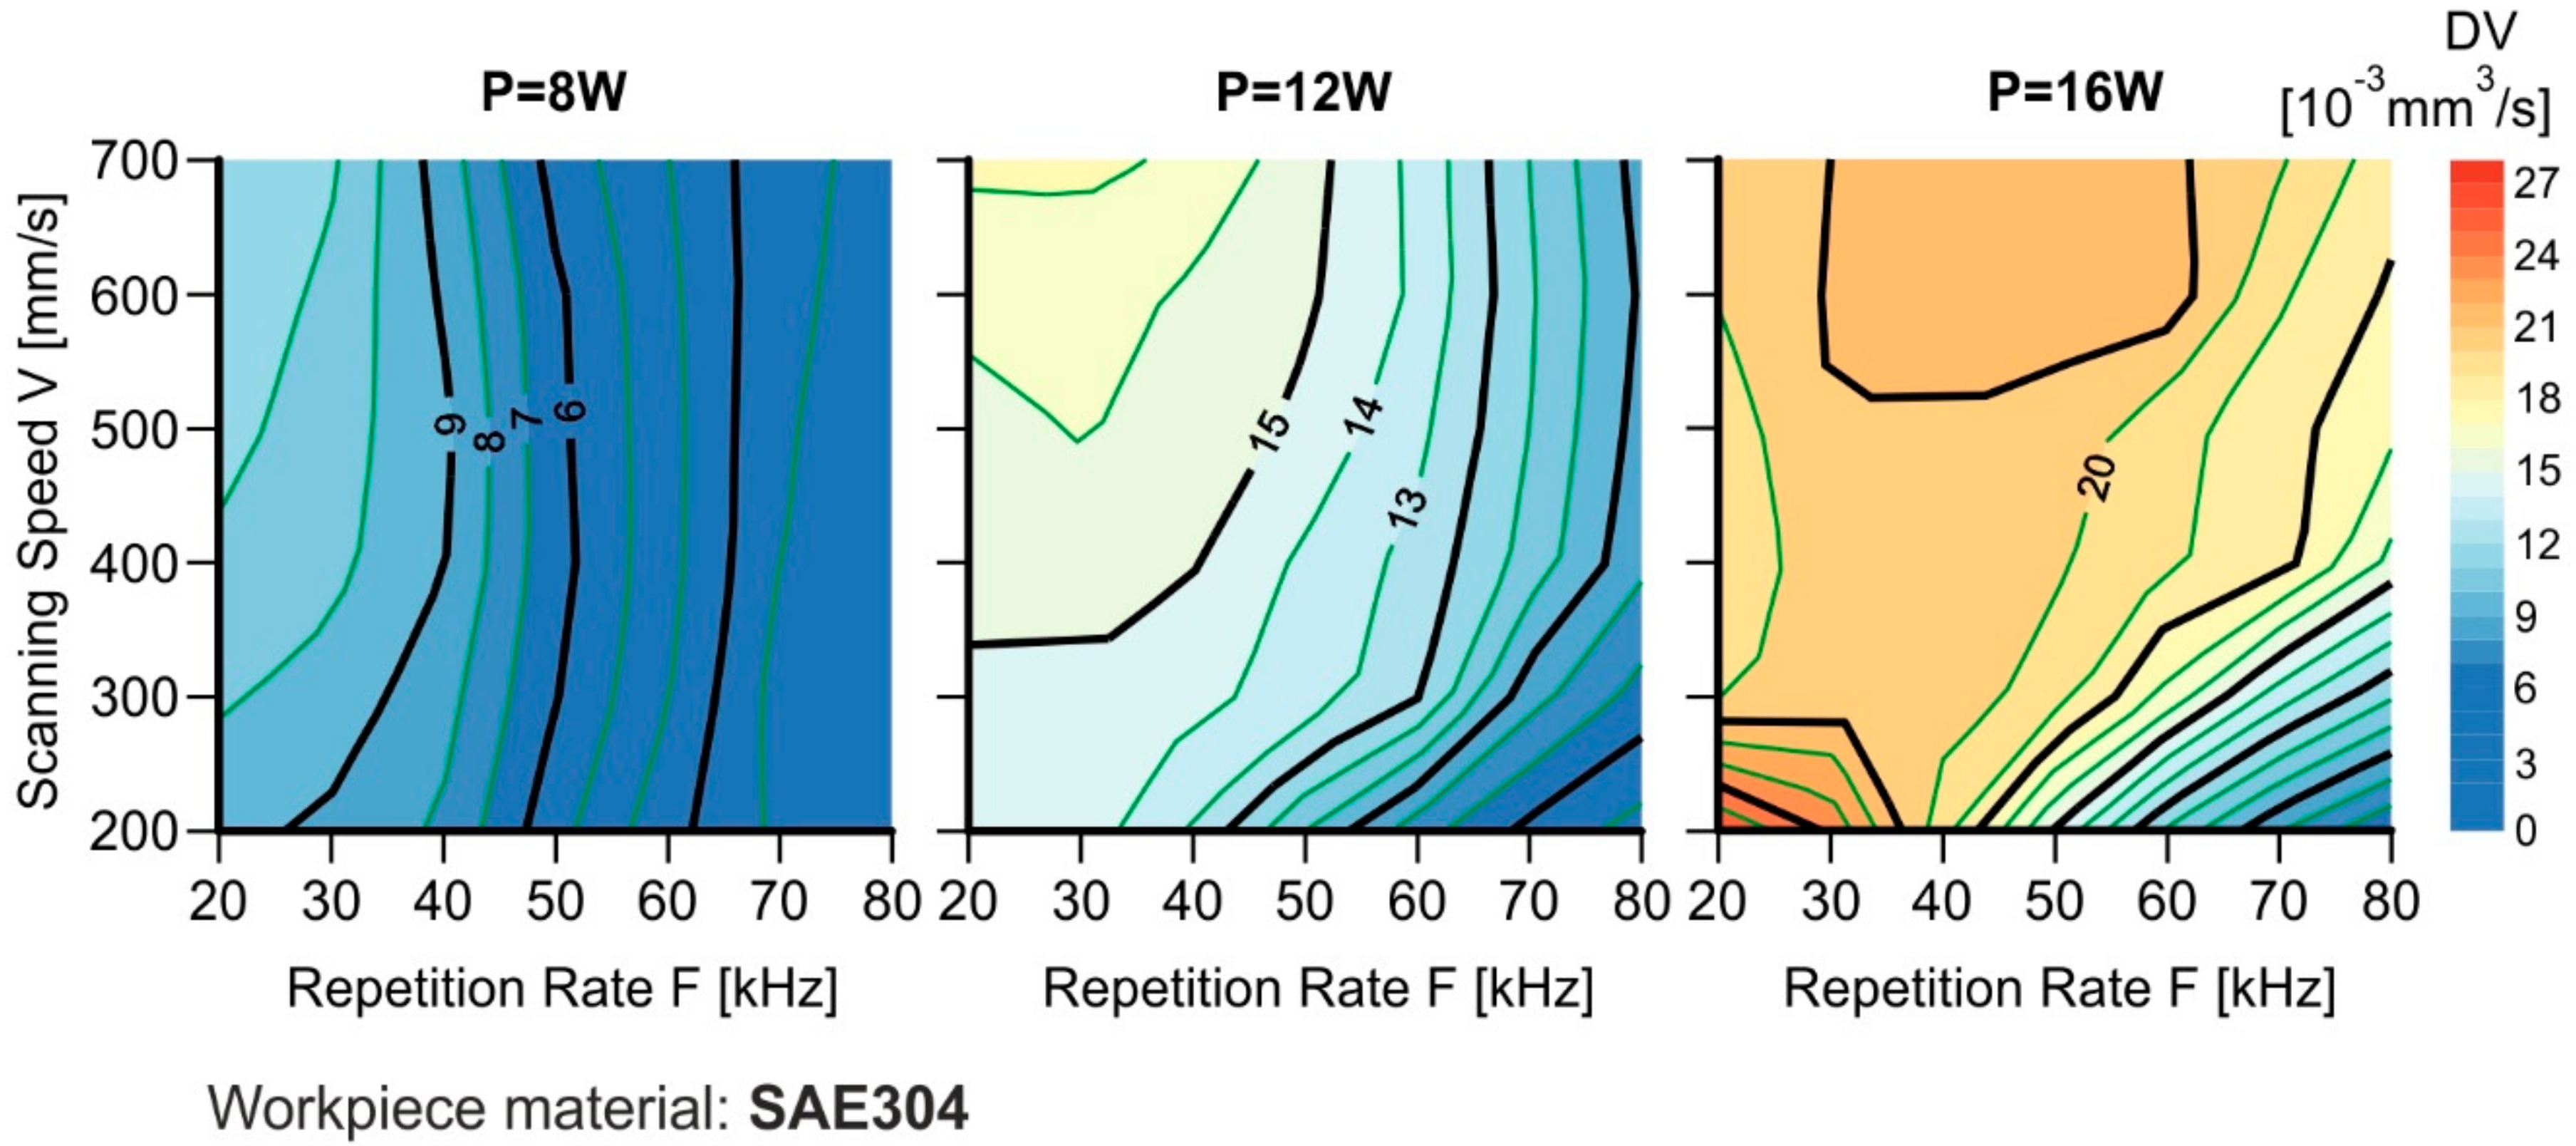
The material removal rate DV of each square can be calculated using Equation (4). The results are shown in Figure 6.
Some conclusions can be drawn from the above graphs about the effect of the tested process parameters on the material removal rate DV. The maximum material removal rate DV is 0.0261 mm3/s and it is observed for process parameters: average power P = 16 W, repetition rate F = 20 kHz, and scanning speed V = 200 mm/s. Independently of the applied average power P, the maximum material removal rate DV is observed for repetition rate F = 20 kHz. For P = 8 W DV is 0.0118 mm3/s at scanning speed V = 600 mm/s, for P = 12 W it is 0.0172 mm3/s at scanning speed V = 700 mm/s, and for P = 16 W it is 0.0261 mm3/s at scanning speed V = 200 mm/s. As far as the average power P is concerned it is observed that increasing the average power P while keeping the repetition rate F and the scanning speed V stable increases the material removal rate DV. As for the scanning speed V, two cases are distinguished, depending on the applied average power P. At the low and medium average powers P = 8 W and P = 12 W, it is observed that increasing the scanning speed V while keeping the repetition rate F stable increases the material removal rate DV. At the high average power P = 16 W, for a repetition rate F in the range between 20 kHz and 40 kHz the material removal rate DV increases by decreasing the scanning speed V, while for a repetition rate F in the range between 40 kHz and 80 kHz the material removal rate DV increases by increasing the scanning speed V. With regards to the repetition rate F it is observed that decreasing the repetition rate F while keeping the scanning speed V stable increases the material removal rate DV. However, a differentiation presents itself in the case of high average power P = 16 W for scanning speed V between 400 mm/s and 700 mm/s: by decreasing the repetition rate F at the beginning, the material removal rate DV increases until it reaches its maximum value for F = 40 kHz, and then a downward trend is observed.
4. Discussion
The purpose of this paper was to investigate the effect of the main laser machining process parameters (average output power, the repetition rate, and the scanning speed) on the effectiveness of the process. For this reason, a set of 126 experimental samples with various combinations of process parameters was made on a SAE304 stainless steel plate. The laser machine which was used was DMG MORI Lasertec 40. For each experimental sample, the removed material layer thickness was measured and the material removal rate was calculated; these were the criteria for the evaluation of the effectiveness of the process.
From the analysis of the experimental results many conclusions have been drawn which were analyzed in a previous section. In general, increasing the average output power P and decreasing the scanning speed V results in increasing the removed material layer thickness Dz. Moreover, increasing the average output power P, increasing the scanning speed V and decreasing the repetition rate F results in increasing the material removal rate DV.
Author Contributions
Conceptualization, E.N. and A.A.; Methodology, E.N.; Formal Analysis, E.N.; Investigation, I.C.; Writing-Original Draft Preparation, E.N.; Writing-Review & Editing, E.N.; Visualization, E.N.; Supervision, A.A.; Project Administration, A.A.
Acknowledgments
This research has been co-financed by the European Union and Greek national funds through the Operational Program Competitiveness, Entrepreneurship and Innovation, under the call RESEARCH-CREATE-INNOVATE (project code: T1EDK-01980)
References
- Heyl, P.; Olschewski, T.; Wijnaendts, R.W. Manufacturing of 3D structures for micro-tools using laser ablation. Microelectron. Eng. 2001, 57–58, 775–780. [Google Scholar] [CrossRef]
- Dubey, A.K.; Yadava, V. Laser beam machining—A review Int. J. Mach. Tools Manuf. 2008, 48, 609–628. [Google Scholar] [CrossRef]
- Kasman, S. Impact of parameters on the process response: A Taguchi orthogonal analysis for laser engraving. Measurement 2013, 46, 2577–2584. [Google Scholar] [CrossRef]
- Campanelli, S.; Casalino, G.; Ludovico, A.; Bonserio, C. An artificial neural network approach for the control of the laser milling process. Int. J. Adv. Manuf. Technol. 2013, 66, 1777–1784. [Google Scholar] [CrossRef]
- Leone, C.; Genna, S.; Tagliaferri, B.; Palumbo, B.; Dix, M. Experimental investigation on laser milling of aluminium oxide using a 30 W Q-switched Yb:YAG fiber laser. Opt. Laser Technol. 2016, 76, 127–137. [Google Scholar] [CrossRef]
- Kochergin, S.A.; Morgunov, Y.A.; Saushkin, B.P. Surface manufacturing under pulse fiber laser. Procedia CIRP 2016, 42, 470–474. [Google Scholar] [CrossRef]
- Angelastro, A.; Campanelli, S.L.; Casalino, G. Statistical analysis and optimization of metal laser deposition of 227-F Colmony nickel alloy. Opt. Laser Technol. 2017, 94, 138–145. [Google Scholar] [CrossRef]
- Casalino, G.; Campanelli, S.L.; Contuzzi, N.; Ludovico, A.D. Experimental investigation and statistical optimization of the selective laser melting process of maraging steel. Opt. Laser Technol. 2015, 65, 151–158. [Google Scholar] [CrossRef]
- Manninen, M.; Hirvimaki, M.; Poutiainen, I.; Salminen, A. Effect of Pulse Length on Engraving Efficiency in Nanosecond Pulsed Laser Engraving of Stainless Steel. Metall. Mater. Trans. B 2015, 46, 2129–2136. [Google Scholar] [CrossRef]
- Campanelli, S.L.; Ludovico, A.D.; Bonserio, C.; Cavalluzi, P.; Cinquepalmi, M. Experimental analysis of the laser milling process parameters. J. Mater. Process. Technol. 2007, 191, 220–223. [Google Scholar] [CrossRef]
- Mladenovic, V.; Panjan, P.; Paskvale, S.; Caliskan, H.; Poljansek, N.; Cekada, M. Investigation of the laser engraving of AISI 304 stainless steel using a response-surface methodology. J. Teh. Vjesn. Tech. Gaz. 2016, 23, 265–271. [Google Scholar]
- Romolia, L.; Tantussib, F.; Fuso, F. Laser milling of martensitic stainless steels using spiral trajectories. Opt. Lasers Eng. 2017, 91, 160–168. [Google Scholar] [CrossRef]
- Teixidor, D.; Ferrer, I.; Ciurana, J.; Ozel, T. Optimization of process parameters for pulsed laser milling of micro-channels on AISI H13 tool steel. Robot. Comput. Integr. Manuf. 2013, 29, 209–218. [Google Scholar] [CrossRef]
- Svantner, M.; Kucera, M.; Houdkova, S. Possibilities of stainless steel laser marking. In Proceedings of the 21st International Conference on Metallurgy and Materials, Brno, Czech Republic, 23–25 May 2012. [Google Scholar]
- Sobotova, L.; Demec, P. Laser marking of metal materials. Mod. Mach. Sci. J. 2015, 808. [Google Scholar] [CrossRef]
- Campanelli, S.L.; Casalino, G.; Contuzzi, N. Multi-objective optimization of laser milling of 5754 aluminum alloy. Opt. Laser Technol. 2013, 52, 48–56. [Google Scholar] [CrossRef]
Figure 1.
Laser engraving process (a) Schematic illustration of the laser engraving process; and (b) engraving depth of 14 successive laser beam pulses in a SAE304 stainless steel workpiece.
Figure 1.
Laser engraving process (a) Schematic illustration of the laser engraving process; and (b) engraving depth of 14 successive laser beam pulses in a SAE304 stainless steel workpiece.
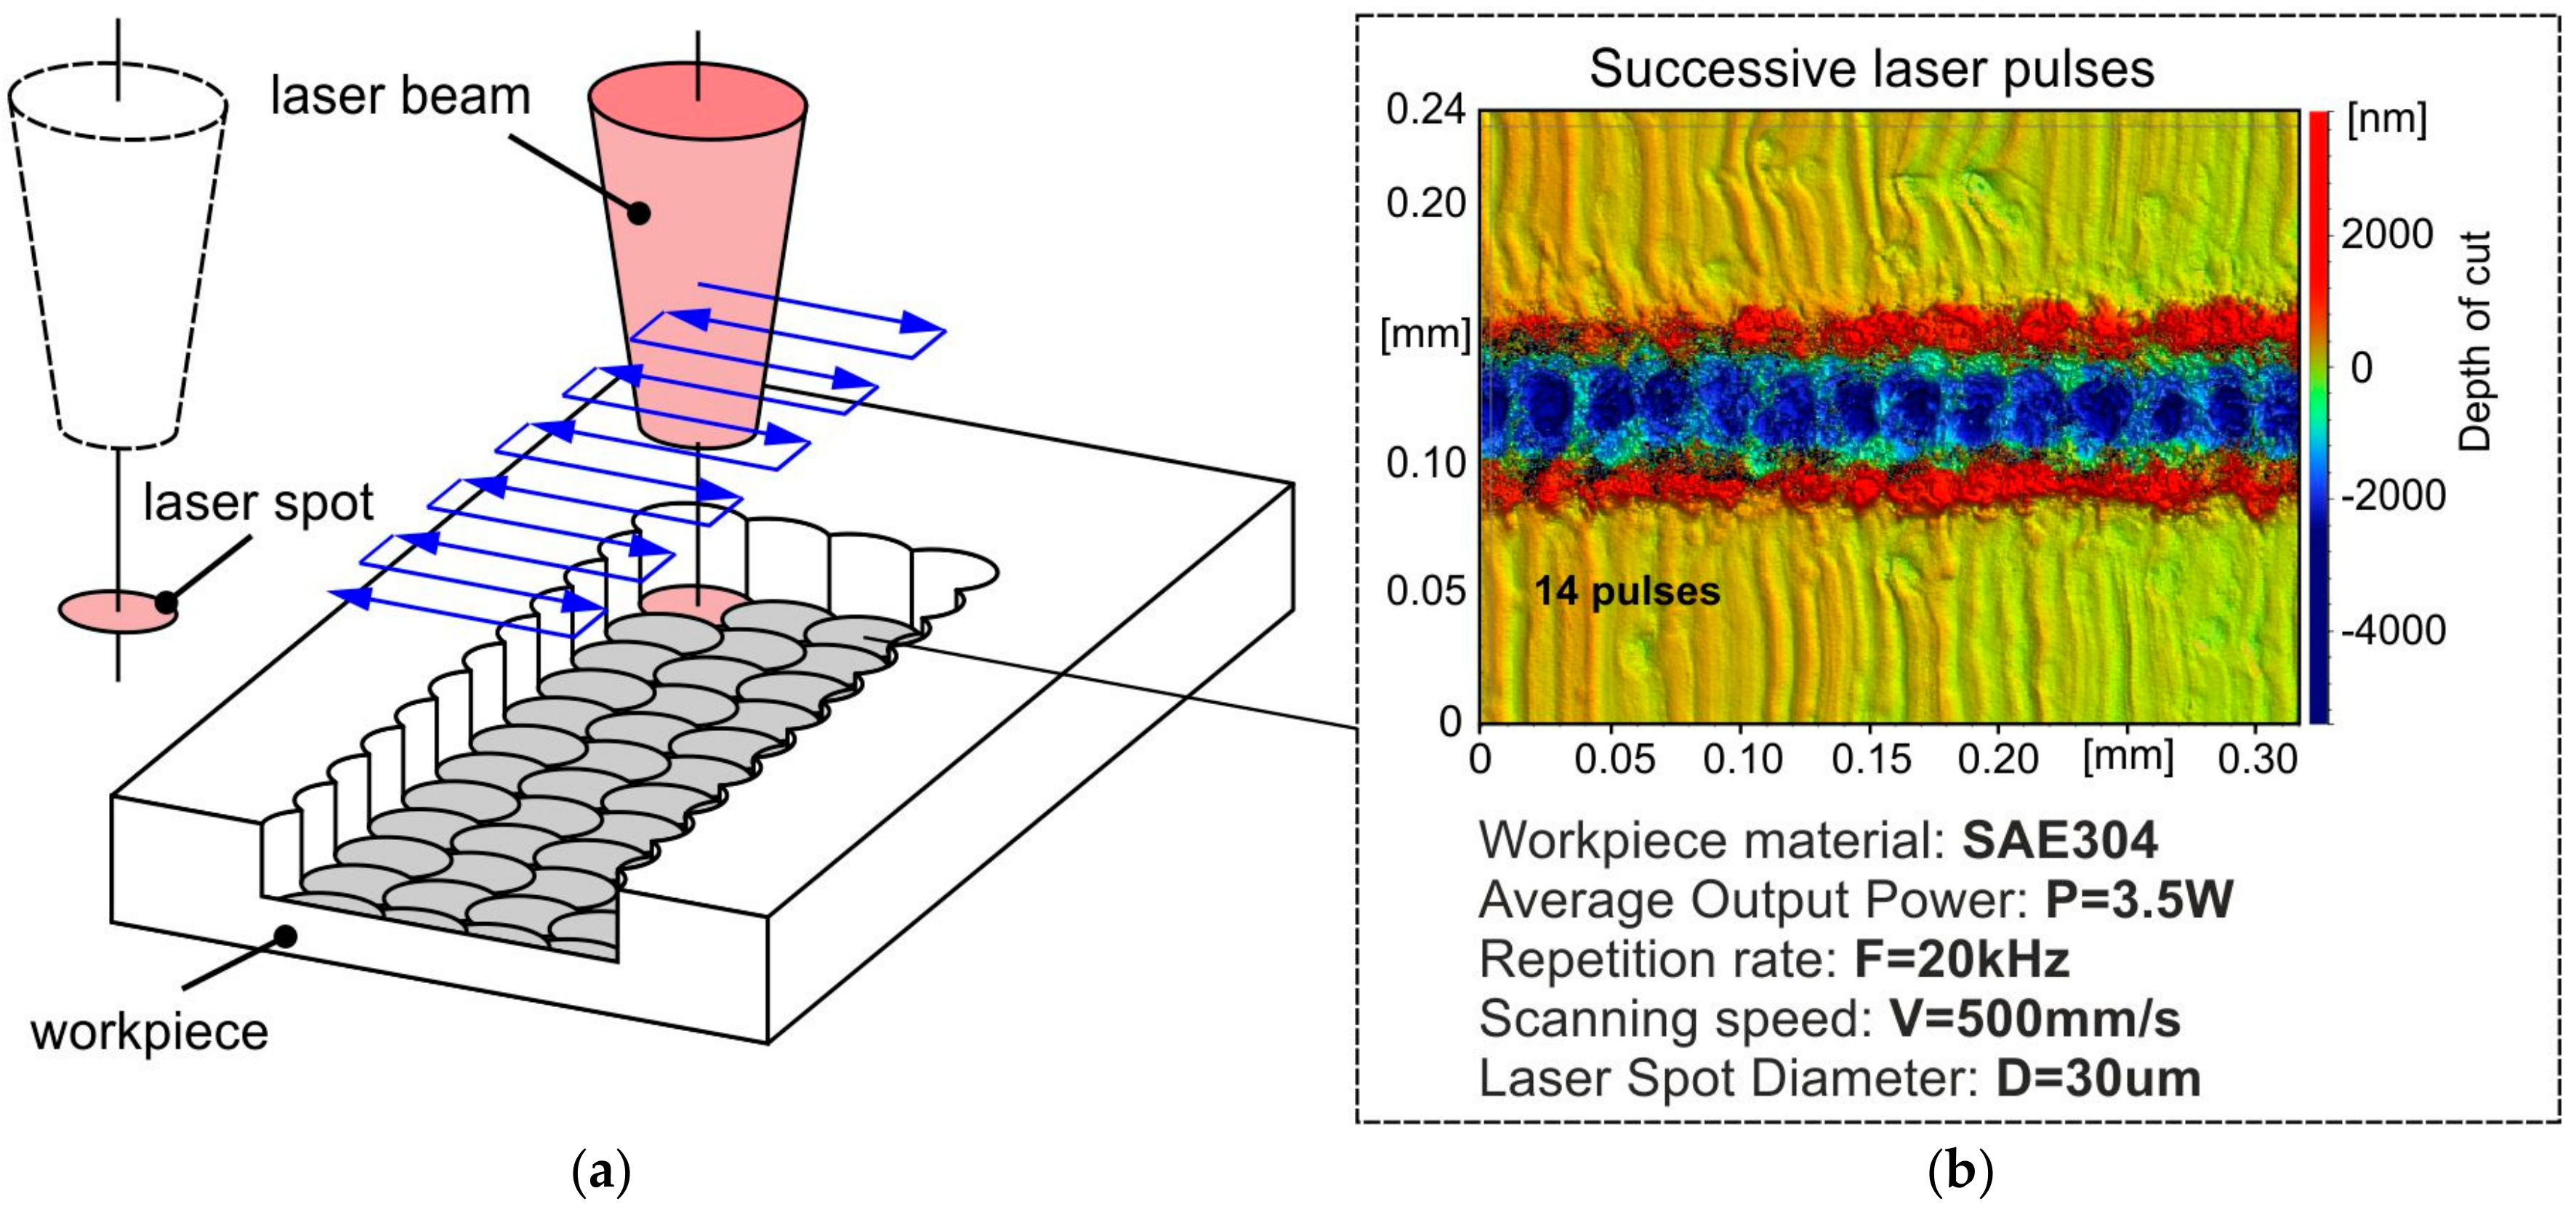
Figure 2.
Laser engraving machine DMG MORI Lasertec 40 (a) Exterior view; and (b) interior view.
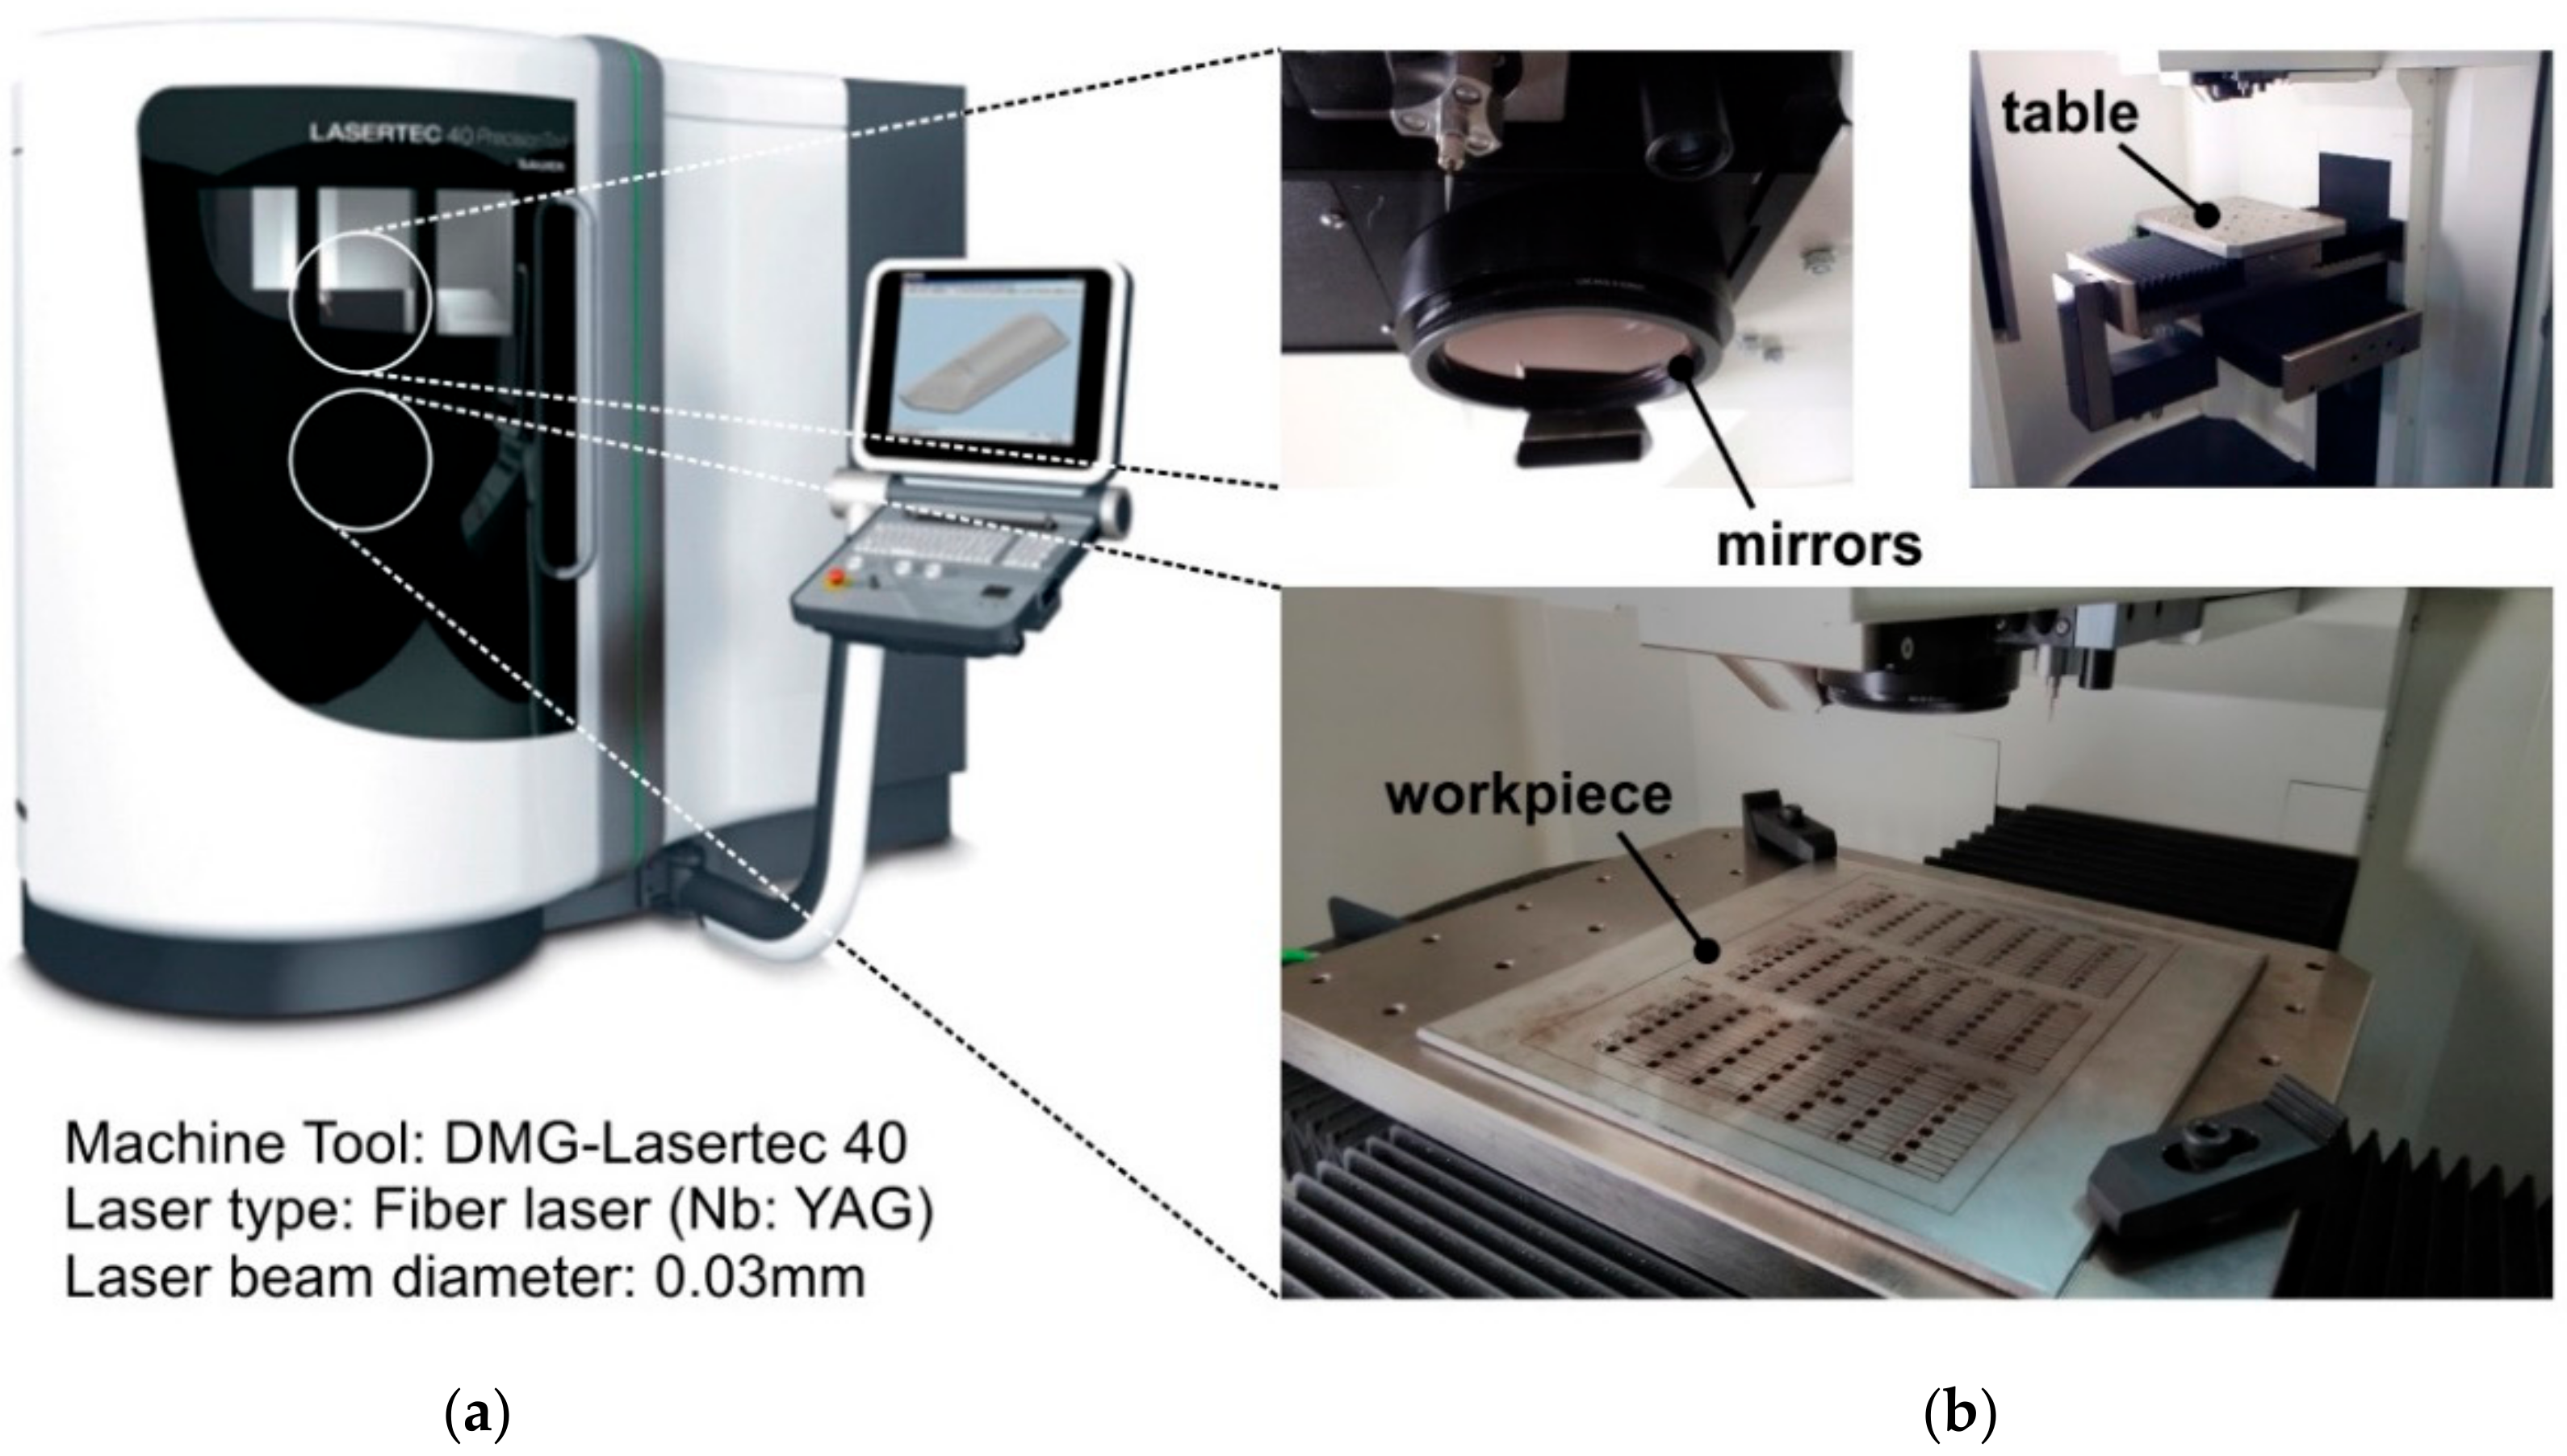
Figure 3.
Laser beam scanning strategy.
Figure 4.
Experimental samples.
Figure 5.
Removed material layer thickness Dz graphs.

Figure 6.
Material removal rate DV graphs.
© 2018 by the authors. Licensee MDPI, Basel, Switzerland. This article is an open access article distributed under the terms and conditions of the Creative Commons Attribution (CC BY) license (http://creativecommons.org/licenses/by/4.0/).
Share and Cite
MDPI and ACS Style
Nikolidakis, E.; Choreftakis, I.; Antoniadis, A. Experimental Investigation of Stainless Steel SAE304 Laser Engraving Cutting Conditions. Machines 2018, 6, 40. https://doi.org/10.3390/machines6030040
AMA Style
Nikolidakis E, Choreftakis I, Antoniadis A. Experimental Investigation of Stainless Steel SAE304 Laser Engraving Cutting Conditions. Machines. 2018; 6(3):40. https://doi.org/10.3390/machines6030040
Chicago/Turabian StyleNikolidakis, Evangelos, Ioannis Choreftakis, and Aristomenis Antoniadis. 2018. "Experimental Investigation of Stainless Steel SAE304 Laser Engraving Cutting Conditions" Machines 6, no. 3: 40. https://doi.org/10.3390/machines6030040
Note that from the first issue of 2016, this journal uses article numbers instead of page numbers. See further details here.