4.1. Production and Domestic Sales
The production of agricultural machinery in Germany covers a wide range of agricultural machinery and supplies for agriculture. In the period from 2006 to 2008, the production increase of combines units was 53%, followed by the plant protection equipment (48%) and planting machines (40%) [
10]. In 2008, the 10,692 combines produced predominantly originated from the production sites of Claas in Harsewinkel and John Deere in Zweibrücken. The German agricultural machinery industry is strongly export oriented, especially in the field of combines and forage harvesters. For example, in 2007, 80% of the 6994 combine units manufactured were exported [
9].
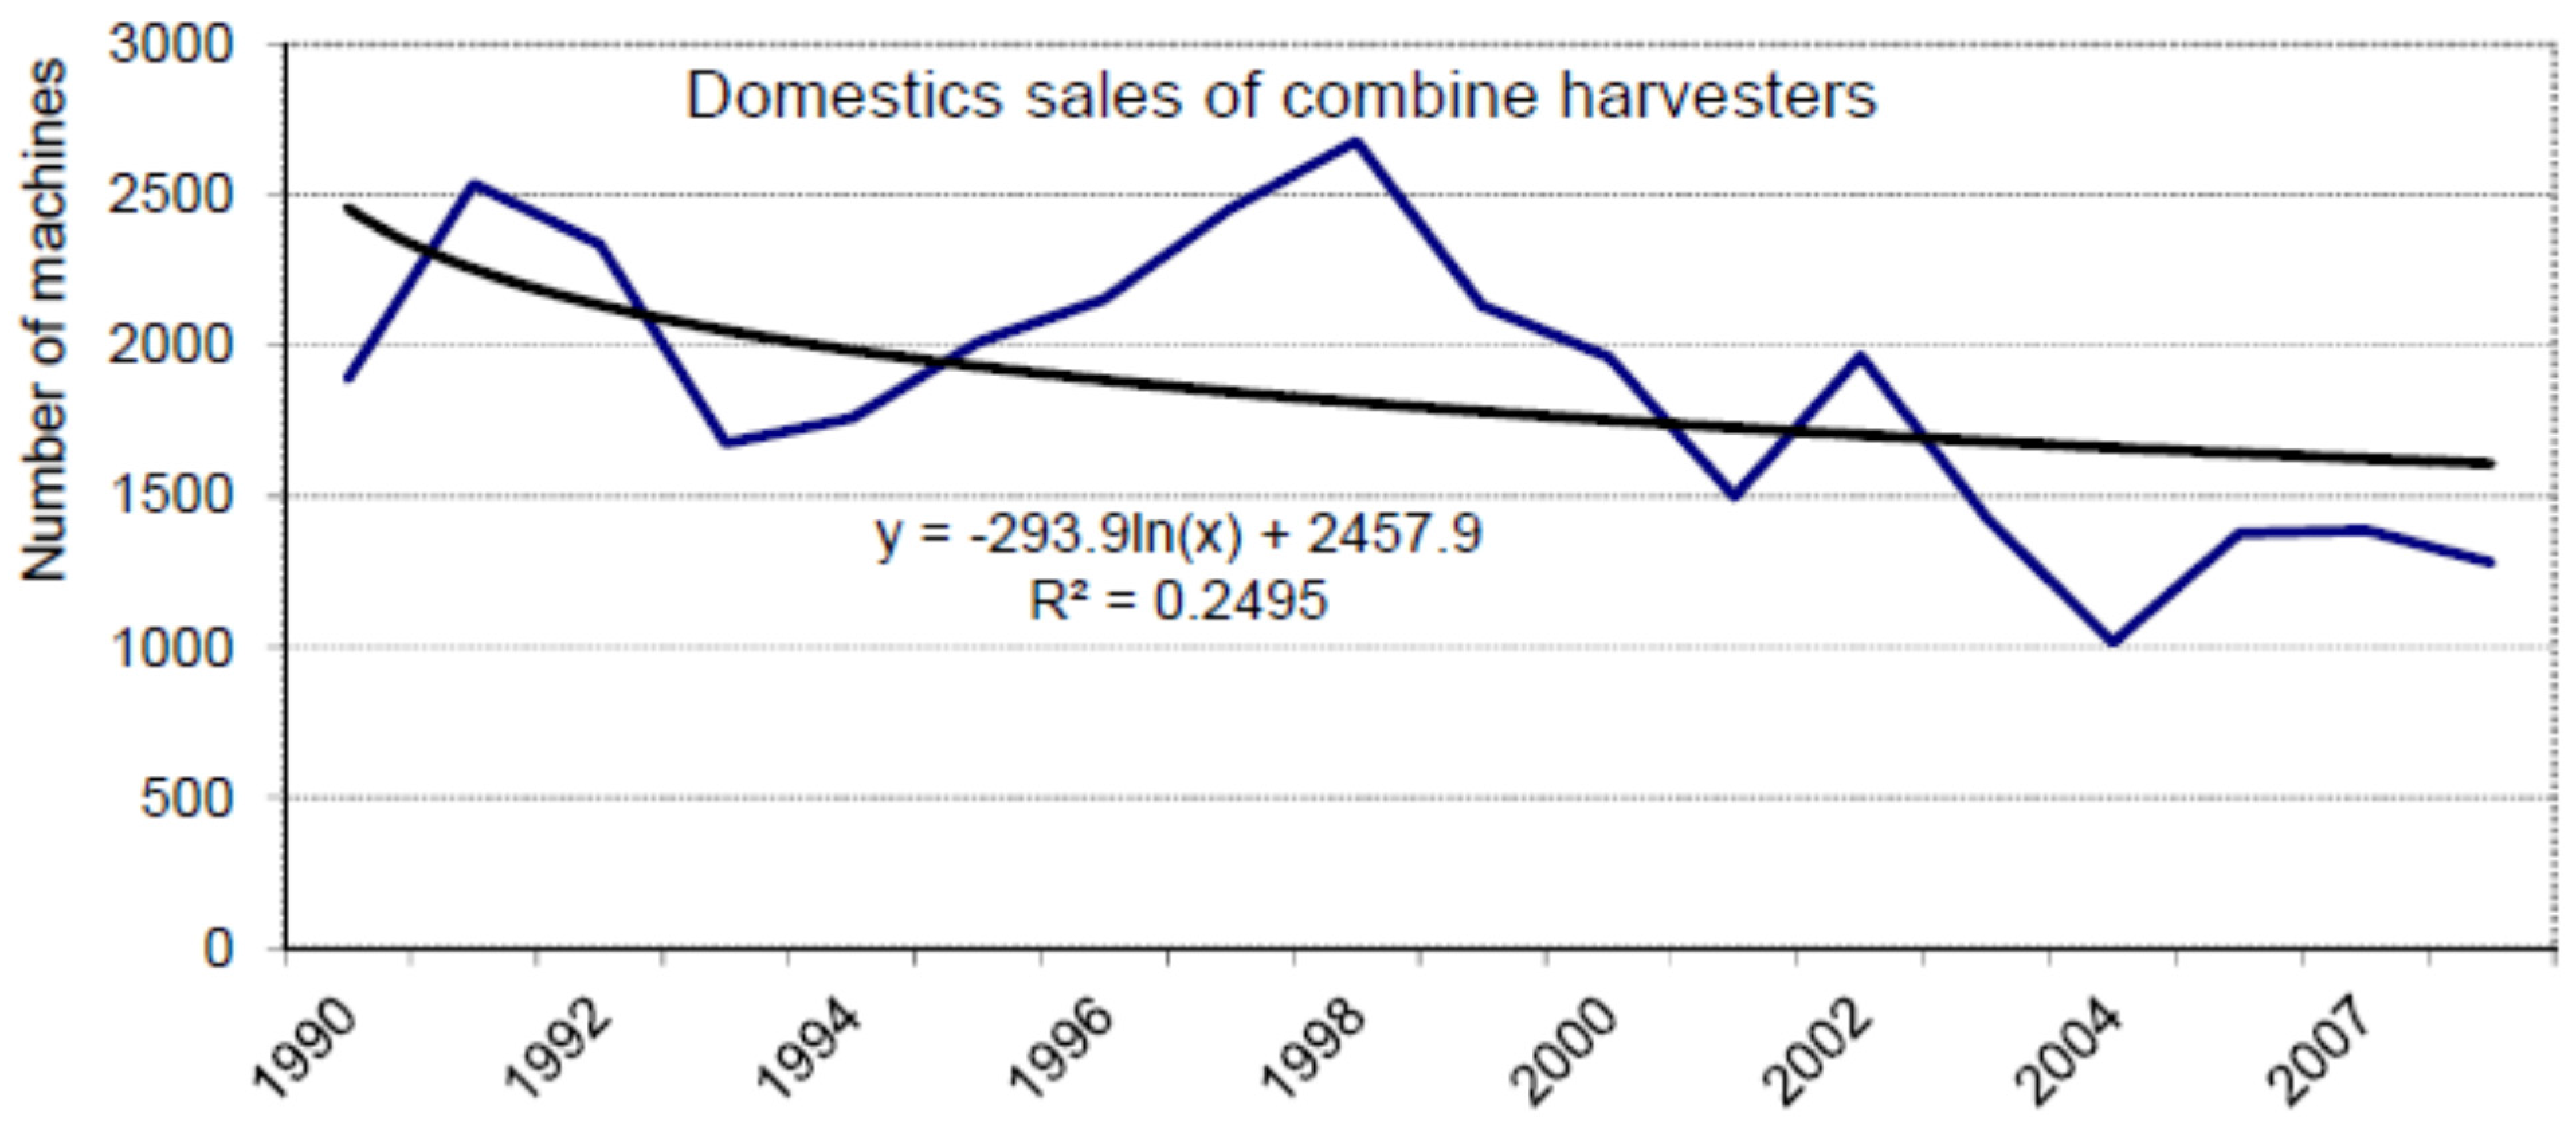
Domestic sales have more than halved from 2678 in 1998 to 1279 in 2008. Between 2000 and 2008, a decreasing trend can be observed. On average, domestic sales from 1990 to 2008 amounted to 1864 units sold (
Figure 2) [
11]. The market volume in the harvesters and equipment segment in 2008 amounted to 715 million euros. After the tractor, with a turnover of 1.6 billion euros, the harvesting machinery and equipment market in Germany is the second largest market for the agricultural machinery industry. Totally, sales of tractors and harvesters covered about 50% of the market volume in 2008.
Figure 2.
Domestic sales of combine harvesters in Germany (1990–2008) (own calculations based on [
11]).
Figure 2.
Domestic sales of combine harvesters in Germany (1990–2008) (own calculations based on [
11]).
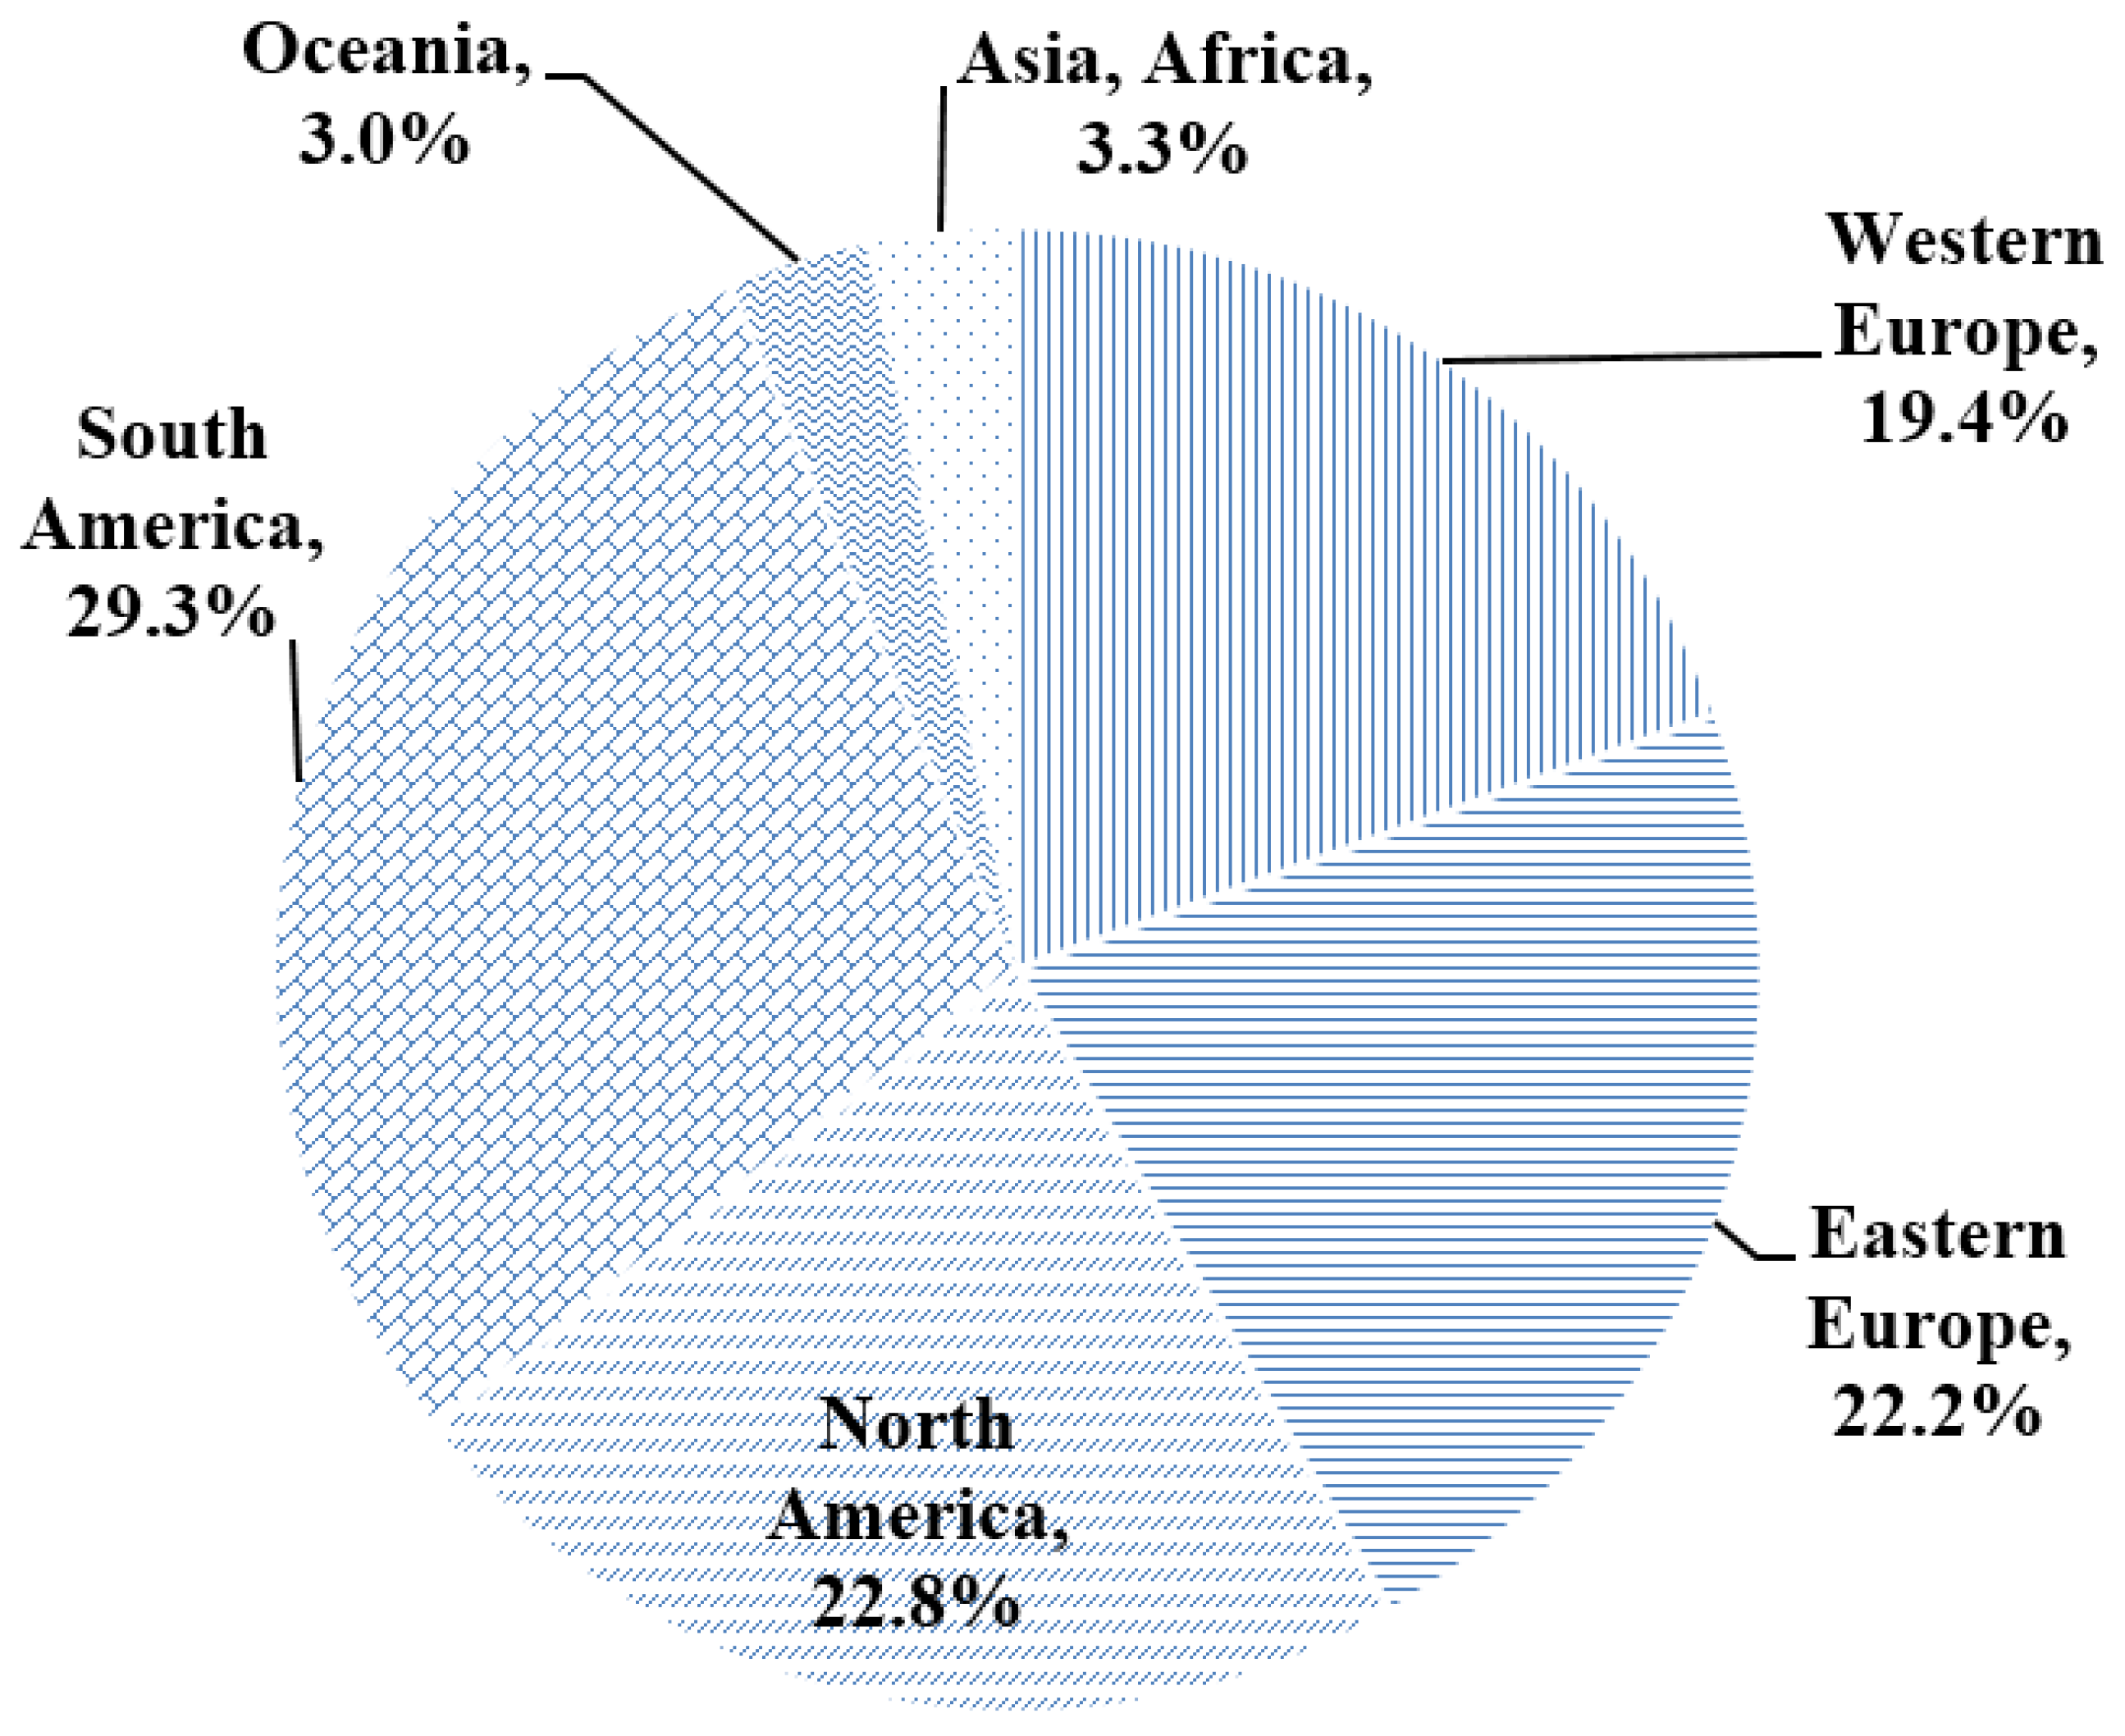
Sales of combine classes are similarly distributed all over Western Europe, where the four-, five- and six-shaking combine harvesters have a market share of about 43%. In the upper performance category of conventional combines, a market penetration of about 37% is typical. The remaining market share of 20% is covered by the hybrid and axial combine harvesters [
5].
4.2. Inventory Development of Combine Harvesters
Stocks of combine harvesters rose from the mid-1950s, with the first self-propelled combine harvesters and the highly popular drawn threshing machines, to the year 1975 to total more than 189,000 units. The proportion of self-propelled combines was five times greater in 1976 compared to the drawn combine harvester. In the following years, the proportion of the drawn harvesters has declined sharply. With further technical developments, coupled with increases in performance with increased operational variables as well as due to the structural change in agriculture, the stocks of combines decreased in the following years by half [
9].
For the grain crop harvest of 9.9 million hectares with a harvest of 61 million tons, nearly 85,000 combine harvesters were used in 2008. In the average of the years 2003 to 2009, about 9.8 million ha, over 56 million tons, were harvested by 93,200 combines [
4]. Although through constructive ways the performance potential of the combines always increased in recent years, the combine’s installed capacity is only exploited in the field to half the degree possible, which corresponds to a field efficiency of about 50% [
12].
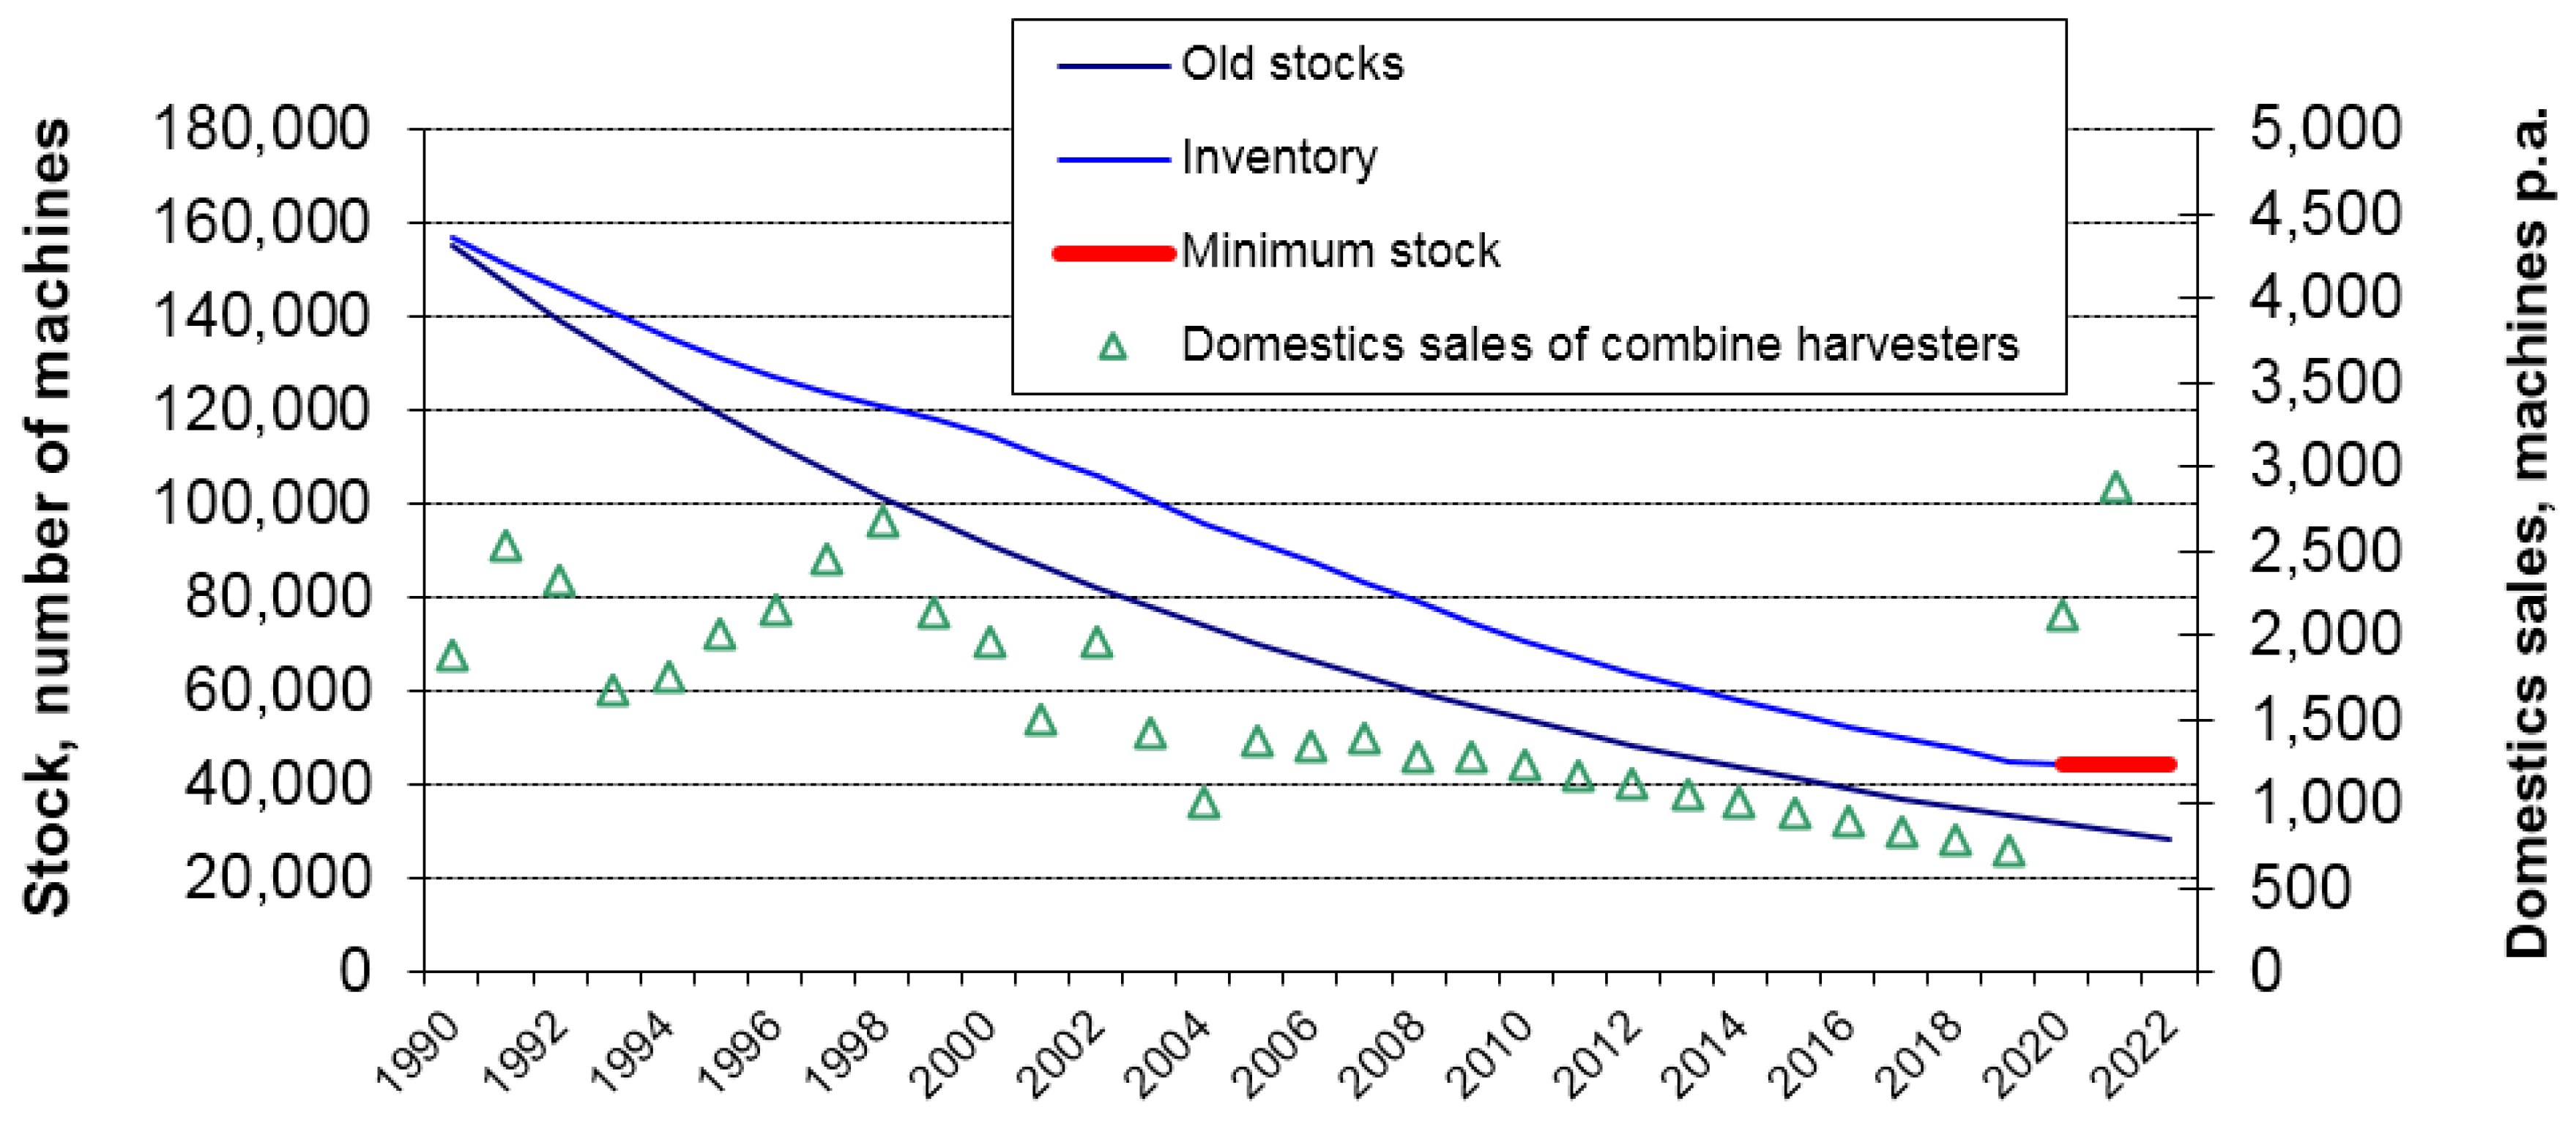
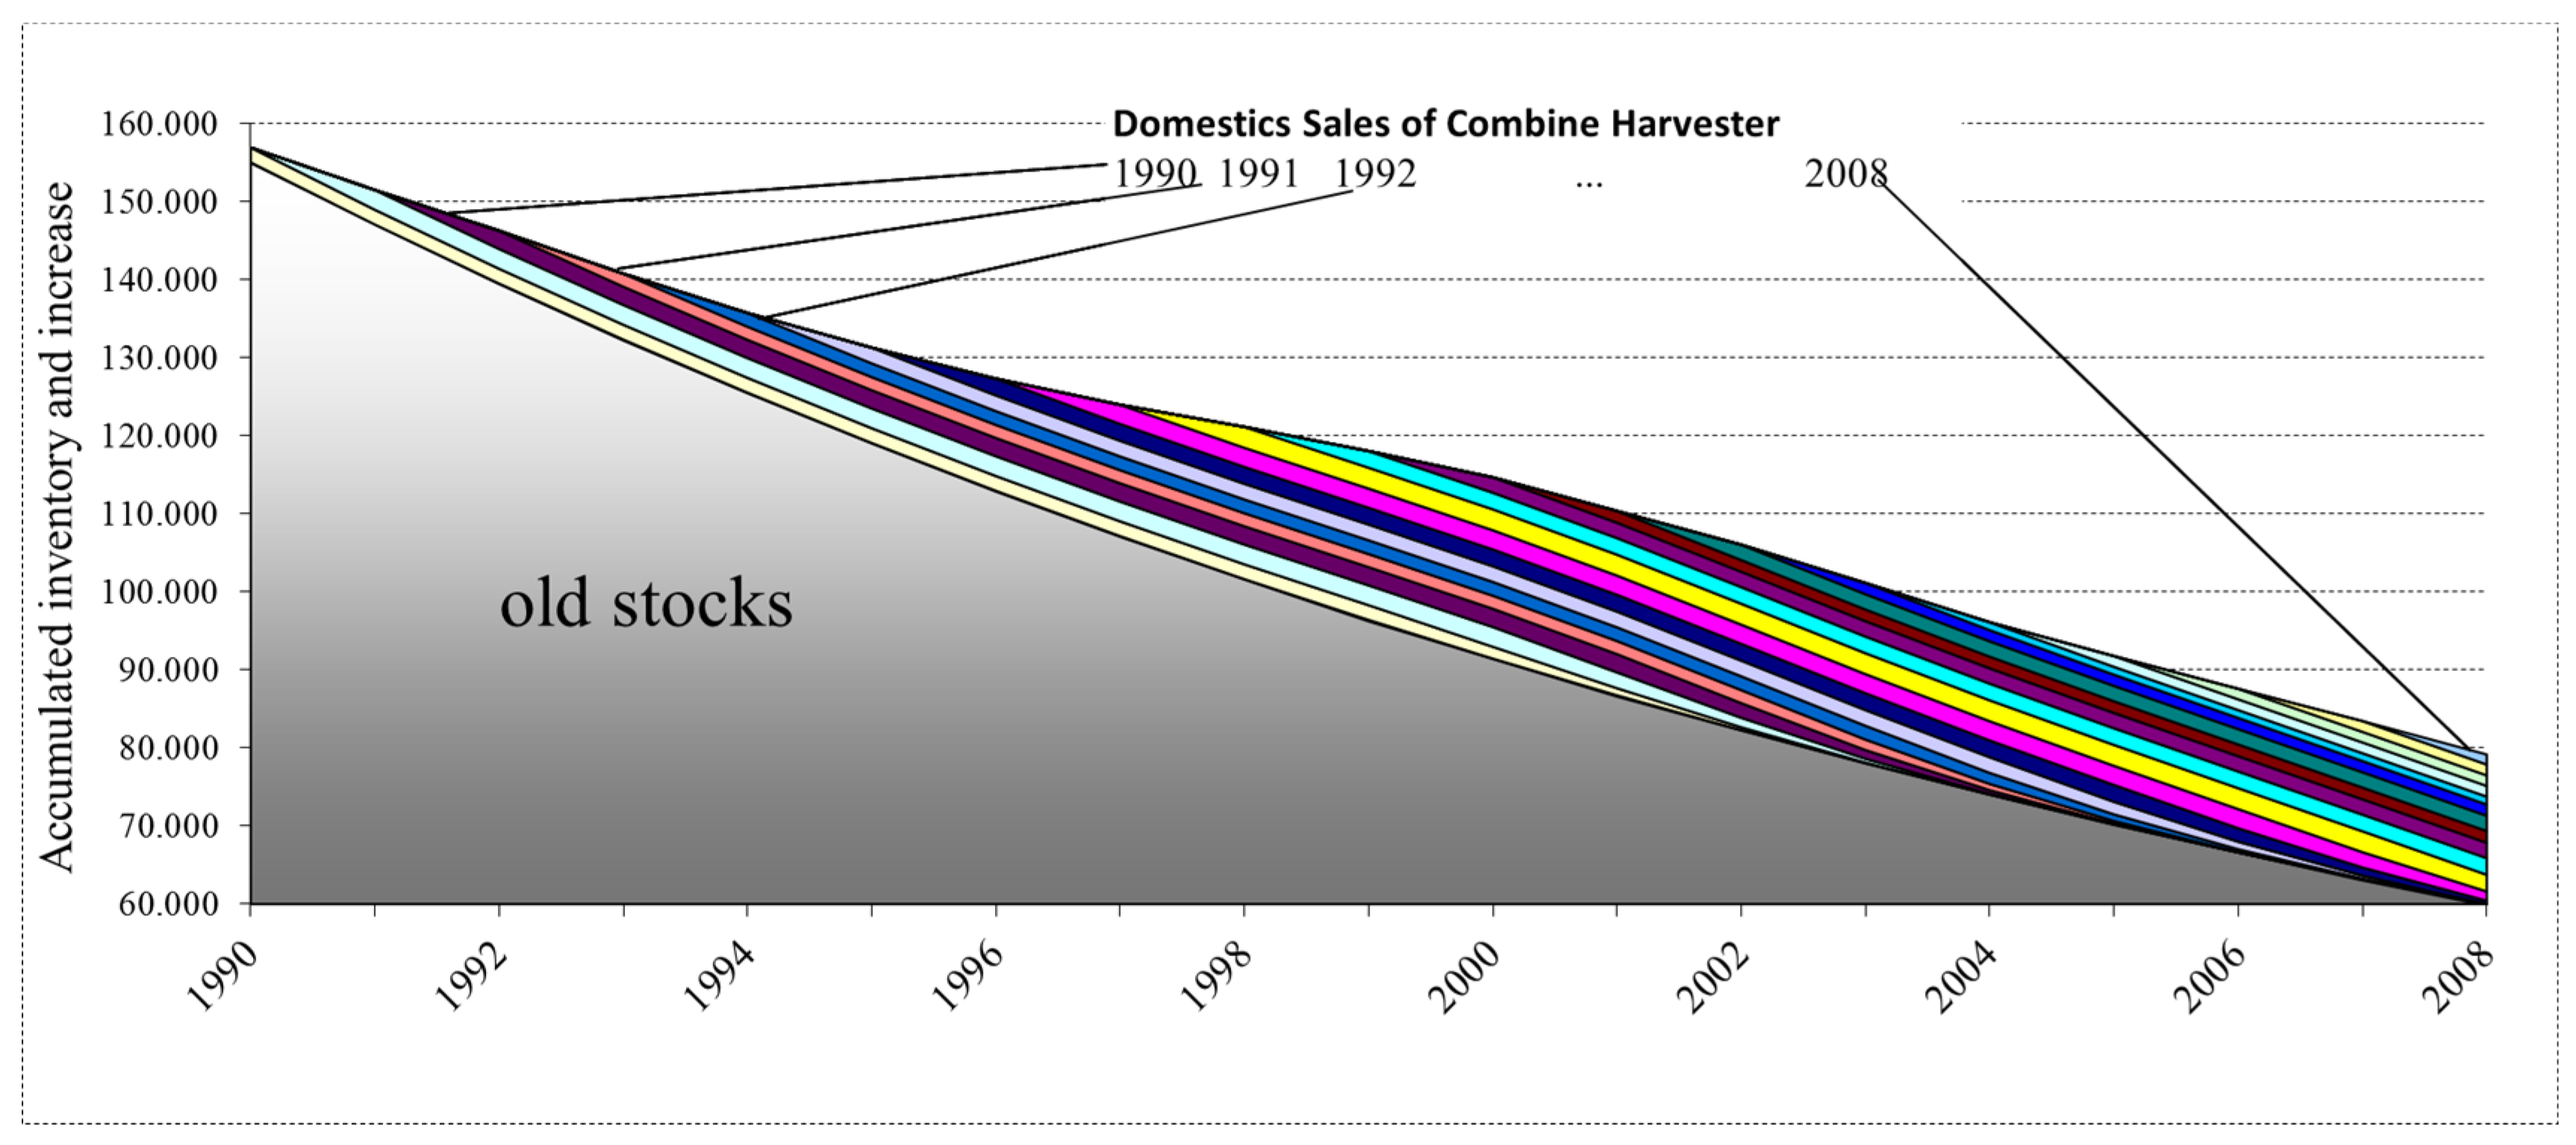
Figure 3 shows the decreasing old stocks of harvesters, beginning in 1990 and, for the period 1990 to 2008, the number of annual harvester sales and for each the fading out due to segregation (colored lines). The accumulated inventory, the sum of the corresponding number of harvesters in a certain year, results in the stock of combines, which has decreased from the previous count of 156,890 in 1990 to 79,153 units in 2008, a drop of approximately 50%.
Figure 3.
Inventory of combine harvesters (old stocks; domestic sales 1990 to 2008—colored lines; all area together = accumulated inventory) 1990–2008. Source: Own calculations based on [
9,
11].
Figure 3.
Inventory of combine harvesters (old stocks; domestic sales 1990 to 2008—colored lines; all area together = accumulated inventory) 1990–2008. Source: Own calculations based on [
9,
11].
According to FAO data, in Germany, in 2007, there were about 85,480 harvesters. Since the period from 1990 to 2008,
i.e., the 17 years of the investigation period, 20,248 new combine harvesters were added, which means there are still 63,193 combine harvesters 17 years or older in use [
13]. If the old portfolio is updated at a rate of 5%, then in 2022 there would still be 28,632 older harvesters (potentially from before 1990) that remain in the stock. A faster replacement of very old combine harvesters is also conceivable, if newer machines are used to a larger extend. Therefore, the future structure of the combine fleet, in particular with respect to the old stock, is not clearly determined.
4.3. Factors Influencing the Threshing and Deriving the Minimum Capacity
The demand for combine harvesters is determined by several factors. In addition to crop management, other factors affect the extent of the actual performance. Ahead of the other factors, breeding and agronomic measures play an important role how a field is harvested.
Production failures, such as lying grain, even through optimal management efficiency of the harvesters can no longer be sustained. Another factor, which the farmer cannot influence, but determines the threshability decisively, is the weather [
14].
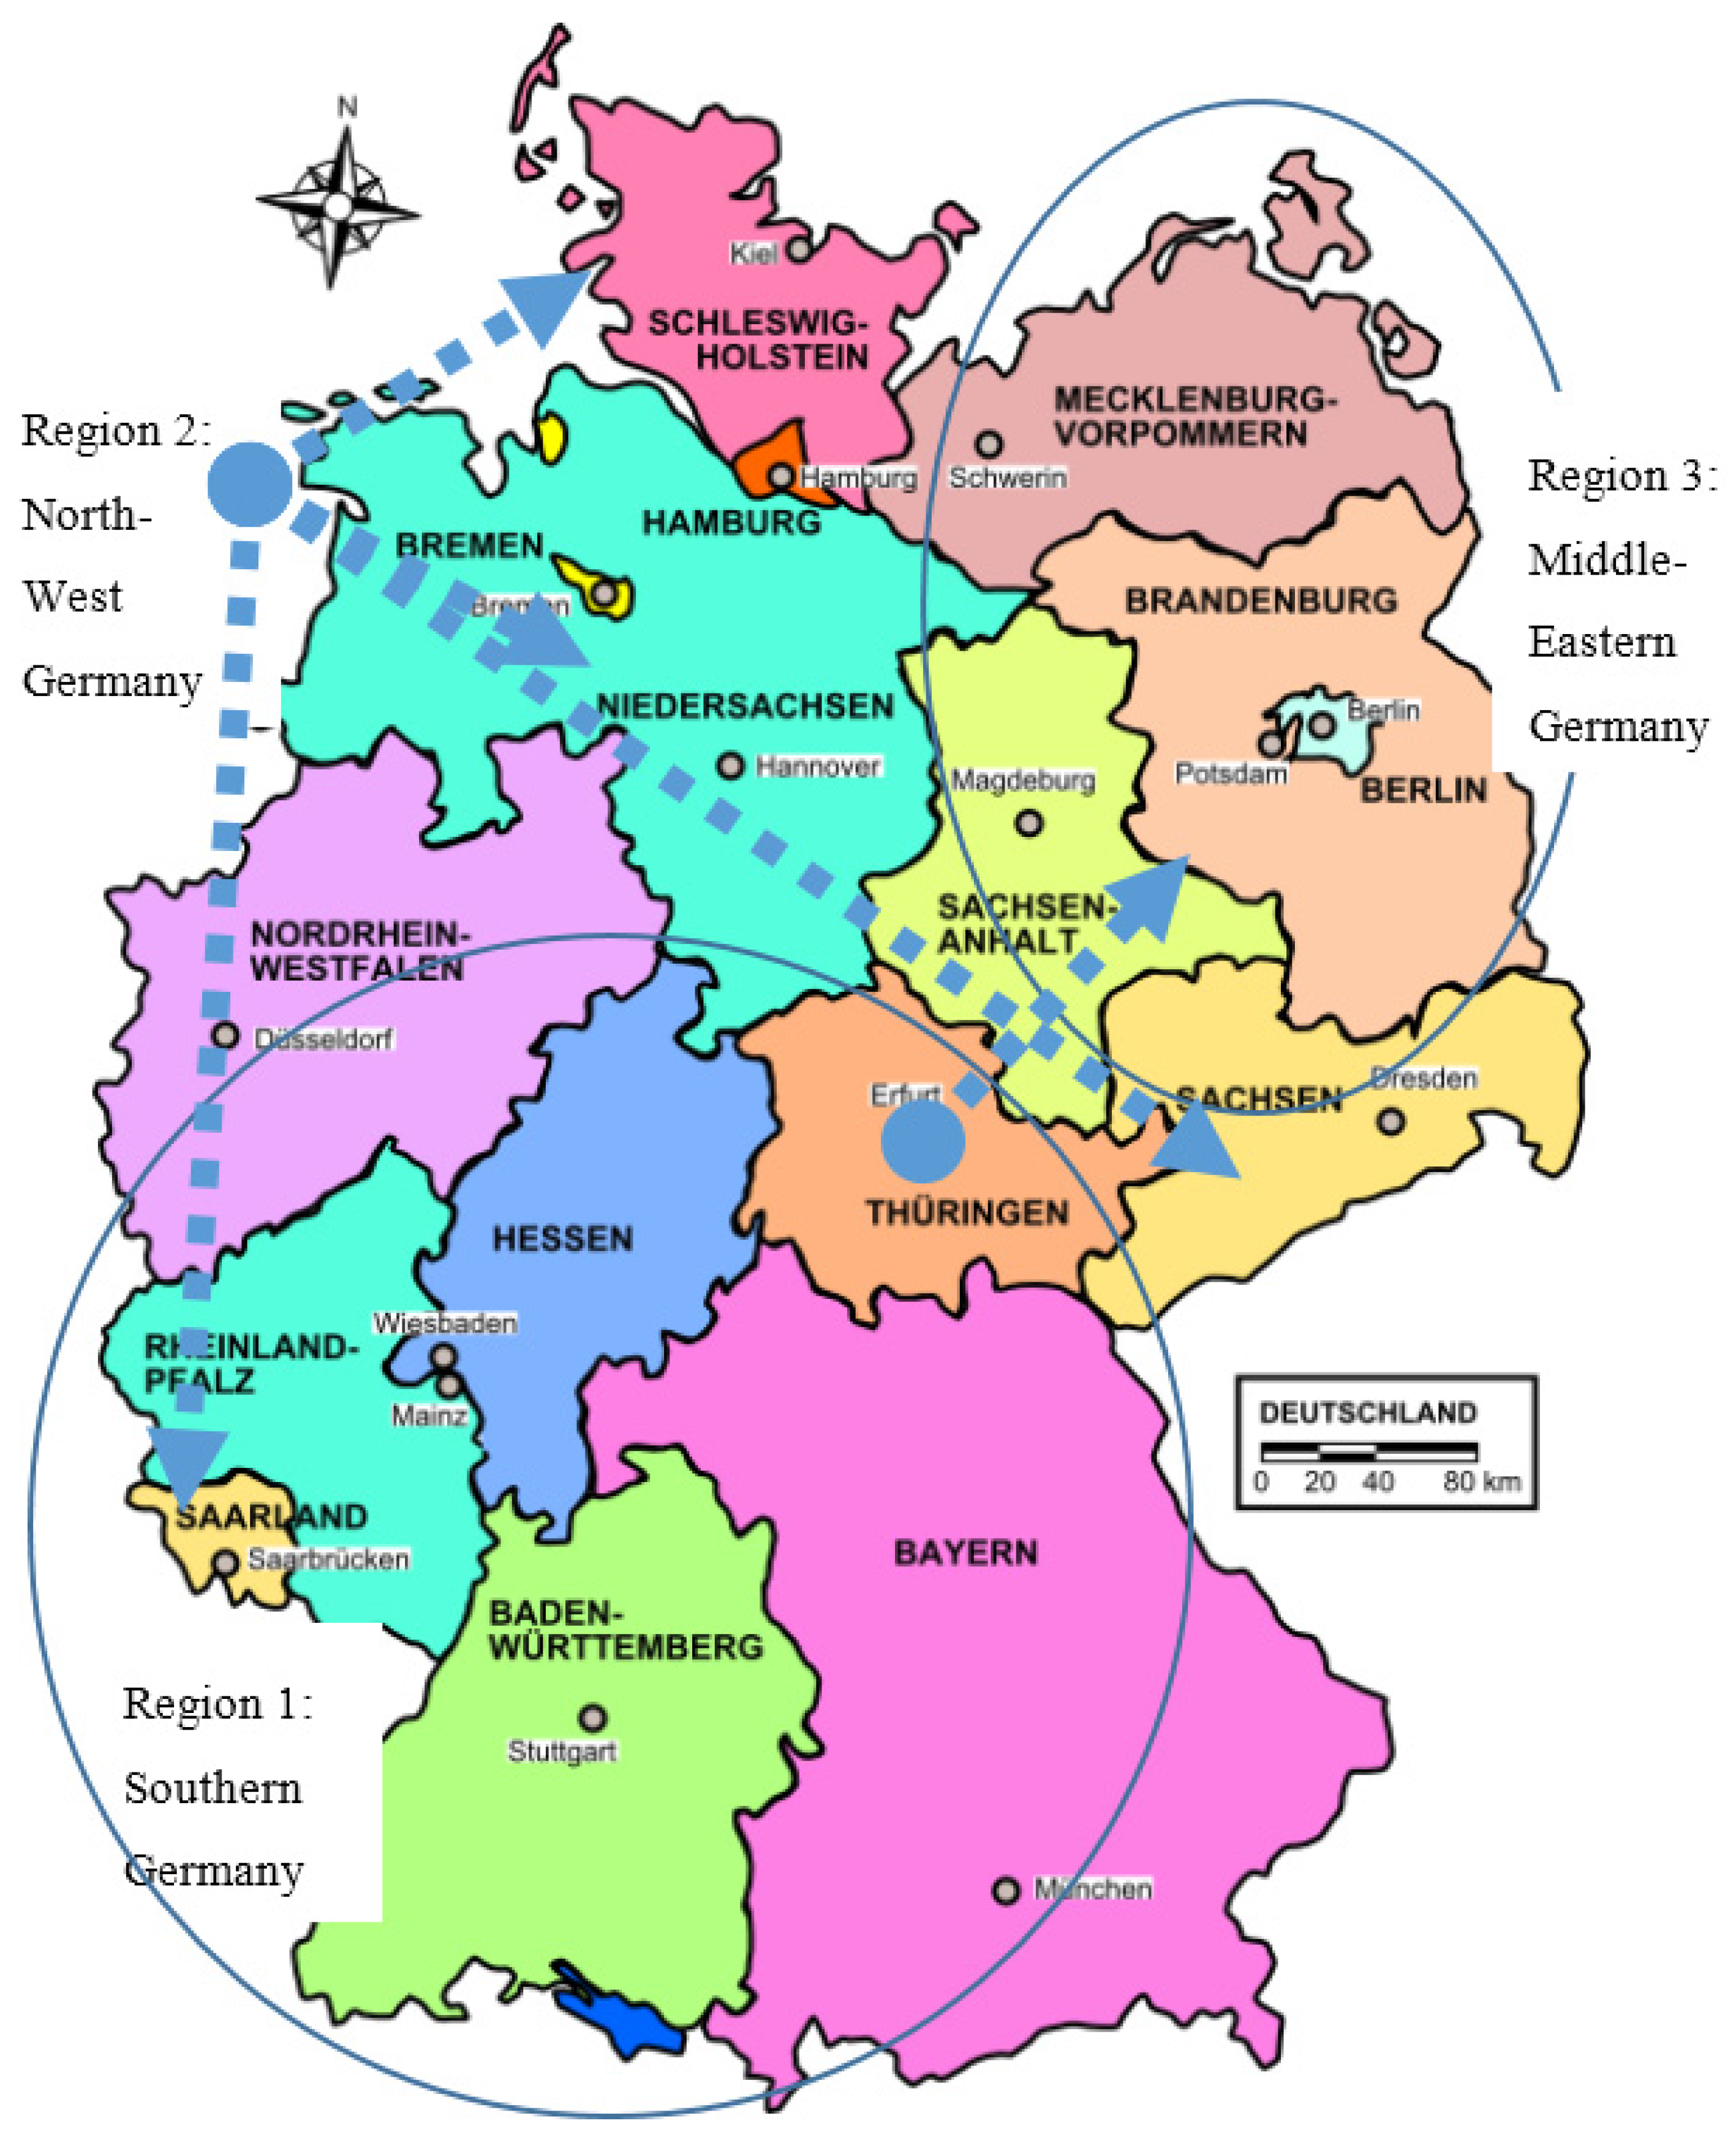
Subsequently, the minimum necessary stocking of combines for the region of Germany should be estimated. Here, Germany is divided into three sub-regions, which differ due to local factors (farm size and field size) and where the use of smaller, medium and large harvesters makes sense (
Figure 4).
Figure 4.
Germany and its three sub-regions for harvester sizes depending on farm size and field size. Source: [
15]; own assumptions and changes.
Figure 4.
Germany and its three sub-regions for harvester sizes depending on farm size and field size. Source: [
15]; own assumptions and changes.
Furthermore, the influence of environmental factors (weather affecting harvest amount, available threshing hours and field efficiency) is simulated in a kind of risk analysis. Unfavorable constellations require the use of a larger number of machines and lead to higher harvesting costs. If there were insufficient harvesters available, higher natural losses and costs could arise; and, in extreme cases, a part of the fields could remain unharvested.
Results of these simulations show the region-specific necessary number of harvesters and the costs of harvest. Based on the average cost of the threshing and the marginal losses in crops, the minimum necessary number of combines is calculated.
4.4. Division into Threshing Regions for the Calculations
The basis for the calculation of the stock of development combines is the distribution of grain crops acreage in Germany in three sub regions. The federal states, with the exception of the city states of Berlin, Hamburg and Bremen, are, in accordance to their average farm size, classified into the following categories: below 40 ha utilized agricultural area (UAA), 40 to 60 ha UUA and 60 ha UAA (
Table 2). Accordingly, the relevant crop and areas sown can be assigned. Decision criterion for the allocation of a performance class of combines for a sub-region is the parameter throughput in quantity of grain per hour.
Threshing region 1 (Southern Germany) comprises the federal states Hessen (HE), Nordrhein-Westfalen (NW), Rheinland-Pfalz (RP), Bavaria (BY) and Baden-Württemberg (BW). In these five states, between 18.4 and 24.1 million tons of grain crops were harvested on average in the years 2003 to 2008 on a cultivated area of 3.5 million hectares annually. In threshing region 1, combines with an engine output of 200 kW, a grain tank of 8500 liters and a cutter of 5 m were used for the harvest of grain crops (
Table 3). With this combine size, it is possible to achieve a throughput capacity of 15 tons per hour. The four states of Schleswig-Holstein (SH), Sachsen (SN), Niedersachsen (NI) and the Saarland (SL) represent the second largest combine harvest area (North-West Germany), which has a cultivated area of 2.2 million hectare. In the years 2003 to 2008, on average 13.2 million tons of grain were harvested, which corresponds to 27% of the German grain harvest. For the grain crop harvesting in the threshing region 2, a combine with a power size of 275 kW, a grain tank capacity of 10,500 L and a cutting bar width of 7.5 m are used (
Table 3). A throughput of 30 tons per hour can be achieved with this harvester size because of the larger farm structures in region 2. In the federal states of Mecklenburg-Vorpommern (MV), Saxony-Anhalt (ST), Brandenburg (BB) and Thuringia (TH), where on cultivated area of 2.8 million hectares (33.2% of the German grain crops acreage), on average over 16 million tons harvested. In the threshing region 3 (Middle-Eastern Germany), the cultivation of commercial crops is most important. About 47% of the commodities are harvested in these four countries. The utilized agricultural area per farm in Mecklenburg-Vorpommern and Saxony-Anhalt is more than 150 ha, the greatest among the regions. For grain crop harvest in the threshing region 3, combines of the motor power class of over 375 kW, a grain tank capacity of 12,000 L and a cutting bar width of 9 m is common (
Table 3). A throughput of 50 tons per hour can be achieved with this harvester size on the large acreage.
Table 2.
Classification of threshing regions in Germany on the basis of the average farm size in ha utilized agricultural area (UAA).
Table 2.
Classification of threshing regions in Germany on the basis of the average farm size in ha utilized agricultural area (UAA).
| Region (Average Farm Size) | Countries | UAA per Farm | Cropping Area | Harvest |
|---|
| ha | 1000 ha | 1000 t |
|---|
| Region 1: Southern Germany (<40 ha) | HE | 34.9 | 382.7 | 2552.6 |
| NW | 31.5 | 743.0 | 5836.0 |
| RP | 28.0 | 302.6 | 1855.7 |
| BY | 26.4 | 1443.8 | 8977.2 |
| BW | 25.1 | 651.9 | 4264.4 |
| Average | 29.2 ha | | |
| Sum | | 3,524.0 ha | 23,485.9 t |
| Proportion | | 41.0% | 42.4% |
| Region 2: North-West Germany (40 to 60 ha) | SH | 57.3 | 444.7 | 3360.5 |
| SN | 54.7 | 574.5 | 3333.4 |
| NI | 52.3 | 1161.8 | 8357.7 |
| SL | 47.6 | 29.6 | 164.4 |
| Average | 53.0 ha | | |
| Sum | | 2210.6 ha | 15,216.0 t |
| Proportion | | 25.7% | 27.4% |
| Region 3: Middle-Eastern Germany (more than 60 ha) | MV | 170.5 | 834.8 | 5181.8 |
| ST | 154.2 | 779.5 | 5141.8 |
| BB | 96.8 | 721.9 | 3277.3 |
| TH | 64.9 | 518.4 | 3149.2 |
| Average | 121.6 ha | | |
| Sum | | 2854.6 ha | 16,750.1 t |
| Proportion | | 33.2% | 30.2% |
| Germany | Average | 56.0 ha | | |
| Sum | | 8589.2 ha | 55.452.0 t |
| Proportion | | 100.0% | 100.0% |
Table 3.
Combine sizes in relation to the operational structure (farm size) in the regions.
Table 3.
Combine sizes in relation to the operational structure (farm size) in the regions.
| Regions in Germany | Combine Key Figures |
|---|
| Motor Power | Grain Tank | Cutting Bar Width | Throughput-Performance | Additional Equipment | Acquisition Costs |
|---|
| Region 1: Southern | 200 kW | 8500 L | 5.0 m | 15 t/h | Rape cutting table | 217,100 € |
| Region 2: North-West | 275 kW | 10,500 L | 7.5 m | 30 t/h | -- | 295,100 € |
| Region 3: Middle-Eastern | 375 kW | 12,000 L | 9.0 m | 50 t/h | -- | 358,400 € |
Applying Monte Carlo method using @RISK [
17] with 10,000 simulations for every scenario, the variations on the three external factors, harvest amount (yields), available threshing hours in a certain season and field efficiency, can be considered:
- -
a small harvest together with high threshing hours and a high field efficiency,
- -
a great harvest at low threshing hours and low field efficiency, or
- -
any other possible combinations.
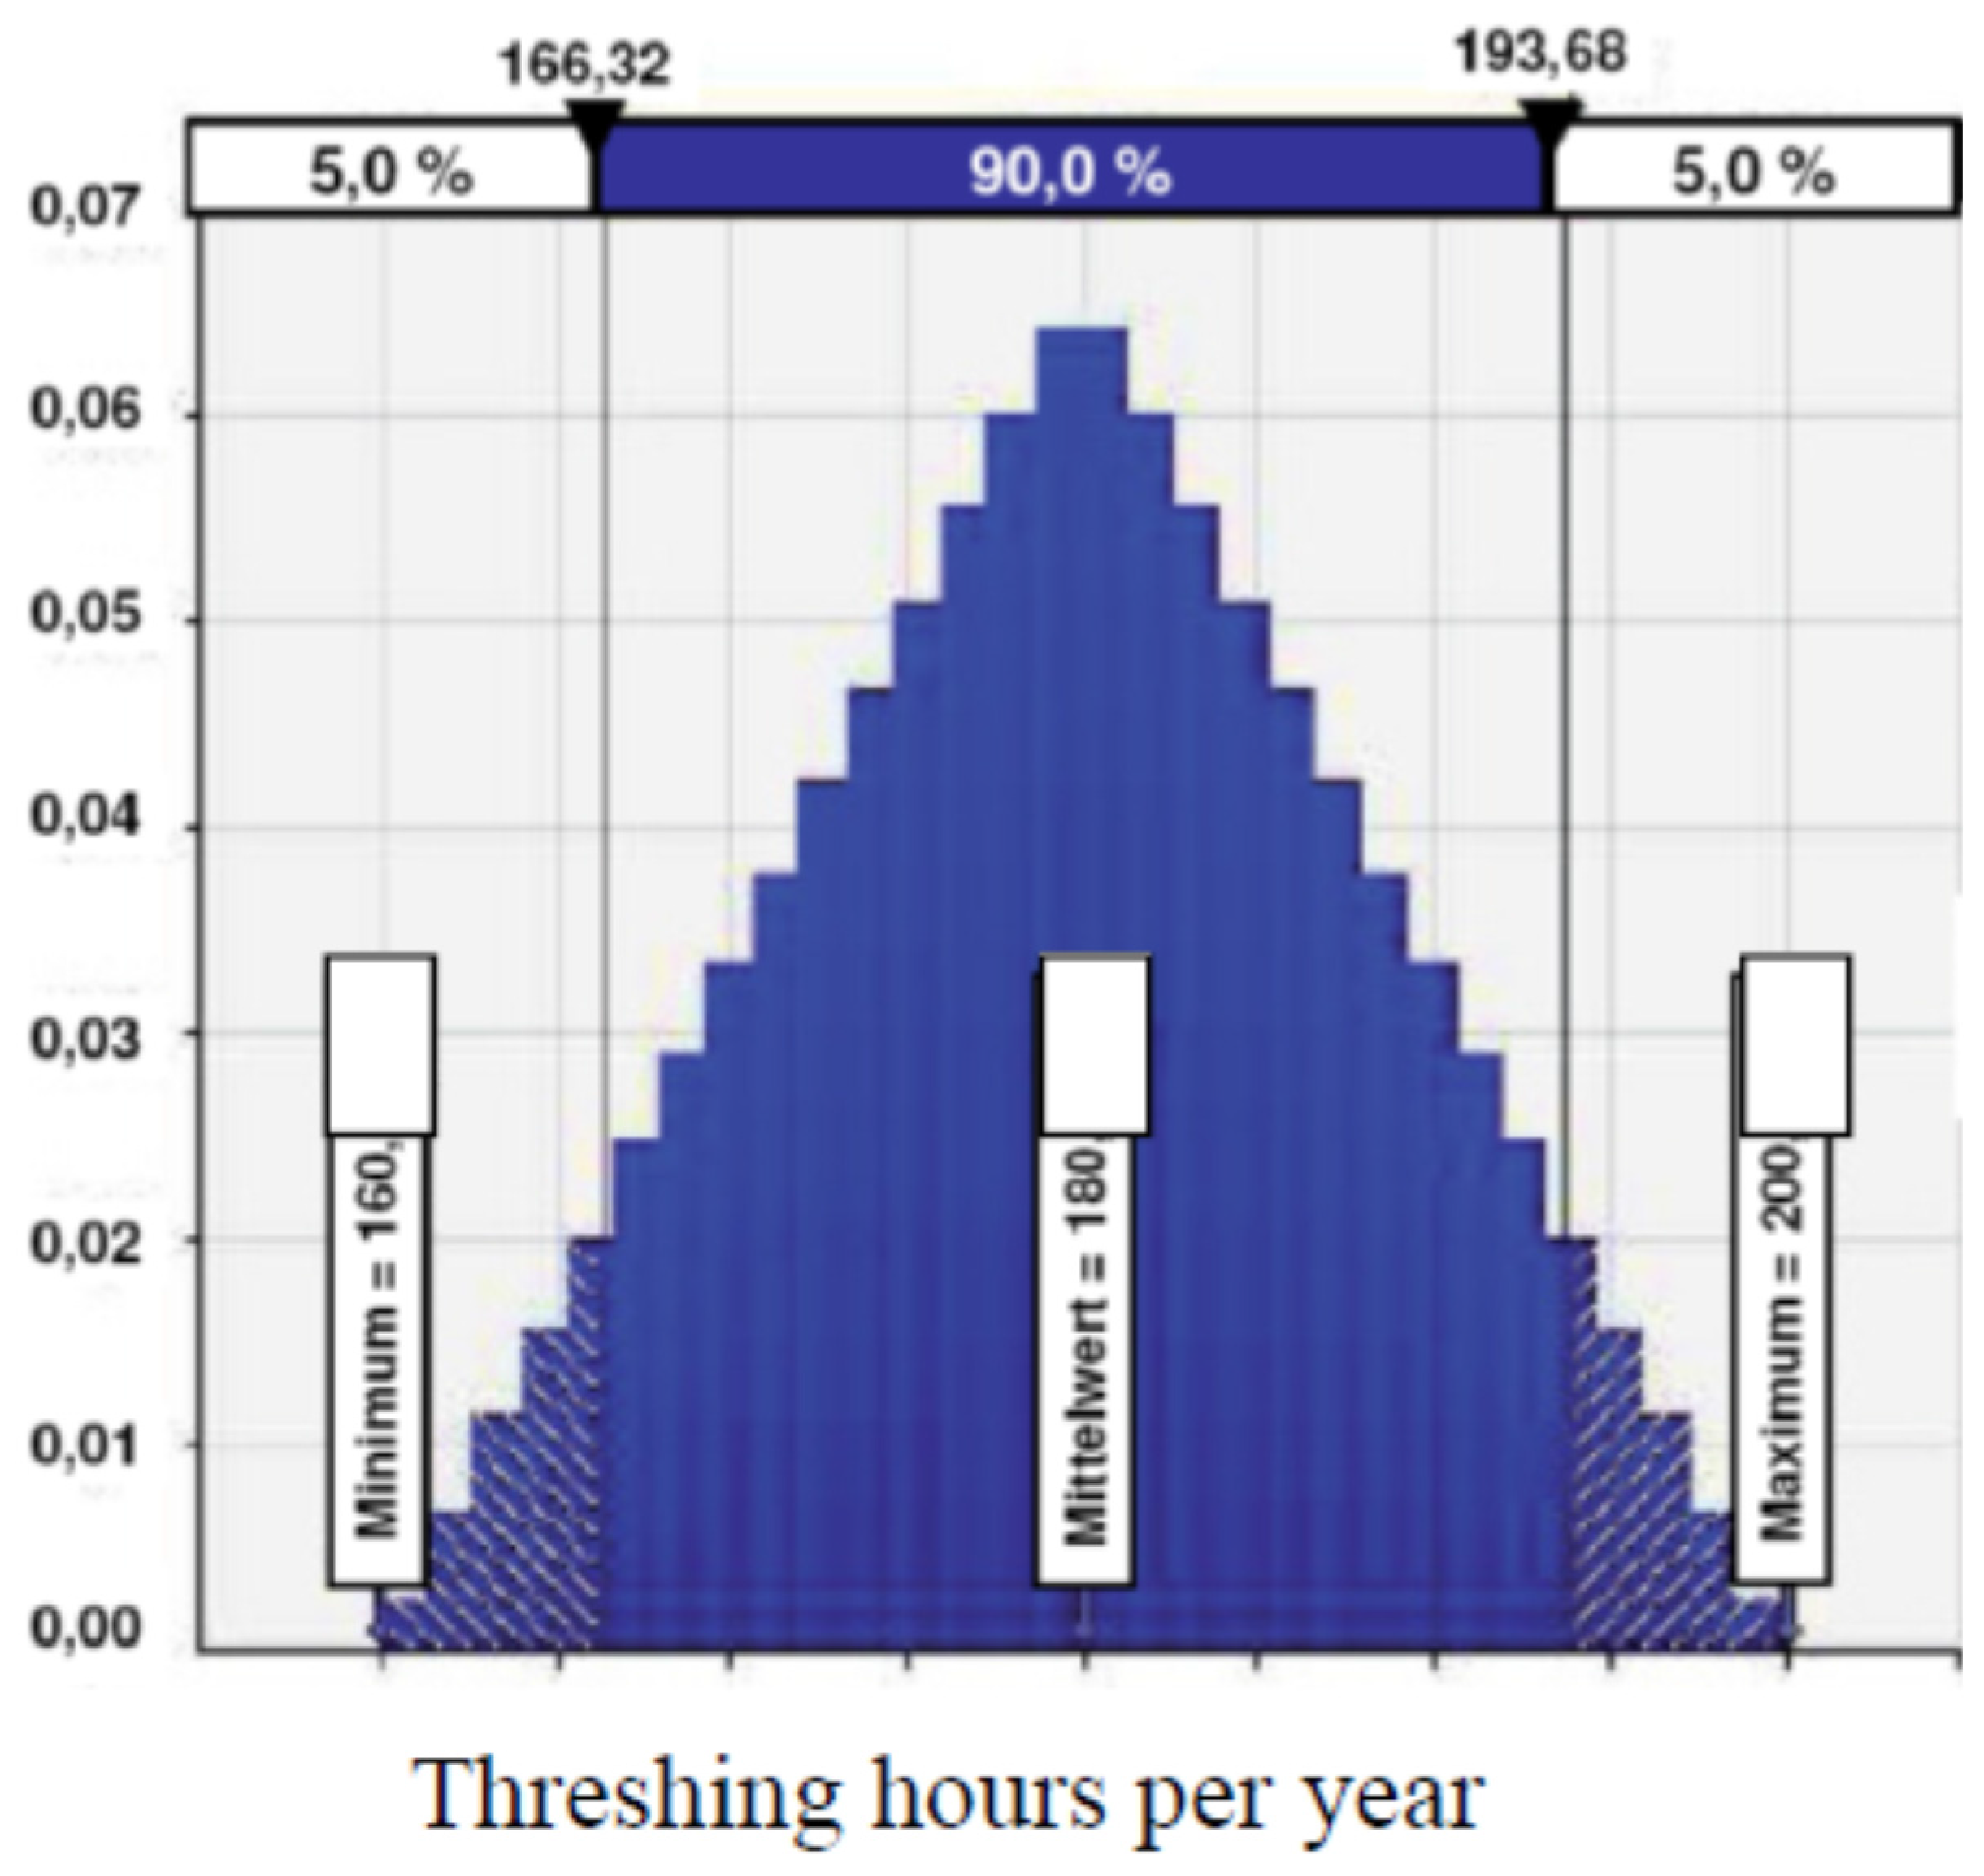
In the first case, a small number of combine harvesters would be sufficient, while a maximum number of harvesting equipment would be needed in the second case. How often unfavorable, average or favorable situations occur is specified with triangular distributions, with extreme values,
i.e., unfavorable or favorable situations, occurring less frequently than average values (
Figure 5).
Figure 5.
Available threshing hours per year in all regions combine harvesting. Source: [
17]; own calculations.
Figure 5.
Available threshing hours per year in all regions combine harvesting. Source: [
17]; own calculations.
For example, it is assumed that the available threshing hours may vary between 160 h per year as a minimum value (rare), 180 h per year on average and up to 200 h per year as the maximum value (also rarely occurs). Regional differently vary the quantities harvested and the field efficiency, the latter is assumed to be lowest for the small-scale south region (region 1) with an average of 40% (in the span from 30% to 70%) and, at the highest and most expensive in the large structured middle-east area (region 3) with an average of 60% (40%–80%) (
Table 3).
The results of the simulations give the number of a necessary minimum set of combines, which is required to harvest the volumes in all simulated years. From these values, the annually sold harvester units can be derived assuming an average service life.
In
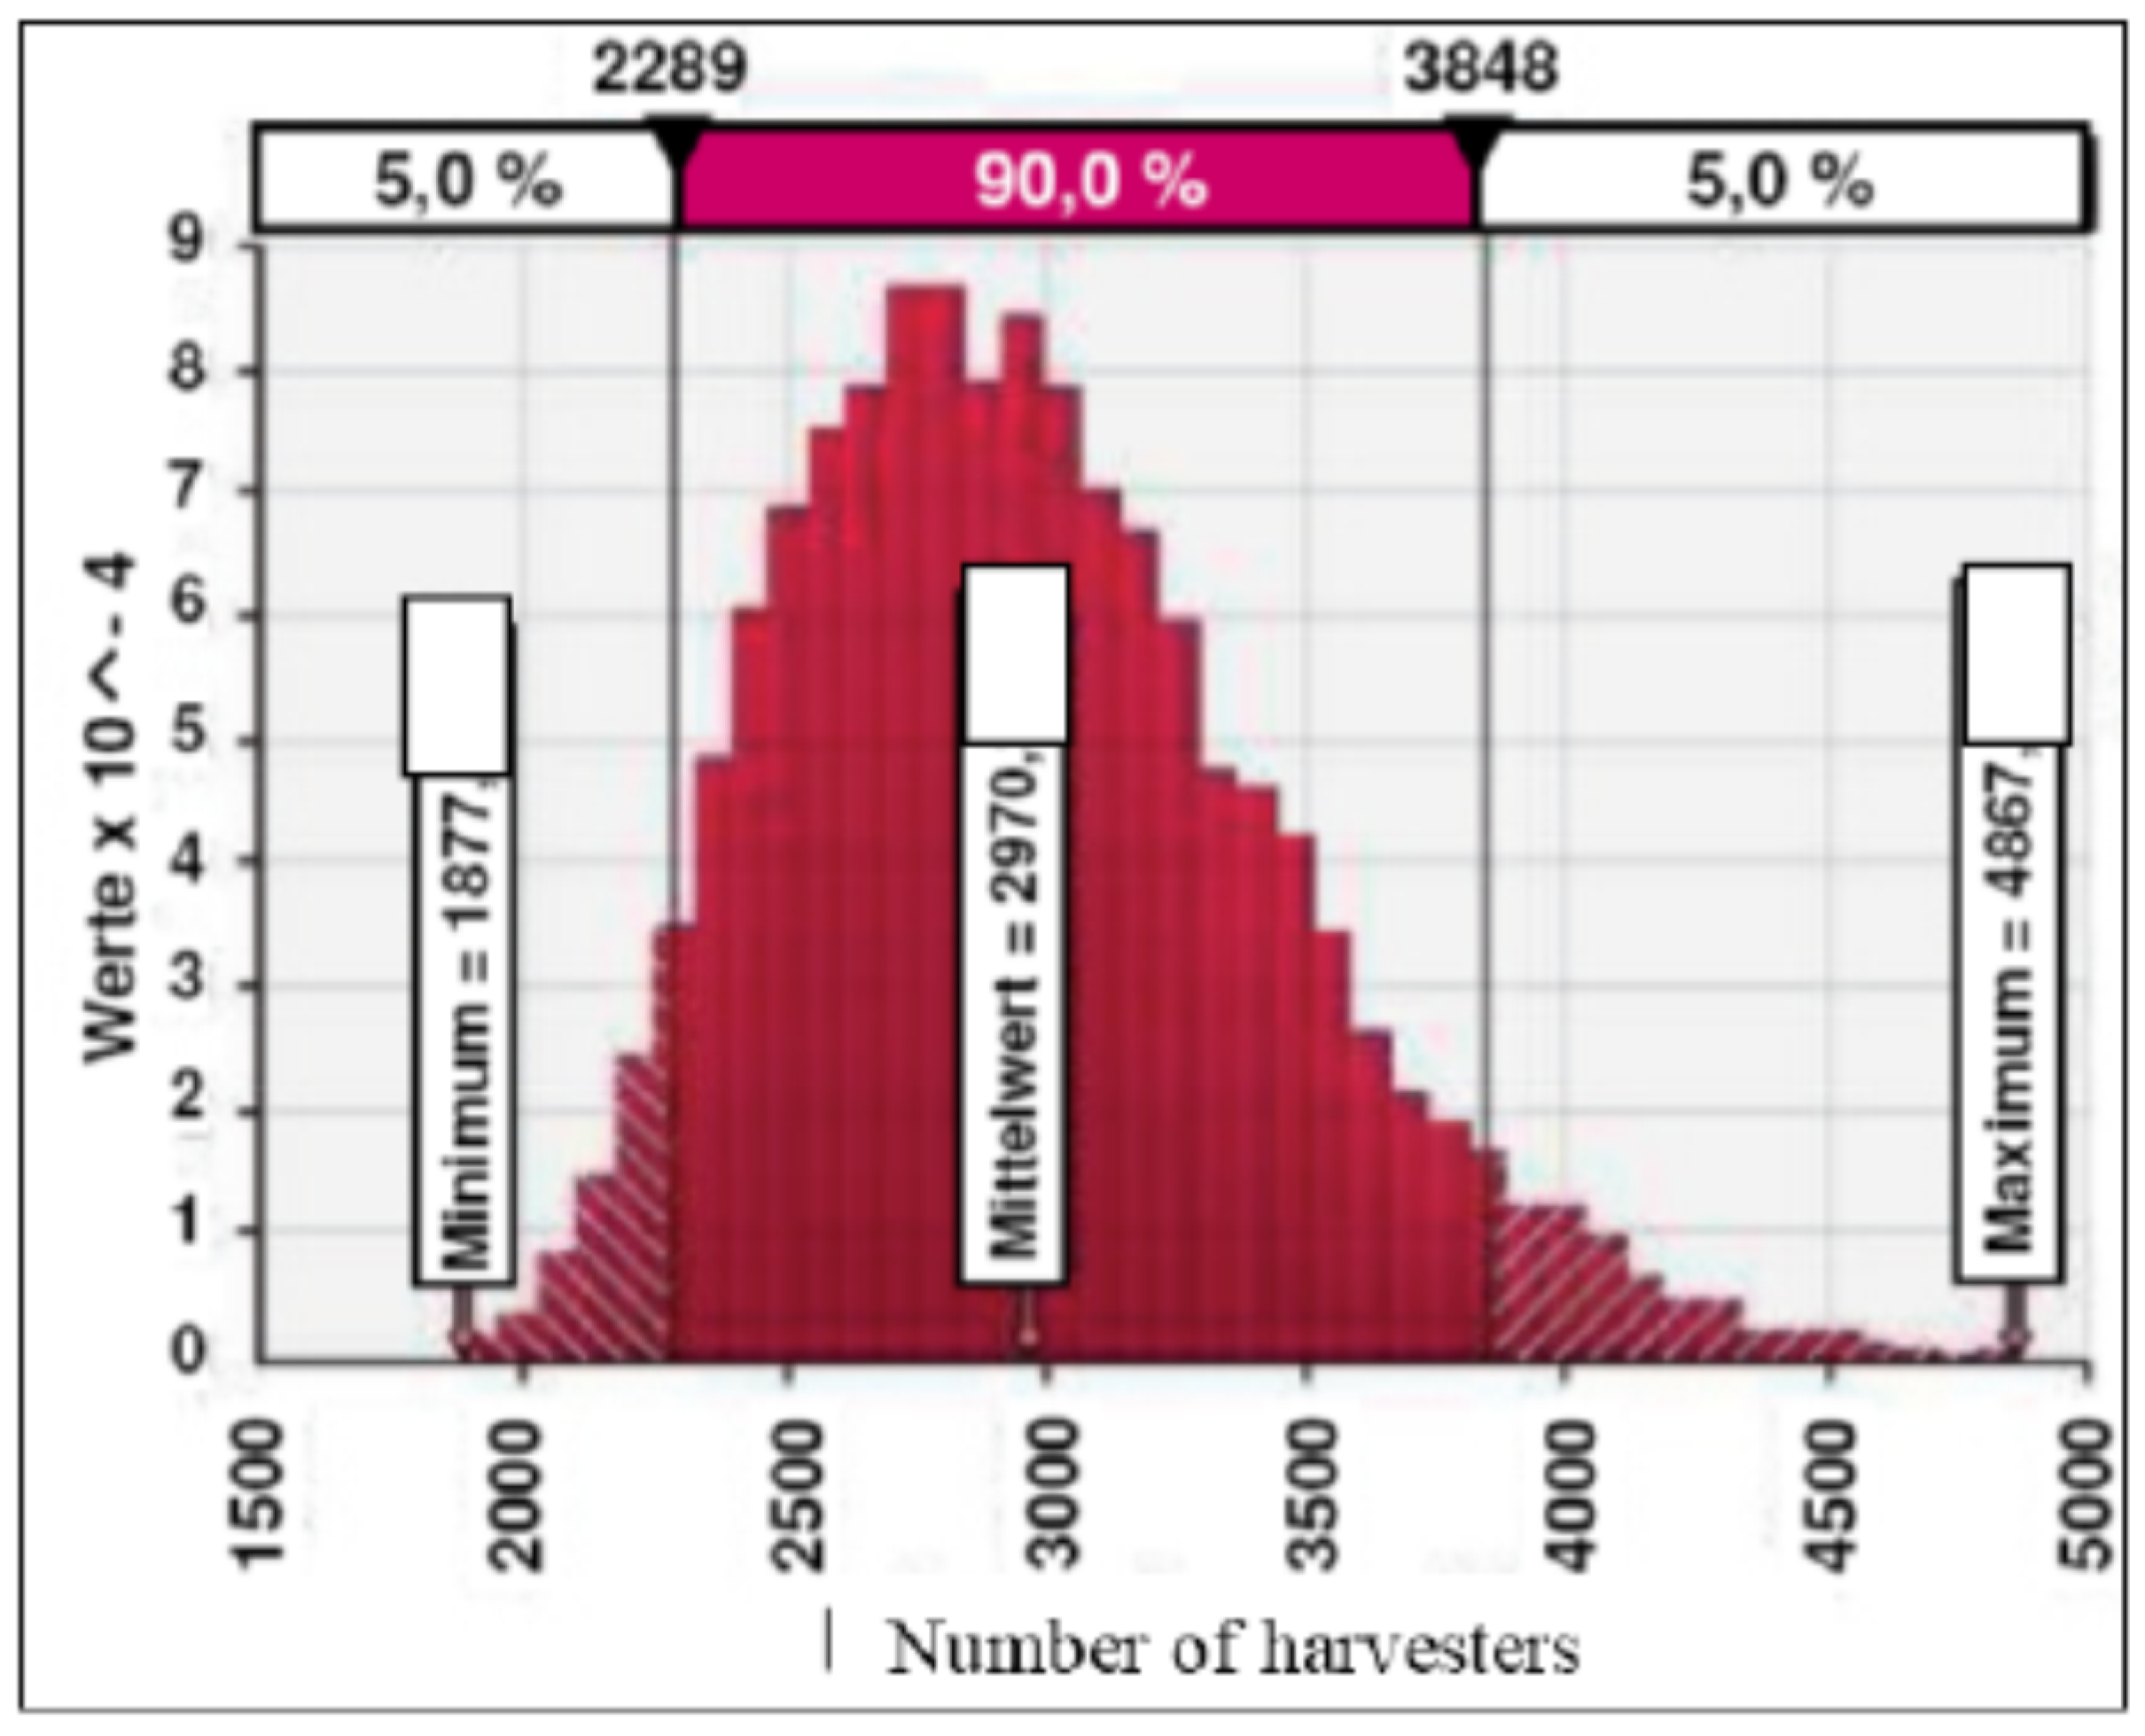
Table 4, the results of the simulation are summarized. In order to ensure that—with a probability of 100% at 10,000 iterations—the cultivated areas are completely threshed in all years, a combine fleet of 44,385 units would be required. The majority of harvesters (approximately 30,000 units) are for the region 1; this relatively high number is due to the assumed smaller power class of 15 tons per hour. In the other two regions, with approximately 8600 (region 2) and 4900 pieces (region 3), significantly fewer units are required (
Figure 6).
Introducing a limit to the fluctuation range to cover for 90% of all cases,
i.e. cutting off the 5% lowest (best) and 5% highest (worst) values:
On the minimum cost side, it becomes more expensive, when the harvest could be cheaper due to an “over”-capacity of combines.
On the other side, it becomes cheaper due to the lower stock of combines; in 5% of all cases, a higher number of combines would be needed. The latter variants could still be realized, namely when other management reserves are developed, for example, additional inter-company co-operation and emergency relief to harvest all under difficult weather conditions.
Table 4.
Assumptions (minimum, medium and maximum values of the triangle distributions) and simulation results (in the 90% range).
Table 4.
Assumptions (minimum, medium and maximum values of the triangle distributions) and simulation results (in the 90% range).
| Region | Key Figure | Unit | Minimum | Average | Maximum |
|---|
| Region 1: Southern Germany | harvest | Mio. t per year | 18.43 | 22.02 | 24.12 |
| available threshing hours | h per year | 160 | 180 | 200 |
| field efficiency | | 30% | 40% | 70% |
| threshing costs (90%) | €uro/t | 17.83
20.79 | 26.40 | 38.63
32.90 |
| necessary stock of combine harvesters (90%) | number of machines | 10,011
12,800 | 18,068 | 30,891
24,240 |
| Region 2: Northern-West Germany | harvest | Mio. t per year | 11.94 | 13.60 | 15.63 |
| available threshing hours | h per year | 160 | 180 | 200 |
| field efficiency | | 35% | 50 % | 70 % |
| threshing costs (90%) | €uro/t | 14.26
15.96 | 18.66 | 25.57
21.93 |
| necessary stock of combine harvesters (90%) | number of machines | 3190
3830 | 4980 | 8627
6440 |
| Region 3: Middle-Eastern Germany | harvest | Mio. t per year | 13.14 | 15.70 | 17.21 |
| available threshing hours | h per year | 160 | 180 | 200 |
| field efficiency | | 40% | 60% | 80% |
| threshing costs (90%) | €uro/t | 12.18
13.18 | 14.97 | 20.04
17.29 |
| necessary stock of combine harvesters (90%) | number of machines | 1877
2289 | 2970 | 4867
3848 |
| Germany | Stock of combine harvesters | number of machines | 15,078 | 25,737 | 44,385 |
| (90%) | 18,919 | | 34,528 |
Figure 6.
Distribution of the necessary number of harvesters in the threshing region 3. Source: [
17]; own calculations (10,000 simulations).
Figure 6.
Distribution of the necessary number of harvesters in the threshing region 3. Source: [
17]; own calculations (10,000 simulations).
4.5. Future Development of the Number of Combine Harvesters
Historical data for inventory and sales of combines have been analyzed in this study, until 2008 and before. The current stock of combine harvesters in Germany amounting to approximately 80,000 machines is almost twice as high as the calculated necessary inventory with about 44,000 units (
Table 4). This explains the relatively low domestic sales in recent years. Due to the overcapacity of combine harvesters, the latest development of destocking, with relatively low replacement, will continue (although powerful modern combine harvesters are not yet in use everywhere) until the necessary stock of about 44,000 combine is reached. For the future, it is assumed that the existing stock of combines will decrease by 5% annually, similar to the period from 1990 to 2008 observed. In addition, the sales of combines per year are estimated (and therefor limited) according the trend line determined during the period from 1990 to 2008 (
Figure 2):
where y = number of combines in Germany in units per year, and x = year from 1990 onwards.
Because of the high old stock of harvesters, the annual sales of combines might decrease to 1283 units in 2009 and further to 727 units in 2019 (
Figure 7). Thus, on average, over the years 2009 to 2019, a relatively small substitution of an average 1005 combines per year would be sufficient in Germany.
In the calculations for
Figure 8, it was assumed that by 2009 for the newly sold combines a 10-year using age could be expected. After this time, annually 20% of the old machines could be eliminated, so after 15 years, none of these machines would be available. In the following years (from 2019), the useful life of the new combines has been limited to a maximum of eight years.
From 2019, the old stock would be so far degraded that a larger replacement demand of approximately 3000 combines a year is expected. In the long term, however, according to the assumptions, about 4400 new combines are annually necessary to replace a total stock of 44,385 units of combine harvester in Germany.
Figure 7.
Sales and inventory of combine harvesters (1990–2022). Source: Own calculations based on [
9,
11].
Figure 7.
Sales and inventory of combine harvesters (1990–2022). Source: Own calculations based on [
9,
11].
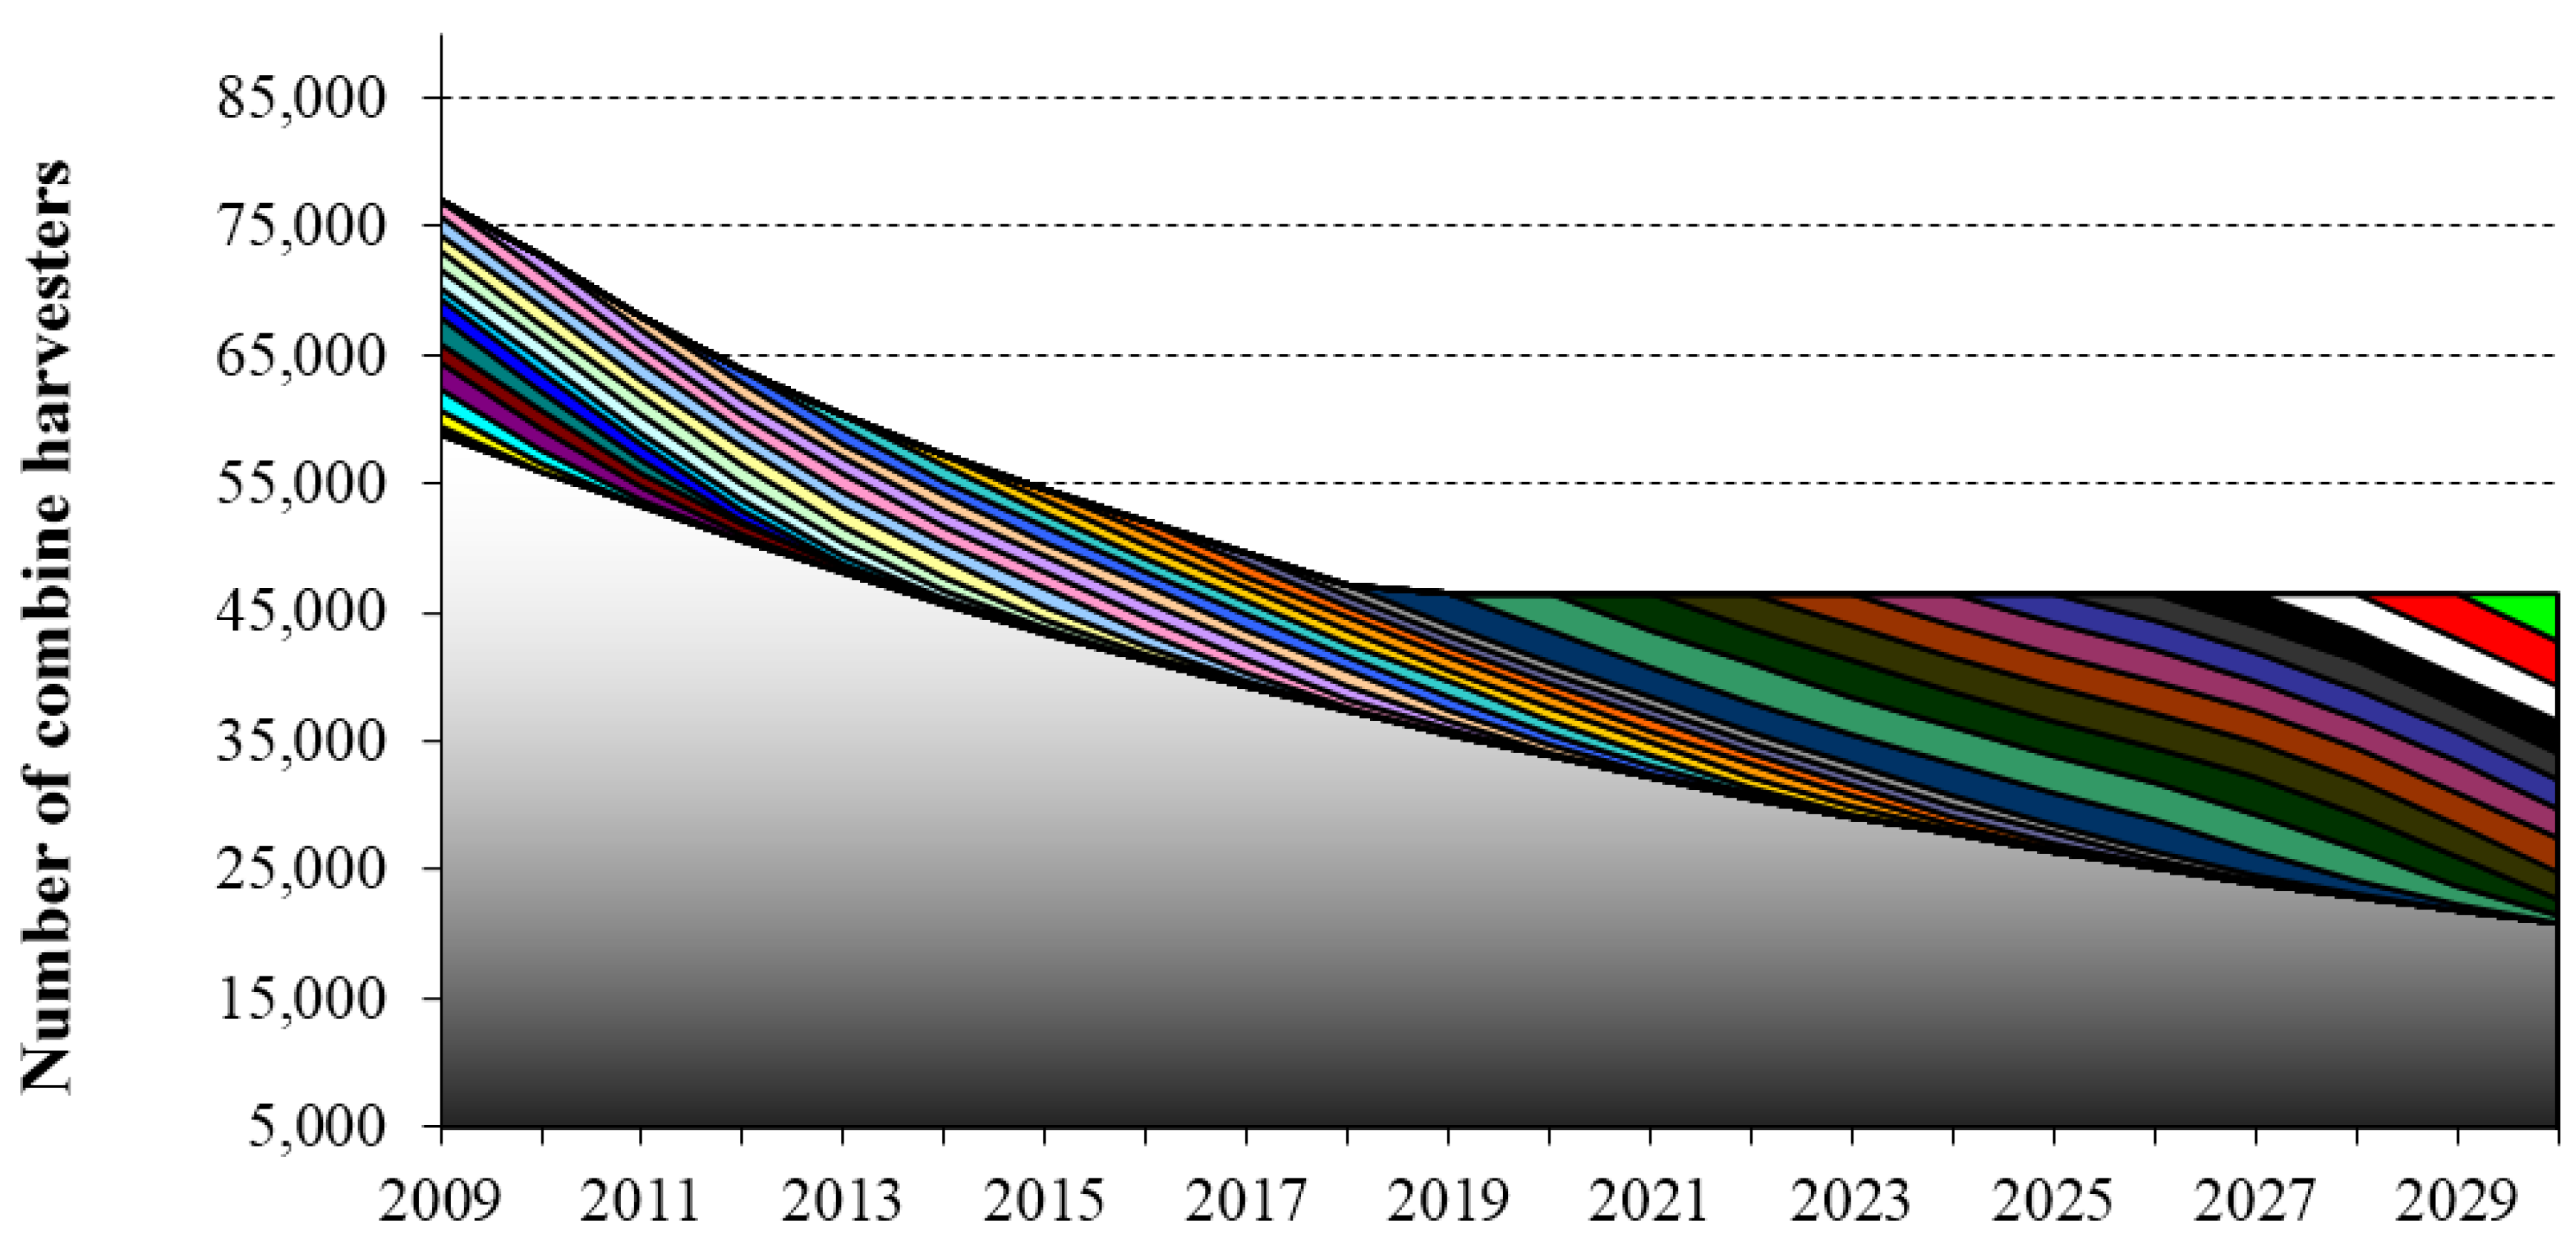
After adjusting, the stocks of combine harvesters will reach a minimum constant level of at least about 44,000 units from 2019 to 2030; the colored lines in
Figure 7 show the initial number of future harvesters sales in a certain year and their path of decrease.
Figure 8.
Inventory of combines cumulated from old stock and calculated domestic sales (2009–2030, colored lines). Source: Own calculations based on [
9,
11].
Figure 8.
Inventory of combines cumulated from old stock and calculated domestic sales (2009–2030, colored lines). Source: Own calculations based on [
9,
11].


