Geology and U-Th-Pb Dating of the Gakara REE Deposit, Burundi
by
 ,
,
Seconde Ntiharirizwa
1,2,*, 
Philippe Boulvais
1,
Marc Poujol
1,
Yannick Branquet
1,3,
Cesare Morelli
4,
Joël Ntungwanayo
4 and
Gilbert Midende
2,4 1
Géosciences Rennes-UMR 6118, University Rennes, CNRS, F-35000 Rennes, France
2
Earth Sciences Department, University of Burundi, 2700 Bujumbura, Burundi
3
Institut des Sciences de la Terre d’Orléans (ISTO) Université d’Orléans·CNRS·BRGM, UMR 7327, 1A rue de la Férollerie, CS 20066, F-45071 Orléans CEDEX 2, France
4
Rainbow Rare Earths, 3 Boulevard du Japon, Bujumbura, Burundi
*
Author to whom correspondence should be addressed.
Minerals 2018, 8(9), 394; https://doi.org/10.3390/min8090394
Submission received: 27 June 2018
/
Revised: 4 September 2018
/
Accepted: 5 September 2018
/
Published: 7 September 2018
(This article belongs to the Special Issue Toward Mineral Systems for HFSE Rare Metals)
Abstract
:The Gakara Rare Earth Elements (REE) deposit is one of the world’s highest grade REE deposits, likely linked to a carbonatitic magmatic-hydrothermal activity. It is located near Lake Tanganyika in Burundi, along the western branch of the East African Rift. Field observations suggest that the mineralized veins formed in the upper crust. Previous structures inherited from the Kibaran orogeny may have been reused during the mineralizing event. The paragenetic sequence and the geochronological data show that the Gakara mineralization occurred in successive stages in a continuous hydrothermal history. The primary mineralization in bastnaesite was followed by an alteration stage into monazite. The U-Th-Pb ages obtained on bastnaesite (602 ± 7 Ma) and on monazite (589 ± 8 Ma) belong to the Pan-African cycle. The emplacement of the Gakara REE mineralization most likely took place during a pre-collisional event in the Pan-African belt, probably in an extensional context.
1. Introduction
During the recent years, the scientific community made an important effort in order to better understand the metallogenic conditions behind the emplacement of Rare Earth Elements (REE) mineralization. Alkaline intrusions and carbonatites and the associated hydrothermal activities are known to host the largest REE deposits [1]. Among the world-famous occurrences, the Gakara deposit (Burundi) is described as a typical example of hydrothermal deposits developed in association with carbonatite magmatism [2]. Nevertheless, little is known or has been published [3,4] about this deposit, especially when compared to the Bayan Obo deposit in China. Indeed, during the last 10 years, more than 100 articles have been published on this unique deposit [5]. Since September 2017, the Gakara deposit is mined by the “Rainbow Rare Earths” mining company with a targeting run rate of about 5000 tons per year. With in-situ grades in the range of 47–67% Total Rare Earth Oxide, Gakara is one of the world’s richest rare earth deposits. The mining operations follow a period of intensive exploration, during which new outcrops have been exposed and reference samples have been collected.
In this work, we first report the field observations we made during two fieldwork campaigns, in October 2017 and February 2018, respectively. These field data allow us to define the structural framework controlling the mineralization in the upper crust. Also, we present a U-Th-Pb geochronological study of the mineralization, which mainly consists of primary bastnaesite (LREE-fluorocarbonate) and secondary monazite (LREE-Phosphate). The only geochronological data available so far for the Gakara area was obtained on bastnaesite [6], using the 138La-138Ba isochron method, yielding a Pan-African age of 586.8 ± 3.7 Ma. In this paper, we use the U-Th-Pb in-situ LA-ICP-MS dating technique for bastnaesite and monazite. These new ages allow us to discuss the evolution of mineralization in the regional geodynamical context.
2. Geology
2.1. Pan-African in East Africa
The Pan-African System in Africa, Brazil and eastern Antarctica has been interpreted as a tectono-thermal event during which several mobile belts formed around older cratons, resulting essentially from the closure of several major Neoproterozoic oceans [7]. The Mozambique mobile belt (Figure 1A) is the youngest of the East African mobile belts, extending from Ethiopia, Kenya and Somalia via Tanzania to the north and Malawi and Mozambique to the south [7,8]. The Pan-African structures are related to the initial formation of Gondwana (and Pangaea) by amalgamation of Archean and Proterozoic cratons, voluminous island arc material as accreted terranes, and sub-craton fragments of Proterozoic continental material [8,9]. The Pan-African overprinting has not yet been recognized in Burundi. However, later Proterozoic events such as (1) the Upper Ruvubu alkaline plutonic complex, (2) the Matongo carbonatite and (3) the Gakara REE mineralization, have been related to Pan-African far-field tectono-thermal processes in the Western Rift area [10].
2.2. Alkaline Magmatism in the Region
The Gakara REE deposit is located in Burundi, near Lake Tanganyika, in the western branch of the East African Rift (Figure 1). The western branch extends over a distance of 2100 km from Lake Albert in the north, to Lake Malawi in the south [11,12]. The western branch of the East African Rift hosts numerous carbonatites (Figure 1A) and alkaline plutonic massifs [3]. These rocks range in age from the Late Proterozoic to the Cenozoic and are the witnesses of several episodes of extensional deformation along the same structural trend [13,14,15]. In central Africa, twenty-three Neoproterozoic alkaline plutonic massifs have been recognized [13,14], among them the Upper Ruvubu Alkaline Plutonic Complex (UPRAC) and the Matongo carbonatite in Burundi [10,16]. In the Gakara region (about 60 km to the south of Matongo), the presence of another carbonatitic body hidden at depth is suspected [10,17]. This suspicion is based on the strongly alkaline character of the ore system [18], the lack of relationships with the regional pegmatitic magmatism [3], the mineral assemblage similar to those found in many carbonatites bearing rare earth mineralization [3,19,20], the nature of the hydrothermal fluid system where liquid CO2 coexists with highly saline aqueous fluid [4] and the rare earth differentiation similar to other carbonatite deposits [3,17,21].
2.3. Geology of the Gakara Area
With the exception of the Archean Mugere complex, the Gakara area is mainly composed of rocks (mostly metasediments and granitoids, Figure 1B) emplaced during the Mesoproterozoic Kibaran orogenic event between 1375 Ma and 985 Ma [22]. These units are intruded by a dense network of Kibaran pegmatites [3]. The REE veins, found in both types of rocks, contain mainly bastnaesite, which can be replaced, in a second stage, by monazite. Because this replacement is not ubiquitous, the REE-bearing minerals in these veins vary from pure bastnaesite to nearly pure monazite. Quartz (several generations) and wall rock clasts constitute the other components found in the ore veins. Classically, this kind of mineralization is related to carbonatitic and/or peralkaline magmas emplacement.
Finally, the Cenozoic rifting (Figure 1B) affected the whole area with a general uplift. Normal faults that accommodated this rifting are not clearly recognized in the Gakara area; however, some large blocks could have been tilted during these extensional tectonic phases.
3. Field Data
3.1. Host Rocks
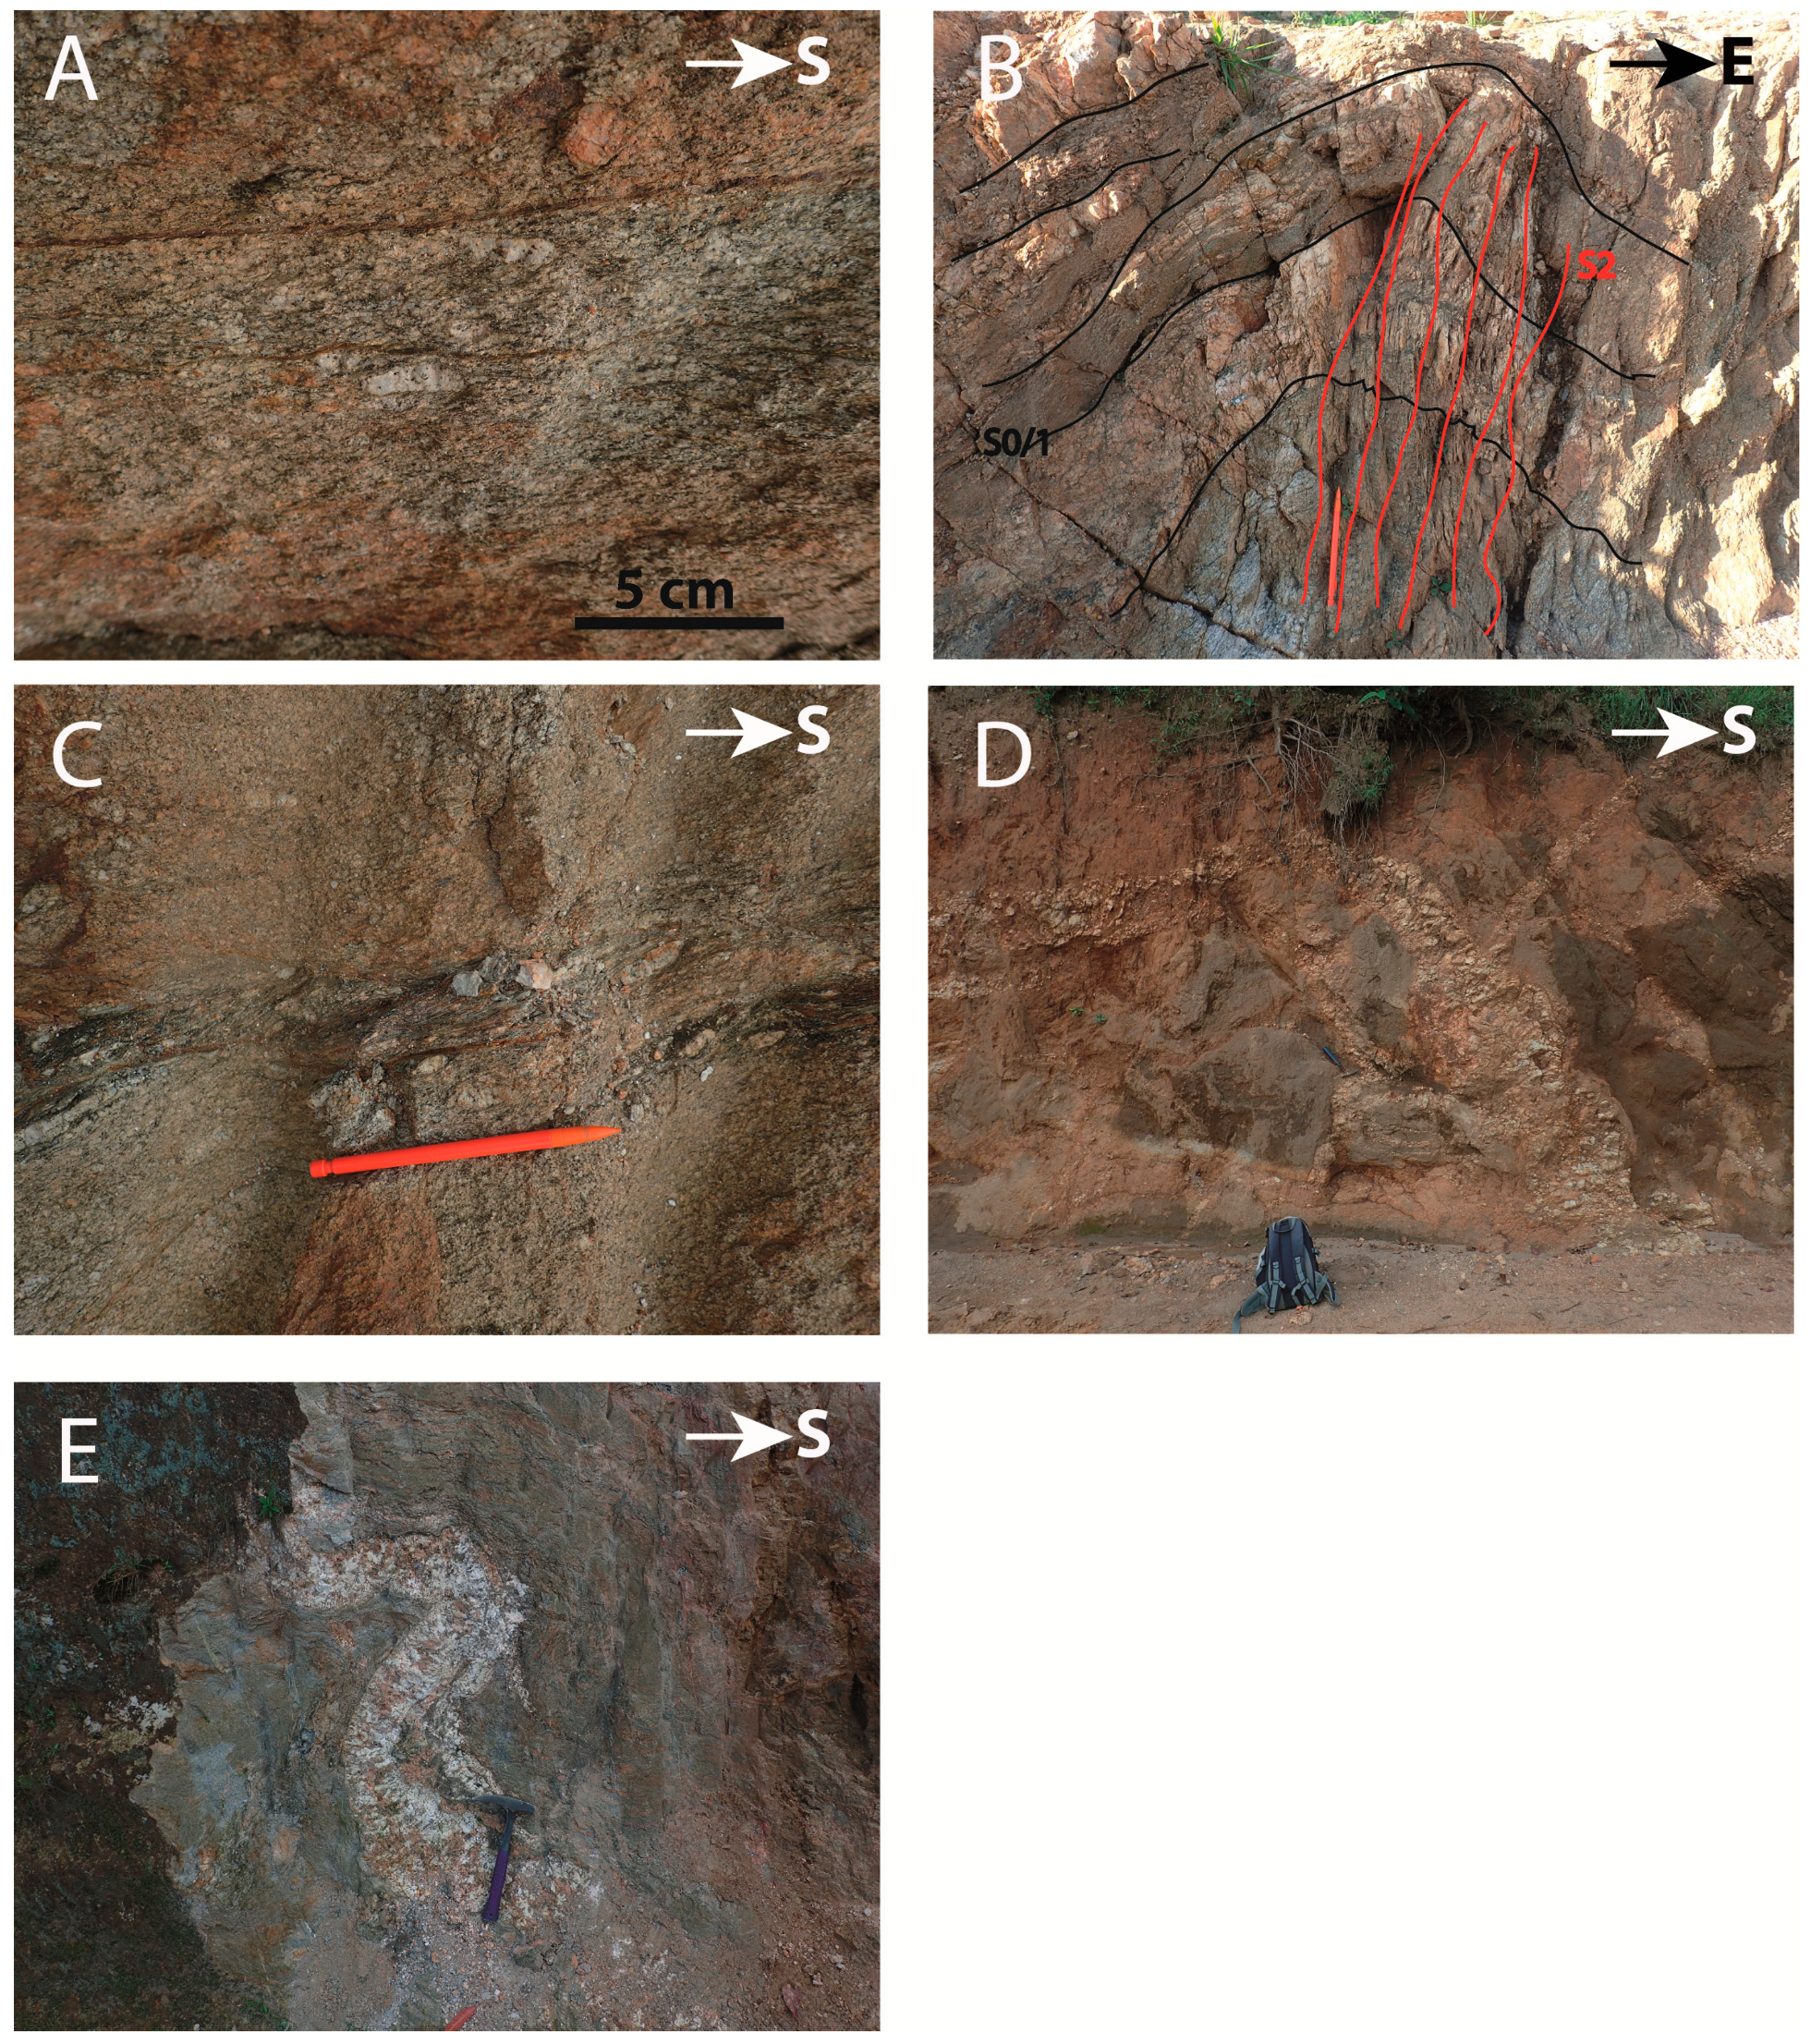
Rocks are poorly exposed in the Gakara region, as they are often buried underneath a lateritic cover, and because of the presence of numerous agricultural crops and slope deposits. Some outcrops are nevertheless visible along new roads opened for mining purposes, as well as along pedestrian roads and river beds. All the visited sites are enclosed within gneisses. The gneisses are very heterogeneous in term of lithologies and structures. The most common gneiss facies corresponds to an orthogneiss with K-feldspar phenocrysts, biotite, quartz, with less abundant muscovite (Figure 2A) likely deriving from S-type granites resulting from the partial melting of the surrounding paragneisses during the Kibaran orogeny. The other type of gneisses corresponds to FK-paragneisses well exposed at Kiyenzi. The original sedimentary bedding transposed by a former S1 foliation is folded with an associated S2 axial planar cleavage (Figure 2B).
The deformation that affected these gneisses, visible at all scales, corresponds to a system of ductile shear bands. Sub-solidus and solid-state deformation have been observed. The existence of sub-solidus and hot deformation is demonstrated by the presence of: (i) typical C/S structures in the orthogneisses, the C planes being underlined by biotite (Figure 2A); (ii) ductile shear zones where pegmatites were emplaced (Figure 2C). Such structures argue for a syntectonic emplacement of the granitoids. Solid-state deformation is attested by the occurrence of foliated mylonites associated with an important grain size reduction. Both the ortho- and para-gneisses are intruded by numerous pegmatitic bodies (Figure 2D,E). When the foliation plan (S1) is parallel to the exposed surface, some of these bodies appear as classical dykes and sills crosscutting the foliation (Figure 2D). However, most of them are transposed into the foliation and strongly deformed (Figure 2E). They are also folded and schistosed by a second foliation (S2) in the paragneiss (Figure 2B). Internal deformation of pegmatites can be very strong parallel to the main foliation (S1) with biotite marking shear planes and a strong stretching of both quartz and feldspar.
3.2. Types of Mineralization
Despite the lack of outcrops, several types of mineralization can be observed on the field. Here we present the gitology of the Gasagwe mine and the most important REE occurrences recognized and explored in the Gakara claim (see Figure 1B for mine and occurrences locations). It has to be noticed that all the visited pits and trenches underwent strong laterization and weathering (picture in Figure 3).
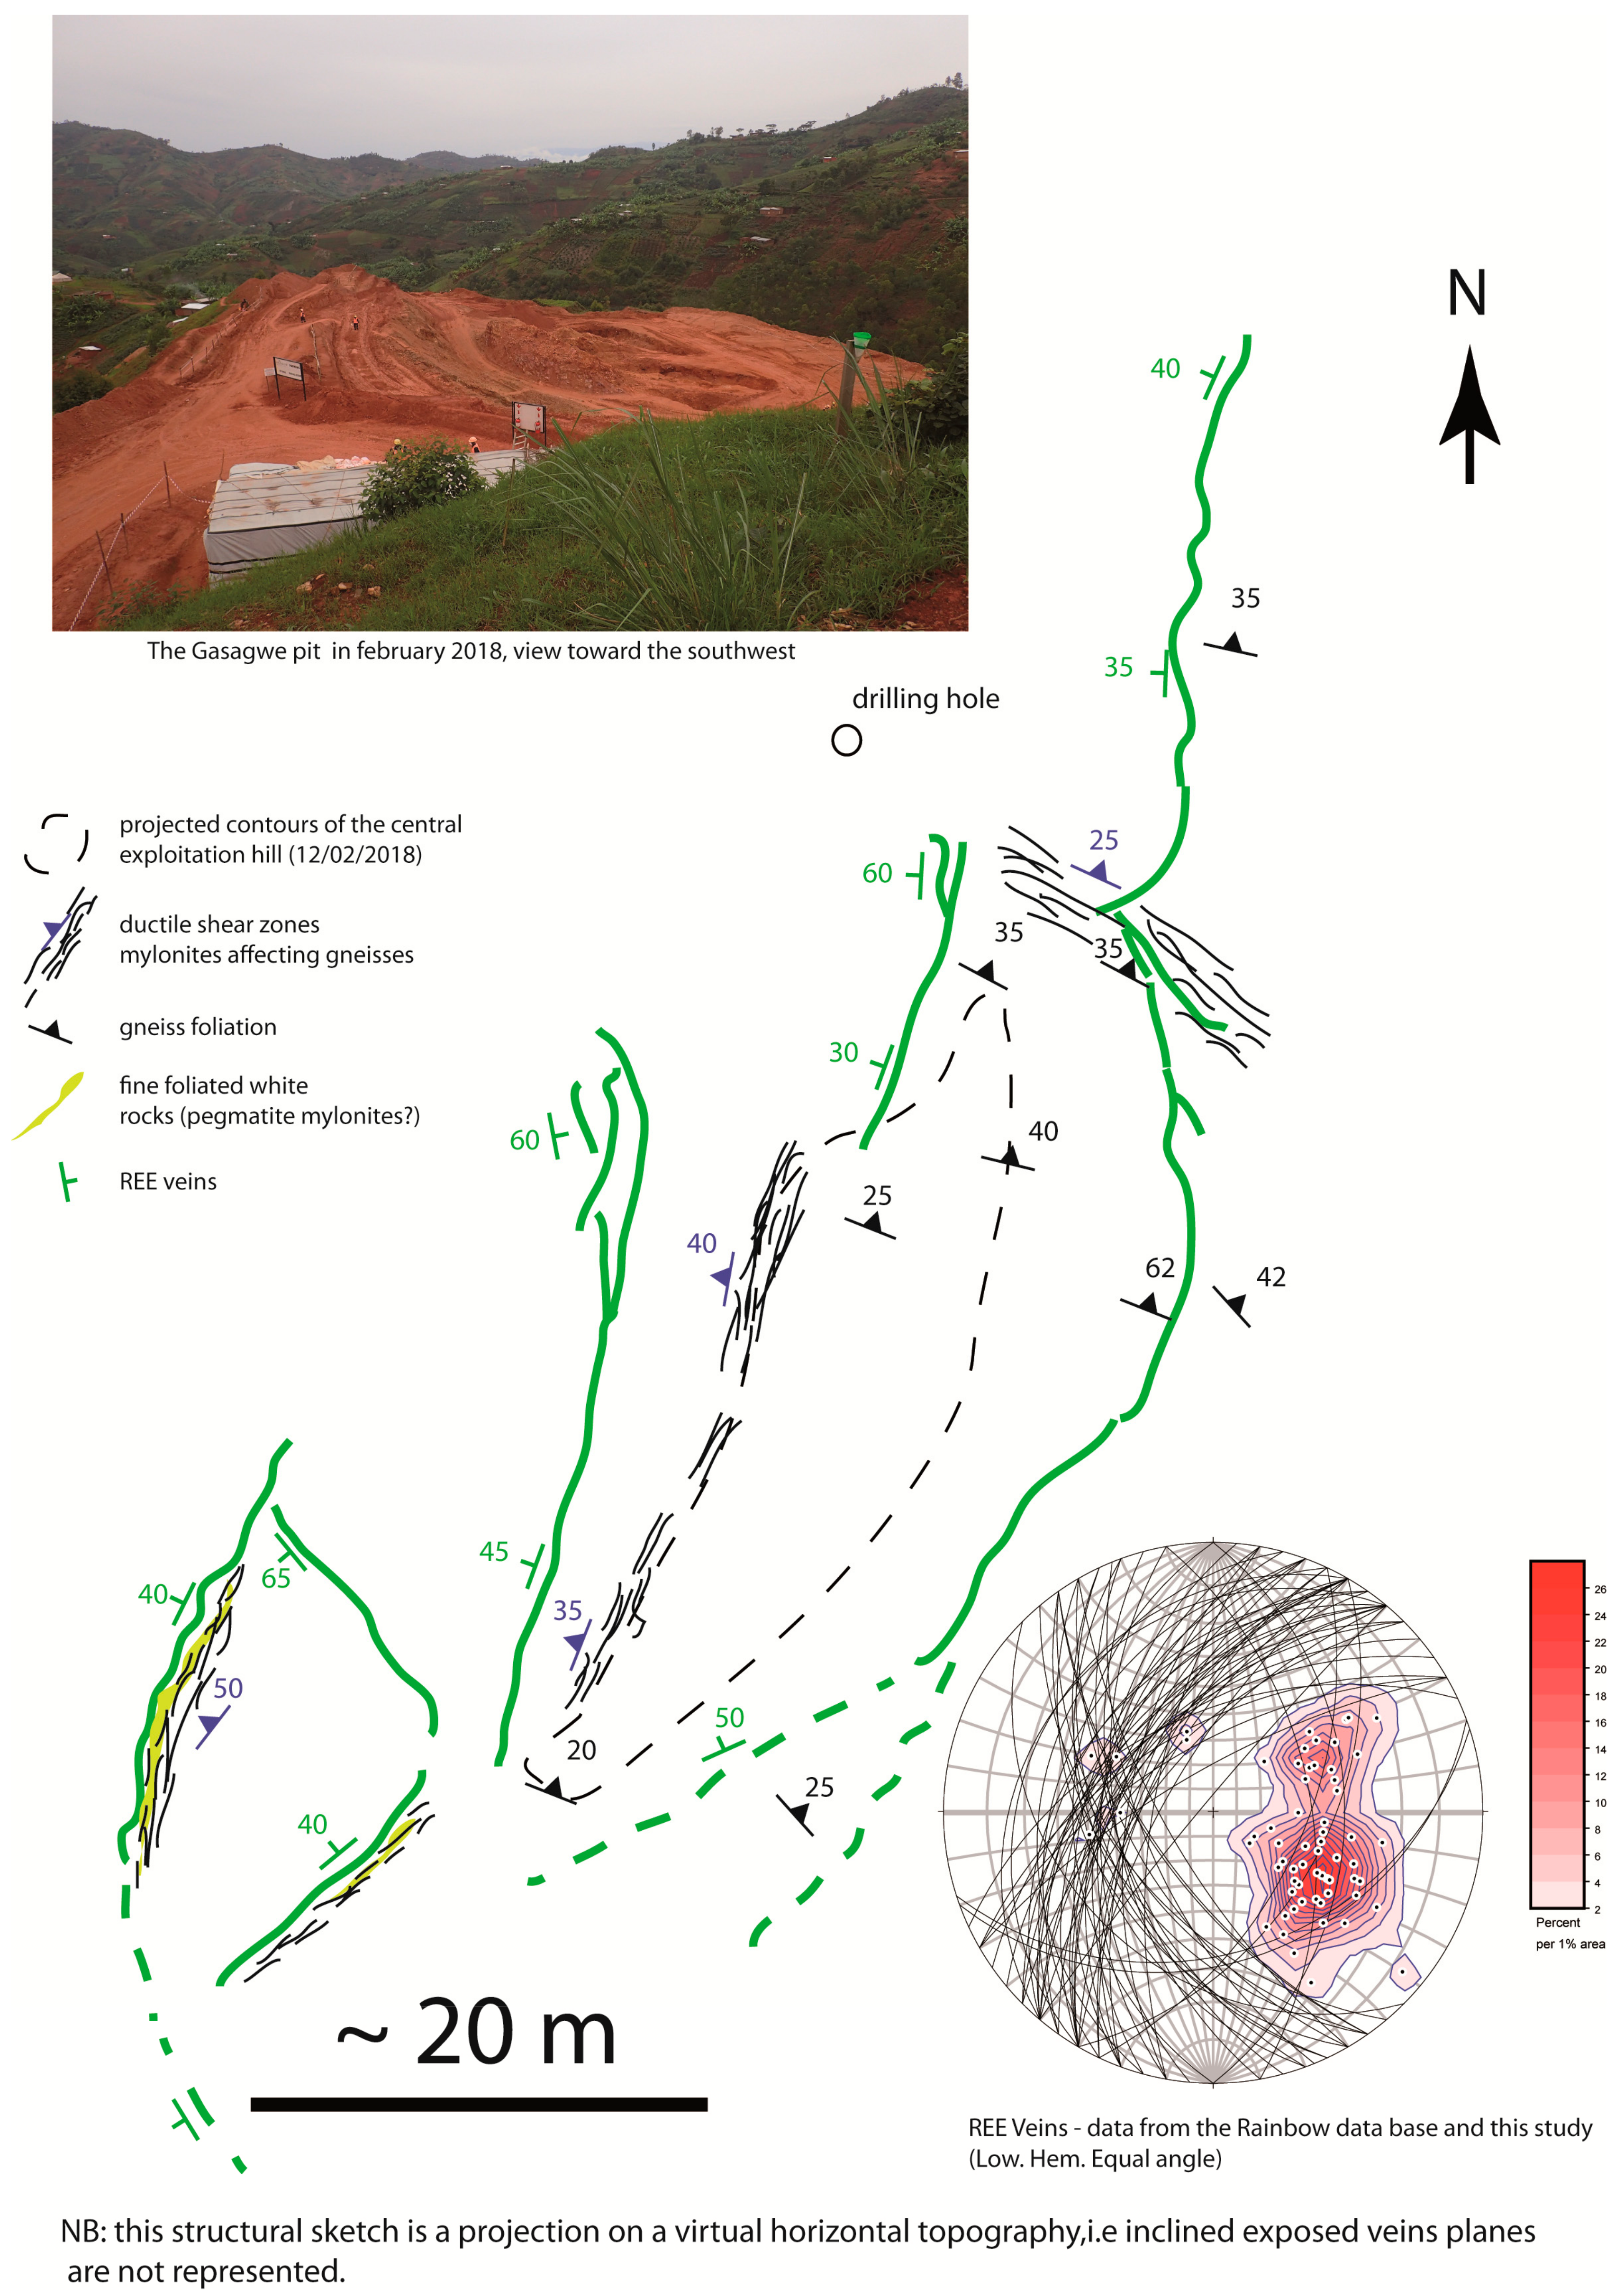
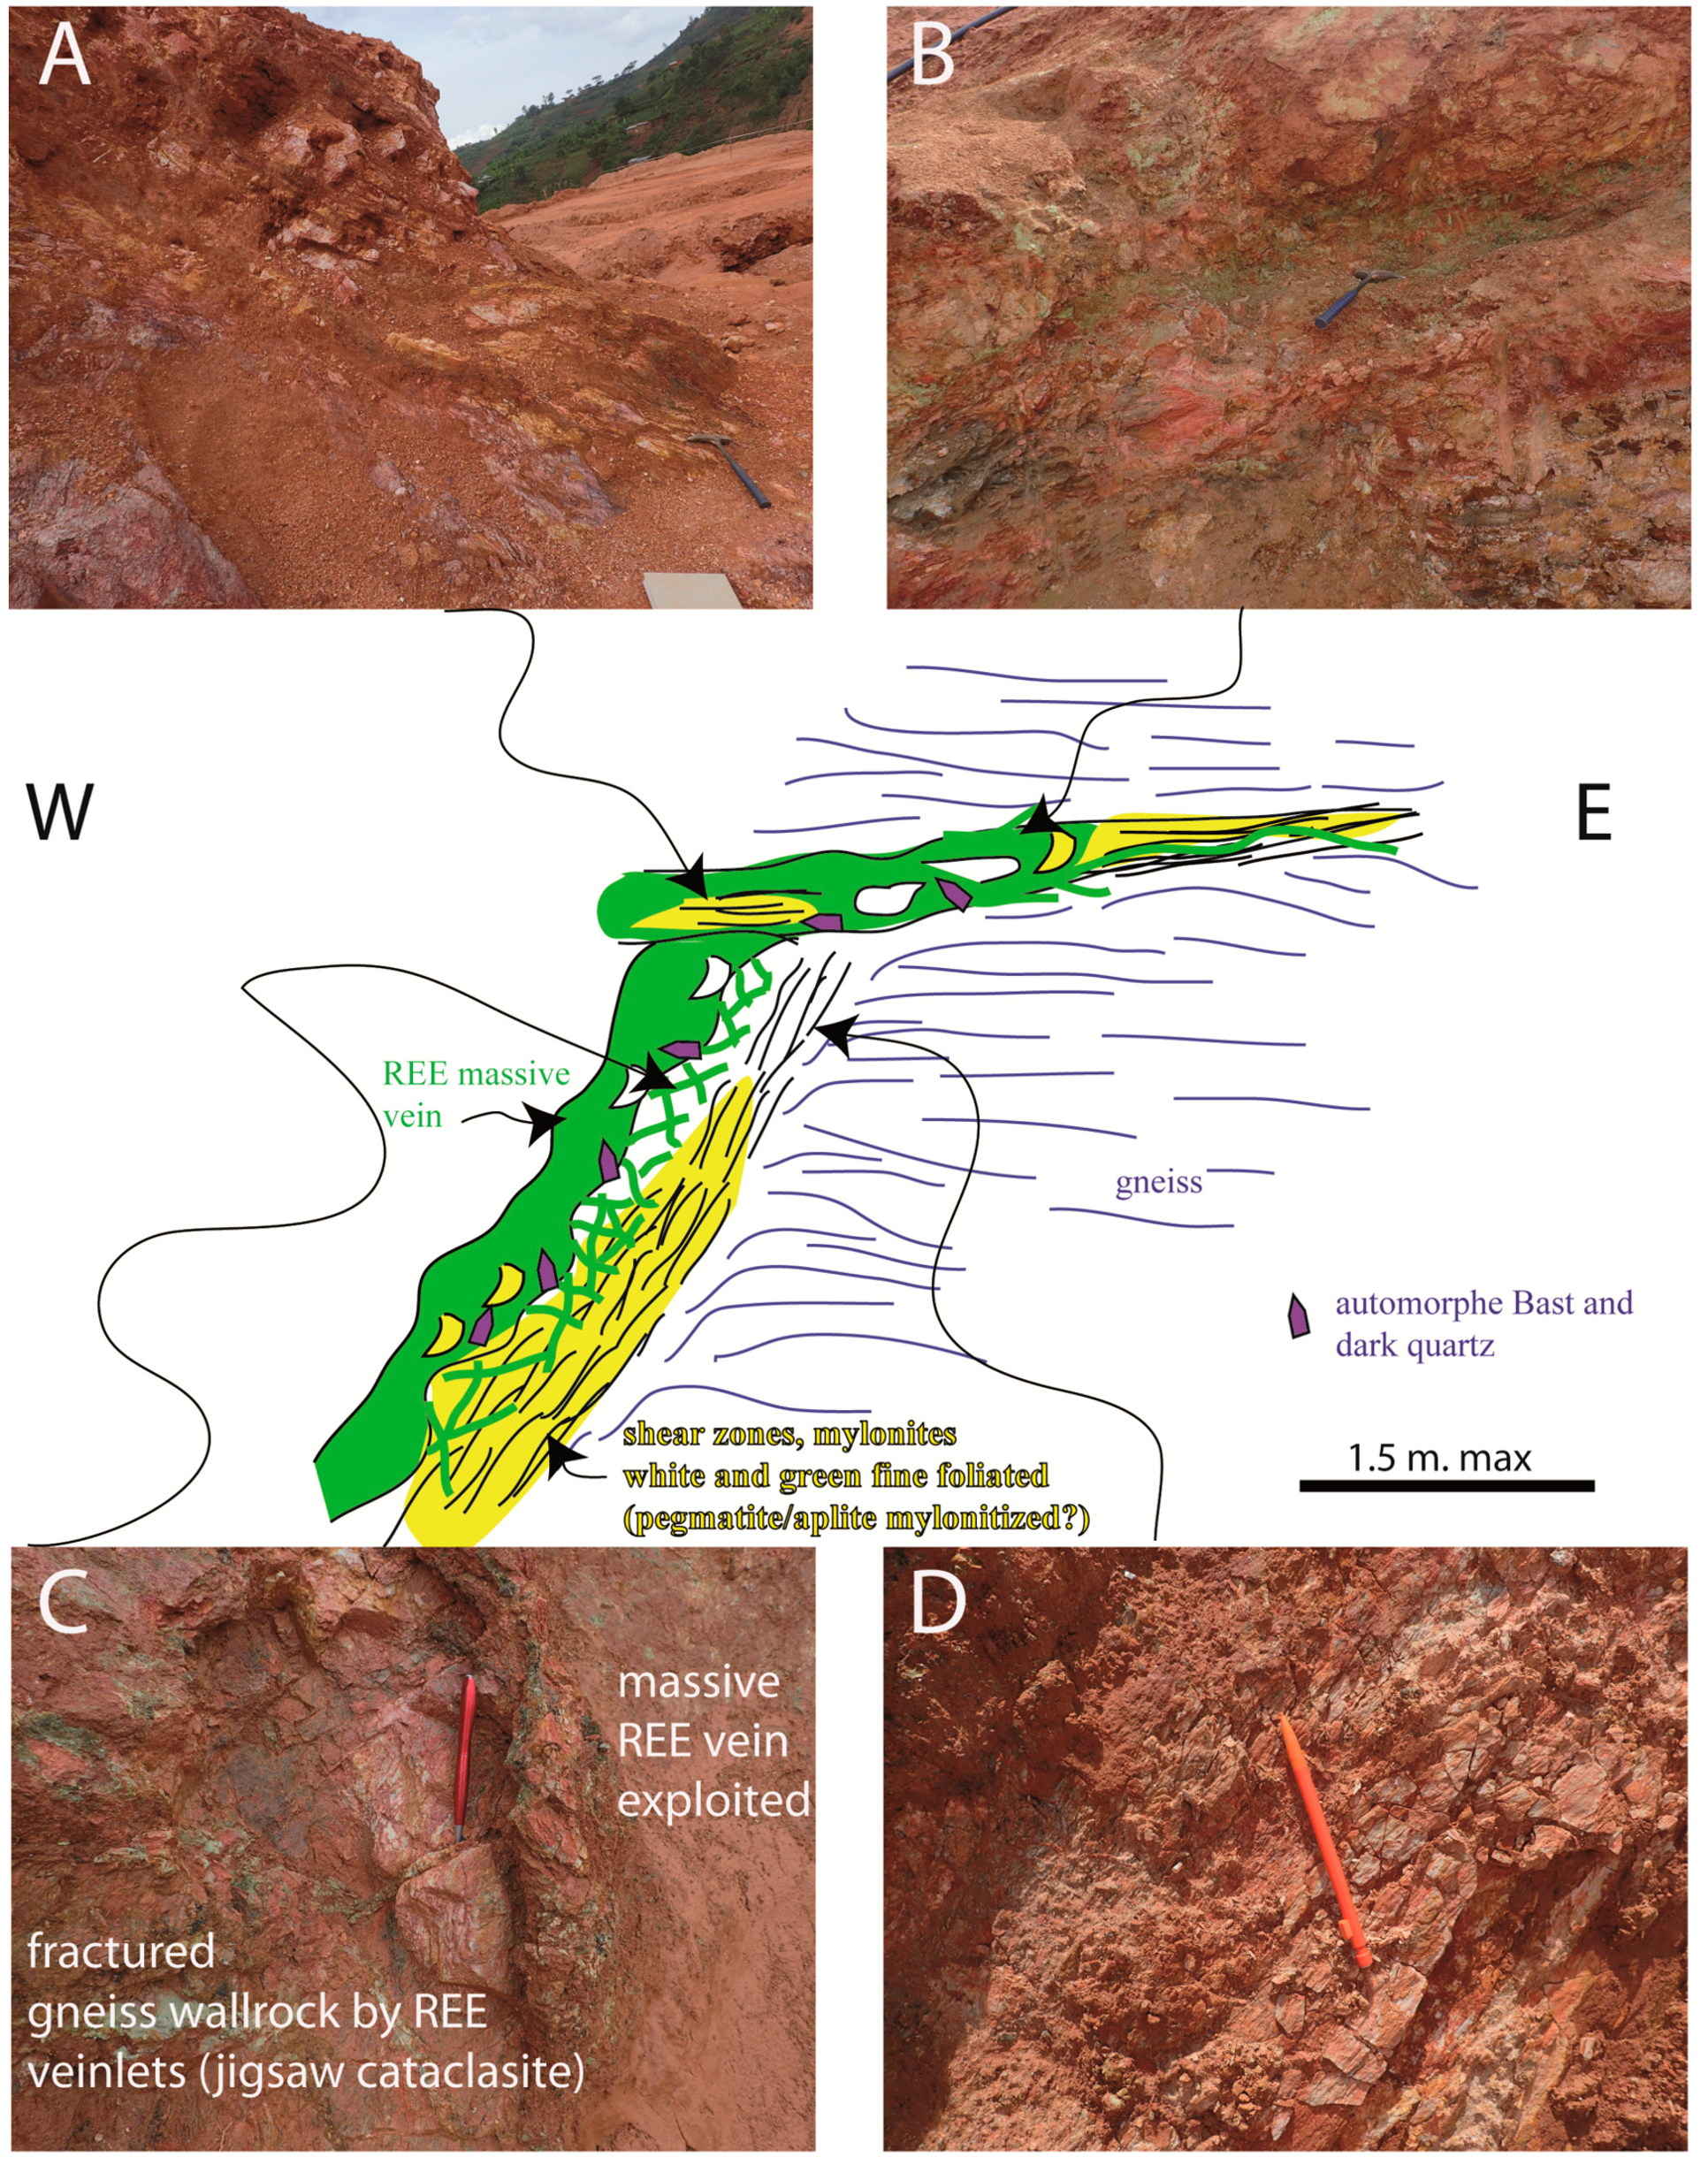
The Gasagwe ore deposit is the most important mining site, where production started in September 2017. There, a spectacular anastomosed network of REE veins trends N to NNE and dips gently westward (Figure 3). Many veins present strike and thickness variations and therefore display a curved aspect. As the result, the variable distribution of measures observed in stereogram (Figure 3) is mostly due to that curved geometry rather than various sets of vein orientations. Most of the REE vein wall rocks correspond to former anisotropies within the basement. Indeed, a white or green fine foliated rock is frequently observed along the REE-vein roof wall (Figure 4A); these foliated zones correspond to foliated pegmatites or mylonites (Figure 4D). Some of these shear zones, lately reused by the REE-bearing fluids, correspond to very flat thrusts (Figure 4B), likely Kibaran in age. Veins texture does not bear any ductile shear component and corresponds to brittle opening, with bastnaesite crystalizing in the resulting open spaces. “Monazitization” of primary bastnaesite occurred during a subsequent brittle increment responsible for mosaic-like breccia of former bastnaesite crystals. Many wall rock clasts (gneiss, pegmatites) are incorporated within the ore, a feature in a good agreement with the brecciation of the REE vein wall rocks by numerous ore veinlets (Figure 4C), which corresponds to an irregular damage zone formed during the REE mineralizing event. The pattern of this damage zone is characteristic of hydrothermal breccia formed by hydraulic fracturing during REE-bearing fluid circulations. Finally, cm- to dm-long dark idiomorphic quartz crystals are frequently found between the hydraulic breccia and the massive ore. The long axes of these crystals appear to be randomly oriented between a normal to a parallel orientation with respect to the contact between the wall rock and the REE-bearing veins. These dark quartz crystals seem to be associated with the monazite alteration rather than with an early bastnaesite crystallization.
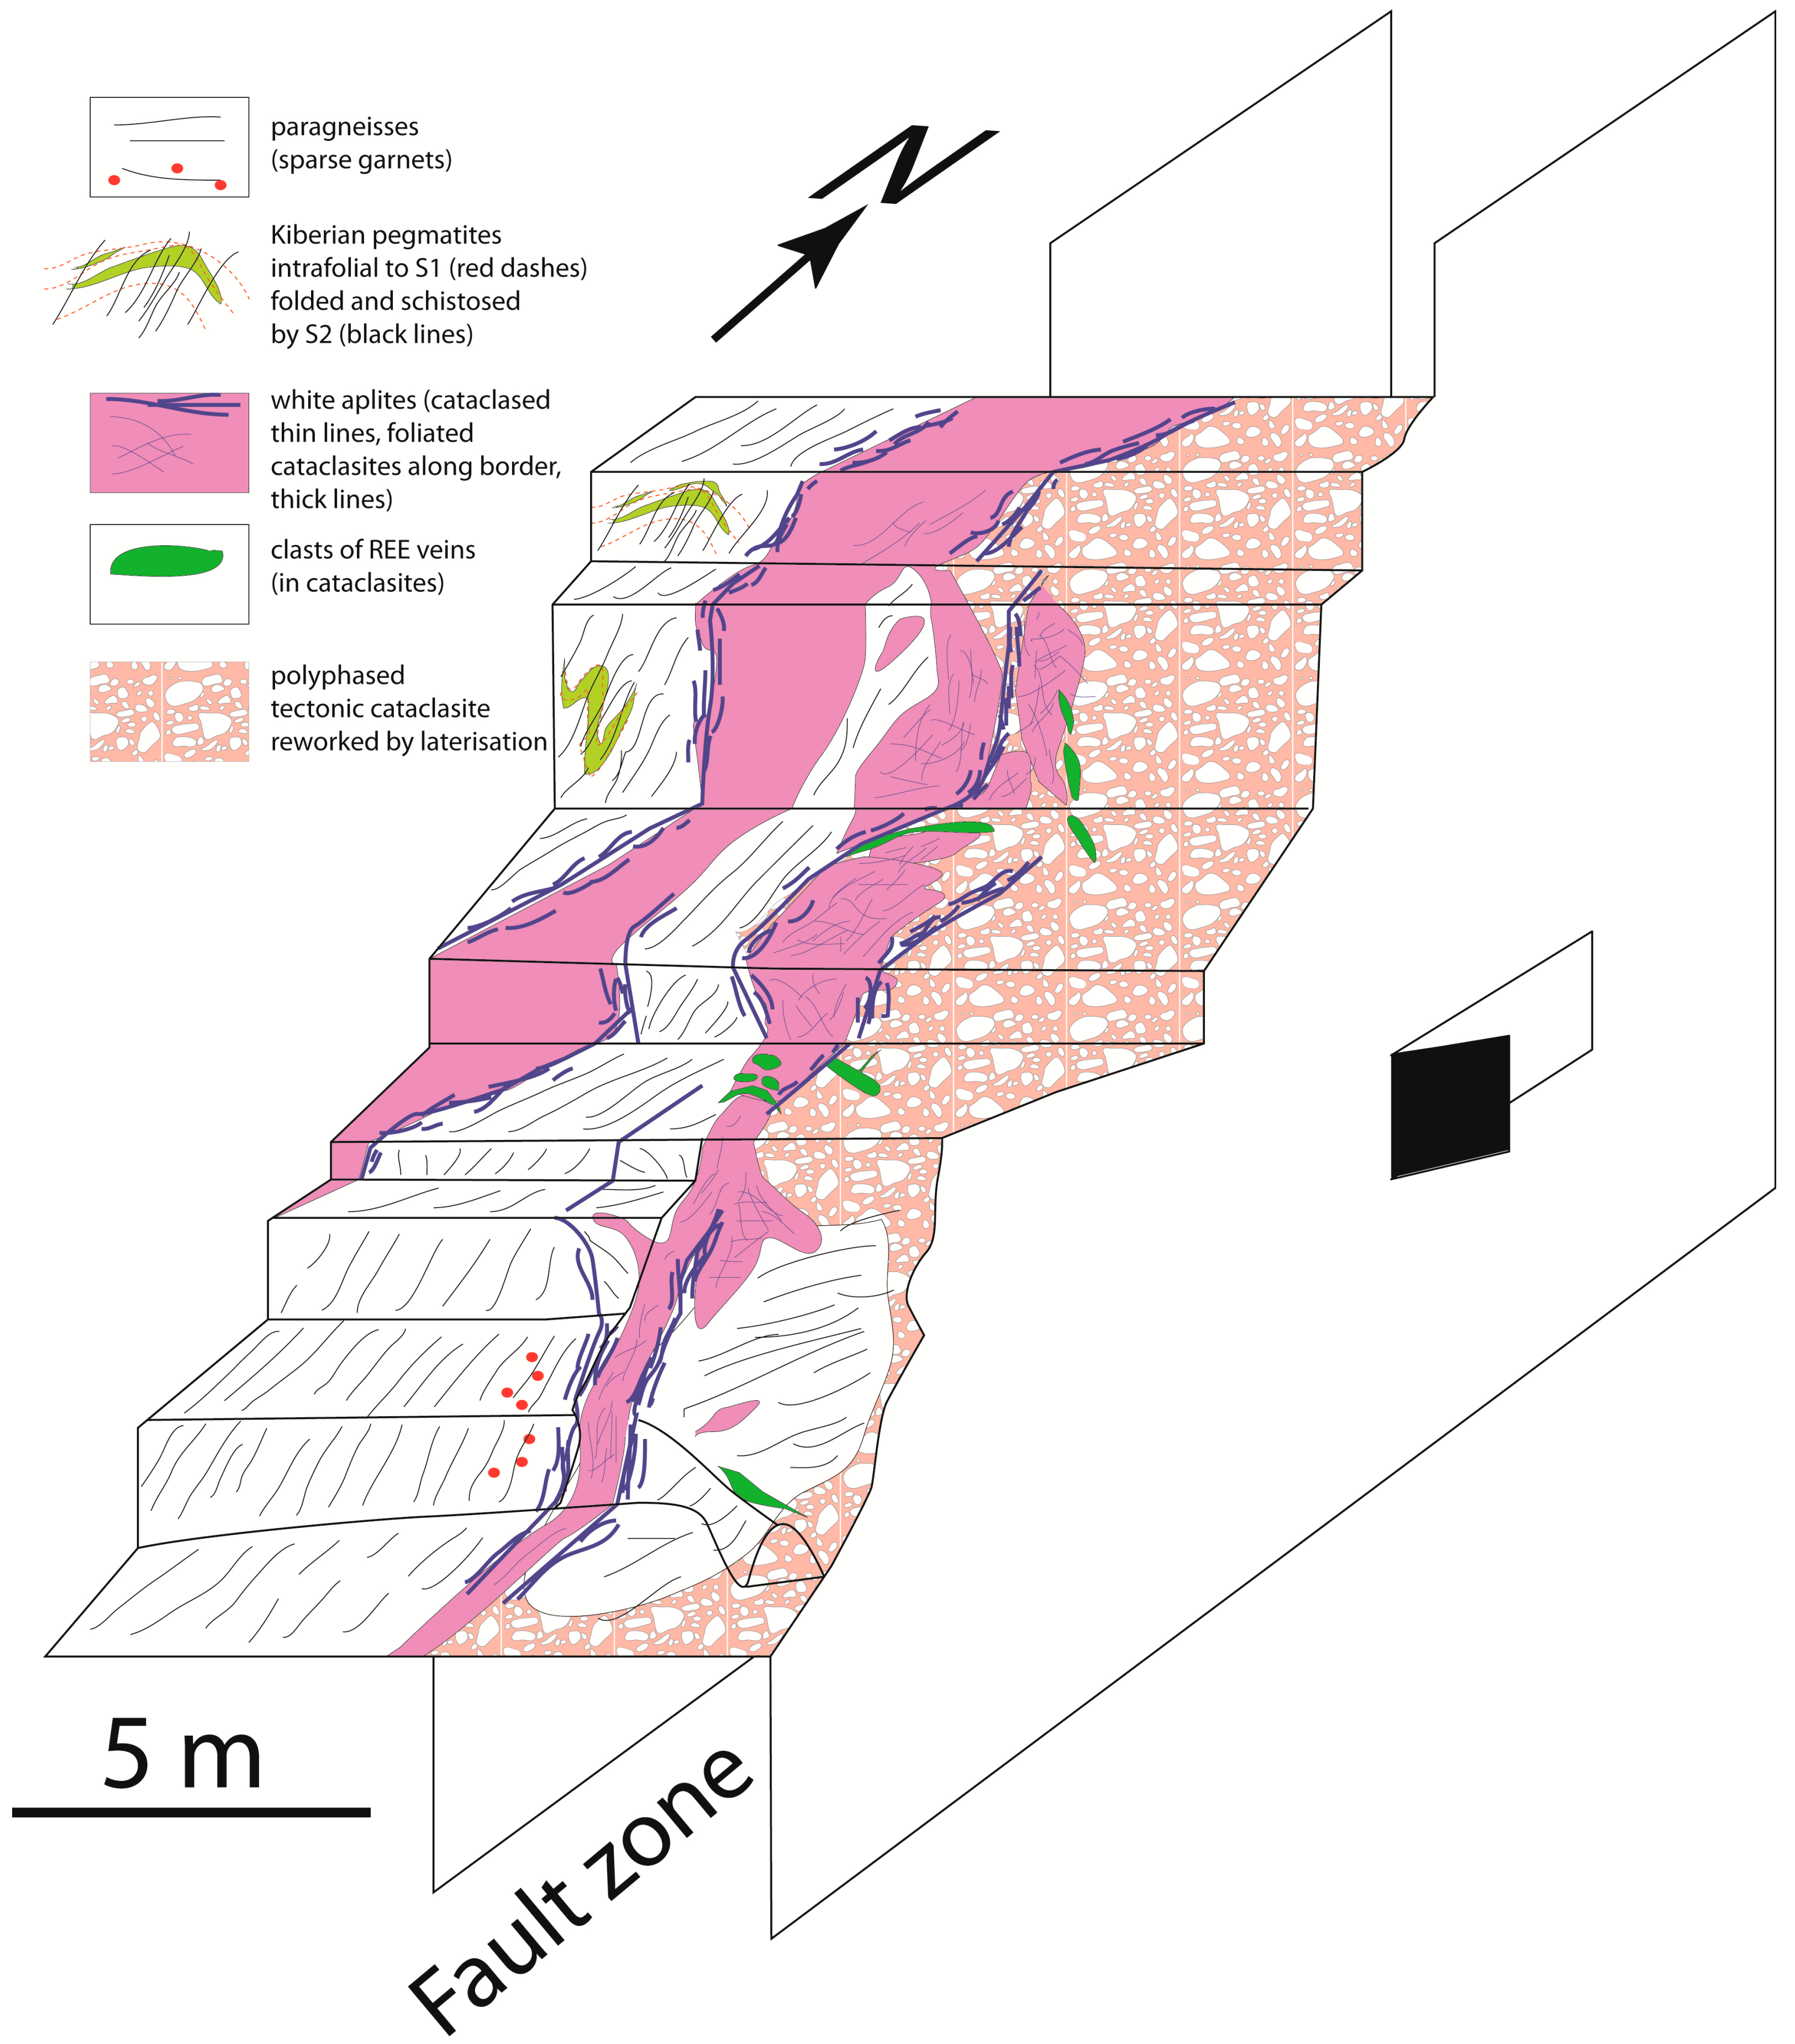
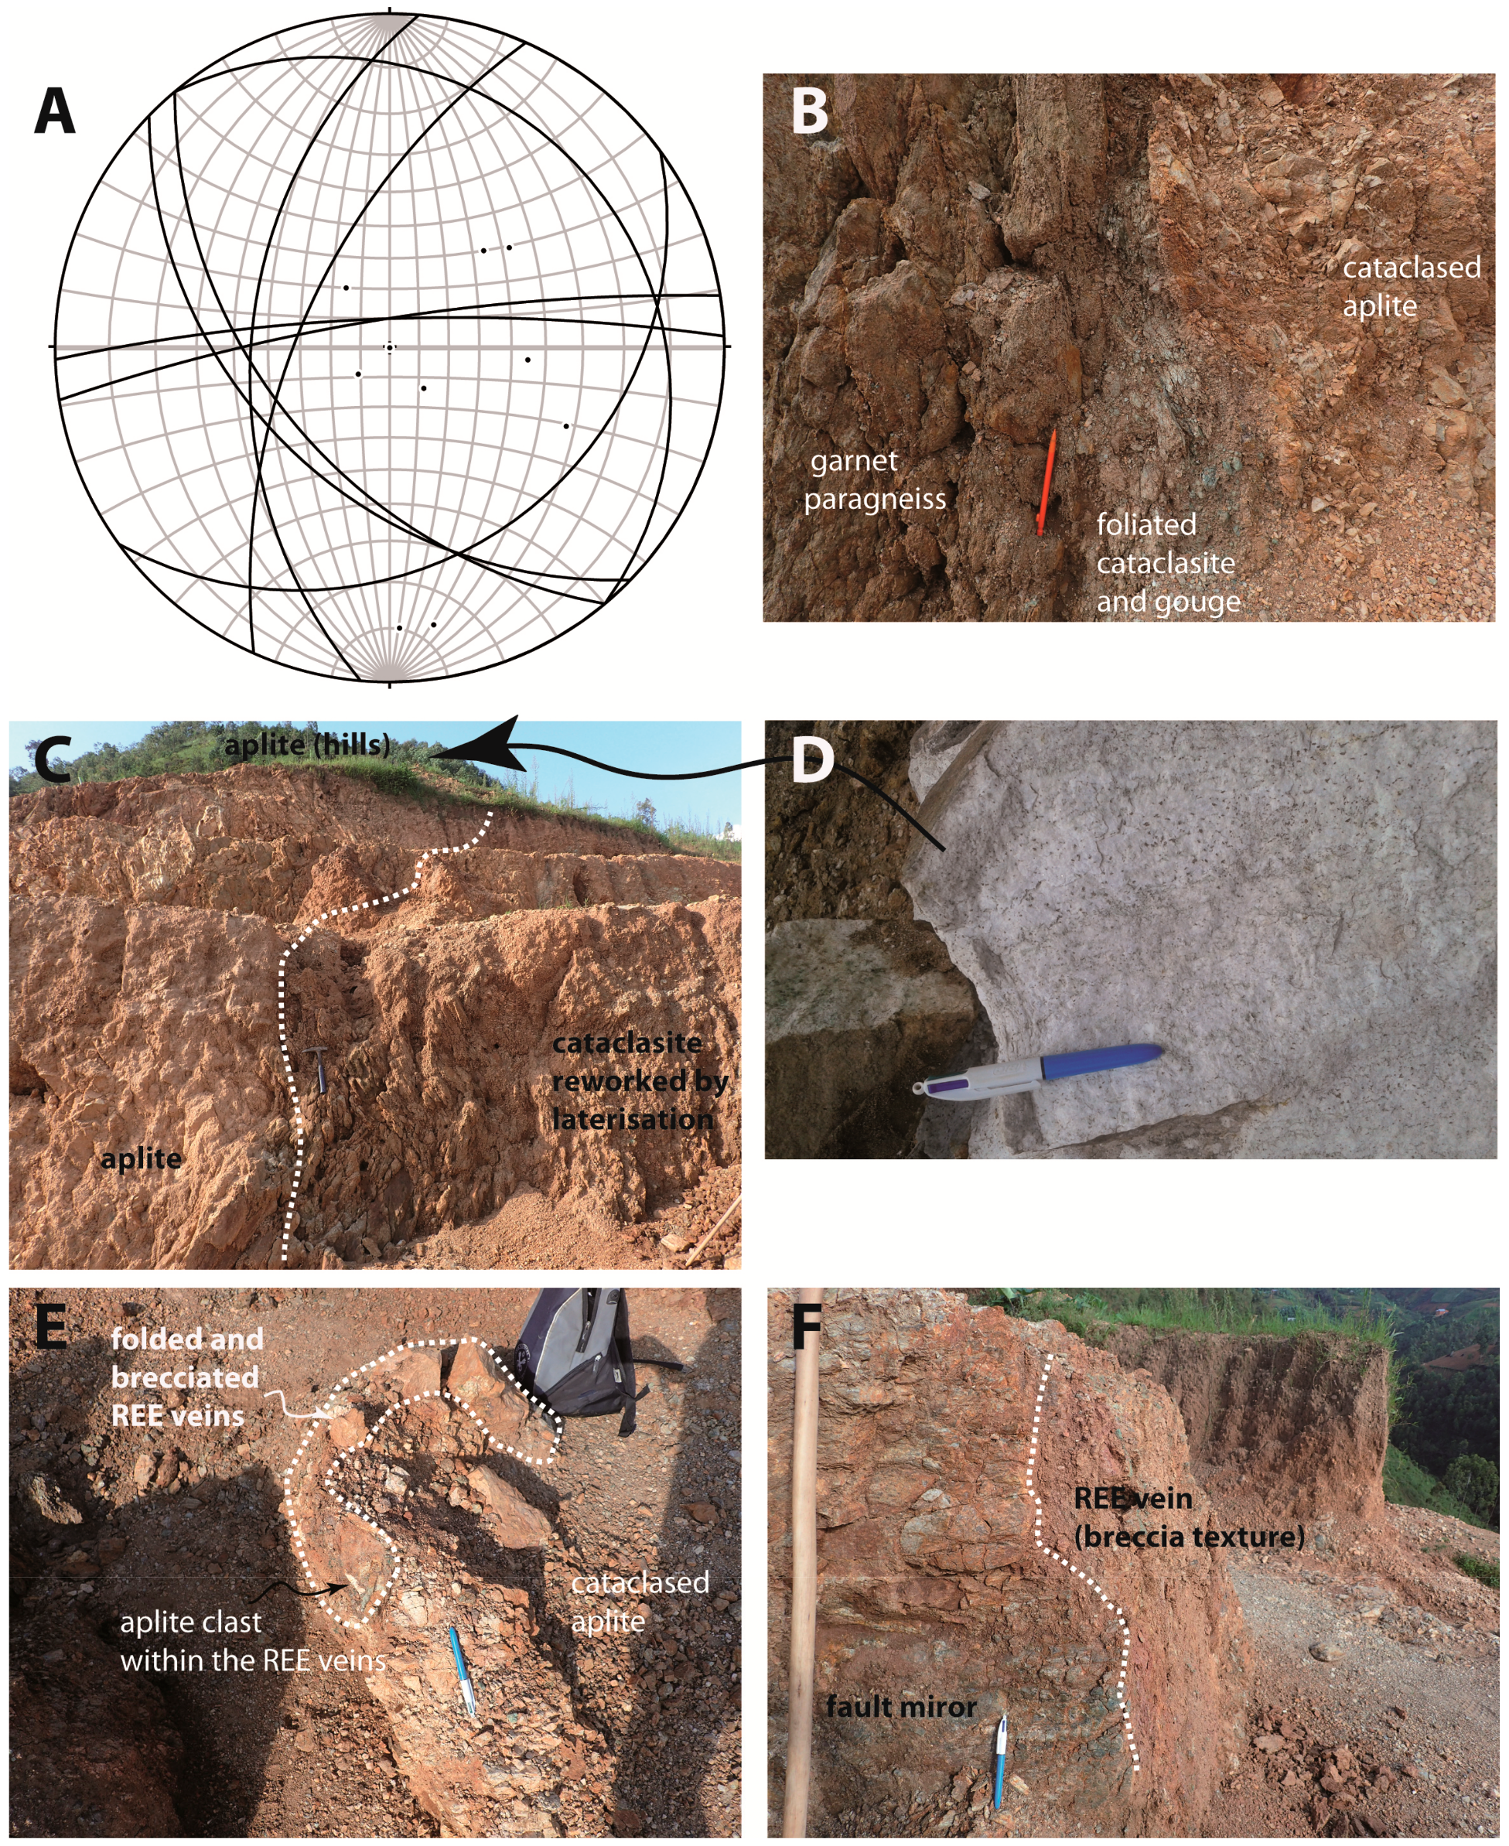
The Kiyenzi occurrence is capped by a hill made of hard and massive white aplitic rocks (Figure 5 and Figure 6D), the color being related to a pervasive albitization of the dykes. The albitized aplitic dyke walls localized a cataclastic shearing responsible for the formation of a foliated cataclasite affecting both the aplites and their paragneissic host (Figure 6B,C). There is no evidence for a ductile deformation in the area. The REE mineralization corresponds to clasts of former veins embedded within cataclasite cemented by late iron oxides and quartz (Figure 6E,F). Therefore, former REE-bearing veins, developed mainly along the walls of the aplitic dykes, have been fragmented and brecciated by post-REE cataclasis. This is well illustrated by the structural measurements (Figure 6A) which are randomly distributed due to a late tectonic brecciation.
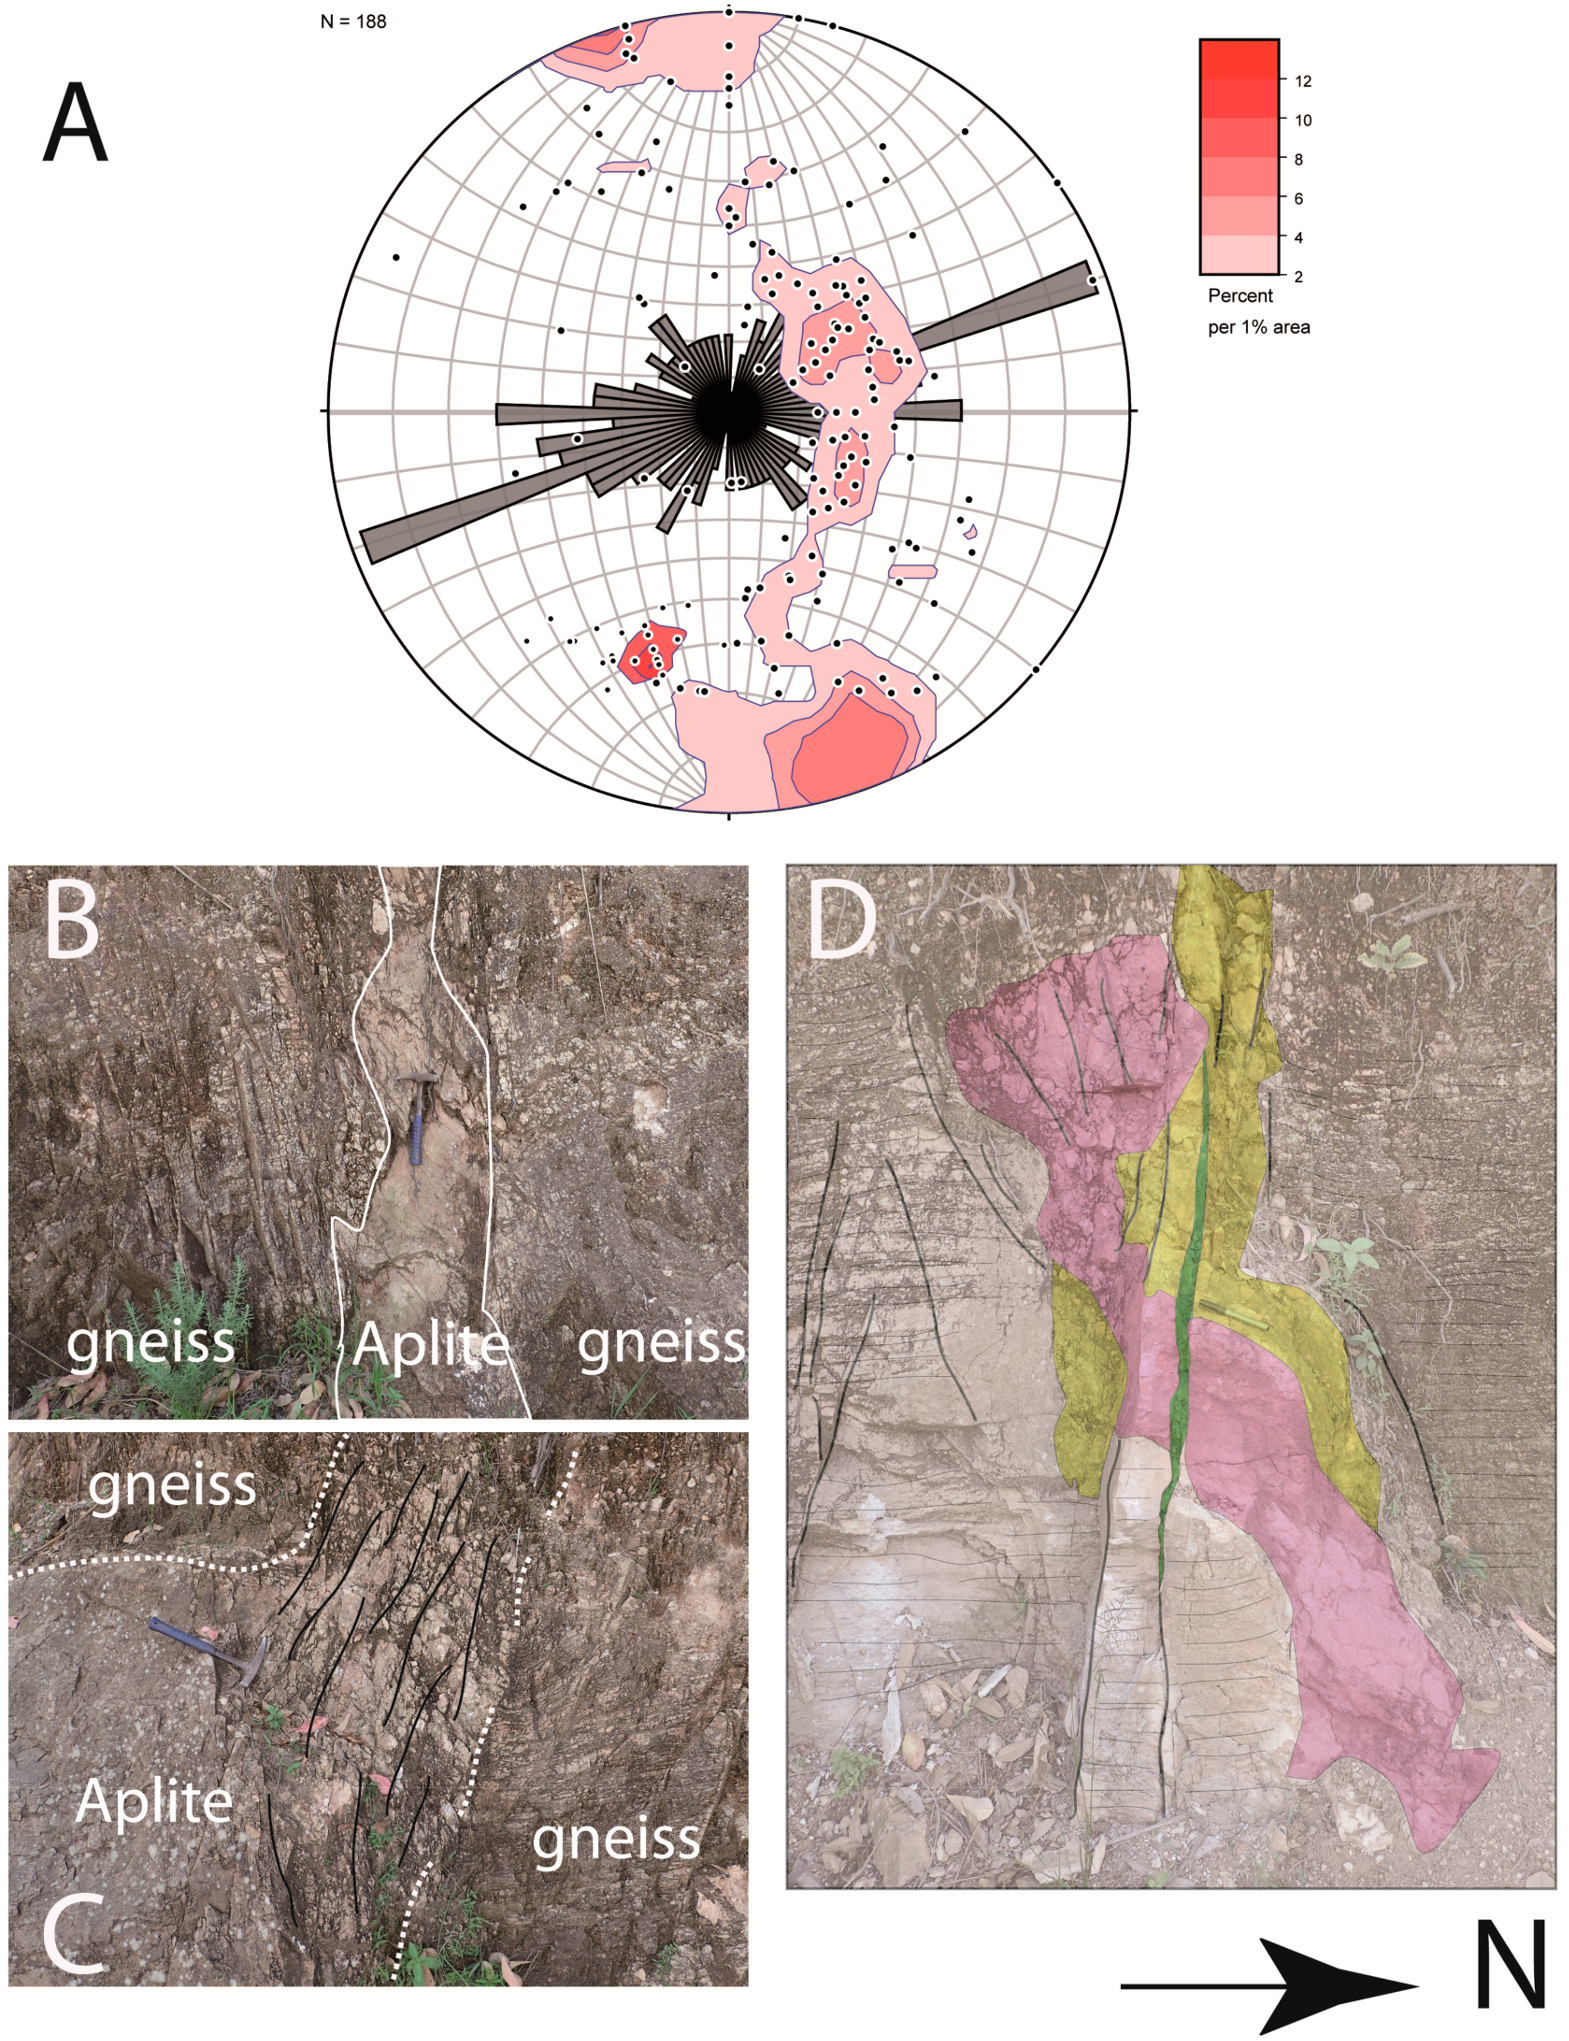
The Gashirwe occurrence is developed within white orthogneisses where mineralization is more frequently localized within and/or along pegmatites, white aplitic dykes and vertical fractures (Figure 7). Here again, the REE-bearing veins reused older heterogeneities to propagate (Figure 7D). The aplite dykes clustered dry jointing (Figure 7B,C). The orientation and dips (sub-vertical) of these dry joints are comparable with those of the REE-bearing veins which argue for a cogenetism, at least at a local scale. Structural data obtained from the Gashirwe main outcrop (Figure 7A) argue for a dominant N70E trending direction for the REE-bearing veins with a sub vertical dip. However, using the Rainbow Mining Burundi (RMB) database at the scale of the entire Gashirwe hill prospect, the contouring of the REE-bearing vein poles suggests that many veins are gently dipping with variable strikes (Figure 7A).
The main feature of the Murambi REE-bearing veins cluster is that nearly all the veins are hosted in Kibaran pegmatites which are strongly deformed in some places. The pegmatites and REE-bearing veins are enclosed within an orthogneiss. These veins are gently dipping and contain REE-bearing minerals filling discontinuities and embedded within laminated quartz ribbons (Figure 8A). Moreover, the contact between the REE-bearing veins and the host pegmatites is characterized by the presence of corrosion gulfs and the incorporation of micas and quartz from the pegmatites into the ore (Figure 8B).
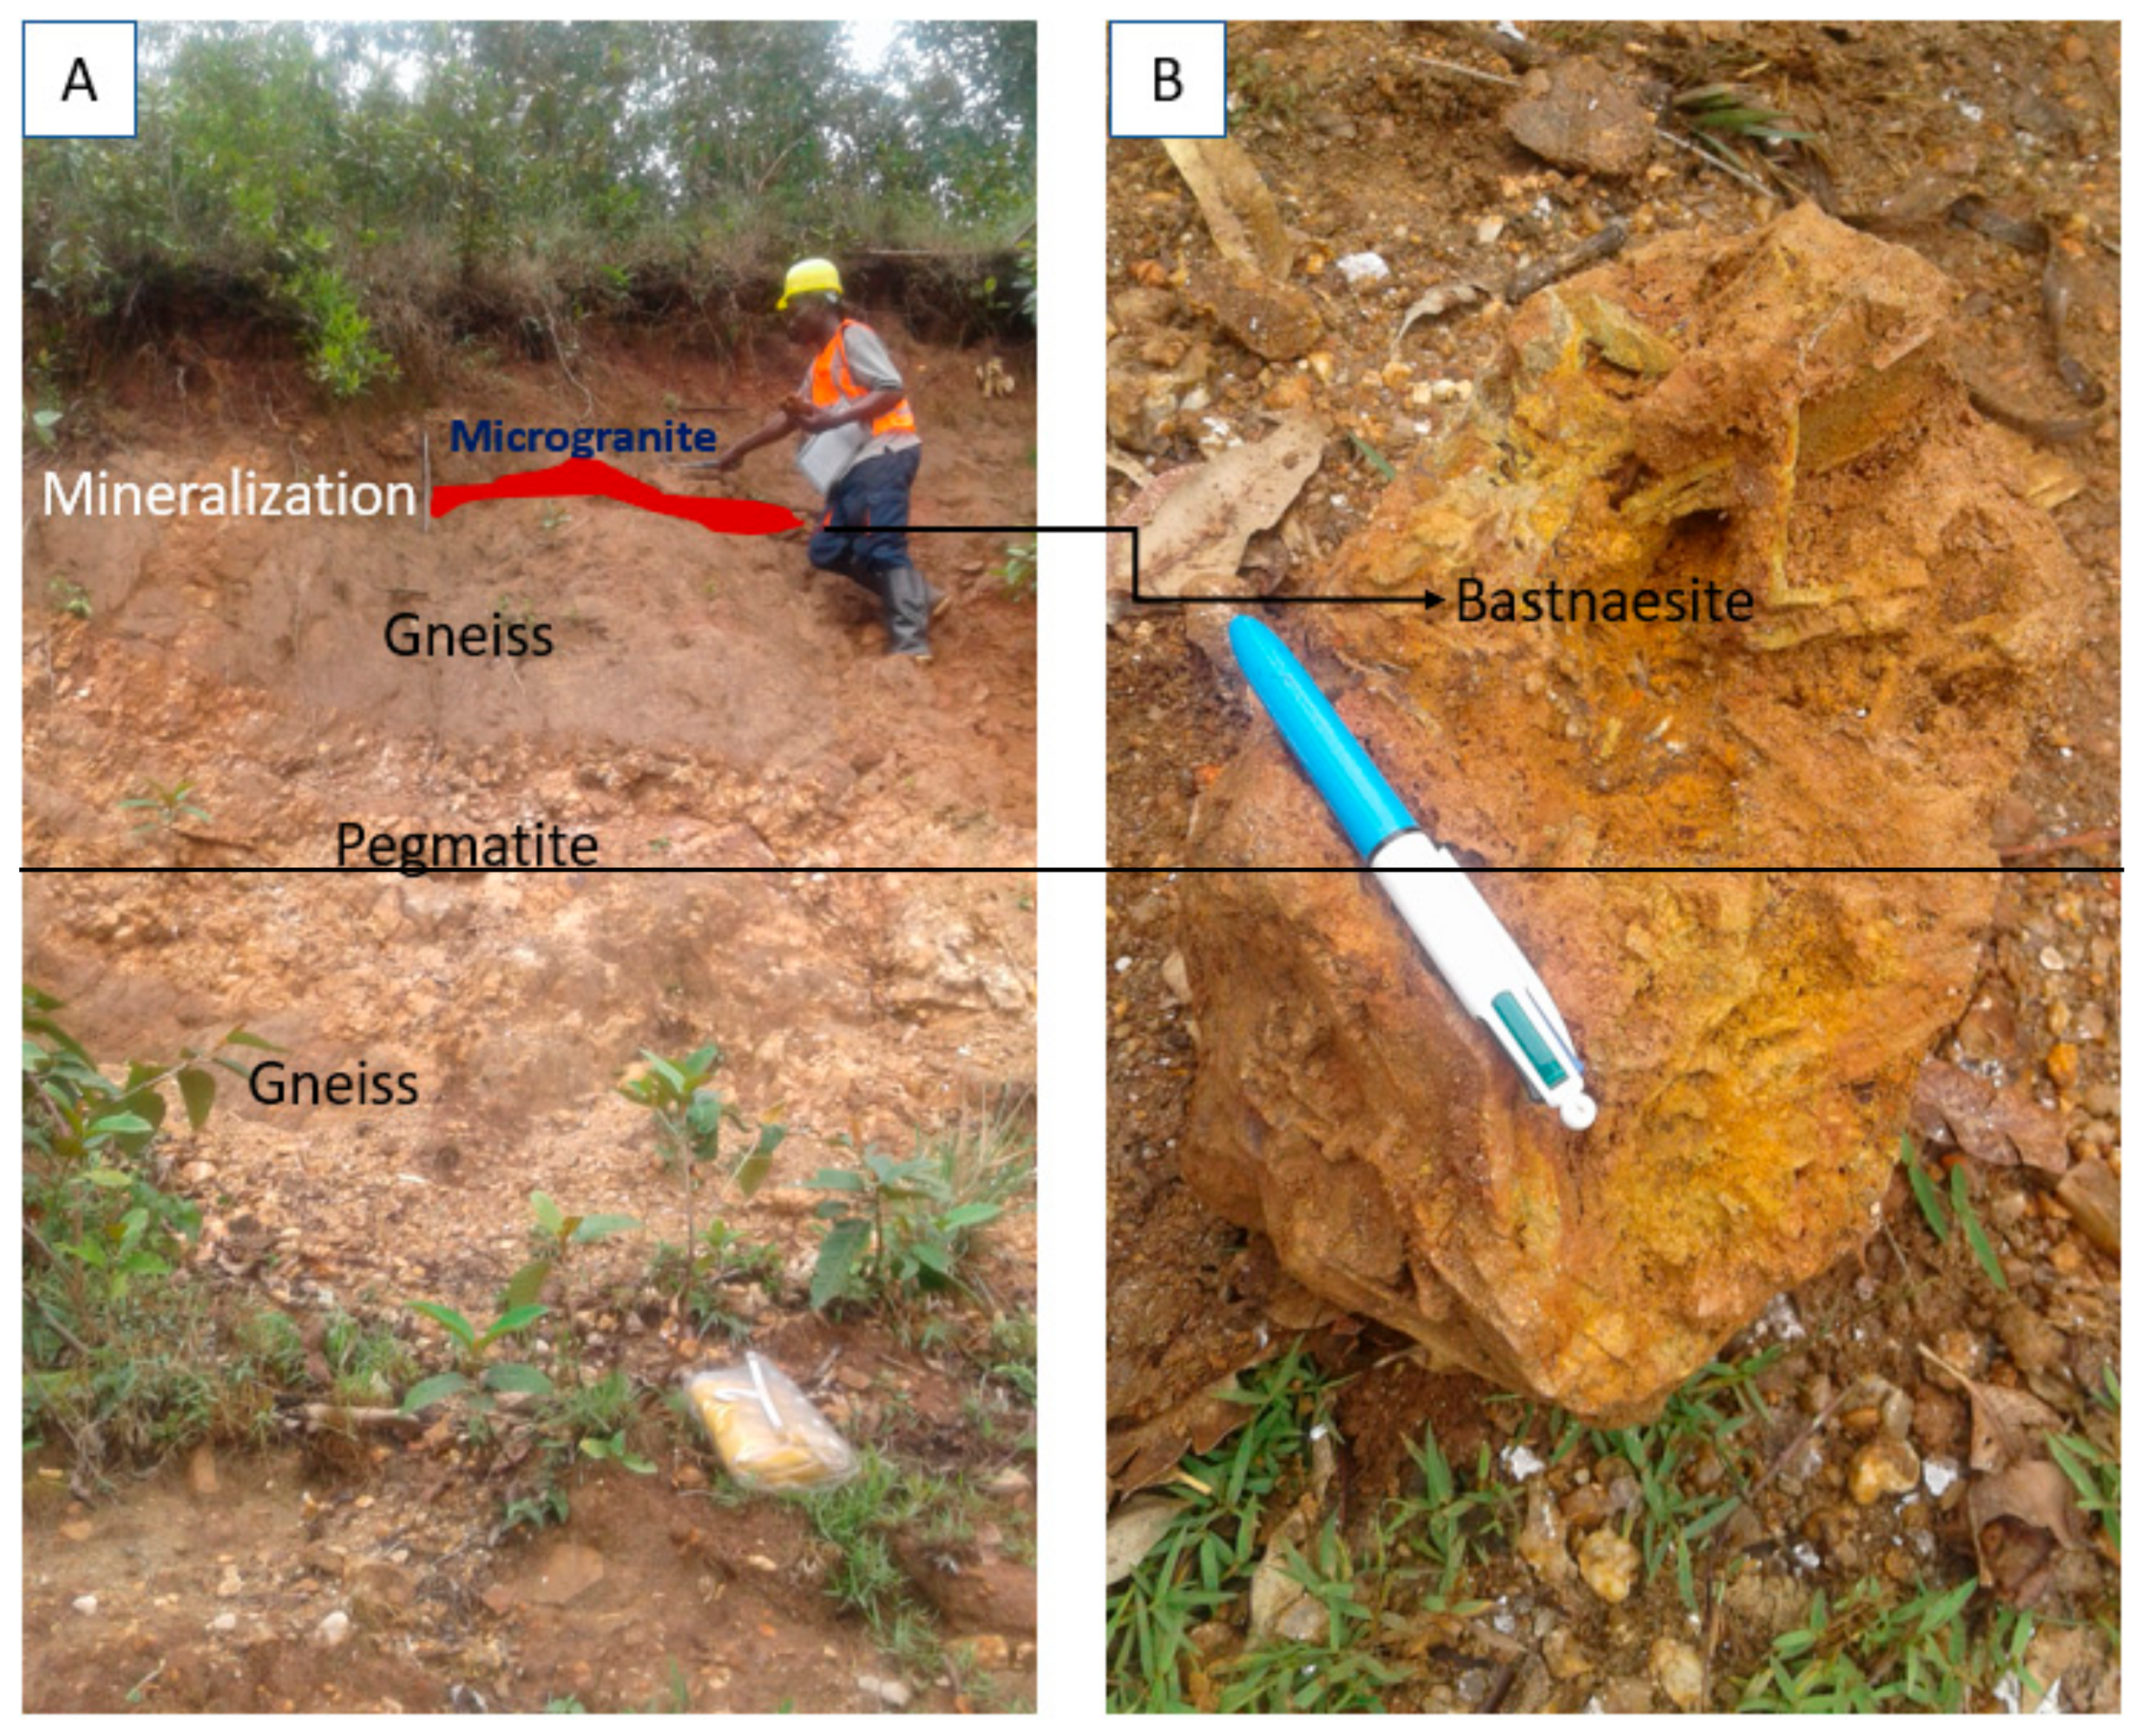
Finally, near the Masenga hill, in the north-east part of the mineralized area, a small cliff along the pedestrian path exposes a highly strained biotite-orthogneiss cut by a meter-thick pegmatitic vein (Figure 9A). Here again, this pegmatitic vein is affected by the regional, steeply-dipping Kibaran foliation. Immediately above the pegmatite, a 20-cm wide, low dipping dyke of isotropic microgranite cuts the foliation. At the base of the microgranite dyke, a lenticular REE-ore body occurs, parallel to the dyke. In the lenticular ore, the several-cm long bastnaesite crystals tend to grow at a high angle to the edge, leaving empty spaces between them.
4. Petrology and Mineralogy
4.1. Ore Sample Description and Typology
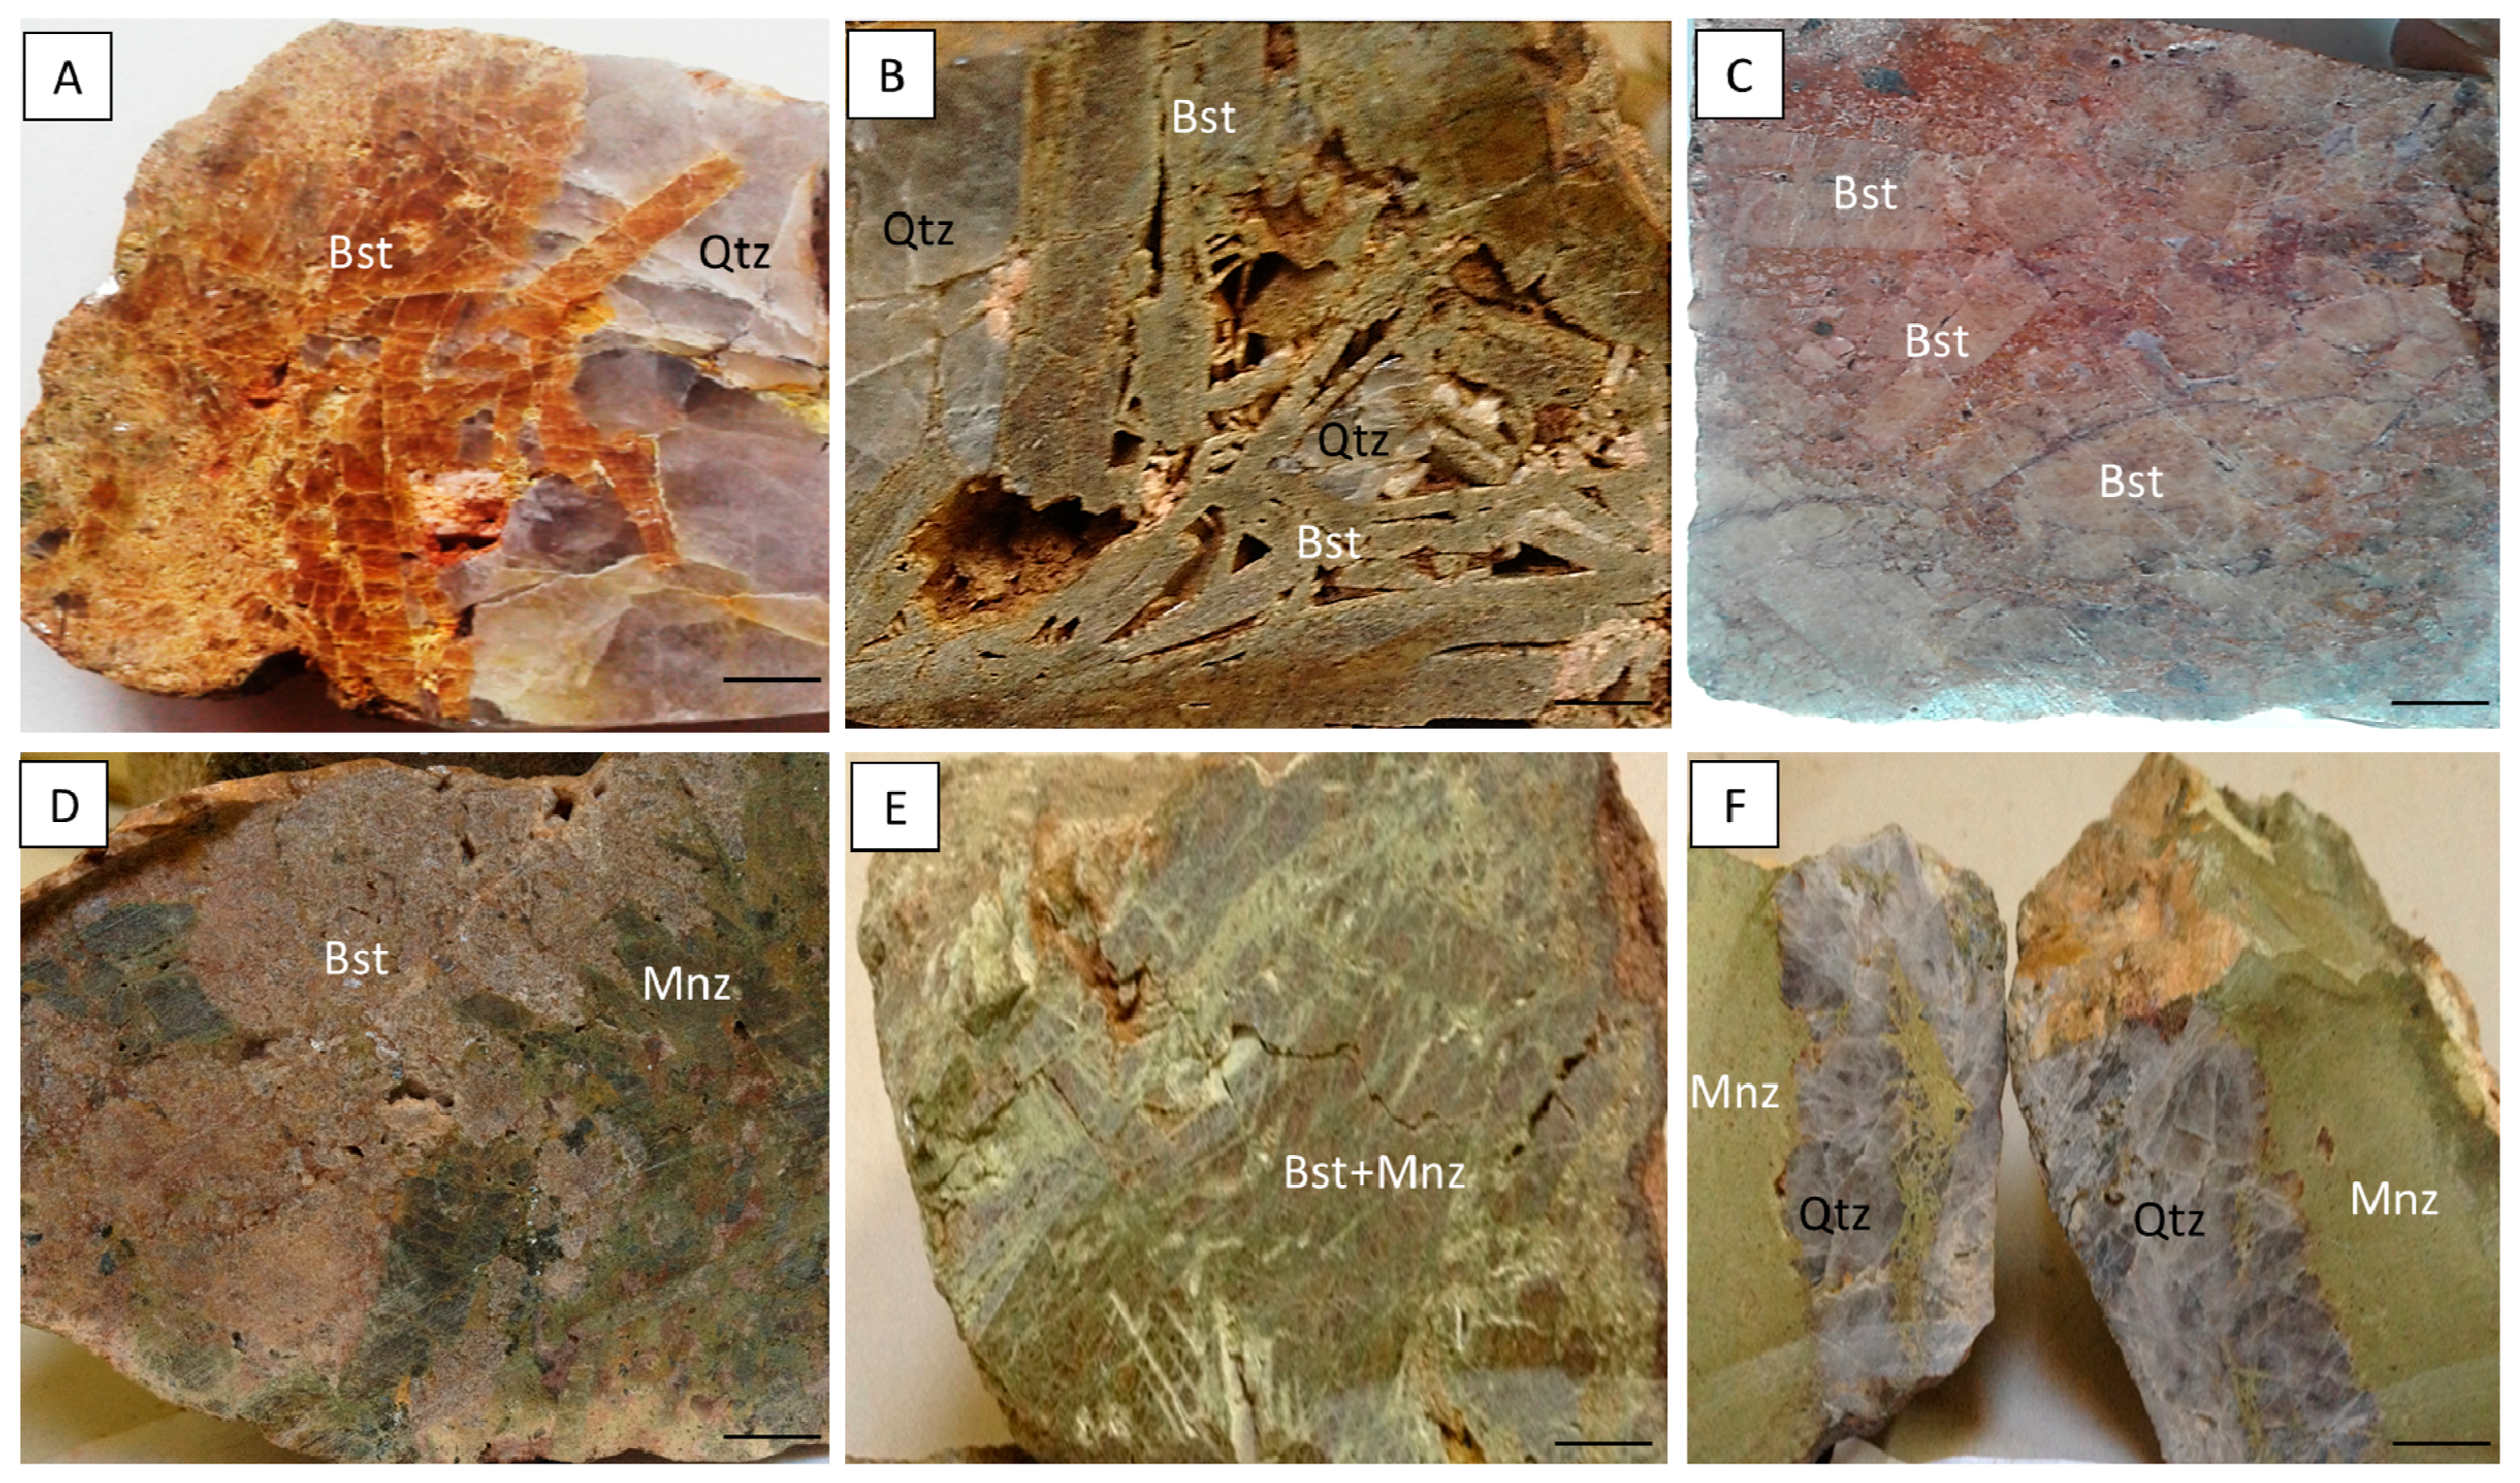
Samples were collected during the RMB exploration campaigns (2011–2014). Additional samples come from some alluvial deposits present in the rivers (Nyarubenga, Mugere, Karonge, Kirasa) crossing the mineralized zone (Figure 1B). Representative samples named GOMV, KIV, NYARU, GASH, GASA, MASE and MURA come, respectively, from the following localities: Gomvyi, Kivungwe, Nyarubenga, Gashirwe, Gasagwe, Masenga and Murambi (see locations Figure 2). Depending on the degree of alteration, different types of ore can be found: from massive pure bastnaesite ore to an almost pure monazite ore, and in-between, ores with various proportions of bastnaesite and monazite. Sample GOMV (Figure 10A) shows a bastnaesite vein associated with a quartz vein. This sample represents the first stage of mineralization where monazite is absent. Sample KIV (Figure 10B) exhibits weakly-altered crystals of bastnaesite with spaces in between partly filled with quartz. Primary textures corresponding to large euhedral bastnaesite laths intercalated with polyhedral cavities filled by quartz (Figure 10A,B) resemble a “pegmatite-like” texture. Sample NYARU (Figure 10C) represents a breccia ore with angular clasts of bastnaesite that are randomly oriented in a finely grained matrix of quartz and barite. Sample GASH (Figure 10D) records the development of monazite at the expense of bastnaesite. Sample GASA (Figure 10E) represents a deeply-altered ore which consists of brown relics of bastnaesite in a green monazitic groundmass. Sample MURA (Figure 10F) shows the ultimate stage of alteration where bastnaesite is completely absent.
4.2. Mineralogical Assemblages
The descriptions of the mineralogical assemblages are based on the observations made by optical microscopy (OM) and Scanning Electron Microscopy (SEM). Thin section OM pictures (Figure 11A,B,E) display an assemblage of bastnaesite, monazite, quartz, biotite, barite and rhabdophane (hydrated REE phosphate). The SEM pictures reveal the presence of additional minerals such as galena, goethite and cerianite (Ce and Th oxide; Figure 11C,D,F).
Bastnaesite and monazite are the most abundant minerals in the studied samples. Bastnaesite forms white tabular fractured crystals. Bastnaesite and the gangue minerals (barite, biotite) are affected by a dense network of micro veinlets of monazite and quartz. Biotite forms large brown crystals with perfect cleavage (Figure 11A). Galena is present as inclusions in quartz (Figure 11C) and presents a sharp contact with bastnaesite. Galena is the most abundant sulfide, however, traces of pyrite and molybdenite have been observed. Goethite which commonly forms a pseudomorph after pyrite was detected as dark crystals within geodes (Figure 11D,E). Acicular crystals of rhabdophane form around quartz and replace bastnaesite and monazite (Figure 11E). Cerianite grains locally replace bastnaesite and/or monazite; a second type of monazite, enriched in lanthanum (La) grew during or after the cerianite rims (Figure 11F).
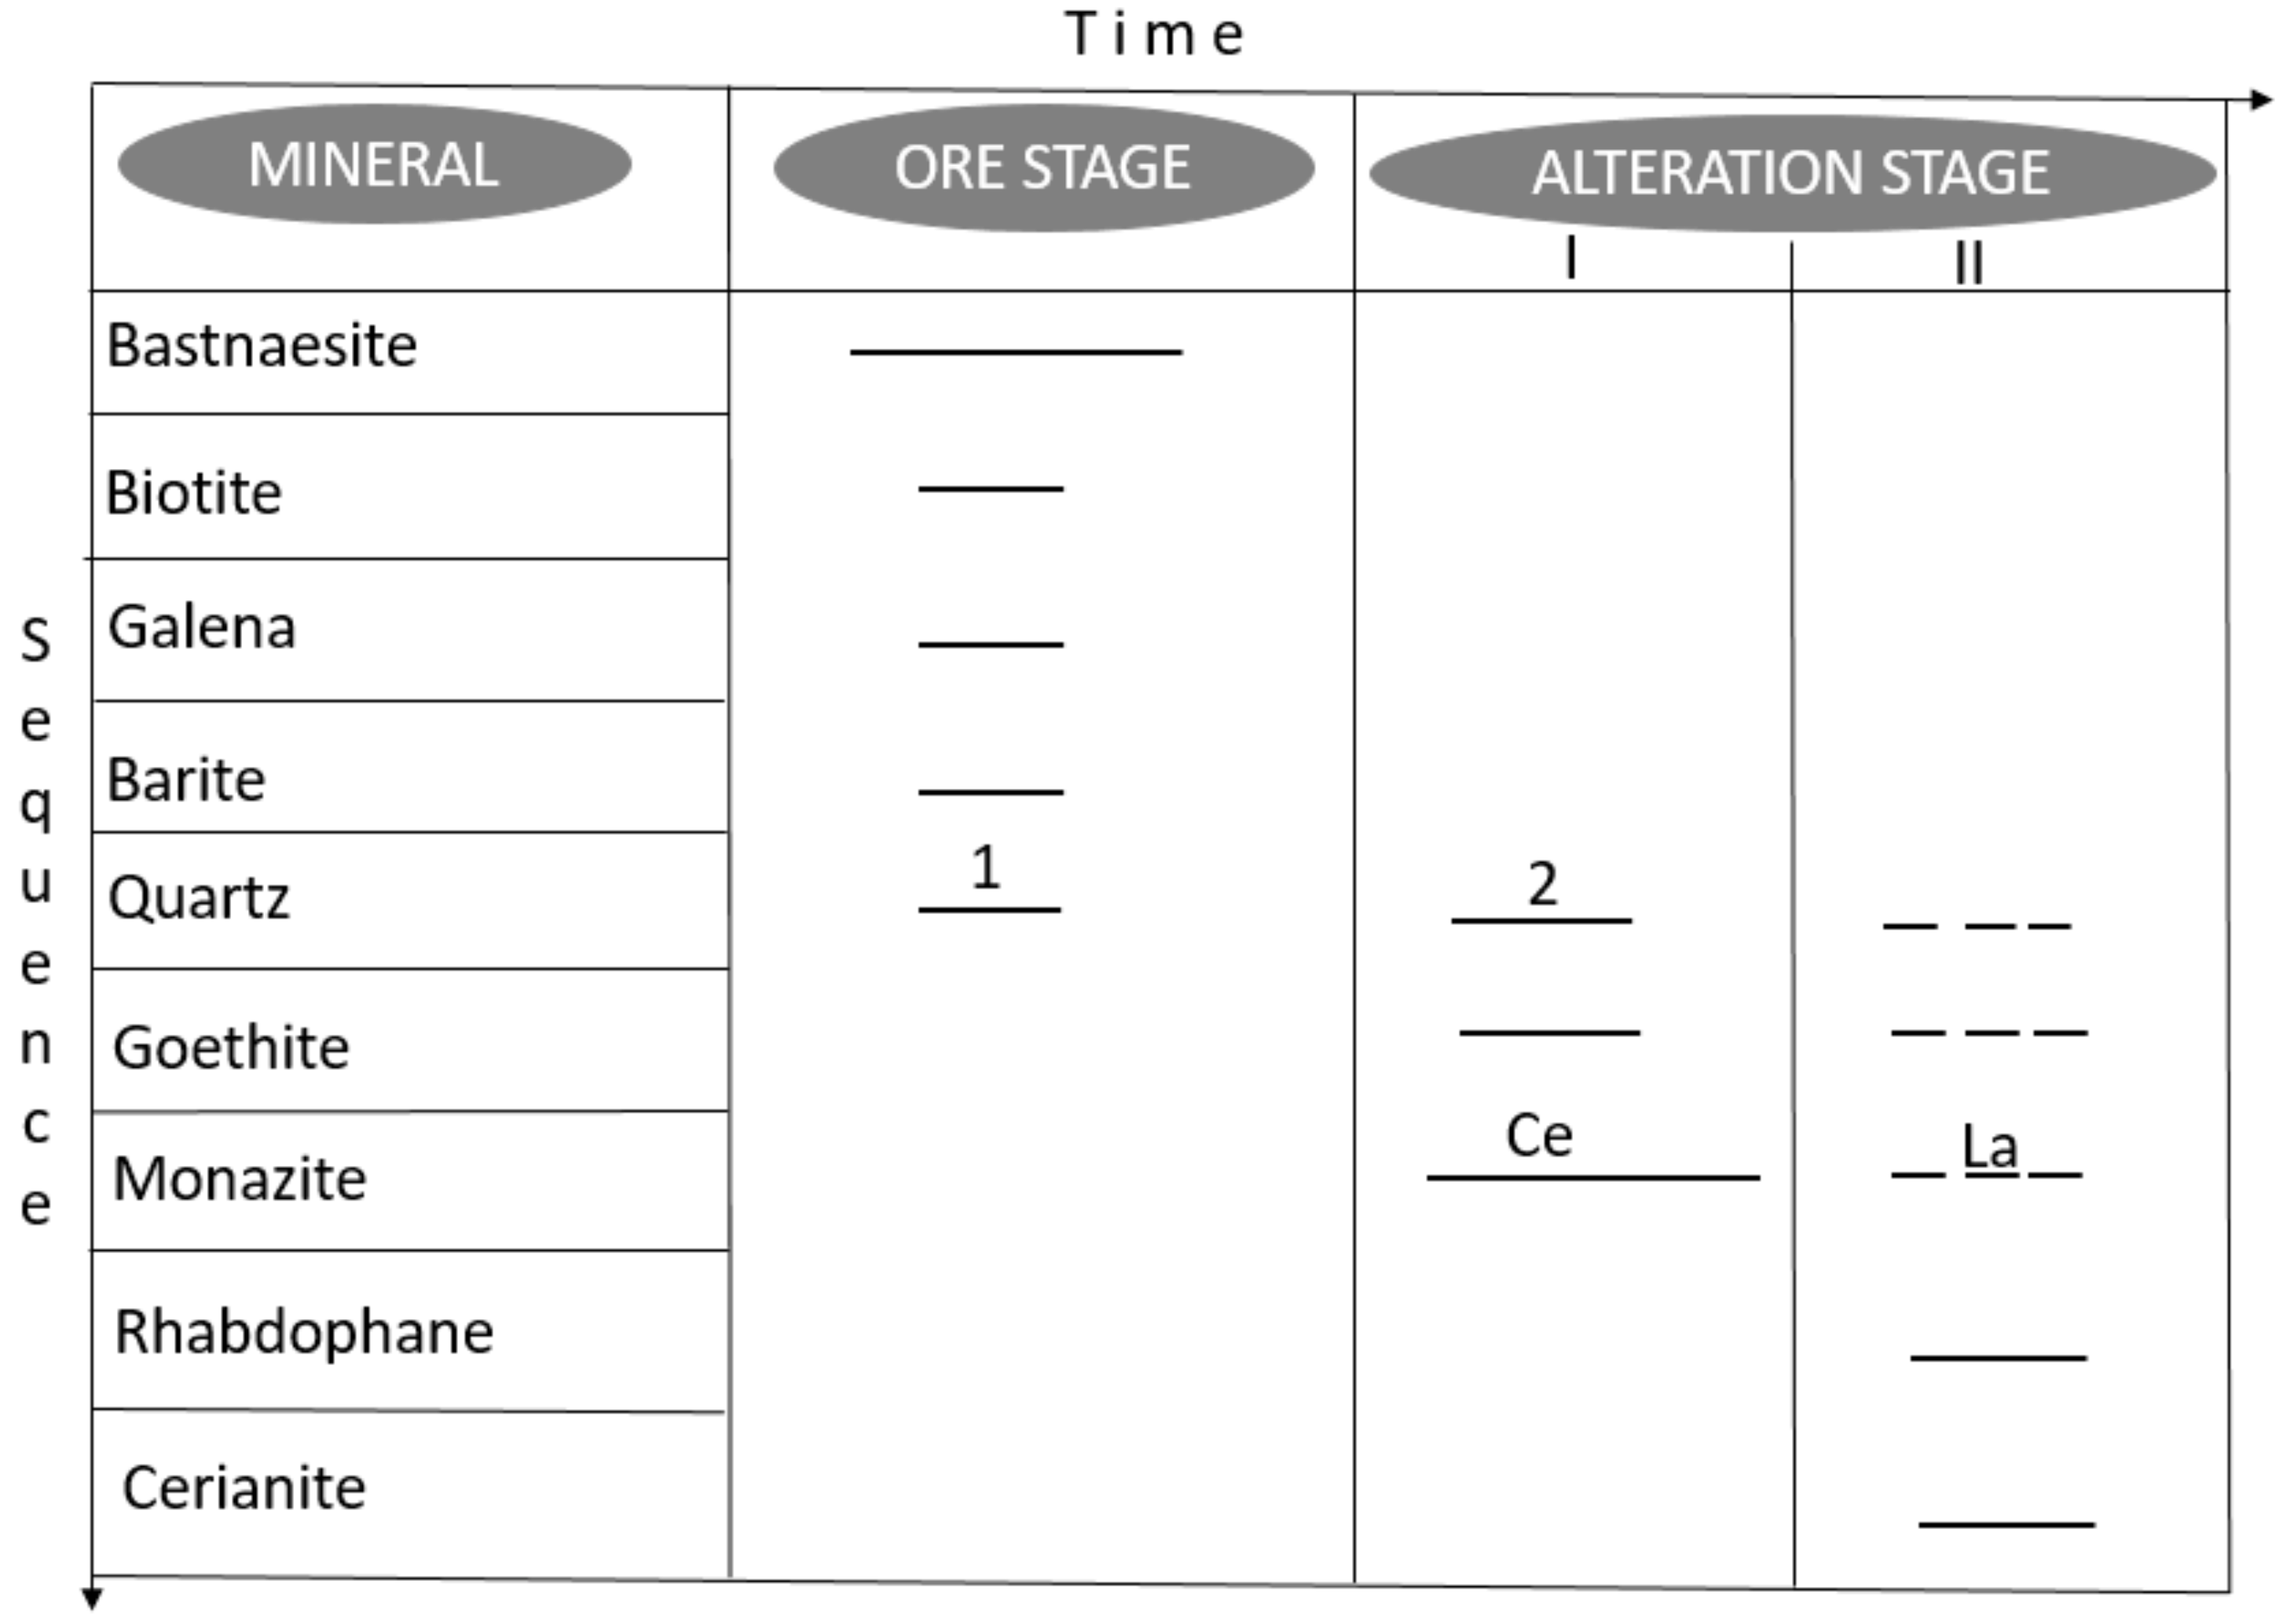
The REE mineralization consists of three successive stages (Figure 12): The first stage consists of the deposition of primary ore comprising bastnaesite, biotite, galena, barite and quartz (1st generation). The second stage begins with the formation of monazite and quartz (2nd generation). The third stage corresponds to the formation of cerianite, a second type of La-rich monazite and rhabdophane in an oxidative environment (possibly linked to lateritization).
5. Geochronology
5.1. Materials and Methods
U-Th-Pb geochronology of monazite and bastnaesite grains from the Gakara deposit was conducted by in-situ laser ablation inductively coupled plasma mass spectrometry (LA-ICP-MS) at Geosciences Rennes using an ESI NWR193UC Excimer laser coupled to a quadripole Agilent 7700x ICP-MS directly in context in thin sections.
For monazite, the signals of 204(Pb + Hg), 206Pb, 207Pb, 208Pb, 232Th and 238U masses are acquired. No common Pb correction was applied owing to the large isobaric interference with 204Hg. The 235U signal is calculated from 238U on the basis of the ratio 238U/235U = 137.88. Single analyses consisted of 20 s of background integration followed by 60 s integration with the laser firing and then a 10 s delay to wash out the previous sample. For more information on the settings of the instruments, see [30] and Appendix A Table A1. Spots diameters of 20 μm associated with repetition rates of 2 Hz with a laser fluency of 7.7 J/cm2 were used during this study. Data were corrected for U-Pb and Th-Pb fractionation and for the mass bias by standard bracketing with repeated measurements of the Moacir monazite standard [31]. Data reduction was carried out with the GLITTER® (v. 4.4.2) package developed by the Macquarie Research Ltd. [32]. Repeated analyses of the Manangoutry monazite standard (557.7 ± 3.1 Ma (MSWD = 0.40; N = 10); ID-TIMS age: 555 ± 2 Ma; [33] treated as unknown were used to control the reproducibility and accuracy of the corrections.
Bastnaesite has been successfully dated by U-Pb ID-TIMS by [34] who obtained a concordant age of 118 ± 1 Ma on two separate aliquots (no measurement of the Pb/Th ratio) for the Karasug Complex (Tuva Republic). This bastnaesite has been then used as in in-house standard (K-9) in the studies of [35] (in situ LA-ICPMS U-Pb dating) and [36] (in-situ SIMS Th-Pb dating). Unfortunately, we did not have access to this in-house standard which is, to our knowledge, the only one available. Indeed, the standard protocol for in-situ U-Th-Pb dating requires the use of a matrix-matched standard as it well known that this technique is highly affected by matrix effects (i.e., laser sampling may result in highly variable amounts of material delivered to the plasma torch, a phenomenon known as “ablation yields”; see [37] for more details). Therefore, in this study, we decided to standardize the bastnaesite grains against two different non-matrix-matched standards: A first set of measurements was standardized to the monazite standard Moacir (another LREE-bearing mineral), while the second set was standardized to the calcite standard WC-1 (another carbonate mineral).
The idea behind this analytical strategy was the following. If indeed this double-standardization protocol returns two apparent ages that are not comparable within error, this means that at least one (if not both) of the standardization did not correct properly for matrix-dependent effects and that, therefore, none of the obtained apparent ages can be considered as accurate. On the other hand, if both standardizations yield the same apparent age within error, the chances that non-matrix effects were not accounted for properly are minimized. Of course, we acknowledge the fact that this does not mean that we cannot be one hundred percent sure that the measured apparent ages are accurate. When bastnaesite analyses were standardized with the Moacir Monazite standard, we followed the same protocol as for the monazite dating (see above). For the standardization using the WC-1 calcite standard, we followed the recommendations of Roberts et al. [38], i.e., a spot size of 100 μm with repetition rates of 10 Hz and a laser fluency of 7.7 J.cm−2. Data reduction was carried out using the data reduction scheme VizualAge_UcomPbine, a set of Iolite procedures that work with Igor Pro [39]. More information can be found in Appendix A Table A1 and in [40]. Repeated analyses of the WC−1 calcite standard (207Pb corrected age of 257.7 ± 4.8 Ma (Common Pb 207Pb/206Pb = 0.85 ± 0.04; MSWD = 2.2; N = 5); ID-IRMS age 254.4 ± 6.4 Ma) [38] treated as unknown were used to control the reproducibility and accuracy of the corrections.
All concordia diagrams were generated using Isoplot/Ex (v. 3nx, BGC Berkeley Geochronology Center, Berkeley, CA, USA) [41]. All errors given in Table 1 and Table 2 are listed at 1-sigma, but where data are combined to calculate lower intercept or concordia ages, the end results are provided at 2-sigma.
5.2. Results
5.2.1. Monazite Dating
Fourteen monazite grains have been analyzed by LA-ICP-MS (Table 1). They are characterized by rather homogeneous, although low, Pb, U and Th contents (1.8–3.5 ppm, 14–30 ppm and 17–48 ppm respectively) and very consistent Th/U ratios (1.0 to 2.1). In Figure 13, we report the data in a Tera–Wasserburg (i.e., 207Pb/206Pb versus 238U/206Pb) Concordia diagram (Figure 13A) and in a 206Pb/238U versus 208Pb/232Th Concordia diagram (Figure 13B,C). In Figure 13A, the data plot in sub-concordant to discordant positions attributed to variable common Pb contents. They however yield a well-defined lower intercept date of 589.4 ± 6.1 Ma (MSWD = 1.5). In the 206Pb/238U versus 208Pb/232Th Concordia diagram (Figure 13B), the data are concordant (5 analyses) to discordant, demonstrating again the presence of common Pb in some of the analyzed grains. The five concordant data define a Concordia age (as of [42]) of 588.7 ± 7.5 Ma (MSWD = 0.73, Figure 13C) while all the data yield a lower intercept date of 585.5 ± 7.4 Ma (MSWD = 1.4, Figure 13B). Therefore, all the chronometers (U/Pb and Th/Pb) return dates that are comparable within error at ca. 588 Ma, a date that we interpret as the age of the crystallization of these monazite grains.
5.2.2. Bastnaesite Dating
As expose earlier, bastnaesite grains have been dated following a double-standardization protocol. They have been first standardized with a monazite standard. The data are listed in Table 2. Twenty-six spots have been analyzed. Pb, U and Th contents are fairly homogeneous with values comparable with the ones found for the monazite grains (1.2–9.6 ppm, 9–30 ppm and 13–59 ppm respectively). Their Th/U ratios are also comparable with the ones found for monazite, between 0.9 and 2.4. Although the calculation to obtain these contents is empirical (see [43], these values are comparable with the U and Th contents measured directly in the Bastanesite by LA-ICP-MS (U < 26 ppm and Th < 63 ppm).
Plotted in a Tera–Wasserburg diagram (Figure 14A), they plot in a concordant to discordant position, due to the presence of variable amount of common Pb. Five analyses are concordant and yield a Concordia age of 608 ± 10 Ma (Figure 14B; MSWD = 1.7). All the 26 analyses define a lower intercept date of 602.6 ± 9.5 Ma (Figure 14A; MSWD = 2.3). When plotted in a 206Pb/238U versus 208Pb/232Th Concordia diagram (Figure 14C), data are slightly discordant to discordant and define a lower intercept date of 597 ± 9 Ma (MSWD = 1.4).
A second set of measurements has been done using a calcite standard (Table 3). Because this calcite standard is almost exempt of any thorium (see [40]), only the U/Pb ratios have been measured. Twenty-six analyses have been performed and plotted in a Tera–Wasserburg diagram (Figure 14D), they define a lower intercept date of 579 ± 27 Ma (MSWD = 0.27).
If all the data acquired on bastnaesite (i.e., standardized with monazite and calcite) are plotted, they define a lower intercept date of 602.1 ± 7.2 Ma (Figure 14E; MSWD = 1.5). This demonstrates that using two different non-matrix matching standards, the dates obtained for the bastnaesite are consistent with each other. We can therefore be relatively confident that the dates obtained are not biased by this analytical protocol and that bastnaesite crystallized 602.1 ± 7.2 Ma ago.
6. Discussion
6.1. Sequence of Events
From the paragenetic sequence established in Figure 12 and in agreement with several previous works [3,17,29,44], it is clear that mineralization occurred in successive stages. The primary mineralization consisted in the deposition of bastnaesite, which was subsequently altered into monazite. A late oxidative stage leading to the newly-formation of La-rich monazite, cerianite and rhapdophane is likely related to lateritization, and will not be considered further in this discussion.
The main question remaining after the work of [6], which gave an age of 586.8 ± 3.7 Ma for bastnaesite crystallization, was the time elapsed between bastnaesite deposition and its alteration into monazite. Our geochronological data help addressing this point. The U-Th-Pb age obtained on monazite (588.7 ± 7.5 Ma) is close to the U-Th-Pb age of the bastnaesite (602.1 ± 7.2 Ma). Given the uncertainties obtained on the geochronological ages, it is difficult to distinguish in time the bastnaesite event (602 ± 8 Ma) from the monazitic alteration (589 ± 8 Ma). Also, our data are compatible with the paragenesis sequence where monazite crystallization postdates the bastnaesite crystallization. The fact that the La-Ba age on bastnaesite of [6] is similar to our U-Th-Pb age on monazite is difficult to discuss in the present study because we do not know much about the closing temperature of the La-Ba system regarding the bastnaesite mineral nor the behavior of this system when late fluids are involved. In any case, the main conclusion regarding the sequence of events is that the alteration stage followed the primary mineralization during a continuum of hydrothermal activity.
To explain the evolution from carbonated conditions to phosphatic ones, two hypotheses can already be raised considering the brief time elapsed between the two events. First, in the carbonatitic realm, it is known that phosphates can be concentrated in the late stages of evolution [16]. The Gakara case could therefore be one of these examples. Second, the fractures along which the mineralizing fluids circulated are typical of the upper brittle crust. Per descensum circulation of surface waters might thus be linked to the monazitic alteration and the associated silicification (2nd generation of quartz). The fluid inclusions data mentioned in [3] and the work of [4] indicate that the first hypothesis is the most realistic. Specific analyses like fluid inclusion characterization on the primary bastnaesite grains and secondary quartz associated with monazite and a stable isotope study of both bastnaesite and quartz must be undertaken to clarify the origin of the fluids involved in the Gakara system.
6.2. Structural Controls and Associated Fluid Pressure
First, the observed texture of the ore veins brings several instructive information. Fibers/unidirectional textures are rare, and it is therefore difficult to interpret the ore veins in term of fracturing modes (e.g., extensional vs. hybrid shear dilatant fractures). Whereas no ductile shearing has been observed, many ore veins present hydrothermal breccia texture, a feature more compatible with cataclasis and chemical corrosion during hydrothermal flow (Figure 10C and Figure 11B).
Second, the orientations and dips of the REE-bearing veins are highly variable between the different occurrences/prospects (see stereograms in Figure 3 and Figure 7) as well as within a single occurrence. Together with the lack of fracturation evidences, it is therefore not possible at this stage to propose a regional stress field compatible with the REE-bearing vein network. This high variability can be partly linked to the late (post REE-vein emplacement) tectonic events, well identified at Kiyenzi (Figure 5 and Figure 6), that could be responsible for bloc rotations/tilting, highly probable along the Tanganyika rift eastern shoulder.
However, various points must be discussed as they yield new insights on the hydro-tectonic context: (i) numerous and common, not to say systematic, evidences for reactivation and reuse of older mechanical heterogeneities (e.g., old Kibaran shear zones within gneisses, pegmatites, albitized aplites, etc.) during the REE mineralizing event. These reactivations lead to a spatial distribution of the REE-bearing vein strikes and dips that is more heterogeneous than what could be expected if the veins developed within an isotropic basement under a high regional differential stress field; (ii) The anastomosed REE-bearing vein pattern of the Gasagwe mine with curved 3D shapes, splay-off and thickness variations (Figure 3) is not compatible with a fracturing controlled by a high differential stress. This geometry resembles more that of hypovolcanic magmatic or phreatic-magmatic dykes and sills intruding shallow sediments, that propagated by opening anisotropies such as the beddings. Thus, the lack of a clear regional tectonic control for the REE-bearing vein distribution might also be explained by the injection of hot REE-rich fluids under a very low regional differential stress. Further works and data are required to constrain the structural model. This will be possible in the near future thanks to the mining activity bringing new outcrops; (iii) Independently of the structural model, hydro fracturing along the REE-bearing vein wall rocks (Figure 4), flat REE-bearing veins with large opening just under microgranite sills (Figure 9A), evidence local supra-hydrostatic fluid pressure within the mineralizing plumbing system.
6.3. Geodynamic Context of the Gakara REE Ore Deposition
Several considerations allow to propose that the Gakara REE deposition occurred in the external zones of the Pan-African mobile belts. First, the geochronological data presented here undoubtedly assign a Pan-African age to the Gakara deposition. If compared to the paroxysmic tectonic and metamorphic events described for the Pan-African mobile belts in East Africa (the Mozambic mobile belt for example; see [7,9,44,45]), the age obtained in this study at ca. 600 Ma corresponds to a pre-collisional event, possibly in an extensional context, associated with the break-up of Rodinia (the interested reader may refer to the Figure 9 of [10], which provides a summary of the tectonic-metamorphic-magmatic events that prevailed since the Mid-Proterozoic in the east African region). Second, the Pan-African overprint is weak in Burundi as most of the eastern part of the country is covered by upper Proterozoic sediments [22,23]. Broadly, the contemporaneity between sedimentation and the deposition of the Gakara mineralization is consistent with an extensional regime for the region. Third, our data indicate the involvement of fluids coming from depth, in a good agreement with the carbonatitic-derived hydrothermal system classically invoked for Gakara. Carbonatite magmas generally emplace in a stable (i.e., non-tectonic) context or in association with lithospheric stretching. In passive margins, local thermal disequilibrium between the thinned and cold sub-continental lithospheric mantle and the nearby hot convective asthenospheric mantle leads to a weak partial melting of the former, producing low partial melting-derived melts, such as the alkaline and associated carbonatitic magmas, and the related REE-rich fluids.
7. Conclusions
Field observations of the Gakara REE deposits show that mineralization occurred in the upper brittle crust, in relation with primary fluids coming from depth. Fluids were localized along fractures zones and heterogeneities in the host rocks (including the steeply-dipping foliation, the walls of vertical aplitic veins). Where such heterogeneities were absent, over-pressure features are recorded by the ore bodies. The fact that we document hydrothermal fluids coming from below is consistent with the classical hypothesis of a hidden carbonatitic body at depth. The involvement of surface-derived fluids, notably during the alteration of bastnaesite into monazite, remains an open question at this stage; a stable isotope and fluid inclusions study is necessary to address this possibility. The ages obtained on bastnaesite (602 ± 7 Ma) and monazite (589 ± 8 Ma) demonstrate that bastnaesite crystallization was rapidly followed by monazite alteration, reinforcing the idea that the diverse types of ore bodies observed in the field must be reconciled into a unique mineralizing event, likely linked to the extensional tectonic context that prevailed at that time in the external zones of the Pan-African system.
Author Contributions
Conceptualization, S.N., P.B.; Methodology, S.N., P.B., Y.B.; Investigation, all co-authors; Writing-Original Draft Preparation, S.N., P.B., M.P., Y.B.;Writing-Review & Editing, All authors.
Funding
This research received no external funding
Acknowledgments
We would like to thank the Rainbow Mining Burundi company for its assistance with the collection of data. We would like to extend our thanks to Xavier Le Coz (thin sectioning laboratory) and Francis Gouttefangeas (Scan MAT–CMEBA), for their help in handling the instruments. Our special thanks are also extended to the staff of Geosciences Rennes for their administrative and technical support. Two anonymous reviewers gave us thoughtful and helpful reactions. Finally, S. Ntiharirizwa wishes to thank the Campus France Agency for the promotion of French higher education abroad.
Conflicts of Interest
The authors declare no conflict of interest.
Appendix A

Table A1.
Operating conditions for the LA-ICP-MS equipment.
| Laboratory & Sample Preparation | |
|---|---|
| Laboratory name | Géosciences Rennes, UMR CNRS 6118, Rennes, France |
| Sample type/mineral | Monazite and Bastnaesite |
| Sample preparation | Polished thin sections |
| Imaging | Back-scattered electron imaging (CMEBA, University Rennes 1) |
| Laser ablation system | |
| Make, Model & type | ESI NWR193UC, Excimer |
| Ablation cell | ESI NWR TwoVol2 |
| Laser wavelength | 193 nm |
| Pulse width | <5 ns |
| Fluence | 7.7 J/cm2 |
| Repetition rate | 2 Hz (Mnz (1)) and 10 Hz (Cal (2)) |
| Spot size | 20 μm (Mnz (1)) and 100 μm (Cal (2)) |
| Sampling mode/pattern | Single spot |
| Carrier gas | 100% He, Ar make-up gas and N2 (3 mL/mn) combined using in-house smoothing device |
| Background collection | 20 s |
| Ablation duration | 60 s (Mnz (1)) and 40 s (Cal (2)) |
| Wash-out delay | 15 s |
| Cell carrier gas flow (He) | 0.75 L/min |
| ICP-MS Instrument | |
| Make, Model & type | Agilent 7700x, Q-ICP-MS |
| Sample introduction | Via conventional tubing |
| RF power | 1350 W |
| Sampler, skimmer cones | Ni |
| Extraction lenses | X type |
| Make-up gas flow (Ar) | 0.87 L/min |
| Detection system | Single collector secondary electron multiplier |
| Data acquisition protocol | Time-resolved analysis |
| Scanning mode | Peak hopping, one point per peak |
| Detector mode | Pulse counting, dead time correction applied, and analog mode when signal intensity > ~106 cps |
| Masses measured | 43Ca (only for Cal (2)), 204(Hg + Pb), 206Pb, 207Pb, 208Pb, 232Th, 238U |
| Integration time per peak | 10–30 ms |
| Sensitivity/Efficiency | 27,000 cps/ppm Pb (50 µm, 10 Hz) |
| Data Processing | |
| Gas blank | 20 s on-peak |
| Calibration strategy | Moacir monazite and calcite WC-1 used as primary reference materials, Manangoutry monazite and calcite WC-1 used as secondary reference materials (quality control) |
| Reference Material info | Moacir Monazite ([35,46]) Calcite WC-1 [40] Manangoutry monazite [33] |
| Data processing package used | Glitter [32] for Mnz (1) and Iolite [47] with VizualAge_UcomPbine [38] for Cal (2) |
| Uncertainty level & propagation | Propagation is by quadratic addition according to [48]. Reproducibility and age uncertainty of reference material are propagated. |
| Quality control/Validation | Manangoutry: 557.7 ± 3.1 Ma (N = 10, MSWD = 0.40) WC-1: Wtd ave 207Pb corrected age: 257.7 ± 4.8 Ma (N = 5, MSWD = 2.2) |
(1): Mnz = monazite; (2) Cal = calcite.
References
- Chakhmouradian, A.R.; Zaitsev, A.N. Rare Earth Mineralization in Igneous Rocks: Sources and Processes. Elements 2012, 8, 347–353. [Google Scholar] [CrossRef]
- Rasoamalala, V.; Salvi, S.; Béziat, D.; Ursule, J.-P.; Cuney, M.; de Parseval, P.; Guillaume, D.; Moine, B.; Andriamampihantona, J. Geology of bastnaesite and monazite deposits in the Ambatofinandrahana area, central part of Madagascar: An overview. J. Afr. Earth Sci. 2014, 94, 128–140. [Google Scholar] [CrossRef]
- Lehmann, B.; Nakai, S.; Höhndorf, A.; Brinckmann, J.; Dulski, P.; Hein, U.F.; Masuda, A. REE mineralization at Gakara, Burundi: Evidence for anomalous upper mantle in the western Rift Valley. Geochim. Cosmochim. Acta 1994, 58, 985–992. [Google Scholar] [CrossRef]
- Hein, U. The bastnaesite-monazite deposits of Gakara/Burundi: Composition of fluid inclusions and genetic implications. Freiberg. Forsch. 1998, C 475, 95–105. [Google Scholar]
- Song, W.; Xu, C.; Smith, M.P.; Chakhmouradian, A.R.; Brenna, M.; Kynický, J.; Chen, W.; Yang, Y.; Deng, M.; Tang, H. Genesis of the world’s largest rare earth element deposit, Bayan Obo, China: Protracted mineralization evolution over ∼1 b.y. Geology 2018, 46, 323–326. [Google Scholar] [CrossRef]
- Nakai, S.; Masuda, A.; Lehmann, B. La-Ba dating of bastnaesite. Am. Mineral. 1988, 73, 1111–1113. [Google Scholar] [CrossRef]
- Kröner, A.; Stern, R.J. Pan-African Orogeny. Encycl. Geol. 2005, 1, 1–12. [Google Scholar]
- Bumby, A.J.; Guiraud, R. The geodynamic setting of the Phanerozoic basins of Africa. J. Afr. Earth Sci. 2005, 43, 1–12. [Google Scholar] [CrossRef]
- Stern, R.J. Arc Assembly and Continental collision in the Neoproterozoic East African orogen: Implications for the consolidation of Gondwanaland. Annu. Rev. Earth Planet. Sci. 1994, 22, 319–351. [Google Scholar] [CrossRef]
- Midende, G.; Boulvais, P.; Tack, L.; Melcher, F.; Gerdes, A.; Dewaele, S.; Demaiffe, D.; Decrée, S. Petrography, geochemistry and U–Pb zircon age of the Matongo carbonatite Massif (Burundi): Implication for the Neoproterozoic geodynamic evolution of Central Africa. J. Afr. Earth Sci. 2014, 100, 656–674. [Google Scholar] [CrossRef] [Green Version]
- Chorowicz, J. The East African rift system. J. Afr. Earth Sci. 2005, 43, 379–410. [Google Scholar] [CrossRef]
- Koptev, A.; Burov, E.; Calais, E.; Leroy, S.; Gerya, T.; Guillou-Frottier, L.; Cloetingh, S. Contrasted continental rifting via plume-craton interaction: Applications to Central East African Rift. Geosci. Front. 2016, 7, 221–236. [Google Scholar] [CrossRef] [Green Version]
- Tack, L.; De Paepe, P.; Deutsch, S.; Liégeois, J.P. The alkaline plutonic complexof the Upper Ruvubu (Burundi): Geology, age, isotopic geochemistry and implications for the regional geology of the Western rift. In African Geology; Klerkx, J., Michot, J., Eds.; Musée Royal Afrique Centrale: Tervuren, Belgium, 1984; pp. 91–114. [Google Scholar]
- Kampunzu, A.B.; Lubala, R.T.; Makutu, M.N.; Caron, J.-P.H.; Rocci, G.; Vellutini, P.-J. Les complexes alcalins de la région interlacustre à l’est du Zaïre et au Burundi: Un exemple de massifs anorogéniques de relaxation. J. Afr. Earth Sci. 1985, 3, 151–167. [Google Scholar] [CrossRef]
- Tack, L.; De Paepe, P.; Liégeois, J.P.; Nimpagaritse, G.; Ntungicimpaye, A.; Midende, G. Late Kibaran magmatism in Burundi. J. Afr. Earth Sci. Middle East 1990, 10, 733–738. [Google Scholar] [CrossRef]
- Decrée, S.; Boulvais, P.; Cobert, C.; Baele, J.-M.; Midende, G.; Gardien, V.; Tack, L.; Nimpagaritse, G.; Demaiffe, D. Structurally-controlled hydrothermal alteration in the syntectonic Neoproterozoic Upper Ruvubu Alkaline Plutonic Complex (Burundi): Implications for REE and HFSE mobilities. Precambrian Res. 2015, 269, 281–295. [Google Scholar] [CrossRef] [Green Version]
- Van Wambeke, L. The Karonge rare earth deposits, Republic of Burundi: New mineralogical-geochemical data and origin of the mineralization. Miner. Deposita 1977, 12, 373–380. [Google Scholar] [CrossRef]
- Wyllie, P.J. Origin of Carbonatites: Evidence from Phase Equilibrium Studies. In Carbonatites: Genesis and Evolution; Bell, K., Ed.; Unwin Hyman: London, UK, 1989; pp. 500–545. ISBN 978-0-04-445068-9. [Google Scholar]
- Ngwenya, B.T. Hydrothermal rare earth mineralisation in carbonatites of the Tundulu complex, Malawi: Processes at the fluid/rock interface. Geochim. Cosmochim. Acta 1994, 58, 2061–2072. [Google Scholar] [CrossRef]
- Wyllie, P.J.; Jones, A.P.; Deng, J. Rare earth elements in carbonate-rich melts from mantle to crust. In Unspecified; Chapman and Hall: London, UK, 1995; Volume 7, pp. 77–104. [Google Scholar]
- Williams-Jones, A.E.; Wood, S.A. A preliminary petrogenetic grid for REE fluorocarbonates and associated minerals. Geochim. Cosmochim. Acta 1992, 56, 725–738. [Google Scholar] [CrossRef]
- Tack, L.; Wingate, M.T.D.; De Waele, B.; Meert, J.; Belousova, E.; Griffin, B.; Tahon, A.; Fernandez-Alonso, M. The 1375 Ma “Kibaran event” in Central Africa: Prominent emplacement of bimodal magmatism under extensional regime. Precambrian Res. 2010, 180, 63–84. [Google Scholar] [CrossRef]
- Fernandez-Alonso, M.; Cutten, H.; De Waele, B.; Tack, L.; Tahon, A.; Baudet, D.; Barritt, S.D. The Mesoproterozoic Karagwe-Ankole Belt (formerly the NE Kibara Belt): The result of prolonged extensional intracratonic basin development punctuated by two short-lived far-field compressional events. Precambrian Res. 2012, 216, 63–86. [Google Scholar] [CrossRef]
- Theunissen 1986: Carte Géologique du Burundi, Feuille Rumonge; Echelle: 1/100000, S4/29-SW; Musée Royal Afrique Centrale: Tervuren, Belgium, 1986.
- Theunissen 1989: Carte Géologique du Burundi, Feuille Bujumbura; Echelle: 1/100000, S4/29-NW; Musée Royal Afrique Centrale: Tervuren, Belgium, 1989.
- Claessens and Theunissen 1988: Carte géologique du Burundi, Feuille Bururi et Gitega; S4/29-NE, Echelle: 1/100000; Musée Royal Afrique Centrale: Tervuren, Belgium, 1988.
- Kretz, R. Symbols for rock-forming minerals. Am. Mineral. 1983, 68, 277–279. [Google Scholar]
- Whitney, D.L.; Evans, B.W. Abbreviations for names of rock-forming minerals. Am. Mineral. 2010, 95, 185–187. [Google Scholar]
- Aderca, B.-M.; van Tassel, R. Le Gisement de Terres Rares de la Karonge (République du Burundi); Académie Royale des Sciences D’outre-mer: Bruxelles, Belgium, 1971. [Google Scholar]
- Ballouard, C.; Boulvais, P.; Poujol, M.; Gapais, D.; Yamato, P.; Tartèse, R.; Cuney, M. Tectonic record, magmatic history and hydrothermal alteration in the Hercynian Guérande leucogranite, Armorican Massif, France. Lithos 2015, 220, 1–22. [Google Scholar] [CrossRef]
- Gasquet, D.; Bertrand, J.-M.; Paquette, J.-L.; Lehmann, J.; Ratzov, G.; De Ascencao Guedes, R.; Tiepolo, M.; Boullier, A.-M.; Scaillet, S.; Nomade, S. Miocene to Messinian deformation and hydrothermal activity in a pre-alpine basement massif of the French Western Alps: New U-Th-Pb and Argon ages from the Lauzière massif. Bull. Société Géol. Fr. 2010, 181, 227–241. [Google Scholar] [CrossRef]
- Van Achterbergh, E.; Ryan, C.; Jackson, S.; Griffin, W. Data reduction software for LA–ICP–MS: Appendix. In Laser Ablation-ICP-Mass Spectrometry in the Earth Sciences; Principles and Applications; Mineralogical Association of Canada: Québec, QC, Canada, 2001; pp. 239–243. [Google Scholar]
- Paquette, J.L.; Tiepolo, M. High resolution (5 μm) U–Th–Pb isotope dating of monazite with excimer laser ablation (ELA)-ICPMS. Chem. Geol. 2007, 240, 222–237. [Google Scholar] [CrossRef]
- Sal’nikova, E.B.; Yakovleva, S.Z.; Nikiforov, A.V.; Kotov, A.B.; Yarmolyuk, V.V.; Anisimova, I.V.; Sugorakova, A.M.; Plotkina, Y.V. Bastnaesite: A promising U-Pb geochronological tool. Dokl. Akad. Nauk 2010, 430, 386–388. [Google Scholar] [CrossRef]
- Yang, Y.-H.; Wu, F.-Y.; Li, Y.; Yang, J.-H.; Xie, L.-W.; Liu, Y.; Zhang, Y.-B.; Huang, C. In situ U–Pb dating of bastnaesite by LA-ICP-MS. J. Anal. At. Spectrom. 2014, 29, 1017–1023. [Google Scholar] [CrossRef]
- Ling, X.X.; Li, Q.L.; Liu, Y.; Yang, Y.H.; Liu, Y.; Tang, G.Q.; Li, X.H. In situ SIMS Th–Pb dating of bastnaesite: Constraint on the mineralization time of the Himalayan Mianning–Dechang rare earth element deposits. J. Anal. At. Spectrom. 2016, 31, 1680–1687. [Google Scholar] [CrossRef]
- Sylvester, P.J. LA-(MC)-ICP-MS trends in 2006 and 2007 with particular emphasis on measurement uncertainties. Geostand. Geoanal. 2008, 32, 469–488. [Google Scholar] [CrossRef]
- Roberts, W.N.M.; Rasbury, E.T.; Parrish, R.R.; Smith, C.J.; Horstwood, M.S.A.; Condon, D.J. A calcite reference material for LA-ICP-MS U-Pb geochronology. Geochem. Geophys. Geosyst. 2017, 18, 2807–2814. [Google Scholar] [CrossRef] [Green Version]
- Chew, D.M.; Petrus, J.A.; Kamber, B.S. U–Pb LA–ICPMS dating using accessory mineral standards with variable common Pb. Chem. Geol. 2014, 363, 185–199. [Google Scholar] [CrossRef] [Green Version]
- Pochon, A.; Poujol, M.; Gloaguen, E.; Branquet, Y.; Cagnard, F.; Gumiaux, C.; Gapais, D. U-Pb LA-ICP-MS dating of apatite in mafic rocks: Evidence for a major magmatic event at the Devonian-Carboniferous boundary in the Armorican Massif (France). Am. Mineral. 2016, 101, 2430–2442. [Google Scholar] [CrossRef]
- Ludwig, K. User’s Manual for Isoplot 3.75. A Geochronological Toolkit for Microsoft Excel; Berkeley Geochronological Center: Berkeley, CA, USA, 2012; pp. 1–75. [Google Scholar]
- Ludwig, K.R. On the Treatment of Concordant Uranium-Lead Ages. Geochim. Cosmochim. Acta 1998, 62, 665–676. [Google Scholar] [CrossRef]
- Poujol, M.; Pitra, P.; Driessche, J.V.D.; Tartèse, R.; Ruffet, G.; Paquette, J.-L.; Poilvet, J.-C. Two-stage partial melting during the Variscan extensional tectonics (Montagne Noire, France). Int. J. Earth Sci. 2017, 106, 477–500. [Google Scholar] [CrossRef] [Green Version]
- Thoreau, J.; Aderca, B.-M.; Van Wambeke, L. Le gisement de terres rares de la Karonge (Burundi). Acad. R. Sci. Outre-Mer. 1958, 4, 684–715. [Google Scholar]
- Unrug, R. The assembly of Gondwanaland. Scientific results of IGCP Project 288: Gondwanaland sutures and mobile belts. Episodes 1996, 19, 11–20. [Google Scholar]
- Fletcher, I.R.; McNaughton, N.J.; Davis, W.J.; Rasmussen, B. Matrix effects and calibration limitations in ion probe U–Pb and Th–Pb dating of monazite. Chem. Geol. 2010, 270, 31–44. [Google Scholar] [CrossRef]
- Paton, C.; Woodhead, J.D.; Hellstrom, J.C.; Hergt, J.M.; Greig, A.; Maas, R. Improved laser ablation U-Pb zircon geochronology through robust downhole fractionation correction. Geochem. Geophys. Geosyst. 2010, 11, 36. [Google Scholar] [CrossRef]
- Horstwood, M.S.A.; Foster, G.L.; Parrish, R.R.; Noble, S.R.; Nowell, G.M. Common-Pb corrected in situ U-Pb accessory mineral geochronology by LA-MC-ICP-MS. J. Anal. Spectrom. 2003, 18, 837–846. [Google Scholar] [CrossRef]
Figure 1.
(A) Geological map of Central Africa showing Precambrian structures and locations of carbonatites+alkaline complexes in the western branch of the East African Rift. The map is modified from [3,12,22,23]. (B) Geological map of the study area showing the occurrences of REE mineralization (Rainbow Burundi Mining data) and their host rocks; compiled data and redrawn from the 1/100,000 geological maps of Burundi: sheet Rumonge [24], sheet Bujumbura [25], sheet Bururi and sheet Gitega [26].
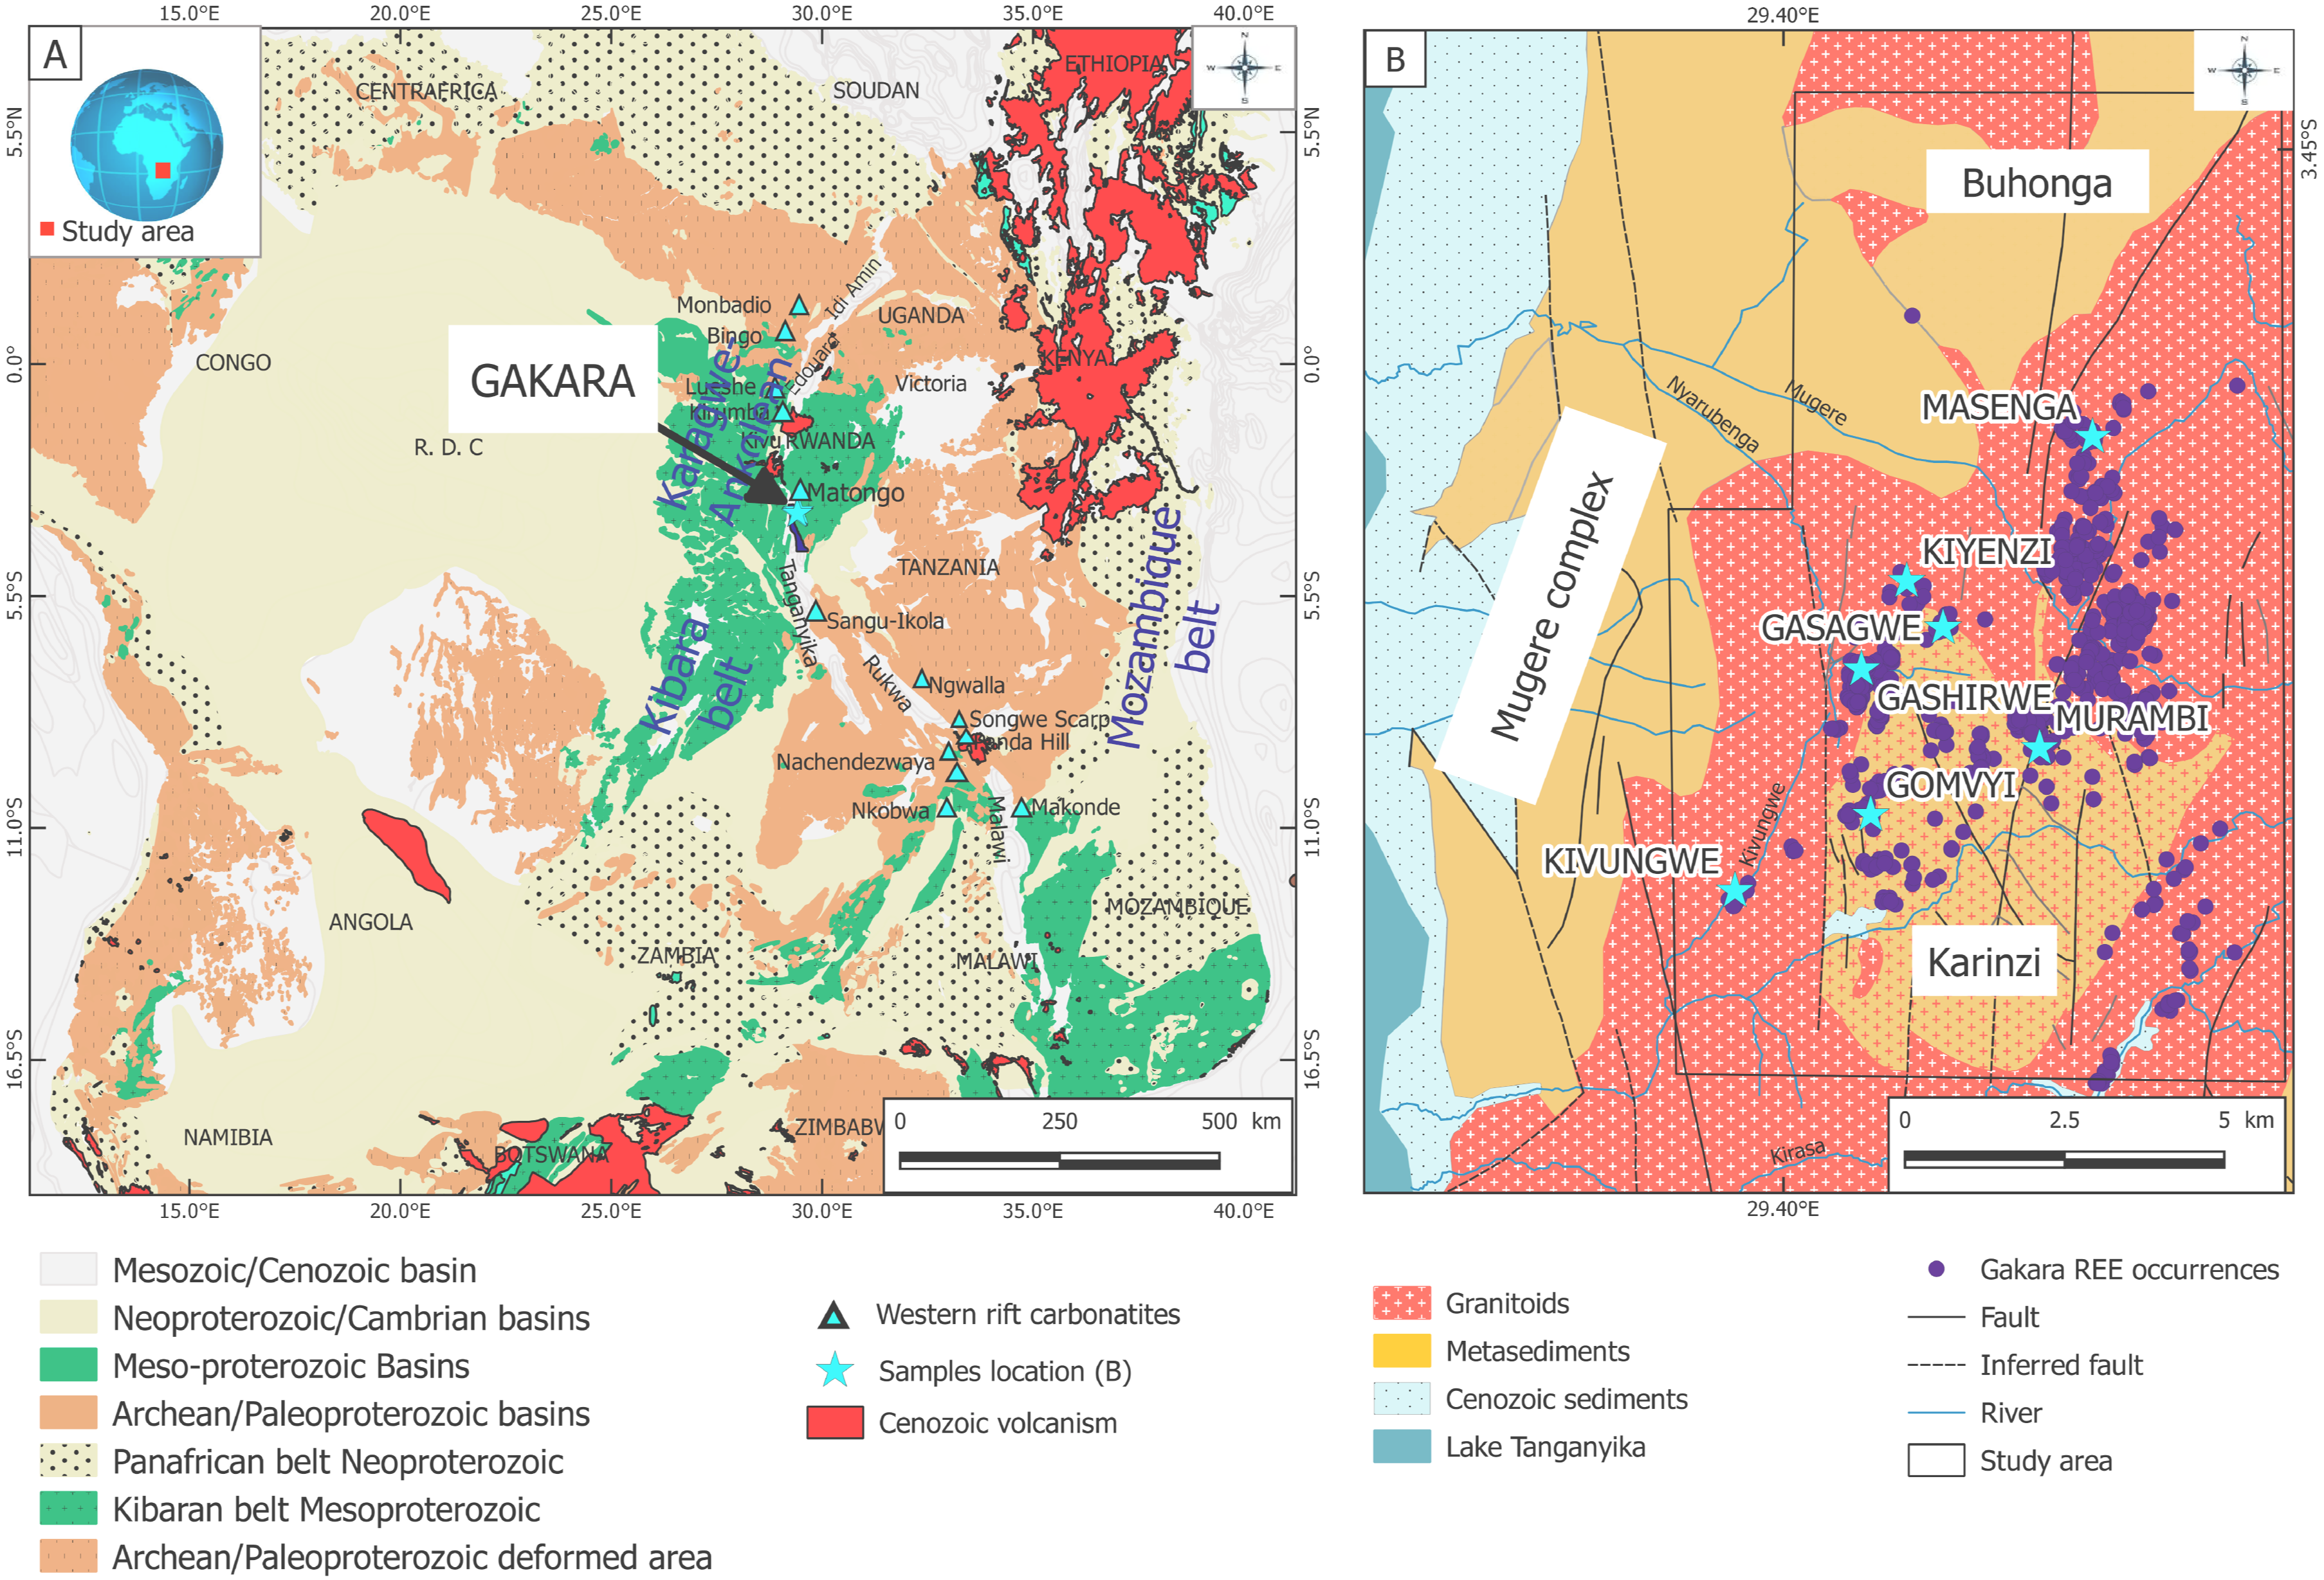
Figure 2.
Features and structures affecting the gneissic host rocks of the Gakara REE mineralization. See text for details. (A,C,D) Gasagwe mine road; (B) FK and garnet-rich para-gneisses hosting the Kiyenzi REE occurrences. The pegmatites parallel to S0/S1 are folded and schistosed by S2; (E) pegmatite and host gneiss, the fold affects both the pegmatite and a previous foliation (main road to Gakara).

Figure 3.
Structural sketch of the Gasagwe REE mine and stereogram of the REE-bearing veins (great circles and contoured poles).
Figure 3.
Structural sketch of the Gasagwe REE mine and stereogram of the REE-bearing veins (great circles and contoured poles).

Figure 4.
Synthetic line drawing, structures and textures associated with the Gasagwe REE-bearing veins. See text for explanation. (A,B) foliated chloritized mylonites re-opened during the REE mineralizing event. (C) hydraulic breccia (jigsaw cataclasite) developed during the mineralizing event in the gneissic wall rocks. (D) ductile lineations on a shear plane crosscutting the gneiss foliation.

Figure 5.
3D synthetic block of the Kiyenzi trench n°7.

Figure 6.
(A) REE veins measured at Kiyenzi (Low. Hem. Equal Angle, 10 data); (B,C) cataclastic brittle shear between aplite and paragneissic host rocks.; (D) hand sample of the Kiyenzi white albitized aplite. (E,F)-the REE veins (which are themselves mineralized breccia cemented by REE-bearing minerals) are fractured, folded and cut by post REE faulting and cataclasis.

Figure 7.
(A) Stereograms and rose diagrams of the REE bearing veins from the Gashirwe prospect (Low. Hem., Equal Area); (B) Aplite intruding gneiss, note the clustering of the post-aplite vertical dry jointing around the intrusive aplite dykes. Those dry fractures are almost parallel to the REE veins at the outcrop scale; (C) Similar pattern of “dry” fracturing within aplite which can enlarge as sill (bottom left). The gneiss foliation is disturbed by drag folding along the aplite and fractures; (D) REE veins (green) crosscutting aplite (pink) and pegmatite (yellow). The REE vein is not continuous and has a variable thickness.

Figure 8.
The Murambi occurrence. (A) REE-bearing veins within the pegmatites. (B) Corrosion gulfs along the pegmatite wall rocks.
Figure 8.
The Murambi occurrence. (A) REE-bearing veins within the pegmatites. (B) Corrosion gulfs along the pegmatite wall rocks.
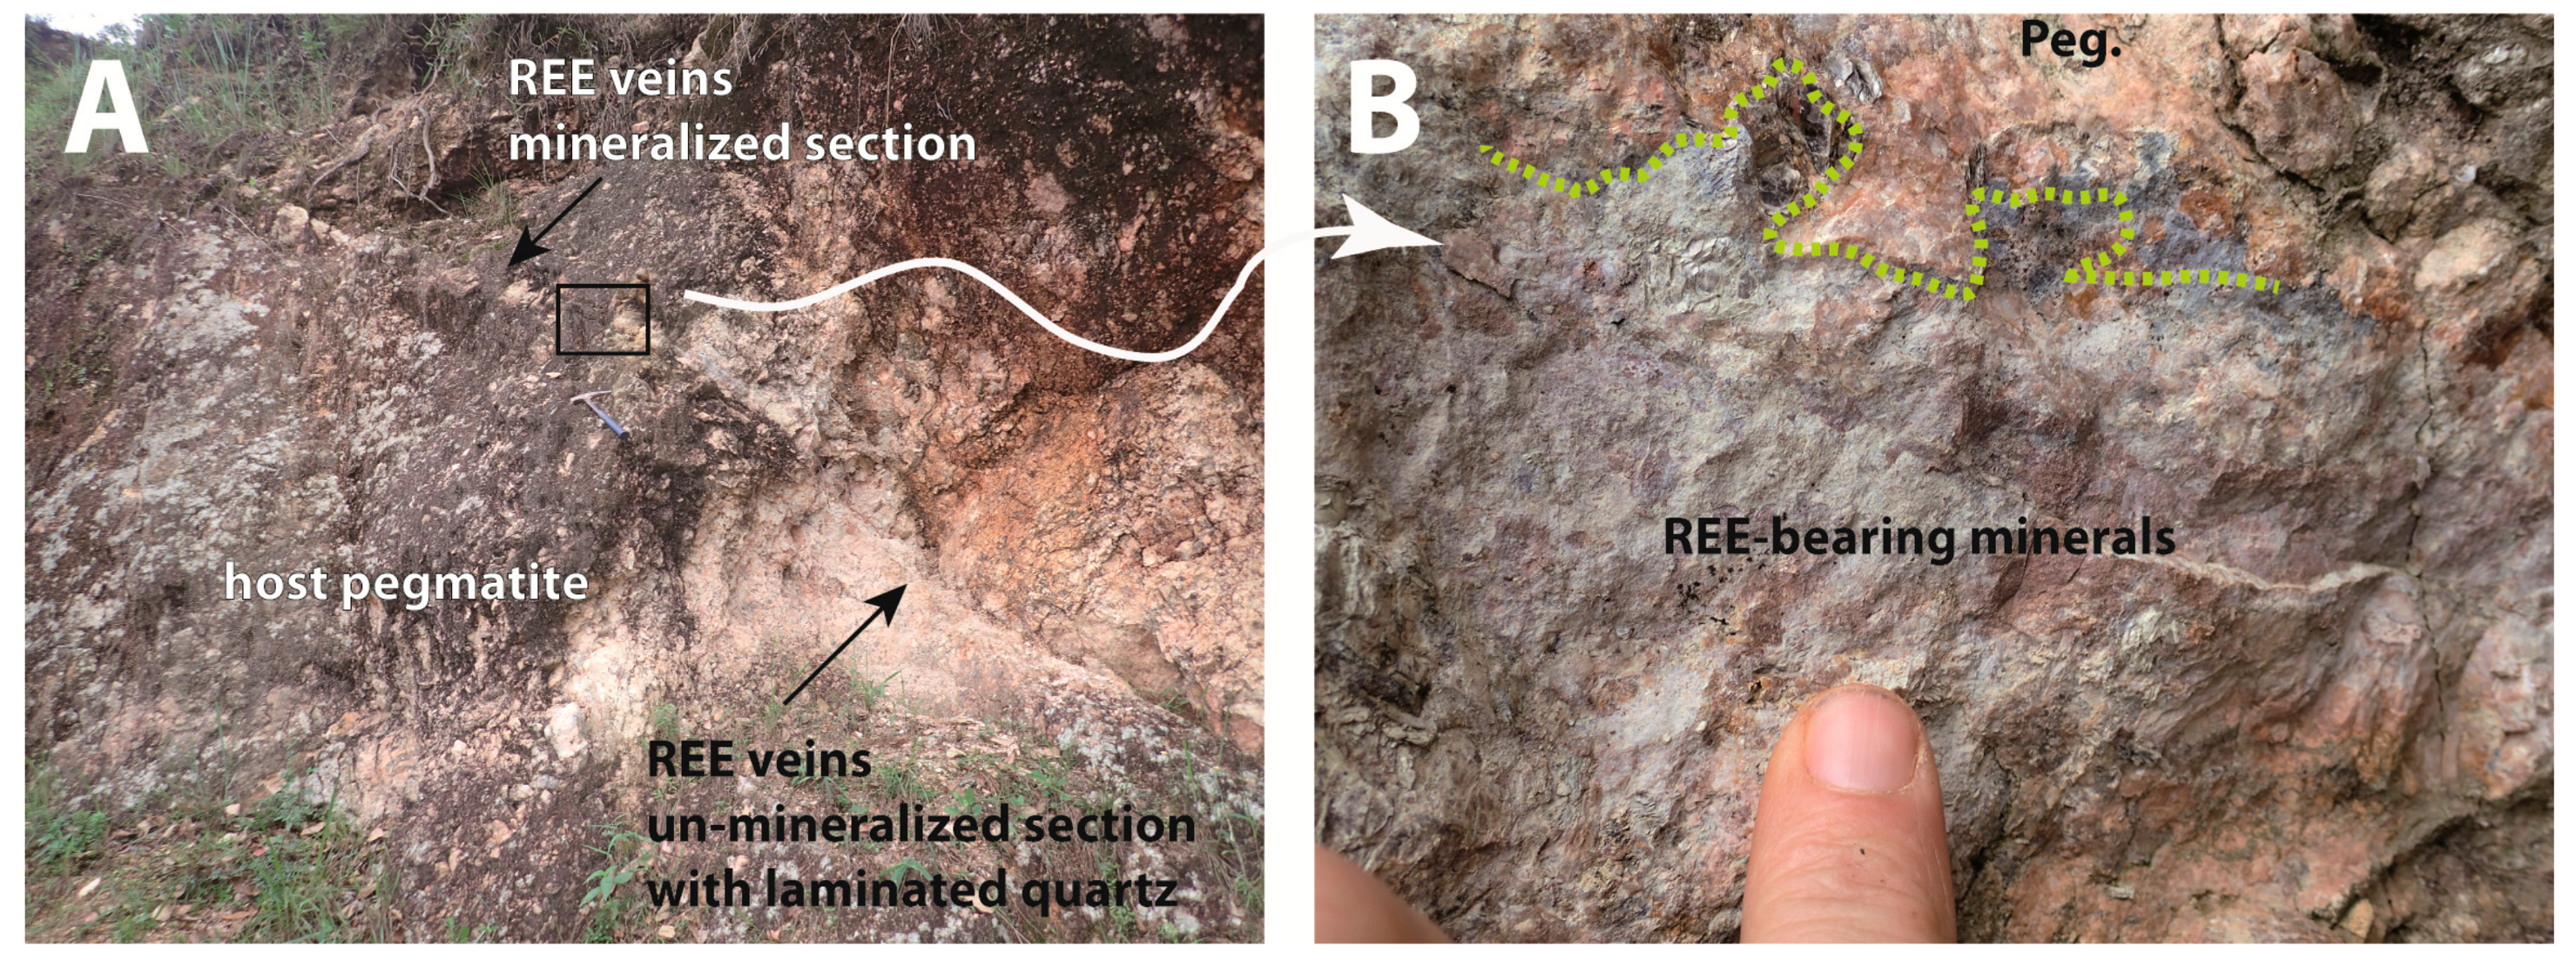
Figure 9.
(A) Masenga outcrop exposing the foliated orthogneiss, cut by a foliated low-dipping pegmatite and by an isotropic 20-cm wide low-dipping microgranite dyke (close to the worker). (B) Large bastnaesite crystals presently altered into a monazite-rich greenish product. Empty spaces between crystals are visible.

Figure 10.
Representative samples of the Gakara REE deposits: (A) GOMV sample exhibits a bastnaesite ore cutting a quartz vein (likely Kibaran in age); (B) KIV sample displays deformed crystals of bastnaesite (Bst) with holes filled by quartz (Qtz); (C) NYARU sample is a breccia consisting of clasts of bastnaesite in a pinkish matrix; (D) GASH sample shows the replacement of bastnaesite by monazite; (E) GASA sample is typical of an altered ore with monazite together with bastnaesite relics; (F) MURA sample shows a monazite (Mnz) ore associated with a quartz vein. Mineral abbreviations according to [27,28]. The black bars at the bottom right corners correspond to 2 cm.

Figure 11.
Thin-section optical and SEM photographs of representative samples displaying the mineralogical assemblages: (A) KIV sample: Bastnaesite (Bst) crystals are affected by a dense network of monazite (Mnz) and quartz (Qtz); Biotite (Bt) forms large brown crystals with perfect cleavage (B) GASH sample: Breccia consisting of clasts of bastnaesite, barite (Brt) and quartz.; (C) MASE sample: Galena (Gn) in quartz associated with bastnaesite and monazite (Mnz); (D) NYARU sample: Microvein + replacement of bastnaesite by monazite together with quartz and goethite; (E) Acicular crystals of rhabdophane (Rbd) form around quartz and replace bastnaesite and monazite. (F) GASA sample: Cerianite (Cnt) grains locally replacing bastnaesite and/or monazite-(Ce); monazite-(La) grew during or after the cerianite rims. Mineral abbreviations (except Cnt and Rbd) according to [27,28]. As a summary, the mineralogical observations above, which are consistent with and complete the works of [17,29] are presented in a paragenetic sequence (Figure 12).
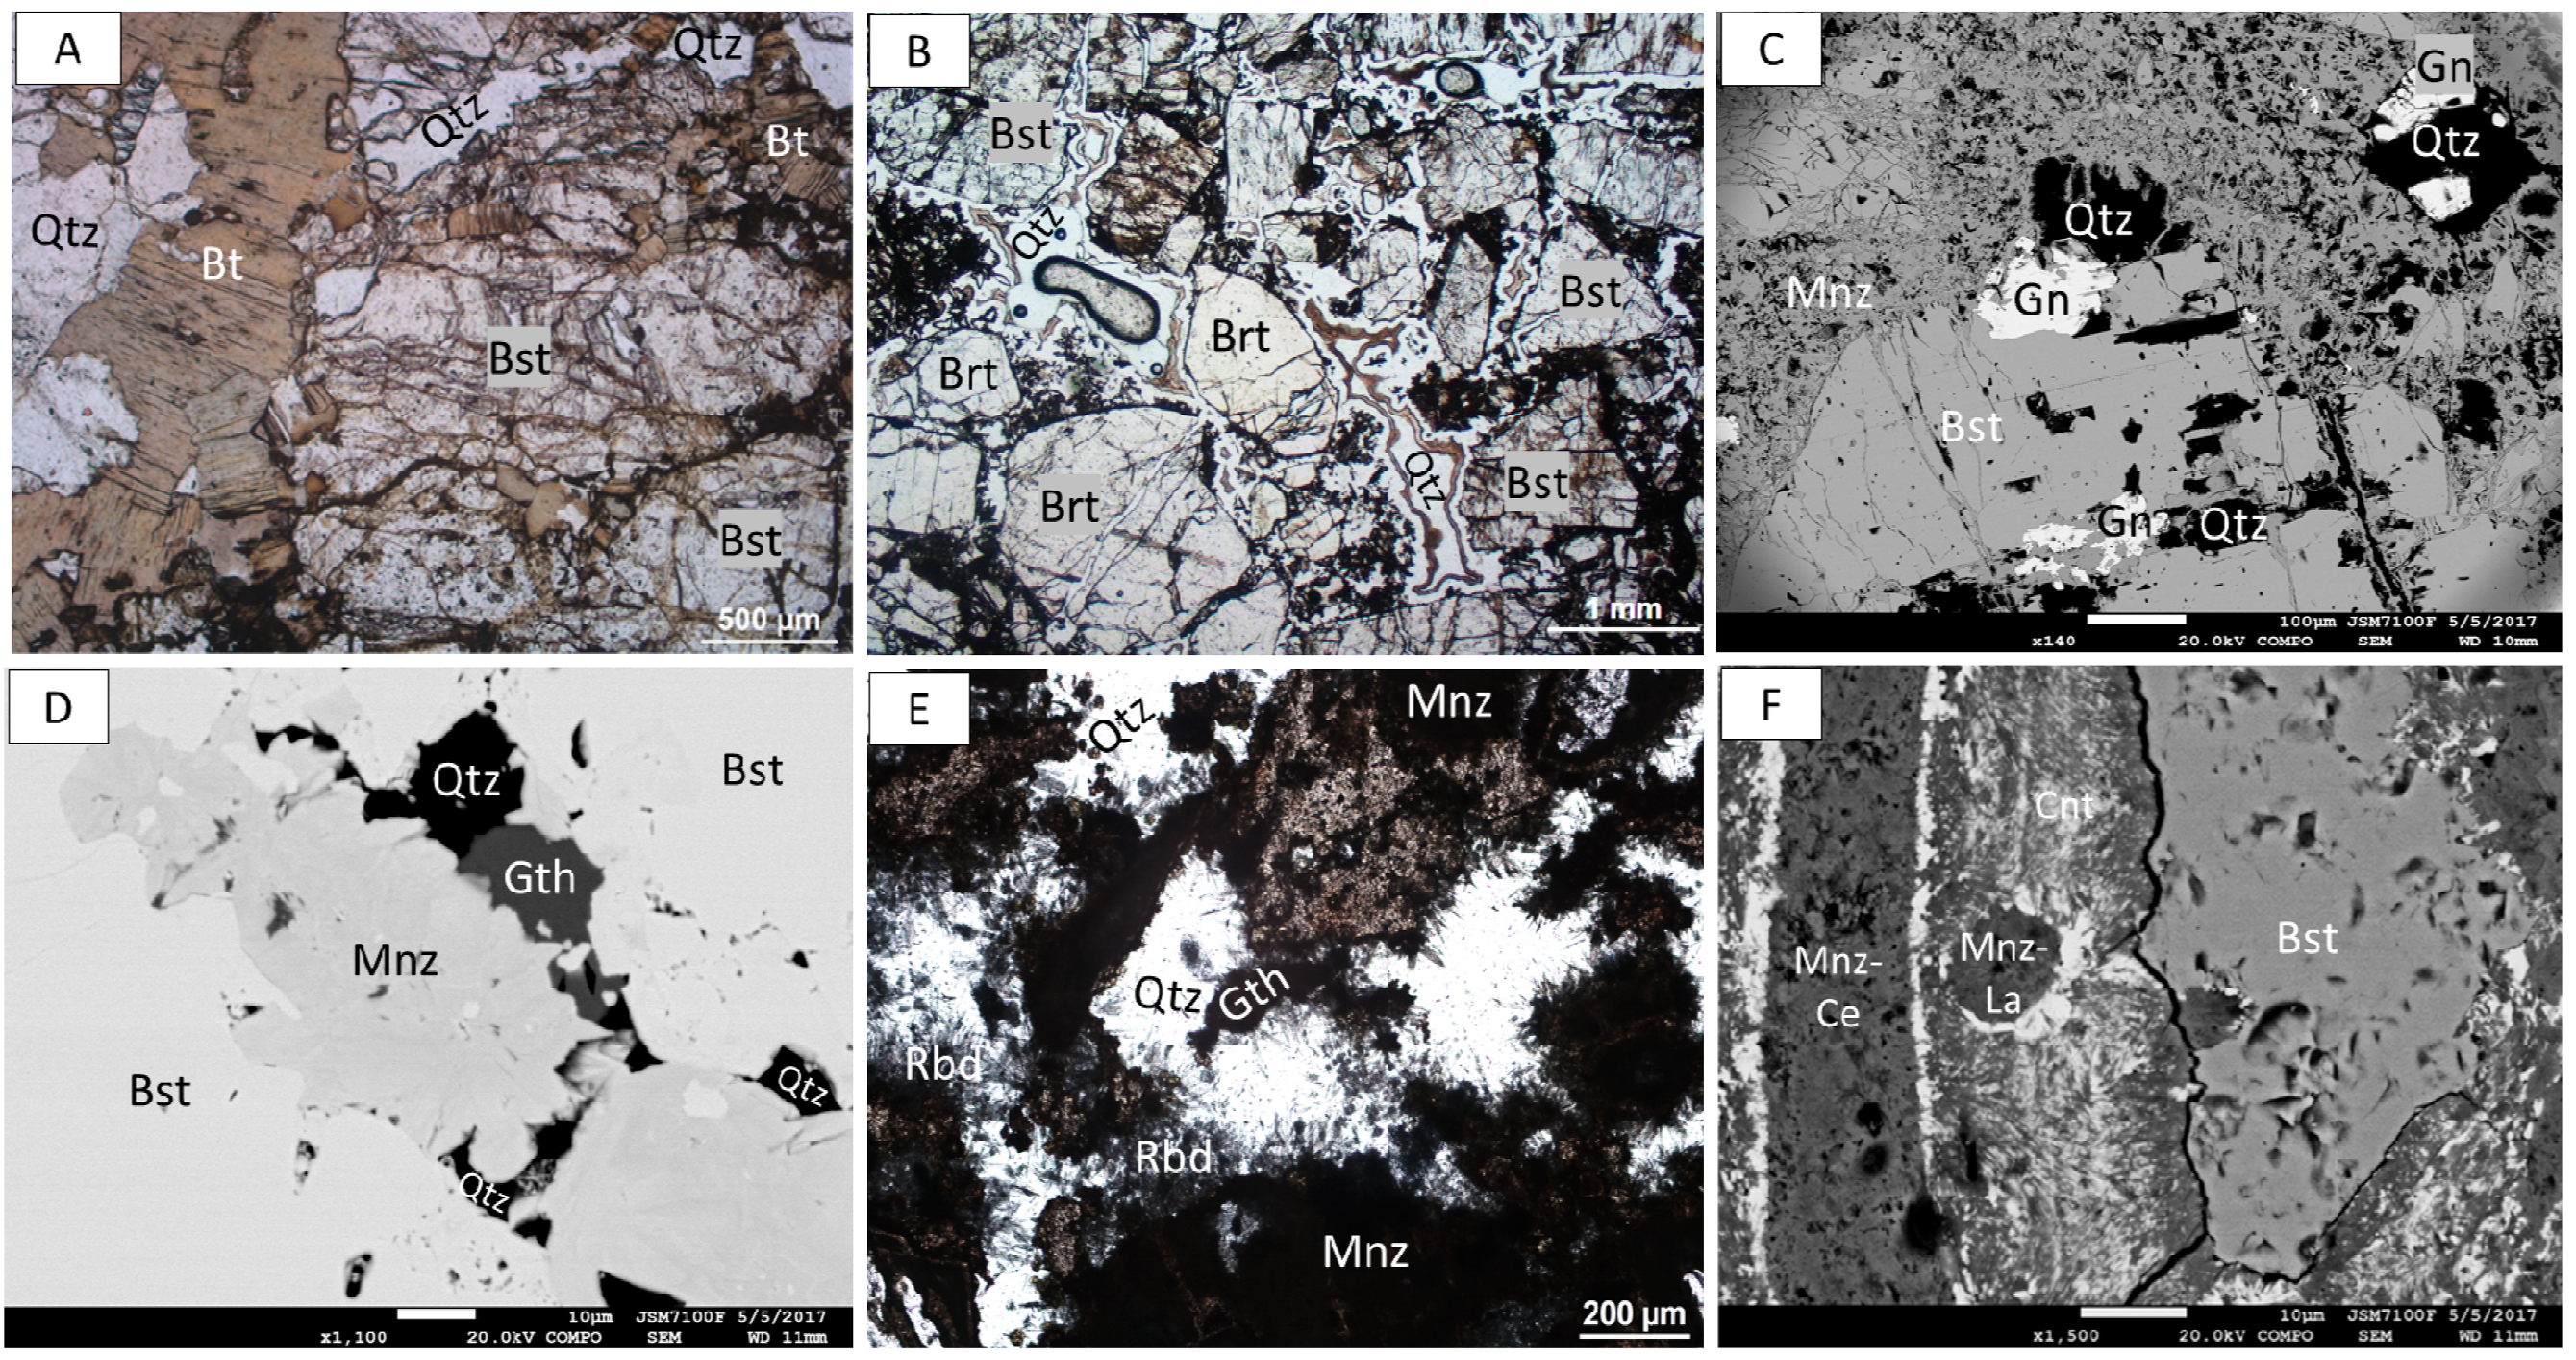
Figure 12.
Synthetic paragenetic sequence for the Gakara REE mineralization; established from various deposits and occurrences (i.e., the degree of alteration stages is not equal for all deposits).
Figure 12.
Synthetic paragenetic sequence for the Gakara REE mineralization; established from various deposits and occurrences (i.e., the degree of alteration stages is not equal for all deposits).

Figure 13.
Tera–Wasserburg (A) and 206Pb/238U versus 208Pb/232Th (B,C) Concordia diagrams for monazite from Gakara. Error ellipses and age calculations are reported with 2σ errors.
Figure 13.
Tera–Wasserburg (A) and 206Pb/238U versus 208Pb/232Th (B,C) Concordia diagrams for monazite from Gakara. Error ellipses and age calculations are reported with 2σ errors.
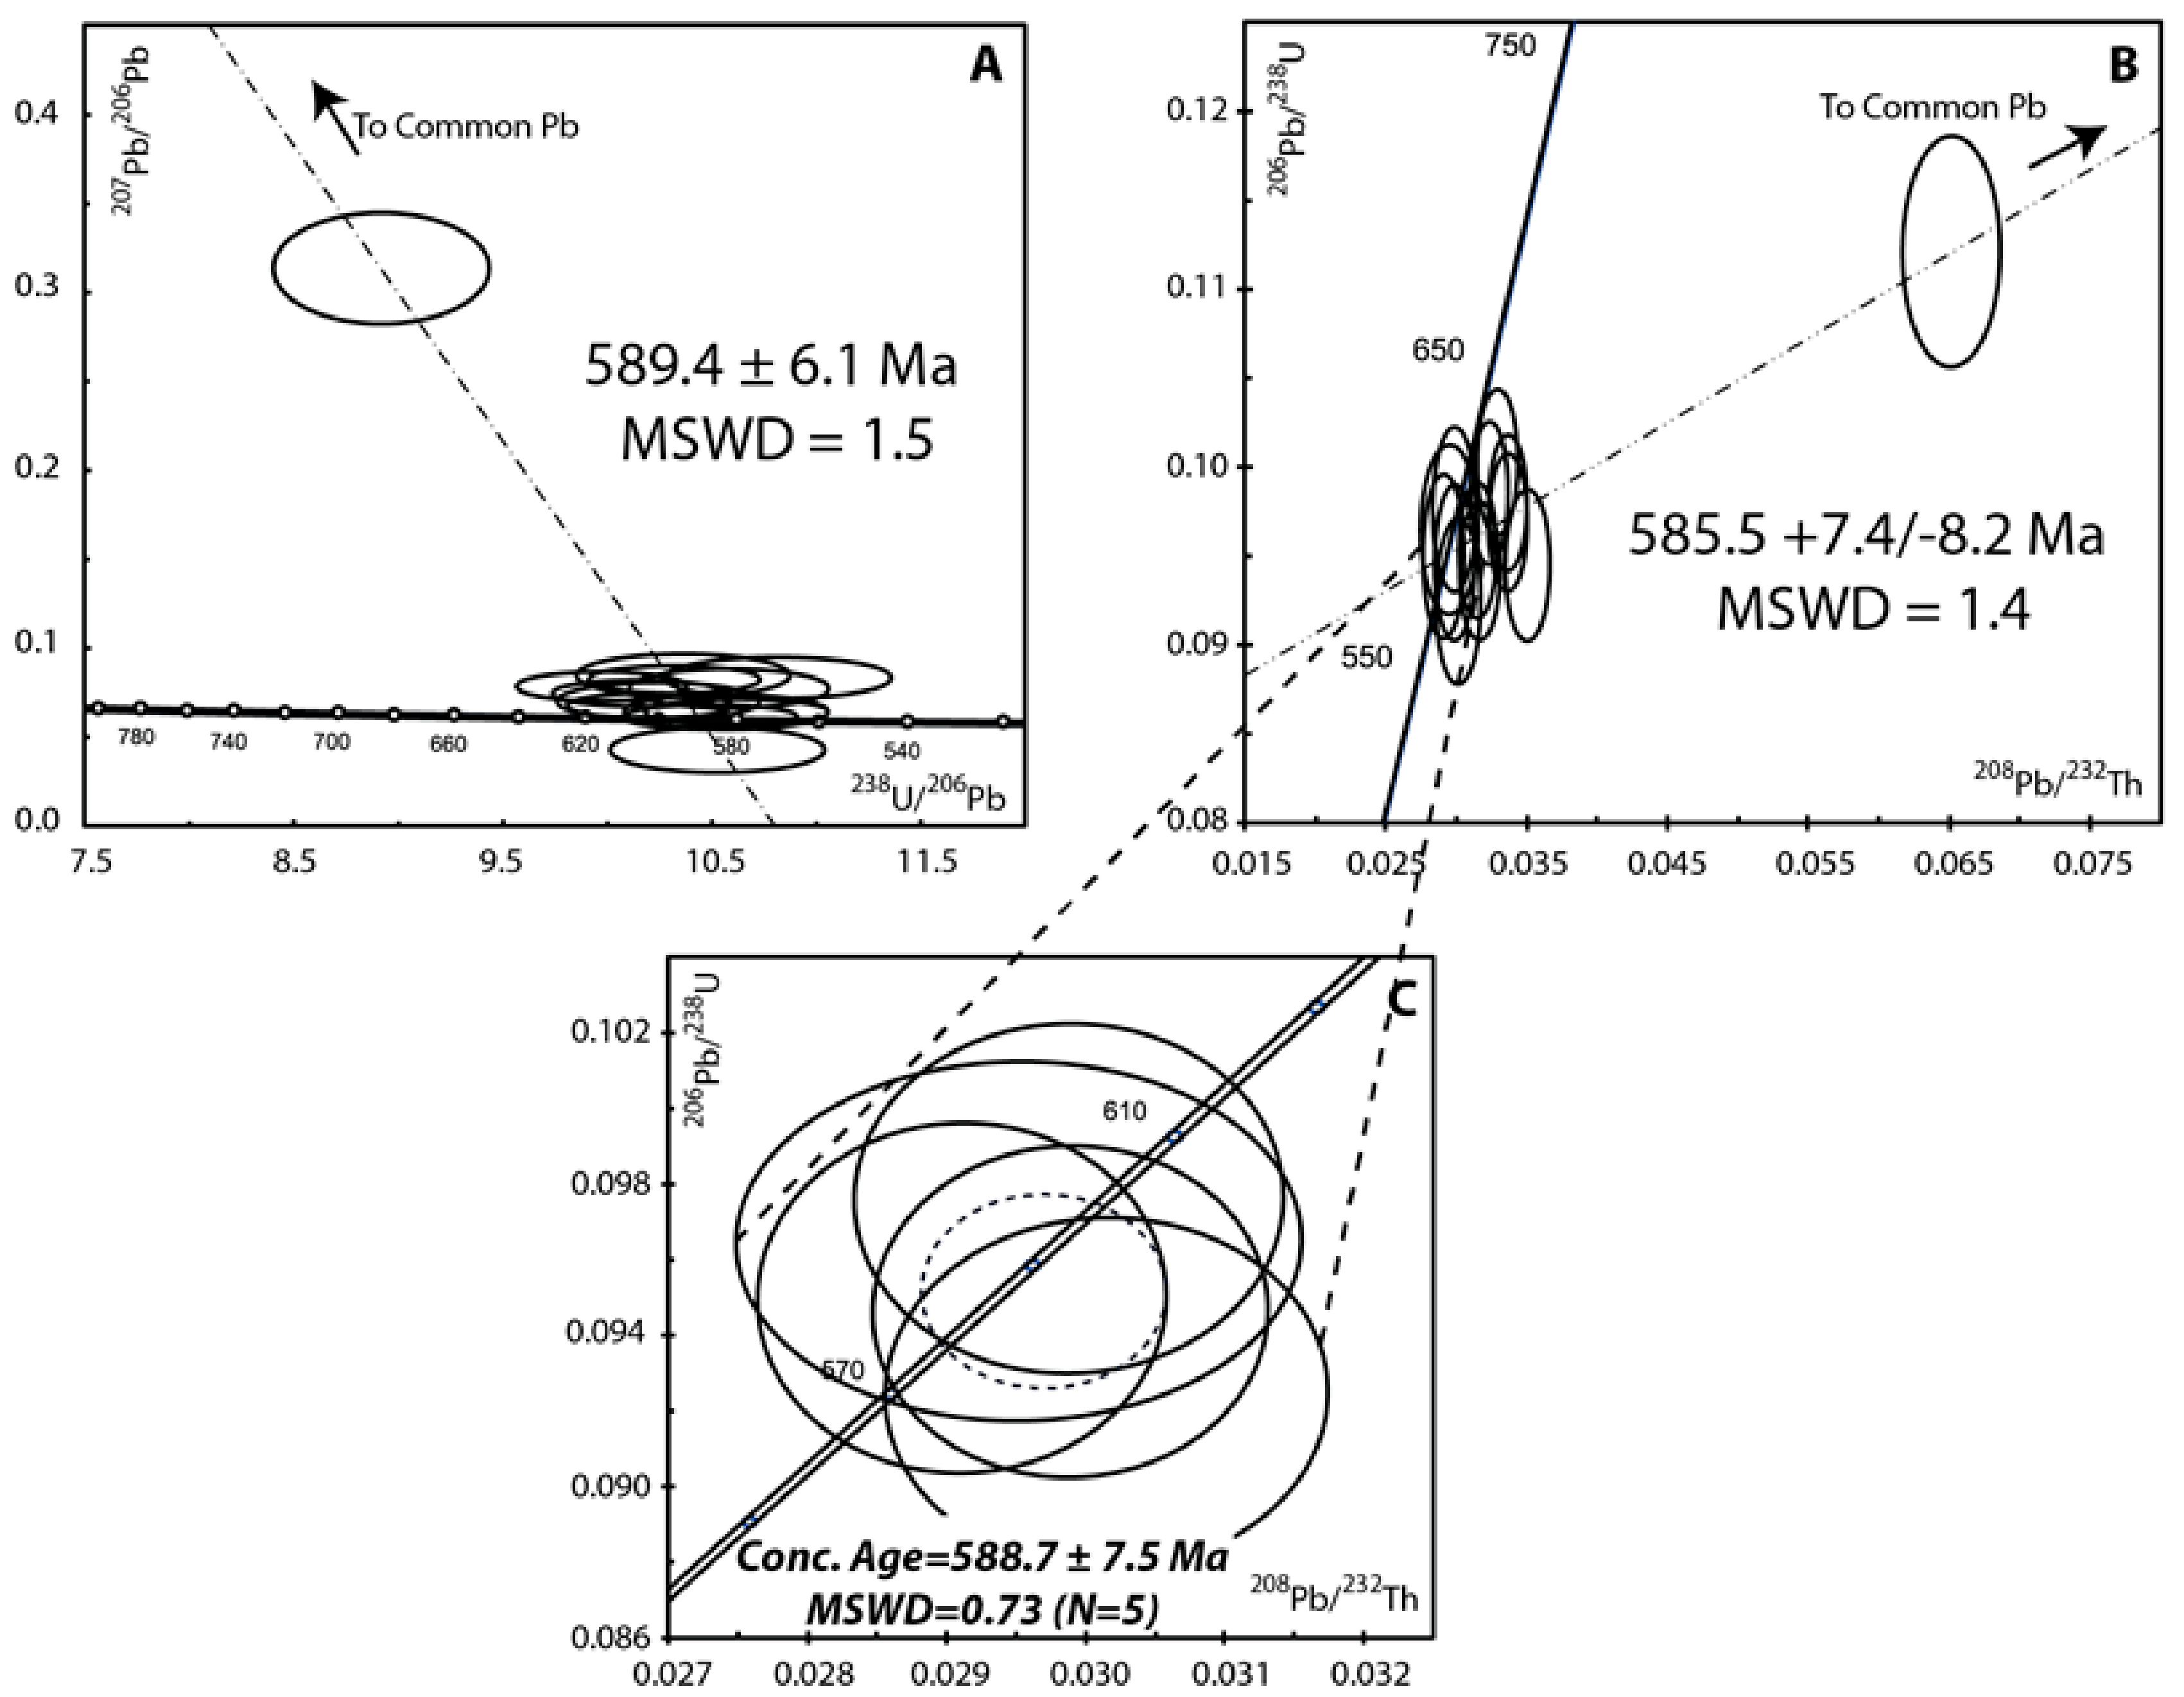
Figure 14.
Tera–Wasserburg and 206Pb/238U versus 208Pb/232Th Concordia diagrams for bastnaesite crystals from Gakara. Error ellipses and age calculations are reported with 2σ errors. (A) Tera–Wasserburg diagram with all the data obtained by standardizing bastnaesite with a monazite standard. (B) Zoom of Figure 14A with concordant data only. (C) 206Pb/238U versus 208Pb/232Th diagram for the bastnaesite standardized with a monazite standard. (D) Tera–Wasserburg diagram with all the data obtained by standardizing bastnaesite with a calcite standard. (E) Tera–Wasserburg diagram combining all the data acquired on bastnaesite.
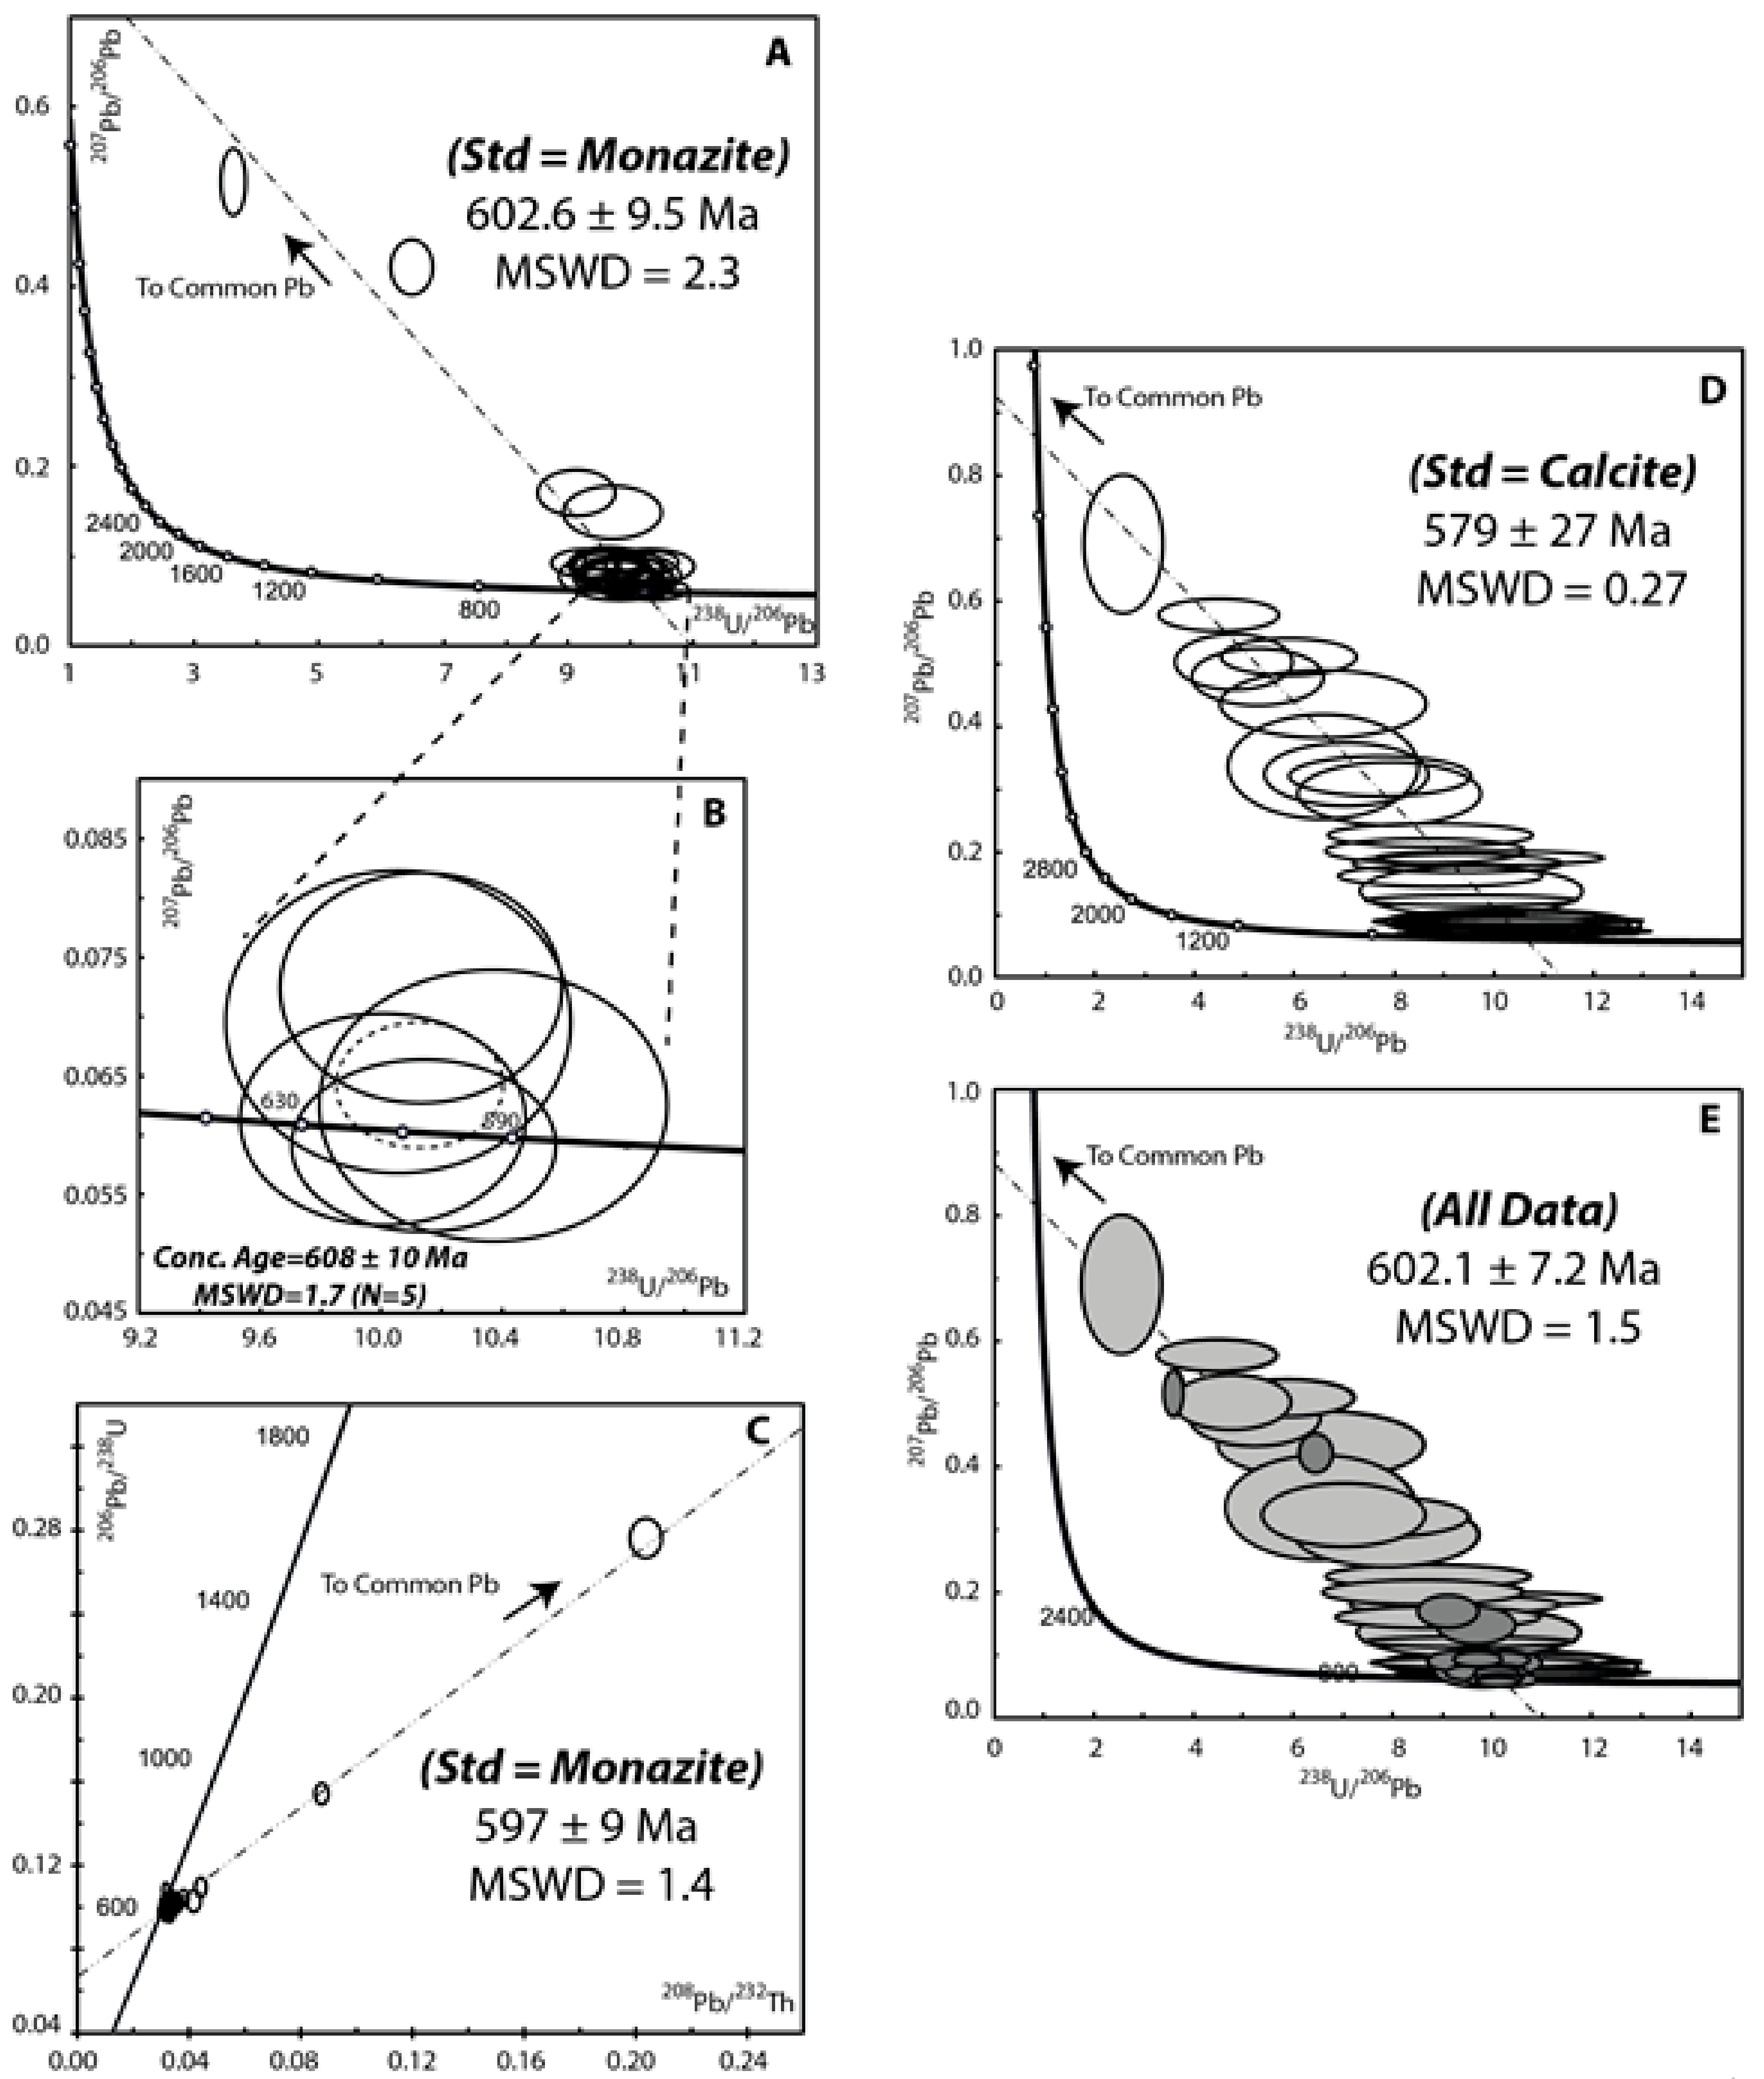
Table 1.
LA-ICP-MS U-Th-Pb on monazite.
| Isotopic Ratios | Apparent Ages | |||||||||||||
|---|---|---|---|---|---|---|---|---|---|---|---|---|---|---|
| Analysis_# | Pb ppm | U ppm | Th ppm | Th/U | 238U/206Pb | Err% | 207Pb/206Pb | Err% | 208Pb/232Th | Err% | 206Pb/238U | Err | 208Pb/232Th | Err |
| S060617a-01 | 2.5 | 19 | 39 | 2.1 | 10,529 | 2.0 | 0.0428 | 12.2 | 0.0291 | 2.1 | 585 | 11 | 580 | 12 |
| S060617a-06 | 3.3 | 16 | 25 | 1.6 | 8921 | 2.4 | 0.3133 | 4.1 | 0.0651 | 2.2 | 685 | 15 | 1275 | 27 |
| S060617b-01 | 3.5 | 27 | 48 | 1.8 | 10,149 | 1.7 | 0.0746 | 4.1 | 0.0324 | 1.7 | 606 | 10 | 644 | 11 |
| S060617b-02 | 3.5 | 28 | 43 | 1.5 | 10,205 | 1.6 | 0.0677 | 4.2 | 0.0337 | 1.6 | 603 | 9 | 669 | 11 |
| S060617b-05 | 3.4 | 26 | 44 | 1.7 | 10.322 | 1.6 | 0.0824 | 3.8 | 0.0337 | 1.7 | 596 | 9 | 669 | 11 |
| S060617b-11 | 3.4 | 26 | 42 | 1.6 | 9974 | 1.7 | 0.0785 | 4.3 | 0.0329 | 1.8 | 616 | 10 | 655 | 12 |
| S060617b-14 | 2.8 | 22 | 40 | 1.8 | 10,245 | 1.9 | 0.0701 | 6.2 | 0.0299 | 2.1 | 600 | 11 | 595 | 12 |
| S060617b-18 | 2.9 | 22 | 45 | 2.1 | 10,569 | 1.9 | 0.0642 | 6.2 | 0.0299 | 1.9 | 583 | 11 | 595 | 11 |
| S060617b-19 | 2.0 | 14 | 26 | 1.8 | 10,584 | 1.8 | 0.0773 | 5.8 | 0.0351 | 1.9 | 582 | 10 | 697 | 13 |
| S060617b-20 | 2.1 | 16 | 31 | 1.9 | 10,817 | 2.1 | 0.0833 | 5.7 | 0.0302 | 2.2 | 570 | 11 | 600 | 13 |
| S060617c-04 | 3.1 | 27 | 36 | 1.3 | 10,621 | 1.7 | 0.0640 | 4.7 | 0.0317 | 1.9 | 580 | 9 | 630 | 12 |
| S060617c-14 | 3.5 | 30 | 43 | 1.4 | 10,493 | 1.6 | 0.0613 | 4.5 | 0.0315 | 1.7 | 587 | 9 | 627 | 11 |
| S060617c-15 | 1.8 | 17 | 17 | 1.0 | 10,365 | 2.0 | 0.0847 | 5.8 | 0.0295 | 2.8 | 594 | 11 | 588 | 16 |
| S060617c-18 | 1.9 | 14 | 27 | 2.0 | 10,139 | 2.3 | 0.0861 | 6.9 | 0.0340 | 2.3 | 606 | 13 | 675 | 15 |
Table 2.
LA-ICP-MS U-Th-Pb data on bastnaesite standardized with Monazite Standard Moacyr.
| Isotopic Ratios | Apparent Ages | |||||||||||||
|---|---|---|---|---|---|---|---|---|---|---|---|---|---|---|
| Analysis_# | Pb ppm | U ppm | Th ppm | Th/U | 238U/206Pb | Err% | 207Pb/206Pb | Err% | 208Pb/232Th | Err% | 206Pb/238U | Err | 208Pb/232Th | Err |
| S060617b-05 | 2.5 | 20 | 29 | 1.5 | 10,131 | 1.9 | 0.0724 | 5.5 | 0.0338 | 2.1 | 607 | 11 | 673 | 14 |
| S060617b-10 | 9.6 | 29 | 59 | 2.0 | 6489 | 2.1 | 0.4215 | 3.0 | 0.0875 | 1.8 | 924 | 18 | 1696 | 30 |
| S060617b-11 | 9.3 | 14 | 26 | 1.9 | 3622 | 2.3 | 0.5165 | 2.9 | 0.2037 | 1.8 | 1572 | 31 | 3747 | 63 |
| S060617b-12 | 2.5 | 17 | 38 | 2.3 | 10,257 | 2.1 | 0.0934 | 5.4 | 0.0330 | 2.0 | 600 | 12 | 657 | 13 |
| S060617b-19 | 3.3 | 30 | 31 | 1.0 | 10,190 | 1.8 | 0.0647 | 4.9 | 0.0330 | 2.2 | 604 | 10 | 657 | 15 |
| S060617b-23 | 2.1 | 20 | 19 | 0.9 | 10,005 | 1.9 | 0.0613 | 5.9 | 0.0322 | 2.6 | 614 | 11 | 641 | 17 |
| S060617b-24 | 2.7 | 25 | 24 | 1.0 | 10,140 | 1.8 | 0.0591 | 5.0 | 0.0343 | 2.2 | 606 | 10 | 682 | 15 |
| S160617b-02 | 1.9 | 16 | 22 | 1.4 | 10,055 | 2.3 | 0.0695 | 7.5 | 0.0347 | 2.7 | 611 | 13 | 680 | 36 |
| S160617b-03 | 2.0 | 15 | 19 | 1.3 | 9713 | 3.3 | 0.1485 | 8.1 | 0.0418 | 3.9 | 632 | 20 | 1151 | 53 |
| S160617b-05 | 1.2 | 9 | 15 | 1.7 | 9651 | 2.7 | 0.0920 | 8.0 | 0.0328 | 3.1 | 636 | 16 | 852 | 45 |
| S160617b-06 | 2.0 | 13 | 19 | 1.5 | 9135 | 2.8 | 0.1703 | 6.1 | 0.0442 | 3.0 | 670 | 18 | 1292 | 42 |
| S160617b-07 | 1.5 | 13 | 13 | 1.0 | 9570 | 2.4 | 0.0891 | 7.2 | 0.0381 | 3.2 | 641 | 15 | 838 | 40 |
| S160617b-08 | 1.3 | 11 | 16 | 1.4 | 9972 | 2.8 | 0.0804 | 9.2 | 0.0322 | 3.5 | 616 | 17 | 759 | 48 |
| S160617b-11 | 1.3 | 11 | 13 | 1.2 | 10,312 | 2.8 | 0.0885 | 9.0 | 0.0331 | 3.8 | 597 | 16 | 793 | 48 |
| S160617b-13 | 1.4 | 11 | 18 | 1.7 | 9831 | 4.1 | 0.0778 | 14.2 | 0.0339 | 4.6 | 625 | 24 | 749 | 73 |
| S160617b-14 | 1.9 | 15 | 21 | 1.4 | 9609 | 2.2 | 0.0735 | 6.8 | 0.0331 | 2.6 | 638 | 13 | 731 | 35 |
| S160617b-15 | 2.2 | 19 | 25 | 1.3 | 9848 | 2.9 | 0.0822 | 9.1 | 0.0318 | 3.6 | 623 | 17 | 778 | 48 |
| S160617b-16 | 2.5 | 20 | 33 | 1.6 | 10,204 | 2.1 | 0.0744 | 6.3 | 0.0301 | 2.3 | 603 | 12 | 706 | 32 |
| S160617b-17 | 2.2 | 18 | 22 | 1.2 | 9829 | 3.0 | 0.0886 | 9.0 | 0.0337 | 3.9 | 625 | 18 | 820 | 49 |
| S160617b-18 | 2.6 | 21 | 33 | 1.6 | 9816 | 2.2 | 0.0815 | 6.3 | 0.0309 | 2.5 | 625 | 13 | 775 | 33 |
| S160617b-19 | 2.1 | 14 | 33 | 2.4 | 9284 | 2.4 | 0.0922 | 6.9 | 0.0317 | 2.4 | 660 | 15 | 876 | 39 |
| S160617b-20 | 1.7 | 13 | 20 | 1.6 | 9809 | 2.4 | 0.0832 | 7.1 | 0.0366 | 2.5 | 626 | 14 | 786 | 38 |
| S160617b-21 | 2.9 | 21 | 36 | 1.7 | 9745 | 2.0 | 0.0947 | 5.2 | 0.0348 | 2.1 | 630 | 12 | 863 | 29 |
| S160617b-22 | 3.1 | 22 | 38 | 1.8 | 9746 | 2.6 | 0.0788 | 8.1 | 0.0354 | 2.8 | 630 | 16 | 760 | 42 |
| S160617b-23 | 2.7 | 20 | 38 | 1.9 | 10,369 | 2.3 | 0.0625 | 7.5 | 0.0317 | 2.3 | 594 | 13 | 614 | 34 |
| S160617b-24 | 1.5 | 12 | 13 | 1.1 | 9671 | 2.6 | 0.0880 | 7.7 | 0.0331 | 3.5 | 634 | 15 | 826 | 42 |
Table 3.
LA-ICP-MS U-Th-Pb data on bastnaesite standardized with Calcite Standard WC-1.
| Analysis # | 207Pb/206Pb | Err% | 238U/206Pb | Err% |
|---|---|---|---|---|
| S160617a-01.d | 0.510 | 2.4 | 5.89 | 9.4 |
| S160617a-02.d | 0.435 | 5.1 | 6.58 | 12.8 |
| S160617a-03.d | 0.323 | 6.3 | 7.04 | 9.5 |
| S160617a-04.d | 0.502 | 3.6 | 4.78 | 10.0 |
| S160617a-05.d | 0.690 | 6.5 | 2.57 | 12.6 |
| S160617a-06.d | 0.122 | 2.7 | 9.55 | 9.1 |
| S160617a-08.d | 0.161 | 4.3 | 8.94 | 9.4 |
| S160617a-09.d | 0.089 | 3.7 | 9.82 | 9.3 |
| S160617a-11.d | 0.201 | 4.0 | 8.64 | 9.5 |
| S160617a-12.d | 0.137 | 11.7 | 9.55 | 9.6 |
| S160617a-13.d | 0.190 | 2.5 | 9.92 | 9.4 |
| S160617a-14.d | 0.478 | 3.9 | 5.26 | 10.3 |
| S160617a-15.d | 0.292 | 7.0 | 7.91 | 9.5 |
| S160617a-16.d | 0.077 | 1.0 | 10.52 | 9.5 |
| S160617a-17.d | 0.083 | 10.8 | 10.51 | 9.5 |
| S160617a-18.d | 0.090 | 1.9 | 10.64 | 9.0 |
| S160617a-19.d | 0.226 | 3.3 | 8.73 | 9.6 |
| S160617a-20.d | 0.072 | 2.3 | 10.75 | 9.1 |
| S160617a-21.d | 0.577 | 1.8 | 4.48 | 11.0 |
| S160617a-22.d | 0.335 | 10.1 | 6.58 | 11.8 |
| S160617a-23.d | 0.181 | 3.3 | 9.28 | 9.3 |
| S160617a-24.d | 0.087 | 9.8 | 10.29 | 9.8 |
| S160617a-25.d | 0.093 | 4.8 | 10.18 | 9.2 |
| S160617a-26.d | 0.080 | 0.8 | 10.38 | 9.3 |
| S160617a-27.d | 0.069 | 0.7 | 10.47 | 9.4 |
| S160617a-28.d | 0.320 | 4.1 | 7.72 | 9.7 |
© 2018 by the authors. Licensee MDPI, Basel, Switzerland. This article is an open access article distributed under the terms and conditions of the Creative Commons Attribution (CC BY) license (http://creativecommons.org/licenses/by/4.0/).
Share and Cite
MDPI and ACS Style
Ntiharirizwa, S.; Boulvais, P.; Poujol, M.; Branquet, Y.; Morelli, C.; Ntungwanayo, J.; Midende, G. Geology and U-Th-Pb Dating of the Gakara REE Deposit, Burundi. Minerals 2018, 8, 394. https://doi.org/10.3390/min8090394
AMA Style
Ntiharirizwa S, Boulvais P, Poujol M, Branquet Y, Morelli C, Ntungwanayo J, Midende G. Geology and U-Th-Pb Dating of the Gakara REE Deposit, Burundi. Minerals. 2018; 8(9):394. https://doi.org/10.3390/min8090394
Chicago/Turabian StyleNtiharirizwa, Seconde, Philippe Boulvais, Marc Poujol, Yannick Branquet, Cesare Morelli, Joël Ntungwanayo, and Gilbert Midende. 2018. "Geology and U-Th-Pb Dating of the Gakara REE Deposit, Burundi" Minerals 8, no. 9: 394. https://doi.org/10.3390/min8090394
Note that from the first issue of 2016, this journal uses article numbers instead of page numbers. See further details here.