Water Adsorption on the β-Dicalcium Silicate Surface from DFT Simulations


1
State Key Laboratory of Materials-Oriented Chemical Engineering, College of Materials Science and Engineering, Nanjing Tech University, Nanjing 210009, China
2
Condensed Matter Physics Department, University of the Basque Country, UPV/EHU, 48080 Bilbao, Spain
3
Molecular Spectroscopy Laboratory, Department of Physical Chemistry, University of the Basque Country, UPV/EHU, 48080 Bilbao, Spain
*
Authors to whom correspondence should be addressed.
Minerals 2018, 8(9), 386; https://doi.org/10.3390/min8090386
Submission received: 1 August 2018
/
Revised: 26 August 2018
/
Accepted: 28 August 2018
/
Published: 4 September 2018
(This article belongs to the Special Issue Molecular Simulation of Mineral-Solution Interfaces)
Abstract
:β-dicalcium silicate (β-Ca2SiO4 or β-C2S in cement chemistry notation) is one of the most important minerals in cement. An improvement of its hydration rate would be the key point for developing environmentally-friendly cements with lower energy consumption and CO2 emissions. However, there is a lack of fundamental understanding on the water/β-C2S surface interactions. In this work, we aim to evaluate the water adsorption on three β-C2S surfaces at the atomic scale using density functional theory (DFT) calculations. Our results indicate that thermodynamically favorable water adsorption takes place in several surface sites with a broad range of adsorption energies (−0.78 to −1.48 eV) depending on the particular mineral surface and adsorption site. To clarify the key factor governing the adsorption of the electronic properties of water at the surface were analyzed. The partial density of states (DOS), charge analysis, and electron density difference analyses suggest a dual interaction of water with a β-C2S (100) surface including a nucleophilic interaction of the water oxygen lone pair with surface calcium atoms and an electrophilic interaction (hydrogen bond) of one water hydrogen with surface oxygen atoms. Despite the elucidation of the adsorption mechanism, no correlation was found between the electronic structure and the adsorption energies.
1. Introduction
Hydration and dissolution of crystals have a profound impact on a broad range of scientific and technological processes such as thermochemical energy storage [1,2], geochemical phenomena at the mineral/water interfaces [3,4,5], and durability of glasses and biomaterials [6]. A prominent technological application of crystal dissolution is the production of cement and concrete. Cement, as the “adhesive” in concrete, is used worldwide in social infrastructures including military and civil buildings. Cement is the most consumed manufactured material. The clinker hydration is the crucial step that controls the final properties of cement materials and the hydration process of cement minerals despite the long-lasting research [7]. Due to the large amount of CO2 emissions and energy consumption in cement industry and the increasing demand, understanding cement hydration mechanisms is urgently needed to supply an academic basis for the design of new environmentally-friendly cements. A great candidate to achieve this objective is Belite. Belite (β-dicalcium silicate and β-C2S in cement chemistry notation) is an artificial orthosilicate that forms during the sintering of the cement clinker. However, it has a natural counterpart called Larnite [8] that appears in natural environments. It is one of the most important minerals in the cement industry and has potential advantages for achieving the low carbon emission goal due to its lower sintering temperature and low calcium carbonate resource compared to tricalcium silicate, which is the base component of traditional cements. However, the low hydration rate of belite restricts its engineering applications. Until now, the experimental endeavors conducted to improve its hydration [9,10,11,12] have had very limited success.
In such a scenario, atomistic simulations are a valuable tool as a complement to experiments in order to study the hydration mechanism of materials as they have demonstrated for ionic solids [13], metallic oxides [14,15], minerals [16,17,18], or ceramics [19]. Regarding cement, atomistic simulations have been mainly used to investigate tricalcium silicate [20,21,22,23,24,25,26], which is the main component of cement, and much less attention has been paid to β-C2S [27,28,29]. In this article, we aim to investigate the interaction between β-C2S surface and water molecules from a fundamental point of view using Density Functional Theory (DFT) simulations. While dissolution is a very complex problem influenced by many microscopic and macroscopic factors that are not taken into account, the atomic scale interaction is the first step that will determine dissolution. Therefore, the results obtained in this study will help us understand some fundamental factors that govern β-C2S/water interaction.
2. Materials and Methods
2.1. Model Construction
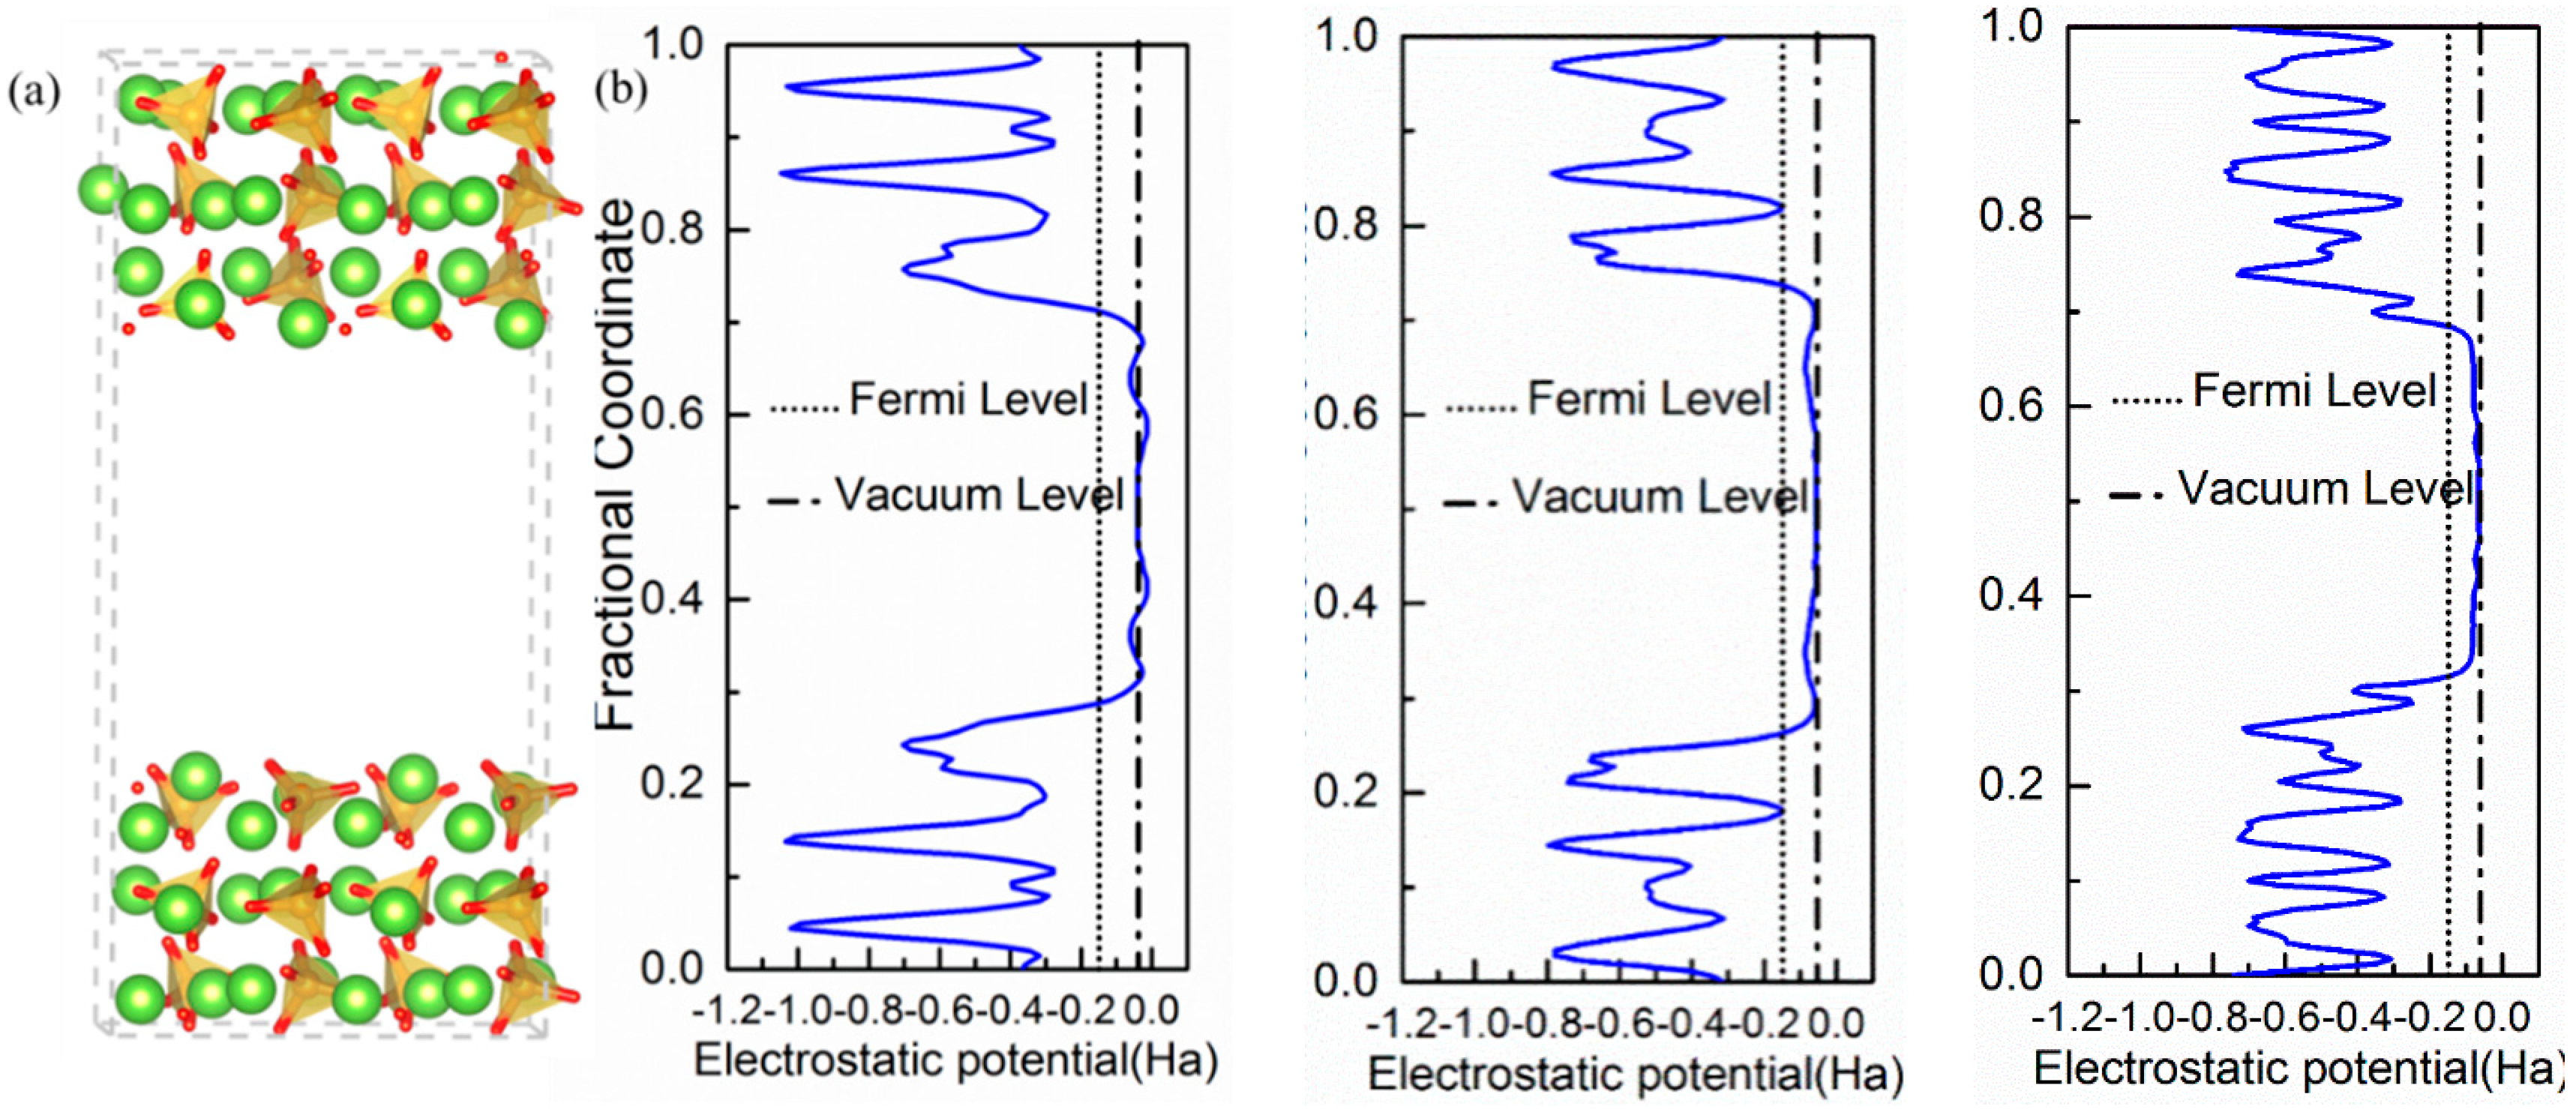
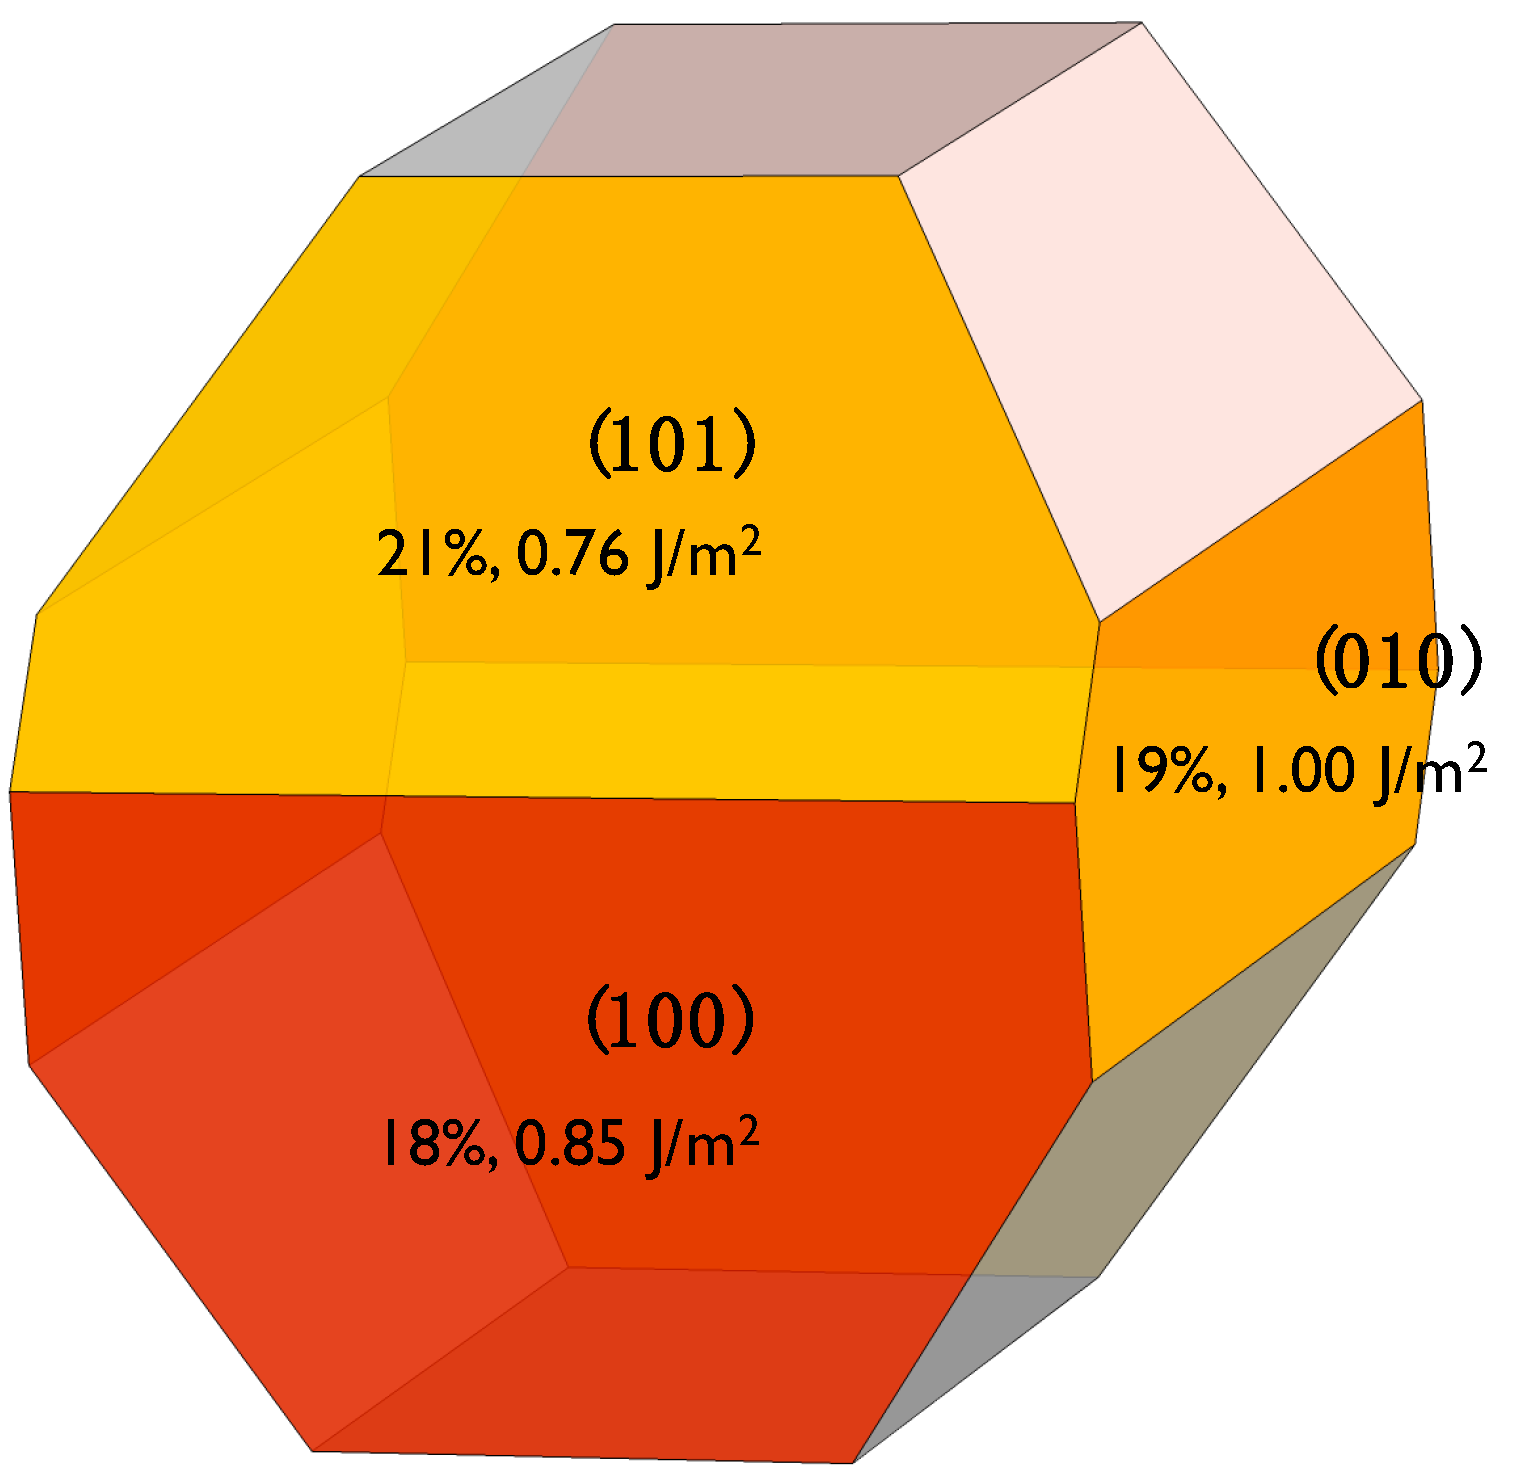
The crystal structure of β-C2S resolved by Mumme [30] was used as the starting point. Based on previous DFT studies [27,28], we decided to use the (100), (101), and (010) surfaces to investigate water adsorption. Analyzing the crystal Wulff’s crystal reconstruction shown in Appendix A, we observed that the contribution of these three surfaces to the equilibrium shape’s total surface area is nearly the same at ~20% and, hence, they account for 60% of the total crystal’s surface. The three surfaces were cleaved through an appropriate plane to generate Tasker type I slabs, i.e., symmetrical surfaces without macroscopic dipolar moments that lead to spurious results and instabilities. The dipole neutrality can be checked by looking at the projection of the electrostatic potential along the perpendicular direction to the surfaces shown in Figure 1. For the three surfaces, the electrostatic potentials of the upper and bottom surfaces are symmetrical with a considerable change at the interface where it becomes wider as it extends to the vacuum region. In the middle of the vacuum layer (10 Å thick in all cases), the electrostatic potential matches the vacuum level energy, which indicates that there is no interaction between the upper and lower surfaces. Therefore, the vacuum layer thickness is enough to avoid self-interactions and the net dipole moment is zero in the three slabs. The final area and thickness of the slabs with dimensions are shown in Table 1.
2.2. Computational Details
The DMol3 density functional theory (DFT) package [31] was employed to study the interaction between the slab model and the water. The exchange-correlation is treated in the generalized gradient approximation (GGA) with the Perdew-Burke-Ernzerhof (PBE) functional [32]. The treatment for the core electrons is the all electrons method. A double ζ plus polarization (DZP) basis set is used with a global orbital cut-off radius of 5.5 Å. The orbital smearing parameter is set to 0.01 eV to balance precision and computing performance. The k-point grid in the first Brillouin zone is constructed using the Monkhorst-Pack method [33] with a 2 × 2 × 1 k-points grid. Self-consistent iteration convergence precision is set to 2.5 × 10⁻⁵ eV, the energy convergence tolerance is set to 2.5 × 10⁻⁴ eV, and the maximum stress is set to be lower than 0.05 eV/Å. During the surface relaxation process, a maximum displacement of 0.005 Å of atoms at each step was allowed and the middle of the slab (6.5 Å from each surface) atoms were fixed.
The adsorption energies are computed by placing a single water molecule above one of the surfaces at an initial distance of ~2 Å. The surface sites were chosen based on a surface sampling of the adsorption energies done at the empirical level with ReaxFF [28]. Once the configurations were set, an energy minimization was done at the DFT level and the adsorption energy was computed with the following expression.
Therefore, the more negative the value is, the more favorable the adsorption site is. Furthermore, an external additional potential was applied to correct macroscopic dipole formation when water molecules are present [34].
3. Results
3.1. Water Adsorption Conformation on β-C2S Surfaces and Bonding Scheme
The surface structure of β-C2S is quite irregular with Ca and O ions of different symmetry present, silicate ions arranged with different orientations, and a considerable roughness. Therefore, it is more difficult to define “a priori” the water adsorption points on the surface than for symmetrical metal oxides such as TiO2, CaO, MgO [14,36,37], or two-dimensional materials such as Ti2C [19]. In a previous work [28], water adsorption sites were exhaustively searched using empirical force field simulations for the (100) surface. Using that information, we have targeted the most favorable adsorption sites of water at β-C2S and performing an energy minimization on the force field final configuration for each adsorption configuration. The process has been repeated for the (010) and (101) surfaces.
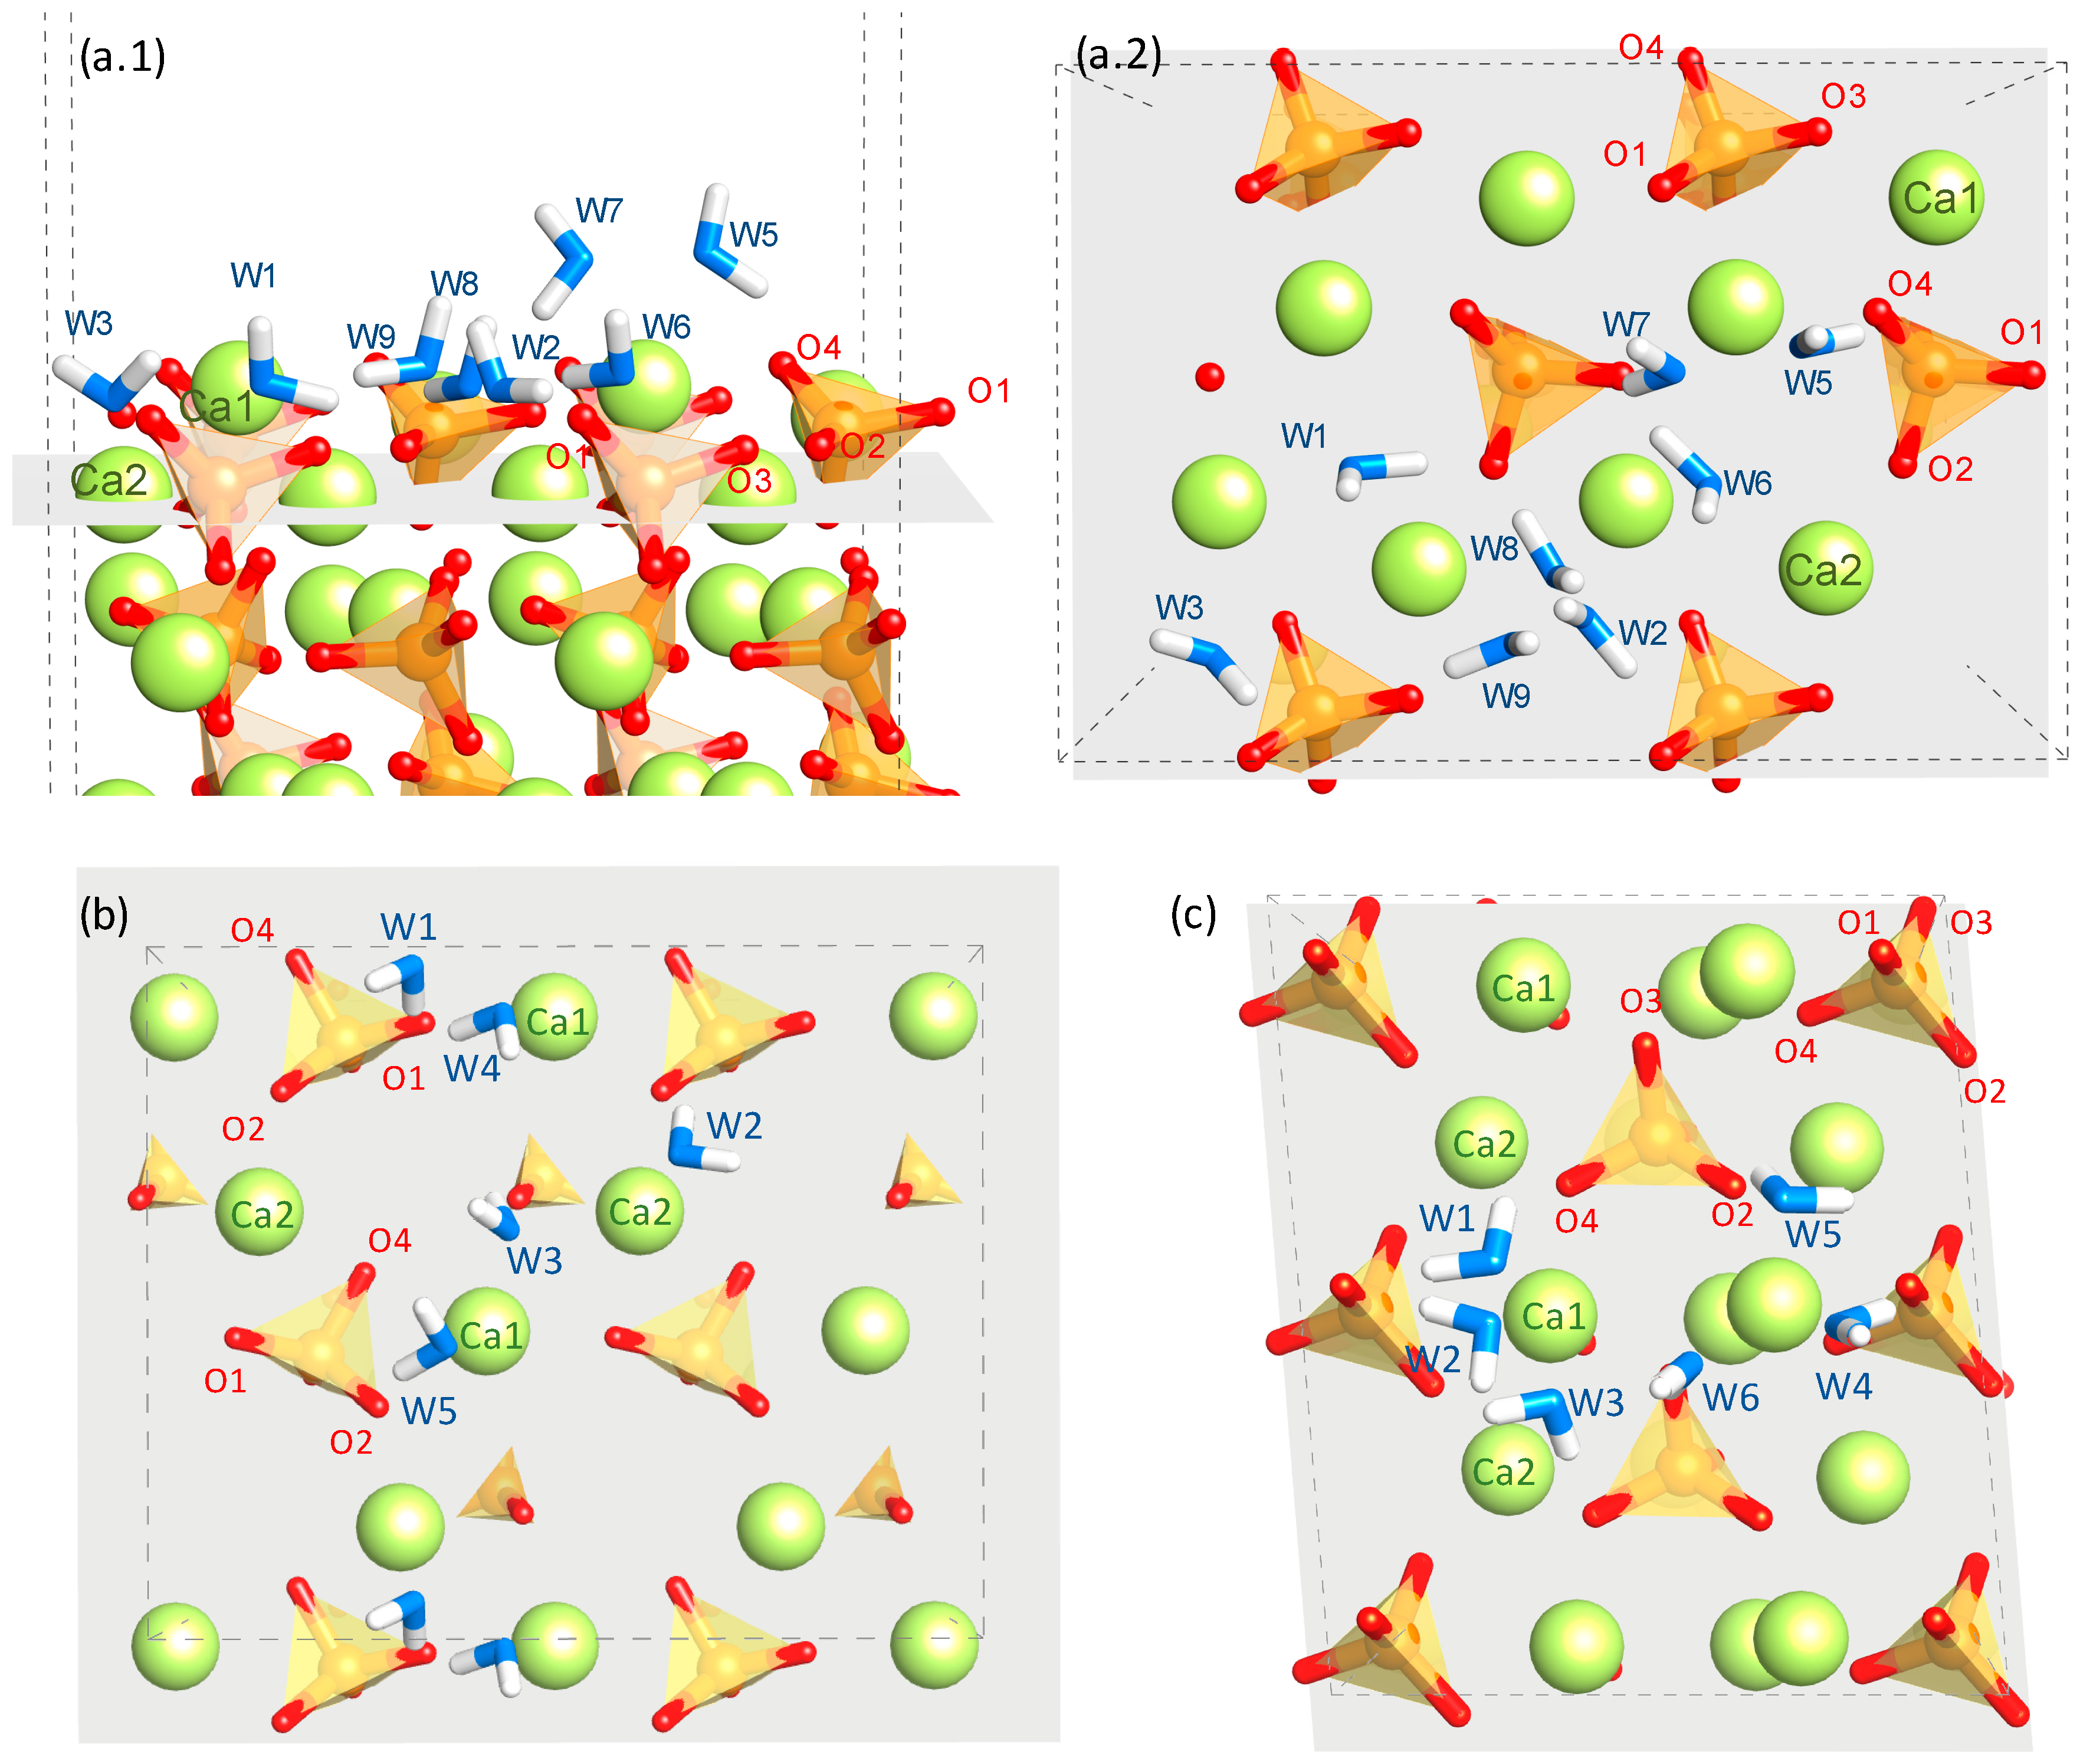
The investigated sites are shown in Figure 2 and the corresponding adsorption energies are shown in Table 2. In general, water is adsorbed in a configuration with the oxygen atom O(w) coordinated to surface calcium atoms Ca and one of its hydrogen atoms H(w) pointing towards the surface and forming a hydrogen bond with oxygen atoms O(s) from the surface silicate groups. The adsorption energies vary in a range from −0.78 to −1.47 eV, which indicates that the surfaces are considerably hydrophilic and adsorption is energetically favorable [38]. The dispersion in the adsorption energy for each surface and the comparison with other orthosilicates will be discussed in Section 4. In all the reported adsorption sites, the water molecule establishes a single hydrogen bond with O(s) atoms and with bond lengths smaller than 1.75 Å and H(w)–O(w)–O(s) angles below 24°. In water, hydrogen bond distances and angles are typically larger at about 1.9 Å and less than 35°, respectively [39,40]. Since the hydrogen bond length and strength are usually correlated [39], this suggests a strong hydrogen bond between water and the belite surface. Regarding the Ca–O(w) distance, we found that the coordination distances of Ca–O(w) on the interface are below 2.8 Å, which match with the Ca–O coordination distance on bulk β-C2S [30].
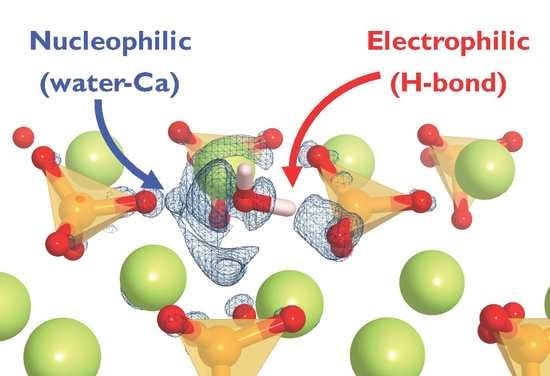
Based on the described conformations, we can suggest a bonding scheme in which β-C2S suffers simultaneously both a nucleophilic and an electrophilic attack from water [22,29]. The Ca is an electron acceptor from the O(w) electron donor and the O(s) is an electron donor (or proton acceptor) to the H(w) electron acceptor, which forms a hydrogen bond. However, it is quite complex to correlate the magnitude of the adsorption energy as a function of the conformation adopted by water at the surface. Hence, it is necessary to analyze the electronic properties of the adsorbate/substrate system to understand the water adsorption mechanism on the surface.
3.2. Charge Population Analysis
A Hirshfield population analysis [41] was performed to investigate the atomic charge transfer between the water molecule and the surface. Table 2 gives the computed charges on the water molecule atoms for the adsorption sites as well as the charges on the surface atoms. Compared with the isolated water molecule, the absolute values of the Hirschfeld charges on the water oxygen atoms have decreased in all the adsorption configurations. It suggests electron transfer from O(w) to Ca(s) as we proposed before. Regarding the water hydrogen atoms, we can first observe an anisotropy in their charges due to the formation of a single hydrogen bond between a water and surface oxygen atom. The H(w) involved in the hydrogen bond is an electron acceptor from the surface O(s). Therefore, it decreases its positive charge from 0.151 to an average value of 0.105. The remaining hydrogen, pointing towards the vacuum, increases its charge possibly due to intramolecular electron withdrawal from the O(w), which has donated electrons to the surface. The trend of the Hirshfeld population on the β-C2S (100) surface atoms involved in the adsorption corroborate the changes described for the water molecules. There is a positive charge decrease on Ca(s) due to the electron transfer from O(w) and a negative charge decrease on the O(s) due to the electron transfer to the H(w).
The Hirshfeld population analysis interpretation matches with the proposed bonding scheme. Depending on the specific adsorption site, there is a net positive or negative charge on the adsorbed water molecule. A positive charge indicates that the electron depletion of the O(w) donor is more important than the electron surfeit of the H(w) and a negative charge of the opposite. Hence, the population analysis suggests that the main interaction in the water adsorption can be the O(w)–Ca ionic interaction or the hydrogen bond depending on the specific site. If we compare the binding energy when the hydrogen bond is the main contribution with the one in bulk water, 0.22 eV [42,43], we can suggest that the water/surface is considerably stronger than a typical water–water interaction.
3.3. Partial Density of States
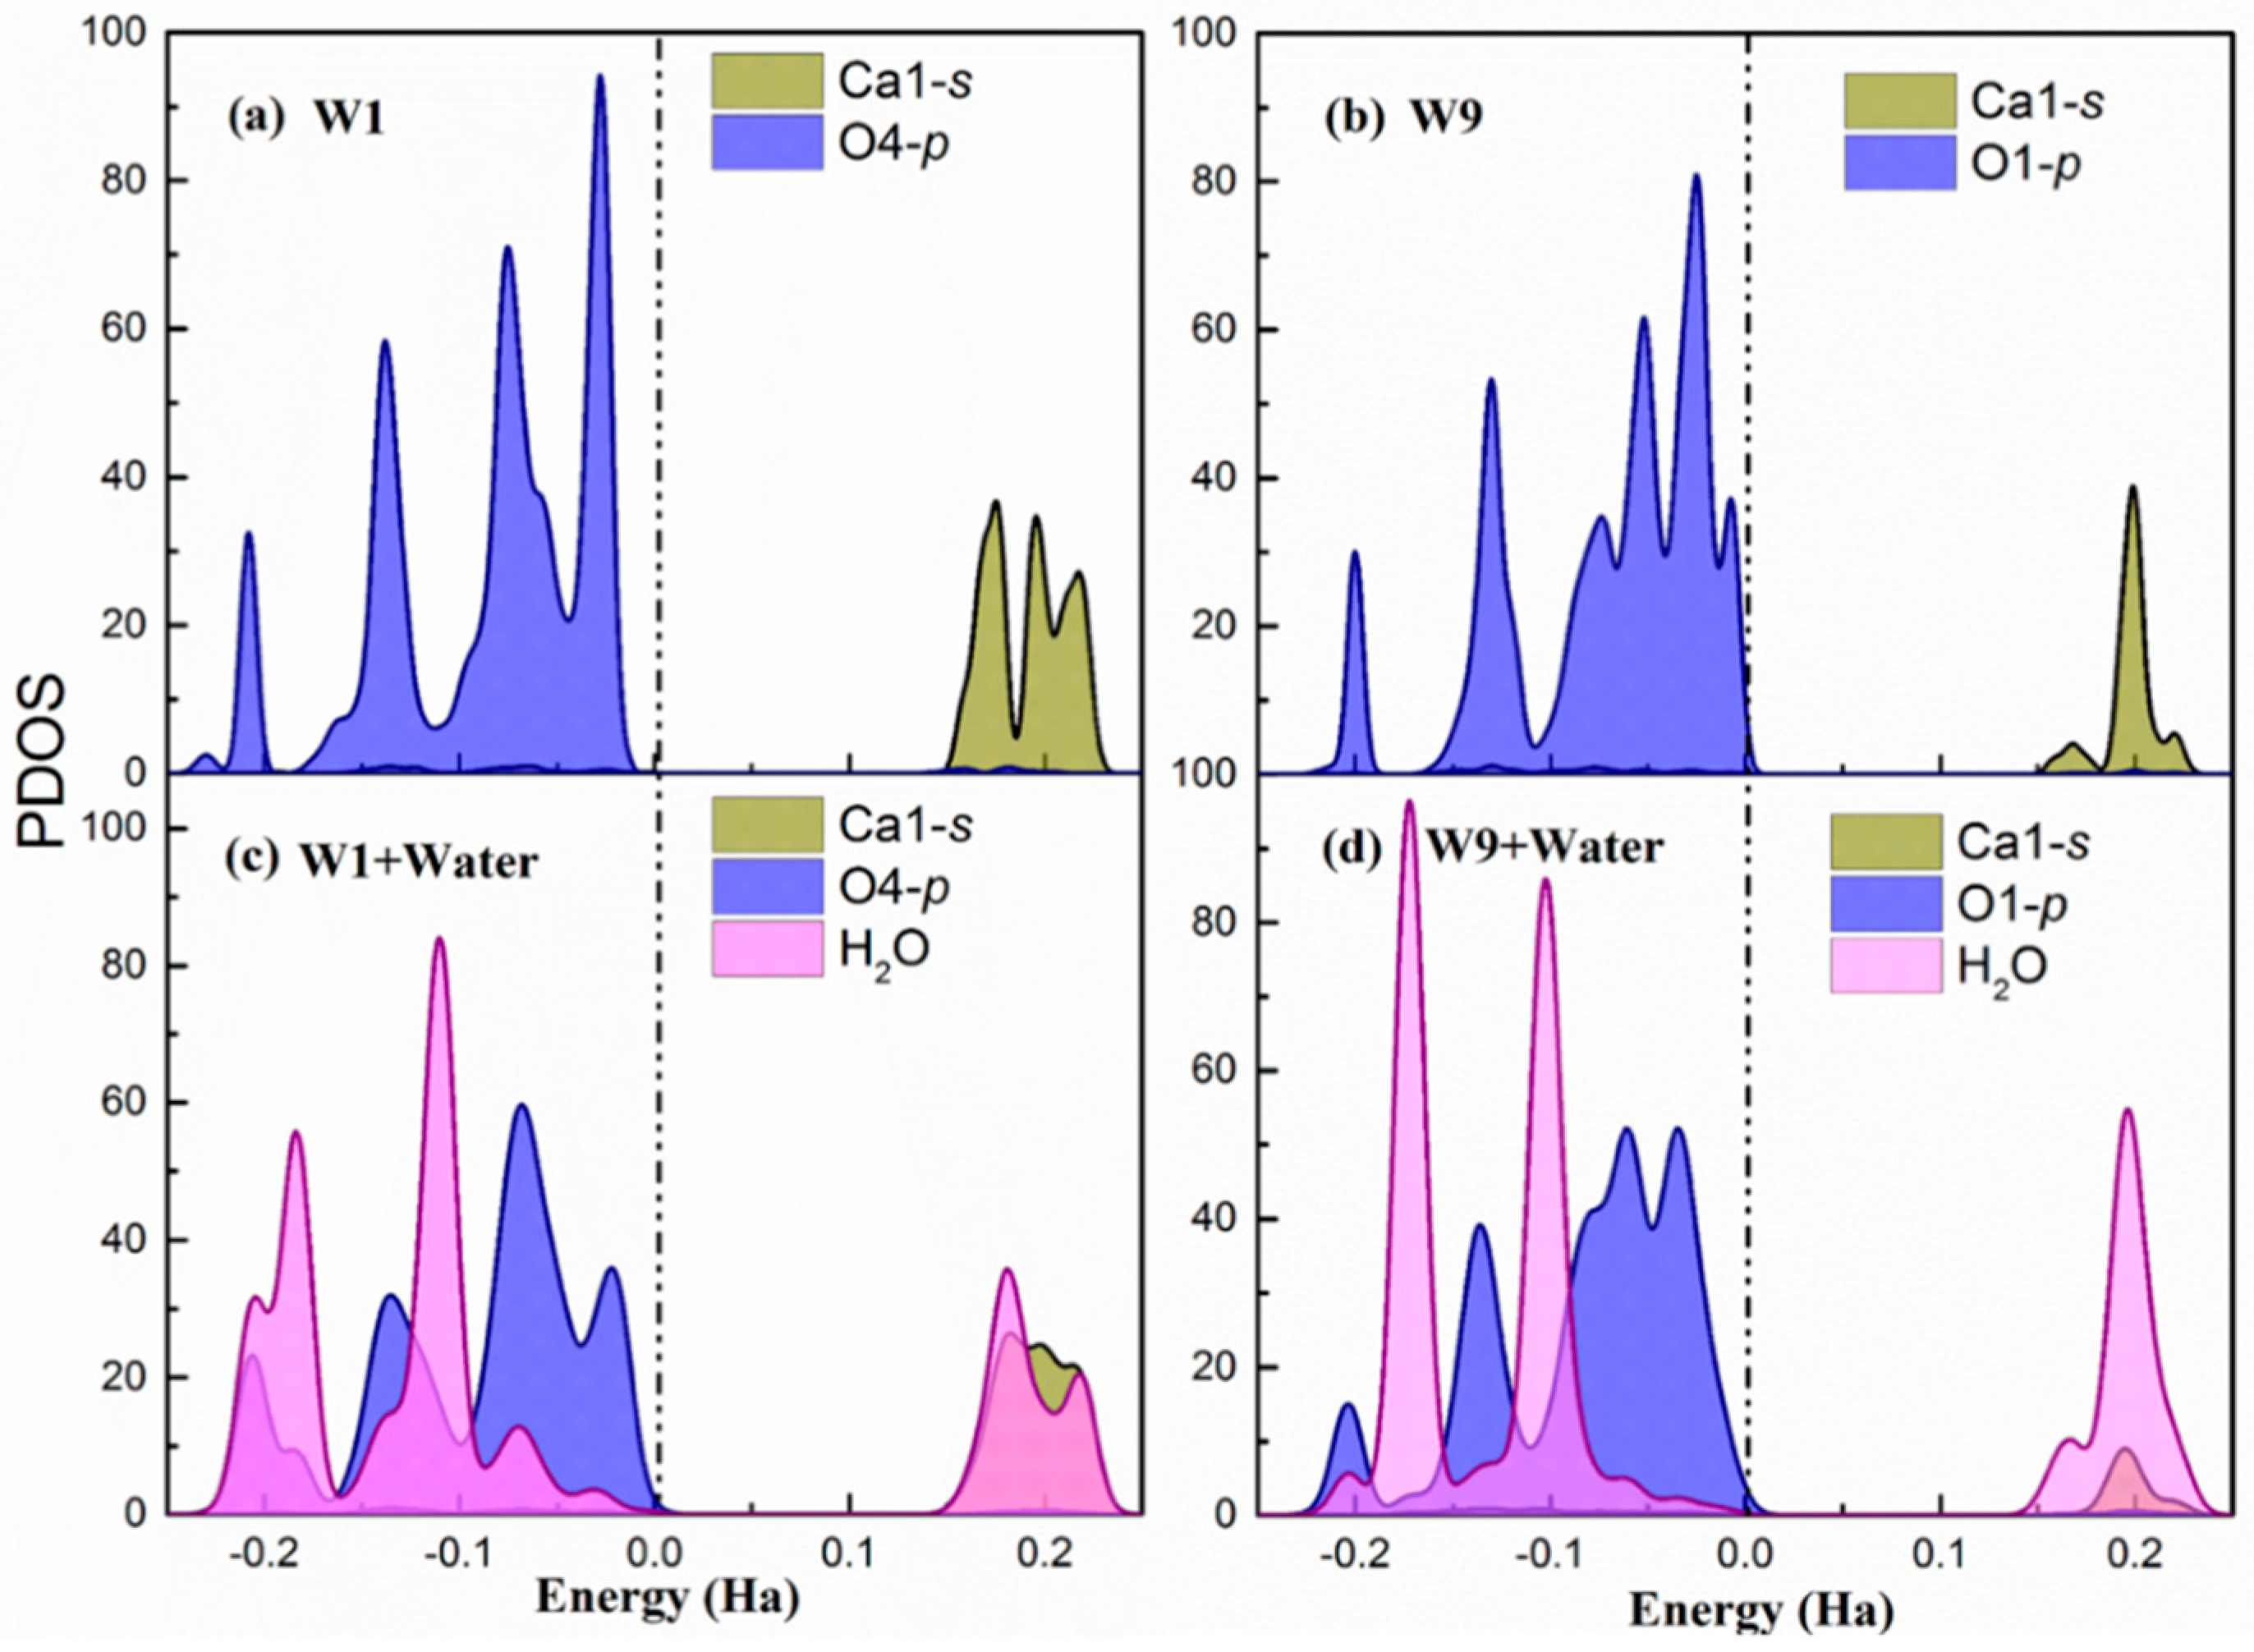
Hirshfeld population analysis reveals a net electron transfer from the water molecules to the surface. For further understanding of the process, the partial density of states (PDOS) of the Ca(s) and O(s) atoms involved in the highest adsorption energy site (W1) and the lowest adsorption energy site (W9) are presented in Figure 3 before and after water adsorption. Figure 3 shows only the results for the (100) surface. However, the behavior is the same for the other two studied cleavages and the PDOS are included in Appendix B.
In both sites, the p-orbitals from surface O atoms are the most significant states contributing to the valence band maximum (VBM). This indicates that the under-coordinated dangling oxygen atoms on the surface localize the electronic charge and are susceptible for suffering an electrophilic attack from water and donate electrons. Regarding the conduction band minimum (CBM), there is a larger contribution of Ca1-s unoccupied states in the of W1 and W9 sites. Hence, the surface Ca atoms are prone of suffering a nucleophilic attack and accept electrons. Therefore, the PDOS of the bare surface matches again with the suggested bonding scheme. Overall, the contribution of oxygen p-states to the VBM and the calcium s-states to the CBM is stronger in the W1 sites, which makes them more favorable both for electrophilic and nucleophilic attack. This is a perfect situation for the adsorption of water molecules, which can be seen from its corresponding adsorption energy.
After water chemisorption, the orbitals of the water molecule are hybridized with both O-p VBM and Ca-s CBM states of the surfaces, which is shown in Figure 3c and Figure 3d, respectively. Furthermore, in the W1 site, the CBM is distributed both in the Ca-s and H(w) unoccupied states while, in the W9, it is strongly localized in the water hydrogen atoms. This suggests that the H(w) in the W9 has not established a strong hydrogen bond with the O(s) and, therefore, still has the capacity to accept electrons. In fact, the Hirsfeld charge on the H(w) at the W9 site has a lower decrease with respect to the isolated water, which confirms this interpretation. Again, these findings agree with the bonding scheme proposed from previous analysis and give an explanation of the more favorable water adsorption in W1 than W9 sites.
3.4. Chemical Bonding from Charge Density Difference Analysis
To complete the characterization of chemical bonding and charge transfer, we move forward to study the spatial electron density distribution before and after the water adsorption from an electron density difference, Δρ, which is calculated from the formula below.
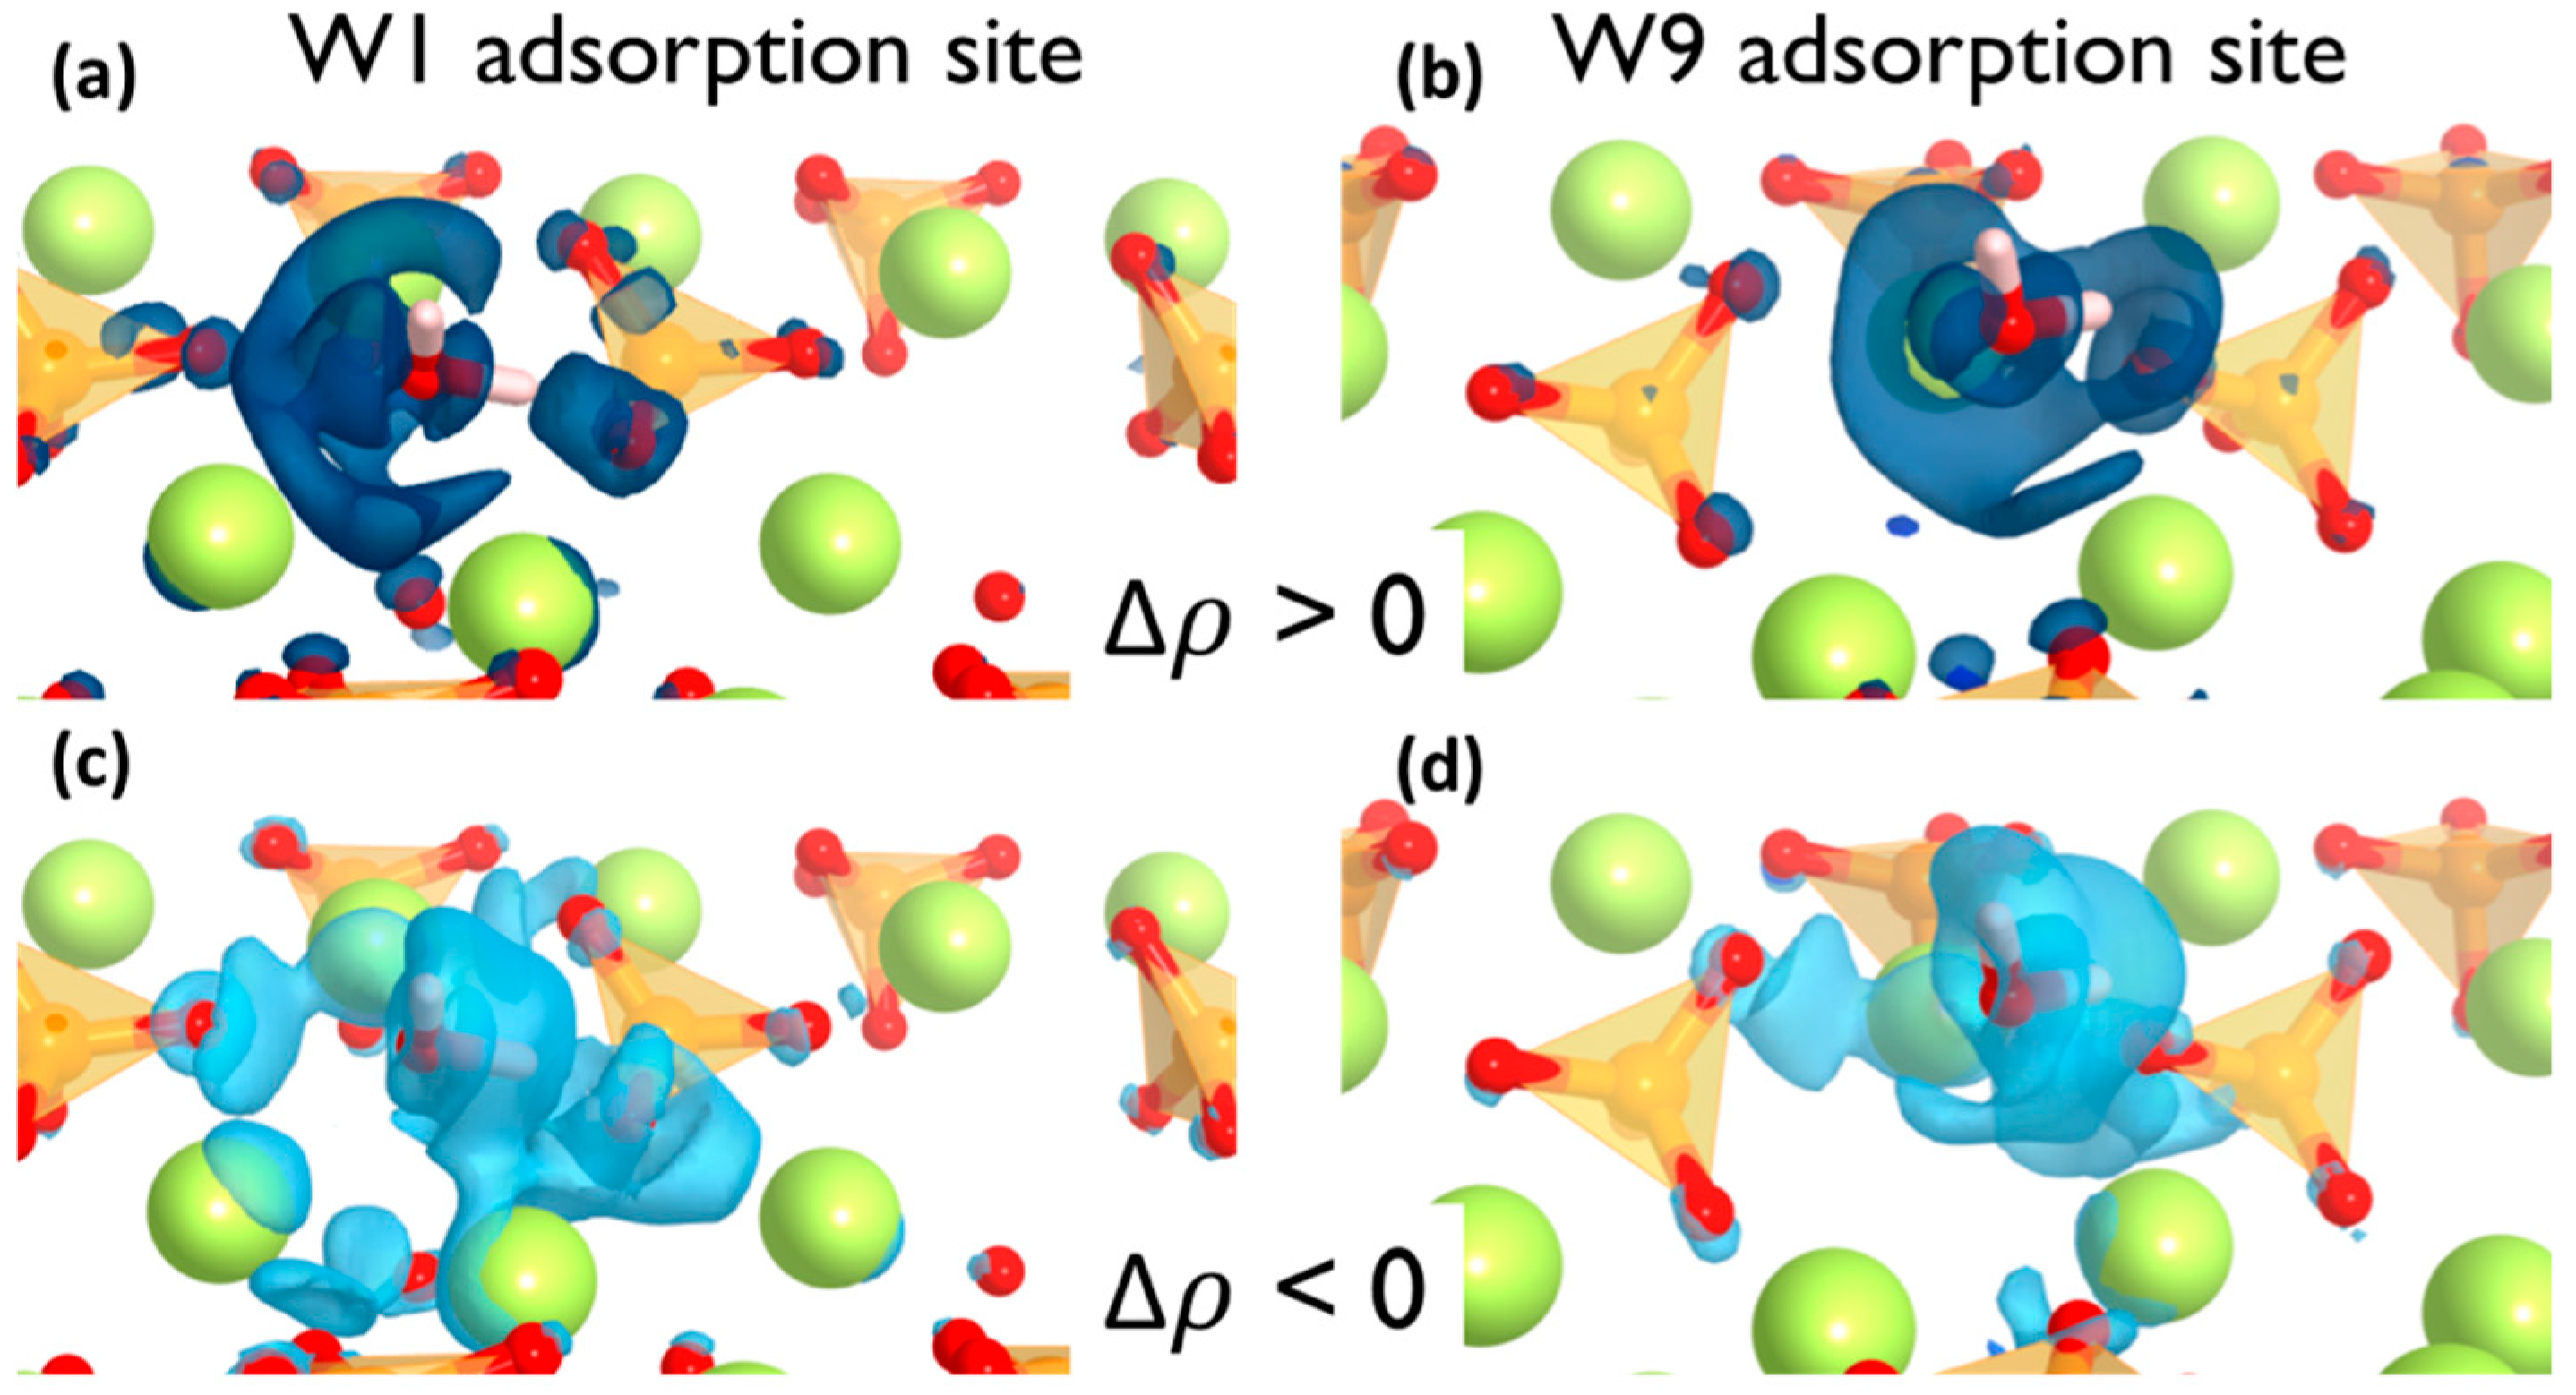
where ρH2O+surf represents the electron density distribution of the water adsorbed on the surface and ρH2O and ρsurf are the electron densities of individual water molecules and pure surface, respectively. Accordingly, a positive Δρ value in a point indicate a lower electronic density after water adsorption due to electron density depletion and negative values have a higher electronic density due to the electron density surfeit. The electron density difference was plotted in Figure 4 where light and dark blue isosurfaces represent the Δρ < 0 and > 0, respectively.
It can be observed that the electron density around the adsorption points of the surface is significantly polarized after the water adsorption. Yet the effect is local and only the atoms involved in the adsorption site are affected. In both cases, the situation is similar. There is a localized electronic density depletion in the O(s) atoms that forms the hydrogen bond as well as a more delocalized depletion in the area of the water oxygen lone pair. On the other hand, the electronic density increment on the H(w) atoms and the Ca(s) atoms are shown in Figure 4c,d. It must be noted that the electron density surfeit takes place in more than one Ca atoms from the surface, which means the adsorption site involves an ionic interaction with more than one Ca atom from the surface. From the charge density isosurfaces, it is apparent that the charge transfer is more pronounced on the W1 sites in comparison with the W9 sites, which aligns with the Hirshfeld populations, the PDOS analysis, and the computed adsorption energies.
The findings are consistent with the suggested electrophilic–nucleophilic dual adsorption scheme, i.e., the H(w) is an electron acceptor from the surface O and the O(w) is an electron donor to surface Ca atoms.
4. Discussion
The “results” section has been focused on a detailed description of the electronic nature of the water adsorption on three β-belite surfaces. The basic mechanism consists on a simultaneous nucleophilic and electrophilic interaction of water oxygen and hydrogen atoms with the β-C2S calcium and oxygen atoms, respectively. However, we could not find a clear correlation between the electronic structure, atomic charges, adsorption configuration, and adsorption energies. To gain a useful insight, it is interesting to compare the adosrption energies between different surfaces and with other related minerals.
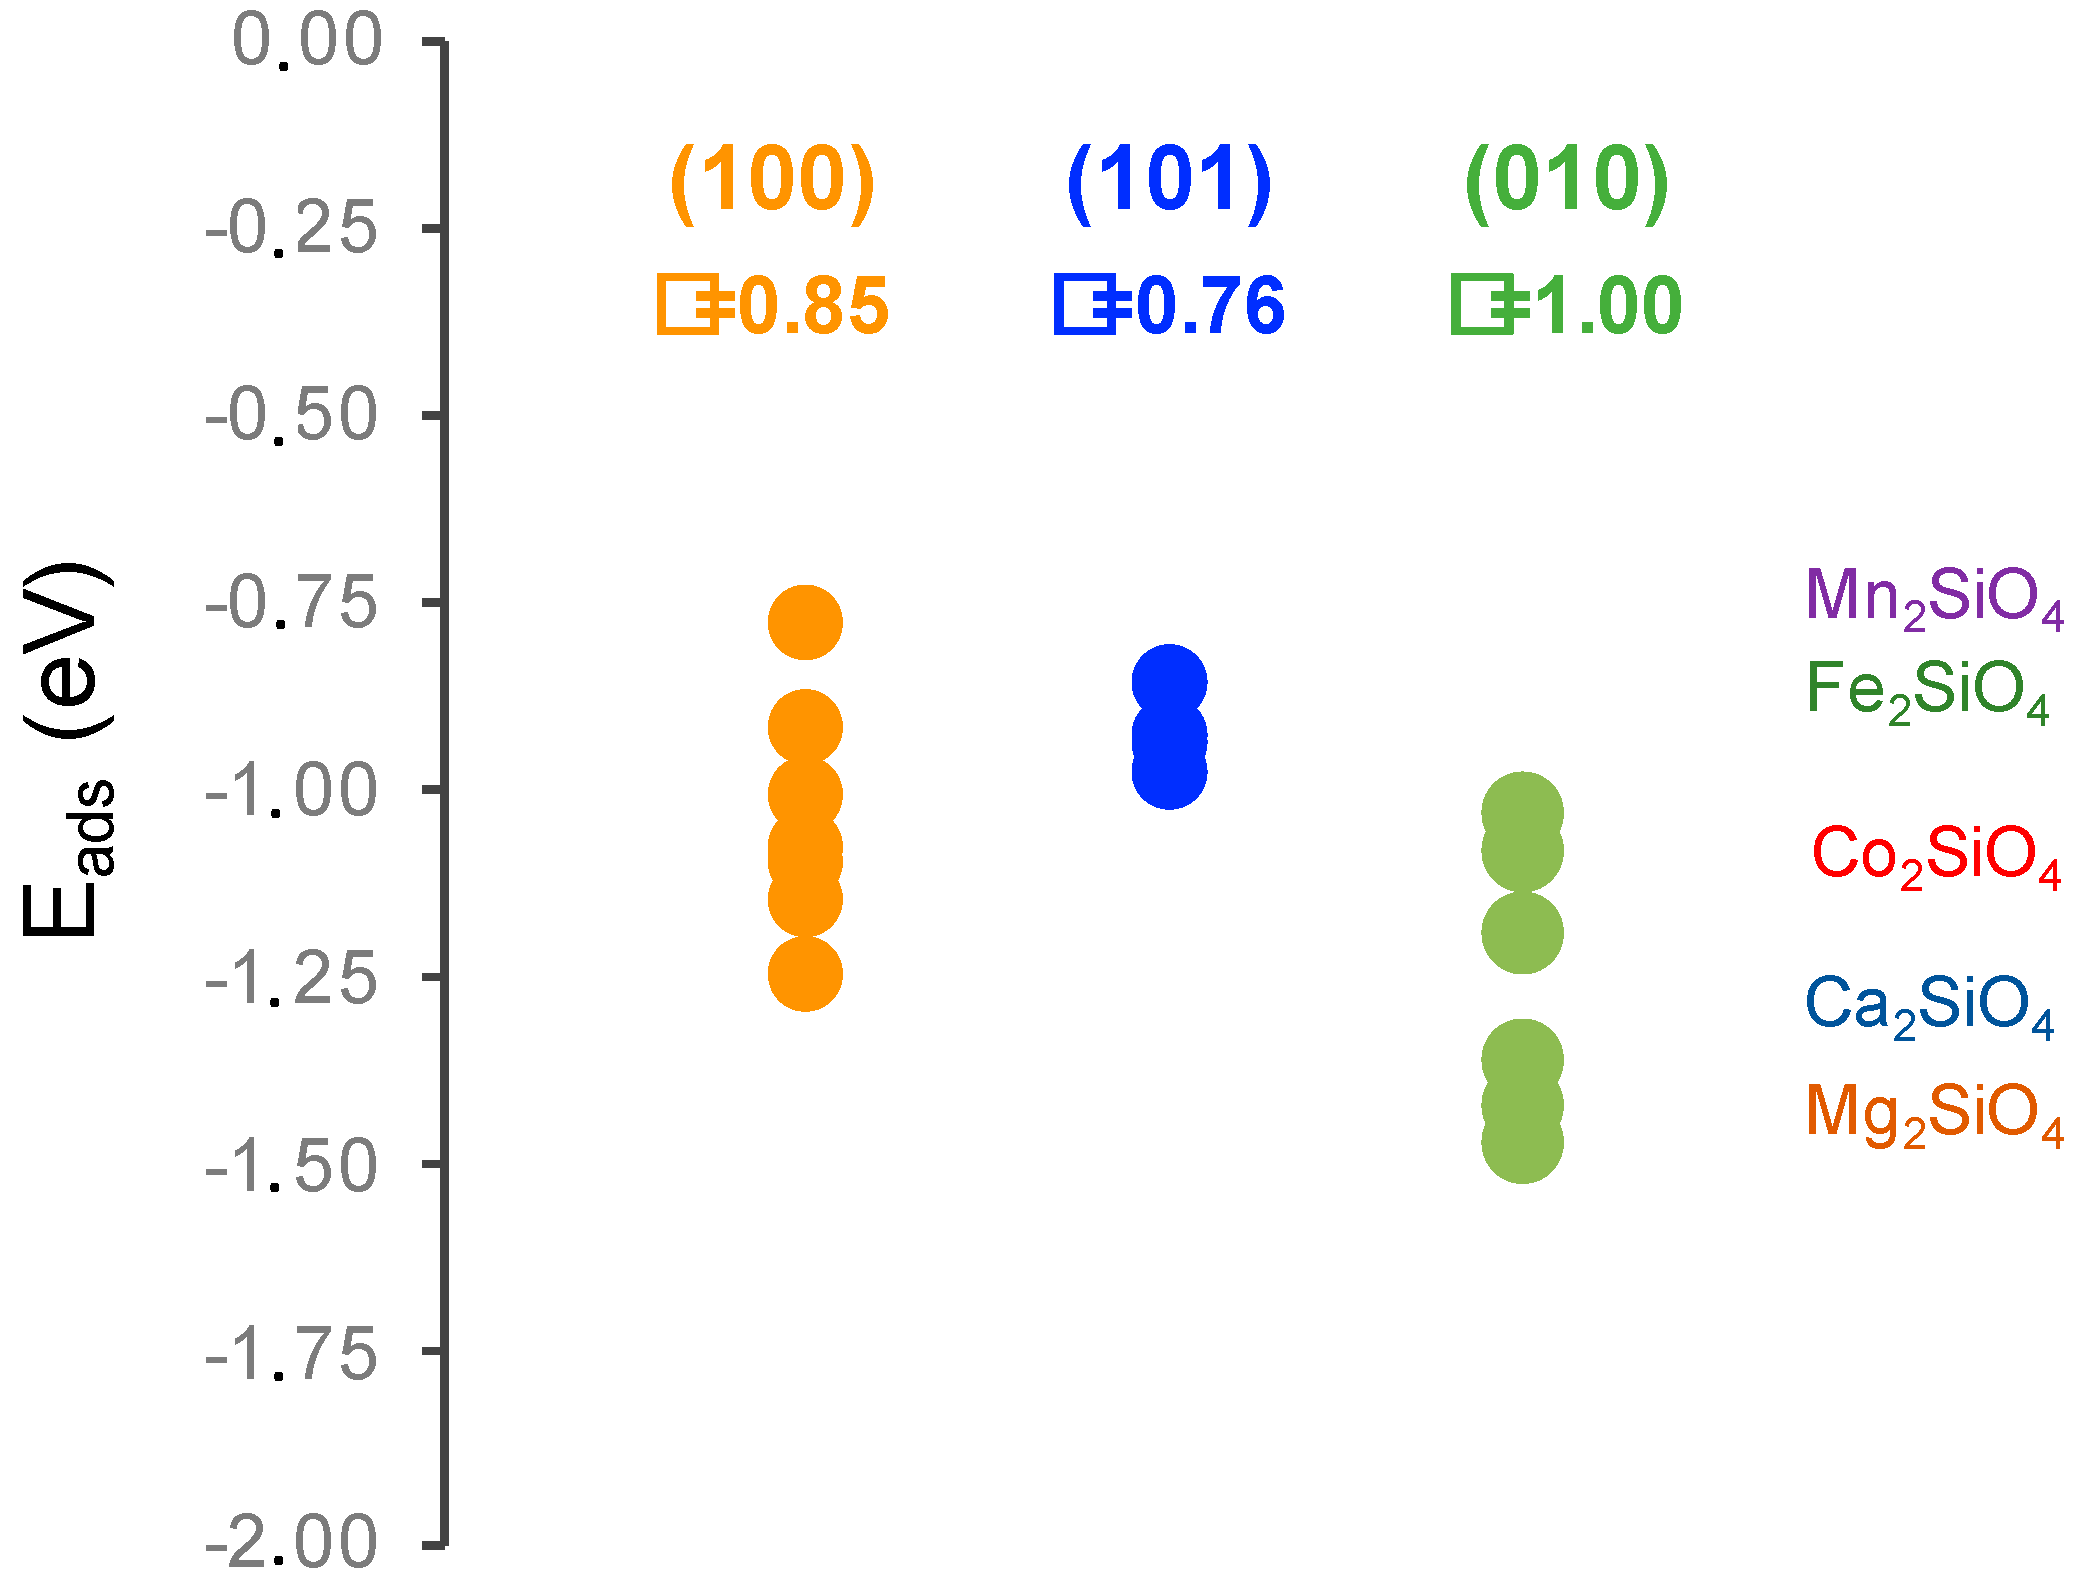
The water adsorption energy on the three studied surfaces are within the same range from 0.75 to 1.50 eV, which are always favorable. The adsorption energies on the (101) are more homogeneous than in the (100) and (010), but no clear reason was found. If we consider the average energy value for each surface, we can see that the higher the surface energy is, the higher the adsorption energy is. Such a correlation could be intuitive since lower surface energies may indicate higher stability and could be less prone to adsorb molecules. However, looking at the different sites, the picture is more complex as the energies are dispersed and the ranges overlap. Overall, we cannot conclude that, among the studied surfaces, there is preferred one for water adsorption, so the attack of water to β-C2S may be homogeneous.
The adsorption energies can be compared with those reported by DFT for the olivine family of orthosilicates by Kerisit et al. [44], see Figure 5. These results correspond to the adsorption energy of a single water molecule adsorption per unit cell in two configurations, flat and side, always in the (010) surface. For the olivine family, different adsorption energies were found depending on the cation increase following the series Mn < Fe < Co < Ca ≈ Mg. First, it must be pointed out that the DFT adsorption energies from Kerisit et al. do not follow the same trend as the experimental dissolution rates [3], which suggests that water adsorption energies are just a small portion of the complex process that is dissolution. Second, it is clear that our results are in the same range of other orthosilicates. It is noteworthy that calcium olivine is the one with a larger difference of adsorption energies, which is consistent with the dispersion that we found in our study. Lastly, it must be noted that the comparison with olivines is very relevant from the cement perspective because calcium olivine mineral is the γ-polymorph of belite, which is a phase that is avoided in cement production due to its negligible reactivity. Comparing our results with those of Kerisit, it seems that the γ-polymorph presents larger water adsorption energies than the β-polymorph. This is a counterintuitive result that was previously reported in Reference [28] because the experimental dissolution rate of β-C2S is larger than that of γ-C2S.
5. Conclusions
β-dicalcium silicate is a promising candidate to develop low-CO2 cements. However, its slow hydration rate has limited its practical applications so far. In this work, density functional theory simulations have been employed with the aim of understanding the water adsorption mechanism on β-dicalcium silicate surfaces.
Due to the structural complexity, there are multiple water adsorption sites with different energies on β-C2S surfaces. The most favorable adsorption sites are ascribed to the co-existence of a dangling oxygen atom from the silicate group and surface calcium atoms. The structural and electronic analyses point towards a double nucleophilic-electrophilic attack by water molecules to the β-C2S surfaces. On the one hand, there is an electron transfer from the water molecule oxygen atom to the surface Ca atoms. On the other hand, one of the water hydrogen atoms establishes a hydrogen bond with the silicate oxygen atoms along with transferring a positive charge onto the silicate oxygen atoms. The results suggest that Frenkel or Schottky and isovalent chemical substitutions of Ca or O by more electropositive and electronegative atoms should create favorable points for water nucleophilic-electrophilic dual interaction. However, it must be taken into account that the point defects will enhance local affinity for water. Yet macroscopic hydration will be also influenced by line, plane, and bulk defects [7,45].
The water adsorption energies on the three studied surfaces are consistent with previous results for the olivine orthosilicate family. They lie in the same energy range, which suggests that no preferential direction for a water attack and there is a considerable dispersion on the values that does not correlate with the electronic structure or adsorption configuration. In addition, the inconsistency between the DFT results and the experimental dissolution rates make us suggest that DFT calculations help us to elucidate in detail the atomic scale interaction but do not provide the necessary information to draw conclusions about macroscopic dissolution rates.
Author Contributions
Q.W., H.M., and X.S. conceived and designed the simulations. Q.W. performed the simulations. Q.W. and H.M. analyzed the data. Q.W., H.M., X.S., and I.L.-A. wrote the paper.
Funding
National Natural Science Foundation of China (No. 51602148), the Priority Academic Program Development of Jiangsu Higher Education Institutions (PAPD), the Program for Innovative Research Team in the University of Ministry of Education of China (No. IRT_15R35), the financial support from the Departamento de Educación, Política Lingüística y Cultura del Gobierno Vasco (IT912-16) and the ELKARTEK project.
Acknowledgments
The technical and human support provided by IZO-SGI SGIker of UPV/EHU is acknowledged.
Conflicts of Interest
The authors declare no conflict of interest.
Appendix A
Figure A1.
Wulff shape reconstruction of β-C2S, according to the surfaces energies computed in Reference [28]. The three studied surfaces are colored and the label shows their cleavage, their contribution to the total surface, and their surface energies. The shape reconstruction and the contribution of each surface to the total area of the crystal has been obtained from the VESTA code [35].

Appendix B
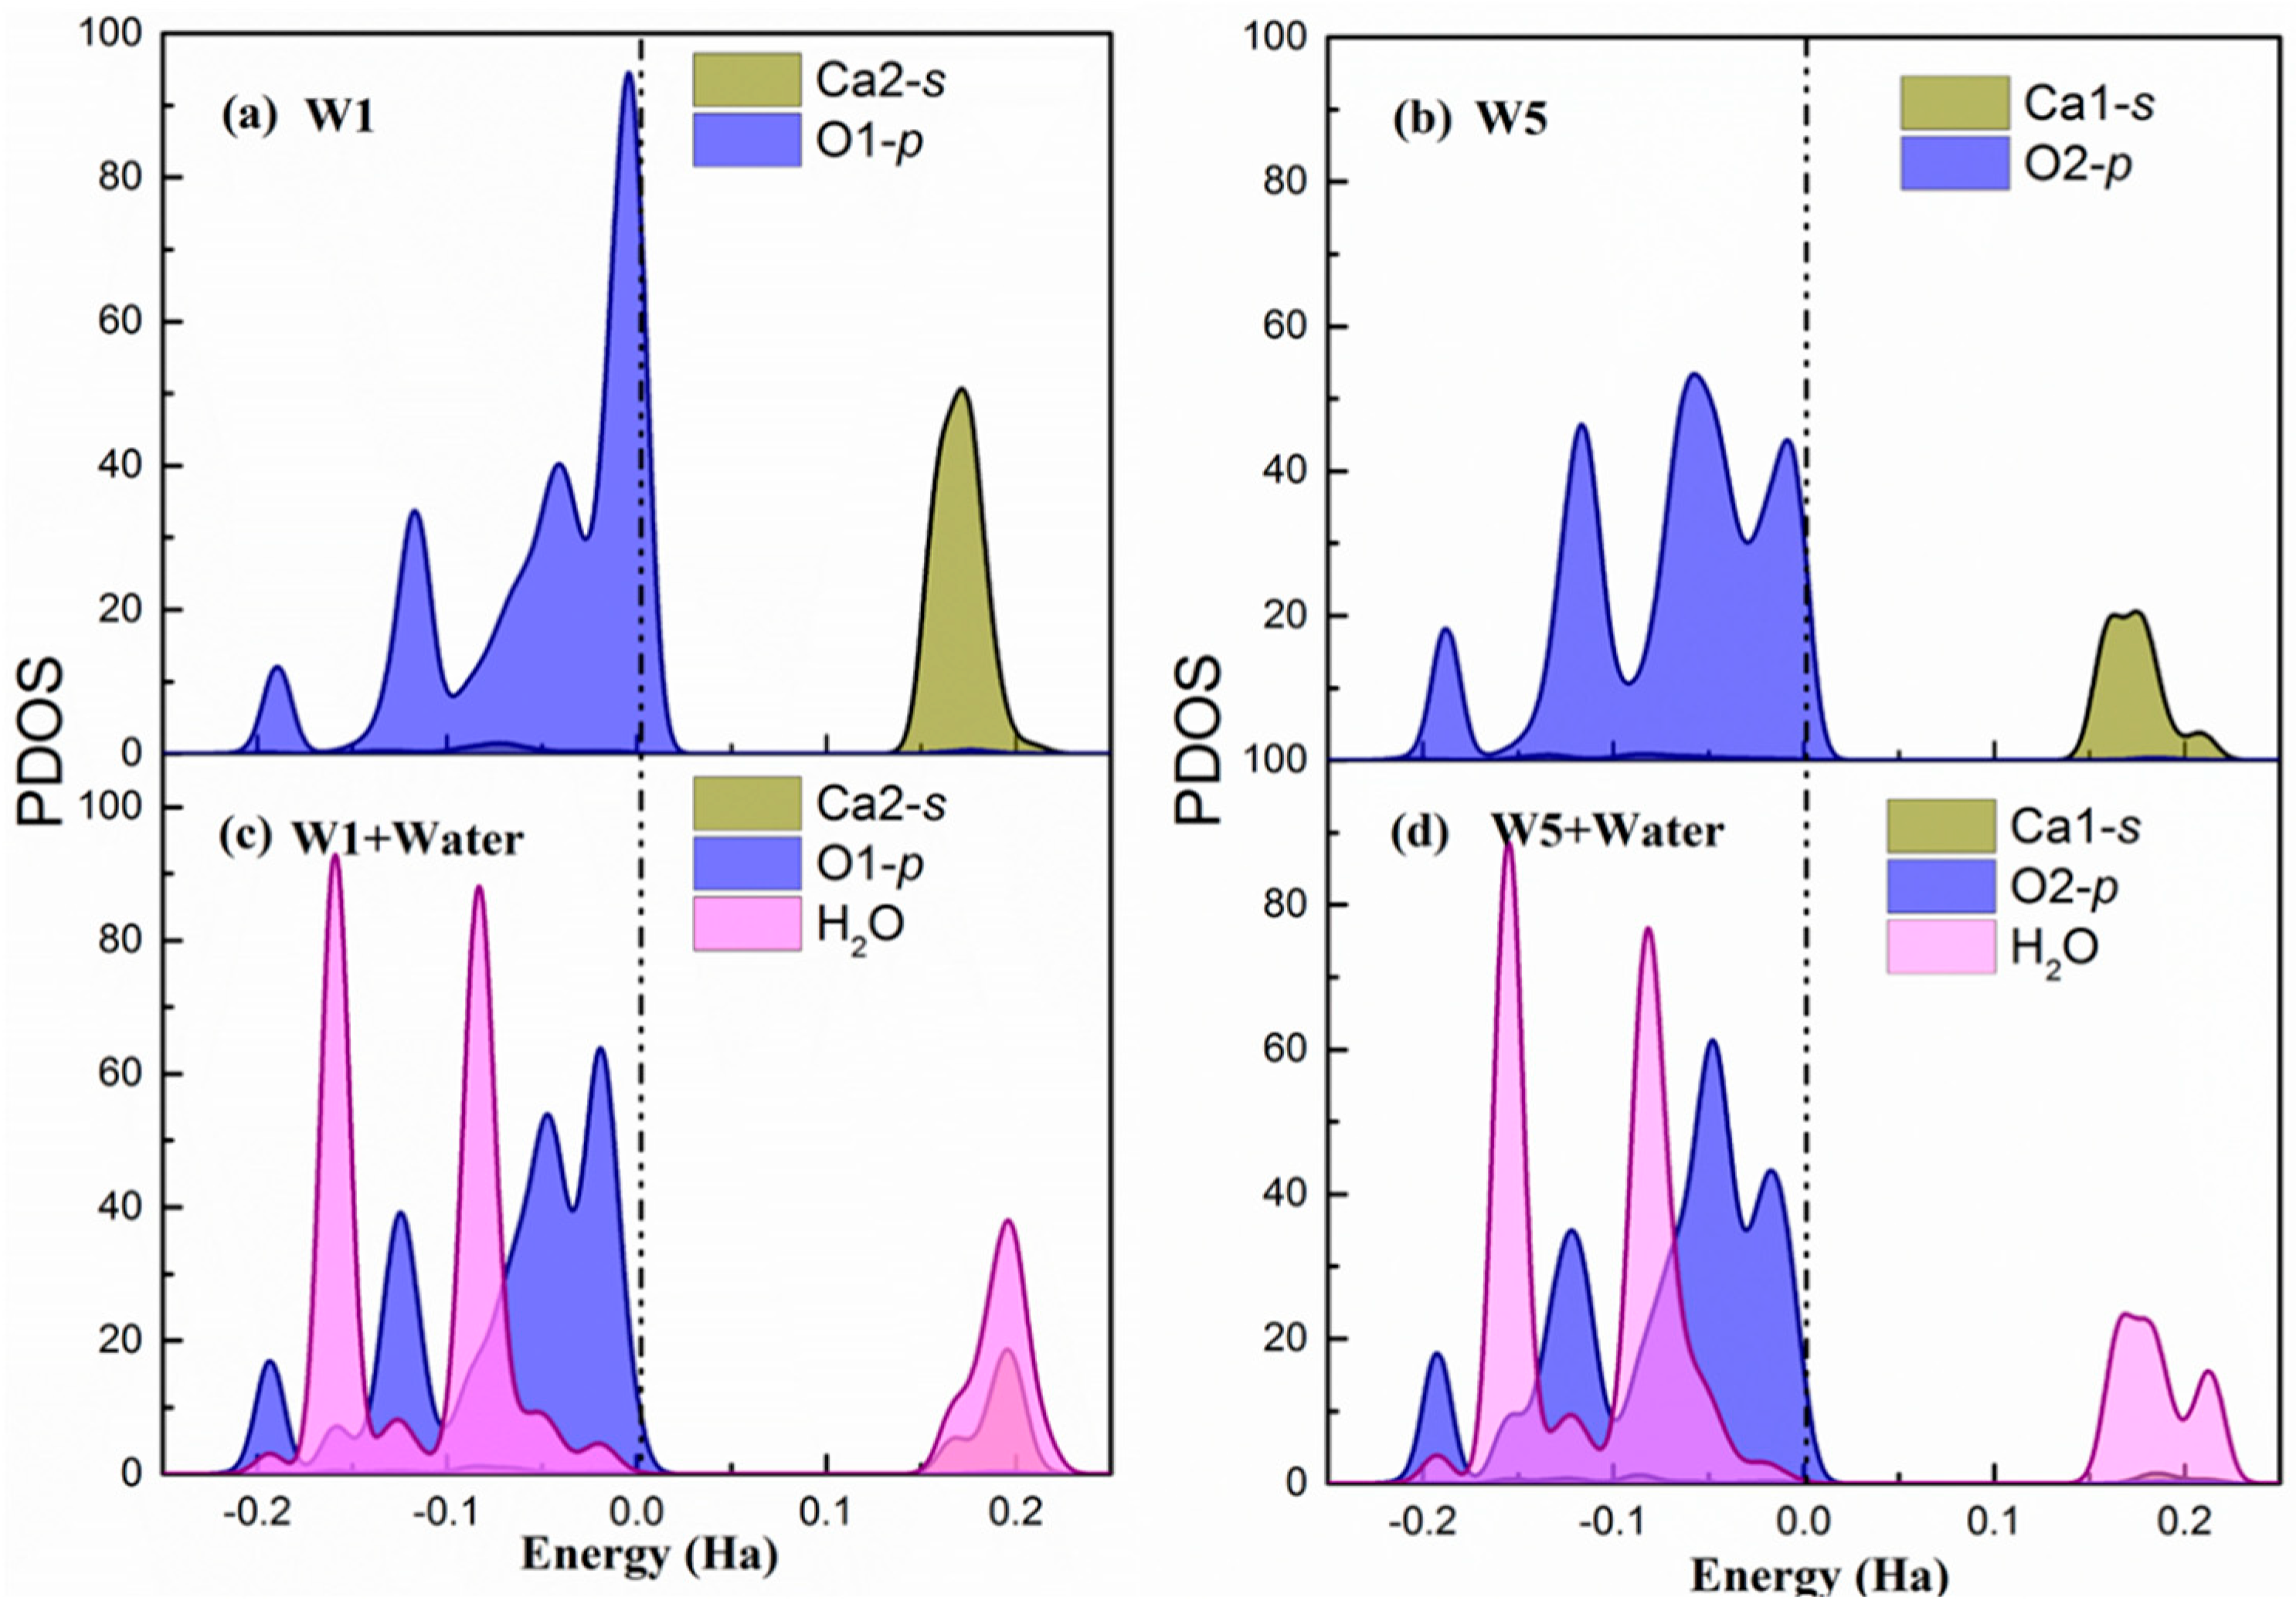
Figure A2.
Surface (101) (a,b) The partial density of states of W1 and W5 adsorption sites on the relaxed surface. (c,d) The partial density of states of W1 and W5 adsorption sites after being water adsorbed on the surface. The dash dot line indicates the Fermi level.
Figure A2.
Surface (101) (a,b) The partial density of states of W1 and W5 adsorption sites on the relaxed surface. (c,d) The partial density of states of W1 and W5 adsorption sites after being water adsorbed on the surface. The dash dot line indicates the Fermi level.

Figure A3.
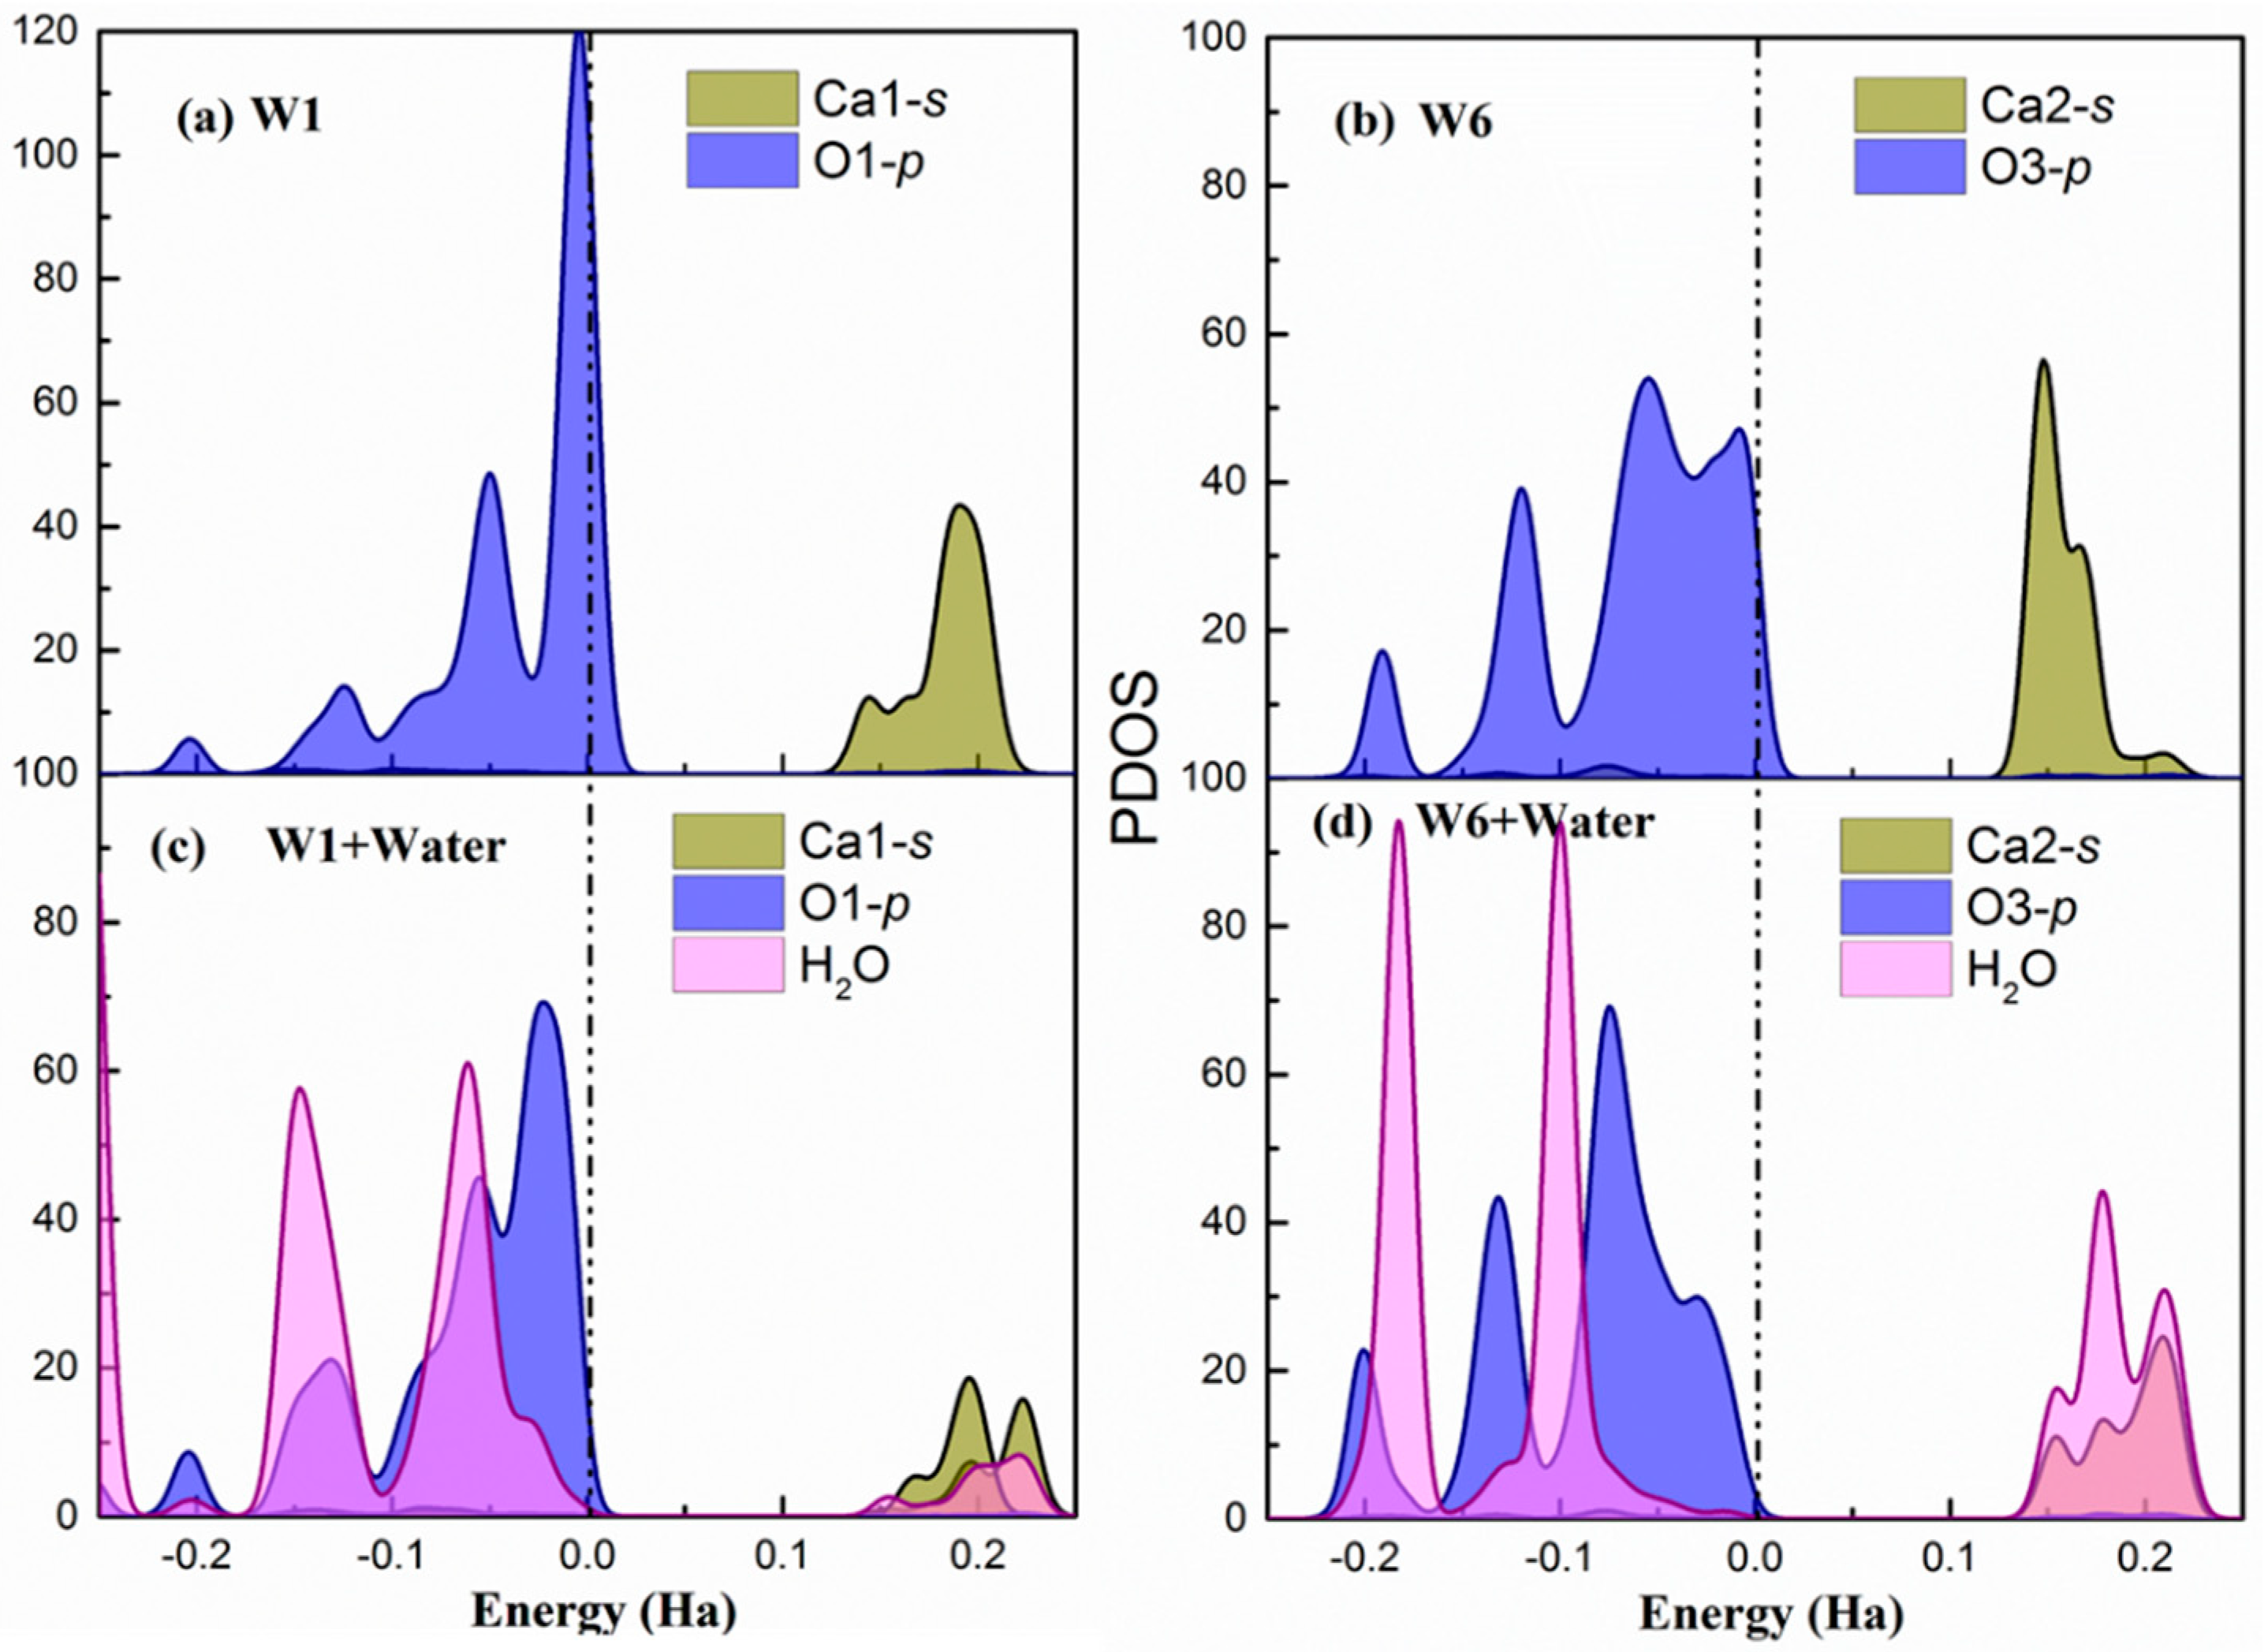
Surface (010) (a,b) The partial density of states of W1 and W6 adsorption sites on the relaxed surface. (c,d) The partial density of states of W1 and W6 adsorption sites after being water adsorbed on the surface. The dash dot line indicates the Fermi level.
Figure A3.
Surface (010) (a,b) The partial density of states of W1 and W6 adsorption sites on the relaxed surface. (c,d) The partial density of states of W1 and W6 adsorption sites after being water adsorbed on the surface. The dash dot line indicates the Fermi level.

References
- Cot-Gores, J.; Castell, A.; Cabeza, L.F. Thermochemical energy storage and conversion: A-state-of-the-art review of the experimental research under practical conditions. Renew. Sustain. Energy Rev. 2012, 16, 5207–5224. [Google Scholar] [CrossRef]
- Sharma, A.; Tyagi, V.V.; Chen, C.R.; Buddhi, D. Review on thermal energy storage with phase change materials and applications. Renew. Sustain. Energy Rev. 2009, 13, 318–345. [Google Scholar] [CrossRef]
- Ohlin, C.A.; Villa, E.M.; Rustad, J.R.; Casey, W.H. Dissolution of insulating oxide materials at the molecular scale. Nat. Mater. 2010, 9, 11–19. [Google Scholar] [CrossRef] [PubMed]
- Brantley, S.L.; Kubicki, J.D.; White, A.F. Kinetics of Water-Rock Interaction; Springer: Berlin, Germany, 2008; Volume 168. [Google Scholar]
- Oelkers, E.H. General kinetic description of multioxide silicate mineral and glass dissolution. Geochim. Cosmochim. Acta 2001, 65, 3703–3719. [Google Scholar] [CrossRef]
- Porter, A.E.; Patel, N.; Skepper, J.N.; Best, S.M.; Bonfield, W. Comparison of in vivo dissolution processes in hydroxyapatite and silicon-substituted hydroxyapatite bioceramics. Biomaterials 2003, 24, 4609–4620. [Google Scholar] [CrossRef]
- Bullard, J.W.; Jennings, H.M.; Livingston, R.A.; Nonat, A.; Scherer, G.W.; Schweitzer, J.S.; Scrivener, K.L.; Thomas, J.J. Mechanisms of cement hydration. Cem. Concr. Res. 2011, 41, 1208–1223. [Google Scholar] [CrossRef]
- Jost, K.H.; Ziemer, B.; Seydel, R.H.K. Redetermination of structure of beta-dicalcium silicate. Acta Crystallogr. Sect. B Struct. Sci. 1977, 33, 1696–1700. [Google Scholar] [CrossRef]
- Fukuda, K.; Ito, S. Improvement in reactivity and grindability of belite-rich cement by remelting reaction. J. Am. Ceram. Soc. 1999, 82, 2177–2180. [Google Scholar] [CrossRef]
- Cuberos, A.J.M.; De la Torre, A.G.; Martin-Sedeno, M.C.; Moreno-Real, L.; Merlini, M.; Ordonez, L.M.; Aranda, M.A.G. Phase development in conventional and active belite cement pastes by Rietveld analysis and chemical constraints. Cem. Concr. Res. 2009, 39, 833–842. [Google Scholar] [CrossRef]
- Cuberos, A.J.M.; De la Torre, A.G.; Alvarez-Pinazo, G.; Martin-Sedeno, M.C.; Schollbach, K.; Pollmann, H.; Aranda, M.A.G. Active Iron-Rich Belite Sulfoaluminate Cements: Clinkering and Hydration. Environ. Sci. Technol. 2010, 44, 6855–6862. [Google Scholar] [CrossRef] [PubMed]
- ElDidamony, H.; Sharara, A.M.; Helmy, I.M.; ElAleem, S.A. Hydration characteristics of beta-C2S in the presence of some accelerators. Cem. Concr. Res. 1996, 26, 1179–1187. [Google Scholar] [CrossRef]
- Yang, H.G.; Sun, C.H.; Qiao, S.Z.; Zou, J.; Liu, G.; Smith, S.C.; Cheng, H.M.; Lu, G.Q. Anatase TiO2 single crystals with a large percentage of reactive facets. Nature 2008, 453, 638–641. [Google Scholar] [CrossRef] [PubMed]
- Manzano, H.; Pellenq, R.J.M.; Ulm, F.-J.; Buehler, M.J.; van Duin, A.C.T. Hydration of Calcium Oxide Surface Predicted by Reactive Force Field Molecular Dynamics. Langmuir 2012, 28, 4187–4197. [Google Scholar] [CrossRef] [PubMed]
- Raymand, D.; van Duin, A.C.T.T.; Spångberg, D.; Goddard, W.A.; Hermansson, K.; Spangberg, D. Water adsorption on stepped ZnO surfaces from MD simulation. Surf. Sci. 2010, 604, 741–752. [Google Scholar] [CrossRef]
- Stack, A.G.; Raiteri, P.; Gale, J.D. Accurate Rates of the Complex Mechanisms for Growth and Dissolution of Minerals Using a Combination of Rare-Event Theories. J. Am. Chem. Soc. 2011, 134, 11–14. [Google Scholar] [CrossRef] [PubMed]
- De Leeuw, N.H.; Parker, S.C. Molecular-dynamics simulation of MgO surfaces in liquid water using a shell-model potential for water. Phys. Rev. B 1998, 58, 13901–13908. [Google Scholar] [CrossRef]
- De Leeuw, N.H.; Parker, S.C.; Catlow, C.R.A.; Price, G.D.; Leeuw, N.H. De Modelling the effect of water on the surface structure and stability of forsterite. Phys. Chem. Miner. 2000, 27, 332–341. [Google Scholar] [CrossRef]
- Cicero, G.; Grossman, J.C.; Catellani, A.; Galli, G. Water at a Hydrophilic Solid Surface Probed by ab initio Molecular Dynamics: Inhomogeneous Thin Layers of Dense Fluid. J. Am. Chem. Soc. 2005, 127, 6830–6835. [Google Scholar] [CrossRef] [PubMed]
- Manzano, H.; Durgun, E.; López-Arbeloa, I.; Grossman, J.C.J.C. Insight on Tricalcium Silicate Hydration and Dissolution Mechanism from Molecular Simulations. ACS Appl. Mater. Interfaces 2015, 7, 14726–14733. [Google Scholar] [CrossRef] [PubMed] [Green Version]
- Manzano, H.; Durgun, E.; Abdolhosseine Qomi, M.J.; Ulm, F.-J.; Pellenq, R.J.M.; Grossman, J.C. Impact of Chemical Impurities on the Crystalline Cement Clinker Phases Determined by Atomistic Simulations. Cryst. Growth Des. 2011, 11, 2964–2972. [Google Scholar] [CrossRef]
- Durgun, E.; Manzano, H.; Pellenq, R.J.M.; Grossman, J.C. Understanding and Controlling the Reactivity of the Calcium Silicate Phases from First Principles. Chem. Mater. 2012, 24, 1262–1267. [Google Scholar] [CrossRef]
- Durgun, E.; Manzano, H.; Kumar, P.V.V.; Grossman, J.C.J.C. The Characterization, Stability, and Reactivity of Synthetic Calcium Silicate Surfaces from First Principles. J. Phys. Chem. C 2014, 118, 15214–15219. [Google Scholar] [CrossRef] [Green Version]
- Huang, J.; Valenzano, L.; Singh, T.V.; Pandey, R.; Sant, G. Influence of (Al, Fe, Mg) Impurities on Triclinic Ca3SiO5: Interpretations from DFT Calculations. Cryst. Growth Des. 2014, 14, 2158–2171. [Google Scholar] [CrossRef]
- Huang, J.; Wang, B.; Yu, Y.; Valenzano, L.; Bauchy, M.; Sant, G. Electronic Origin of Doping-Induced Enhancements of Reactivity: Case Study of Tricalcium Silicate. J. Phys. Chem. C 2015, 119, 25991–25999. [Google Scholar] [CrossRef]
- Mishra, R.K.; Flatt, R.J.; Heinz, H. Force Field for Tricalcium Silicate and Insight into Nanoscale Properties: Cleavage, Initial Hydration, and Adsorption of Organic Molecules. J. Phys. Chem. C 2013, 117, 10417–10432. [Google Scholar] [CrossRef]
- Wang, Q.; Guo, Y.; Manzano, H.; Lopez-Arbeloa, I.; Shen, X.; Li, F. First-principles study of water adsorption and dissociation on β-C2S (100). J. Nucl. Mater. 2014, 454, 446–454. [Google Scholar]
- Wang, Q.; Manzano, H.; Guo, Y.; Lopez-Arbeloa, I.; Shen, X. Hydration Mechanism of Reactive and Passive Dicalcium Silicate Polymorphs from Molecular Simulations. J. Phys. Chem. C 2015, 119, 19869–19875. [Google Scholar] [CrossRef]
- Wang, Q.; Li, F.; Shen, X.; Shi, W.; Li, X.; Guo, Y.; Xiong, S.; Zhu, Q. Relation between reactivity and electronic structure for α′L-, β- and γ-dicalcium silicate: A first-principles study. Cem. Concr. Res. 2014, 57, 28–32. [Google Scholar] [CrossRef]
- Mumme, W.G.; Hill, R.J.; Bushnellwye, G.; Segnit, E.R. Rietveld Crystal-Structure Refinements, Crystal-Chemistry and Calculated Powder Diffraction Data for the Polymorphs of Dicalcium Silicate and Related Phases. Neues Jahrb. Fur Mineral. 1995, 169, 35–68. [Google Scholar]
- Delley, B. From molecules to solids with the DMol3 approach. J. Chem. Phys. 2000, 113, 7756–7764. [Google Scholar] [CrossRef]
- Perdew, J.P.; Burke, K.; Ernzerhof, M. Generalized gradient approximation made simple. Phys. Rev. Lett. 1996, 77, 3865–3868. [Google Scholar] [CrossRef] [PubMed]
- Monkhorst, H.J.; Pack, J.D. Special points for Brillouin-zone integrations. Phys. Rev. B 1976, 13, 5188–5192. [Google Scholar] [CrossRef]
- Neugebauer, J.; Scheffler, M. Adsorbate-substrate and adsorbate-adsorbate interactions of Na and K adlayers on Al (111). Phys. Rev. B 1992, 46, 16067. [Google Scholar] [CrossRef]
- Momma, K.; Izumi, F. VESTA: A three-dimensional visualization system for electronic and structural analysis. J. Appl. Crystallogr. 2008, 41, 653–658. [Google Scholar] [CrossRef]
- Machesky, M.L.; Predota, M.; Wesolowski, D.J.; Vlcek, L.; Cummings, P.T.; Rosenqvist, J.; Ridley, M.K.; Kubicki, J.D.; Bandura, A.V.; Kumar, N. Surface protonation at the rutile (110) interface: Explicit incorporation of solvation structure within the refined MUSIC model framework. Langmuir 2008, 24, 12331–12339. [Google Scholar] [CrossRef] [PubMed]
- Allen, J.P.; Parker, S.C.; Price, D.W. Atomistic Simulation of the Surface Carbonation of Calcium and Magnesium Oxide Surfaces. J. Phys. Chem. C 2009, 113, 8320–8328. [Google Scholar] [CrossRef]
- Bolis, V.; Fubini, B.; Marchese, L.; Martra, G.; Costa, D. Hydrophilic and hydrophobic sites on dehydrated crystalline and amorphous silicas. J. Chem. Soc. Faraday Trans. 1991, 87, 497–505. [Google Scholar] [CrossRef]
- Grabowski, S.J. Hydrogen bonding strength—Measures based on geometric and topological parameters. J. Phys. Org. Chem. 2004, 17, 18–31. [Google Scholar] [CrossRef]
- Duque-Redondo, E.; Manzano, H.; Epelde-Elezcano, N.; Martínez-Martínez, V.; López-Arbeloa, I. Molecular Forces Governing Shear and Tensile Failure in Clay-Dye Hybrid Materials. Chem. Mater. 2014, 26, 4338–4345. [Google Scholar] [CrossRef]
- Hirshfeld, F.L. Bonded-atom fragments for describing molecular charge densities. Theor. Chim. Acta 1977, 44, 129–138. [Google Scholar] [CrossRef]
- Grabowski, S.J. What Is the Covalency of Hydrogen Bonding? Chem. Rev. 2011, 111, 2597–2625. [Google Scholar] [CrossRef] [PubMed]
- Elgabarty, H.; Khaliullin, R.Z.; Kühne, T.D. Covalency of hydrogen bonds in liquid water can be probed by proton nuclear magnetic resonance experiments. Nat. Commun. 2015, 6, 8318. [Google Scholar] [CrossRef] [PubMed] [Green Version]
- Kerisit, S.; Bylaska, E.J.; Felmy, A.R. Water and carbon dioxide adsorption at olivine surfaces. Chem. Geol. 2013, 359, 81–89. [Google Scholar] [CrossRef]
- Juilland, P.; Gallucci, E.; Flatt, R.; Scrivener, K. Dissolution theory applied to the induction period in alite hydration. Cem. Concr. Res. 2010, 40, 831–844. [Google Scholar] [CrossRef]
Figure 1.
(a) Atomic representation of the β-C2S (100) surface model visualized with VESTA [35]. Red, green, and orange spheres represent oxygen, calcium, and silicate atoms, respectively. The SiO4−4 groups are further represented as orange tetrahedral. (b) Electrostatic potentials along with the vertical vectors of the slab for the (100), (101), and (010) cleavage directions. The solid line represents the vacuum level.

Figure 2.
(a) Water adsorption configurations on β-C2S (100) in side (a.1) and top (a.2) views. For the β-C2S (101) (b) and (010) (c), only the top view is shown. The nomenclature of the Ca and O sites from dicalcium silicate follow that of the original paper describing the crystalline structure [30]. The atoms representation is the same as in Figure 1 including the water molecules with the O atoms in blue and the H atoms in white. It must be noted that the conformation sites labelled as W2 and W4 in the (100) were different in the empirical simulation. However, after the present DFT energy minimization, they became equivalent.

Figure 3.
(a,b) The partial density of states of W1 and W9 adsorption sites on the relaxed surface (c,d). The partial density of states of W1 and W9 adsorption sites after water adsorbed on the surface. The dash dot line indicates the Fermi level. Note that Ca1 in sites W1 and W9 were equivalent in the bulk. However, after slab relaxation, they are not equivalent and hence have different PDOS.

Figure 4.
Isosurface plots of the electron density difference for W1 (a,c) and W9 (b,d) adsorption sites. Dark and light blue isosurfaces indicate the electron density surfeit and depletion, respectively.
Figure 4.
Isosurface plots of the electron density difference for W1 (a,c) and W9 (b,d) adsorption sites. Dark and light blue isosurfaces indicate the electron density surfeit and depletion, respectively.

Figure 5.
Adsorption energies of water on β-belite surfaces compared to the values reported with DFT for the olivine orthosilicate family [44]. The circles correspond to the adsorption energies calculated in this study and the shadowed region ranges obtained for different water adsorption configurations in Reference [44]. Additionally, the surface energy value (γ) is given in J/m2.


Table 1.
Summary of the properties for the studied surfaces.
| Surface Index | Slab Size (Å) | Slab Thickness (Å) | Surface Energy (J m−2) | Contribution to the Wulff Shape |
|---|---|---|---|---|
| (100) | 13.5 × 9.3 | 16.3 | 0.85 | 18% |
| (010) | 9.3 × 11.0 | 20.4 | 1.00 | 19% |
| (101) | 11.2 × 13.5 | 19.0 | 0.76 | 21% |
Table 2.
The Hirshfeld charge of water molecule atoms for various adsorption sites as well as the corresponding adsorption energies. The adsorption sites are named in a descending adsorption energy order and the surface Ca and oxygen numbers are those in Figure 2. The water molecule atoms are named with the w subscript. The Hw taking part of the hydrogen bond (see text) is labeled as Hw(O).
| Surface | Adsorption Site | Adsorption Energy (eV) | Hirshfeld Charge on Water (e−) | Hirshfeld Charge on Surfaces (e−) | Bond Distance Ca–Ow (Å) | Bond Distance O–Hw (Å) | ||||
|---|---|---|---|---|---|---|---|---|---|---|
| Ow | Hw(O) | Hw | Total | Ca | O | |||||
| H2O | - | - | −0.302 | 0.151 | 0.151 | 0 | - | - | - | - |
| (100) | ||||||||||
| W1 | Ca1O4 | −1.24 | −0.198 | 0.099 | 0.180 | 0.081 | 0.612 | −0.321 | 2.595 | 1.419 |
| W2 | Ca2O3 | −1.14 | −0.195 | 0.108 | 0.181 | 0.094 | 0.477 | −0.361 | 2.644 | 1.598 |
| W3 | Ca2O3 | −1.14 | −0.196 | 0.107 | 0.179 | 0.09 | 0.475 | −0.362 | 2.630 | 1.593 |
| W4 | Ca2O3 | −1.14 | −0.198 | 0.106 | 0.179 | 0.087 | 0.476 | −0.362 | 2.630 | 1.392 |
| W5 | Ca1O2 | −1.09 | −0.269 | 0.101 | 0.169 | 0.001 | 0.649 | −0.356 | 2.351 | 1.550 |
| W6 | Ca2O1 | −1.07 | −0.218 | 0.095 | 0.176 | 0.053 | 0.446 | −0.218 | 2.542 | 1.393 |
| W7 | Ca1O1 | −1.00 | −0.258 | 0.108 | 0.174 | 0.024 | 0.649 | −0.258 | 2.395 | 1.661 |
| W8 | Ca2O4 | −0.91 | −0.203 | 0.103 | 0.177 | 0.077 | 0.462 | −0.203 | 2.560 | 1.524 |
| W9 | Ca1O1 | −0.78 | −0.207 | 0.122 | 0.182 | 0.097 | 0.498 | −0.207 | 2.546 | 1.677 |
| (101) | ||||||||||
| W1 | Ca2O1 | −0.974 | −0.266 | 0.103 | 0.162 | −0.001 | 0.5043 | −0.3559 | 2.481 | 1.604 |
| W2 | Ca2O2 | −0.932 | −0.266 | 0.1075 | 0.1648 | 0.006 | 0.4989 | −0.3599 | 2.499 | 1.665 |
| W3 | Ca1O3 | −0.922 | −0.226 | 0.1156 | 0.1697 | 0.06 | 0.5219 | −0.325 | 2.781 | 1.568 |
| W4 | Ca1O1 | −0.921 | −0.256 | 0.1038 | 0.1619 | 0.01 | 0.4930 | −0.3499 | 2.522 | 1.553 |
| W5 | Ca1O2 | −0.853 | −0.262 | 0.1026 | 0.1609 | 0.002 | 0.4936 | −0.3591 | 2.519 | 1.603 |
| (010) | ||||||||||
| W1 | Ca1O1 | −1.477 | −0.278 | 0.0957 | 0.1392 | −0.043 | 0.5029 | −0.3882 | 2.431 | 1.612 |
| W2 | Ca1O1 | −1.430 | −0.272 | 0.0949 | 0.1613 | −0.016 | 0.4928 | −0.3869 | 2.448 | 1.580 |
| W3 | Ca1O4 | −1.365 | −0.258 | 0.1073 | 0.163 | 0.012 | 0.5084 | −0.3601 | 2.463 | 1.726 |
| W4 | Ca2O1 | −1.199 | −0.273 | 0.0992 | 0.1641 | −0.001 | 0.5587 | −0.3883 | 2.383 | 1.558 |
| W5 | Ca2O2 | −1.094 | −0.272 | 0.1054 | 0.1492 | −0.01 | 0.5856 | −0.3544 | 2.498 | 1.731 |
| W6 | Ca2O3 | −1.044 | −0.252 | 0.1121 | 0.1723 | 0.032 | 0.5623 | −0.3458 | 2.421 | 1.658 |
© 2018 by the authors. Licensee MDPI, Basel, Switzerland. This article is an open access article distributed under the terms and conditions of the Creative Commons Attribution (CC BY) license (http://creativecommons.org/licenses/by/4.0/).
Share and Cite
MDPI and ACS Style
Wang, Q.; Manzano, H.; López-Arbeloa, I.; Shen, X. Water Adsorption on the β-Dicalcium Silicate Surface from DFT Simulations. Minerals 2018, 8, 386. https://doi.org/10.3390/min8090386
AMA Style
Wang Q, Manzano H, López-Arbeloa I, Shen X. Water Adsorption on the β-Dicalcium Silicate Surface from DFT Simulations. Minerals. 2018; 8(9):386. https://doi.org/10.3390/min8090386
Chicago/Turabian StyleWang, Qianqian, Hegoi Manzano, Iñigo López-Arbeloa, and Xiaodong Shen. 2018. "Water Adsorption on the β-Dicalcium Silicate Surface from DFT Simulations" Minerals 8, no. 9: 386. https://doi.org/10.3390/min8090386
Note that from the first issue of 2016, this journal uses article numbers instead of page numbers. See further details here.