Evaluation of Viscosity, Strength and Microstructural Properties of Cemented Tailings Backfill


1
School of Civil and Resources Engineering, University of Science and Technology Beijing, Beijing 100083, China
2
State Key Laboratory of High-Efficient Mining and Safety of Metal Mines of Ministry of Education, University of Science and Technology Beijing, Beijing 100083, China
3
First Quantum Minerals Ltd., Cayeli Bakir Isletmeleri A.S., P.O. Box 42, Madenli, Cayeli, Rize TR53200, Turkey
*
Authors to whom correspondence should be addressed.
Minerals 2018, 8(8), 352; https://doi.org/10.3390/min8080352
Submission received: 9 July 2018
/
Revised: 9 August 2018
/
Accepted: 12 August 2018
/
Published: 14 August 2018
(This article belongs to the Special Issue Backfilling Materials for Underground Mining)
Abstract
:In this study, the particle size distribution and chemical composition of gold mine tailings were examined experimentally. A series of viscosity and uniaxial compressive strength (UCS) tests were used to study the relations between the viscosity of cemented tailings backfill (CTB) slurry, the solid content (SD), and the cement-to-tailings ratio (c/t). Relations between UCS performance of CTB and SD, c/t, and curing time (CT) were discussed while examining the microstructure of 28-day cured backfill with different solid contents. Results illustrate that a major increase in CTB viscosity by increasing the SD leads to the formation of tailings grains for a skeleton formation, which is formed due to consolidation and gravitational forces. The CTB’s strength increases with the increase of c/t, SD, and CT, due to a decrease in water-to-cement ratio and porosity, and an increase in hydration products over time. The SEM micrographs show how CTB’s microstructure is affected by the SD, generating ettringites and calcium silicate hydrates in the backfill matrix. The findings of this study will lead to an efficient CTB mix design for reaching the higher performance in underground mining structures, thereby reducing expenses related to the backfill.
1. Introduction
After useful metal elements in the underground ore body are separated by various mineral processing techniques on the surface plants, huge amounts of processing tailings are left on mining grounds. These tailings are most often hazardous and must be efficiently disposed of in order to meet environmental regulations [1,2,3]. The surface emissions of processing tailings will not only cause environmental pollution, but also may induce tailings dam or impoundments collapses [4,5]. In the meantime, the extraction of ore minerals from underground mines results in the creation of voids [6]. If these mined-out openings or stopes are not well back-filled in time, they may give rise to the stope collapses, induce surface deformations, and acutely threaten the safety of underground workers and/or equipment [7]. Accordingly, it is very important to safely transfer these problematic tailings into underground voids, which will back-fill the underground mined-out stopes, and also reduce the volume and emissions of the environmentally harmful processing tailings to be disposed of causally at the surface on fertile lands.
Cemented paste backfill (CPB) or cemented tailings backfill (CTB) has gained increasing popularity for the safe refilling of underground mine openings in Canada, Australia, China, Turkey, South Africa, and the United States [8,9,10,11,12,13,14,15]. Having a relatively low strength and requiring reduced amounts of complex materials, CTB is usually prepared by dewatering slurries of processing tailings to obtain a filter cake, and then mixing with small amounts of hydraulic binders and additional water (in order to produce a high-slump, flow-able material [16,17,18]. The filtered tailings contain a typical moisture content of 15–25 wt %. The cement used is either ordinary Portland cement (OPC) alone or blended cements: OPC with pulverized fly ash, blast furnace slag, and silica fume. Processing water, recycling water, and tap water are most often used as mixing water. The formed CTB slurry is usually gravity delivered or pumped over long distances and down the mine shaft to the final deposition point in underground stopes, usually located at the top of the stope [19].
Experiences indicate that the shearing of CTB mix during its distribution in pipeline changes its rheological and mechanical properties. This is significant proof of why the overall performance of laboratory-prepared CTB samples is always lower than the performance of CTB material placed in the underground stopes [20]. Due to the fact that the rheological properties of CTB may significantly vary during transportation to the underground mined-out stope owing to shearing in the pipeline, it is of vital importance in estimating pressure losses in the pipeline [21,22,23]. Many scholars and engineers have carried out research on the strength of cemented tailings backfills, such as uniaxial compressive strength (UCS), blasting response, yield stress, and microstructural analysis [24,25,26,27,28,29,30,31,32,33,34]. Cao et al. [35,36,37,38] and Wang et al. [39,40] mainly consider the coupled influence of structural factors (such as filling time, filling interval time, and filling surface angle) on uniaxial compressive strength of CTB samples. Qi et al. [41] proposed an intelligent modeling framework for the secure prediction of the CTB’s mechanical properties using machine learning algorithms and genetic algorithms. Aldhafeeri et al. [42] found that irrespective of the initial sulfate content, increasing the cement content or replacing cement with mineral admixtures in the backfill greatly reduces the reactivity of the formed paste backfills.
Numerous researchers [43,44,45,46,47,48,49] also investigated experimentally the influence of binder type and rate, water-to-cement ratio, consolidation, and mineral and chemical admixtures on strength, rheology and pore structural properties of CTB or CPB samples. One can observe from those works that the ultimate mechanical strength and durability of CTB samples are greatly affected by its mineralogical and microstructural evolution after binder hydration during the curing process. Some problems in CPB’s long-term mechanical performance and durability, such as acid mine drainage and leachate formation, are known to be experienced often in practice when sulfide-rich tailings are used for the preparation of CTB samples [50,51]. However, it is known that the particle size, size distribution, and chemical and mineralogical composition of the processing tailings used in each specific mine are quite different. The viscosity and strength behavior of the prepared CTB slurry mixes are the two most important indicators. Deng et al. [52] have shown experimentally that the rheological behavior of CTB samples is greatly affected by the tailings’ particle size and transport properties. The CTB materials prepared with finer particle sizes show higher yield stress than those of coarser particle sizes. It is also experimentally demonstrated that CTB samples having larger particle sizes contain more hydration products and display increased rates of particle sedimentation, resulting in these backfill samples having higher viscosities for a given solid and cement content.
Although many aspects of CTB samples are now relatively well known, aspects relating to viscosity and microstructural evolution over time remain to be further understood. In this regard, the main purpose of this paper is to characterize the viscosity and strength behavior of CTB samples using the control variable method. During the experiments, five kinds of solid content (SD) and four types of the cement-to-tailings ratio (c/t) were established for viscosity testing. In addition, the major factors such as the SD, c/t, and curing time (CT) were mainly considered for uniaxial compression testing, and relationships between the above three main factors and the UCS of CTB samples were studied. The scanning electron microscopy (SEM) technique was also used to further investigate the microstructure of 28-day cured CTB samples containing different solid contents. It is hoped that the results of this research work will lead to a better understanding of some mechanisms relating to the mechanical, rheological, and microstructural behavior of CTB samples, and consequently, to a better-backfill recipe selection, which can serve as a significant reference for an efficient and effective tailings backfill design of underground mining.
2. Materials and Methods
2.1. Materials Characterization
2.1.1. Processing Tailings
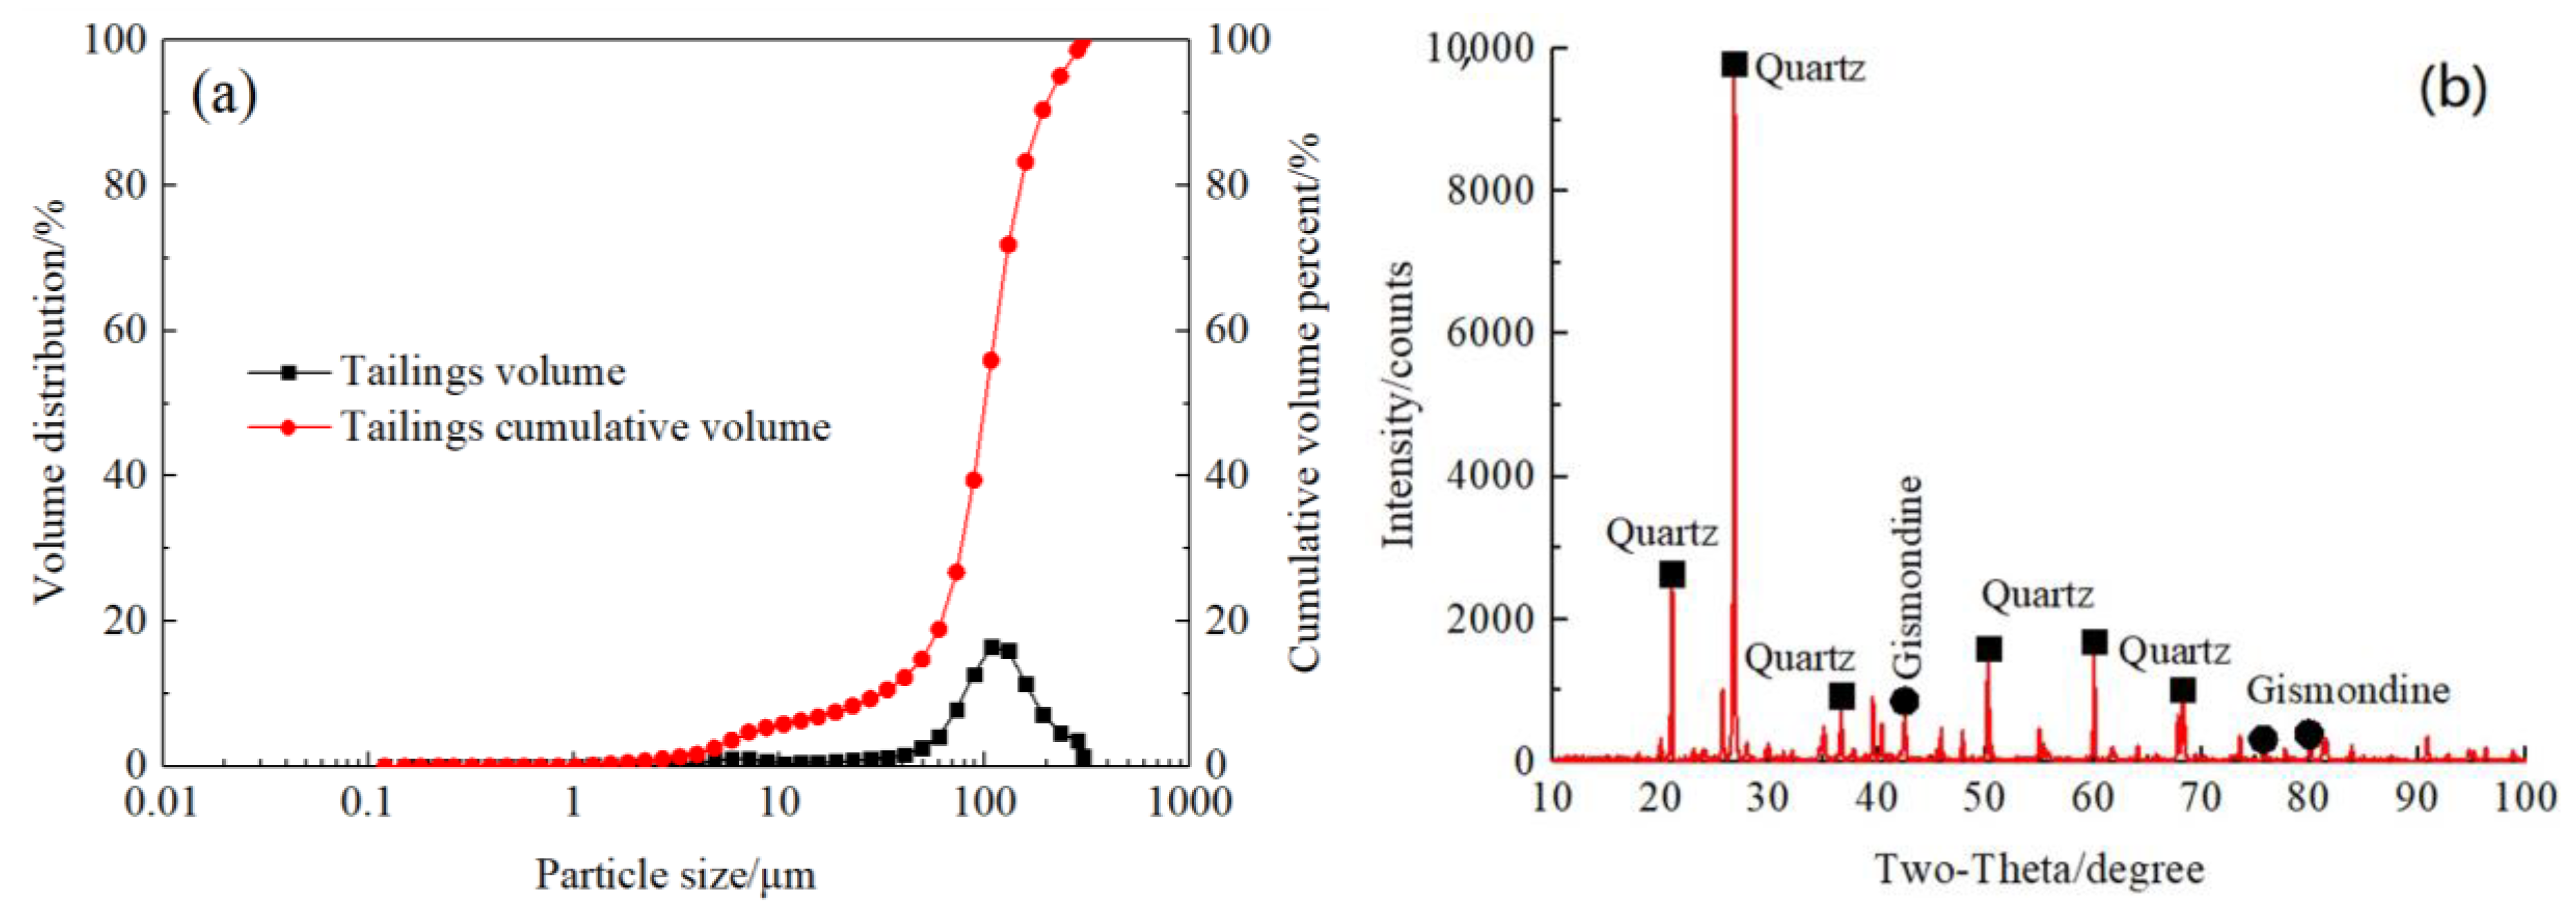
In this study, gold tailings, sampled from a gold mine located in Shandong Province, northeast of China, were used to prepare various CTB mixtures. The particle size distribution (PSD) of the tailings samples was analyzed using a SA-CP3 particle analyzer (Shimadzu, Tokyo, Japan) under dry conditions in accordance with the ASTM D421 standard procedures. Figure 1a shows the PSD curves of the tailings studied. It was found that the percentage of the fine particle with a size smaller than 12.13 μm reached 50%. The average particle size was 144.26 μm. The specific gravity and surface area of the studied processing tailings are 2.65 and 1.08 m2/g respectively. PSD is directly related to the flow properties, permeability, and pumpability of CTB samples. Accordingly, the higher the fines content (<20 μm in size), the lower the permeability coefficient becomes [10]. The fine-grained particles, with their relatively high specific surface, have a higher water-holding capacity and are delivered with coarse-grained particles in a pipeline. CTB frequently produces a plug flow when transported via a pipeline. Note that plug flow is a simple model of the velocity profile of a fluid flowing in a pipe. In plug flow, the velocity of the fluid is assumed to be constant across any cross-section of the pipe perpendicular to the axis of the pipe. The plug flow model assumes there is no boundary layer adjacent to the inner wall of the pipe.
The chemical composition of the studied tailings sample was tested by X-ray diffraction, as shown in Figure 1b and Table 1. SiO2 and Al2O3 were the main minerals within the tailings (65.7% and 14.3% by weight). The main compositions of the tailings sample (e.g., SiO2, Al2O3, and CaO) exerted a relatively positive effect on coagulation and strength development [35]. One can comment from chemical analyses that the studied tailings contain too much silica minerals. It should be kept in mind that minerals such as micas and clay can reduce the ultimate strength and stability of CTB samples, mainly because of their water absorbent mineral layers. Note that sulfide minerals raise the specific gravity, while the strength of abrasiveness of silica minerals causes serious pipeline wear.
2.1.2. Binder and Mixing Water
OPC 32.5 R was used as the main binding agent during testing. OPC is the symbol for ordinary Portland cement while the number 32.5 indicates the minimum desired strength value (≥32.5 MPa UCS ≤ 52.5 MPa) achieved within 28 days. R refers to a class with high early strength (UCS ≥ 10 MPa) at 2 days. The basic characteristics of the OPC used during the experiments were listed in Table 2. The Portland cement shows a typical chemistry for this type of cement, and the calculated Bogue’s composition is 65% for C3S, 7% for C2S, 9% for C3A and 7.5% for C4AF. The hydraulic modulus [CaO/(SiO2 + Al2O3 + Fe2O3)], which quantifies the hydraulic activity or the self-cementing characteristics of binders, calculated for OPC is 2.11. The higher the hydraulic modulus, the higher the overall self-cementing ability of the binder becomes. As mixing water, tap water was only used to homogenously mix both tailings and binder. Mixing water strongly affects the mechanical strength properties of CTB samples in terms of the water-to-cement ratio and cement hydration mechanisms. The effects of municipal, lake, and process waters on the strength performance of CTB samples manufactured using different binders were assessed in detail by Benzaazoua et al. [53].
2.2. CTB Sample Preparation
To better understand the effects of solid content and cement-to-tailings ratio in the backfill mix, a number of CTB samples with solid contents of 65%, 68%, 70% and 72% and c/t values of 1:04, 1:06, 1:08 and 1:10 were thoroughly mixed for at least 10 min. After intensive mixing, the mixed slurry was poured into metal cubes with dimensions of 70.7 mm × 70.7 mm × 70.7 mm, followed by a rest period (48 h) to obtain cubic samples. Following this, the CTB samples were removed from the cubic molds and then placed and cured in a relative temperature at 20 ± 5 °C and humidity room at 92 ± 5% for the final curing periods of 3, 7, and 28 days [54]. Before each testing, the size of CTB samples was measured carefully and recorded. The flatness was controlled within ±0.02 mm. The calculation (calculated by mass fraction) of the proportions of each CTB sample is listed in Table 3. Note that a high-precision electronic scale an accuracy of 0.01 g was used to weigh the ingredients of CTB. Figure 2 shows some images of the backfill preparation process.
The cost of the cement is 350–400 ¥/t in Shandong, China. Taking a 70% solids content as an example, when the cement-to-tailings ratio increased from 1:6 to 1:4, and the increased cost reached 14–16 ¥/t. Instead of using OPC alone, low-cost alternative cement that contains blast furnace slag, fly ash, sawdust, and construction and demolition waste as a partial replacement of the cement up to 80% with OPC can be used within the CTB mixtures for reducing the cement costs.
2.3. Viscosity Testing
A number of experimental studies have shown that the rheological properties of the CTB slurry mixes were complex [55]. To investigate the shear stress and apparent viscosity of CTB samples at different solid contents and c/t ratios, a Brookfield R/S + SST (soft solid tester) rotational rheometer with a vane geometry was used optional Rheo3000 software (AMETEK Brookfield, Middleborough, MA, USA), as shown in Figure 3. As sample holders, cylindrical glass beakers (D/H: 95/122 mm) were used during the tests according to the Chinese GB/T21785-2008 standard. The prepared CTB slurry was first poured into a beaker. To remove air bubbles in the mix, CTB samples were tamped 12 times using a glass rod. The test time was set to 120 s to get the viscosity of samples. Using vane spindle geometry for materials with particulates, slurries, and stiff paste, this test provides data that closely relates to visco-elastic properties such as yield stress, shear modulus (stiffness of material structure when intact), and creep.
2.4. Uniaxial Compressive Testing
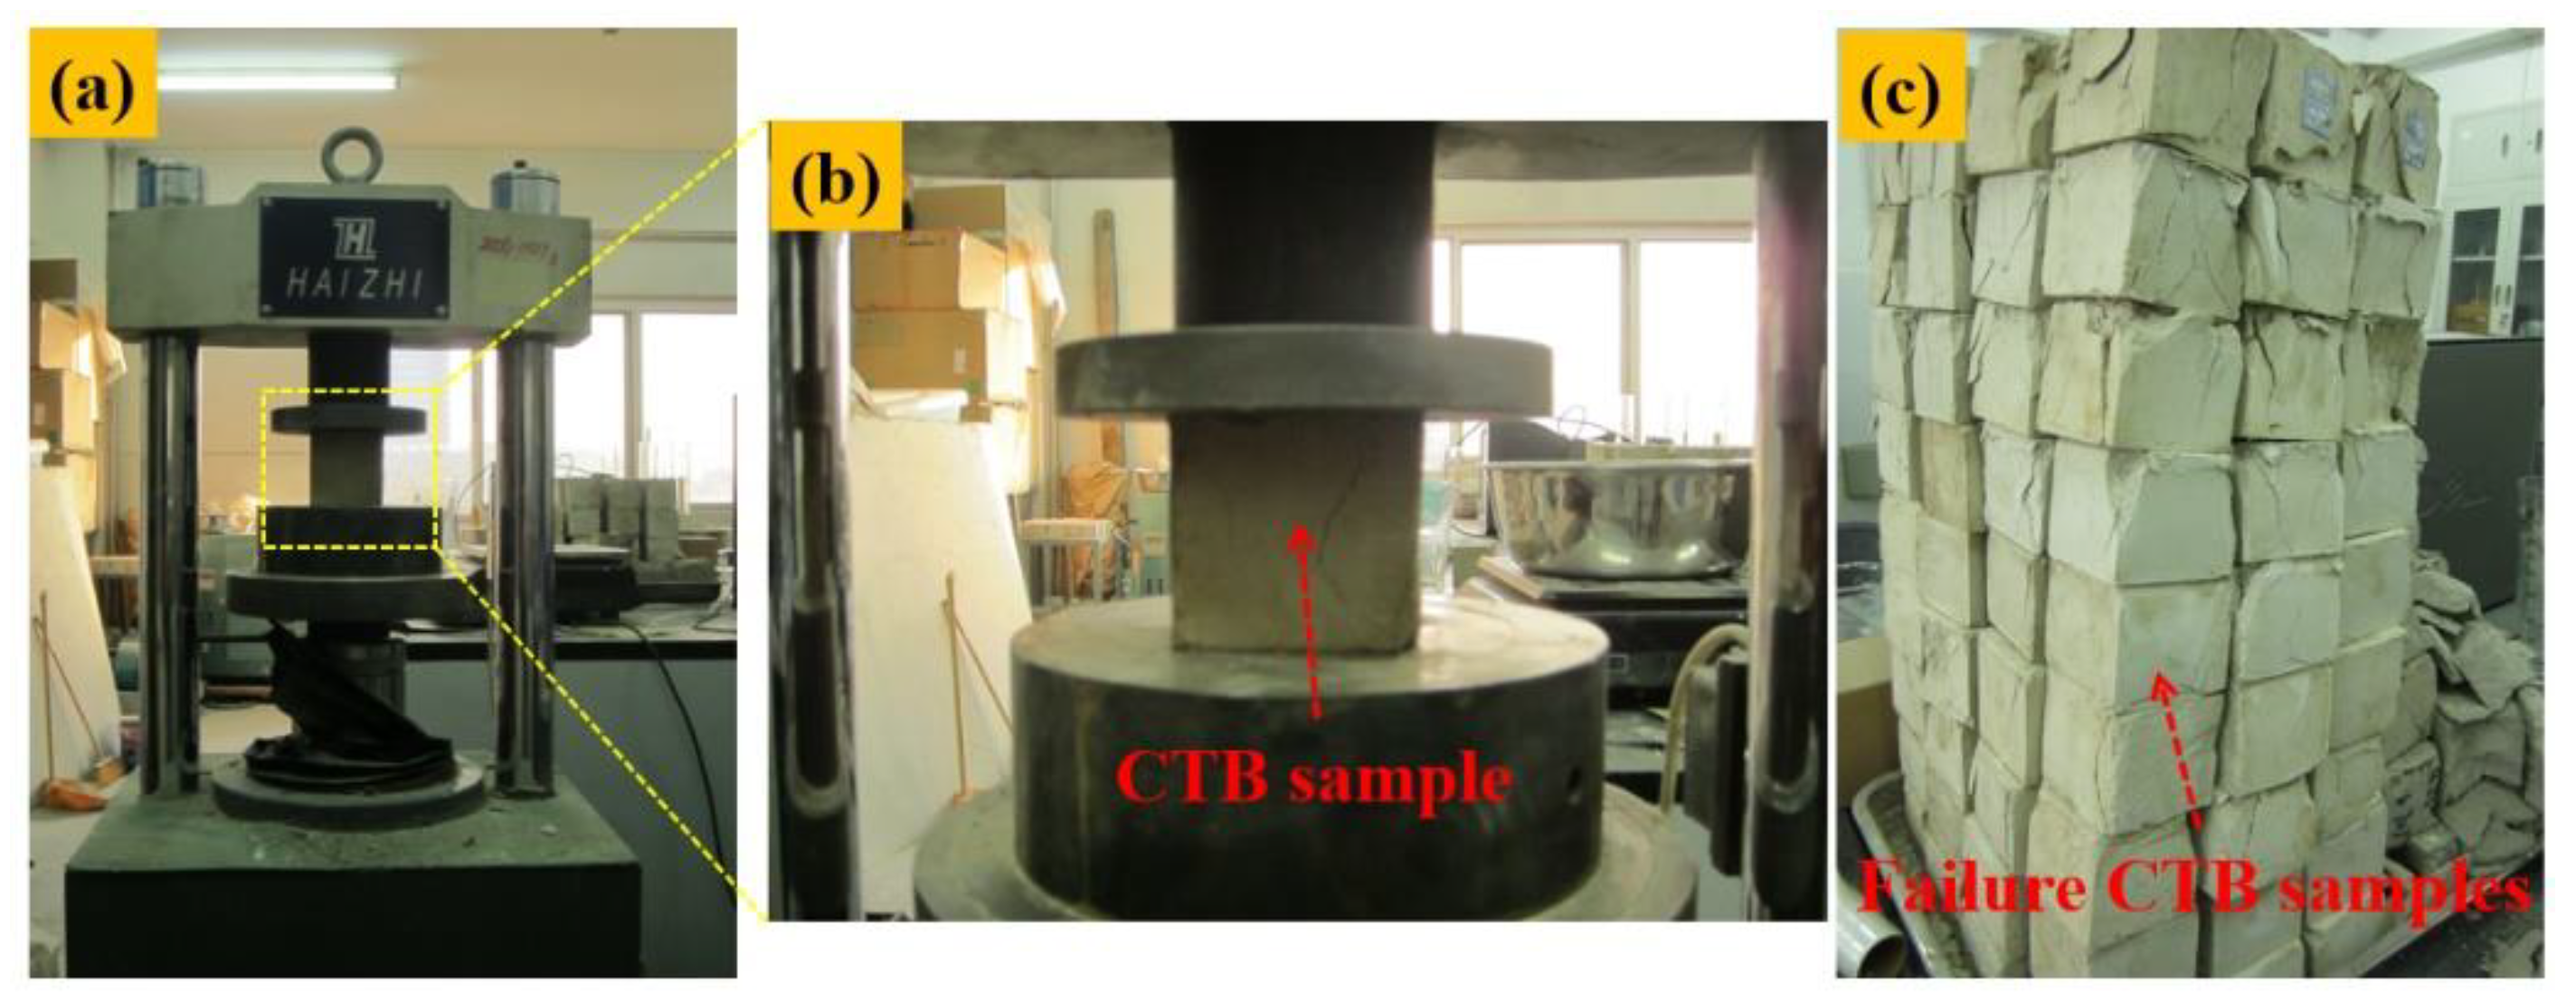
Uniaxial compressive testing is the most direct means to investigate the mechanical properties of the CTB samples. Considering the specifications to prepare the backfill were not consistent with the mine site, the fictitious recipe was used in this work to acquire the results. The solid contents of CTB samples were 65%, 68%, 70%, and 72%, curing times were 3, 7, and 28 days, and c/t ratios were 1:04, 1:06, 1:08, and 1:10. In this study, the Haizhi microcomputer-controlled electro-hydraulic servo rigid pressure testing system with a 100 kN loading capacity (Figure 4) was used to determine the uniaxial compressive strength of CTB samples.
The loading rate was 0.5 mm/min according to the ASTM C39 standard [56]. The load applied to CTB was measured by a pressure cell with a full-scale precision of 1%. The UCS corresponds to the maximum stress (or failure peak) reached during the compression test. Five measurements were conducted to determine an average UCS of CTB samples, and only the mean value was considered in the present study.
2.5. Microstructural Analysis
The microstructure of cementitious materials such as CTB greatly affects the backfill’s physical and strength properties, and also controls the stability of the long-term cemented backfills. A ZEISS EVO 18 scanning electron microscopy (SEM, Jena, Germany) was used to study the microstructure and texture of the 28-day cured CTB samples containing different solid contents. The SEM method provides some advantages, such as high resolution, large magnification time, and 3-D image views. EVO 18 provides excellent quality imaging results from an analytical microscope with the capability of handling all material types. Attention must be paid during sample preparation. The dried and gilded samples should be prepared for obtaining true and clear observations. At first, samples were cut out and separated from CTB mass. For SEM analyses, CTB pieces with a 3–5 mm thickness were fully soaked in alcohol, and vacuum oven dried at a temperature of 60 °C for 2 days. The final polishing process was done using a 1 μm diamond paste [57]. Figure 5 demonstrates the scanning electron microscopy test apparatus used during the experiments.
3. Results and Discussion
3.1. Viscosity Results of CTB Samples
A comprehensive understanding of the rheological characteristics of CTB throughout the paste operation is required for achieving the desired characteristics for underground backfilling. The rheological data such as viscous flow and yield stress are significant for the prediction of deposition behavior, pipeline transport, and pump design and the dewatering operation design.
Table 4 shows the viscosity results of CTB with different solid contents and c/t values. To obtain the relationship between the backfill’s viscosity, SD, and c/t ratio, a control variable method was used for assessing the results. Results indicate that for a c/t ratio of 1:04, viscosity significantly increases from 14.9 Pa·s to 116 Pa·s when the CTB’s solid content increases from 60% to 72%. However, when the c/t ratio for CTB samples increases from 1:04 to 1:10, the corresponding viscosity decreases from 14.9 to 8.3 for a fixed SD value of 60 wt %. The most common effect of solid content on viscosity behavior of CTB samples is a shift from Newtonian behavior at low solid contents, through Bingham behavior at intermediate contents to yield stress shear thinning behavior at higher solid contents, depending on mineralogy and particle size distribution among other factors.
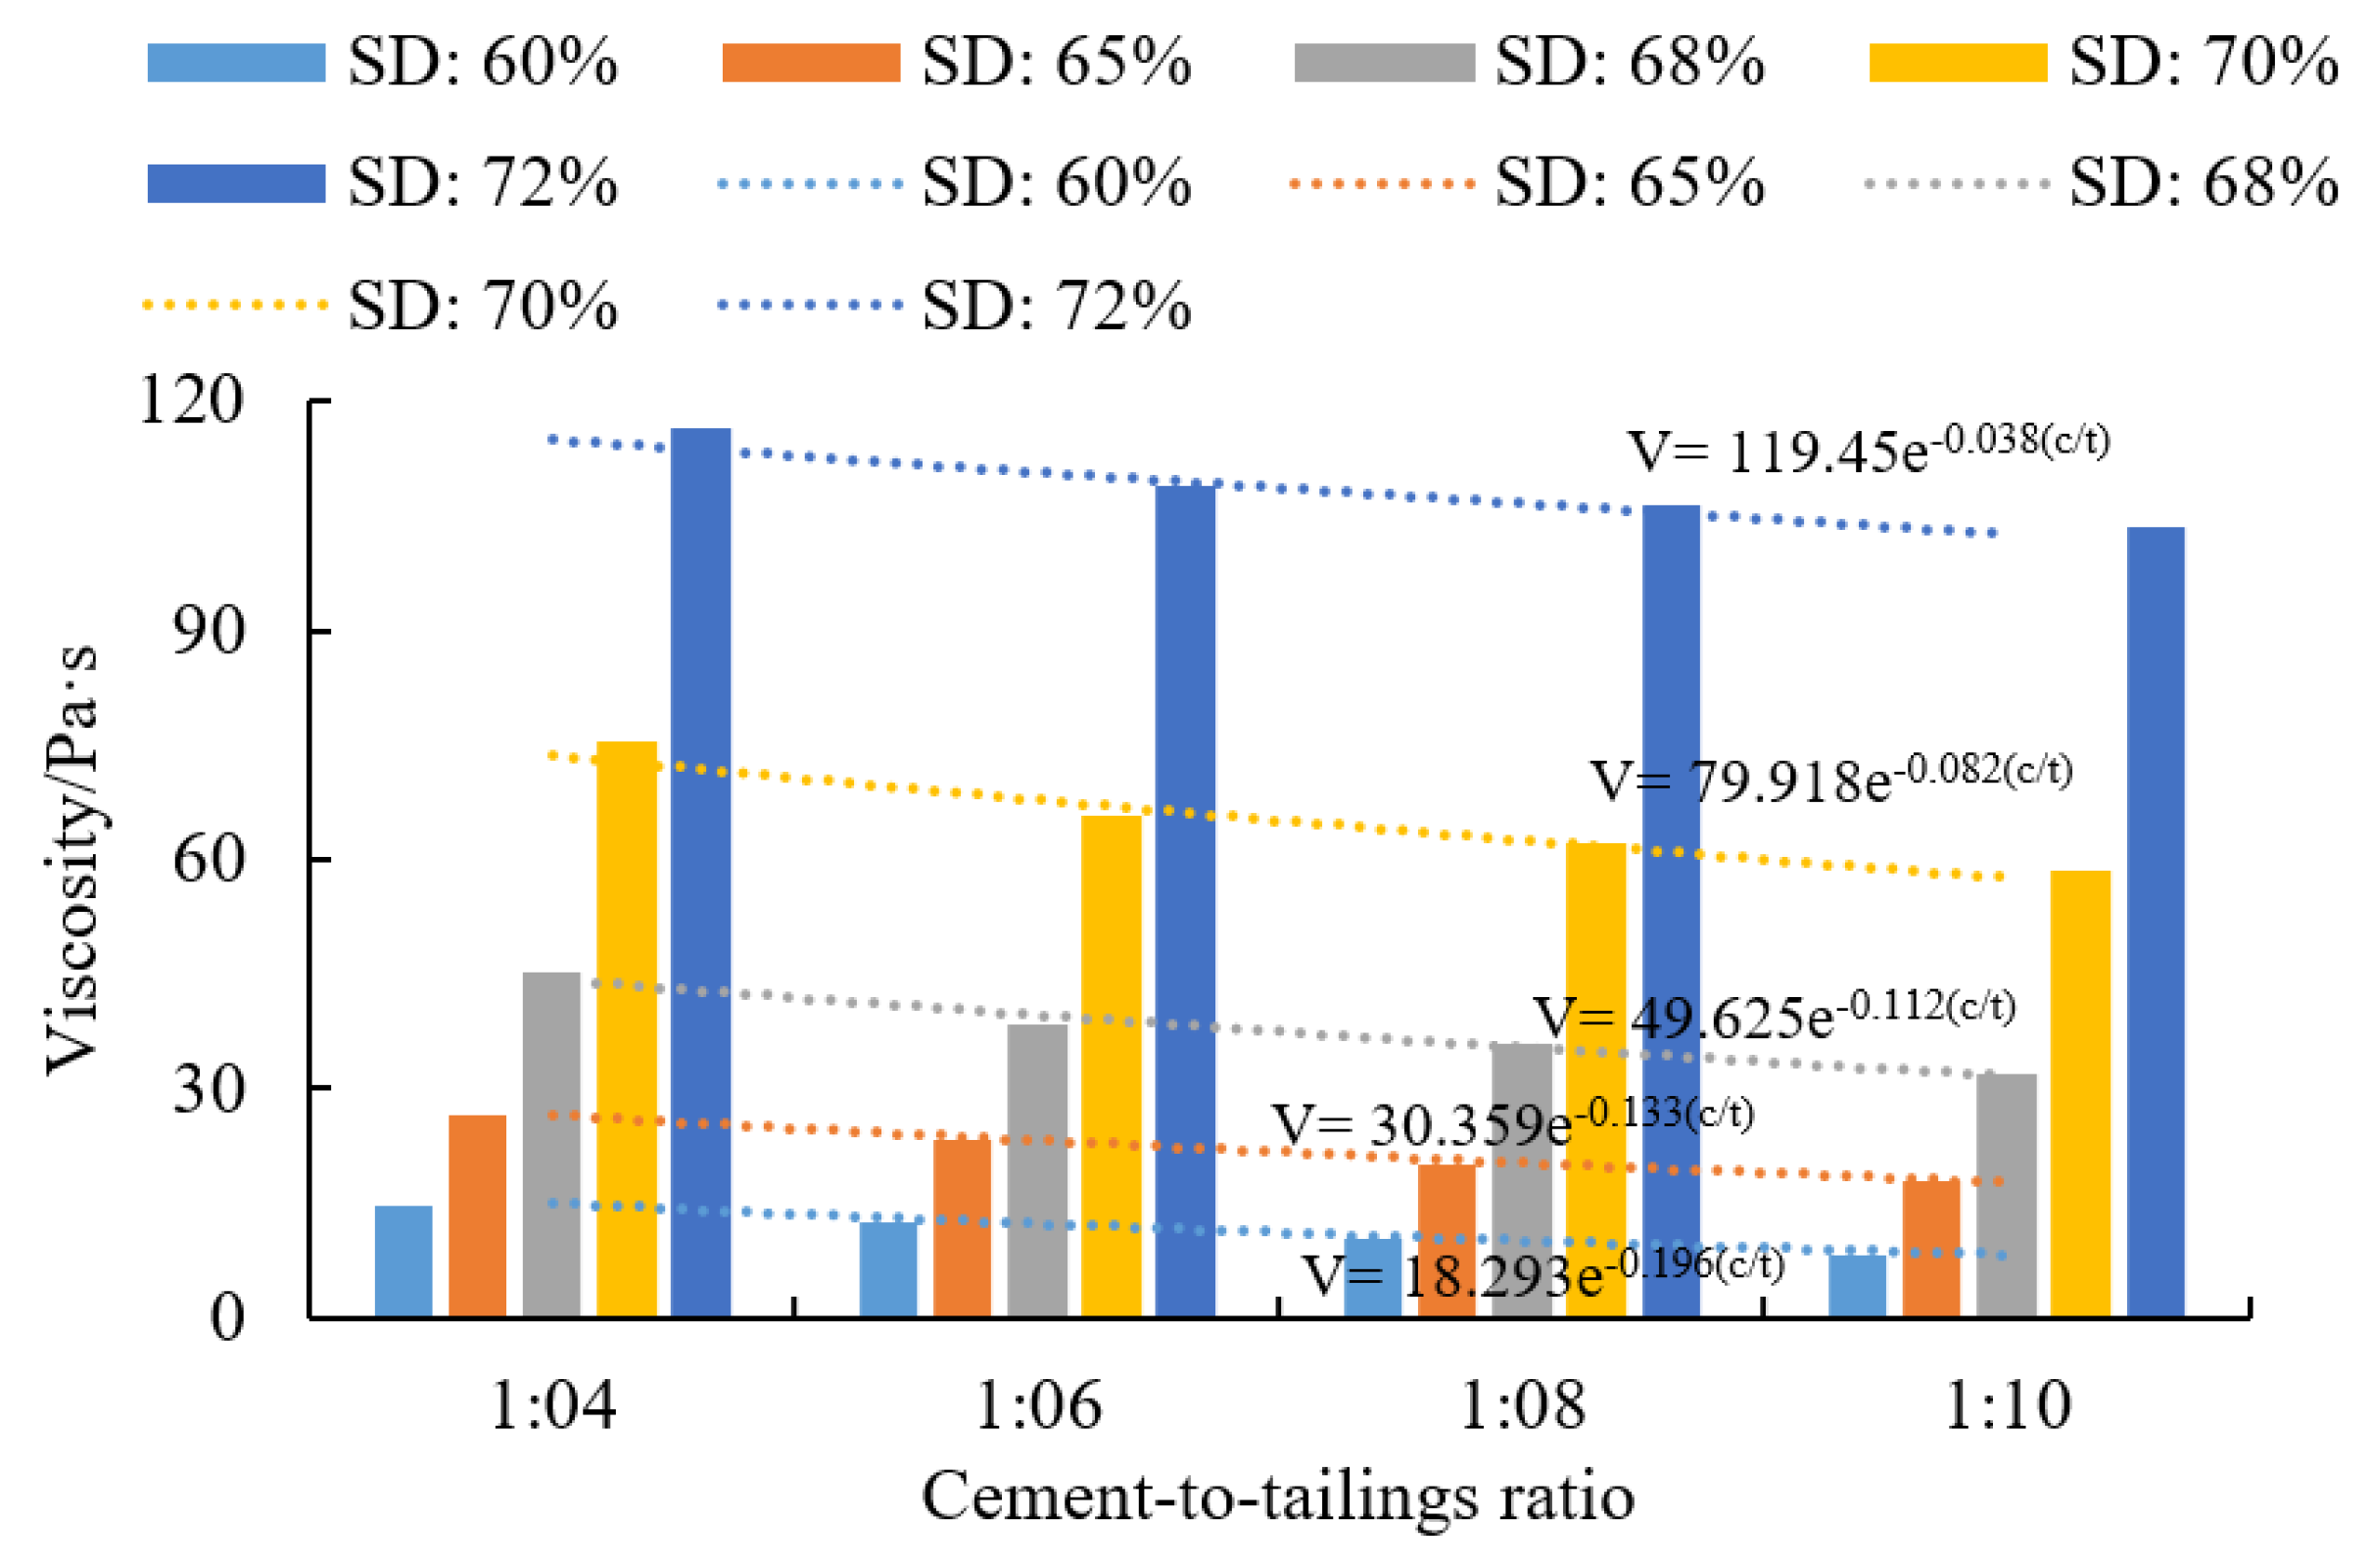
3.1.1. Effect of Cement-to-Tailings Ratio
A number of CTB samples with different cement-to-tailings ratios (c/t: 1:04; 1:06; 1:08; and 1:10) were prepared at solid contents varying from 60 wt % to 72 wt %. Figure 6 shows the typical viscosity curves of CTB samples. One can say that when the cement-to-tailings ratio increased from 1:10 to 1:4, viscosity decreases mainly due to the high particle packing density of the backfill and the increased number of cement hydration products, such as C-S-H gels. These hydration products can establish links between grains and lead to CTB samples with higher viscosities. Considering the ingredients of CTB mixes such as tailings, water, and cement, water is used for cement hydration and for filling the particle voids, resulting in higher backfill flowability.
The CTB samples with low solid contents (60–68 wt %) provide lower viscosities (8–45 Pa·s), while the CTB samples with high solid contents (70–72 wt %) yield higher viscosities (58.5–115.5 Pa·s). In cementitious matrixes, such as CTB matrix, an engineered mix of tailings and cement gives a relatively high-density backfill matrix, which results in higher viscosity. In addition, the alkalinity property of the cement helps particle sedimentation, which leads to an increase in viscosity.
To better investigate the relationship between viscosity values and cement-to-tailings ratio for CTB samples, the solid content was fixed. Linear fitting, exponential fitting, and logarithmic fitting methods were used and Table 5 shows the fitting results, representing the quantitative relation according to the magnitude of the multiple correlation coefficient (R2).
It was found that linear, exponential, and logarithmic fitting methods all have higher fitting degrees. The responding average multiple correlation coefficients (R2) are 0.9608, 0.9696, and 0.9645, respectively. Among them, the exponential correlation provided the highest correlation coefficient. Moreover, it was also found that the viscosity of the CTB slurry increases with the cement-to-tailings ratio increases significantly due to particle rearrangement and cement hydration products over time. As a result, the relation between c/t and viscosity of CTB samples can be expressed as an exponential equation, and the relevant expression can be defined in Equation (1).
where V is the viscosity of the CTB slurry mixes, c/t is the cement-to-tailings ratio. A1 and B1 are the fitting parameters related to the influence of solid content and c/t factors.
3.1.2. Effect of Solid Content
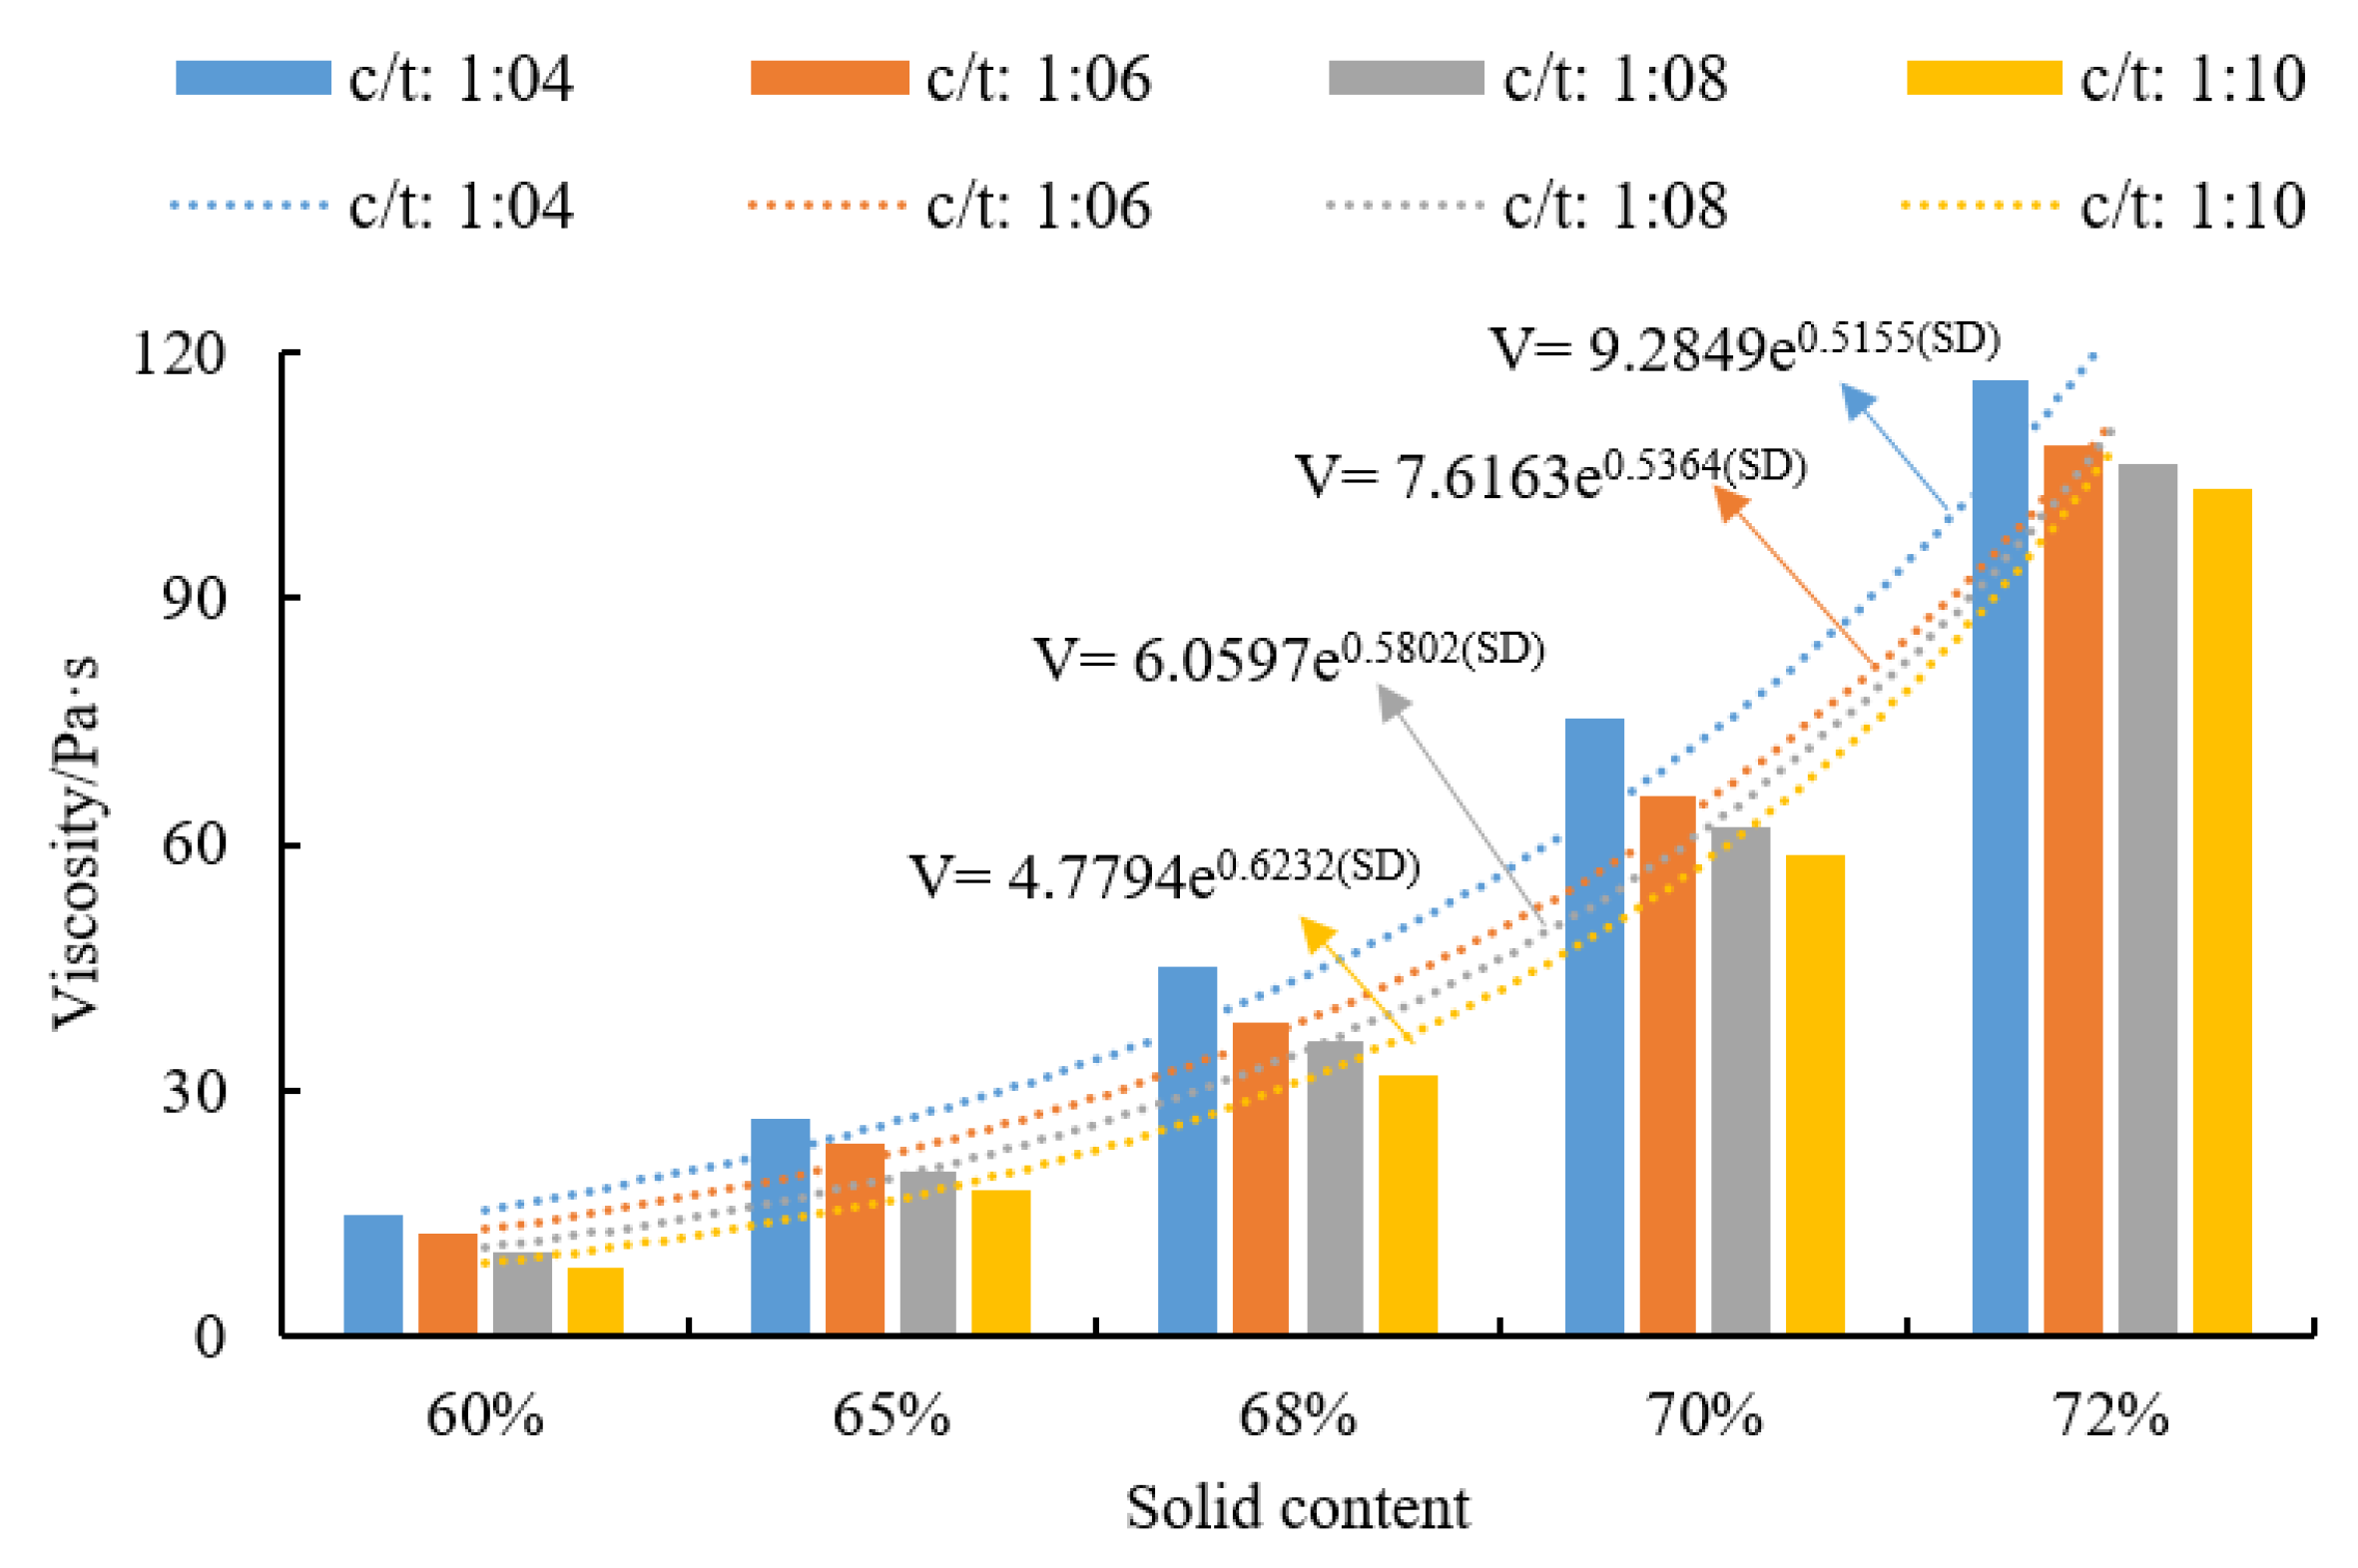
The solid content is of great importance in responding to the rheology of the prepared backfill slurry mixes. The two main factors, grain size distribution, and chemical-mineralogical composition are vital for understanding the CTB’s rheological behavior. A change of ±1 wt % in solid content may change significantly the rheology of the backfill slurry formed. Figure 7 shows the histogram curves between SD and viscosity of CTB samples.
One can say that as the solid content of CTB samples increases from 60 wt % to 72 wt %, the viscosity of the CTB slurry with a c/t ratio of 1:04, 1:06, 1:08, and 1:10 increases from 14.9 to 116.5 Pa·s, from 12.5 to 108.8 Pa·s, from 10.3 to 106.5 Pa·s, and from 8.3 to 103.4 Pa·s, respectively. This behavior can be explained by the thickness of the lubricating film between tailings particles within the CTB matrix, which reduces with increasing solid content and particle contacts, thereby resulting in an increase in friction between the solid particles. One can also state that a finer tailings CTB material will have a higher viscosity at a given solid content mainly due to the finer slurry having a greater grain-specific surface area, and thus, a greater area available for inter-particle interactions.
The c/t values were considered as constants to better study the variation of the viscosity of CTB samples with different solid contents. Linear fitting, exponential fitting, and logarithmic fitting of the variation of viscosity were conducted and the relevant R2 was listed in Table 6.
It is also found that the multiple correlation coefficients (R2) of the exponential fitting are obviously higher than the linear and logarithmic fitting results. The R2 for the linear and logarithmic fits were only 0.7943 and 0.7729, while the exponential fit was 0.9723. In summary, the relation between solid content and viscosity of CTB samples can be expressed as an exponential equation, and the relevant expression can be defined in Equation (2).
where V is the viscosity of the CTB slurry mixes, c/t is the cement-to-tailings ratio. A2 and B2 are the fitting parameters related to the influence of solid content and viscosity factors.
3.2. Uniaxial Compressive Strength Results of CTB Samples
Uniaxial compressive strength (UCS) is considered as one of the most important parameters in designing the CTB matrix used for underground mines. Various intrinsic and extrinsic factors may greatly affect the quality and performance of the CTB mix [58,59]. A total of 288 CTB samples were prepared and subjected to UCS testing for this investigation. Each group was tested 6 times, and the average UCS results were obtained for comparison. Table 7 presents the UCS data obtained from the performed mechanical strength testing.
One can observe that the CTB strength increases notably when the c/t ratio increases from 1:04 to 1:10, regardless of curing time and solid content. The increase in the strength gain is mainly due to increasing cement content used in CTB which can be explained by the production of secondary C-S-H gels based on a reaction of mineral admixtures in ordinary Portland cement with C-H formed during the hydration process. It is well known that C-S-H gels can form a protective coating on alumina-rich phases which connect in the formation of ettringite. These C-S-H gels give rise to a denser packing of the microstructure of CTB with the reduced hydraulic conductivity and the increased mechanical strength for a given cemented tailings backfill recipe and curing time.
In addition, the backfill’s compressive strength increases with the increased solid content in the mix. This is mainly due to a major reduction in the added water content, which may seriously affect the workability of the backfill mixtures. Controlling the solid content of CTB samples is of great importance in improving the safe pumpability of the backfill mixes to the underground mined-out stopes. If the backfill’s solid content is too high, blockage may occur in pipeline, which causes paste fill production losses and downtime. The SD has a positive effect on UCS: the higher the SD, the higher the CTB strength. Considering the negative effect on pumpability of the backfill, establishing a balance level between UCS and workability is vital for an efficient backfill design.
3.2.1. Effect of Solid Content
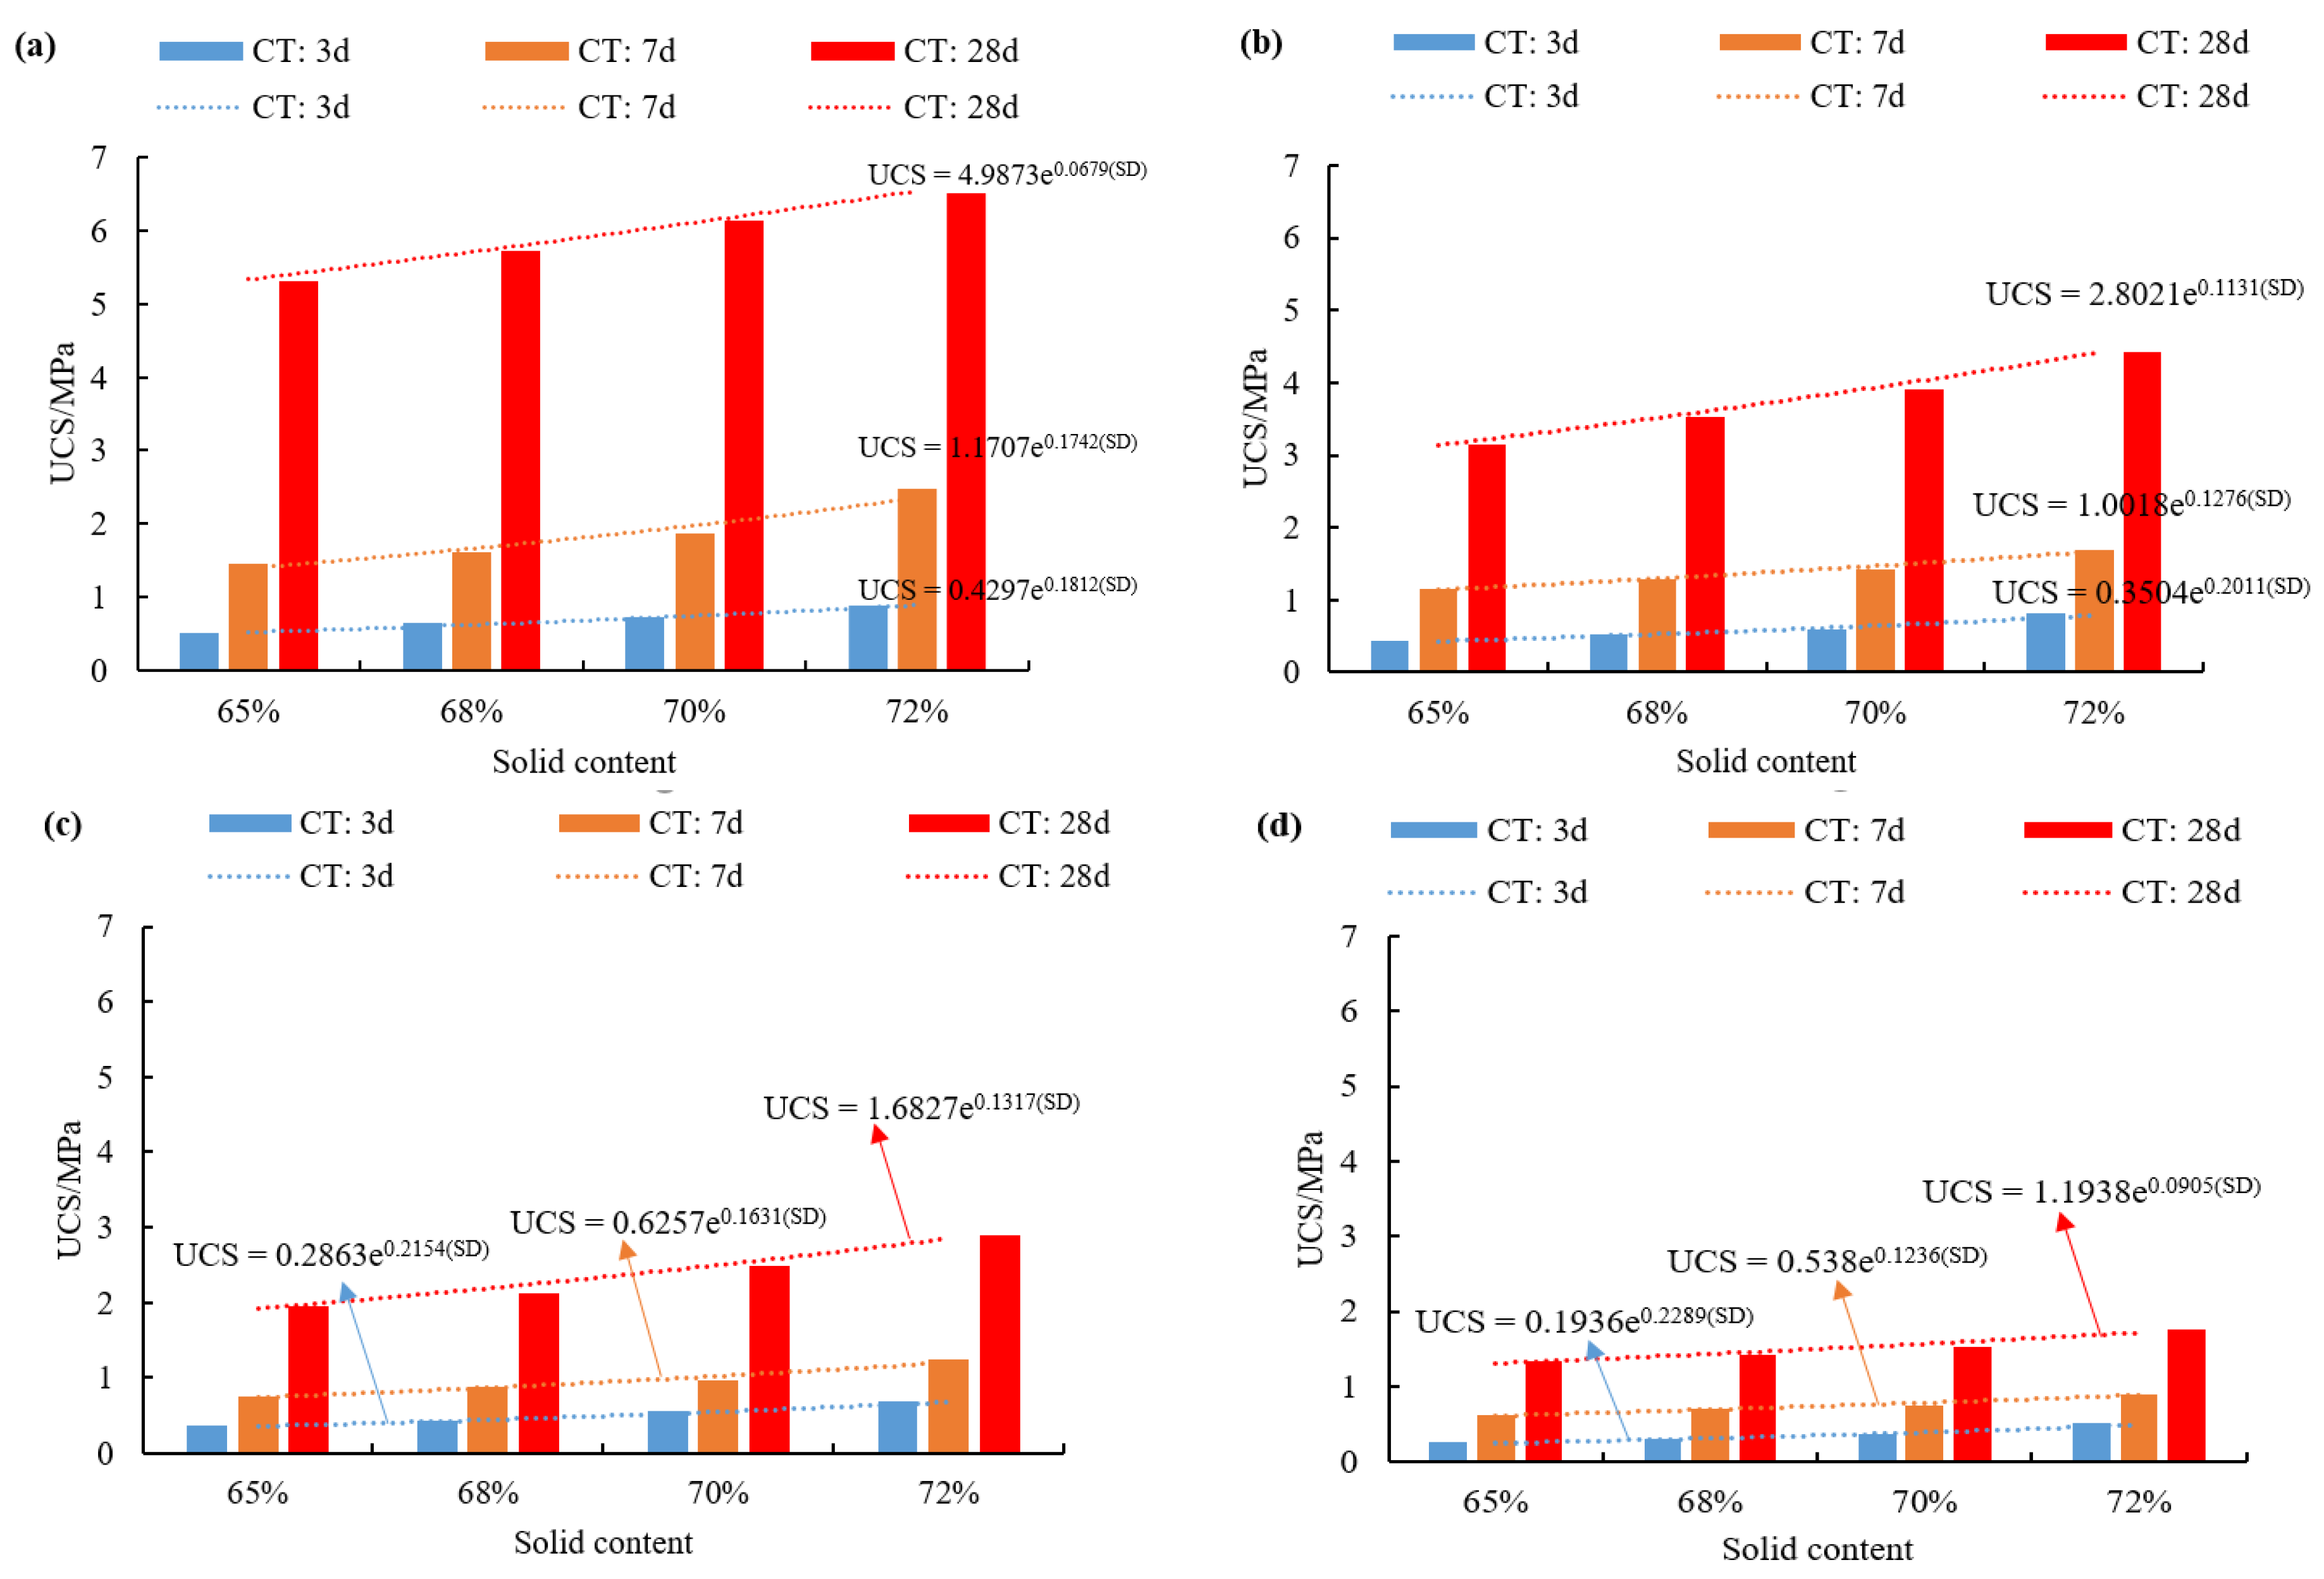
Figure 8 shows the change in the CTB strength with the SD as a function of curing time. As expected, the samples’ strength increases with increasing SD for a given binder content. For a SD of 65 wt % at a constant c/t ratio of 1:04, the strength of 3-day cured CTBs is 0.5 MPa. When the SD increased from 65 wt % to 72 wt %, the corresponding UCS becomes 0.9 MPa, causing a 44% increase in the strength of CTB. As the SD is increased from 65 wt % to 72 wt %, UCS increases from 1.5 to 2.5 MPa for 7 days and from 5.3 to 6.5 MPa for 28 days, respectively.
These increases observed in the mechanical strength of CTB samples, depending on the solid content used in the matrix, are due to higher cement consumption in volume. Increasing the C-S-H gels in the backfill after cement hydration over time leads to a higher bond strength between tailings and cement, and thereby, to a higher CTB’ strength and stiffness. The solid content (also stated as a water-cement ratio) in the mix is a vital parameter for CTB matrix since it controls the hydration and precipitation reactions, which are closely related to the hardening processes within the backfill. In fact, the CTB’s hardening processes are governed by the hydration reactions and the chemical solubility rates. The precipitation phenomena resulted in the formation of solid phases when they reached up their saturation index. The solid phase includes not only calcium hydroxide and C-S-H gels, but also ettringite and gypsum within the CTB materials. The CTB samples with low solid content have low mechanical strengths with the identical curing times (3, 7 and 28 days). Similarly, the CTB samples with high solid content (it means low water-to-cement ratio for cemented backfills) have a smaller amount of apparent porosity. This is due to the fact that less excess drainage water causes the fast settlement of CTB samples (increasing of the packing density in the mix and therefore the ultimate backfill strength increases), and accordingly, a resultant reduction of total porosity and void ratio of the backfill material.
The cement-to-tailings ratio and curing time values were considered as constants to study the variation of the UCS performance of CTB samples containing different solid contents. Linear fitting, exponential fitting and logarithmic fitting of the variation of viscosity for different cemented tailings backfill mixtures were conducted experimentally and the correlation coefficient (R2) obtained was listed in Table 8.
Table 8 shows the exponential fitting between sold content and UCS values of CTB samples. It was found that when the cement-to-tailings ratio was 1:04, 1:06, 1:08, and 1:10, the corresponding multiple correlation coefficients (R2) for the exponential fit were 0.9630, 0.9603, 0.9502, and 0.9455, respectively. Both linear and logarithmic fitting degrees are significantly less than the exponential fit alone. The effect of solid content on the UCS behavior of CTB samples is in good agreement with the exponential function.
Figure 8 demonstrates the exponential fitting results, based on the relationship between c/t and viscosity of CTB samples can be expressed as an exponential equation, and the relevant expression can be defined in Equation (3).
where UCS is the uniaxial compressive strength of the CTB slurry, SD is the solid content. A3 and B3 are the fitting parameters related to the influence of solid content and UCS factors.
3.2.2. Effect of Cement-to-Tailings Ratio
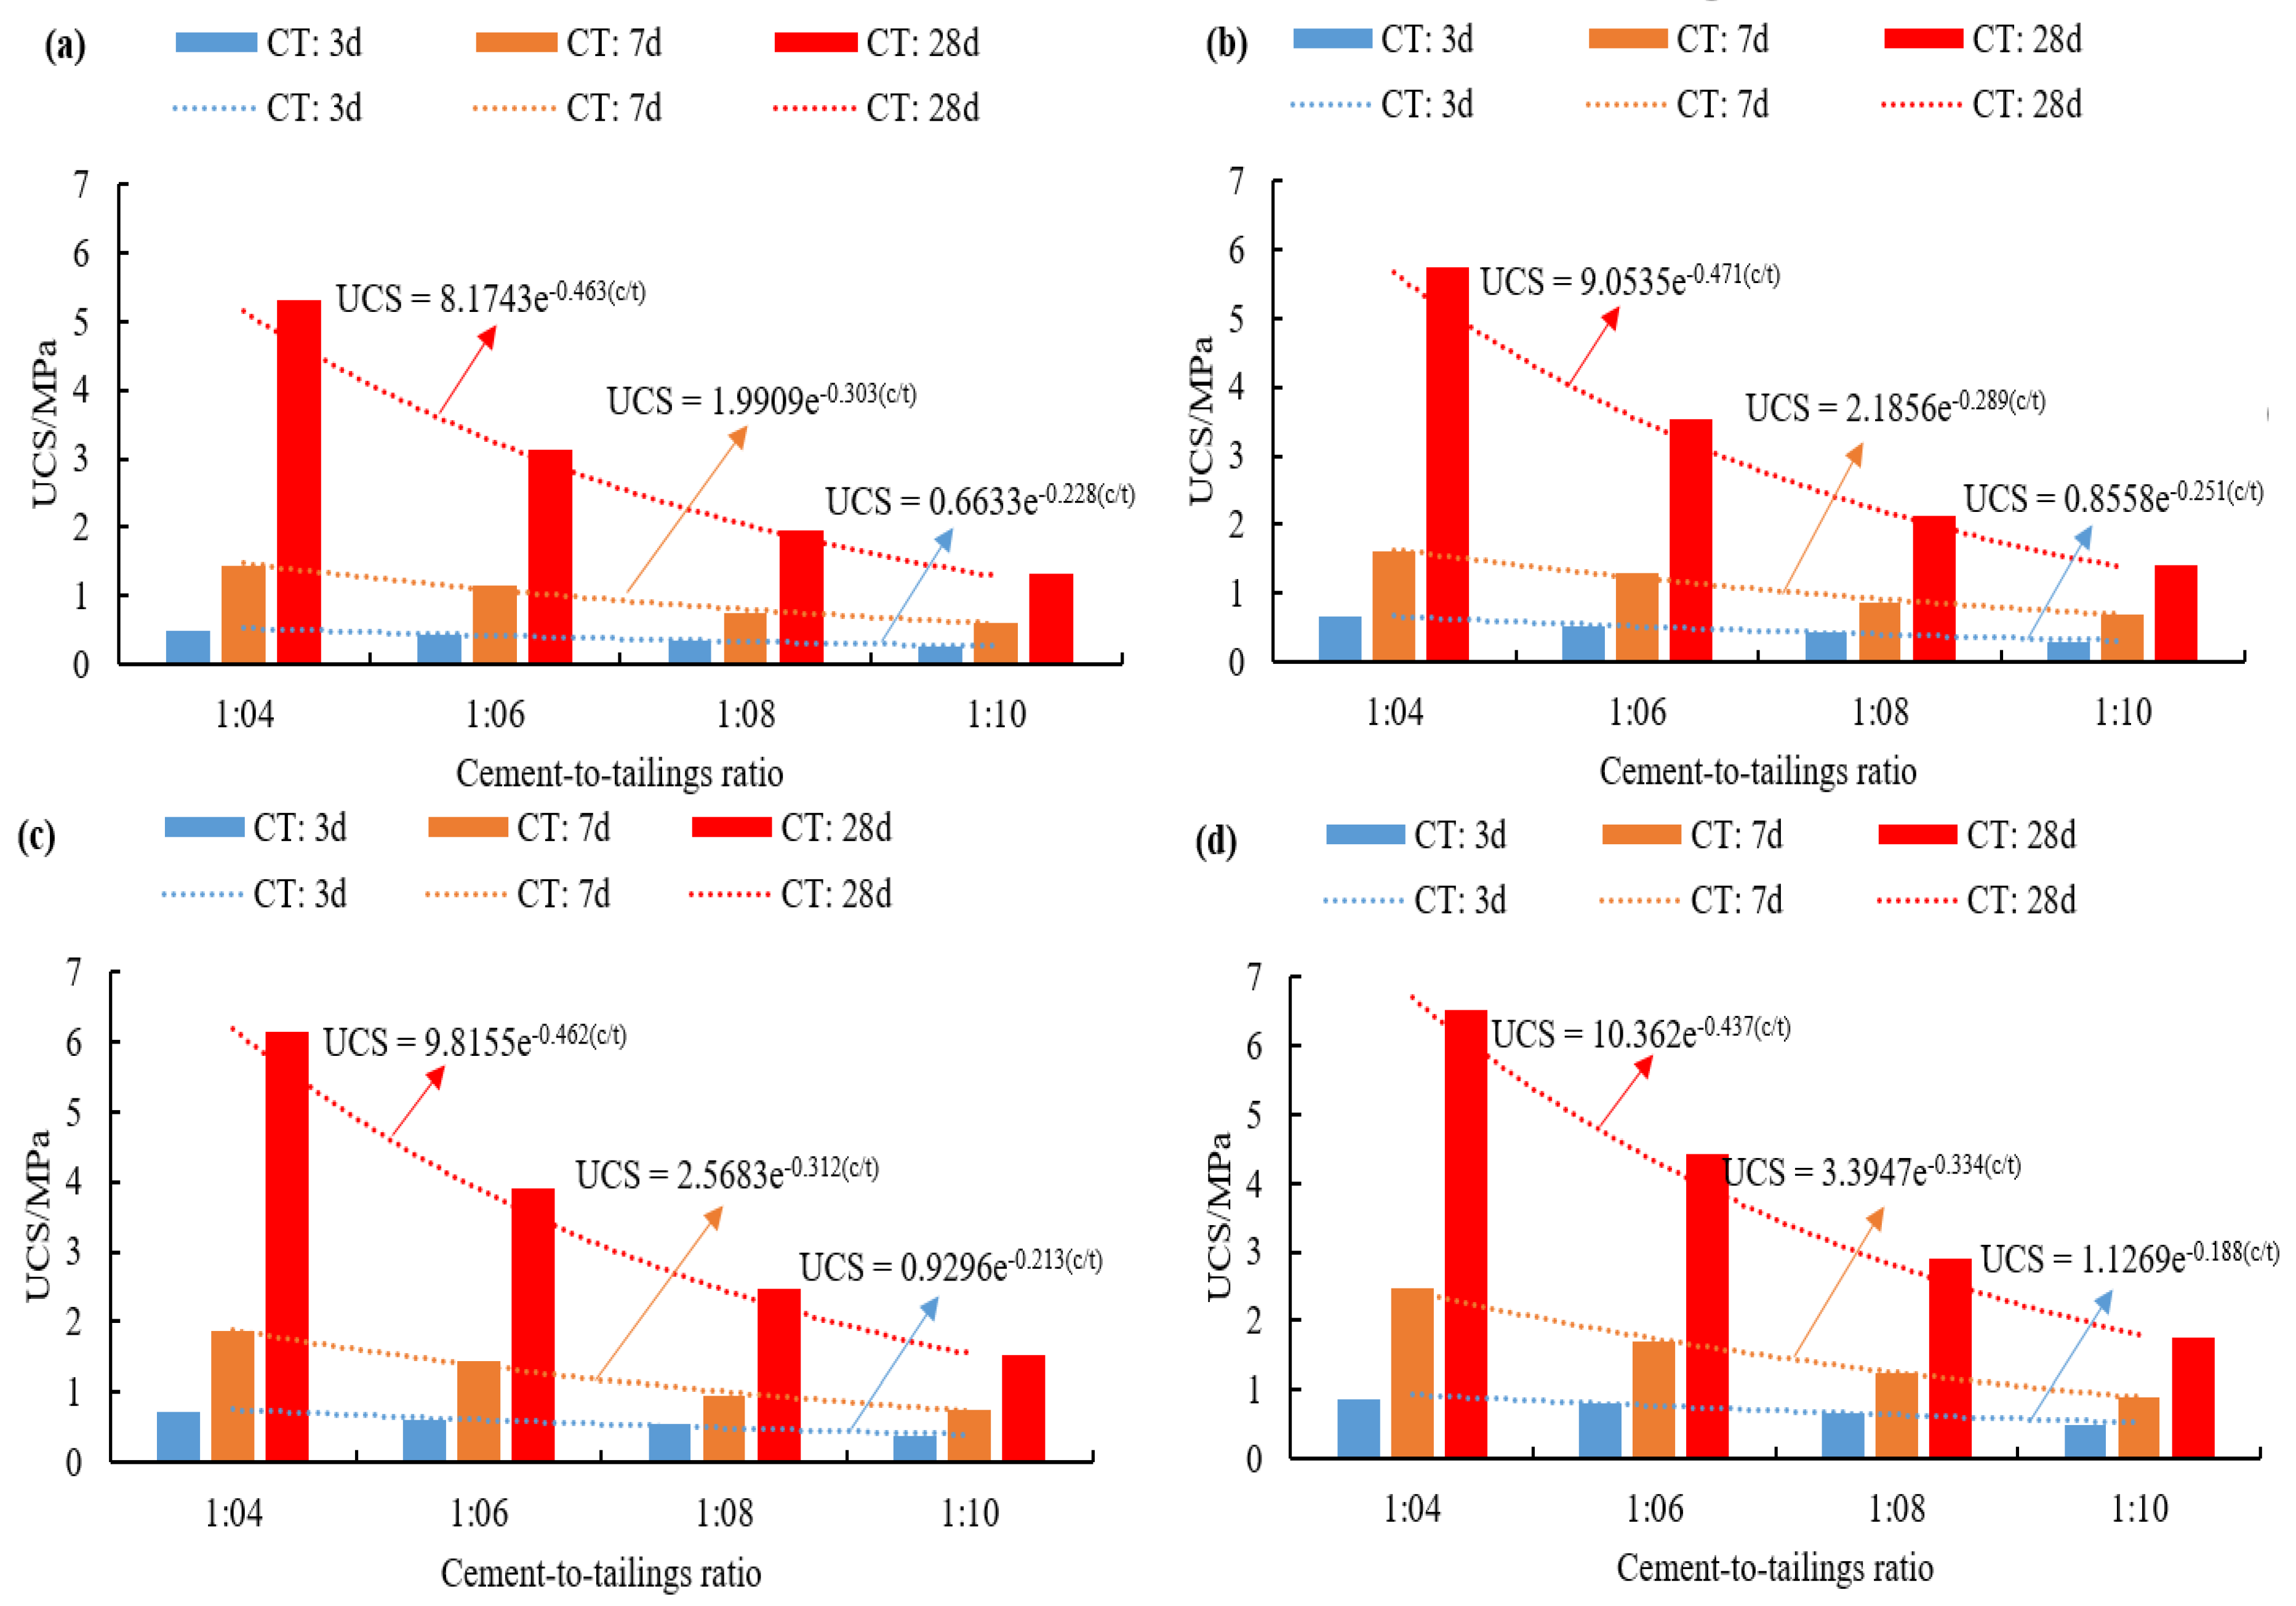
Figure 9 represents the fitted histogram of cement-to-tailings ratio and strength gain of CTB samples. One can observe from the performed test results that, for a given solid content in the mix, the mechanical strength gain of CTB samples increases with an increase in the cement-to-tailings ratio, irrespective of curing time. When the cement-to-tailings ratio increased from 1:10 to 1:04 respectively, the compressive strength of CTB samples with a solid content of 65 wt % increased from 0.25 to 0.5 MPa for 3 days, from 0.61 to 1.45 MPa for 7 days, and from 1.33 to 5.32 MPa for 28 days. For CTB samples with a solid content of 70 wt %, these rates increased from 0.37 to 0.73 MPa for 3 days, from 0.75 to 1.86 MPa for 7 days, and from 1.53 to 6.14 MPa for 28 days. As expected, increasing the quantity of the binder used in the backfill mix gives rise to the high strength of CTB samples. The reason behind this strength increase is that the higher binder content results in the formation of more hydration products, such as C-S-H gels, providing a higher strength of the CTB matrix.
For a given cement content or tailings grain size, the lower the water-to-cement ratio, the higher the mechanical strength of cemented tailings backfill samples. When the water-to-cement ratio in the mix is reduced, the strength gain of CTB samples increases, mainly due to the decrease in overall void ratio. An increase in the tailings particle size reduces the backfill’s void ratio, causing the pore refinement of the CTB mix. A decrease in the void ratio leads to an increase in the strength gain of the backfill. Tailings fineness also has an influence on the backfill strength; CTB samples prepared with coarser tailings exhibits higher strengths than those obtained from finer tailings due to the tailings’ specific surface area. In addition, the mineralogical composition (especially silicate and sulfidic minerals) is closely related to the backfill’s strength gain. Depending on their mineralogy, finer tailings show high water retention, which may represent the CPB matrix having good flow properties, but relatively lower strength gains. Note that minerals like pyrite can induce strength retardation and reduction due to internal sulfate attack.
The solid content and curing time values were considered as constant to better study the UCS variation of CTB samples with different cement-to-tailings ratios. Linear fitting, exponential fitting, and logarithmic fitting of the variation of viscosity in the mixture were conducted and the relevant correlation coefficient (R2) was listed in Table 9.
It was found from Table 9 that exponential and logarithmic fitting methods have higher fitting degrees. The responding multiple R2 are larger than 0.94. Among them, the exponential correlation has the highest R2. When the solid content was 65%, 68%, 70%, and 72%, the corresponding R2 for the exponential fit were 0.9746, 0.9876, 0.9715, and 0.9739, respectively. Moreover, it was also found experimentally that the UCS performance of CTBs increases with increasing cement-to-tailings ratio. The relationship between c/t and UCS of CTB samples could be well expressed as the exponential equation, and the relevant expression can be defined in Equation (4).
where, c/t is the cement-to-tailings ratio. A4 and B4 are the fitting parameters related to the influence of c/t and UCS factors.
3.2.3. Effect of Curing Time
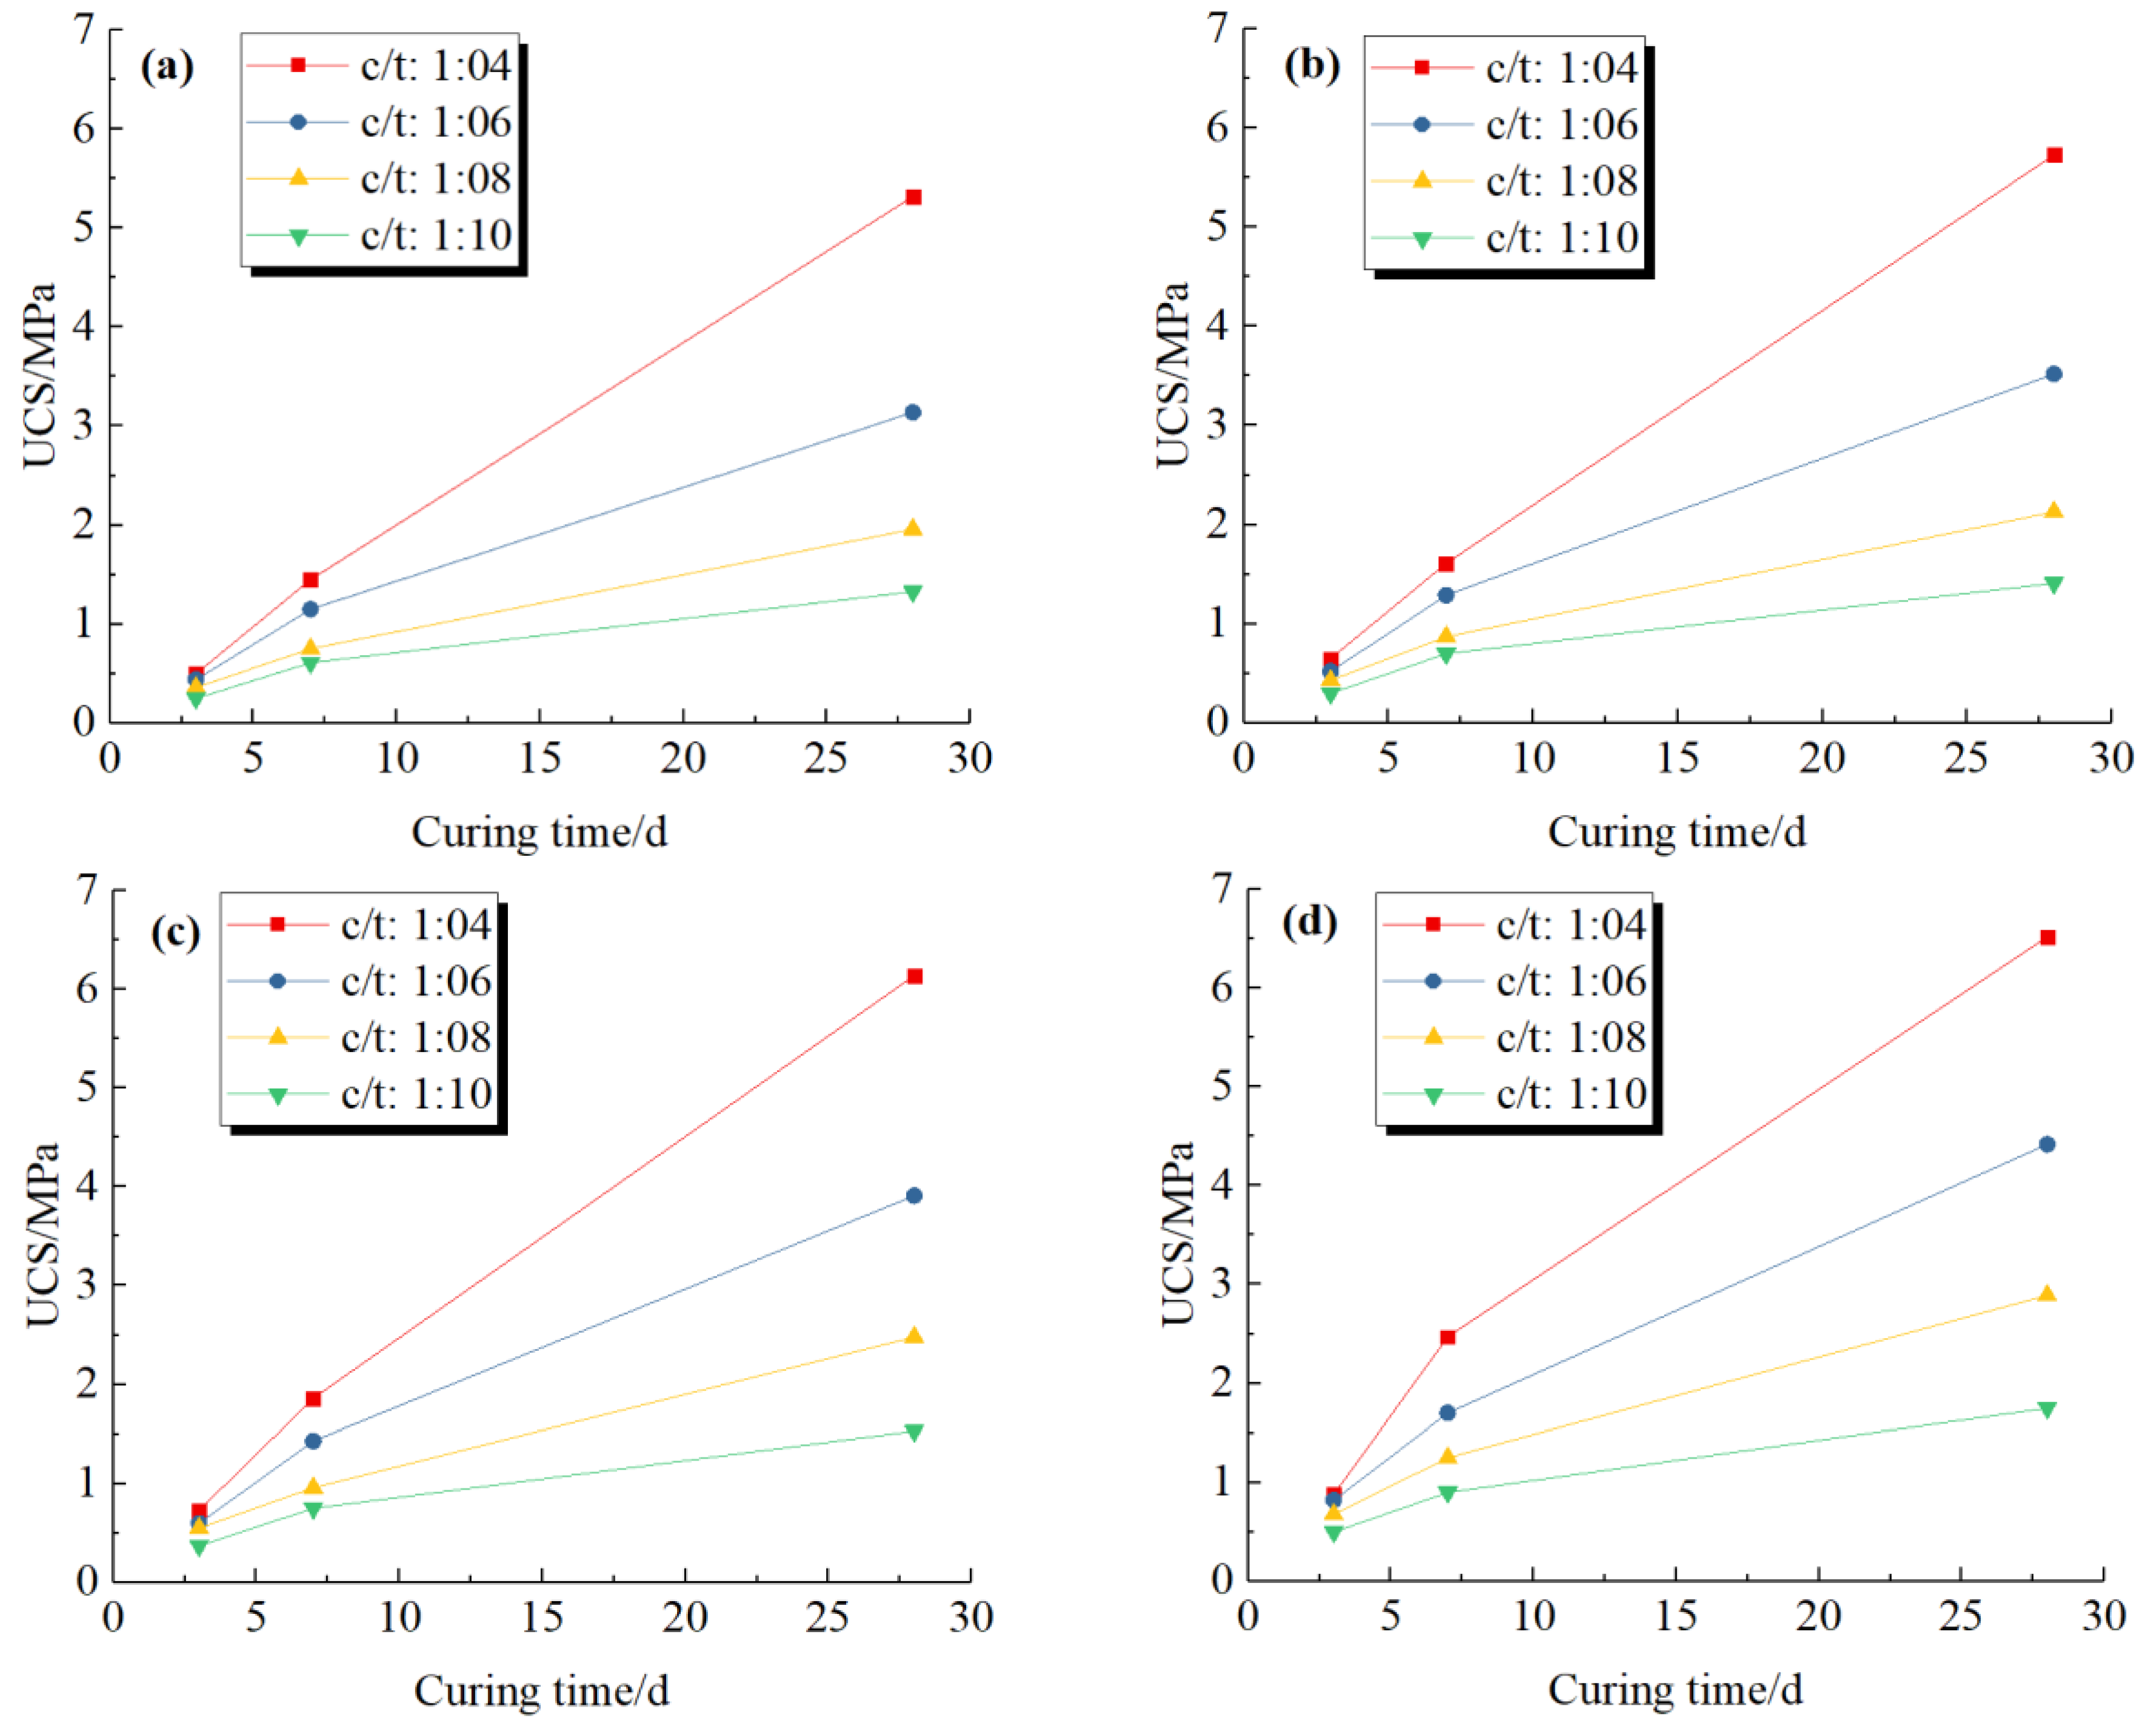
The UCS variation of 28-day cured CTB samples with four different solid contents (65%, 68%, 70% and 72%) is shown in Figure 10. One should emphasize that since the curing time is only 3, 7, and 28 days, the three-point data does not meet the conditions for data fitting, so no corresponding data fitting analysis has been conducted. Instead, one can say that as the curing time increases, the UCS performance of CTB samples increases, irrespective of c/t ratio and SD factors.
For instance, the strength of CTB with a solid content of 72 wt % and a cement-to-tailings ratio of 1:04 is 0.88, 2.47, and 6.52 MPa for a curing time of 3, 7, and 28 days, respectively. At a fixed solid content (72 wt %), these values were 0.82, 1.7, and 4.42 MPa; 0.68, 1.25 and 2.89 MPa; 0.5, 0.9, and 1.75 MPa for a cement-to-tailings ratio of 1:06, 1:08, and 1:10, respectively. As expected, when the curing times increase, CTB samples tend to get hardened mainly due to the progress of cement hydration. This eventually causes a gradual increase of the backfill’s stiffness and strength.
One can observe from the obtained results that the void ratios present within the cemented tailings backfill samples are significantly reduced by filling with the finer hydration products, consequently increasing the backfill’s stiffness. Such a high variation in the mechanical strength can be closely associated with the drainage water, cement hydration, and self-weight or time-dependent consolidation. The drainage of excess free waters within fresh CPB samples gives rise to a major reduction in the overall porosity (i.e., increased backfill density) of cemented tailings backfill mixes, and accordingly, to higher compressive strength acquisitions. Additionally, the drainage of free water in the backfill mix affects positively the cement hydration mechanisms.
This eventually causes more solid cementitious matrices (i.e., the filling of pore sizes occurred mainly due to the cement hydration products), which are reflected by a superior cohesion between tailings and cement (i.e., interaction between tailings particles and hydration products), providing the high mechanical strengths for a given CTB recipe and curing time.
3.3. Microstructural Characteristics
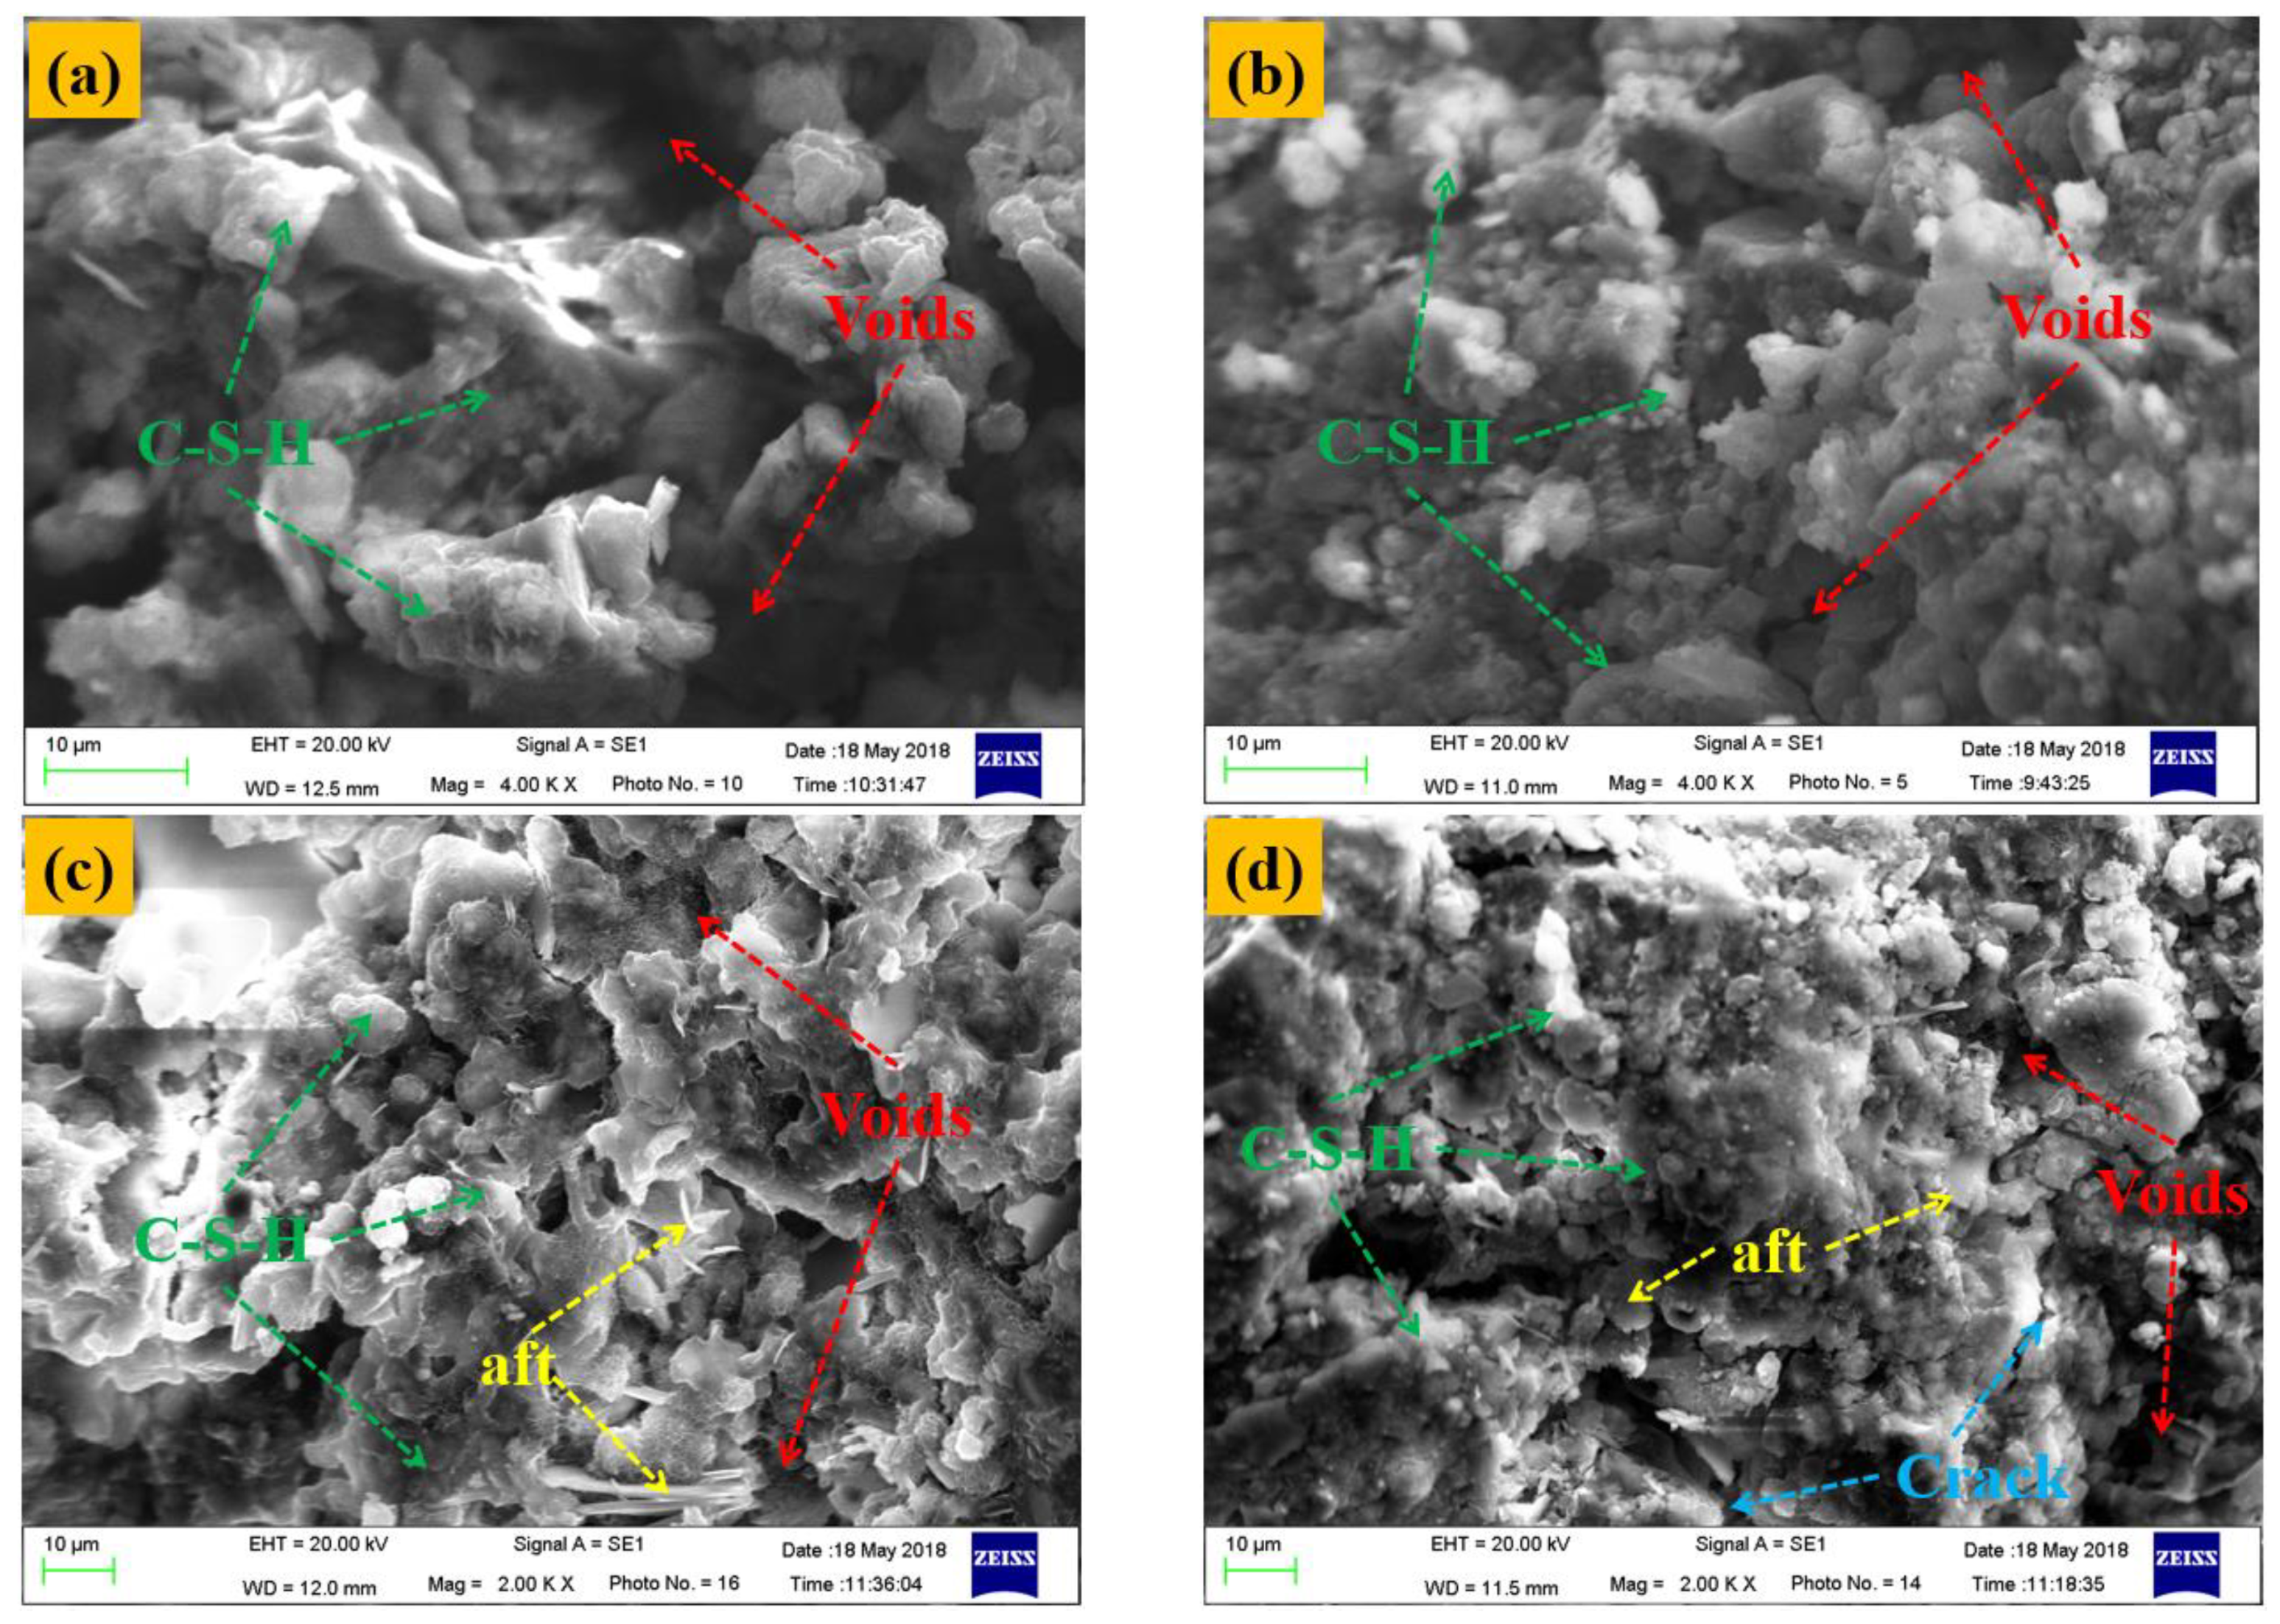
Indeed, the CTB matrix is a solid-liquid-gas multiphase system which consists of C-S-H, ettringite (aft), voids. SEM micrographs of CTB samples containing different solid contents (65%, 68%, 70% and 72%) were shown in Figure 11. To study the relationships between the compressive strength and the microstructure of the backfill, SEM analyses were done only on 28-day cured CTB samples after UCS testing. Images indicate that particles in the backfill are evenly dispersed within their matrix. The voids between the tailings particles are partially covered with hydration products, depending on the number and rate of cement hydration.
It was found that many ettringites and calcium silicate hydrates exist in the CTB matrix; a number of voids and cracks distributed in the plain cement tailings are notable as well. One can observe that, with the increase of the solid content, the C-S-H gels, ettringite and other different kinds of gels generate more and the original voids within the CTB matrix are filled up. During the load process, CTB samples with a higher slurry content correspond to a smaller void, which can significantly improve the compressive strength and pore structure of the prepared CTB mixes.
From the performed SEM micrographs, one can observe that the textural properties of CTB samples are directly related to their ultimate strength development for a given curing age (28 days). This means that the mechanical strength of CTB samples significantly increases with the denser CTB matrix, which contains fewer voids. The more the CTB matrix is dense, the more the mechanical strength gain develops.
In addition, SEM images indicate that the dense CTB matrix has been obtained by acting as a bridging component among tailings and cement, resulting in enhanced mechanical properties of the backfill mix. Note that the influence of the addition of cementitious materials on the strength properties of CTB samples is explained by the consumption of Ca(OH)2 liberated during the cement hydration, producing secondary C-S-H gels with bonding properties. This will develop inevitably the microstructure of CTB matrix with a denser packing density having a reduction in the porosity. In this view, a visible densification in the backfill tailings particles was observed to occur due to the formation of cement hydrates, such as C-S-H gels.
4. Conclusions
Good knowledge and understanding the rheological and mechanical properties of CTB are vital to obtain an efficient and low-cost CTB system for underground mines. Measuring the influence of operating variables on flow properties of a given CTB material is achieved by rheological testing. In this study, the effects of the solid content of cemented tailings slurry, the cement-to-tailings ratio, and curing time on the rheology, mechanical and microstructural behaviors of CTB samples have been intensively investigated experimentally. A number of quantitative relationships between the viscosity of the cemented backfill slurry mixes, the solid content (SD), the cement-to-tailings ratio (c/t), and curing time were developed for different CTB samples. It is also good to stress that the microstructural evolution of the CTB samples prepared at a curing time of 28 days alone was investigated using the scanning electron microscopy analyses. From the performed experimental tests on the CTB samples and the different test results presented, the following conclusions can be drawn:
(1) The viscosity of the CTB slurry mix increases with increasing c/t ratio in the mixture. Linear, exponential and logarithmic fitting methods were conducted to obtain the quantitative correlation between viscosity and c/t. An exponential equation can explain the relationship between viscosity and c/t factors.
(2) As the SD increases, the viscosity of the CTB slurry continues to increase. The multiple R2 of the exponential fitting is obviously higher than the linear and logarithmic fitting results. Hence, the relation between SD and viscosity of CTB can be expressed as an exponential equation.
(3) The influence of SD and c/t factors on UCS performance of CTBs is in a good agreement with the exponential function. The mechanical strength gain of CTB samples increases with increasing c/t and SD. Moreover, the CTB’s strength increases with increasing curing time.
(4) The SEM micrograph shows that there exist many ettringites and calcium silicate hydrates within the 28-day cured cemented backfills. CTB samples with higher slurry content correspond to a smaller void ratio, which can effectively improve the backfill’s strength gain.
Consequently, this study will bring a new light to a better understanding of some mechanisms relating to the viscosity, strength, and microstructure of CTB samples and thereby to a better CTB mix recipe selection for most modern underground mines around the world. In addition, a number of the general power law fitting models were proposed to better predict the uniaxial compression strength parameters required for the preliminary design needs. The laboratory test conducted in this study is based on a gold mine in Shandong, China. However, the parameters such as tailings particle size, mineralogy, and cement type are unique for each mine. Thus, this study can only provide a basis for the backfilling design of the studied gold mine.
In future research works, the authors will consider applying the results obtained from this lab testing to a gold mine backfilling. We also demonstrate the results of the indoor research based on the technical problems that may arise during the backfilling process.
Author Contributions
S.C. and W.S. analyzed the experimental data and initiated the writing of the paper; E.Y. modified the manuscript and corrected the English writing.
Funding
This research was supported the China Postdoctoral Science Foundation (2018M631341), the Open fund of the Key Laboratory of Ministry of Education for Efficient Mining and Safety of Metal Mines (USTBMSLAB201804) and the Fundamental Research Funds for the Central Universities (FRF-TP-17-075A1).
Acknowledgments
The authors would like to sincerely acknowledge the detailed and constructive reviews and suggestions from three anonymous reviewers, which greatly improved the present paper. Special thanks are extended to Gaili Xue and Xiang yang Li for their help during the laboratory tests and Xuedong Sheng for providing the tailings samples.
Conflicts of Interest
The authors declare no conflict of interest.
References
- Sofrá, F.; Boger, D.V. Environmental rheology for waste minimisation in the minerals industry. Chem. Eng. J. 2002, 86, 319–330. [Google Scholar] [CrossRef]
- Belem, T.; Benzaazoua, M. Design and application of underground mine paste backfill technology. Geotech. Geol. Eng. 2008, 26, 147–174. [Google Scholar] [CrossRef]
- Potvin, Y.; Thomas, E.; Fourie, A. Handbook on Mine Fill; Australian Centre for Geomechanics: Perth, Australia, 2005; pp. 1–179. [Google Scholar]
- Klein, K.; Simon, D. Effect of specimen composition on the strength development in cemented paste backfill. Can. Geotech. J. 2006, 43, 310–324. [Google Scholar] [CrossRef]
- Yilmaz, E.; Belem, T.; Benzaazoua, M. Effect of curing and stress conditions on hydromechanical, geotechnical and geochemical properties of cemented paste backfill. Eng. Geol. 2014, 168, 23–37. [Google Scholar] [CrossRef]
- Suazo, G.; Villavicencio, G. Numerical simulation of the blast response of cemented paste backfilled stopes. Comput. Geotech. 2018, 100, 1–14. [Google Scholar] [CrossRef]
- Hassani, F.P.; Mortazavi, A.; Shabani, M. Investigations of mechanics involved in backfill-rock mass behavior in narrow vein mining. J. S. Afr. Inst. Min. Metall. 2008, 108, 463–471. [Google Scholar]
- Benzaazoua, M.; Fall, M.; Belem, T. A contribution to understanding the hardening process of cemented paste backfill. Miner. Eng. 2004, 17, 141–152. [Google Scholar] [CrossRef]
- Kesimal, A.; Yilmaz, E.; Ercikdi, B. Evaluation of paste backfill test results obtained from different size slumps with varying cement contents for sulphur-rich mill tailings. Cem. Concr. Res. 2004, 34, 1817–1822. [Google Scholar] [CrossRef]
- Sivakugan, N.; Veenstra, R.; Niroshan, N. Underground mine backfilling in Australia using paste fills and hydraulic fills. Int. J. Geosynth. Ground Eng. 2015, 1, 1–7. [Google Scholar] [CrossRef]
- Ghirian, A.; Fall, M. Properties of cemented paste backfill. In Paste Tailings Management; Yilmaz, E., Fall, M., Eds.; Springer: Cham, Switzerland, 2017; pp. 59–109. [Google Scholar]
- Chen, Q.; Zhang, Q.; Fourie, A.; Xin, C. Utilization of phosphogypsum and phosphate tailings for cemented paste backfill. J. Environ. Manag. 2017, 201, 19–27. [Google Scholar] [CrossRef] [PubMed]
- Brackebusch, F.W. Basics of paste backfill systems. Min. Eng. 1994, 46, 1175–1178. [Google Scholar]
- Fourie, A.; Fahey, H.; Helinski, M. Using effective stress theory to characterize the behaviour of backfill. CIM Bull. 2007, 100, 1–9. [Google Scholar]
- Qi, C.C.; Fourie, A.; Chen, Q.S. Neural network and particle swarm optimization for predicting the unconfined compressive strength of cemented paste backfill. Constr. Build. Mater. 2018, 159, 473–478. [Google Scholar] [CrossRef]
- El Aatar, O.; Belem, T.; Bussière, B.; Benzaazoua, M.; Yilmaz, E. Microstructural properties of column consolidated paste backfill. In Proceedings of the 60th Canadian Geotechnical Conference, Ottawa, ON, Canada, 21–25 October 2007; pp. 21–24. [Google Scholar]
- Fall, M.; Benzaazoua, M.; Saa, E.G. Mix proportioning of underground cemented tailings backfill. Tunn. Undergr. Space Technol. 2008, 23, 80–90. [Google Scholar] [CrossRef]
- Cihangir, F.; Ercikdi, B.; Kesimal, A.; Turan, A.; Deveci, H. Utilisation of alkali-activated blast furnace slag in paste backfill of high-sulphide mill tailings: Effect of binder type and dosage. Miner. Eng. 2012, 30, 33–43. [Google Scholar] [CrossRef]
- Yilmaz, E. Stope depth effect on field behaviour and performance of cemented paste backfills. Int. J. Min. Reclam. Environ. 2018, 32, 273–296. [Google Scholar] [CrossRef]
- Yilmaz, E.; Belem, T.; Benzaazoua, M.; Bussière, B. Assessment of the modified CUAPS apparatus to estimate in situ properties of cemented paste backfill. Geotech. Test. J. 2010, 33, 351–362. [Google Scholar]
- Bloss, M. Below ground disposal (mine backfill). In Paste and Thickened Tailings: A Guide; Jewell, R.J., Fourie, A.B., Lord, E.R., Eds.; University of Western Australia: Nedlands, Australia, 2002; pp. 103–126. [Google Scholar]
- Koupouli, N.J.F.; Belem, T.; Rivard, P.; Effenguet, H. Direct shear tests on cemented paste backfill-rock wall and paste backfill-backfill interfaces. Rock Mech. Geotech. Eng. 2016, 8, 472–479. [Google Scholar] [CrossRef]
- Qi, C.C.; Chen, Q.S.; Fourie, A.; Zhang, Q.L. An intelligent modelling framework for mechanical properties of cemented paste backfill. Miner. Eng. 2018, 123, 16–27. [Google Scholar] [CrossRef]
- Yilmaz, E.; Belem, T.; Benzaazoua, M.; Kesimal, A.; Ercikdi, B. Evaluation of the strength properties of deslimed tailings paste backfill. Miner. Resour. Eng. 2007, 12, 129–144. [Google Scholar]
- Chen, Q.S.; Zhang, Q.L.; Fourie, A.; Chen, L.X.; Qi, C.C. Experimental investigation on the strength characteristics of cemented paste backfill in a similar stope model and its mechanism. Constr. Build. Mater. 2017, 154, 34–43. [Google Scholar] [CrossRef]
- Yilmaz, E. Investigating the Hydrogeotechnical and Microstructural Properties of Cemented Paste Backfills Using the Versatile CUAPS Apparatus. Ph.D. Thesis, Université du Québec en Abitibi-Témiscamingue (UQAT), Rouyn-Noranda, QC, Canada, 2010; pp. 1–450. [Google Scholar]
- Yin, S.; Wu, A.; Hu, K.; Wang, Y.; Zhang, Y. The effect of solid components on the rheological and mechanical properties of cemented paste backfill. Miner. Eng. 2012, 35, 61–66. [Google Scholar] [CrossRef]
- Sofra, F. Rheological properties of fresh cemented paste tailings. In Paste Tailings Management; Yilmaz, E., Fall, M., Eds.; Springer: Cham, Switzerland, 2017; pp. 33–57. [Google Scholar]
- Helinski, M.; Fahey, M.; Fourie, A. Coupled two-dimensional finite element modelling of mine backfilling with cemented tailings. Can. Geotech. J. 2010, 47, 1187–1200. [Google Scholar] [CrossRef]
- Koohestani, B.; Darban, A.K.; Mokhtari, P. A comparison between the influence of superplasticizer and organosilanes on different properties of cemented paste backfill. Constr. Build. Mater. 2018, 173, 180–188. [Google Scholar] [CrossRef]
- Yi, X.; Ma, G.W.; Fourie, A. Compressive behavior of fiber-reinforced cemented paste backfill. Geotext. Geomembr. 2015, 43, 207–215. [Google Scholar] [CrossRef]
- Walske, M.; Mcwilliam, H.; Doherty, J.; Fourie, A. Influence of curing temperature and stress conditions on mechanical properties of cementing paste backfill. Can. Geotech. J. 2016, 53, 148–161. [Google Scholar] [CrossRef]
- Panchal, S.; Deb, D.; Sreenivas, T. Variability in rheology of cemented paste backfill with hydration age, binder and superplasticizer dosages. Adv. Powder Technol. 2018, 29, 2211–2220. [Google Scholar] [CrossRef]
- Niroshan, N.; Yin, L.; Sivakugan, N.; Veenstra, R.L. Relevance of SEM to long-term mechanical properties of cemented paste backfill. Geotech. Geol. Eng. 2018, 36, 2171–2187. [Google Scholar] [CrossRef]
- Cao, S.; Song, W.D.; Yilmaz, E. Influence of structural factors on uniaxial compressive strength of cemented tailings backfill. Constr. Build. Mater. 2018, 174, 190–201. [Google Scholar] [CrossRef]
- Cao, S.; Song, W.D. Effect of filling interval time on the mechanical strength and ultrasonic properties of cemented coarse tailing backfill. Int. J. Miner. Process. 2017, 166, 62–68. [Google Scholar] [CrossRef]
- Cao, S.; Song, W.D.; Xue, G.L.; Wang, Y.; Zhu, P.R. Tests of strength reduction of cemented tailings filling considering layering character. Rock Soil Mech. 2015, 36, 2869–2876. [Google Scholar]
- Cao, S.; Song, W.D.; Xue, G.L.; Ma, R.W.; Zhu, P.R. Mechanical characteristics variation of stratified cemented tailing backfilling and its failure modes. J. China Univ. Min. Technol. 2016, 45, 717–722. [Google Scholar]
- Wang, J.; Song, W.D.; Tan, Y.Y.; Cao, S. Energy consumption and damage characteristics of stratified backfill under triaxial loading and unloading. J. China Univ. Min. Technol. 2017, 46, 1050–1057. [Google Scholar]
- Wang, J.; Song, W.D.; Cao, S.; Tan, Y.Y. Mechanical properties and failure modes of stratified backfill under triaxial cyclic loading and unloading. Int. J. Min. Sci. Technol. 2018, 28. [Google Scholar] [CrossRef]
- Qi, C.; Chen, Q.; Fourie, A.; Zhao, J.; Zhang, Q. Pressure drop in pipe flow of cemented paste backfill: Experimental and modeling study. Powder Technol. 2018, 333, 9–18. [Google Scholar] [CrossRef]
- Aldhafeeri, Z.; Fall, M. Sulphate induced changes in the reactivity of cemented tailings backfill. Int. J. Miner. Process. 2017, 166, 13–23. [Google Scholar] [CrossRef]
- Ramlochan, T.; Grabinsky, M.W.; Hooton, D.H. Microstructural and chemical investigations of cemented paste backfills. In Proceedings of the 11th International Conference on Tailings and Mine Waste, Vail, Fort Collins, CO, USA, 10–13 October 2004; pp. 293–304. [Google Scholar]
- Huynh, L.; Beattie, D.A.; Fornasiero, D.; Ralston, J. Effect of polyphosphate and naphthalene sulfonate formaldehyde condensate on the rheological properties of dewatered tailings and cemented paste backfill. Miner. Eng. 2006, 19, 28–36. [Google Scholar] [CrossRef]
- Fall, M.; Samb, S.S. Effect of high temperature on strength and microstructural properties of cemented paste backfill. Fire Saf. J. 2009, 44, 642–651. [Google Scholar] [CrossRef]
- Yilmaz, E.; Benzaazoua, M.; Bussière, B.; Pouliot, S. Influence of disposal configurations on hydrogeological behaviour of surface paste disposal: A field experimental study. Int. J. Miner. Process. 2014, 131, 12–25. [Google Scholar] [CrossRef]
- Yilmaz, E.; Belem, T.; Benzaazoua, M. One-dimensional consolidation parameters of cemented paste backfills. Miner. Resour. Manag. 2012, 28, 29–45. [Google Scholar]
- Fahey, M.; Helinski, M.; Fourie, A. Development of specimen curing procedures that account for the influence of effective stress during curing on the strength of cemented mine backfill. Geotech. Geol. Eng. 2011, 29, 709–723. [Google Scholar] [CrossRef]
- Xu, W.; Cao, P.; Tian, M. Strength development and microstructure evolution of cemented tailings backfill containing different binder types and contents. Minerals 2018, 8, 167. [Google Scholar] [CrossRef]
- Ouellet, S.; Bussière, B.; Mbonimpa, M.; Benzaazoua, M.; Aubertin, M. Reactivity and mineralogical evolution of an underground mine sulphidic cemented paste backfill. Miner. Eng. 2006, 19, 407–419. [Google Scholar] [CrossRef]
- Ercikdi, B.; Cihangir, F.; Kesimal, A.; Deveci, H.; Alp, I. Utilization of industrial waste products as pozzolanic material in cemented paste backfill of high sulphide mill tailings. J. Hazard. Mater. 2009, 168, 848–856. [Google Scholar] [CrossRef] [PubMed]
- Deng, X.J.; Klein, B.; Hallbom, D.J.; de Wit, B.; Zhang, J.X. Influence of particle size on the basic and time-dependent rheological behaviors of cemented paste backfill. J. Mater. Eng. Perform. 2018, 27, 3478–3487. [Google Scholar] [CrossRef]
- Benzaazoua, M.; Belem, T.; Bussière, B. Chemical factors that influence the performance of mine sulphidic paste backfill. Cem. Concr. Res. 2002, 32, 1133–1144. [Google Scholar] [CrossRef]
- Zhou, Y.L.; Deng, H.W.; Liu, J.X. Rational utilization of fine unclassified tailings and activated blast furnace slag with high calcium. Minerals 2017, 7, 48. [Google Scholar] [CrossRef]
- Qiu, J.P.; Yang, L.; Sun, X.G.; Xing, J.; Li, S.B. Strength characteristics and failure mechanism of cemented super-fine unclassified tailings backfill. Minerals 2017, 7, 58. [Google Scholar] [CrossRef]
- Zhang, Q.L.; Chen, Q.S.; Wang, X.M. Cemented backfilling technology of paste-like based on Aeolian sand and tailings. Minerals 2016, 6, 132. [Google Scholar] [CrossRef]
- Rong, H.; Zhou, M.; Hou, H.B. Pore structure evolution and its effect on strength development of sulfate-containing cemented paste backfill. Minerals 2017, 7, 8. [Google Scholar] [CrossRef]
- Yilmaz, E.; Kesimal, A.; Ercikdi, B. The factors affecting the strength and stability of paste backfill. Yerbilimleri Bull. Earth Sci. 2003, 28, 155–169. [Google Scholar]
- Yilmaz, E.; Fall, M. Paste Tailings Management, 1st ed.; Springer International Publishing: Cham, Switzerland, 2017; pp. 1–303. ISBN 978-3-319-39680-4. [Google Scholar]
Figure 1.
Fundamental characteristics of the studied tailings: (a) particle size distribution curve; (b) X-ray diffraction curve.
Figure 1.
Fundamental characteristics of the studied tailings: (a) particle size distribution curve; (b) X-ray diffraction curve.
Figure 2.
Some images of CTB sample preparation process.
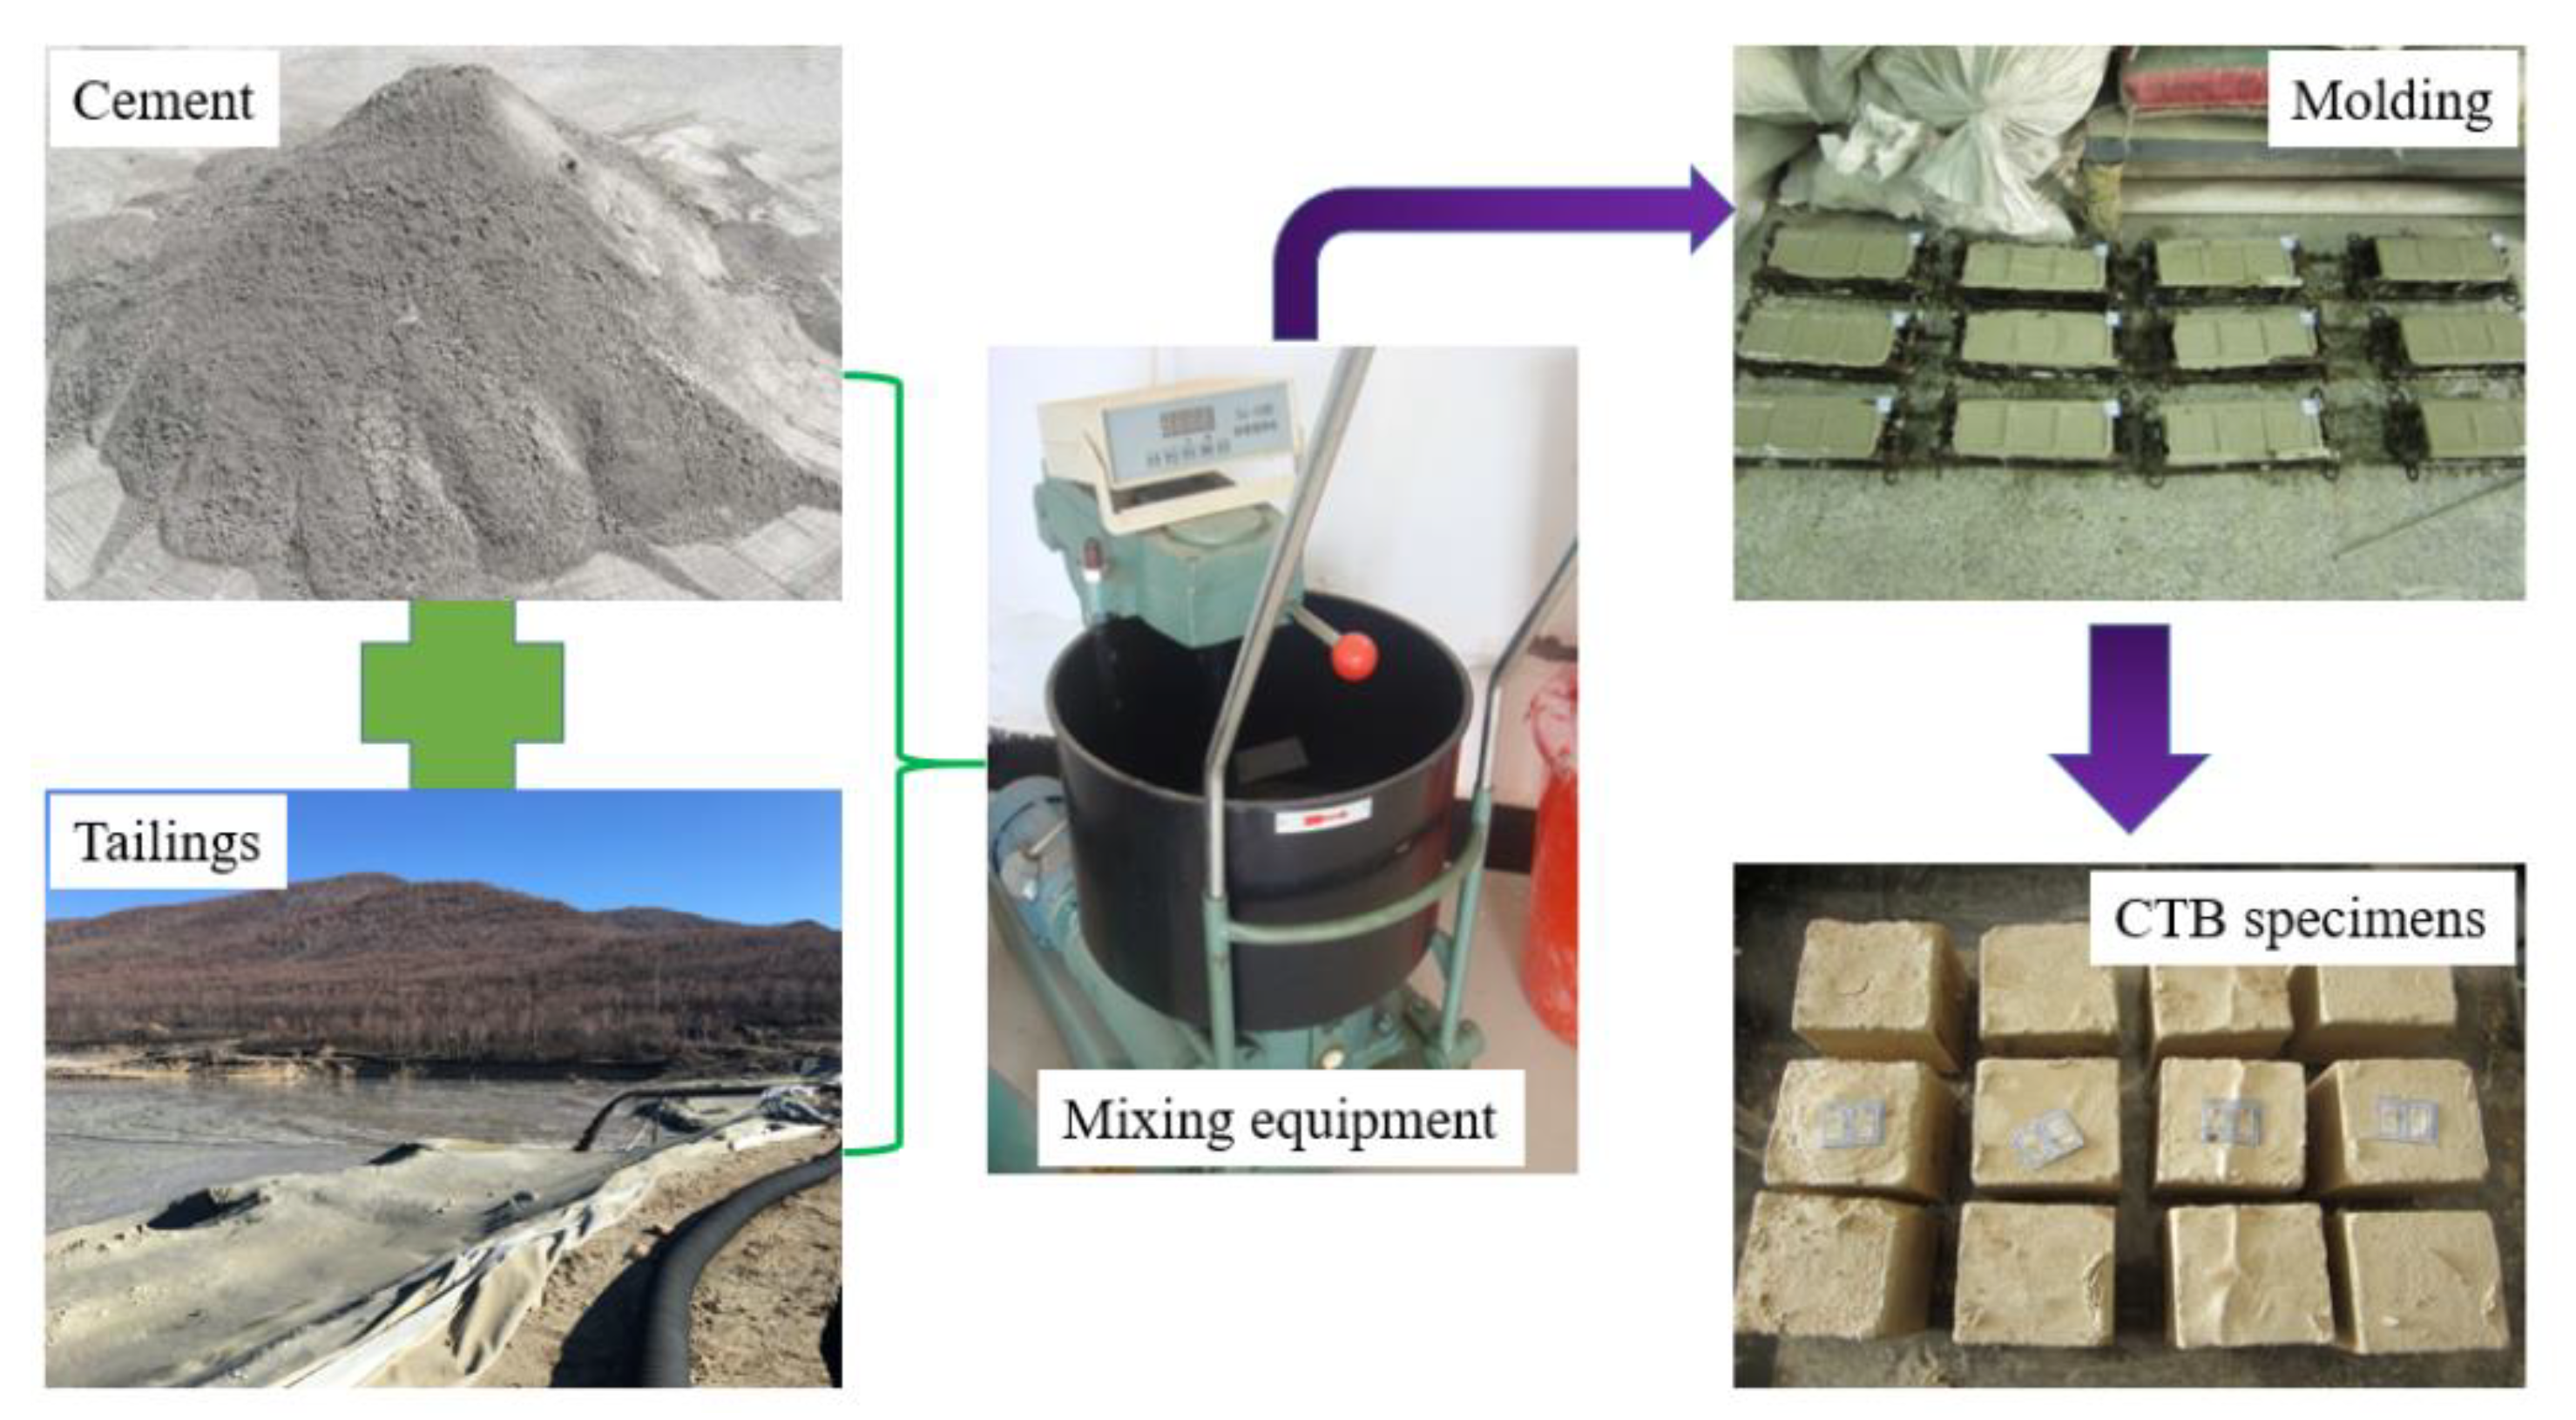
Figure 3.
Rheology testing apparatus of the CTB slurry mixes.
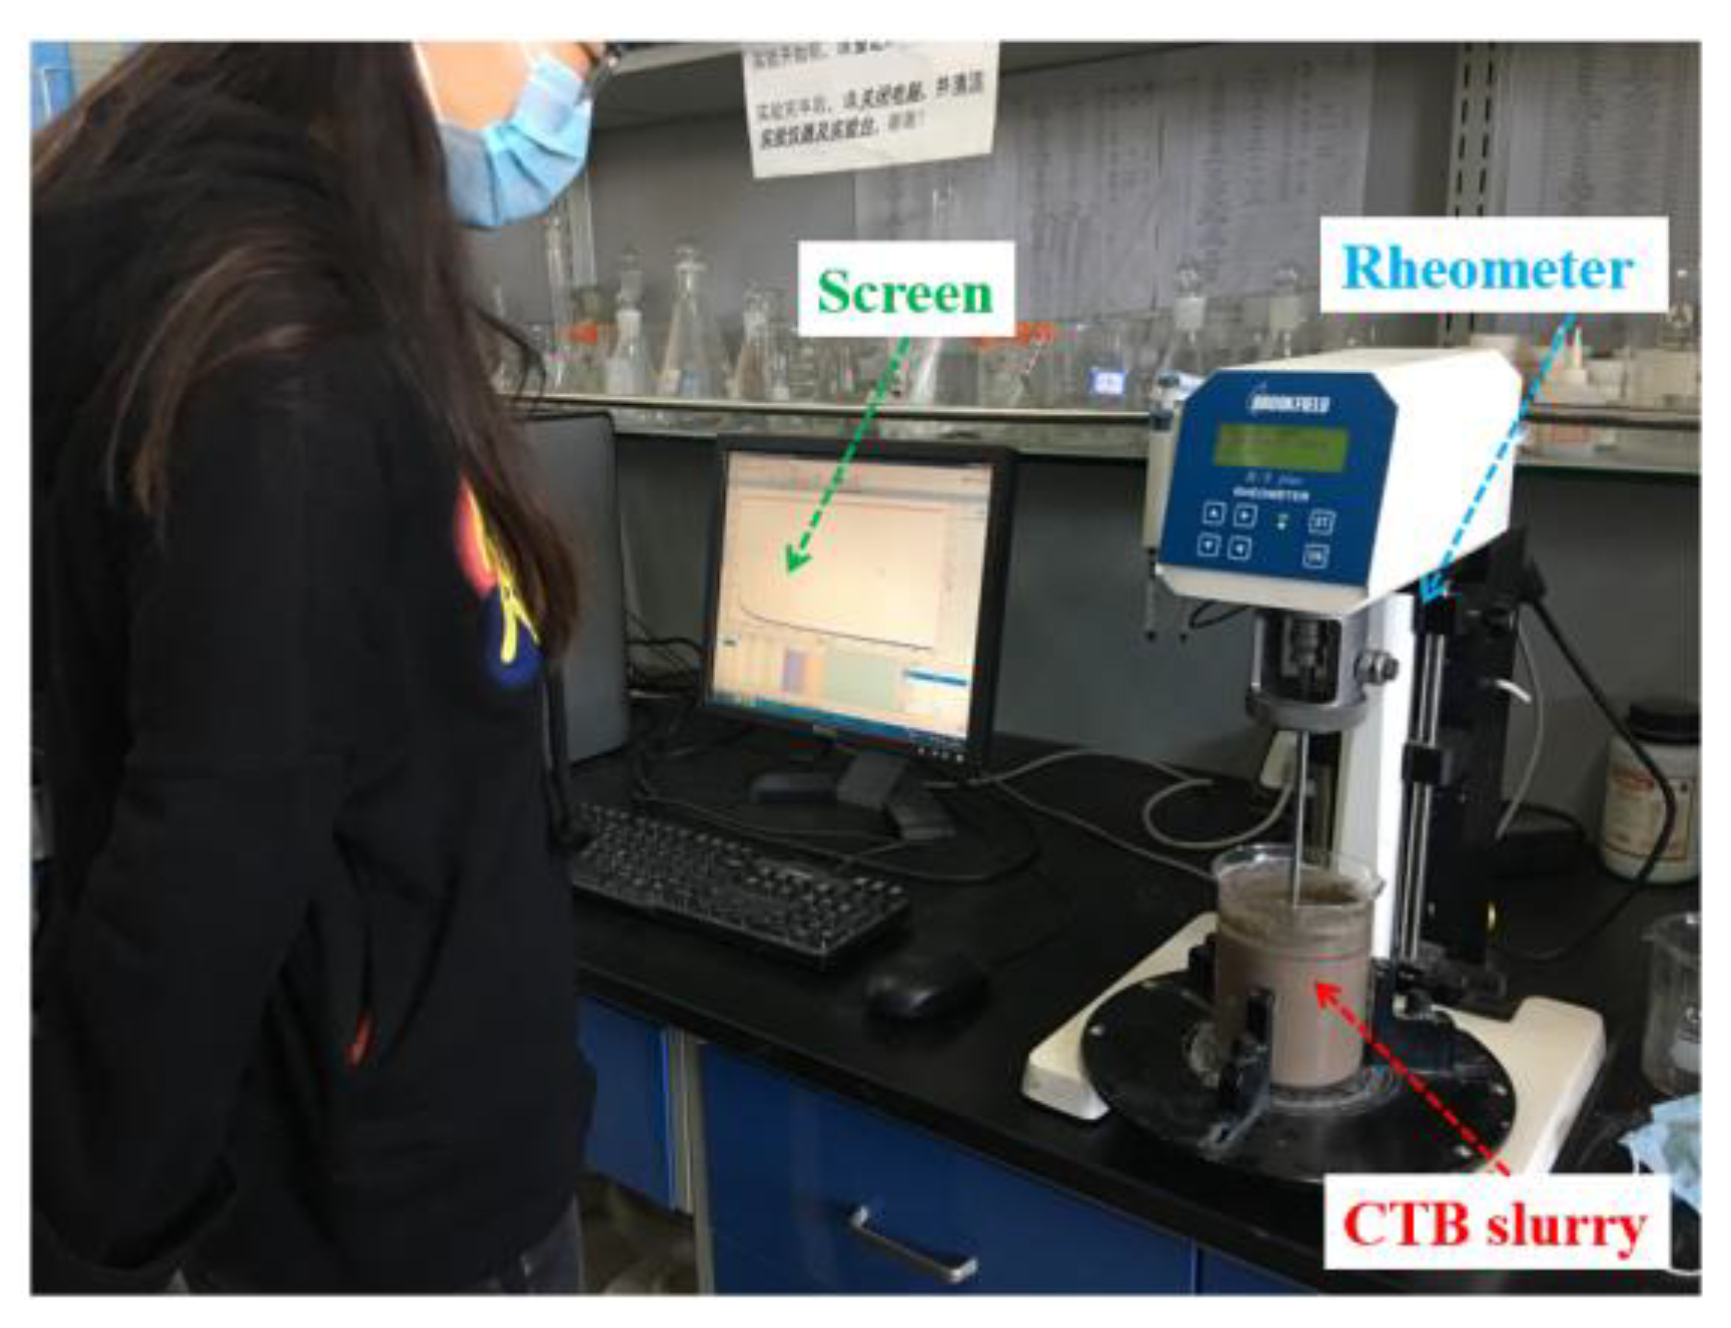
Figure 4.
UCS testing: (a) testing apparatus; (b) cured CTB sample; (c) failure CTB samples.

Figure 5.
An image of SEM testing apparatus.
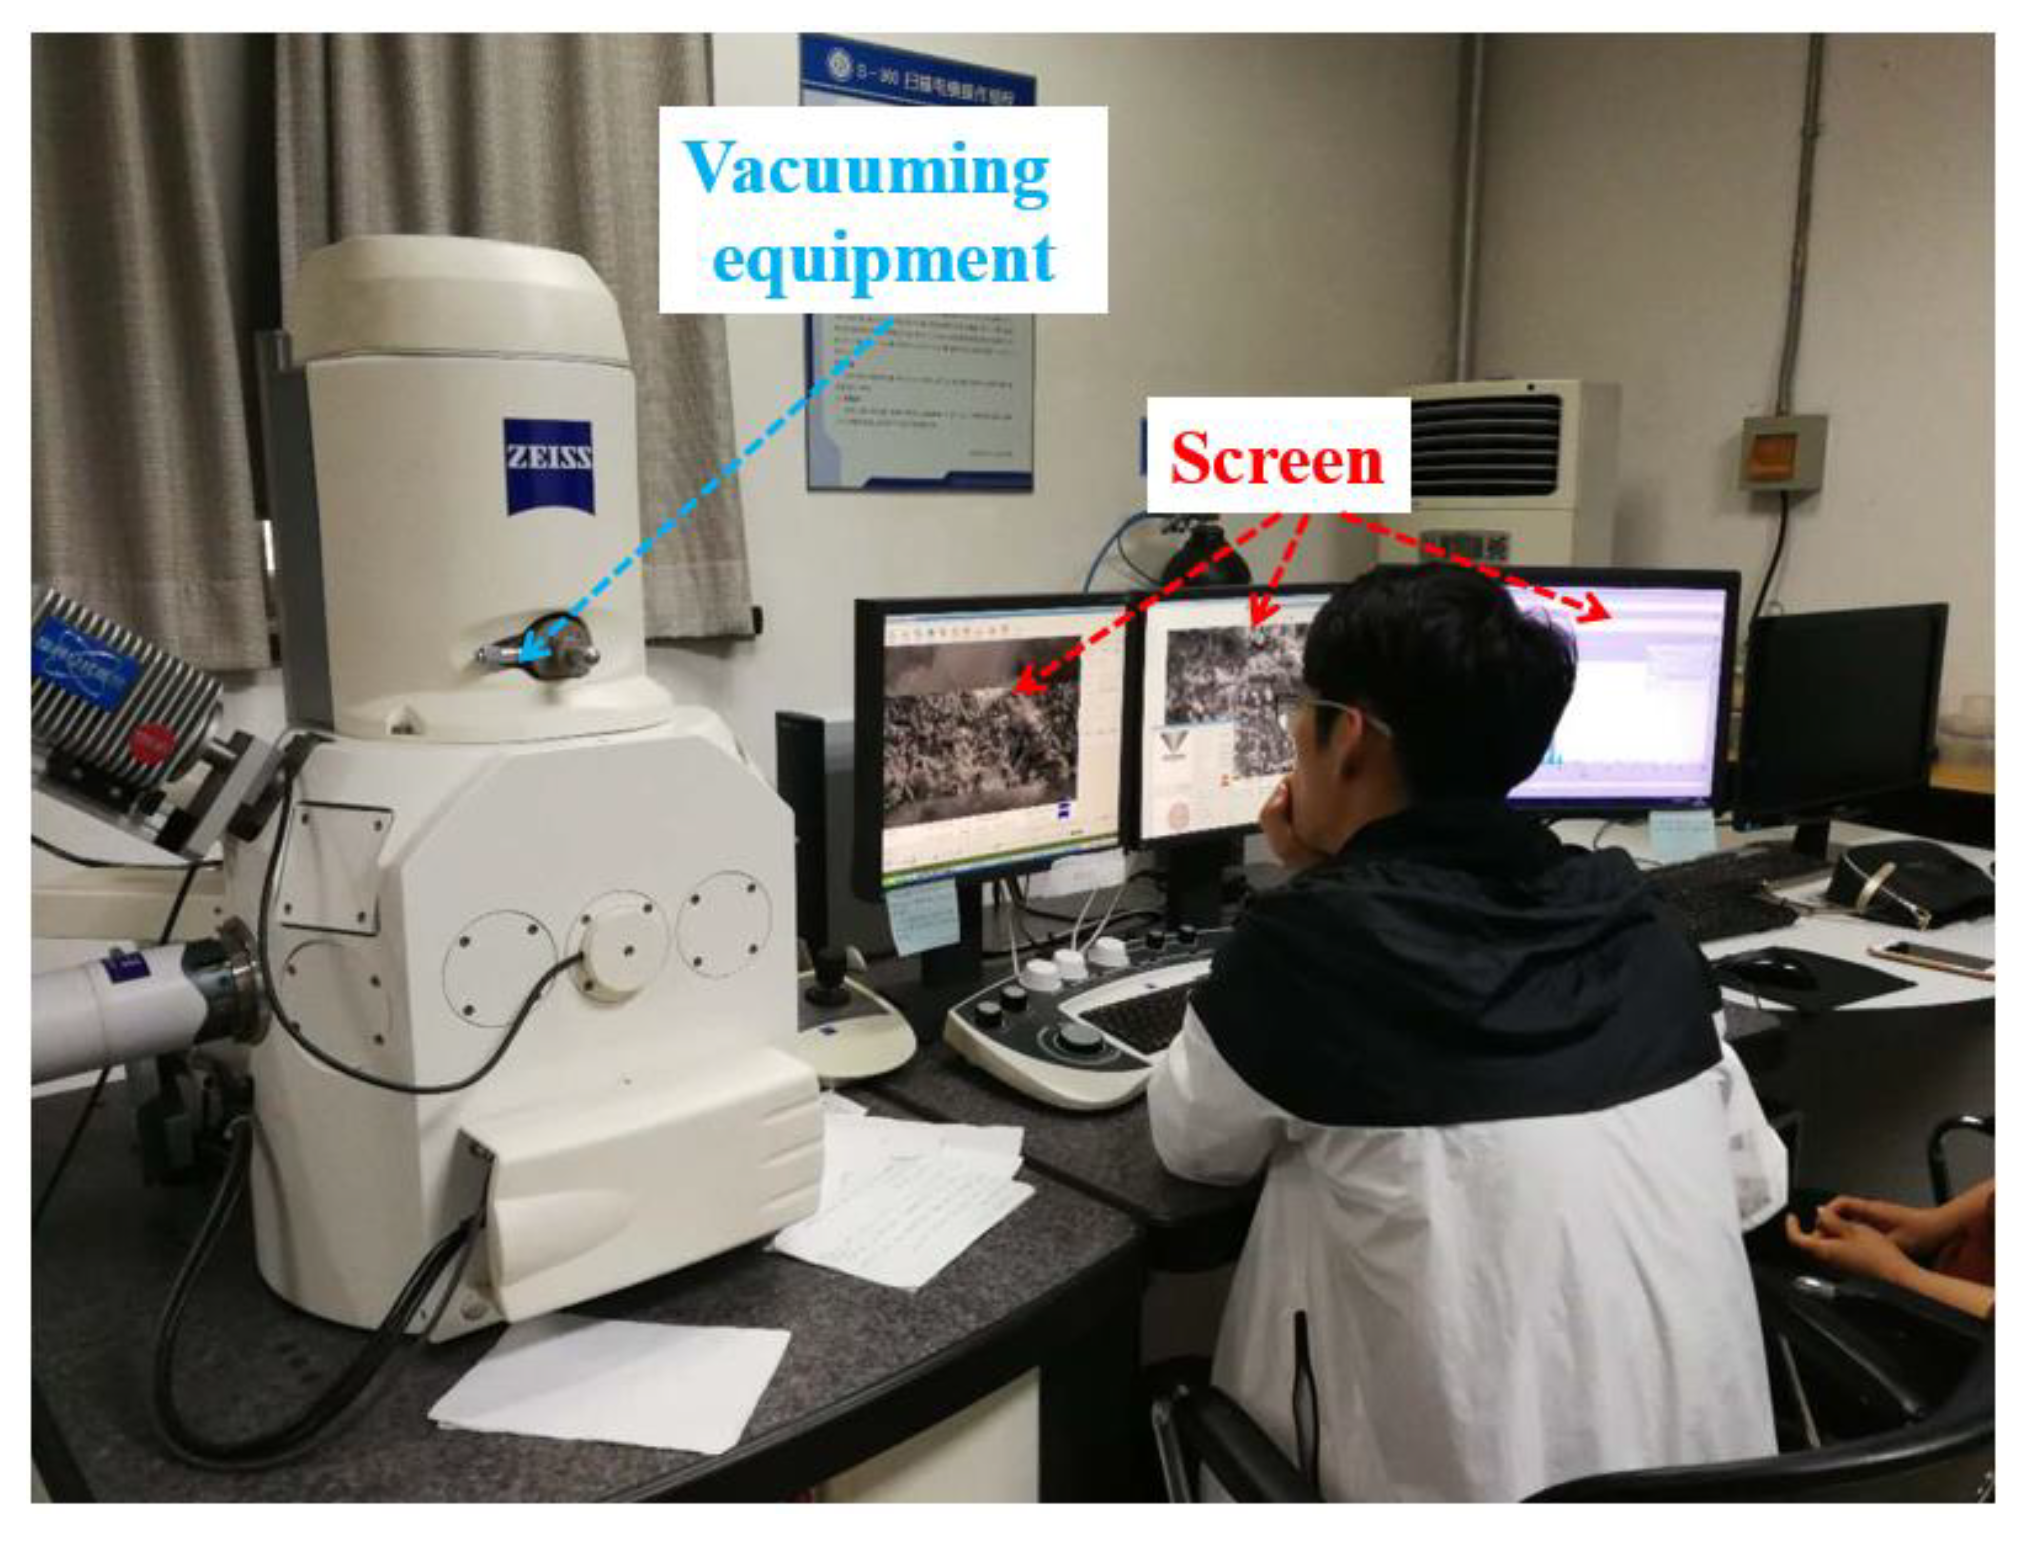
Figure 6.
Histogram between c/t and viscosity of CTB samples.
Figure 7.
Histogram between solid content and viscosity of CTB samples.

Figure 8.
Relations between SD and UCS of CTB: (a) c/t: 1:04; (b) c/t: 1:06; (c) c/t: 1:08; (d) c/t: 1:10.
Figure 8.
Relations between SD and UCS of CTB: (a) c/t: 1:04; (b) c/t: 1:06; (c) c/t: 1:08; (d) c/t: 1:10.
Figure 9.
Relations between c/t and UCS of CTB: (a) SD: 65%; (b) SD: 68%; (c) SD: 70%; (d) SD: 72%.

Figure 10.
Relations between curing time and UCS of CTB: (a) SD: 65%; (b) SD: 68%; (c) SD: 70%; (d) SD: 72%.
Figure 10.
Relations between curing time and UCS of CTB: (a) SD: 65%; (b) SD: 68%; (c) SD: 70%; (d) SD: 72%.
Figure 11.
SEM micrographs of 28-day cured polished CTB surface: (a) SD: 65%; (b) SD: 68%; (c) SD: 70%; (d) SD: 72%.
Figure 11.
SEM micrographs of 28-day cured polished CTB surface: (a) SD: 65%; (b) SD: 68%; (c) SD: 70%; (d) SD: 72%.

Table 1.
Chemical components of the studied tailings.
| Varieties/% | SiO2 | Al2O3 | CaO | MgO | P | Fe | S | Au |
|---|---|---|---|---|---|---|---|---|
| Tailings | 65.7 | 14.3 | 1.88 | 0.49 | 0.08 | 3.05 | 0.13 | <0.01 |
Table 2.
Chemical composition of ordinary Portland cement OPC 32.5 R.
| Varieties/% | SiO2 | Fe2O3 | Al2O3 | MgO | CaO | SO3 |
|---|---|---|---|---|---|---|
| OPC 32.5 R | 21.36 | 3.21 | 4.92 | 3.41 | 62.33 | 1.92 |
Table 3.
Proportion calculation of CTB samples.
| Cement: Tailings Ratio | 1:04 | 1:06 | 1:08 | 1:10 | |||||||||||||
|---|---|---|---|---|---|---|---|---|---|---|---|---|---|---|---|---|---|
| Mass fraction of solid, % | 65 | 68 | 70 | 72 | 65 | 68 | 70 | 72 | 65 | 68 | 70 | 72 | 65 | 68 | 70 | 72 | |
| Mass fraction (%) | Cement | 13 | 13.6 | 14 | 14.4 | 9.3 | 9.7 | 10 | 10.3 | 7.2 | 7.6 | 7.8 | 8 | 5.9 | 6.2 | 6.4 | 6.5 |
| Tailings | 52 | 54.4 | 56 | 57.6 | 55.7 | 58.3 | 60 | 61.7 | 57.8 | 60.4 | 62.2 | 64 | 59.1 | 61.8 | 63.6 | 65.5 | |
| Water | 35 | 32 | 30 | 28 | 35 | 32 | 30 | 28 | 35 | 32 | 30 | 28 | 35 | 32 | 30 | 28 | |
Table 4.
Viscosity results of CTB samples.
| c/t | Viscosity/Pa·s | ||||
|---|---|---|---|---|---|
| 60% | 65% | 68% | 70% | 72% | |
| 1:04 | 14.87 | 26.68 | 45.19 | 75.39 | 116.44 |
| 1:06 | 12.50 | 23.32 | 38.36 | 65.75 | 108.79 |
| 1:08 | 10.31 | 20.05 | 35.95 | 62.16 | 106.54 |
| 1:10 | 8.26 | 18.01 | 31.81 | 58.51 | 103.37 |
Table 5.
Viscosity results of CTB samples under various c/t ratios.
| Fitting Type | Solid Content, SD (wt %) | |||||
|---|---|---|---|---|---|---|
| 60% | 65% | 68% | 70% | 72% | Average | |
| linear | 0.9989 | 0.9885 | 0.9607 | 0.9314 | 0.9245 | 0.9608 |
| exponential | 0.9970 | 0.9959 | 0.9742 | 0.9483 | 0.9328 | 0.9696 |
| logarithmic | 0.9996 | 0.9909 | 0.9642 | 0.9374 | 0.9304 | 0.9645 |
Table 6.
Viscosity fitting results of CTB samples under various solid contents.
| Fitting Type | Cement-to-Tailings Ratio, c/t | ||||
|---|---|---|---|---|---|
| 1:04 | 1:06 | 1:08 | 1:10 | Average | |
| linear | 0.8223 | 0.7946 | 0.7867 | 0.7736 | 0.7943 |
| exponential | 0.9728 | 0.9687 | 0.9719 | 0.9758 | 0.9723 |
| logarithmic | 0.8017 | 0.7733 | 0.7651 | 0.7518 | 0.7729 |
Table 7.
The uniaxial compressive strength test results of different CTB samples.
| Cement-to-Tailings Ratio, c/t | Solid Content, SD (wt %) | Curing Time, Days | ||
|---|---|---|---|---|
| 3-Day (MPa) | 7-Day (MPa) | 28-Day (MPa) | ||
| 1:04 | 65% | 0.50 | 1.45 | 5.32 |
| 68% | 0.65 | 1.61 | 5.73 | |
| 70% | 0.73 | 1.86 | 6.14 | |
| 72% | 0.88 | 2.47 | 6.52 | |
| 1:06 | 65% | 0.44 | 1.15 | 3.14 |
| 68% | 0.52 | 1.29 | 3.52 | |
| 70% | 0.60 | 1.43 | 3.91 | |
| 72% | 0.82 | 1.70 | 4.42 | |
| 1:08 | 65% | 0.36 | 0.75 | 1.96 |
| 68% | 0.43 | 0.87 | 2.13 | |
| 70% | 0.55 | 0.96 | 2.48 | |
| 72% | 0.68 | 1.25 | 2.89 | |
| 1:10 | 65% | 0.25 | 0.61 | 1.33 |
| 68% | 0.30 | 0.70 | 1.41 | |
| 70% | 0.37 | 0.75 | 1.53 | |
| 72% | 0.50 | 0.90 | 1.75 | |
Table 8.
UCS results of CTB samples under various solid contents.
| Cement-to-Tailings Ratio, c/t | Fitting Type | Curing Time, Days | |||
|---|---|---|---|---|---|
| 3-Day | 7-Day | 28-Day | Average | ||
| 1:04 | linear | 0.9857 | 0.8535 | 0.9910 | 0.9434 |
| exponential | 0.9943 | 0.8995 | 0.9951 | 0.9630 | |
| logarithmic | 0.9828 | 0.8426 | 0.9881 | 0.9378 | |
| 1:06 | linear | 0.8802 | 0.9344 | 0.9726 | 0.9291 |
| exponential | 0.9331 | 0.9609 | 0.9868 | 0.9603 | |
| logarithmic | 0.8704 | 0.9267 | 0.9673 | 0.9215 | |
| 1:08 | linear | 0.9460 | 0.8863 | 0.9246 | 0.9189 |
| exponential | 0.9744 | 0.9302 | 0.9459 | 0.9502 | |
| logarithmic | 0.9389 | 0.8771 | 0.9163 | 0.9108 | |
| 1:10 | linear | 0.9061 | 0.9325 | 0.9012 | 0.9133 |
| exponential | 0.9554 | 0.9588 | 0.9223 | 0.9455 | |
| logarithmic | 0.8969 | 0.9256 | 0.8918 | 0.9048 | |
Table 9.
UCS results of CTB samples under various c/t ratios.
| Solid Content | Fitting Type | Curing Time, Days | |||
|---|---|---|---|---|---|
| 3-Day | 7-Day | 28-Day | Average | ||
| 65% | linear | 0.9820 | 0.9707 | 0.9340 | 0.9622 |
| exponential | 0.9474 | 0.9811 | 0.9954 | 0.9746 | |
| logarithmic | 0.8945 | 0.9698 | 0.9962 | 0.9535 | |
| 68% | linear | 0.9951 | 0.9769 | 0.9488 | 0.9736 |
| exponential | 0.9790 | 0.9857 | 0.9982 | 0.9876 | |
| logarithmic | 0.9611 | 0.9707 | 0.9983 | 0.9767 | |
| 70% | linear | 0.9576 | 0.9775 | 0.9656 | 0.9669 |
| exponential | 0.9232 | 0.9915 | 0.9997 | 0.9715 | |
| logarithmic | 0.8967 | 0.9824 | 0.9996 | 0.9596 | |
| 72% | linear | 0.9570 | 0.9662 | 0.9818 | 0.9683 |
| exponential | 0.9267 | 0.9984 | 0.9966 | 0.9739 | |
| logarithmic | 0.8424 | 0.9997 | 0.9956 | 0.9459 | |
© 2018 by the authors. Licensee MDPI, Basel, Switzerland. This article is an open access article distributed under the terms and conditions of the Creative Commons Attribution (CC BY) license (http://creativecommons.org/licenses/by/4.0/).
Share and Cite
MDPI and ACS Style
Cao, S.; Yilmaz, E.; Song, W. Evaluation of Viscosity, Strength and Microstructural Properties of Cemented Tailings Backfill. Minerals 2018, 8, 352. https://doi.org/10.3390/min8080352
AMA Style
Cao S, Yilmaz E, Song W. Evaluation of Viscosity, Strength and Microstructural Properties of Cemented Tailings Backfill. Minerals. 2018; 8(8):352. https://doi.org/10.3390/min8080352
Chicago/Turabian StyleCao, Shuai, Erol Yilmaz, and Weidong Song. 2018. "Evaluation of Viscosity, Strength and Microstructural Properties of Cemented Tailings Backfill" Minerals 8, no. 8: 352. https://doi.org/10.3390/min8080352
Note that from the first issue of 2016, this journal uses article numbers instead of page numbers. See further details here.