Particle Size Distribution Effects on the Strength Characteristic of Cemented Paste Backfill
by
 , ,
, ,
Jiangyu Wu
1,2,3 ,
,
Meimei Feng
1,2,* ,
,
Zhanqing Chen
1,2,
Xianbiao Mao
1,2,
Guansheng Han
1,2 and
Yiming Wang
2 1
State Key Laboratory for Geomechanics & Deep Underground Engineering, China University of Mining & Technology, Xuzhou 221116, China
2
School of Mechanics & Civil Engineering, China University of Mining & Technology, Xuzhou 221116, China
3
GeoEnergy Research Centre, Faculty of Engineering, University of Nottingham, University Park, Nottingham NG7 2RD, UK
*
Author to whom correspondence should be addressed.
Minerals 2018, 8(8), 322; https://doi.org/10.3390/min8080322
Submission received: 31 May 2018
/
Revised: 10 July 2018
/
Accepted: 25 July 2018
/
Published: 27 July 2018
(This article belongs to the Special Issue Backfilling Materials for Underground Mining)
Abstract
:It is of great significance, for economic, environmental and security reasons, to investigate the strength characteristic of underground cemented paste backfill (CPB). Consequently, an ultrasonic test, uniaxial and triaxial compression experiment, and acoustic emission (AE) monitoring were carried out on CPB, for which the particles satisfied Talbot gradation. The homogeneity of CPB specimens was evaluated by ultrasonic pulse velocity (UPV). The stress–strain behavior and AE characteristic of CPB specimens under different Talbot indices and confining pressures were investigated. The effects of the particle size distribution and the confining pressure on the peak strength of CPB were analyzed. The strength parameter model of CPB under the coupled influence of the particle size distribution and the confining pressure was constructed based on the Mohr–Coulomb strength criterion. The results show that the peak strength of CPB is positively linear with confining pressure, however, the relationship between its strength parameters and the Talbot index can be characterized by a quadratic polynomial function. This suggests that there is an optimal gradation of particles reflected in the maximum strength of CPB.
1. Introduction
Cemented paste backfill (CPB) is a relatively new green material, composed of waste rocks and cementing materials with water, widely used in green mining [1,2,3]. Its main role is to control the strata movement and surface subsidence, which additionally reduces the waste of land resources and the pollution of water resources caused by the waste rock and tailing in stope [4,5,6,7]. Therefore, CPB technology creates tremendous economic, environmental, and safety benefits.
CPB’s structure is usually under compression for its whole service life. The backfill must maintain its mechanical stability, so investigating its strength characteristic under compression is of significant interest [8,9,10]. For this purpose, lots of studies have focused on the strength characteristic of CPB, mostly from the perspective of the differences in cementing materials such as the type and content [11,12,13], additives such as nano-material, polymer, fiber, alkaline substances, and water-absorbing substances [14,15,16,17,18,19,20], and environmental conditions such as temperature, corrosion and conservation [21,22,23,24,25,26,27].
To our knowledge, CPB is a porous media that consists of waste rock particles (or tailings), cementing materials, and pores [28]. The cementing material has a great influence on the strength of CPB, but its type, amount, and transportation are restricted by engineering conditions and economic benefits [29,30]. Regarding the control of the pores of CPB, this mainly relies on the filling technology and the contact difficulty between the CPB and goaf roof [31]. CPB with mass ratios of 1:2–1:12 of the cementing materials and particles are generally used in engineering; that is, the proportion of particles in the CPB is at least 66% [32]. Therefore, it is necessary to systematically study the influence of the particles on the strength characteristic of CPB, especially the particle size distribution [33].
At present, in terms of the effect of the particles on the strength characteristic of CPB, the results show a huge difference caused by multiformity in the particle size distribution, which greatly affects the homogeneity of the CPB material [34,35,36,37]. However, it is generally believed that the appropriate particle size distribution can not only strengthen the structure of CPB to achieve optimization of its strength characteristic [38,39,40,41,42,43,44,45,46], but also enhances its frost resistance and corrosion resistance [47], and even improves its flow property and water requirements [48]. The key issue is that the size and distribution of the particles in CPB are extremely difficult to reasonably select and quantify, which is also the main reason for the slow progress in the study on particles in CPB [49]. For the spatial distribution of particles, for example, it is necessary to seek the optimal strength of CPB in 6-dimensional space [Y1:Y2:Y3:Y4:Y5:Y6] and in six particle size intervals of (0–d1), (d1–d2), (d2–d3), (d3–d4), (d4–d5) and (d5–d6), thereby causing the curse of dimensionality [50,51,52].
Consequently, the ultrasonic test, uniaxial and triaxial compression experiment, and acoustic emission (AE) monitoring were carried out on CPB, for which the particles satisfied Talbot gradation. The homogeneity of CPB specimens was evaluated by ultrasonic pulse velocity (UPV). The stress–strain behavior and AE characteristic of CPB specimens under different Talbot indices and confining pressures were investigated. The effects of the particle size distribution and the confining pressure on the peak strength of CPB were analyzed. The strength parameter model of CPB under the coupled influence of the particle size distribution and the confining pressure was constructed based on the Mohr–Coulomb strength criterion.
2. Materials and Methods
2.1. Experimental Materials
In order to study the influence of the particles on the strength characteristic of CPB, it is necessary to first understand the component of the tailings used in this test [53]. Table 1 gives the chemical properties of the tailings obtained using X-ray diffraction (XRD, D8 Advance diffractometer, Bruker Corporation, Bremen, Germany). The cementing material is composite Portland cement (P.C. 32.5R), and Table 2 shows its composition. The P.C. 32.5R is produced in China and is widely used in filling mining with CPB in China as the basic cementing material, due to its good fit for the actual situation in mine [54]. It contains abundant SiO2 (21.56%) and CaO (62.19%), which can provide sufficient strength and stability.
2.2. Experimental Specimens
Differences in the sampling process of CPB specimens also seriously affect its strength characteristic. Normally, methods such as the application of a release agent to the surface of the mold and gentle vibration are used to remove the specimen from the mold, which influences the test results due to the uneven smearing of the release agent and the mixing of the release agent and cementing material. The slight vibrating sampling method can easily damage the test specimen. In order to overcome these difficulties, Yilmaz et al. first developed a method for the non-destructive sampling of CPB using air pressure [55]. We also developed a device for CPB specimen production that can perform non-destructive sampling. It is mainly composed of two halves of a cylinder, an upper base, a lower base, bolts, and other components, as shown in Figure 1. The internal diameter of the cylinder is 50 mm and the internal height is 100 mm to ensure the prepared specimen is a standard of ϕ50 × 100, which satisfies the requirements of the American Society for Testing and Materials (ASTM) and the International Society for Rock Mechanics and Rock Engineering (ISRM) [56,57]. In the preparation of the specimen, clamping components are used to clamp the cylinder as shown in Figure 1a, and the entire device can then be placed directly into the curing equipment. During sampling, the cylinder can be disassembled into two parts, as shown in Figure 1b, which can achieve non-destructive sampling of the CPB specimen without the need for a release agent, as the entire device is subjected to smooth treatment and an anti-corrosion treatment.
For laboratory tests on CPB materials, the difficulties always lie in the determination of particle size and the selection of appropriate specimen size [58]. The ASTM has proposed that the minimum diameter of a cylindrical specimen must exceed three times the maximum size of coarse aggregate in the sample [56], while a specimen diameter of at least five times the largest grain size of the particles was recommended by Wu et al. [51]. Since the CPB specimen production device is designed for the standard cylindrical sample, the maximum particle size of grains used in this test is 10 mm. The tailings should be crushed and sieved to obtain particles that satisfy the test requirements, with seven size intervals of 0–0.5 mm, 0.5–1.0 mm, 1.0–1.5 mm, 1.5–2.5 mm, 2.5–5.0 mm, 5.0–8.0 mm, and 8.0–10.0 mm. In order to obtain the optimal strength of the CPB material, it is necessary to carry out a compression test on CPB specimens with different mass ratios (Y1:Y2:Y3:Y4:Y5:Y6:Y7) of those particles in seven size intervals. This allows the search for the optimal strength of CPB in the seven-dimensional space of (Y1, Y2, Y3, Y4, Y5, Y6, Y7), which results in the curse of dimensionality. Therefore, the Talbot gradation theory was used to determine the mass ratio of the particles at seven particle sizes for overcoming this problem [59]. The Talbot gradation theory is relatively simple and convenient, and has been widely used in the fields of geomechanics and concretes [60]. It is a continuous exponential gradation function, which can quantify the effect of particle distribution on the performance of CPB materials. The maximum size of the particles is dmax according to the Talbot gradation, and the ratio P of the mass M of particles with sizes below or equal to d to the mass Mt of total particles is:
where n is the Talbot index.
The mass of particles with sizes in the interval of [d1, d2] can be calculated according to Formula (1):
The total mass of tailings in a specimen was 300 g, and the maximum particle diameter was 10 mm. The mass distribution of the particles at seven sizes with Talbot indices of 0.2, 0.4, 0.6, and 0.8 can be obtained according to Formula (2), as shown in Table 3.
The preparations of tailings with different Talbot indices were mixed with cement and water to form a homogeneous slurry, according to the experimental program in Table 4. The mixed slurry was poured into the CPB specimen production device, and then the entire device was placed on a vibratory table to ensure the homogeneity of the CPB specimen. After cement end setting, the CPB specimen should be removed and put in the curing equipment for seven days, maintained at a humidity of 95% and temperature of 25 °C.
2.3. Experimental Equipment and Testing Parameters
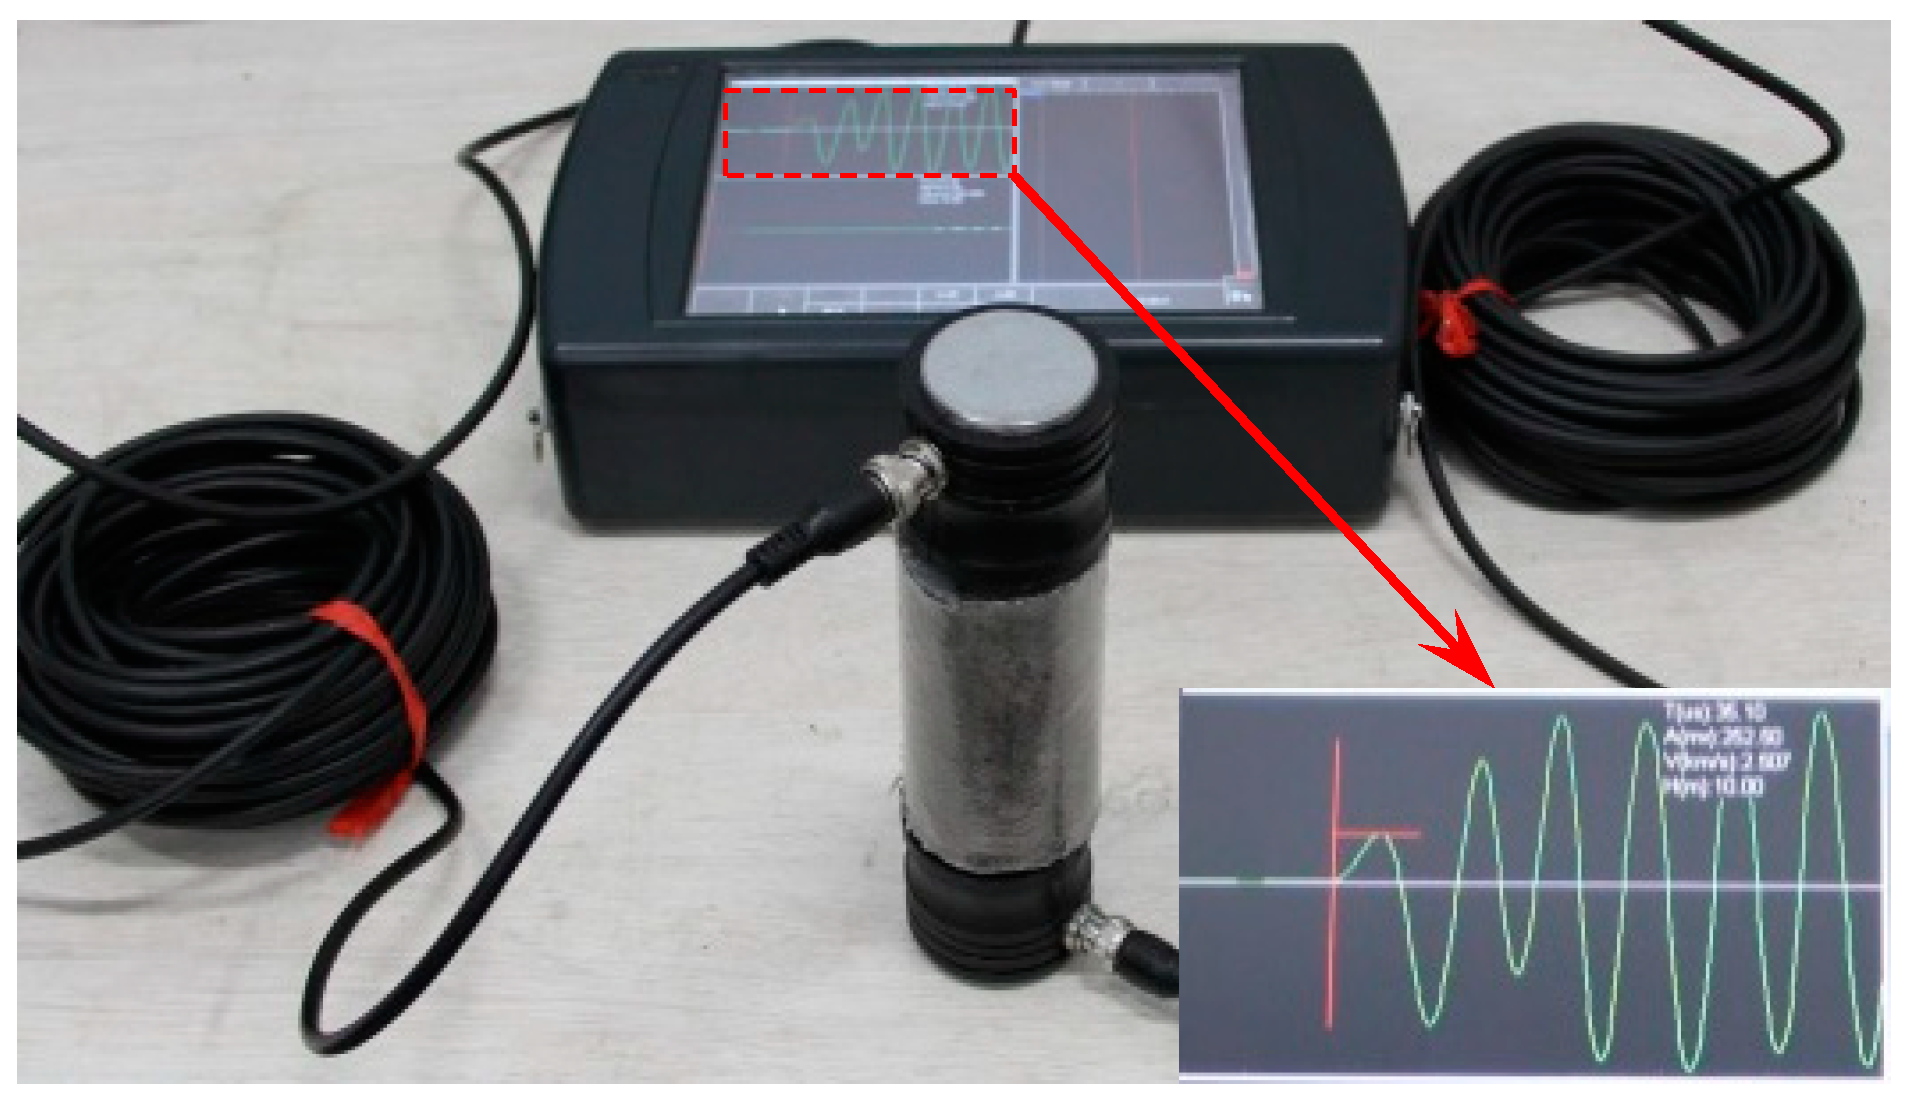
Ultrasonic tests on CPB specimens can obtain the UPV using an ultrasonic automatic cycle tester (RSM-SY6, Institute of Rock and Soil Mechanics, Chinese Academy of Sciences, Beijing, China), which measures the propagation of ultrasound pulses with a sound amplitude accuracy of 3% and sound time accuracy of 0.5%, as shown in Figure 2. The transducers are 50 kHz, and the length of the measuring base is determined within an accuracy of 0.1 mm. The scanning speed can exceed 20 cycles/s, and the sampling interval is (0.1, 200) μs.
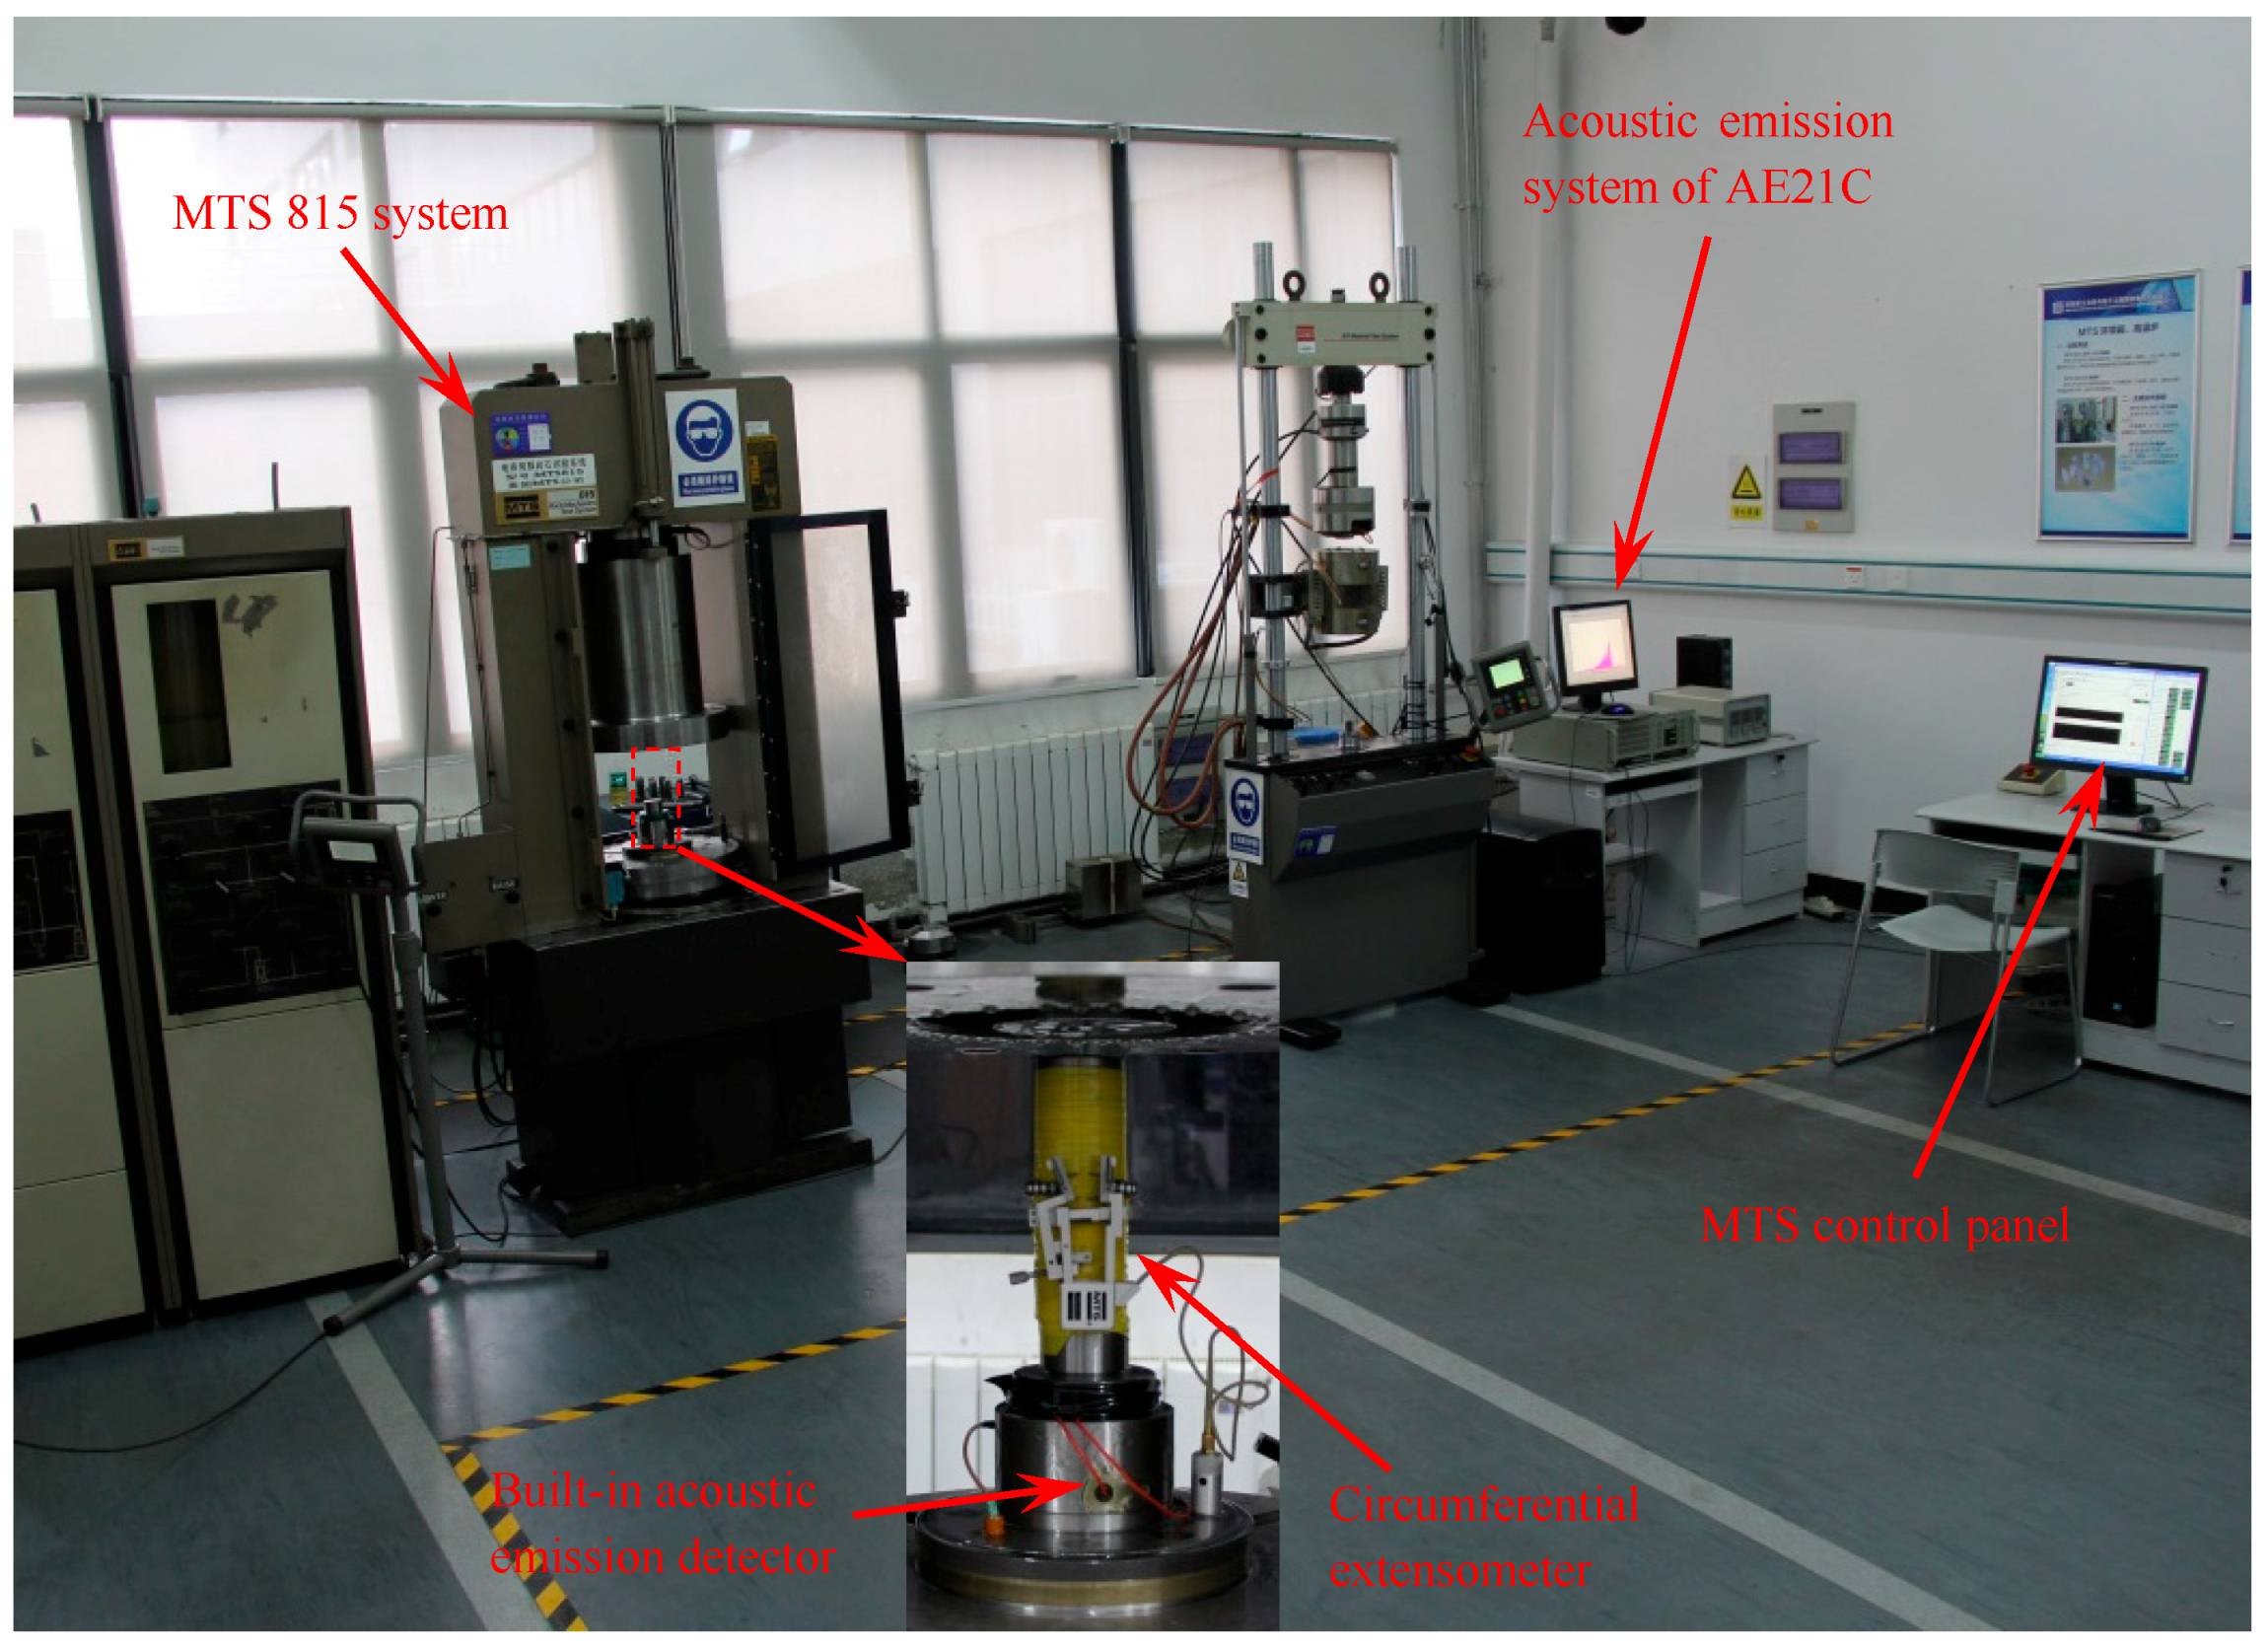
The uniaxial and triaxial compression tests on CPB specimens were carried out by an MTS815 rock mechanics test system. Its maximum axial pressure is 4600 kN, the loading rate range is 1 × 10⁻⁵–1 mm/s, the fatigue frequency is 0.001–0.5 Hz, and the frame stiffness is 10.5 × 10⁹ N/m, as shown in Figure 3. The AE21C system was used for monitoring the AE signals of the CPB specimens during the loading process. The AE detectors were the piezoelectric ceramic AE sensors, with a gain and threshold of 35 db, an impact time of 50 μs, an impact interval of 300 μs, and an acquisition rate of 100 ms/time. The AE signals are picked up by the detectors, which are pre-amplified, mainly discharged and denoised by the AE instrument to form the AE parameters (AE count, AE counting rate, energy count, energy counting rate, and so on) [61].
Before the test, it is necessary to check the non-parallelism and non-perpendicularity of the CPB specimen within ±0.02 mm, although it may have rigid boundaries. If there are some specimens that cannot meet the test requirements, they must be discarded. The ultrasonic test on the CPB specimen was performed first. Vaseline was applied to the surfaces of the transducers (transmitter and receiver) and the ends of the specimens to ensure full contact and the elimination of the cavitation between the transducers and the test medium. This provides the best coupling between the surface of the transducer and the end of specimen, in order to maximize the measurement accuracy. As the most satisfactory and reliable method, the direct transmission technology was used for the test, whereby the transmitter and receiver were located on the opposite ends of the CPB specimen. The UPV of the same specimen was read five times, and the average value was used as the experimental result when the deviation was sub-optimal. Then, the Vaseline was also applied to the two heads of the MTS to ensure perfect coupling between the surfaces of the heads and the ends of the CPB specimen. In the uniaxial compression test, the CPB specimen can be axially loaded at a rate of 0.002 mm/s; meanwhile, the AE signals should be monitored [62]. In the triaxial compression test, the confining pressure must be loaded to a specific confining pressure at a rate of 0.04 MPa/s, and then the CPB specimen can be axially loaded at a rate of 0.002 mm/s under the constant specific confining pressure. The AE signals should be monitored at the same time [63]. In this experiment, the initial pre-stress is 0.25 KN, and the specific confining pressures are 0.5, 1, and 2 MPa.
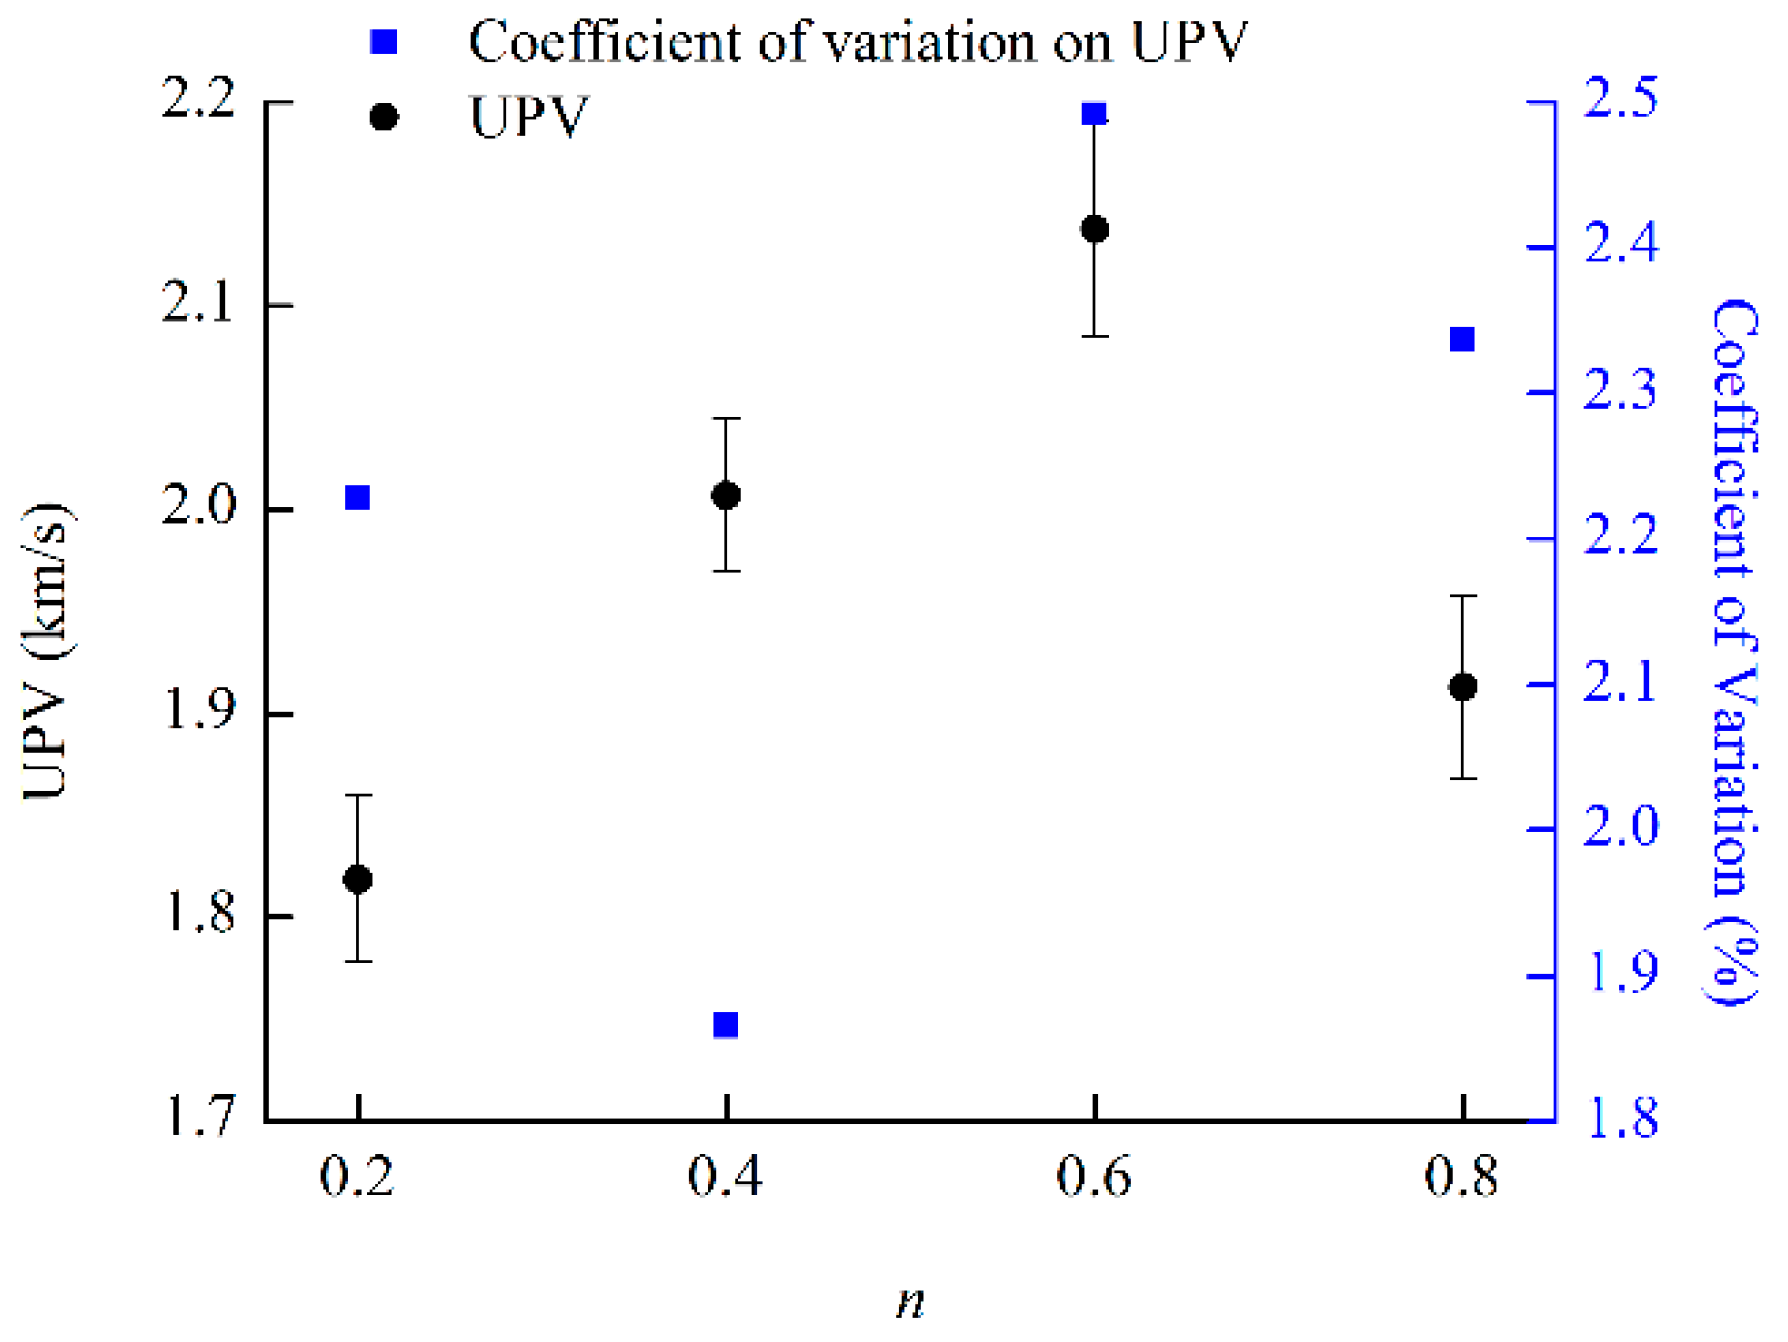
It is necessary to understand the dispersion among the CPB specimens to ensure the validity of the test results, which requires homogeneity of the CPB material under the same condition [64,65]. Börgesson proved that the homogeneity of CPB material can greatly affect its mechanical properties [36]. Therefore, we used the UPV of each CPB specimen to evaluate its homogeneity. Figure 4 shows the UPV and its coefficient of variation for CPB specimens with different Talbot indices. The parameter of n is the Talbot index in the figure. It can be seen that the coefficient of variation on UPV does not exceed 3% at the maximum. This indicates that the CPB material that was tested has good homogeneity, and the dispersion among different CPB specimens under the same conditions is relatively small.
3. Results and Discussion
3.1. Confining Pressure and the Particle Size Distribution Effect on Stress–Strain Behavior and the AE Characteristic of CPB
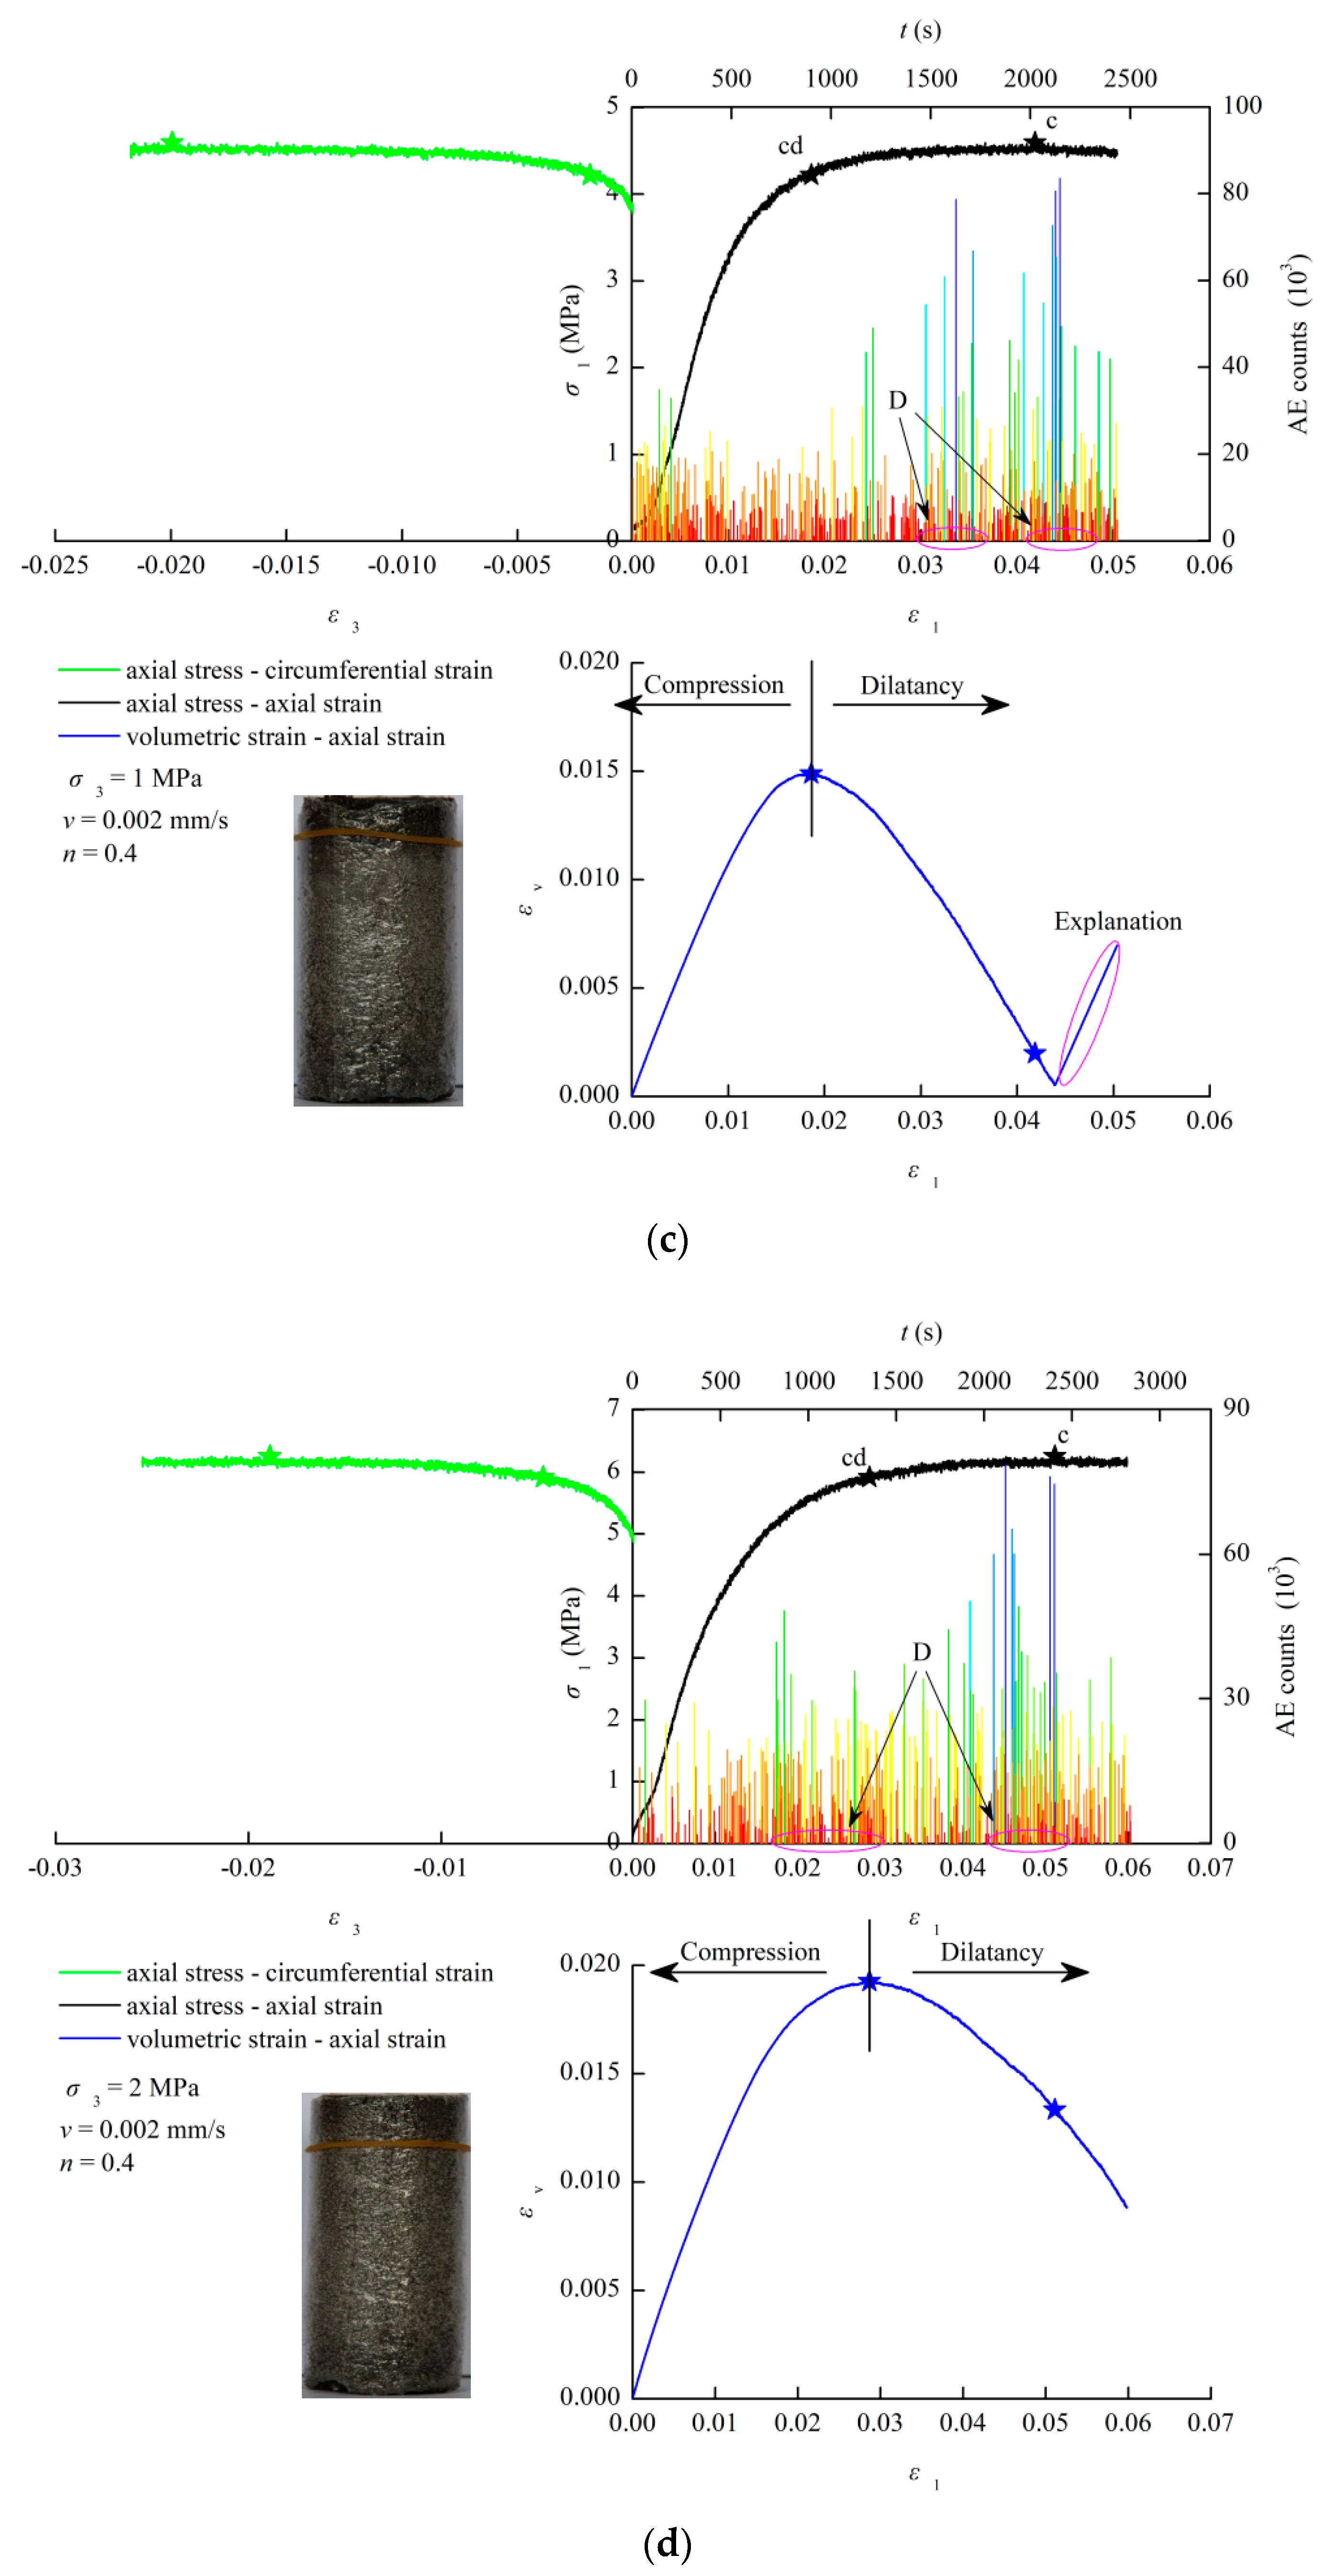
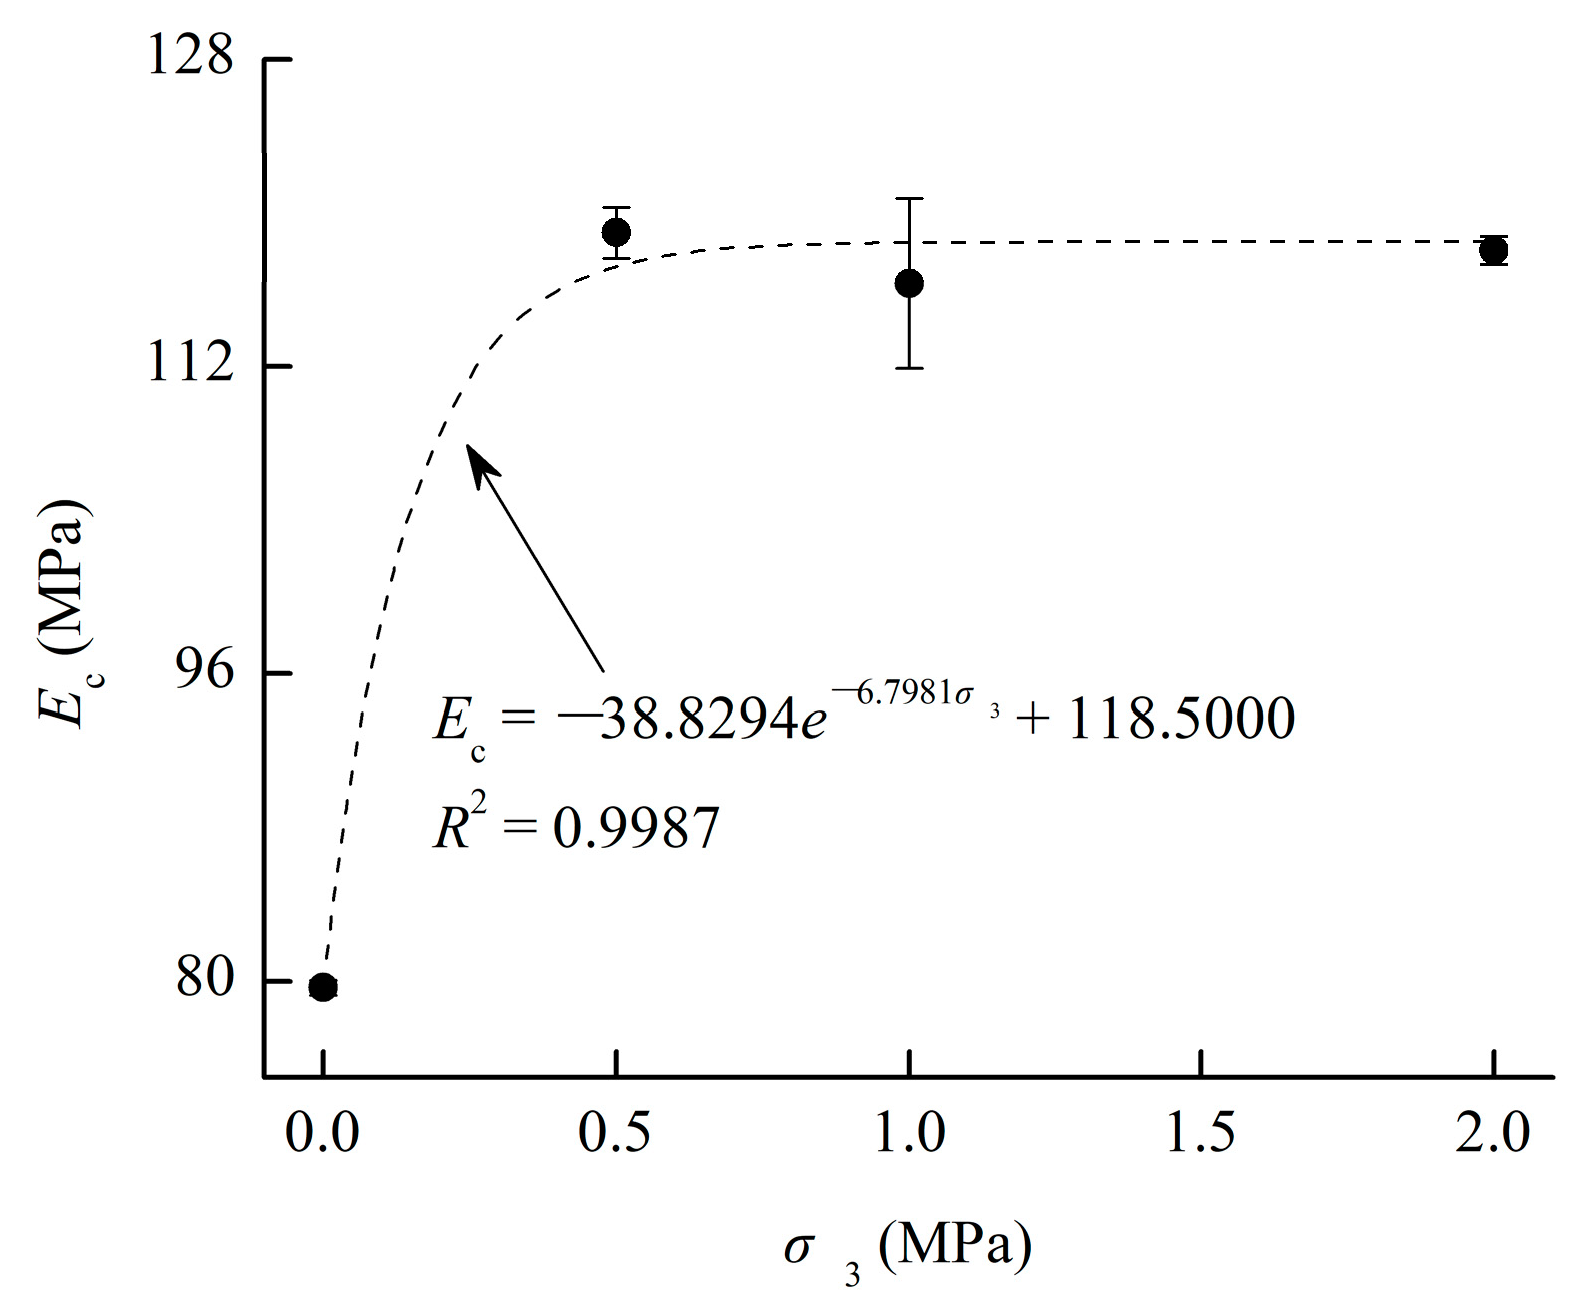
Figure 5 presents the stress–strain-AE curves of CPB specimens with a Talbot index of 0.4, under confining pressures of (a) 0 Mpa, (b) 0.5 MPa, (c) 1 MPa and (d) 2 MPa. In the figure, the green curve is the axial stress-circumferential strain, the black curve is the axial stress-axial strain, the blue curve is the volumetric strain-axial strain, and the histogram is the AE counts-time. Figure 6 gives the relationship between the deformation modulus at the peak point and the confining pressure under a Talbot index of 0.4. It can be seen from the figures that the peak strength and peak strain of the CPB specimen increase with the confining pressure, which indicates a positive correlation between the compressibility of CPB and the confining pressure. The deformation modulus of the CPB specimen grows quickly in the confining pressure range of 0–0.5 MPa, which indicates the strength of CPB is more sensitive to the confining pressure than to its deformation. However, the deformation modulus basically remains constant when the confining pressure is greater than 0.5 MPa, which indicates the confining pressure increase in the strength of CPB is basically the same as the deformation. The confining pressure not only increases the peak strength and compressibility of CPB, but also greatly increases its ductility. As shown in Figure 5a, when the confining pressure is 0 MPa (that is it is in uniaxial compression), the specimen exhibits an obvious strain softening characteristic. However, at confining pressures of 0.5, 1, and 2 MPa, after the specimen reaches the yield strength, a distinct yield platform occurs and creates a plastic flow state which is characterized by strain hardening, as shown in Figure 5b–d. It is worth noting that a specific point of maximum volumetric strain exists before the peak strength in the deformation of the CPB specimen. Before this point, the volumetric strain varies in the same direction as the principal stress, therefore the specimen is characterized as in a compression state. After this point, the volumetric strain changes in the opposite direction to the principal stress, thereby causing the specimen to enter a dilatancy state. The presence of confining pressure increases these compression deformations and dilatancy deformations, as can be seen by comparing Figure 5a–d. Incredibly, a specimen under confining pressure can still maintain the same carrying capacity in the case of continuous volume dilatancy. To achieve this ductility characteristic, the material must simultaneously show two characteristics. The first is that the new cracks continuously expand and propagate. The second is that the already opened cracks require constant compression and occlusal friction. This mechanism is well proven in the AE distributions of CPB specimens. The expansion and propagation of new cracks cause large AE signals, and small AE signals are produced by the constant compression and occlusal friction of the already opened cracks. Moreover, due to the existence of confining pressure, the AE signals generated by the friction among the fracture grains are more frequent. Therefore, under the condition of confining pressure, the AE characteristic of the CPB specimen show that small AE signals distribute around large AE signals, as shown in Figure 5b–d. It is obviously different from the AE characteristic under uniaxial compression shown in Figure 5a. It should be noted that the small amount of cement with a mass ratio 1:10 of cement to particles, and the short curing time of 7 days, caused some fractures of the cohesive particles and AE activities in CPB specimen during the initial loading period. In addition, the further increase in the volumetric strain in the end stage of volume deformation, shown in Figure 5b,c, was caused by a large circumferential deformation exceeding the range of the MTS circumferential extensometer.
Figure 7 shows the stress–strain-AE curves of CPB specimens with Talbot indices of (a) 0.2, (b) 0.4, (c) 0.6 and (d) 0.8, under a confining pressure of 1 MPa. Figure 8 gives the relationship between the deformation modulus at the peak point and the Talbot index under a confining pressure of 1 MPa. It can be seen from the figures that there is a Talbot index of particles that can allow both the strength and deformation of CPB to reach their extremes. The deformation modulus has a quadratic polynomial relationship with the Talbot index. This shows that there is a reasonable Talbot index that can optimize the compressibility of CPB. The gradation of particles not only affects the peak strength and compressibility of CPB, but also greatly influences the dilatancy behavior. The dilatancy deformation of CPB increases with the Talbot index. The volumetric strain of 0.0167 at cd point varies to 0.0123 at c point in a CPB specimen with a Talbot index of 0.2, which causes a volume dilatancy on volumetric strain of 0.0044, as shown in Figure 7a. Figure 7b shows the volumetric strain of 0.0149 at cd point varies to 0.0020 at c point in a CPB specimen with a Talbot index of 0.4, which results in the volume dilatancy on volumetric strain of 0.0129. Figure 7c presents the volumetric strain of 0.0202 at cd point varies to 0.0067 at c point in a CPB specimen with a Talbot index of 0.6, which causes the volume dilatancy on volumetric strain of 0.0135. Finally, the volumetric strain of 0.0197 at cd point varies to −0.0046 at c point in a CPB specimen with a Talbot index of 0.8, which results in the volume dilatancy on volumetric strain of 0.0243, as shown in Figure 7d. It is worth noting that the CPB specimen can still maintain a stable carrying capacity under a large dilatancy deformation. Obviously, this ductility characteristic of CPB material is also positively correlated with the Talbot index. In addition, the density and intensity of the AE distribution in specimens with a Talbot index of 0.2 are significantly lower than those of other specimens. This is due to the fact that the particles in the CPB under these conditions are too fine, and the mass of the particles is below 1 mm in size, accounting for a total mass of particles above 60%. The peak strength of this specimen is also the smallest of all CPB specimens.
3.2. Effects of Particle Size Distribution on the Strength Parameters of CPB
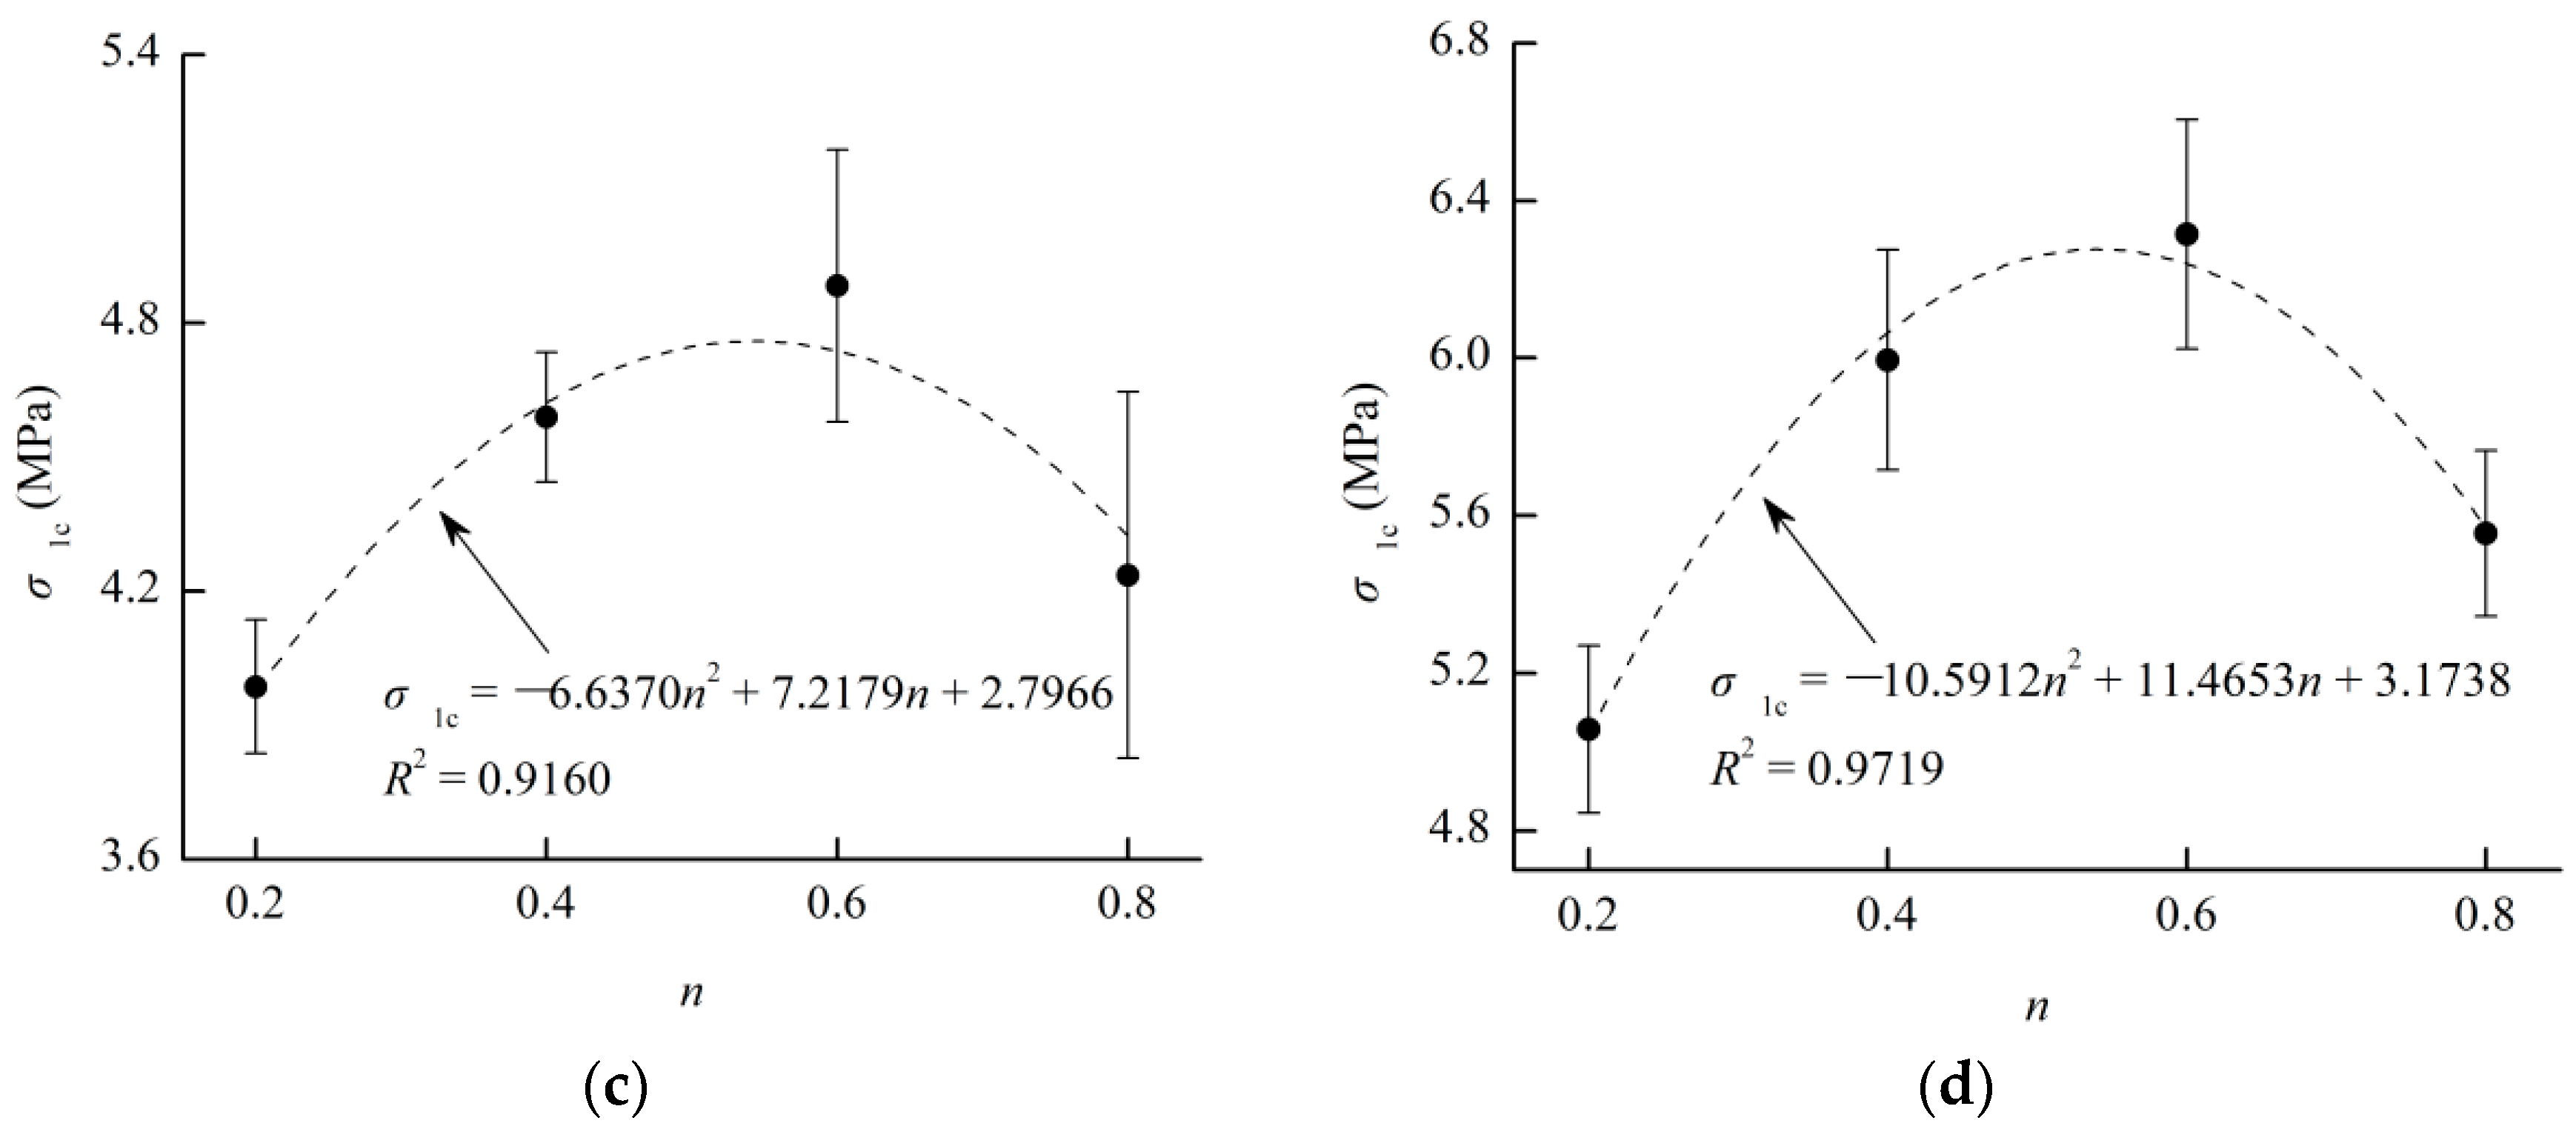
Figure 9 gives the relationship between the peak strength and the Talbot index of particles in CPB specimens under different confining pressures. It can be seen from the figure that all the peak strengths of CPB under different confining pressures first increase and then decrease with the increase of the Talbot index. This means that there is an optimal gradation of particles that maximizes the CPB’s peak strength, for which the optimization is between 0.4 and 0.6 based on the Talbot gradation. Therefore, a quadratic polynomial function is used to describe the relationship between the peak strength and the Talbot index, and the extremum of the established function in the Talbot gradation range can be used to characterize the optimal gradation of particles reflected by the maximum strength of the CPB material, which has a definite physical meaning. Table 5 presents the relationships between the peak strength and the Talbot index of CPB specimens under different confining pressures; all the fitting correlation coefficients are generally higher than 0.9. This indicates that the function can be used to characterize the relationship between the peak strength and the Talbot index.
where is the peak strength of the CPB specimen, and α, β and λ are the test control parameters.
The Mohr–Coulomb strength criterion is usually used to describe the strength characteristic of geo-materials. The maximum shear force that the material can carry is composed of the cohesive force and the internal friction caused by the normal stress [66]:
where the internal friction coefficient is , and the internal friction angle is . This means that the maximum principal stress in the material is linearly related to the minimum principal stress:
where M and N are the strength parameters of the Mohr–Coulomb strength criterion, which can be characterized as [67]:
The criterion has a clear physical meaning, which considers that geo-materials have cohesiveness and internal friction properties. Moreover, the failure characteristics of geotechnical specimens mostly present as the shear failure mode. Therefore, the Mohr–Coulomb strength criterion is widely used in geotechnical engineering [68,69].
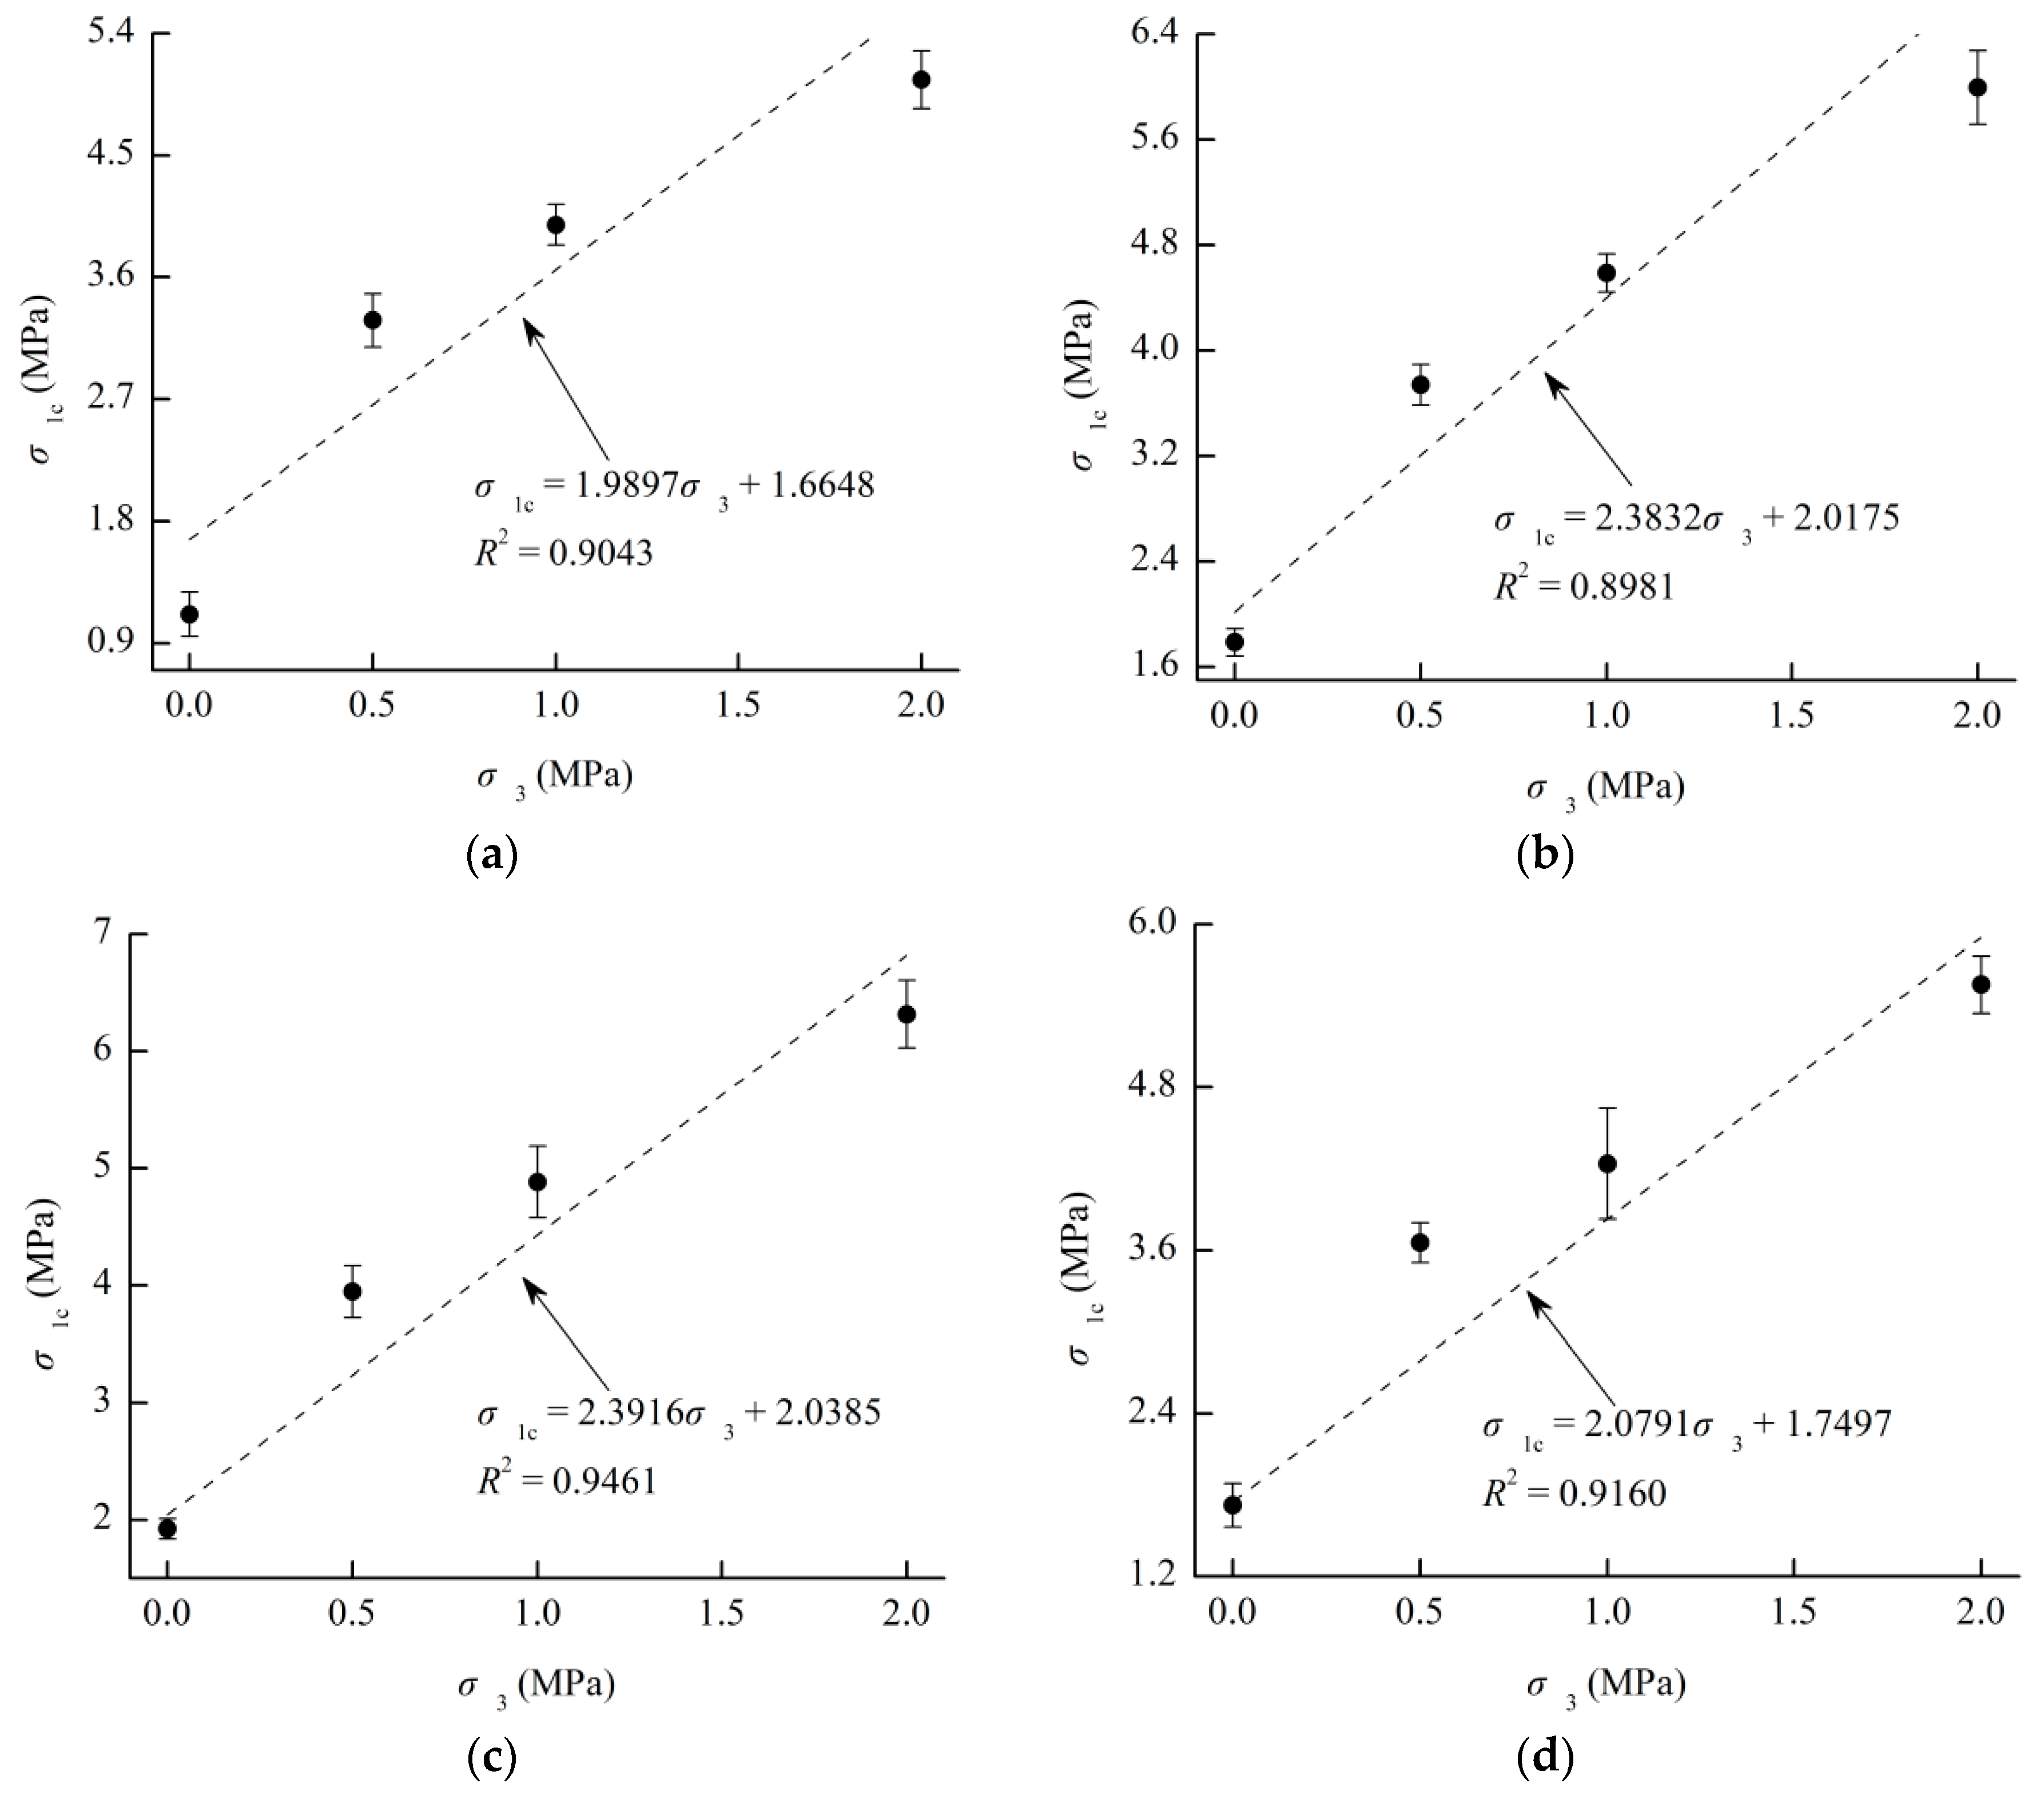
Figure 10 shows the relationship between the peak strength and confining pressure in CPB specimens with different gradations of particles. It can be seen from the figure that the peak strength of CPB with different Talbot indices is positively correlated with the confining pressure. The relationship can be described by the linearity, as given in Table 6. When the confining pressure is 0 MPa, the parameter of M characterizes the theoretical peak strength of CPB, and the sensitivity of the peak strength to the confining pressure is reflected in the parameter of N. Thus, the fitting strength parameters also have a clear physical meaning.
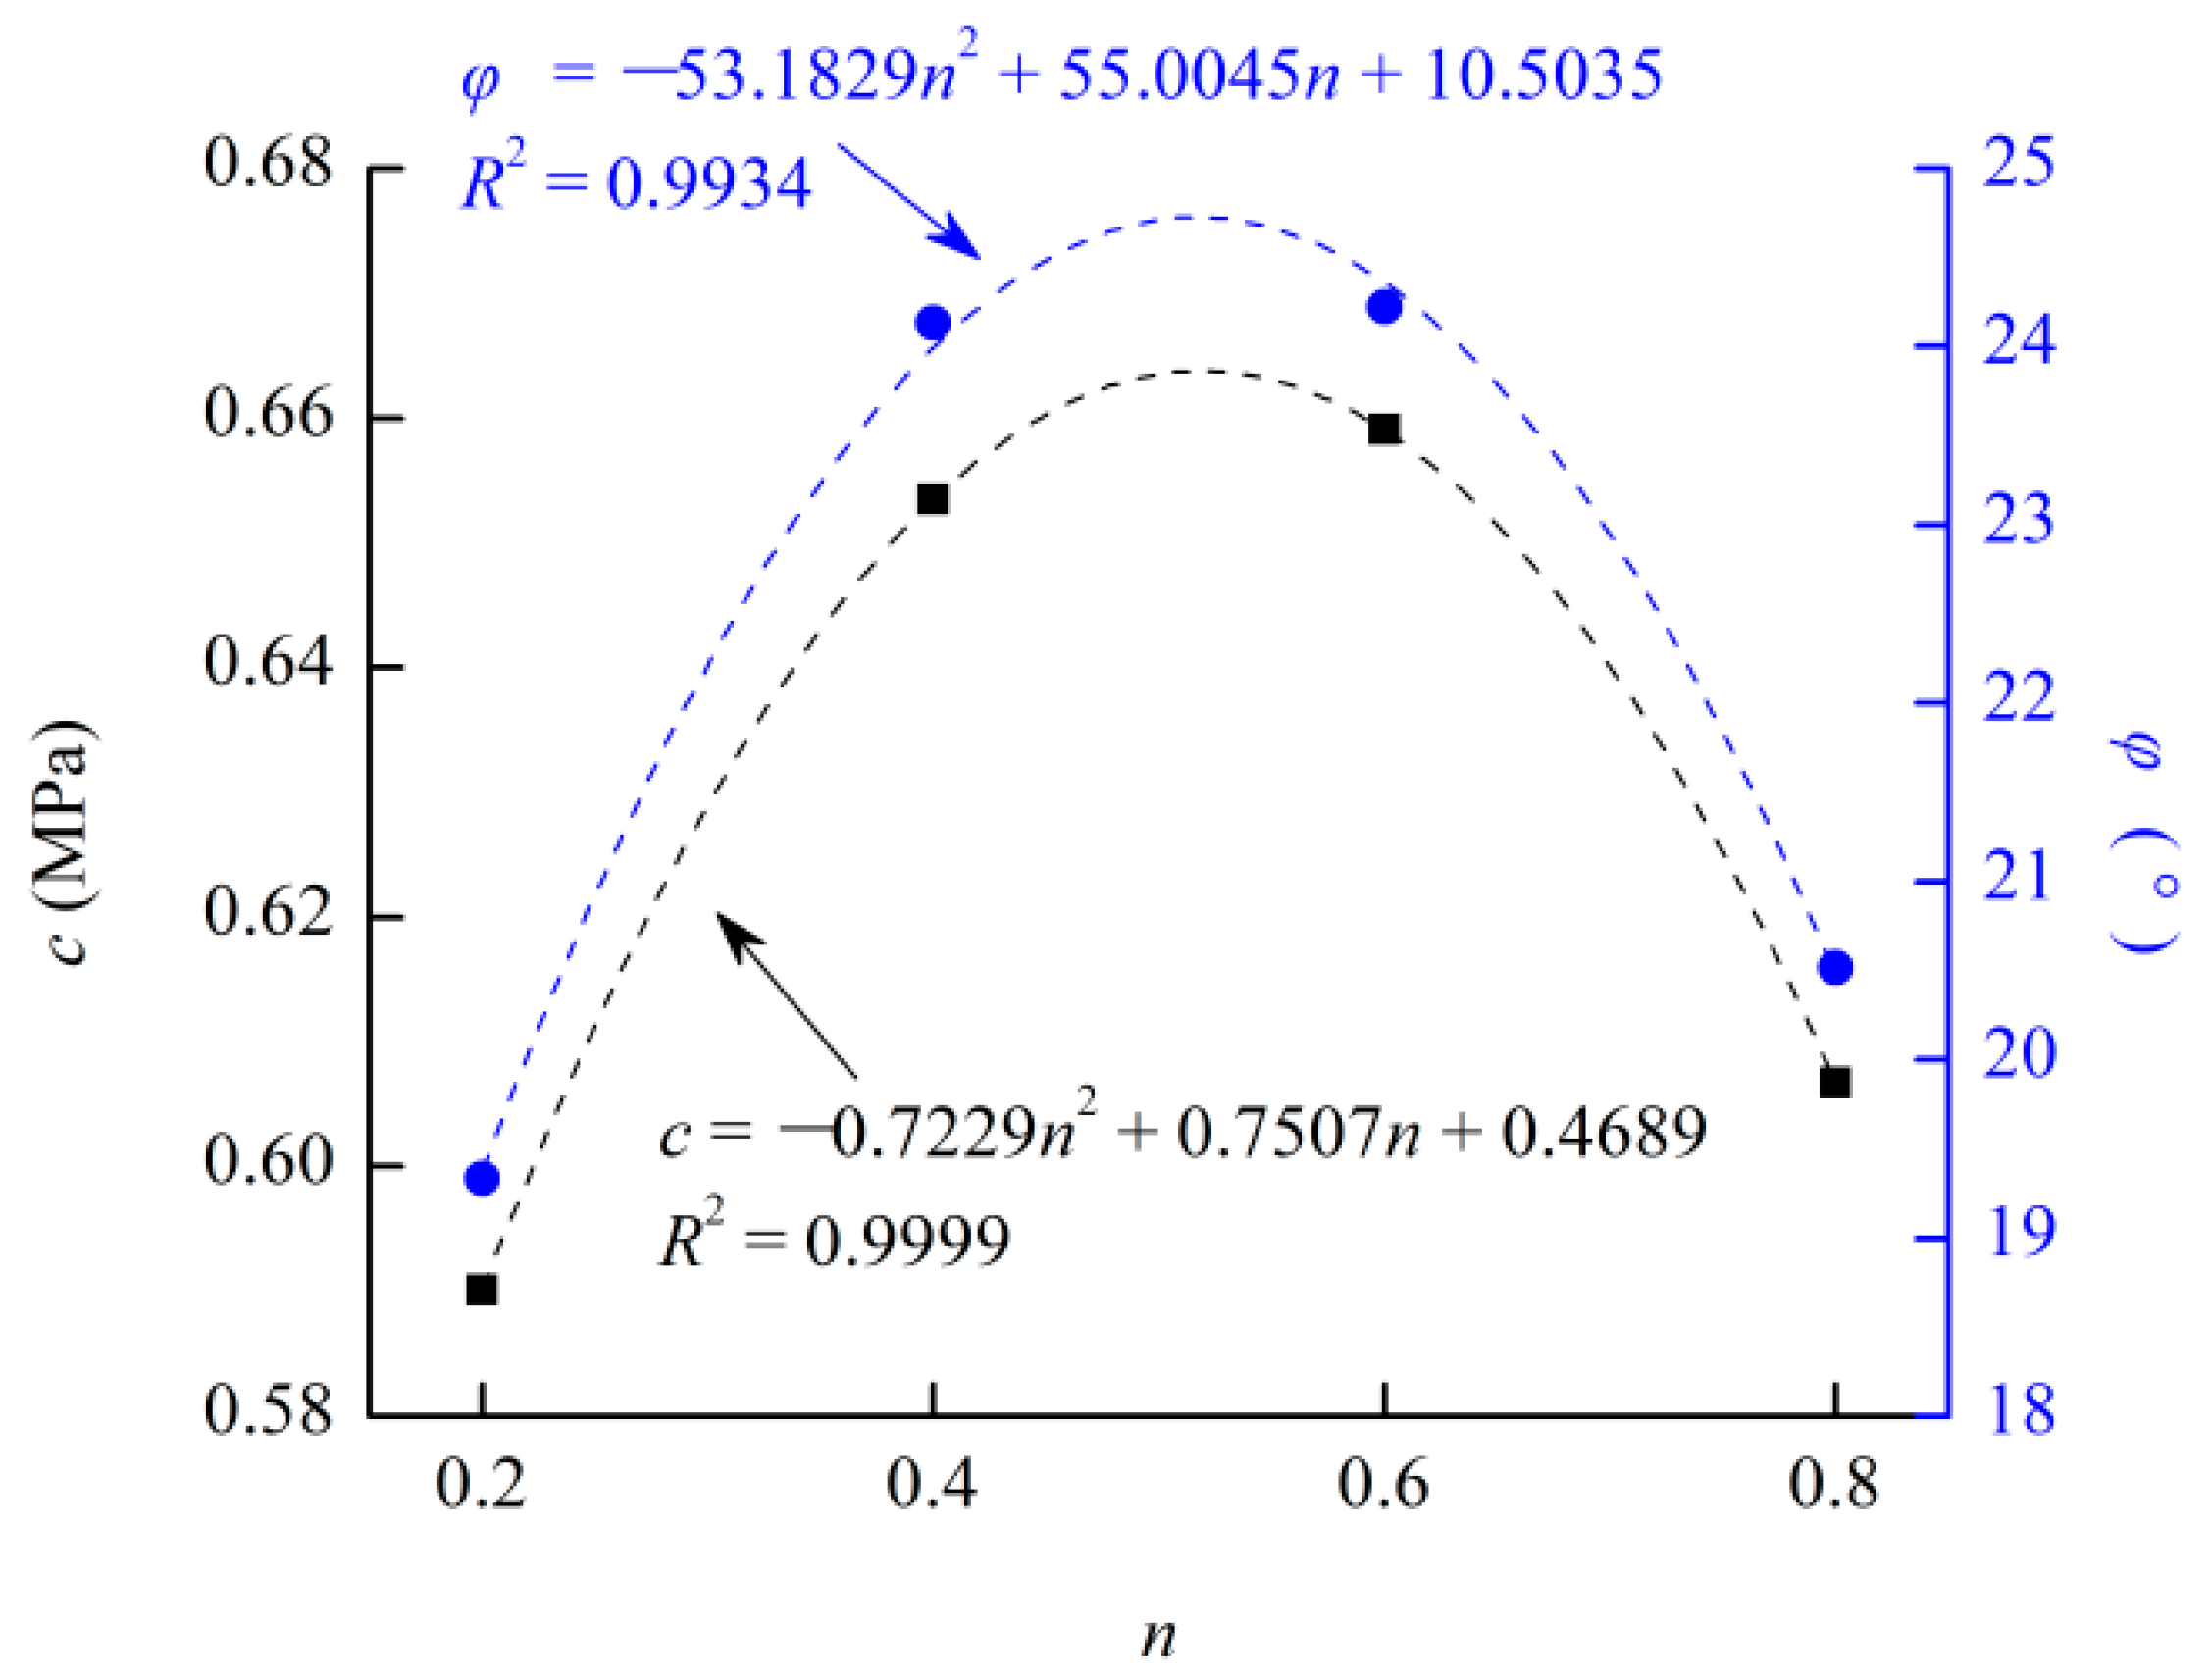
Figure 11 presents the relationship between the fitting strength parameters of M and N and the Talbot index, Figure 12 gives the relationship between the strength parameters of and and the Talbot index, and the corresponding relationships are given in Table 7. To our knowledge, the cohesive force among the particles in geo-material decreases with the yield and damage of the material, which causes the cohesive particles to fracture. However, the material can still rely on the fissure friction to continue to load; the maximum friction force can exceed the cohesive force of the geo-material, and the friction force is correlated with the internal friction property of the material and the external load [70]. Hence, the increase of the confining pressure to the peak strength of CPB only increases the maximum friction force that can be carried within the material, and has no effect on the cohesive property. However, the influence of the particle size distribution on CPB is reflected in both the properties of cohesiveness and internal friction, as shown in Figure 11 and Figure 12. All of the strength parameters are in a quadratic polynomial relationship with the Talbot index. This indicates that there is an optimal gradation of particles reflected in the maximum cohesive force and internal friction angle of CPB. Moreover, in terms of the sensitivity to confining pressure, the CPB specimen with better gradation is greater, which is reflected in the parameter of N. This means that as the confining pressure increases, the strength parameters of the CPB with better gradation will further increase.
3.3. The Coupled Effect of Confining Pressure and Particle Size Distribution on the Strength Parameters of CPB
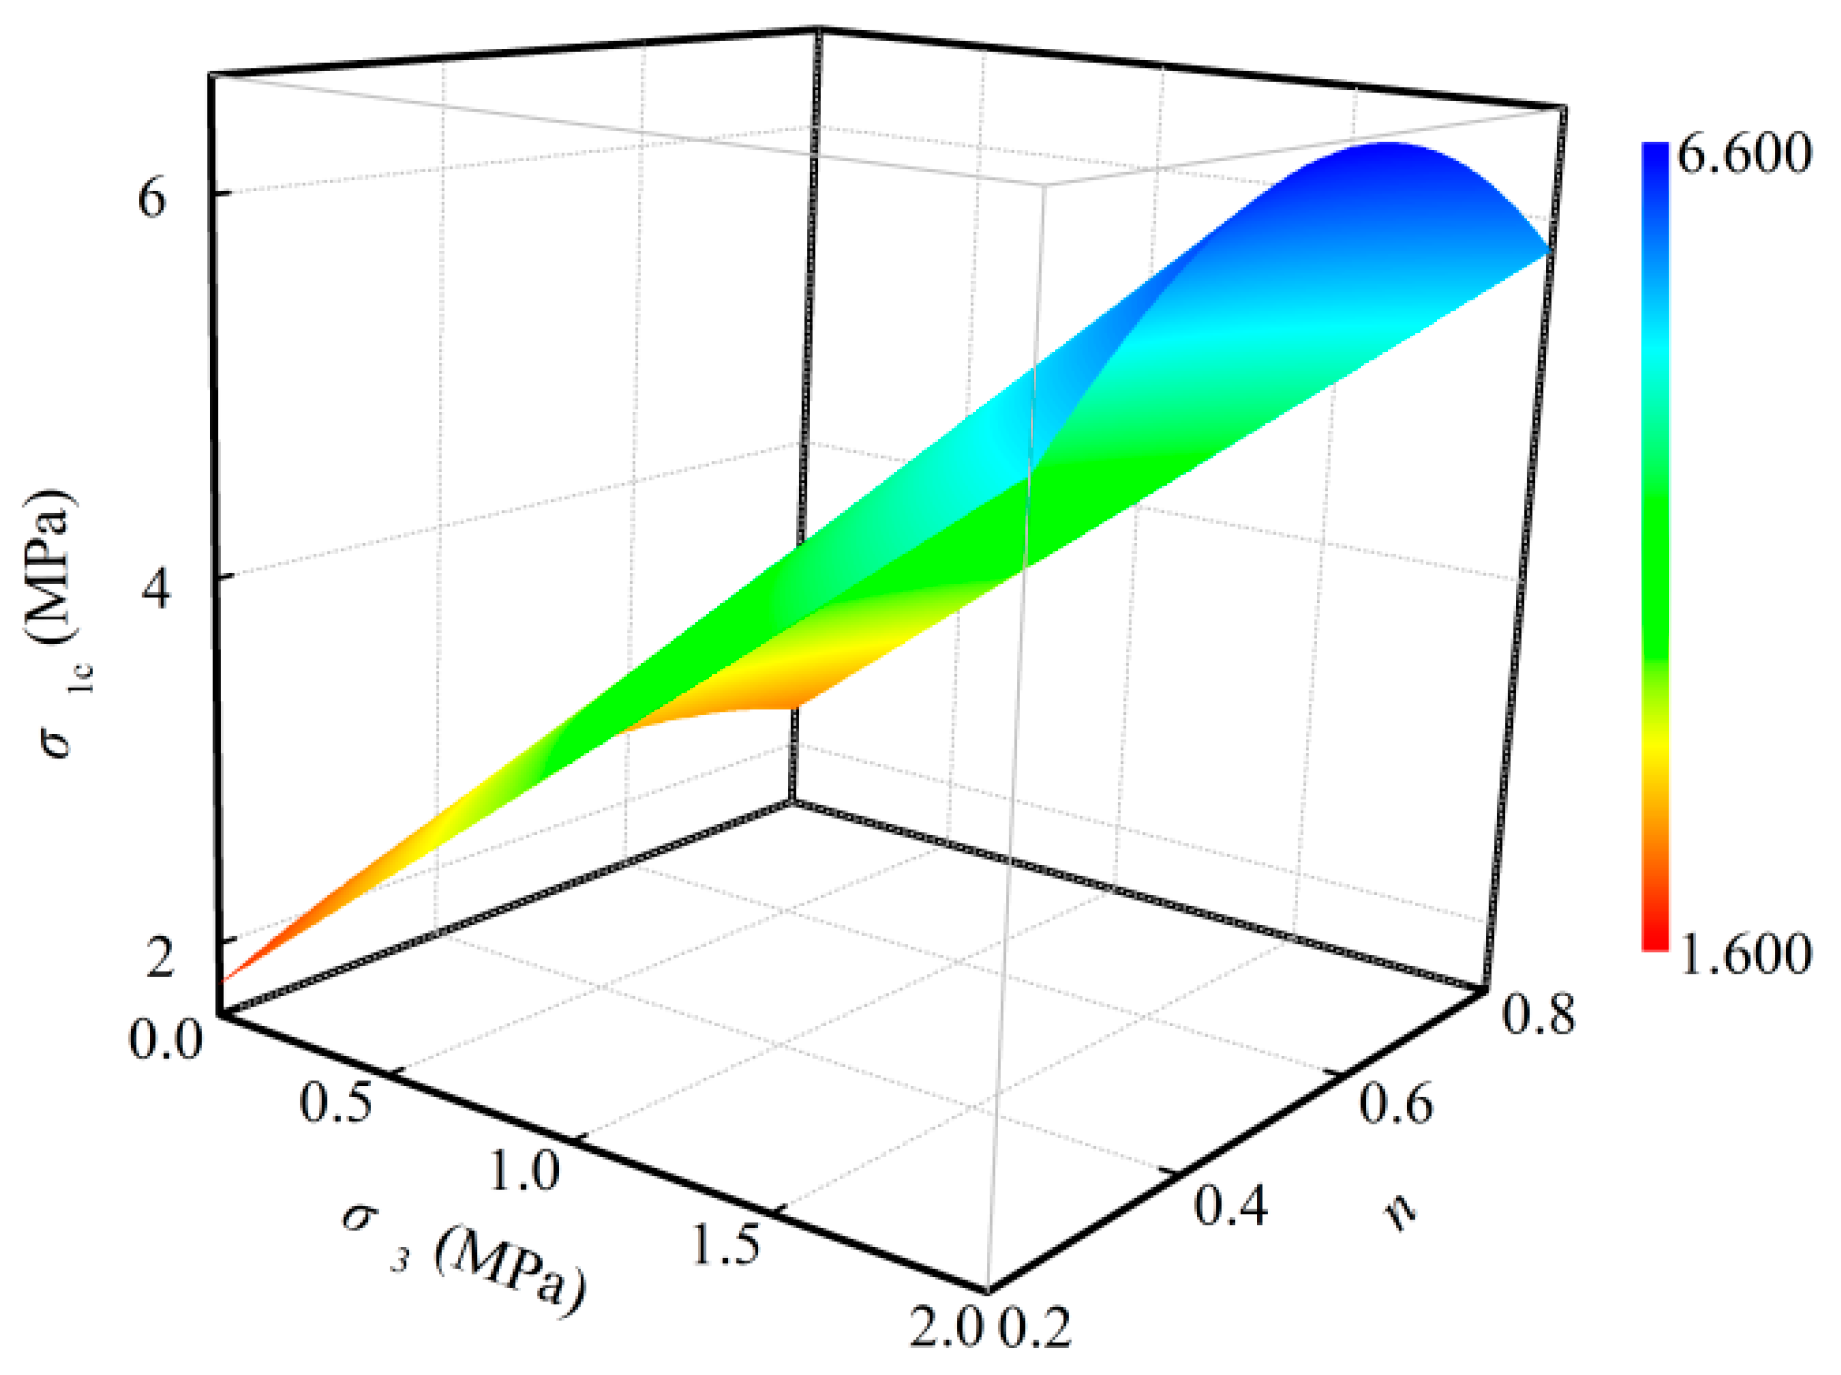
At present, mass ratios of 1:2–1:12 between the cementing materials and particles are generally used in CPB; that is, the particles account for at least 66% of the mass of the CPB, thereby causing a crucial influence of the particles on the CPB material. For the CPB material, an excessive content of large particles tends to deteriorate the pore structure, which results in the formation of voids inside the structure which cannot be completely filled. In contrast, too many fine particles cause weaker planes in the boundaries of the cement-rock, and an increase of interparticle voids. Consequently, it is of great significance to seek the optimal gradation of particles to enhance the strength of CPB, in order to save filling material and improve the filling effect, which greatly benefits safety and economics during engineering. CPB is always in triaxial compression, therefore we have constructed a strength parameter model of CPB under the coupled influence of the confining pressure and the particle size distribution. The cohesiveness and internal friction properties of the CPB material are related to the gradation of particles within it. The relationship between the cohesive force and the Talbot index was used to characterize the effect of the gradation of particles on the cohesiveness property of CPB, and the relationship between the internal friction angle and the Talbot index was used to characterize the influence of the gradation of particles on the internal friction property of CPB. The relationships of and are therefore easy to obtain.
The strength parameter model of CPB under the coupled influence of the confining pressure and the particle size distribution can be obtained based on Formulas (5)–(7):
where A1, B1, C1, A2, B2 and C2 are the test control parameters.
Obviously, the strength parameter model is based on the Mohr–Coulomb strength criterion. It is believed that the cohesiveness and internal friction properties of CPB are related to the particle size distribution, that there is an optimal gradation of particles reflected in the maximum strength parameter, and that each parameter has a clear physical meaning. Figure 13 shows the strength parameter model established based on the test results of this paper. The correlation coefficient match with the experimental values reaches 0.8979, which simultaneously reflects the effect of the confining pressure and the gradation of particles on the strength parameters of CPB. According to this model, it is possible to intuitively select the CPB with the appropriate gradation of particles to fill in the goaf under known conditions of depth and ground stress.
This paper mainly discusses the effect of the particle size distribution on the strength parameters of CPB, and tries to optimize the framework structure of CPB in engineering to enhance its strength and improve the filling effect, which in turn can result in improved economics and safety [71,72,73]. However, Yilmaz et al. pointed out those fine particles can undergo significant consolidation settlement in the early curing stage [74]. CPB curing under pressure involves the rearrangement of particles caused by the settlement of fine particles, which can significantly affect its structural and mechanical properties [75]. Therefore, the consolidation effect should be considered in this process. For CPB with multiple particle size distributions under curing conditions with pressure especially, differences in the particle size distribution inevitably cause differences in the settlement of different particles in the CPB. This involves the coupled effect of particle size distribution and consolidation on the structural and mechanical properties of CPB. In the future, we can use curing under an applied pressure system [76] to improve the backfill’s geotechnical design, and the CPB specimen will still maintain a constant carrying capacity under confining pressure even if there is a large dilatancy deformation in its structure, as shown in Figure 5 and Figure 7. This indicates that an increase in deformation can make more materials yield, however, it will not cause the macroscopic slippage produced by crack propagation to occur in the failure of the CPB specimen under confining pressure. In fact, the deformation of CPB in the deep earth is used to dissipate the energy released from the rock mass. If the CPB material can have both high strength and excellent ductility, it will undoubtedly greatly improve the filling effect and increase the service life of CPB. Therefore, CPB’s ductility also deserves our attention. As seen in the results of Figure 7, the optimization of the gradation of particles can also improve the ductility of the CPB. However, there has not been any study that has focused on CPB’s ductility so far. There are some difficulties in measuring ductility, and there are no clear and uniform standards. This work will be the direction of the author’s future efforts.
4. Conclusions
The ultrasonic test, uniaxial and triaxial compression experiment, and acoustic emission (AE) monitoring were carried out on CPB, for which the particles satisfied Talbot gradation. The homogeneity of CPB specimens was evaluated by the ultrasonic pulse velocity (UPV). The stress–strain behavior and AE characteristic of CPB specimens under different Talbot indices and confining pressures were investigated. The effects of the particle size distribution and the confining pressure on the peak strength of CPB were analyzed. The strength parameter model of CPB under the coupled influence of the particle size distribution and the confining pressure was constructed based on the Mohr–Coulomb strength criterion.
- (1)
- The confining pressure not only increases the peak strength and compressibility of CPB, but also greatly increases its ductility. With the increase of confining pressure, CPB is transformed from demonstrating the strain softening characteristic under uniaxial compression to the strain hardening characteristic under triaxial compression. The material must have two points at the same time to achieve this ductility characteristic under confining pressure. The first is that the new cracks continuously expand and propagate. The second is that the already opened cracks require constant compression and occlusal friction. Therefore, under the condition of confining pressure, the AE characteristic of CPB specimens show that small AE signals distribute around the large AE signals. This is obviously different from the AE characteristic under uniaxial compression.
- (2)
- This ductility and the dilatancy deformation of CPB are positively correlated with the Talbot index of particles. In addition, in the CPB specimens with a Talbot index of 0.2, since they contain too many fine particles, the density and intensity of the AE distribution and the peak strength are the lowest among all the specimens.
- (3)
- The peak strength of the CPB specimen first increases and then decreases with the increase of the Talbot index, and the relationship between the peak strength and the Talbot index can be described by a quadratic polynomial function. The extremum of the function in the Talbot gradation range can be used to characterize the optimal gradation of particles reflected by the maximum strength of the CPB material, for which the optimal Talbot index is between 0.4 and 0.6.
- (4)
- The established strength parameter model of CPB under the coupled influence of the confining pressure and the particle size distribution is related to the cohesiveness and internal friction properties of the material, and each parameter has a definite physical meaning. Under the conditions of this paper, the model can effectively reflect the influence of the confining pressure and the particle size distribution on the peak strength of CPB, and can also reflect the influence of the particle size distribution on the cohesive force and internal friction angle of CPB.
Author Contributions
J.W., M.F., Z.C. and X.M. conceived and designed the experiments; J.W., Y.W. and G.H. performed the experiments; J.W., M.F. and Z.C. analyzed the data; J.W., M.F., Z.C. and X.M. wrote the paper.
Acknowledgments
This work was supported by the Fundamental Research Funds for the Central Universities (No. 2018BSCXB22) and the Postgraduate Research & Practice Innovation Program of Jiangsu Province (KYCX18_1970).
Conflicts of Interest
The authors declare no conflict of interest.
References
- Khoshand, A.; Fall, M. Geotechnical characterization of peat-based landfill cover materials. J. Rock Mech. Geotech. Eng. 2016, 6, 1–9. [Google Scholar] [CrossRef]
- Deng, D.Q.; Liu, L.; Yao, Z.L.; Song, K.; Lao, D.Z. A practice of ultra-fine tailings disposal as filling material in a gold mine. J. Environ. Manag. 2017, 196, 100–109. [Google Scholar] [CrossRef] [PubMed]
- Li, M.; Zhang, J.X.; Zhou, N.; Huang, Y.L. Effect of Particle Size on the Energy Evolution of Crushed Waste Rock in Coal Mines. Rock Mech. Rock Eng. 2017, 50, 1–8. [Google Scholar] [CrossRef]
- Li, X.B.; Li, D.Y.; Liu, Z.X.; Zhao, G.Y.; Wang, W.H. Determination of the minimum thickness of crown pillar for safe exploitation of a subsea gold mine based on numerical modelling. Int. J. Rock Mech. Min. Sci. 2013, 57, 42–56. [Google Scholar] [CrossRef]
- Zhang, J.X.; Li, B.Y.; Zhou, N.; Zhang, Q. Application of solid backfilling to reduce hard-roof caving and longwall coal face burst potential. Int. J. Rock Mech. Min. Sci. 2016, 88, 197–205. [Google Scholar] [CrossRef]
- Zhang, K.; Yang, T.H.; Bai, H.B.; Gamage, R.P. Longwall mining–induced damage and fractures: Field measurements and simulation using FDM and DEM coupled method. Int. J. Geomech. 2018, 18, 04017127. [Google Scholar] [CrossRef]
- Sivakugan, N.; Rankine, R.M.; Rankine, K.J.; Rankine, K.S. Geotechnical considerations in mine backfilling in Australia. J. Clean. Prod. 2006, 14, 1168–1175. [Google Scholar] [CrossRef]
- Abdul-Hussain, N.; Fall, M. Thermo-hydro-mechanical behaviour of sodium silicate-cemented paste tailings in column experiments. Tunn. Undergr. Space Technol. 2012, 29, 85–93. [Google Scholar] [CrossRef]
- Holt, E.; Leivo, M. Cracking risks associated with early age shrinkage. Cem. Concr. Compos. 2004, 26, 521–530. [Google Scholar] [CrossRef]
- Ouellet, S.; Bussière, B.; Aubertin, M.; Benzaazoua, M. Characterization of cemented paste backfill pore structure using SEM and IA analysis. Bull. Eng. Geol. Environ. 2008, 67, 139–152. [Google Scholar] [CrossRef]
- Wu, A.X.; Wang, Y.; Wang, H.J.; Yin, S.H.; Miao, X.X. Coupled effects of cement type and water quality on the properties of cemented paste backfill. Int. J. Min. Process. 2015, 143, 65–71. [Google Scholar] [CrossRef]
- Ouellet, S.; Bussière, B.; Mbonimpa, M.; Benzaazoua, M.; Aubertin, M. Reactivity and mineralogical evolution of an underground mine sulphidic cemented paste backfill. Miner. Eng. 2006, 19, 407–419. [Google Scholar] [CrossRef]
- Fall, M.; Benzaazoua, M.; Saa, E.G. Mix proportioning of underground cemented tailings backfill. Tunn. Undergr. Space Technol. 2008, 23, 80–90. [Google Scholar] [CrossRef]
- Koohestani, B.; Koubaa, A.; Belem, T.; Bussière, B.; Bouzahzah, H. Experimental investigation of mechanical and microstructural properties of cemented paste backfill containing maple-wood filler. Constr. Build. Mater. 2016, 121, 222–228. [Google Scholar] [CrossRef]
- Ercikdi, B.; Cihangir, F.; Kesimal, A.; Deveci, H.; Alp, İ. Utilization of water-reducing admixtures in cemented paste backfill of sulphide-rich mill tailings. J. Hazard. Mater. 2010, 179, 940–946. [Google Scholar] [CrossRef] [PubMed]
- Koohestani, B.; Darban, A.K.; Mokhtari, P. A comparison between the influence of superplasticizer and organosilanes on different properties of cemented paste backfill. Constr. Build. Mater. 2018, 173, 180–188. [Google Scholar] [CrossRef]
- Koohestani, B.; Bussière, B.; Belem, T.; Koubaa, A. Influence of polymer powder on properties of cemented paste backfill. Int. J. Min. Process. 2017, 167, 1–8. [Google Scholar] [CrossRef]
- Koohestani, B. Effect of saline admixtures on mechanical and microstructural properties of cementitious matrices containing tailings. Constr. Build. Mater. 2017, 156, 1019–1027. [Google Scholar] [CrossRef]
- Pourjavadi, A.; Fakoorpoor, S.M.; Hosseini, P.; Khaloo, A. Interactions between superabsorbent polymers and cement-based composites incorporating colloidal silica nanoparticles. Cem. Concr. Compos. 2013, 37, 196–204. [Google Scholar] [CrossRef]
- Koohestani, B.; Belem, T.; Koubaa, A.; Bussière, B. Experimental investigation into the compressive strength development of cemented paste backfill containing Nano-silica. Cem. Concr. Compos. 2016, 72, 180–189. [Google Scholar] [CrossRef]
- Fall, M.; Célestin, J.C.; Pokharel, M.; Touré, M. A contribution to understanding the effects of curing temperature on the mechanical properties of mine cemented tailings backfill. Eng. Geol. 2010, 114, 397–413. [Google Scholar] [CrossRef]
- Fall, M.; Pokharel, M. Coupled effects of sulphate and temperature on the strength development of cemented tailings backfills: Portland cement-paste backfill. Cem. Concr. Compos. 2010, 32, 819–828. [Google Scholar] [CrossRef]
- Fall, M.; Samb, S.S. Effect of high temperature on strength and microstructural properties of cemented paste backfill. Fire Saf. J. 2009, 44, 642–651. [Google Scholar] [CrossRef]
- Ghirian, A.; Fall, M. Coupled thermo-hydro-mechanical-chemical behaviour of cemented paste backfill in column experiments. Part II: Physical, hydraulic and thermal processes and characteristics. Eng. Geol. 2013, 164, 195–207. [Google Scholar] [CrossRef]
- Jiang, H.; Fall, M.; Liang, C. Yield stress of cemented paste backfill in sub-zero environments: Experimental results. Miner. Eng. 2016, 92, 141–150. [Google Scholar]
- Yilmaz, E.; Belem, T.; Benzaazoua, M. Effects of curing and stress conditions on hydromechanical, geotechnical and geochemical properties of cemented paste backfill. Eng. Geol. 2014, 168, 23–37. [Google Scholar] [CrossRef]
- Cihangir, F.; Ercikdi, B.; Kesimal, A.; Deveci, H.; Erdemir, F. Paste backfill of high-sulphide mill tailings using alkali-activated blast furnace slag: Effect of activator nature, concentration and slag properties. Miner. Eng. 2015, 83, 117–127. [Google Scholar] [CrossRef]
- Jongpradist, P. Effective Void Ratio for Assessing the Mechanical Properties of Cement-Clay Admixtures at High Water Content. J. Geotech. Geoenviron. 2011, 137, 621–627. [Google Scholar] [CrossRef]
- Yilmaz, E.; Benzaazoua, M.; Belem, T.; Bussière, B. Effect of curing under pressure on compressive strength development of cemented paste backfill. Miner. Eng. 2009, 22, 772–785. [Google Scholar] [CrossRef]
- Liu, Z.X.; Dang, W.G.; Liu, Q.L.; Chen, G.H.; Peng, K. Optimization of clay material mixture ratio and filling process in gypsum mine goaf. Int. J. Min. Sci. Technol. 2013, 23, 337–342. [Google Scholar] [CrossRef]
- Miao, X.X.; Zhang, J.X.; Feng, M.M. Waste-filling in fully-mechanized coal mining and its application. J. China Univ. Min. Technol. 2008, 18, 479–482. [Google Scholar] [CrossRef]
- Liu, Z.X.; Li, X.B. Study on fractal gradation of tailings and knowledge bank of its cementing strength. Chin. J. Rock Mech. Eng. 2005, 24, 1789–1793. [Google Scholar]
- Yin, S.H.; Wu, A.X.; Hu, K.J.; Wang, Y.; Zhang, Y.K. The effect of solid components on the rheological and mechanical properties of cemented paste backfill. Miner. Eng. 2012, 35, 61–66. [Google Scholar] [CrossRef]
- Ke, X.; Hou, H.; Zhou, M.; Wang, Y.; Zhou, X. Effect of particle gradation on properties of fresh and hardened cemented paste backfill. Constr. Build. Mater. 2015, 96, 378–382. [Google Scholar] [CrossRef]
- Fall, M.; Benzaazoua, M.; Ouellet, S. Experimental characterization of the influence of tailings fineness and density on the quality of cemented paste backfill. Miner. Eng. 2005, 18, 41–44. [Google Scholar] [CrossRef]
- Börgesson, L.; Johannesson, L.E.; Gunnarsson, D. Influence of soil structure heterogeneities on the behaviour of backfill materials based on mixtures of bentonite and crushed rock. Appl. Clay Sci. 2003, 23, 121–131. [Google Scholar] [CrossRef]
- Yilmaz, E.; Belem, T.; Benzaazoua, M.; Kesimal, A.; Ercikdi, B. Evaluation of the strength properties of deslimed tailings paste backfill. Miner. Resour. Eng. 2013, 12, 129–144. [Google Scholar]
- Orejarena, L.; Fall, M. The use of artificial neural networks to predict the effect of sulphate attack on the strength of cemented paste backfill. Bull. Eng. Geol. Environ. 2010, 69, 659–670. [Google Scholar] [CrossRef]
- Gautam, B.P.; Panesar, D.K.; Sheikh, S.A.; Vecchio, F.J. Effect of coarse aggregate grading on the ASR expansion and damage of concrete. Cem. Concr. Res. 2017, 95, 75–83. [Google Scholar] [CrossRef]
- Liu, R.; Li, B.; Jiang, Y. Critical hydraulic gradient for nonlinear flow through rock fracture networks: The roles of aperture, surface roughness, and number of intersections. Adv. Water. Resour. 2016, 88, 53–65. [Google Scholar] [CrossRef]
- Liu, R.; Jiang, Y.; Li, B.; Yu, L. Estimating permeability of porous media based on modified Hagen–Poiseuille flow in tortuous capillaries with variable lengths. Microfluid. Nanofluid. 2016, 20, 120. [Google Scholar] [CrossRef]
- Yilmaz, E.; Benzaazoua, M.; Bussière, B.; Kesimal, A.; Ercikdi, B. Influence of disposal configurations on hydrogeological behaviour of sulphidic paste tailings: A field experimental study. Int. J. Miner. Process. 2014, 131, 12–25. [Google Scholar] [CrossRef]
- Ke, X.; Zhou, X.; Wang, X.; Wang, T.; Hou, H.B.; Zhou, M. Effect of tailings fineness on the pore structure development of cemented paste backfill. Constr. Build. Mater. 2016, 126, 345–350. [Google Scholar] [CrossRef]
- Kesimal, A.; Ercikdi, B.; Yilmaz, E. The effect of desliming by sedimentation on paste backfill performance. Miner. Eng. 2003, 16, 1009–1011. [Google Scholar] [CrossRef]
- Sari, D.; Pasamehmetoglu, A.G. The effects of gradation and admixture on the pumice lightweight aggregate concrete. Cem. Concr. Res. 2005, 35, 936–942. [Google Scholar] [CrossRef]
- Bosiljkov, V.B. SCC mixes with poorly graded aggregate and high volume of limestone filler. Cem. Concr. Res. 2003, 33, 1279–1286. [Google Scholar] [CrossRef]
- Lamontagne, A.; Pigeon, M. The influence of polypropylene fibers and aggregate grading on the properties of dry-mix shotcrete. Cem. Concr. Res. 1995, 25, 293–298. [Google Scholar] [CrossRef]
- Zhang, T.S.; Yu, Q.J.; Wei, J.X.; Zhang, P.P. A new gap-graded particle size distribution and resulting consequences on properties of blended cement. Cem. Concr. Compos. 2011, 33, 543–550. [Google Scholar] [CrossRef]
- Ashraf, W.B.; Noor, M.A. Laboratory-Scale Investigation on Band Gradations of Aggregate for Concrete. J. Mater. Civ. Eng. 2013, 25, 1776–1782. [Google Scholar] [CrossRef]
- Ma, D.; Zhou, Z.; Wu, J.; Li, Q.; Bai, H. Grain Size Distribution Effect on the Hydraulic Properties of Disintegrated Coal Mixtures. Energies 2017, 10, 612. [Google Scholar] [Green Version]
- Wu, J.Y.; Feng, M.M.; Yu, B.Y.; Chen, Z.Q.; Mao, X.B.; Han, G.S. Experimental study of strength and deformation characteristics of cemented waste rock backfills with continuous gradation. Rock Soil Mech. 2017, 38, 101–108. [Google Scholar]
- Ma, D.; Rezania, M.; Yu, H.; Bai, H. Variations of hydraulic properties of granular sandstones during water inrush: Effect of small particle migration. Eng. Geol. 2017, 217, 61–70. [Google Scholar] [CrossRef] [Green Version]
- Fall, M.; Benzaazoua, M. Modeling the effect of sulphate on strength development of paste backfill and binder mixture optimization. Cem. Concr. Res. 2005, 35, 301–314. [Google Scholar] [CrossRef]
- Cao, S.; Song, W.D.; Yilmaz, E. Influence of structural factors on uniaxial compressive strength of cemented tailings backfill. Constr. Build. Mater. 2018, 174, 190–201. [Google Scholar] [CrossRef]
- Yilmaz, E.; Belem, T.; Benzaazoua, M. Specimen size effect on strength behavior of cemented paste backfills subjected to different placement conditions. Eng. Geol. 2015, 185, 52–62. [Google Scholar] [CrossRef]
- ASTM Standard C192/C192M-13a. 2013. Standard Practice for Making and Curing Concrete Test Specimens in the Lab. Annual Book of ASTM Standards, 04.02, West Conshohocken, PA. Available online: http://dx.doi.org/10.1520/C0192_C0192M-13A (accessed on 19 September 2016).
- Ulusay, R. The ISRM Suggested Methods for Rock Characterization, Testing and Monitoring: 2007–2014; Springer International Publishing: Cham, Switzerland, 2015. [Google Scholar]
- Darlignton, W.J.; Ranjith, P.G.; Choi, S.K. The effect of specimen size on strength and other properties in lab testing of rock and rock-like cementitious brittle materials. Rock Mech. Rock Eng. 2011, 44, 513–529. [Google Scholar] [CrossRef]
- Feng, M.M.; Wu, J.Y.; Ma, D.; Ni, X.Y.; Yu, B.Y.; Chen, Z.Q. Experimental investigation on seepage property of saturated broken red sandstone of continuous gradation. Bull. Eng. Geol. Environ. 2017, 1–12. [Google Scholar] [CrossRef]
- Talbot, A.N.; Richart, F.E. The Strength of Concrete and Its Relation to the Cement, Aggregate and Water; Bulletin; Univeristy of Illinois Engineering Experiment Station: Champaign, IL, USA, 1923; Volume 137, pp. 1–118. [Google Scholar]
- Carpinteri, A.; Corrado, M.; Lacidogna, G. Heterogeneous materials in compression: Correlations between absorbed, released and acoustic emission energies. Eng. Fail. Anal. 2013, 33, 236–250. [Google Scholar] [CrossRef]
- Wu, J.Y.; Feng, M.M.; Yu, B.Y.; Han, G.S. The length of pre-existing fissures effects on the mechanical properties of cracked red sandstone and strength design in engineering. Ultrasonics 2018, 82, 188–199. [Google Scholar] [CrossRef] [PubMed]
- Wu, J.Y.; Feng, M.M.; Yu, B.Y.; Zhang, W.L.; Ni, X.Y.; Han, G.S. Experimental investigation on dilatancy behavior of water-saturated sandstone. Int. J. Min. Sci. Technol. 2018, 28, 323–329. [Google Scholar] [CrossRef]
- Yilmaz, T.; Ercikdi, B.; Karaman, K.; Külekçi, G. Assessment of strength properties of cemented paste backfill by ultrasonic pulse velocity test. Ultrasonics 2014, 54, 1386–1394. [Google Scholar] [CrossRef] [PubMed]
- Ercikdi, B.; Yilmaz, T.; Külekci, G. Strength and ultrasonic properties of cemented paste backfill. Ultrasonics 2013, 54, 195–204. [Google Scholar] [CrossRef] [PubMed]
- Hoek, E. Estimating Mohr-Coulomb friction and cohesion values from the Hoek-Brown failure criterion. Int. J. Rock Mech. Min. Sci. Geomech. Abstr. 1990, 27, 227–229. [Google Scholar] [CrossRef]
- Hoek, E.; Kaiser, P.K.; Bawden, W.F. Support of Underground Excavations in Hard Rock; Balkema: Rotterdam, The Netherlands, 1995. [Google Scholar]
- You, M.Q. Comparison of the accuracy of some conventional triaxial strength criteria for intact rock. Int. J. Rock Mech. Min. Sci. 2011, 48, 852–863. [Google Scholar] [CrossRef]
- Wu, J.Y.; Chen, Z.Q.; Feng, M.M.; Wang, Y.M.; Han, G.S. The length of pre-existing fissure effects on the dilatancy behavior, acoustic emission, and strength characteristics of cracked sandstone under different confining pressures. Environ. Earth Sci. 2018, 77, 430. [Google Scholar] [CrossRef]
- You, M.Q. True-triaxial strength criteria for rock. Int. J. Rock Mech. Min. Sci. 2009, 46, 115–127. [Google Scholar] [CrossRef]
- Li, M.; Zhang, J.X.; Huang, Y.L.; Zhou, N. Effects of particle size of crushed gangue backfill materials on surface subsidence and its application under buildings. Environ. Earth Sci. 2017, 76, 603. [Google Scholar] [CrossRef]
- Zhang, J.X.; Li, M.; Liu, Z.; Zhou, N. Fractal characteristics of crushed particles of coal gangue under compaction. Powder Technol. 2017, 305, 12–18. [Google Scholar] [CrossRef]
- Li, M.; Zhang, J.X.; Quan, K.; Zhou, N. Innovative Extraction Method for a Coal Seam with a Thick Rock-Parting for Supporting Coal Mine Sustainability. Sustainability 2017, 9, 1982. [Google Scholar] [CrossRef]
- Yilmaz, E.; Belem, T.; Benzaazoua, M. One-dimensional consolidation parameters of cemented paste backfills. Miner. Resour. Manag. 2012, 28, 29–45. [Google Scholar]
- Yilmaz, E.; Belem, T.; Bussière, B.; Benzaazoua, M. Relationships between microstructural properties and compressive strength of consolidated and unconsolidated cemented paste backfills. Cem. Concr. Compos. 2011, 33, 702–715. [Google Scholar] [CrossRef]
- Yilmaz, E.; Belem, T.; Bussière, B.; Mbonimpa, M.; Benzaazoua, M. Curing time effect on consolidation behaviour of cemented paste backfill containing different cement types and contents. Constr. Build. Mater. 2015, 75, 99–111. [Google Scholar] [CrossRef]
Figure 1.
Device for cemented paste backfill (CPB) specimen production. Closed state (a); Open state (b).
Figure 1.
Device for cemented paste backfill (CPB) specimen production. Closed state (a); Open state (b).
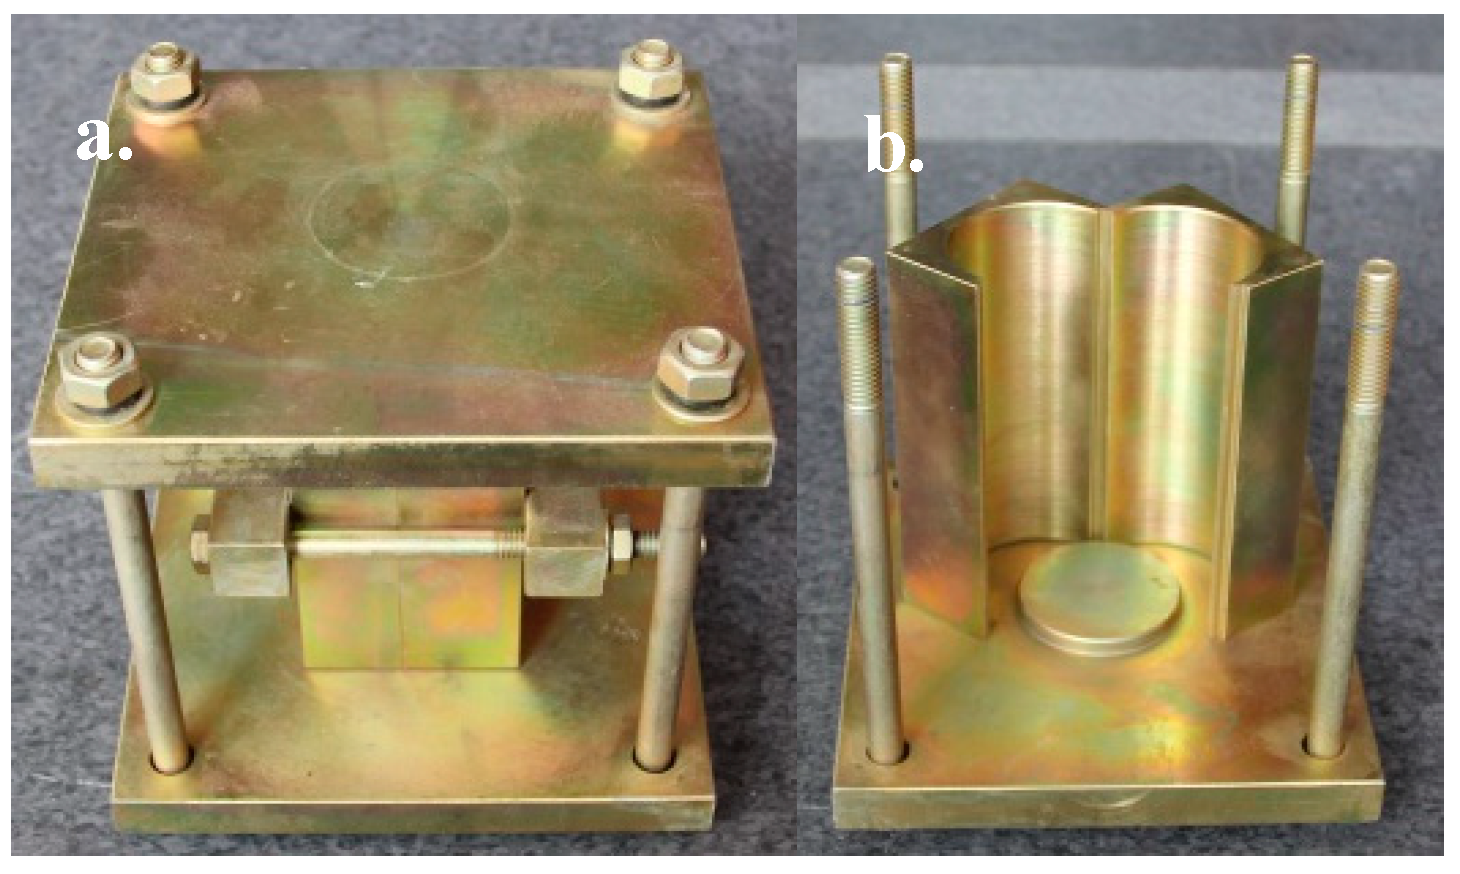
Figure 2.
Ultrasonic automatic cycle tester.

Figure 3.
MTS815 and AE21C experimental systems.

Figure 4.
The dispersion of CPB specimens based on ultrasonic pulse velocity (UPV).

Figure 5.
Stress–strain-AE curves of CPB specimens under different confining pressures. σ3 = 0 MPa (a); σ3 = 0.5 MPa (b); σ3 = 1 MPa (c); σ3 = 2 MPa (d).
Figure 5.
Stress–strain-AE curves of CPB specimens under different confining pressures. σ3 = 0 MPa (a); σ3 = 0.5 MPa (b); σ3 = 1 MPa (c); σ3 = 2 MPa (d).
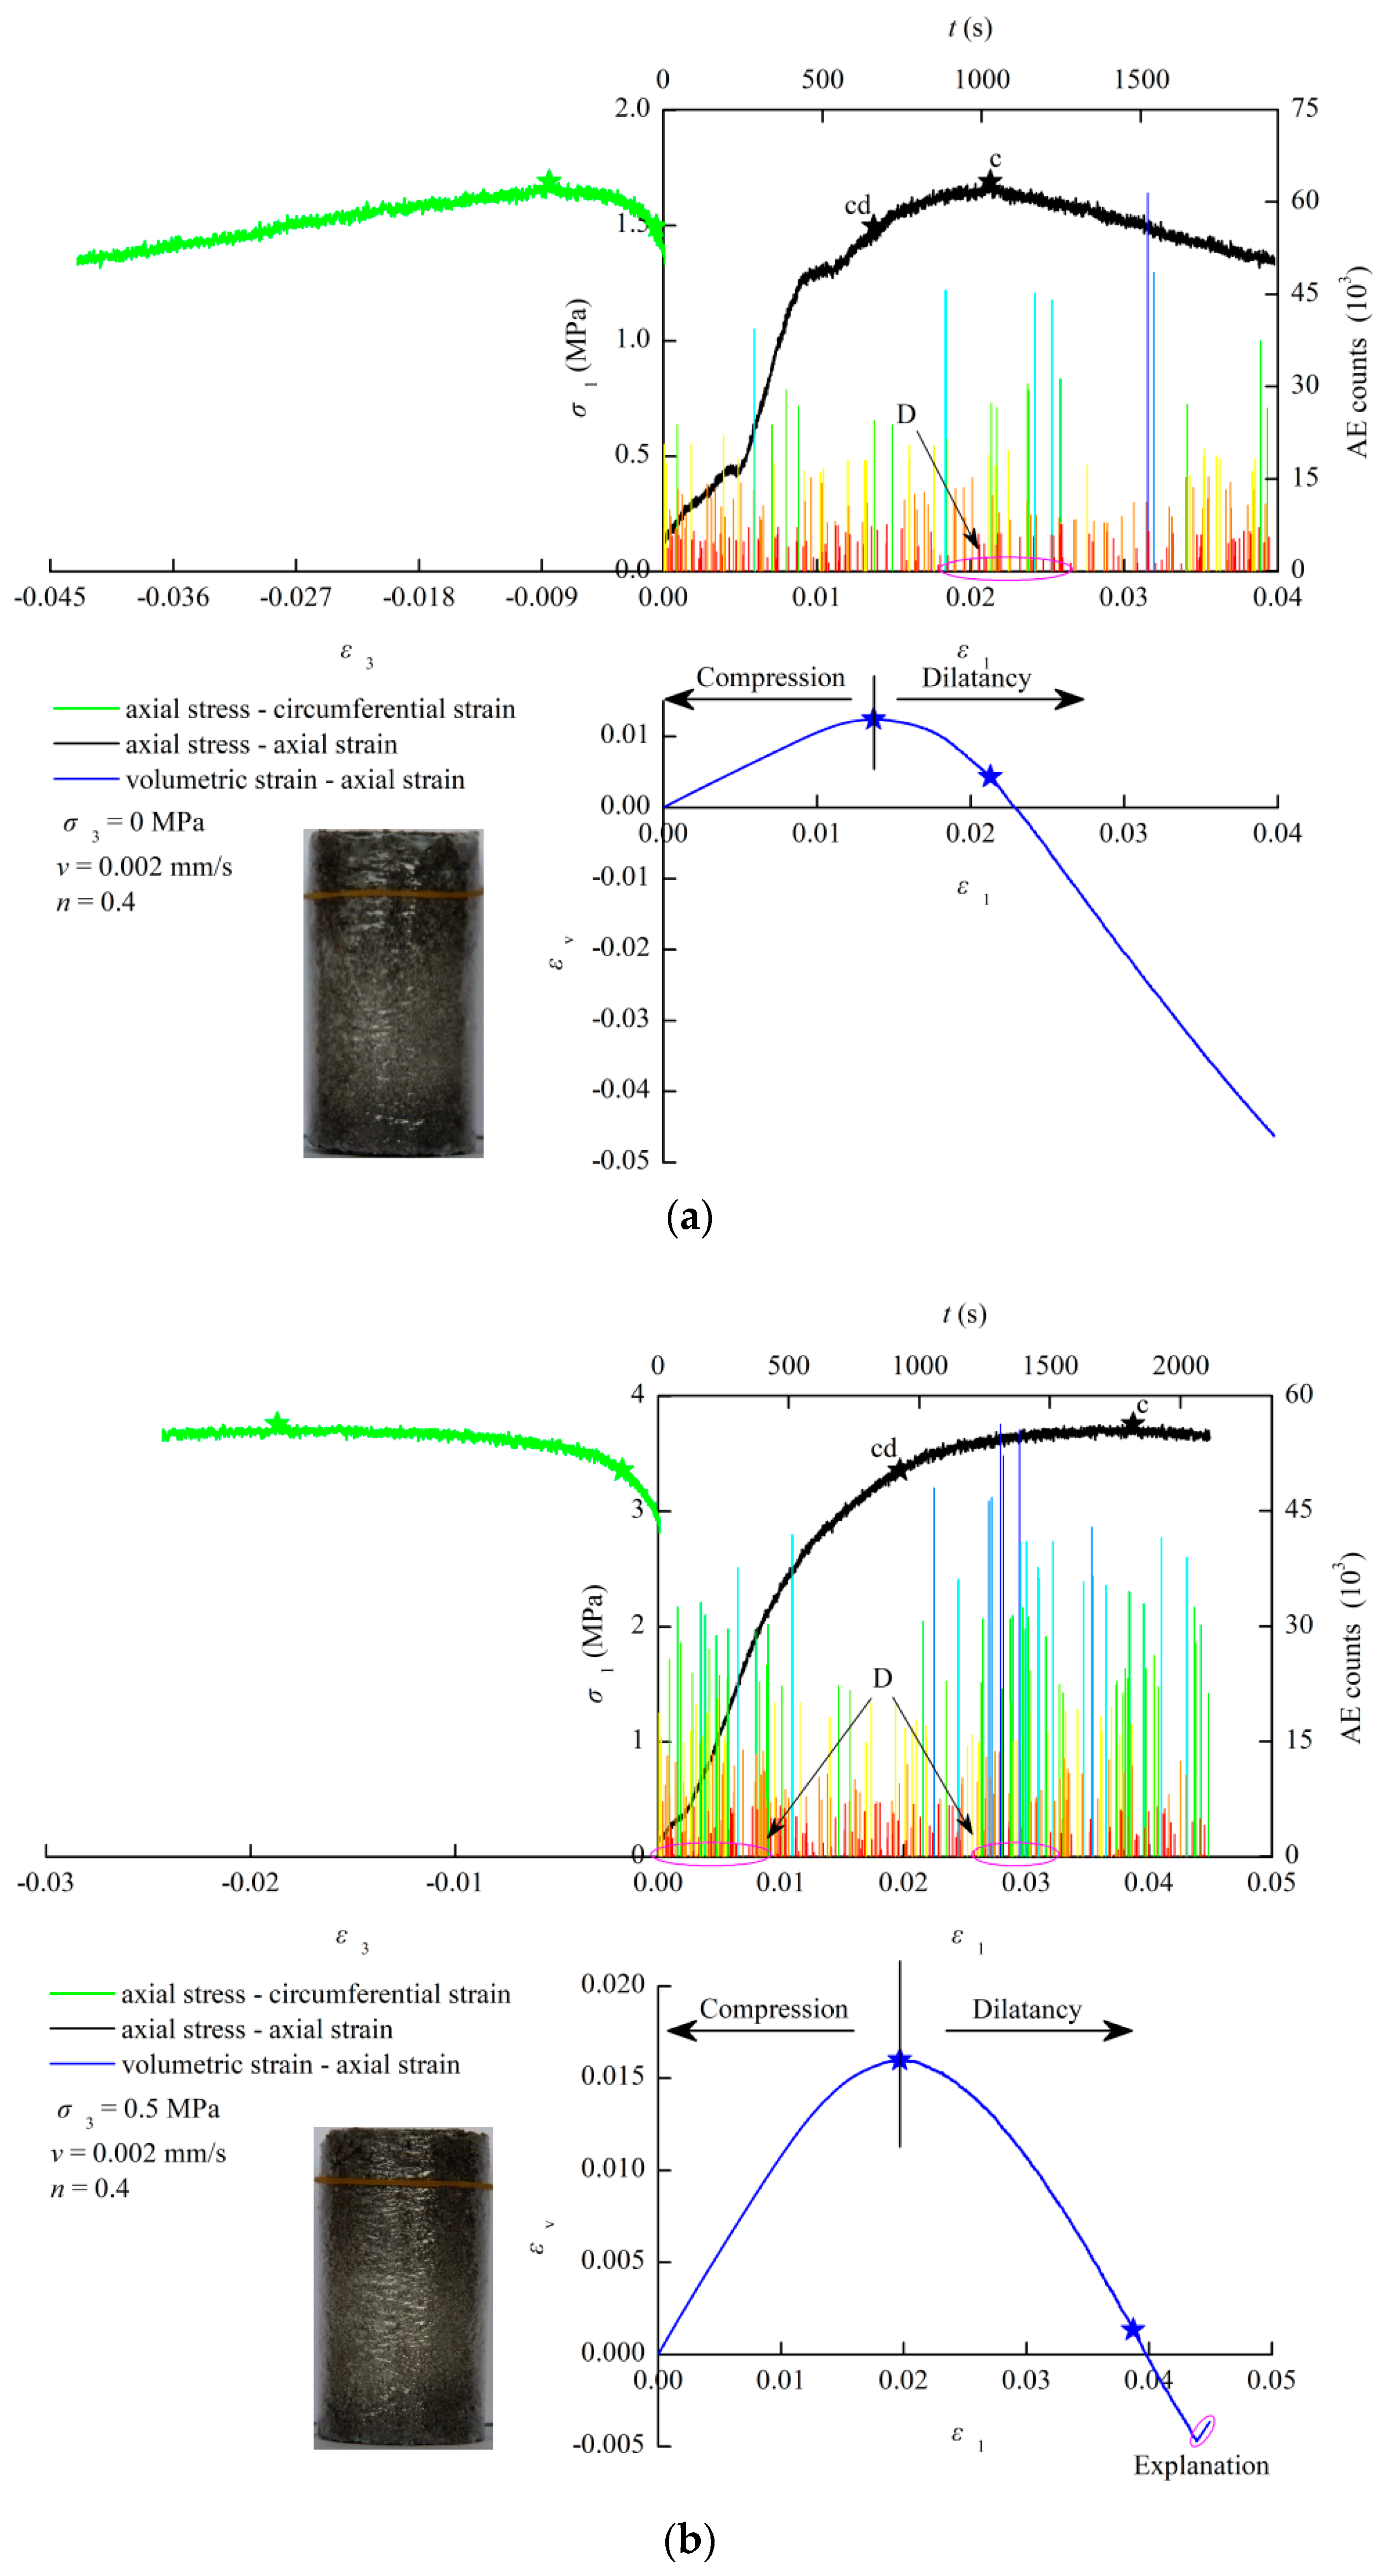

Figure 6.
Relationship between the deformation modulus and confining pressure under a Talbot index of 0.4.
Figure 6.
Relationship between the deformation modulus and confining pressure under a Talbot index of 0.4.

Figure 7.
Stress–strain-AE curves of CPB specimens with different Talbot indices of particles: n = 0.2 (a); n = 0.4 (b); n = 0.6 (c); n = 0.8 (d).
Figure 7.
Stress–strain-AE curves of CPB specimens with different Talbot indices of particles: n = 0.2 (a); n = 0.4 (b); n = 0.6 (c); n = 0.8 (d).
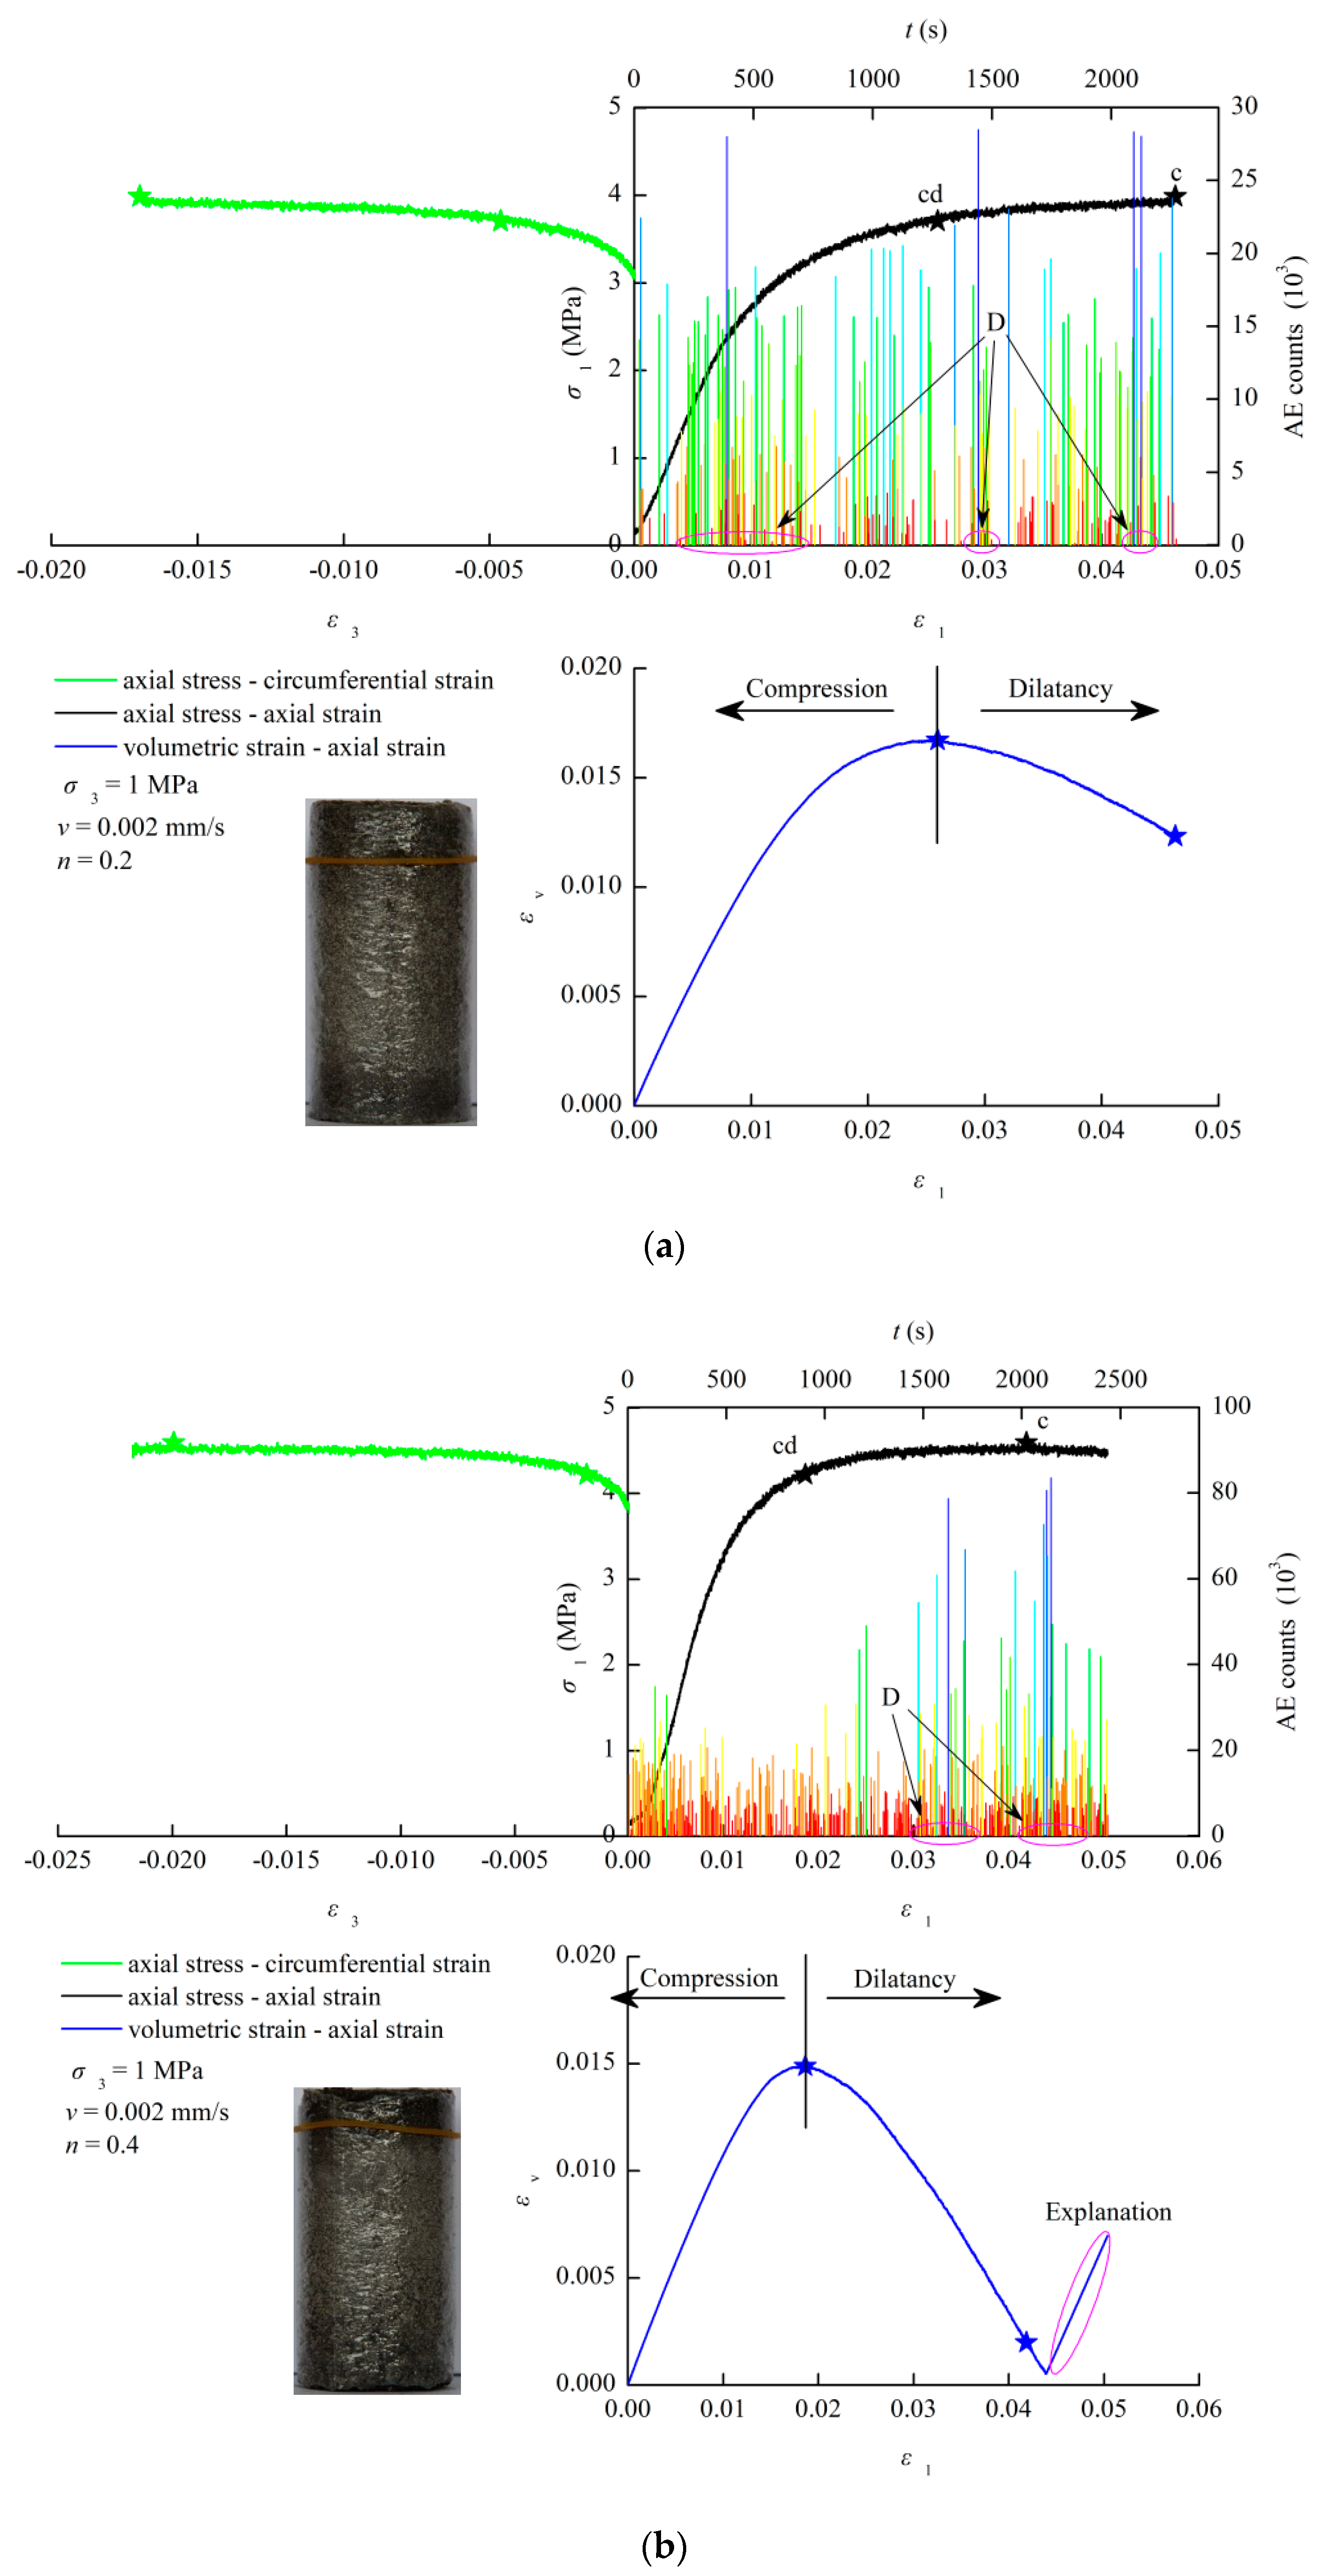
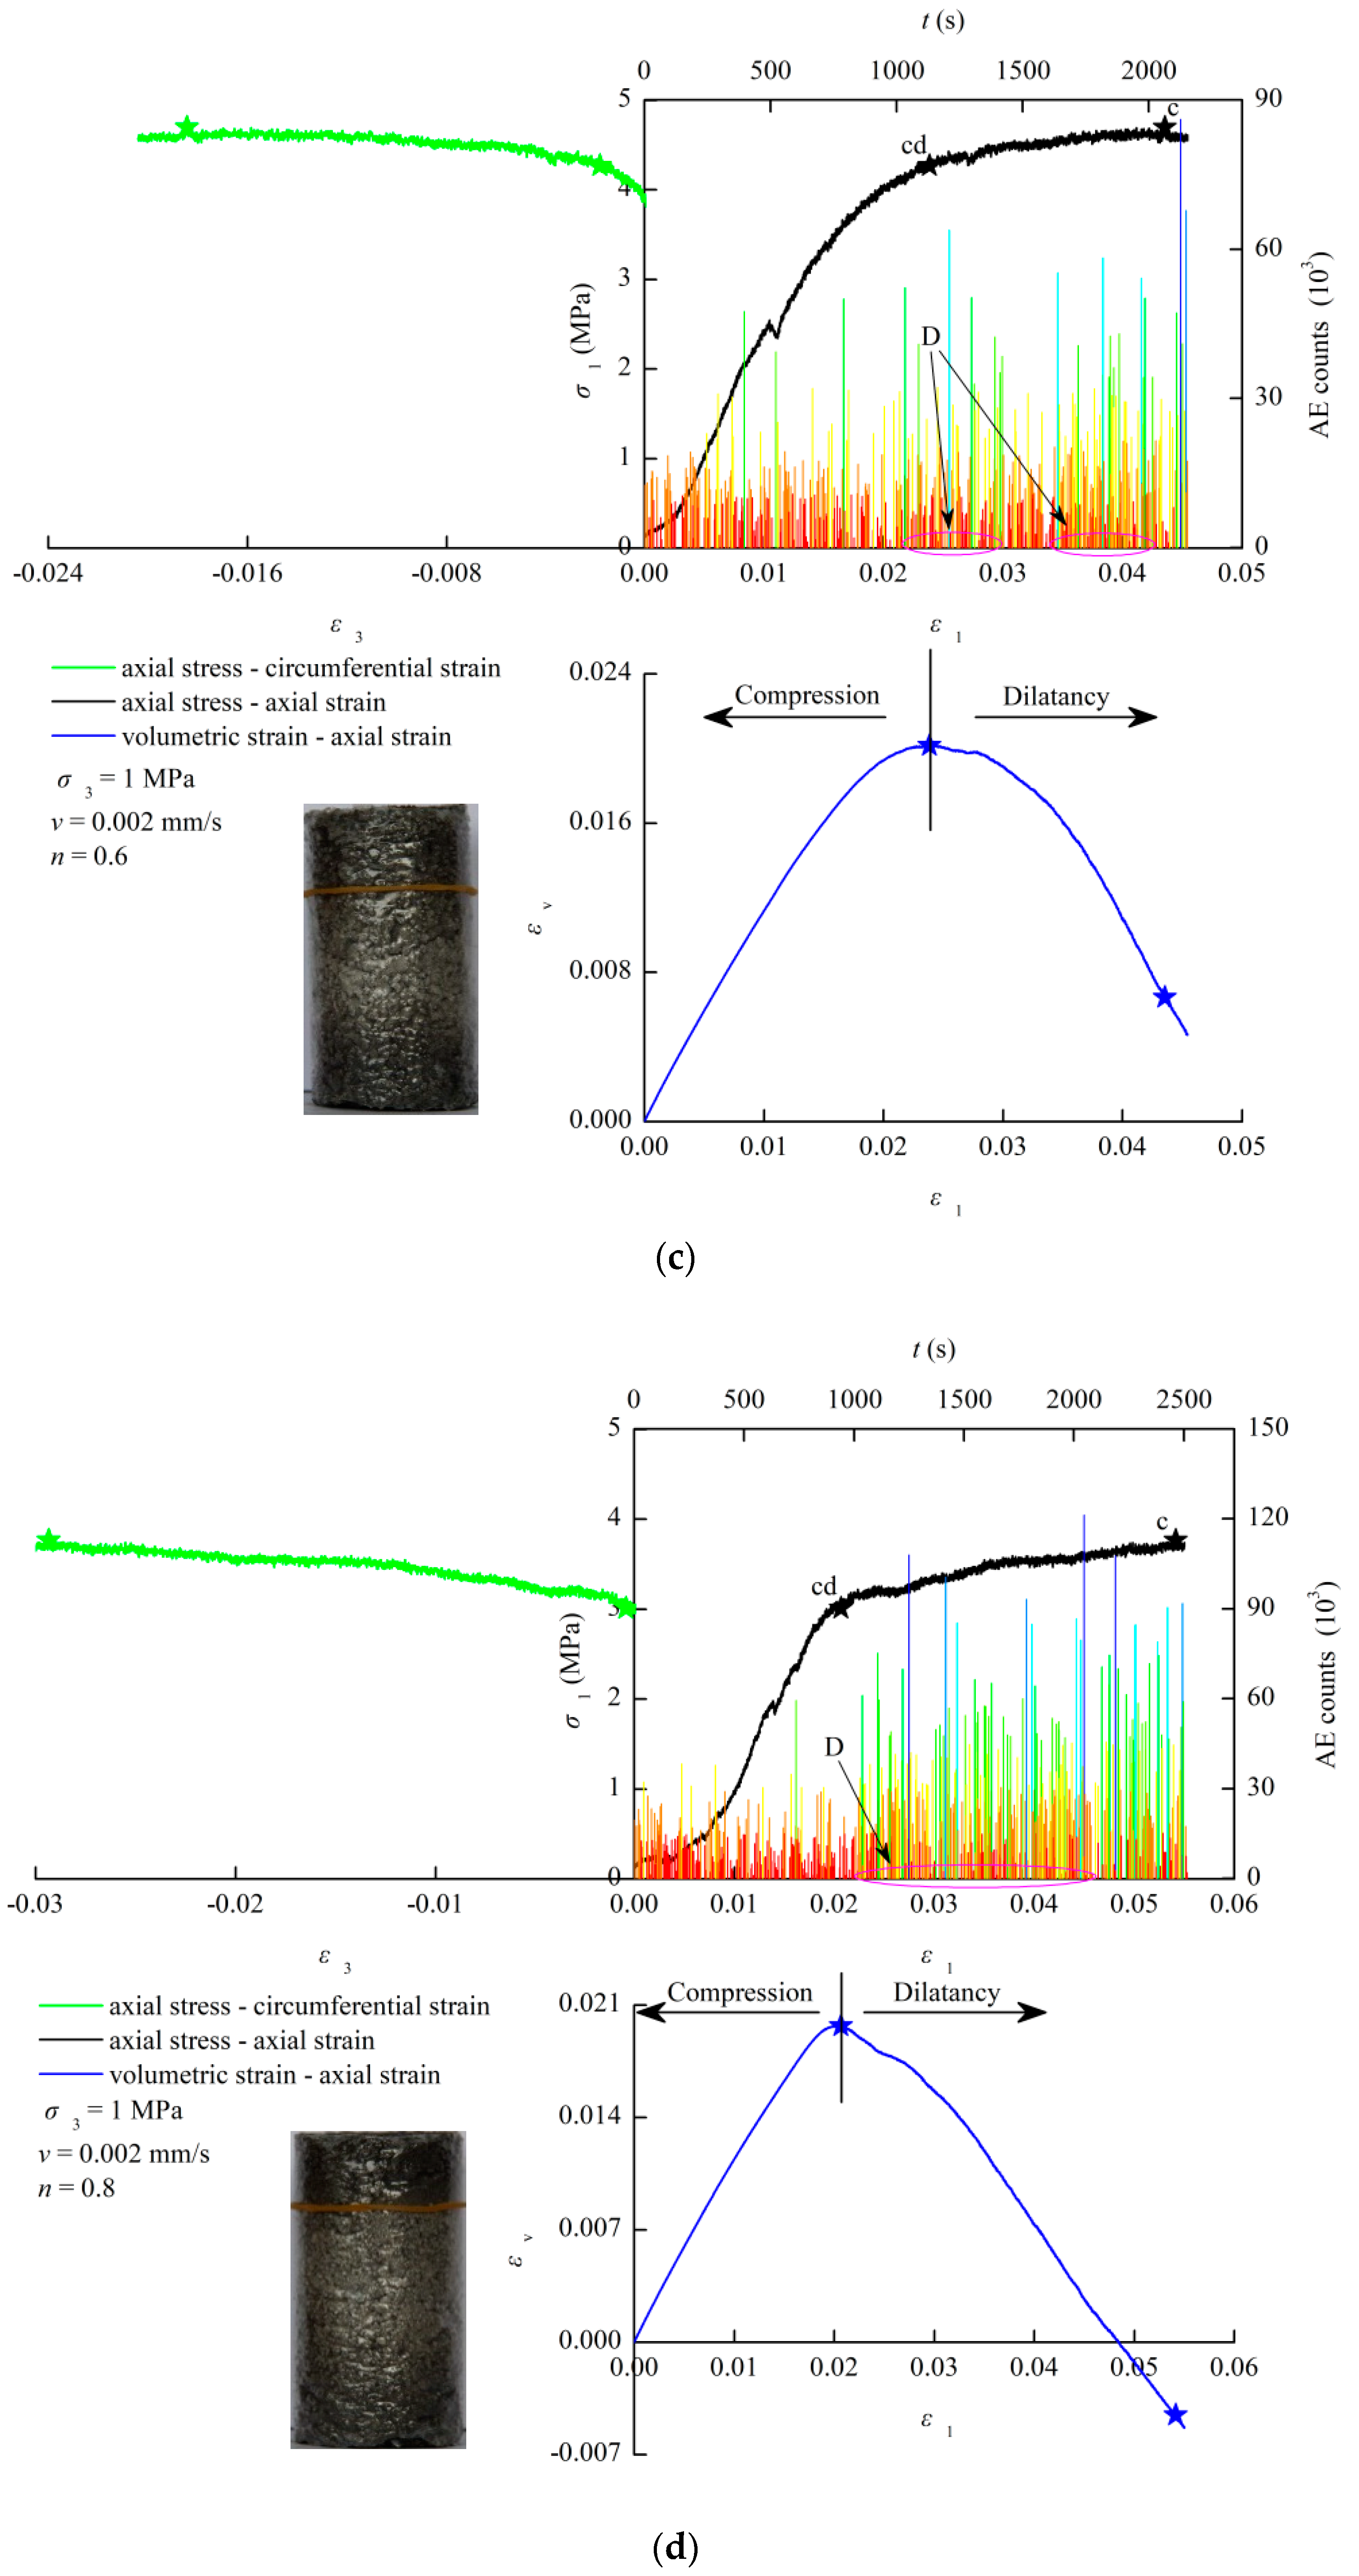
Figure 8.
Relationship between the deformation modulus and Talbot index under a confining pressure of 1 MPa.
Figure 8.
Relationship between the deformation modulus and Talbot index under a confining pressure of 1 MPa.
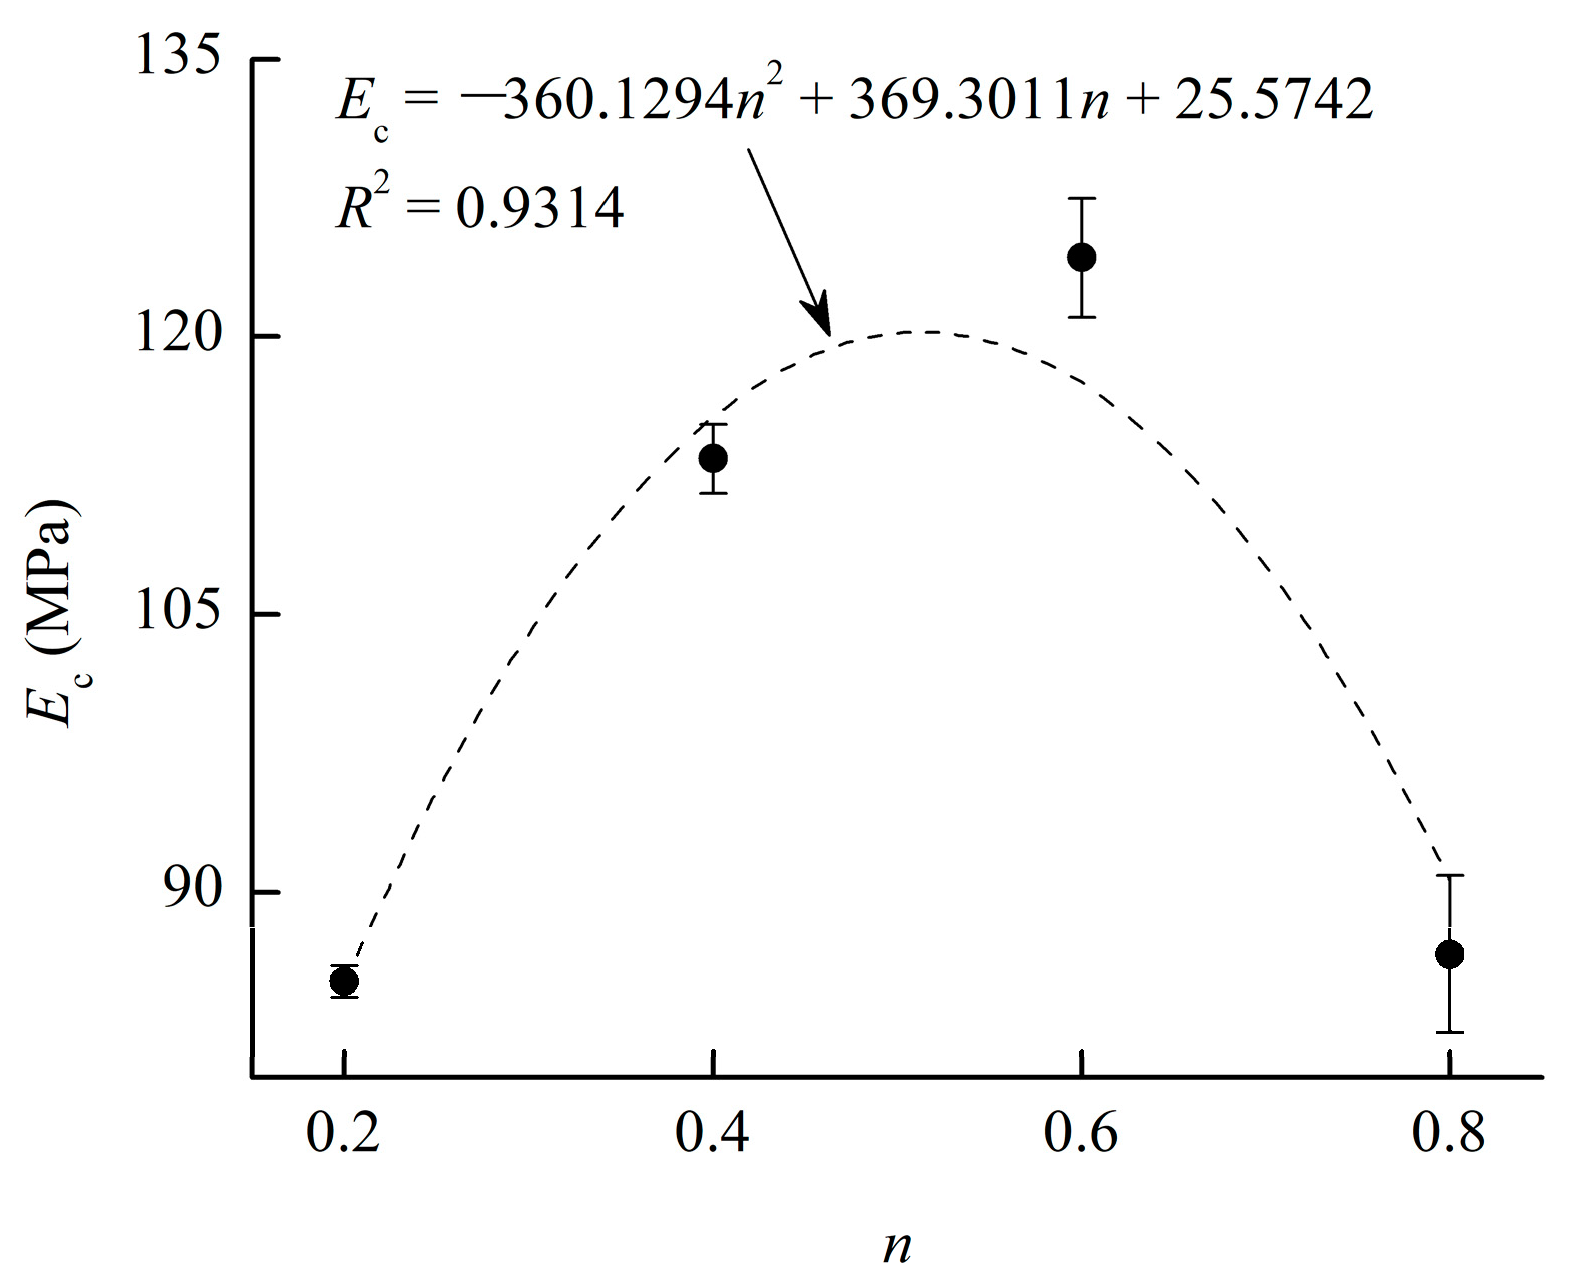
Figure 9.
Relationship between the peak strength and Talbot index of CPB specimens under different confining pressures. σ3 = 0 MPa (a); σ3 = 0.5 MPa (b); σ3 = 1 MPa (c); σ3 = 2 MPa (d).
Figure 9.
Relationship between the peak strength and Talbot index of CPB specimens under different confining pressures. σ3 = 0 MPa (a); σ3 = 0.5 MPa (b); σ3 = 1 MPa (c); σ3 = 2 MPa (d).
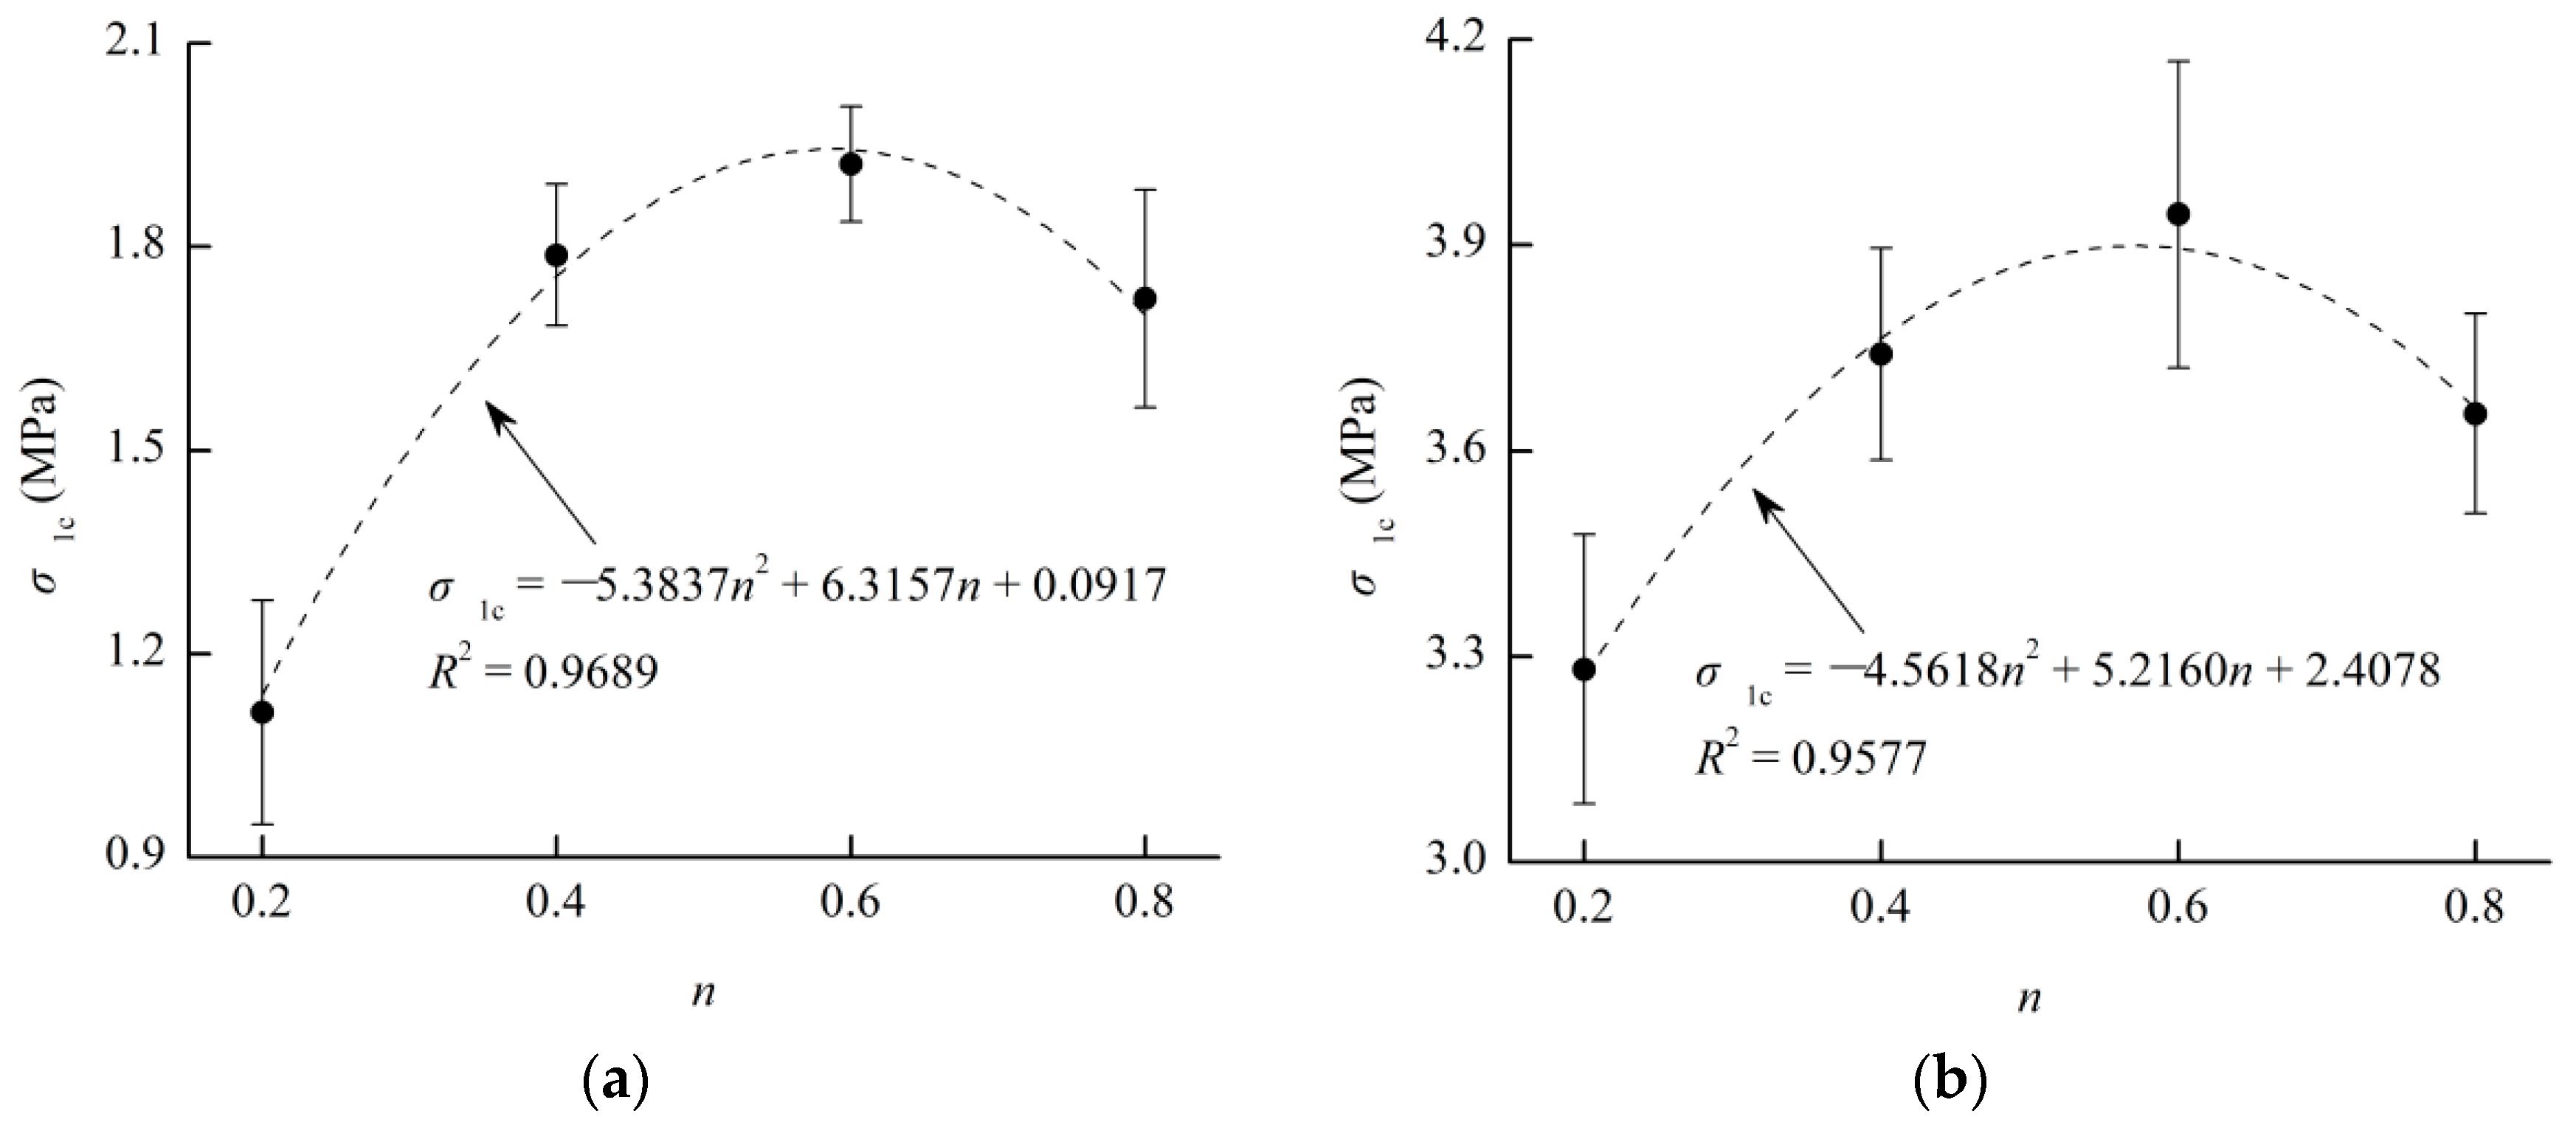

Figure 10.
Relationship between the peak strength and confining pressure of CPB specimens with different Talbot indexes. n = 0.2 (a); n = 0.4 (b); n = 0.6 (c); n = 0.8 (d).
Figure 10.
Relationship between the peak strength and confining pressure of CPB specimens with different Talbot indexes. n = 0.2 (a); n = 0.4 (b); n = 0.6 (c); n = 0.8 (d).

Figure 11.
Relationship between the fitting strength parameter and Talbot index of CPB specimens.
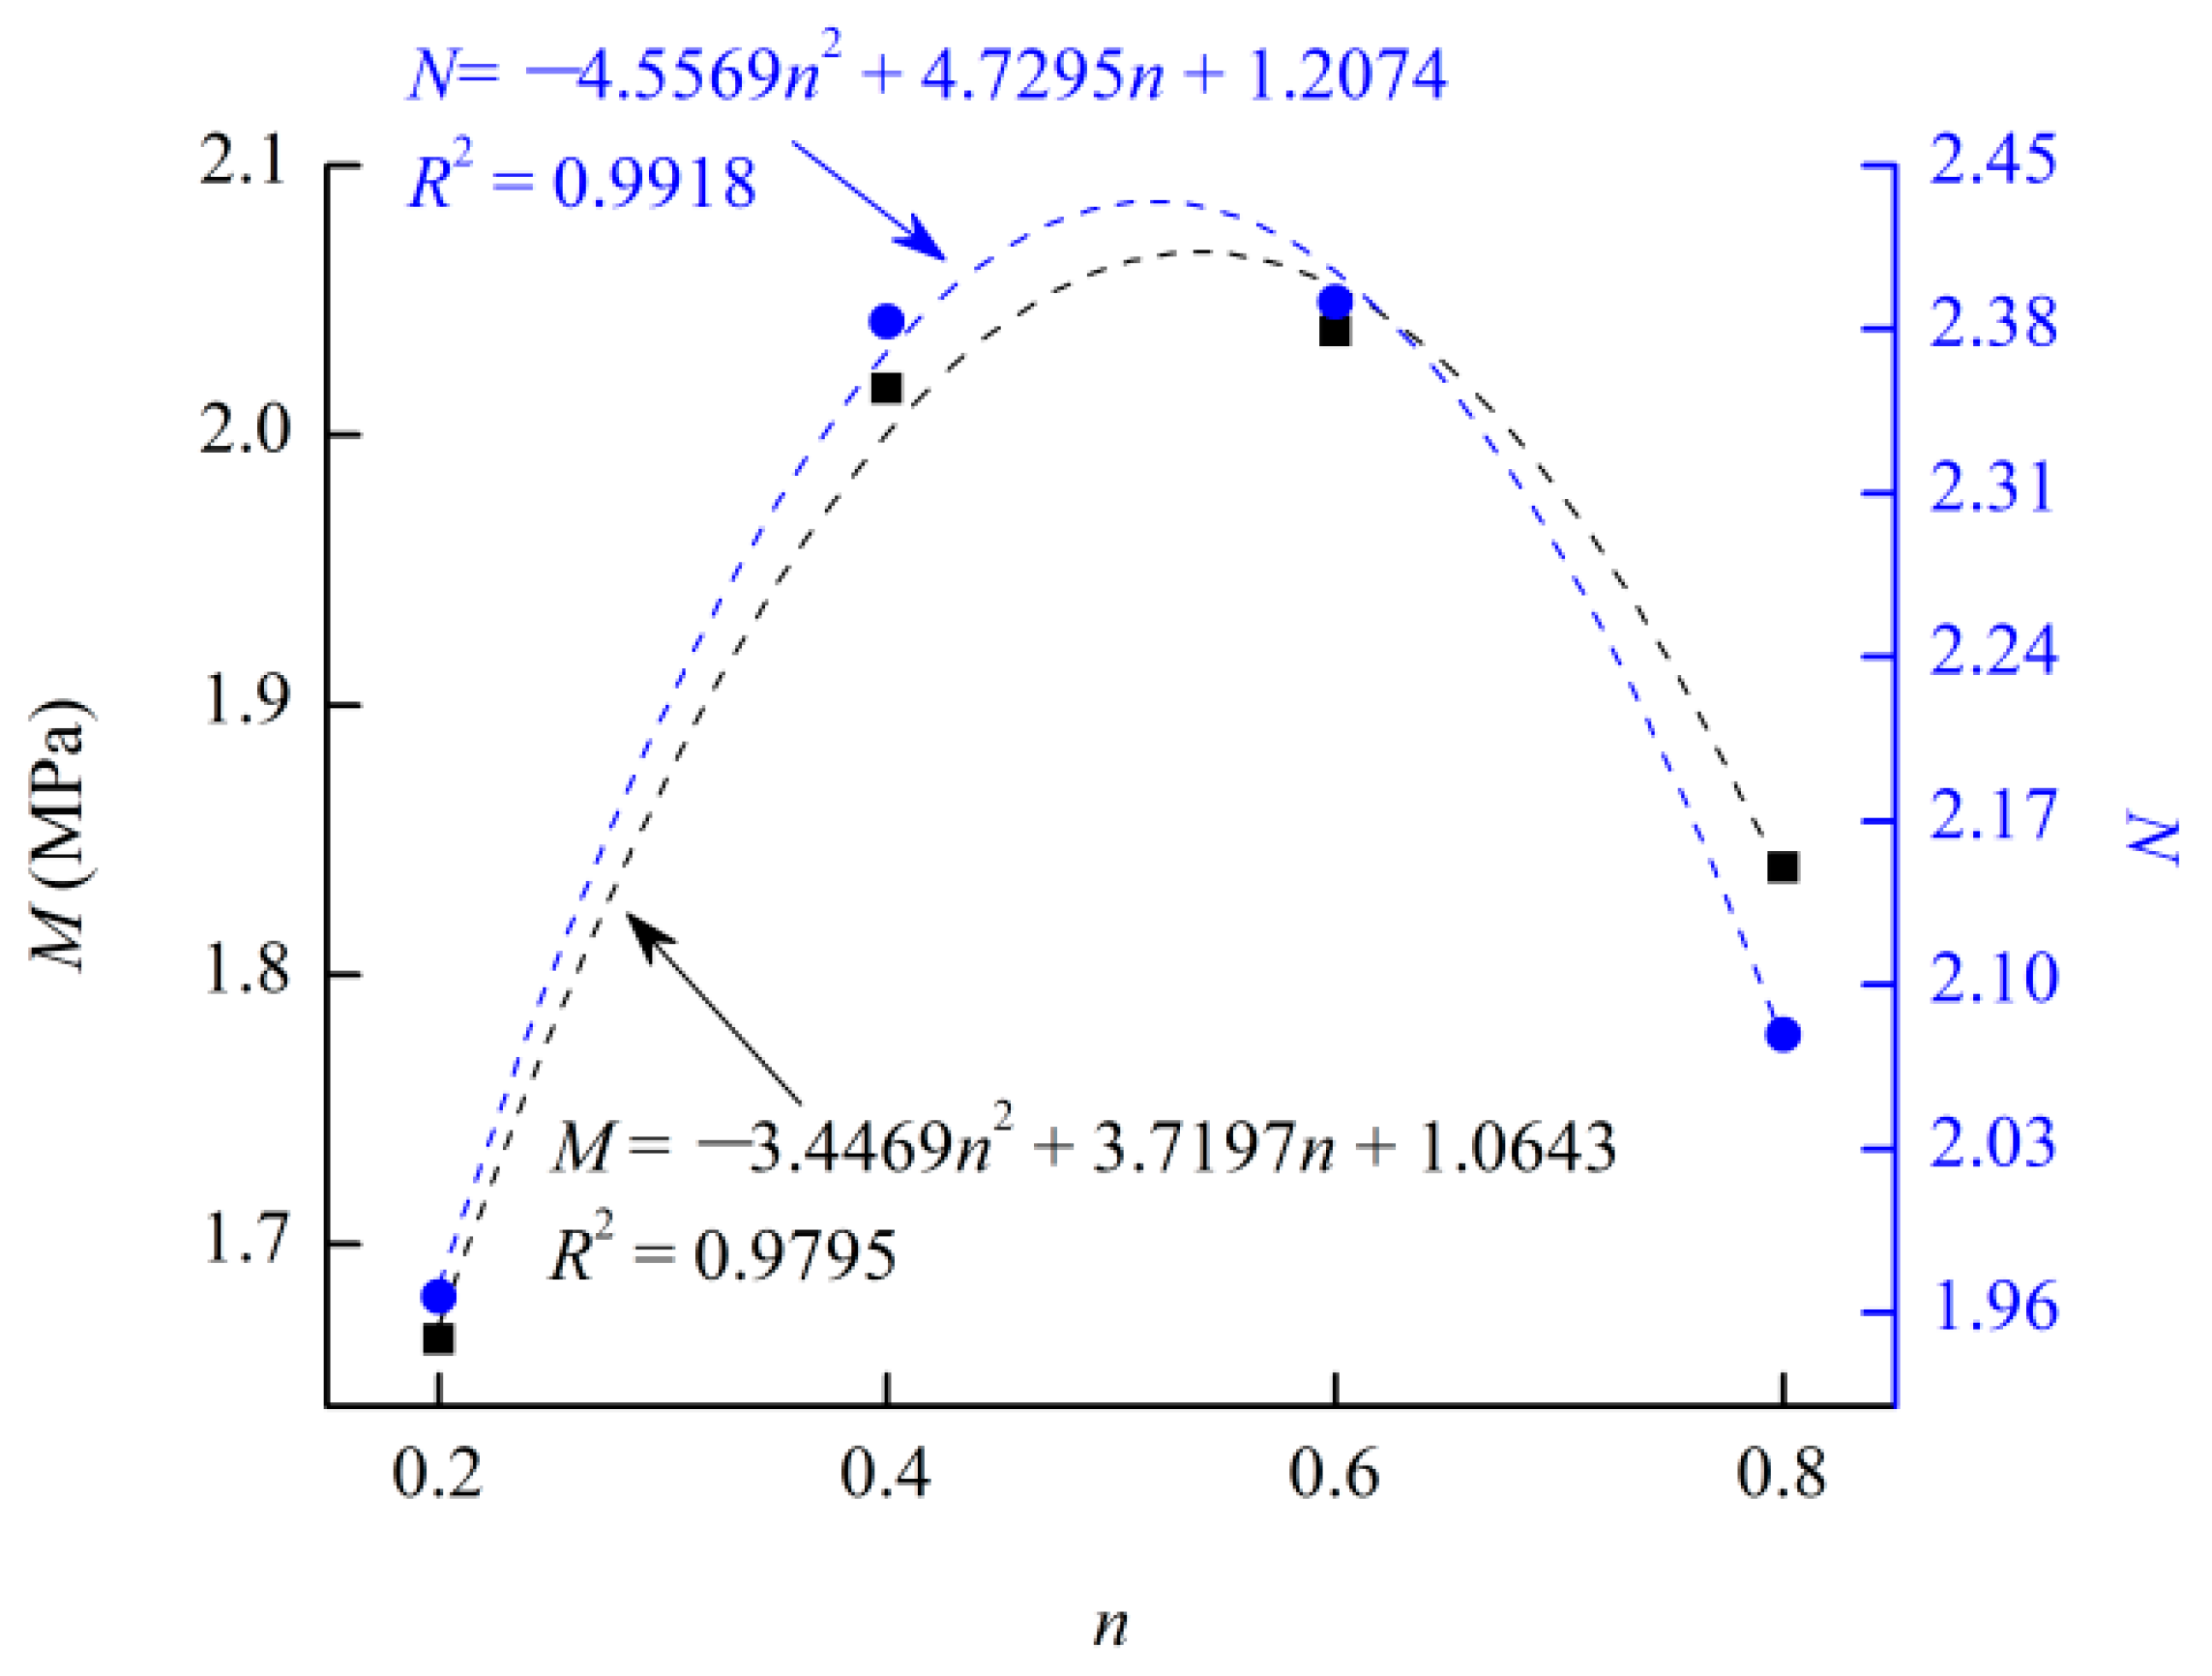
Figure 12.
Relationship between the strength parameter and Talbot index of CPB specimens.

Figure 13.
Relationship between the strength parameter and Talbot index of CPB specimens.


Table 1.
The chemical components of tailings.
| Varieties (%) | CaO | Al2O3 | SiO2 | MgO | K2O | Fe |
|---|---|---|---|---|---|---|
| Tailings | 3.91 | 13.21 | 67.75 | 2.87 | 0.02 | 3.69 |
Table 2.
The chemical components of composite Portland cement 32.5R.
| Varieties (%) | CaO | Al2O3 | SiO2 | Fe2O3 | MgO | SO3 | Na2O | K2O | TiO2 |
|---|---|---|---|---|---|---|---|---|---|
| P.C. 32.5R | 62.19 | 4.67 | 21.56 | 3.69 | 2.87 | 1.91 | 0.21 | 0.68 | 0.16 |
Table 3.
Distribution of particles under different Talbot indices.
| n | Mass (g) of Particles in Different Sizes (mm) | Mass Percent (%) of Particles in Different Sizes (mm) | ||||||||||||
|---|---|---|---|---|---|---|---|---|---|---|---|---|---|---|
| 0–0.5 | 0.5–1 | 1–1.5 | 1.5–2.5 | 2.5–5 | 5.0–8.0 | 8.0–10.0 | 0–0.5 | 0.5–1 | 1–1.5 | 1.5–2.5 | 2.5–5 | 5.0–8.0 | 8.0–10.0 | |
| 0.2 | 164.78 | 24.51 | 15.99 | 22.08 | 33.81 | 25.74 | 13.09 | 54.93 | 8.17 | 5.33 | 7.36 | 11.27 | 8.58 | 4.36 |
| 0.4 | 90.51 | 28.92 | 21.03 | 31.84 | 55.05 | 47.03 | 25.62 | 30.17 | 9.64 | 7.01 | 10.61 | 18.35 | 15.68 | 8.54 |
| 0.6 | 49.72 | 25.64 | 20.76 | 34.47 | 67.34 | 64.48 | 37.59 | 16.57 | 8.55 | 6.92 | 11.49 | 22.45 | 21.49 | 12.53 |
| 0.8 | 27.31 | 20.23 | 18.22 | 33.20 | 73.34 | 78.65 | 49.05 | 9.10 | 6.74 | 6.07 | 11.07 | 24.45 | 26.22 | 16.35 |
Table 4.
Experimental program for prepared specimens.
| Talbot Index | Type of Cementing Material | Content of Cementing Material m/g | Content of Distilled Water v/mL |
|---|---|---|---|
| 0.2 | Cement | 30 | 22.5 |
| 0.4 | Cement | 30 | 22.5 |
| 0.6 | Cement | 30 | 22.5 |
| 0.8 | Cement | 30 | 22.5 |
Table 5.
Relationships between the peak strength and Talbot index of CPB specimens under different confining pressures.
Table 5.
Relationships between the peak strength and Talbot index of CPB specimens under different confining pressures.
| σ3 (MPa) | Relationship | Correlation Coefficient |
|---|---|---|
| 0 | σ1c = −5.3837n2 + 6.3157n + 0.0917 | 0.9689 |
| 0.5 | σ1c = −4.5618n2 + 5.2160n + 2.4078 | 0.9577 |
| 1 | σ1c = −6.6370n2 + 7.2179n + 2.7966 | 0.9160 |
| 2 | σ1c = −10.5912n2 + 11.4653n + 3.1738 | 0.9719 |
Table 6.
Relationships between the peak strength and Talbot index of CPB specimens under different confining pressures.
Table 6.
Relationships between the peak strength and Talbot index of CPB specimens under different confining pressures.
| n | Relationship | Correlation Coefficient |
|---|---|---|
| 0.2 | σ1c = 1.9897σ3 + 1.6648 | 0.9043 |
| 0.4 | σ1c = 2.3832σ3 + 2.0175 | 0.8981 |
| 0.6 | σ1c = 2.3916σ3 + 2.0385 | 0.9461 |
| 0.8 | σ1c = 2.0791σ3 + 1.7497 | 0.9160 |
Table 7.
Relationship between the strength parameter and Talbot index.
| Parameter | Relationship | Correlation Coefficient |
|---|---|---|
| M | M = −3.4469n2 + 3.7197n + 1.0643 | 0.9795 |
| N | N = −4.5569n2 + 4.7295n + 1.2074 | 0.9918 |
| c | c = −0.7229n2 + 0.7507n + 0.4689 | 0.9999 |
| φ | φ = −53.1829n2 + 55.0045n + 10.5035 | 0.9934 |
© 2018 by the authors. Licensee MDPI, Basel, Switzerland. This article is an open access article distributed under the terms and conditions of the Creative Commons Attribution (CC BY) license (http://creativecommons.org/licenses/by/4.0/).
Share and Cite
MDPI and ACS Style
Wu, J.; Feng, M.; Chen, Z.; Mao, X.; Han, G.; Wang, Y. Particle Size Distribution Effects on the Strength Characteristic of Cemented Paste Backfill. Minerals 2018, 8, 322. https://doi.org/10.3390/min8080322
AMA Style
Wu J, Feng M, Chen Z, Mao X, Han G, Wang Y. Particle Size Distribution Effects on the Strength Characteristic of Cemented Paste Backfill. Minerals. 2018; 8(8):322. https://doi.org/10.3390/min8080322
Chicago/Turabian StyleWu, Jiangyu, Meimei Feng, Zhanqing Chen, Xianbiao Mao, Guansheng Han, and Yiming Wang. 2018. "Particle Size Distribution Effects on the Strength Characteristic of Cemented Paste Backfill" Minerals 8, no. 8: 322. https://doi.org/10.3390/min8080322
Note that from the first issue of 2016, this journal uses article numbers instead of page numbers. See further details here.