Article

Fault Zone Evolution and Development of a Structural and Hydrological Barrier: The Quartz Breccia in the Kiggavik Area (Nunavut, Canada) and Its Control on Uranium Mineralization

1
Sorbonne Université, CNRS-INSU, Institut des Sciences de la Terre de Paris, ISTeP UMR 7193, F-75005 Paris, France
2
Université de Lorraine, CNRS, CREGU, GeoRessources lab, 54506 Vandoeuvre-lès-Nancy, France
3
UMR Geops, Université Paris Sud, 91405 Orsay, France
4
Departament de Mineralogia, Universitat de Barcelona (UB), Petrologia i Geologia Aplicada, Facultat de Ciències de la Terra, 08028 Barcelona, Spain
5
Orano Canada Inc., 817 45th Street, West Saskatoon, SK S7L 5X2, Canada
*
Author to whom correspondence should be addressed.
Minerals 2018, 8(8), 319; https://doi.org/10.3390/min8080319
Submission received: 25 May 2018 / Revised: 20 July 2018 / Accepted: 24 July 2018 / Published: 27 July 2018
(This article belongs to the Special Issue Structural Control of Mineral Deposits: Theory and Reality)

Abstract

:
In the Kiggavik area (Nunavut, Canada), major fault zones along, or close to, where uranium deposits are found are often associated with occurrence of thick quartz breccia (QB) bodies. These bodies formed in an early stage (~1750 Ma) of the long-lasting tectonic history of the Archean basement, and of the Proterozoic Thelon basin. The main characteristics of the QB are addressed in this study; through field work, macro and microscopic observations, cathodoluminescence microscopy, trace elements, and oxygen isotopic signatures of the quartz forming the QB. Faults formed earlier during syn- to post-orogenic rifting (1850–1750 Ma) were subsequently reactivated, and underwent cycles of cataclasis, pervasive silicification, hydraulic brecciation, and quartz recrystallization. This was synchronous with the circulation of meteoric fluids mixing with Si-rich magmatic-derived fluids at depth, and were coeval with the emplacement of the Kivalliq igneous suite at 1750 Ma. These processes led to the emplacement of up to 30 m thick QB, which behaved as a mechanically strong, transverse hydraulic barrier that localized later fracturing, and compartmentalized/channelized vertical flow of uranium-bearing fluids after the deposition of the Thelon Basin (post 1750 Ma). The development and locations of QB control the location of uranium mineralization in the Kiggavik area.

1. Introduction

Fault zones are often associated with enhanced, focused, repeated fluid circulations in the earth’s crust [1,2,3,4,5,6,7]. These fluids may have different origins: Meteoric, magmatic, metamorphic or basinal, and possibly transport metals to a favorable area of deposition [8,9]; that will ultimately allow for the formation of potential economic ore deposits. In many conceptual models of the formation of ore deposits, fault zones are important structural features acting as pathways [2,10] and/or as traps for fluids, and related metals [11]. In the uppermost crust, deformation is dominantly brittle and breccias are commonly observed in fault zones [12,13,14,15]. Among the different families of breccias, hydrothermal breccias are one sub-class that would develop early, in response to fracture propagation processes [13], through interaction between brecciated rocks and hydrothermal solutions. Hydrothermal breccias can be of various types depending on several parameters, such as pressure, temperature, depth of emplacement, and elements in the fluids [14]. Among them, quartz-cemented breccias can have an economic interest, being possibly associated with ore deposits such as epithermal (Au-Ag-Cu-Pb-Zn-Sb, [16,17]), orogenic gold (Au, [18]), and porphyric (Cu-Mo-Au-Ag, [19,20]). They display thickness from meter to several meters, thicker hydrothermal breccias being relatively rarely described. Quartz breccias in fault zones form progressively during several cycles of fluid pressure growth, seismogenic fault slip and quartz precipitation [21,22]. Unaltered, quartz-rich bodies have a lowered porosity and thus have an impact on later fluid circulation within the fault zone. Such silicification would be comparable to fluid-flow being constrained by horizontal barriers, such as sedimentary layers indurated through diagenesis (aquitards, [23,24]), or impermeable (clay-rich) layers in roll-front uranium deposits [25]. In addition, the likely hardening of the fault rocks in response to multiple cycles of quartz brecciation and healing may cause a significant rheological contrast between the “strong” fault zone and the expectedly “weaker” hosting terranes, possibly controlling localization of subsequent deformation.
In this contribution, we focus on one structural feature encountered in many fault zones within the Uranium (U)-rich district of the Kiggavik area (Nunavut, Canada): The so-called hydrothermal Quartz Breccia (QB). The importance of this breccia, only briefly described by previous authors [26,27,28,29,30] was recently highlighted by Grare et al. [31] who documented the control exerted by this breccia on later fracturing events, hydrothermal alterations and uranium mineralization at the Contact uranium prospect. However, despite observations in several locations of the Kiggavik area and its seemingly strong control on the current distribution of the uranium mineralization, the genetic model of the QB remains poorly characterized and explained to date. Grare et al. [31] showed that the QB emplaced along faults of inferred Archean age, and that this emplacement was a key event within a long-lasting (~1000 Ma) complex brittle tectonic history that led to uranium mineralization within or in the vicinity of the quartz breccia (Figure 1C). In order to better constrain the nature, emplacement, significance and role of the QB, we carried out a structural analysis combined with vein cement petrography using optical and cathodoluminescence observations, trace elements, and oxygen stable isotope analysis of quartz. Our study addresses the structural, mineralogical and geochemical characteristics of the QB. Combined with the reconstructed geochemical signature of the fluids, a model of formation of the QB is proposed and its role in controlling uranium mineralization in the Kiggavik area is highlighted.

2. Geological Setting

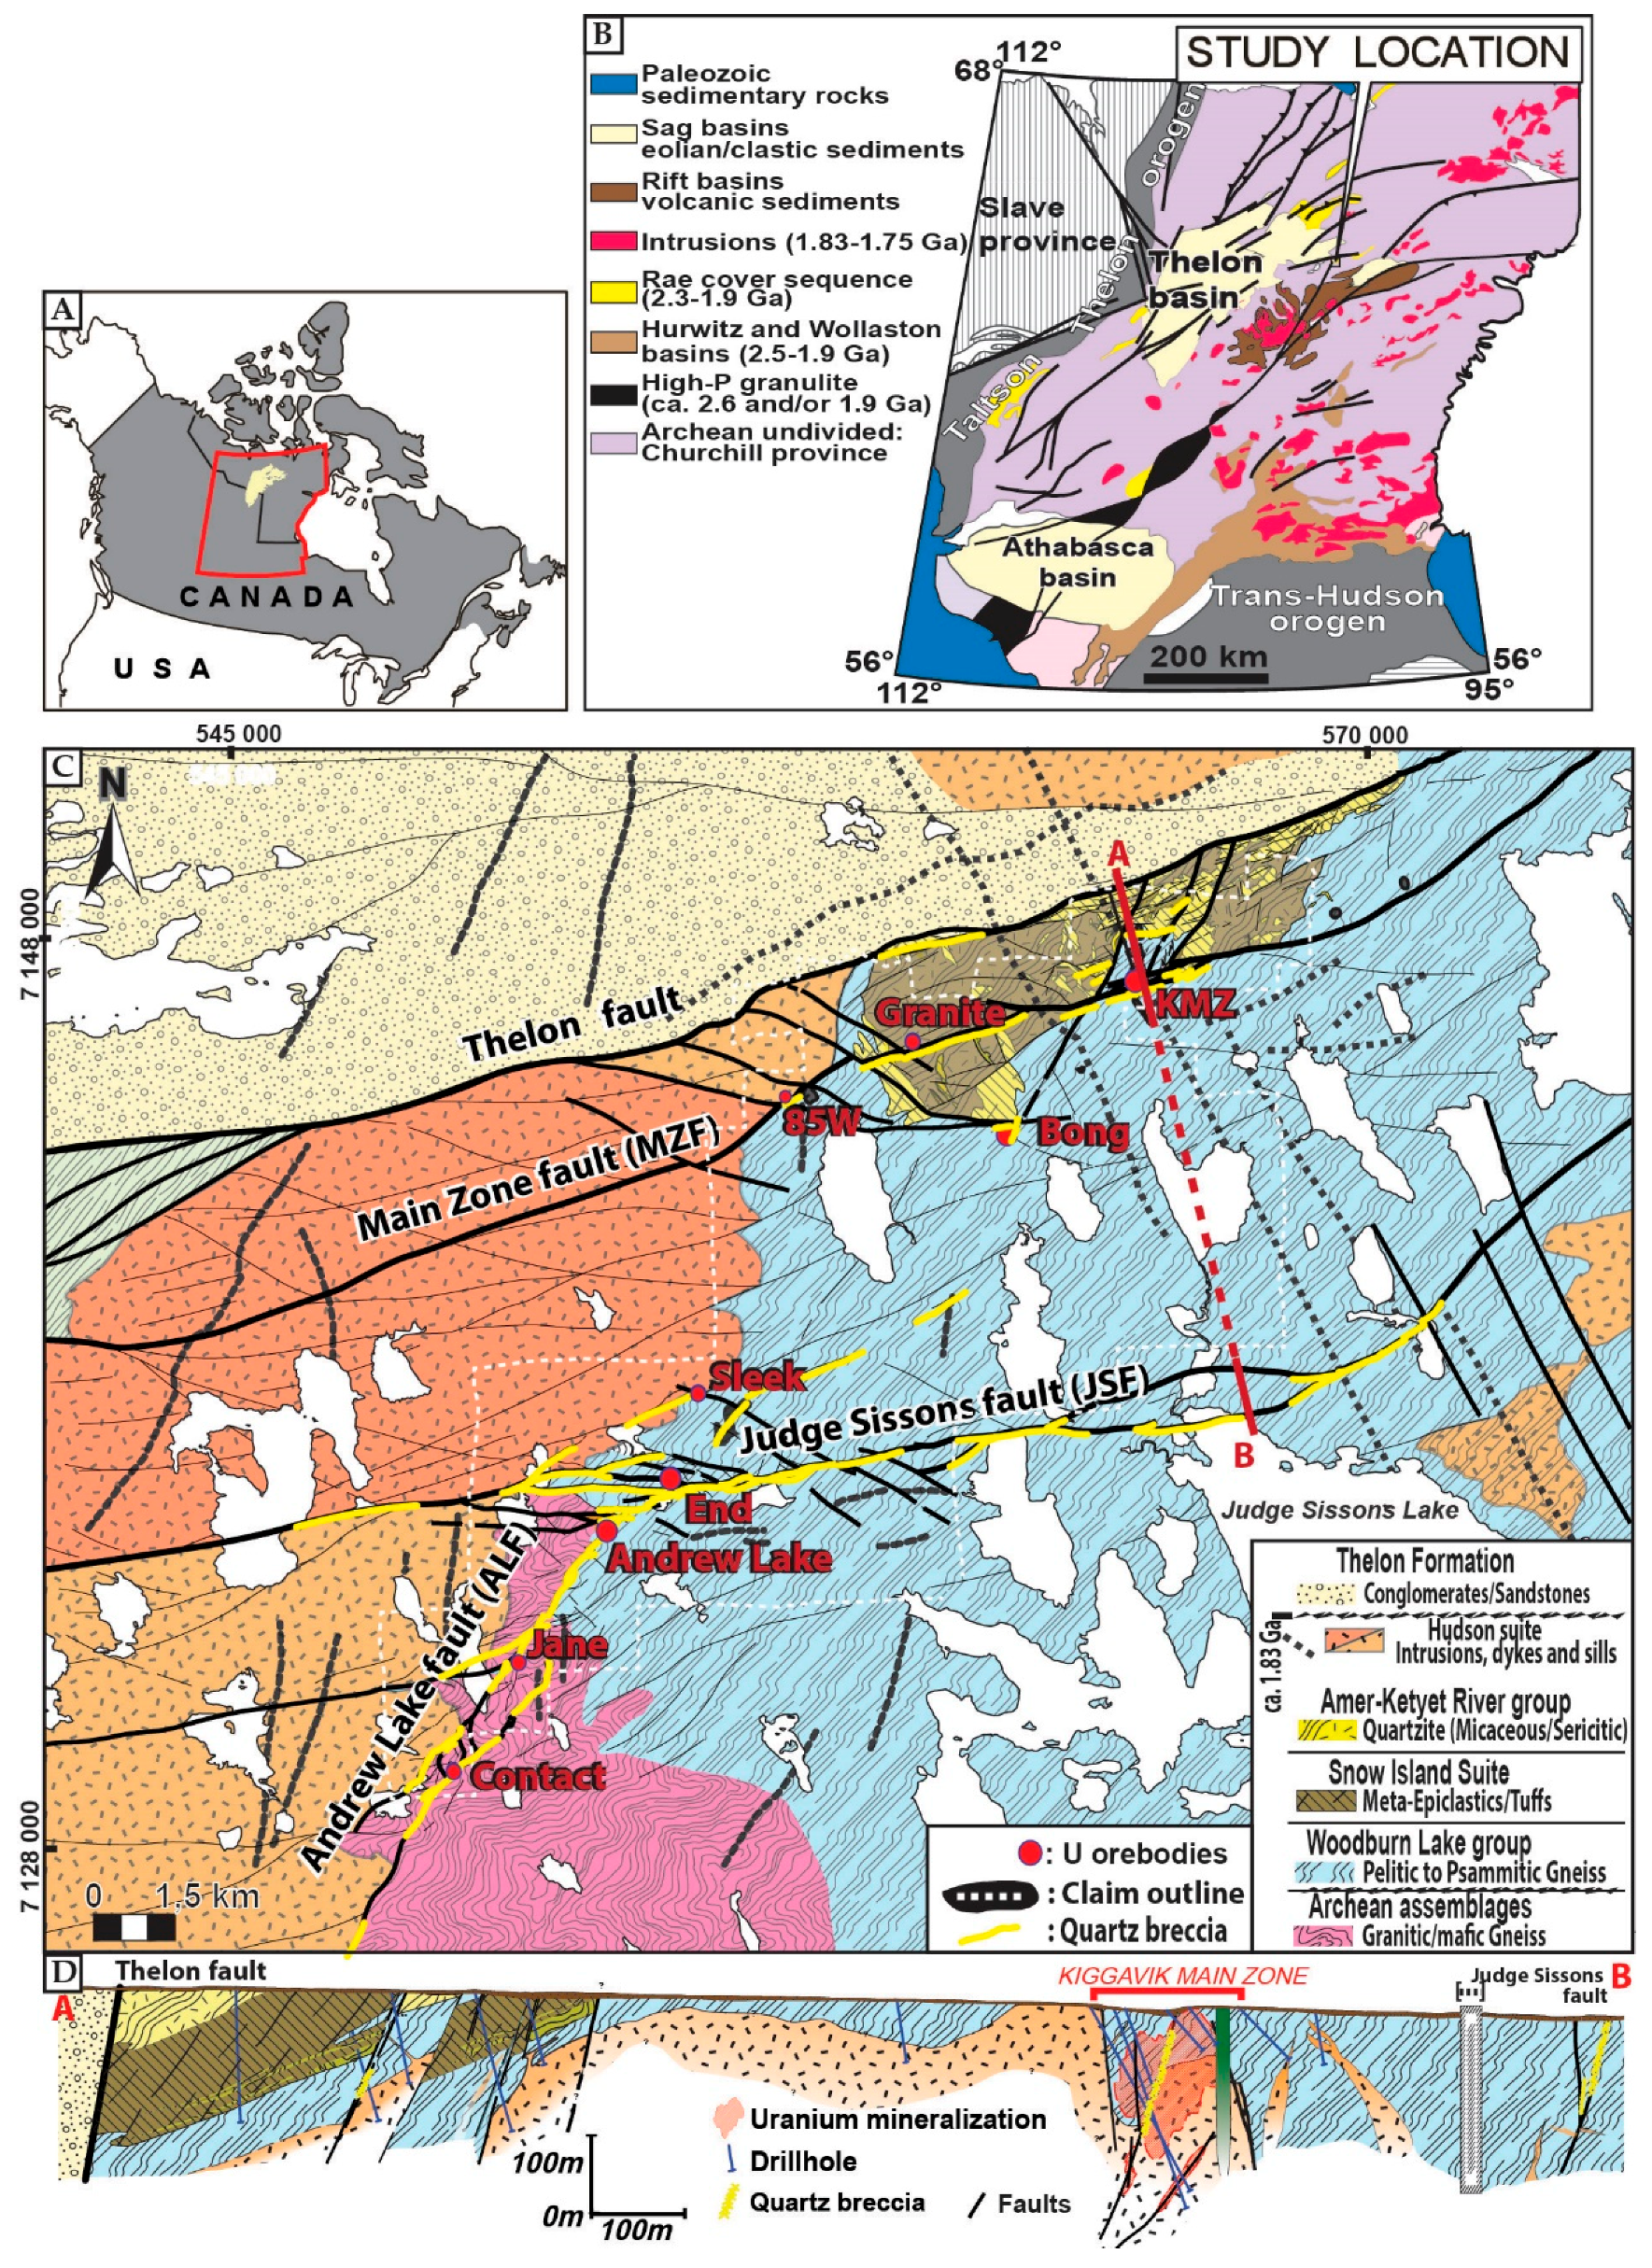
2.1. Regional Geological Setting

The Kiggavik area is located on the eastern border of the Proterozoic intracratonic Thelon Basin (ca. 1670–1540 Ma, [32,33]) in Nunavut, Canada, within the Churchill province. The Churchill province is known to host the Athabasca Basin (1740–1540 Ma, [34]); another Proterozoic basin, which itself hold the world-class Cigar Lake and McArthur River uranium deposits. The Thelon Basin is one analogue of the Athabasca Basin and the Kiggavik area displays several economically significant uranium orebodies: Four of the deposits yield calculated resources of 48,953 t of uranium at a grade of 0.47% U [35]. Exploration began in the 1980s by Urangesellschaft, and the property is now held by Orano Canada (formerly known as AREVA Resources Canada) in joint venture with JCU (Canada) Exploration Company Ltd. (Vancouver, BC, Canada).
The Churchill province (Figure 1B) is bordered to the NW by the Thelon-Taltson (ca. 2020–1900 Ma), and to the SE by the Trans-Hudson orogenic belts (ca. 2070–1800 Ma). At the end of the Trans-Hudsonian orogeny, the Baker Lake Basin developed as a result of (retro-arc) extensional to transtensional rifting tectonics [36], and was filled with sedimentary and bi-modal volcanic-sedimentary rocks (Baker Lake and Wharton Grps, ca. 1850–1750 Ma, [37,38]). It was followed by uplift, extensive erosional peneplanation and regolith formation, over which deposited the eolian sandstones and conglomeratic red-beds of the Thelon formation (ca. 1670–1540 Ma [32,33]), linked to thermal subsidence in the sag, fault-controlled intracratonic Thelon basin [36,38,39]. This volcano-sedimentary pile unconformably overlies a metamorphosed basement consisting of Archean rocks that include Mesoarchean (ca. 2870 Ma) granitic gneisses, 2730–2680 Ma, supracrustal rocks of the Woodburn Lake Group [40], and a distinctive package of 2620–2580 Ma felsic volcanic and related hypabyssal rocks known as the Snow Island Suite [41,42,43,44,45,46,47].
Before emplacement of the Thelon formation, the Archean to Paleoproterozoic rocks of the Churchill province where intruded by three magmatic suites: (i) The late syn-orogenic (ca. 1830 Ma) Hudson Suite [48], (ii) the Dubawnt Minette Suite (contemporaneous of the Hudson Suite), with ultrapotassic intrusions, minette dikes and lamprophyres, and (iii) the anorogenic (ca. 1750 Ma) Kivalliq Igneous Suite (KIS) [46,49,50,51].

2.2. Local Geological Setting

A simplified geological map of the Kiggavik area is presented in Figure 1C. The local litho-structural pile consists of Mesoarchean granitic, granodioritic, and augen gneisses (2866 ± 6 Ma; [52]) tectonically overlain by a Neoarchean metavolcano- sedimentary package retromorphosed to greenschist facies: The Woodburn Lake Group. This package consists of quartzo-feldspathic wackes and minor quartzite with thin, interbedded banded iron formation layers, rare black shales, and locally komatiite and rhyolite (2710 ± 2.1 Ma). These rocks, together with overlying Paleoproterozoic (2300–2150 Ma) rocks of the Ketyet River Group [53], include a prominent unit of orthoquartzite [52]. These rocks are intruded by the Schultz Lake Intrusive Complex (SLIC, [51]). The SLIC comprises rocks from the two intrusive suites previously described [51]: (i) The “Hudson granite” consists of non-foliated granitoid sills, syenites and lamprophyre dikes of the late syn-orogenic Hudson Suite; and (ii) the “Nueltin granite” comprises anorogenic granite to rhyolite of the KIS [46].
The diabase dikes of the Mackenzie diabase swarm form prominent linear aeromagnetic features trending NNW-SSE [44,45] and cut across all previous lithologies. This intrusive event is dated at 1267 ± 2 Ma [54,55], and represents the last magmatic-tectonic event in the region.
The main structural features in the Kiggavik area are the ENE-trending Thelon fault (TF) and the Main Zone fault (MZF) in the northern part of the property, the ENE-trending Judge Sisson fault (JSF) in the central part, and the NE-trending Andrew Lake Fault (ALF) in the southwestern part of the study area (Figure 2). These faults date back to at least ~1920 Ma [56] and had a subsequent complex structural and kinematic evolution with several episodes of reactivation and fluid circulation during Proterozoic time [31,56]. These faults host several uranium orebodies; prospects and deposits, the main uranium mineralizing events being bracketed between 1540 and 1270 Ma [28,29,31]. The MZF hosts various deposits and prospects: 85 W, Granite Grid and Kiggavik (Main, Central and East Zones, Figure 1C). End is hosted by the JSF, while Andrew Lake, Jane and Contact occur along the ALF (Figure 1C).

3. Sampling and Methods

3.1. Drillhole Observations, Sampling Strategy and Collection of Oriented Data

The QB has been observed in the field but the scarcity of outcrops in the area is the reason why most observations and oriented measurements were taken from drill holes within the deposits and prospects in the Kiggavik area (location in Figure 1C). Porosity was measured systematically in the field following the fluid resaturation method. A clean and dried sample is weighted, saturated with a liquid of known density, and then reweighed. The weight change divided by the density of the fluid results in the pore volume. Many of the observations and samples come from the recently drilled Contact prospect (2014 and 2015 Orano exploration campaigns). More than 5000 m of drill core were reviewed, with several hundreds of meters dedicated to the characterization and study of the QB. Recent drilling (2014–2015) in the Kiggavik area was done with NQTM coring providing a 47.6 mm diameter sample. Oriented data measured on drill core were restored in their original position and plotted with Dips 6.0 software (Rocscience, Toronto, ON, Canada). Uncertainty on fault/fracture orientation measurements is estimated to be ±10°.

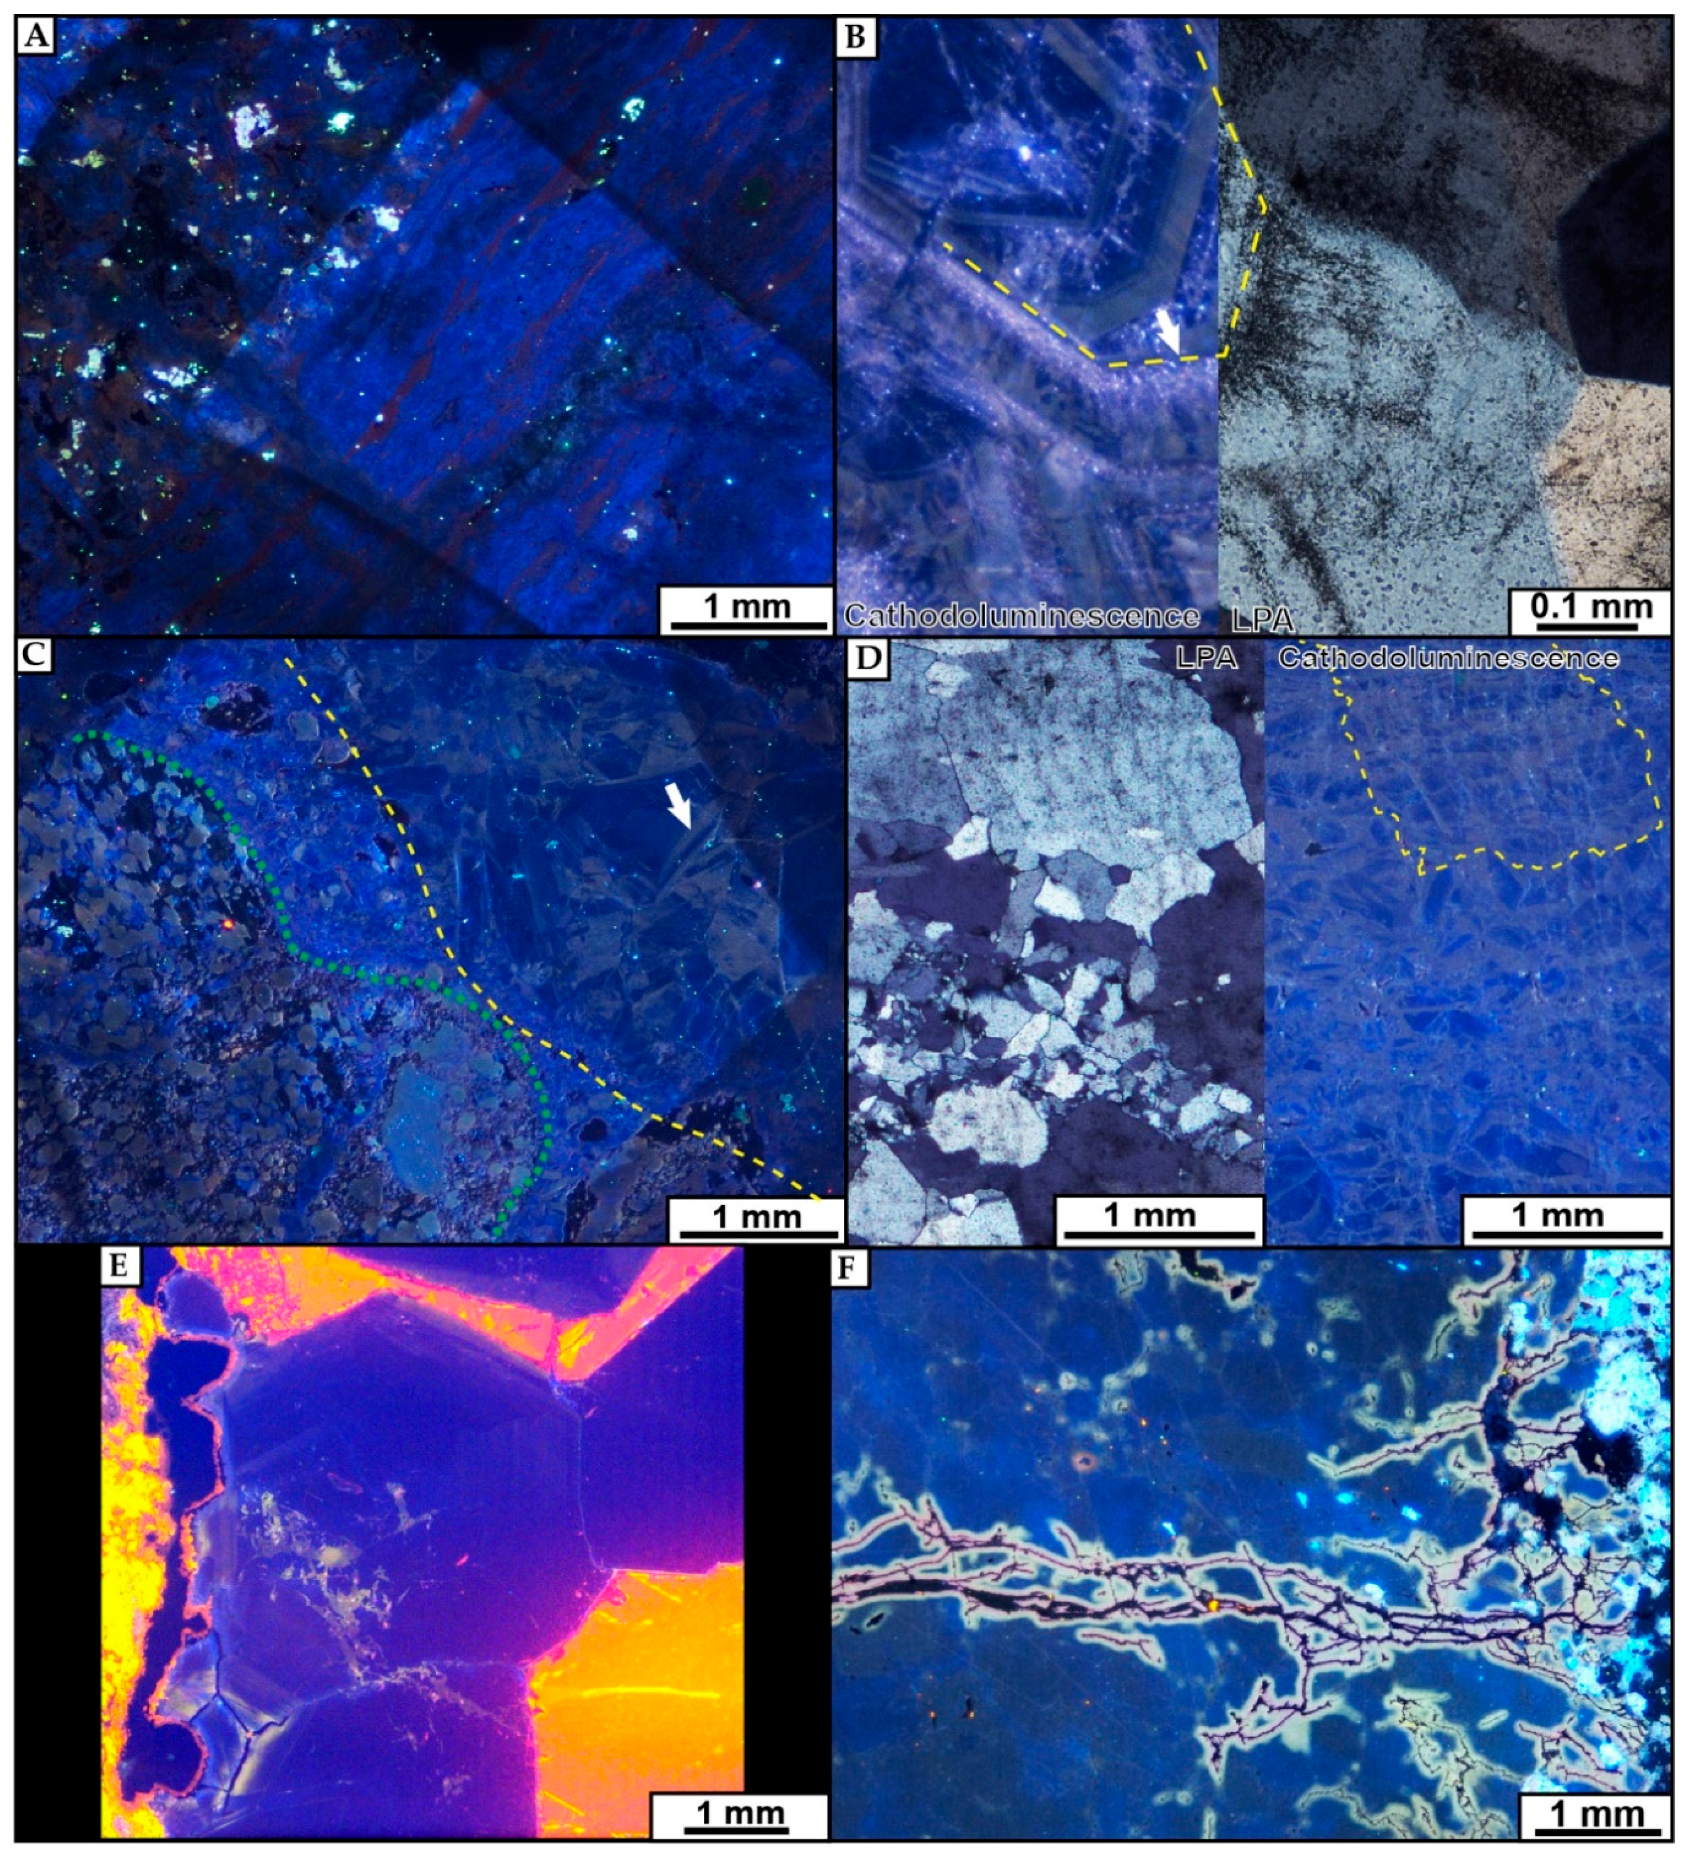
3.2. Quartz Microscopic Characterisation by Optical and Cathodoluminescence Microscopy

Quartz Fifty-five drill core samples (10 to 20 cm in length) displaying veins or breccias linked to the QB were collected, mainly from the Contact prospect, but also from End, Andrew Lake and Bong deposits. All samples were studied from the macro- to the micro-scale in order to characterize the macroscopic texture of the quartz breccia and its relationships with predating and postdating fracturing and faulting events. Thirty-five thin sections were prepared for petrographic and microstructural studies. Thin sections were observed through optical microscopy (plane polarized transmitted and reflected light microscope Motic BA310 POL Trinocular, equipped with a 5 M pixel Moticam camera) (Motic Instruments Inc., Richmond, BC, Canada), and cathodoluminescence microscopy (CITL Cold Cathodoluminescence device Model MK5-1, made at University of Barcelona (Barcelona, Spain), for deciphering quartz generations.

3.3. Fluid Characterization by Trace Elements and Oxygen Isotopes Analyses

Laser ablation ICP-MS analyses of quartz were conducted at GeoRessources, Université de Lorraine (Vandoeuvre-lès-Nancy, France), using a 7500e quadrupole ICP-MS (Agilent, Santa Clara, CA, USA) coupled with a nanosecond excimer laser (GEOLAS Pro; 193 nm wavelength). Zones free of fluid inclusions (FIs) were selected for analyses. Analyses were performed using a laser beam diameter of 60 (first session of analyses) and 90 (second session) µm, with a fluence of ~10 J/cm2 and a repetition rate of 5 Hz. The laser beam was focused onto the sample with a Schwarztschild reflective objective (magnification ×25; numerical aperture = 0.4). Each analysis consisted of 20 s of background measurement during laser warm-up, 20 to 40 s of ablation (depending on the thickness of the quartz) and 15 s of washout before repeating the process on a nearby location. The external standards were NIST SRM610 and NIST SRM 612 [57], the external standards being analyses twice at the beginning and at the end of each set of samples, following a bracketing standardization procedure. LA-ICP-MS calibration was optimized for highest sensibility for the whole mass/charge range, while maintaining Th/U ~ 1 and ThO/Th < 0.5% as determined on NIST SRM 610 or 612. The following isotopes were measured: 7Li, 11B, 23Na, 24Mg, 27Al, 28Si, 39K, 44Ca, 48Ti, 57Fe, 74Ge, 85Rb, 88Sr, 89Y, 90Zr, 133Cs, 138Ba and 153Eu for the first session, and 7Li, 11B, 23Na, 27Al, 29Si, 45Sc, 47Ti, 51V, 53Cr, 55Mn, 59Co, 60Ni, 63Cu, 66Zn, 69Ga, 72Ge, 75As, 85Rb, 88Sr, 90Zr, 93Nb, 95Mo, 115In, 118Sn, 121Sb, 133Cs, 137Ba, 181Ta, 182W, 197Au, 208Pb, and 209Bi for the second session. 28Si or 29Si were used as internal standard, using a SiO2 concentration of 100%. Data reduction was done using Iolite software [58].
In situ oxygen isotope analysis of the main quartz generations was performed by secondary ion mass spectrometry (SIMS, CAMECA, Gennevillier, France) using the Cameca IMS1270 at CRPG/CNRS in Vandoeuvre-les-Nancy, France, following the approach of Hervig et al. [59]. The isotopes 16O and 18O were measured, based on standard polished sections coated with gold. A ~4 nA defocused primary ion beam of Cs impact energy 10 keV was used, producing sub-circular ablation craters of ~10–20 µm diameter. A mass resolution (∆M/M) of 5000 was used, to resolve potential interference of 17O on 16O. Two in-house standards were used (Brésil (δ18O = 9.6‰) and Brésil-2 (δ18O = 19.6‰)) to set-up the instrument and correct for drifts and fractionations using a standard bracketing approach. The internal precision for δ18O was between 0.06 and 0.1‰ (measurements on the standards Brésil and Brésil-2 and on the different quartz generations of Kiggavik). δ18O values are reported relative to the V-SMOW standard.

4. Results

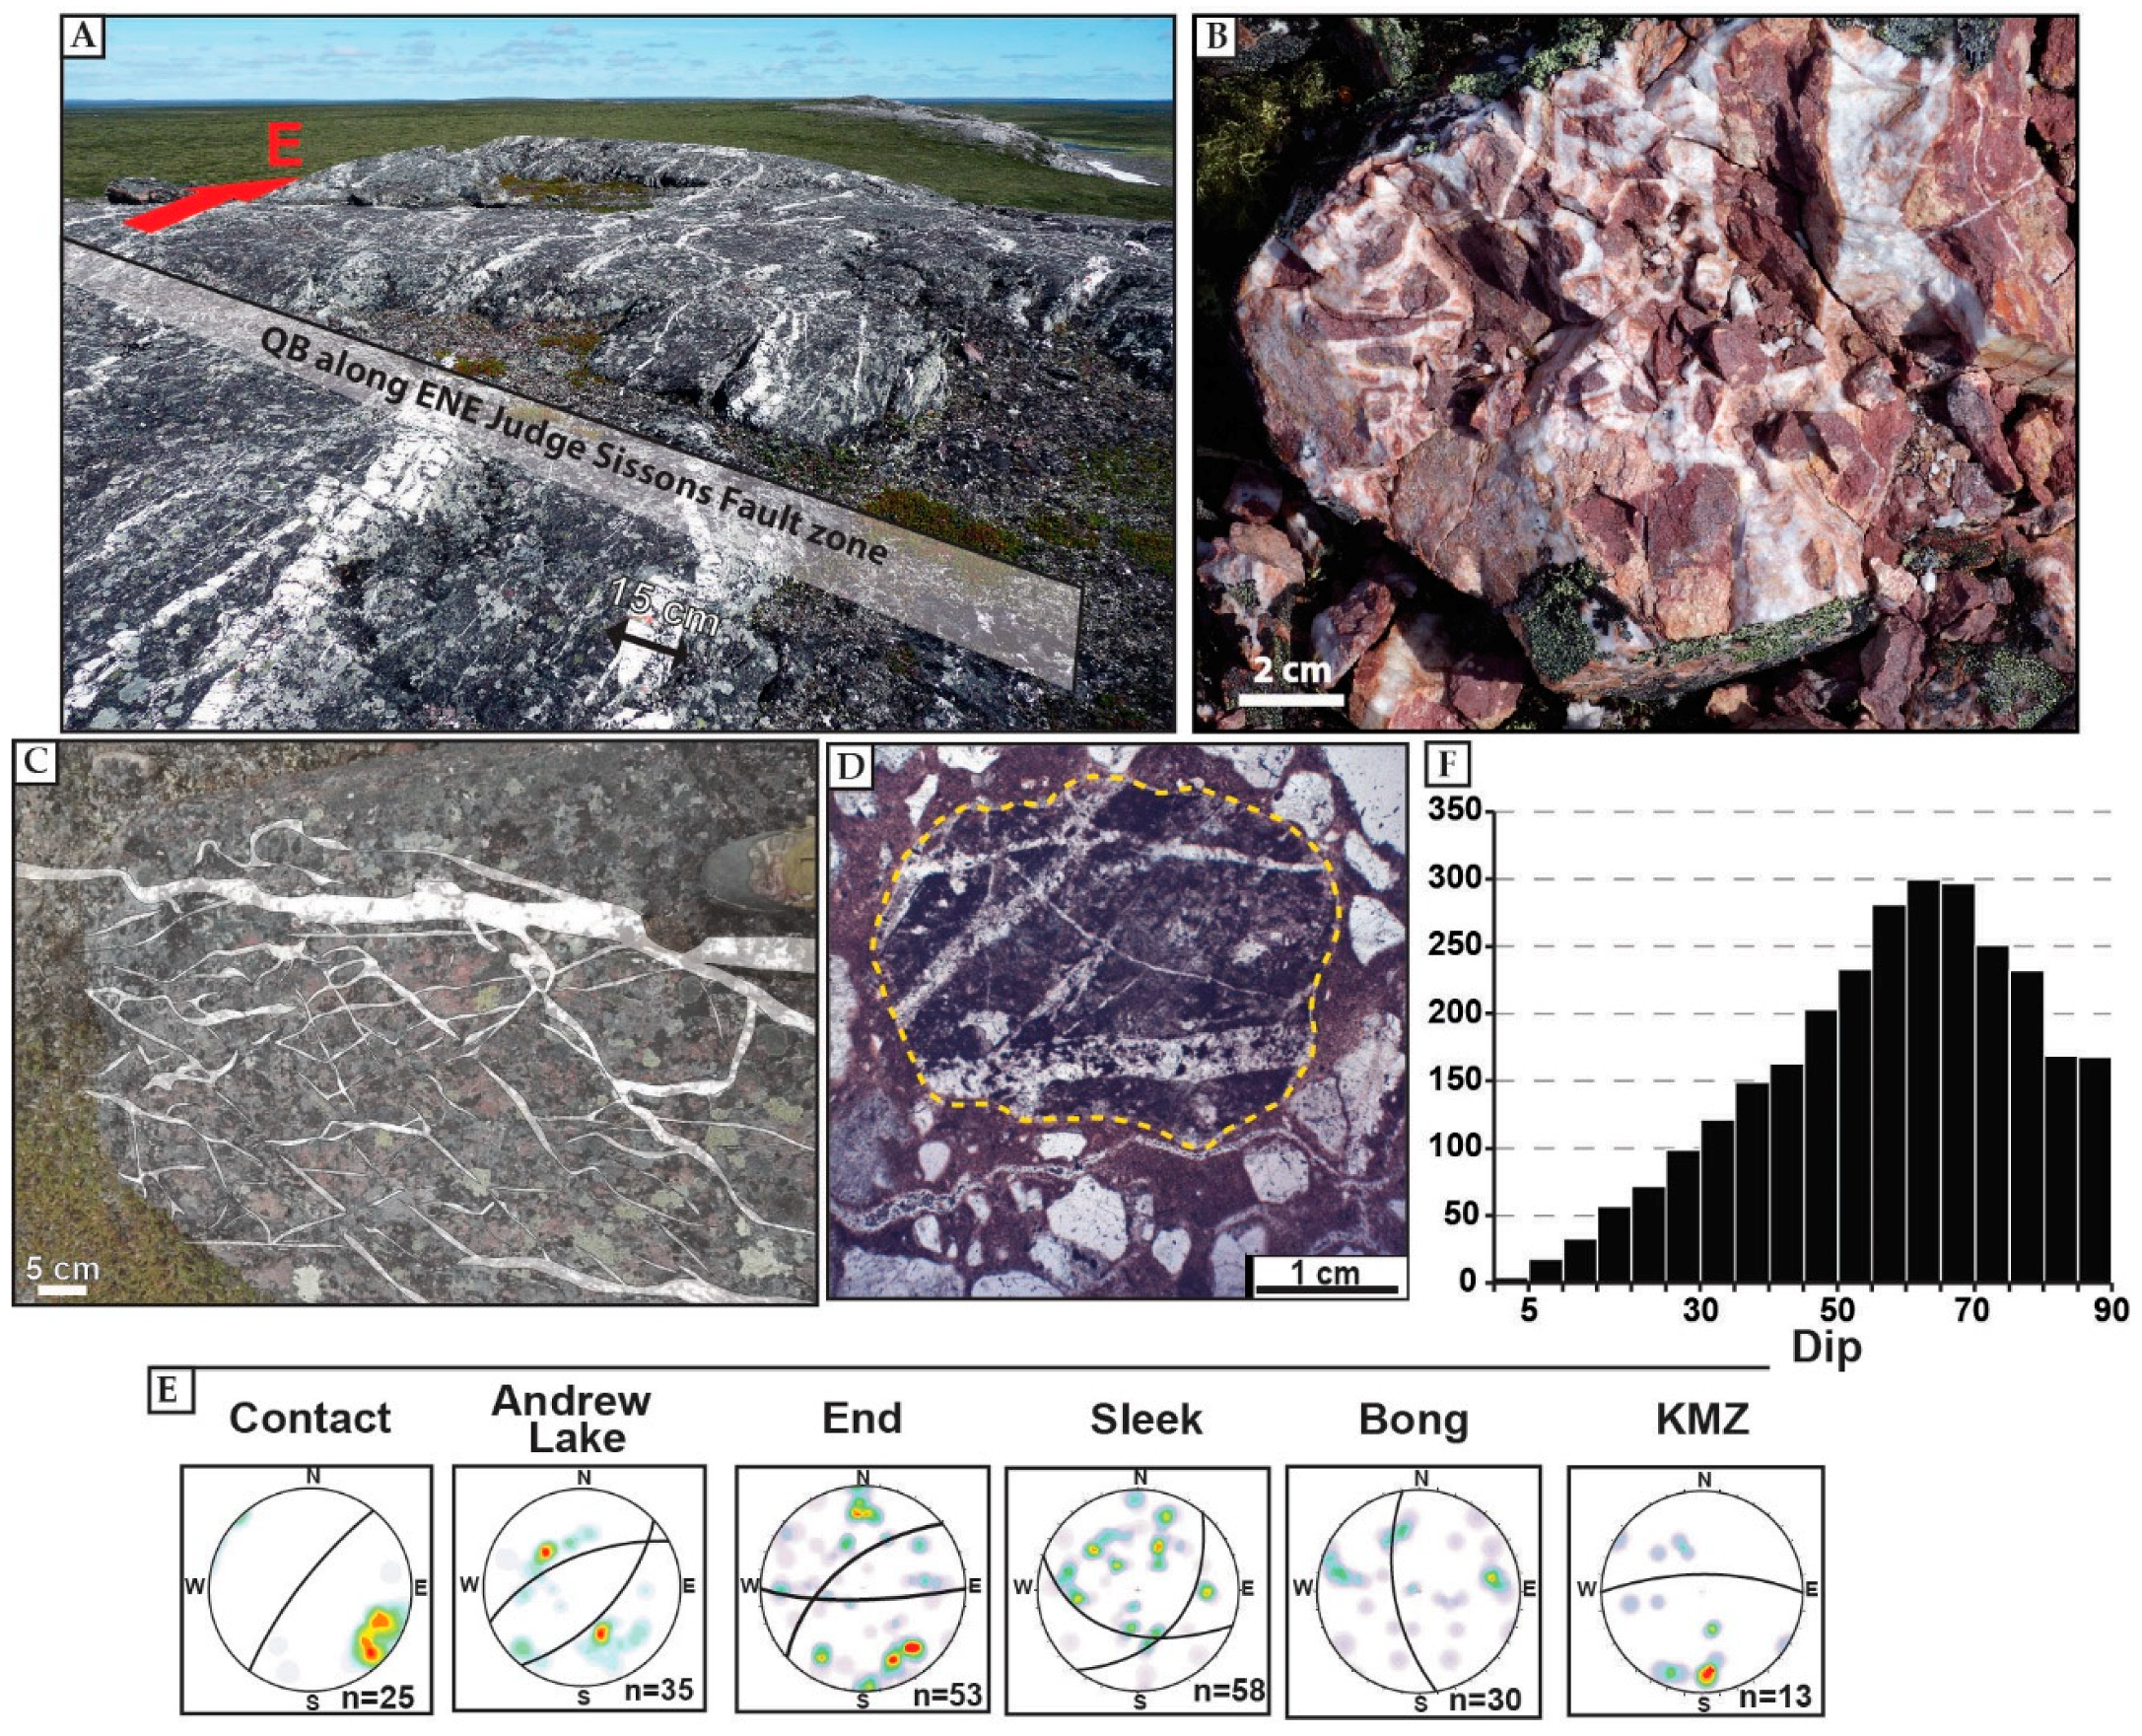
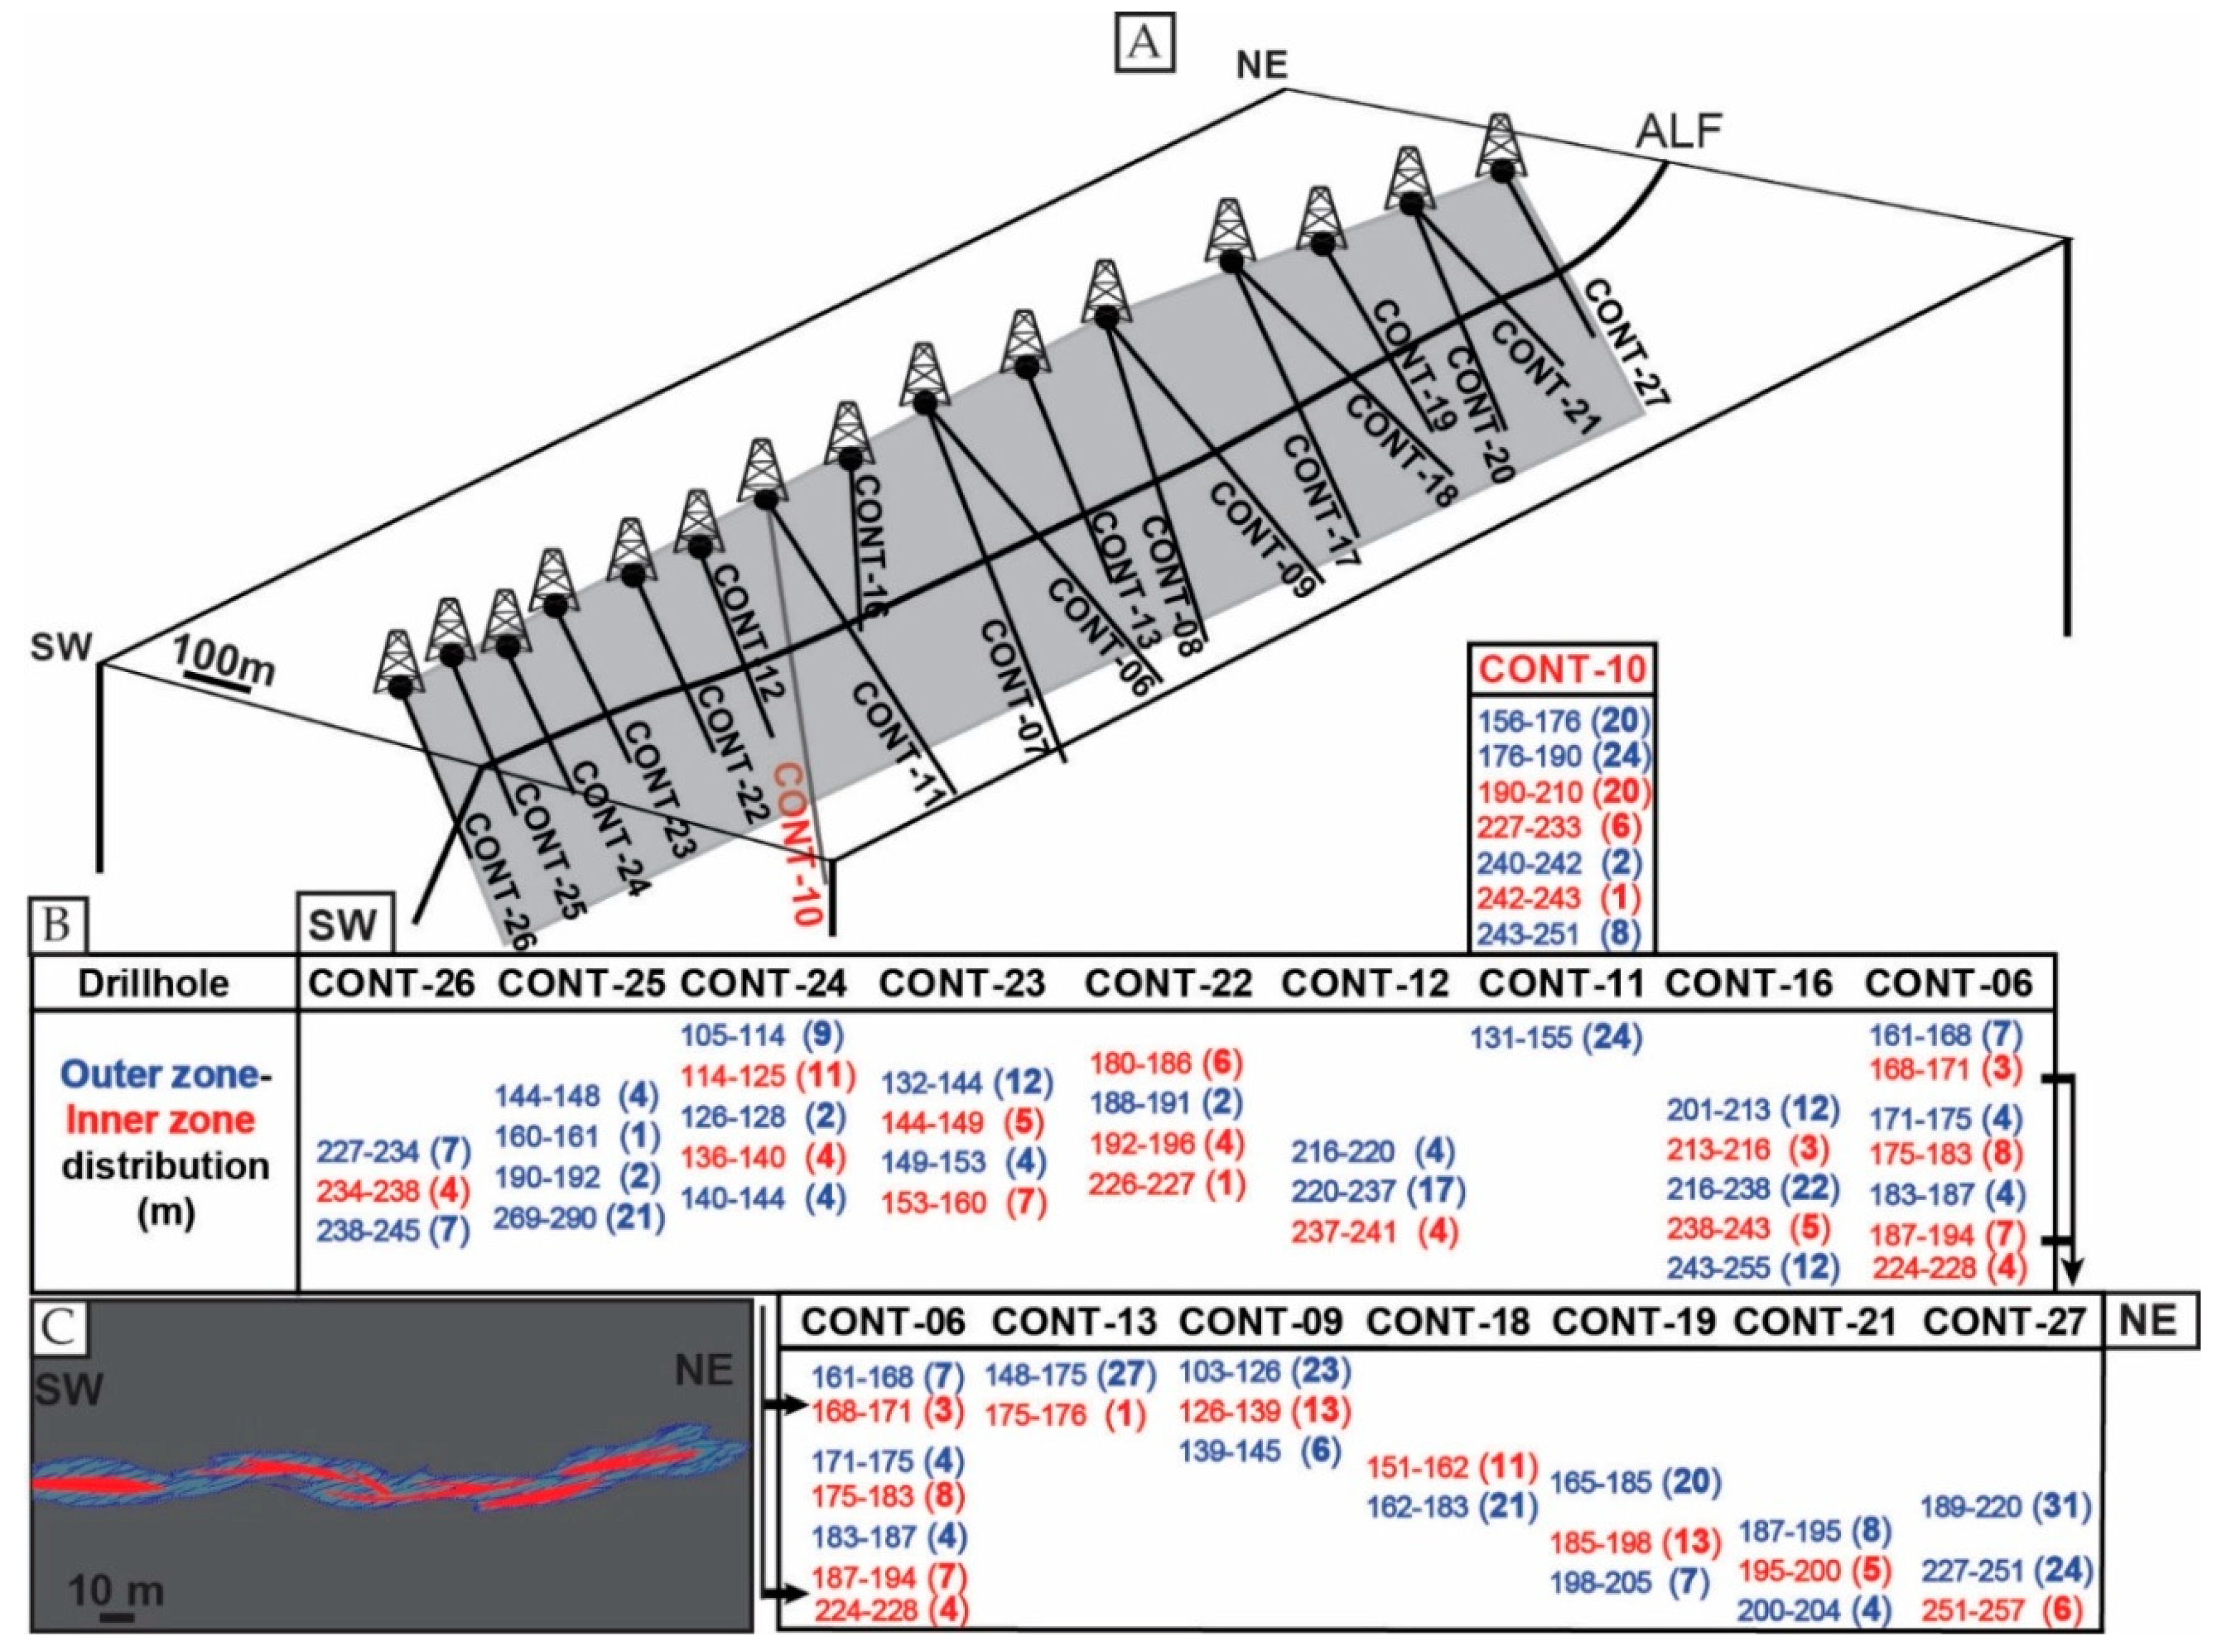
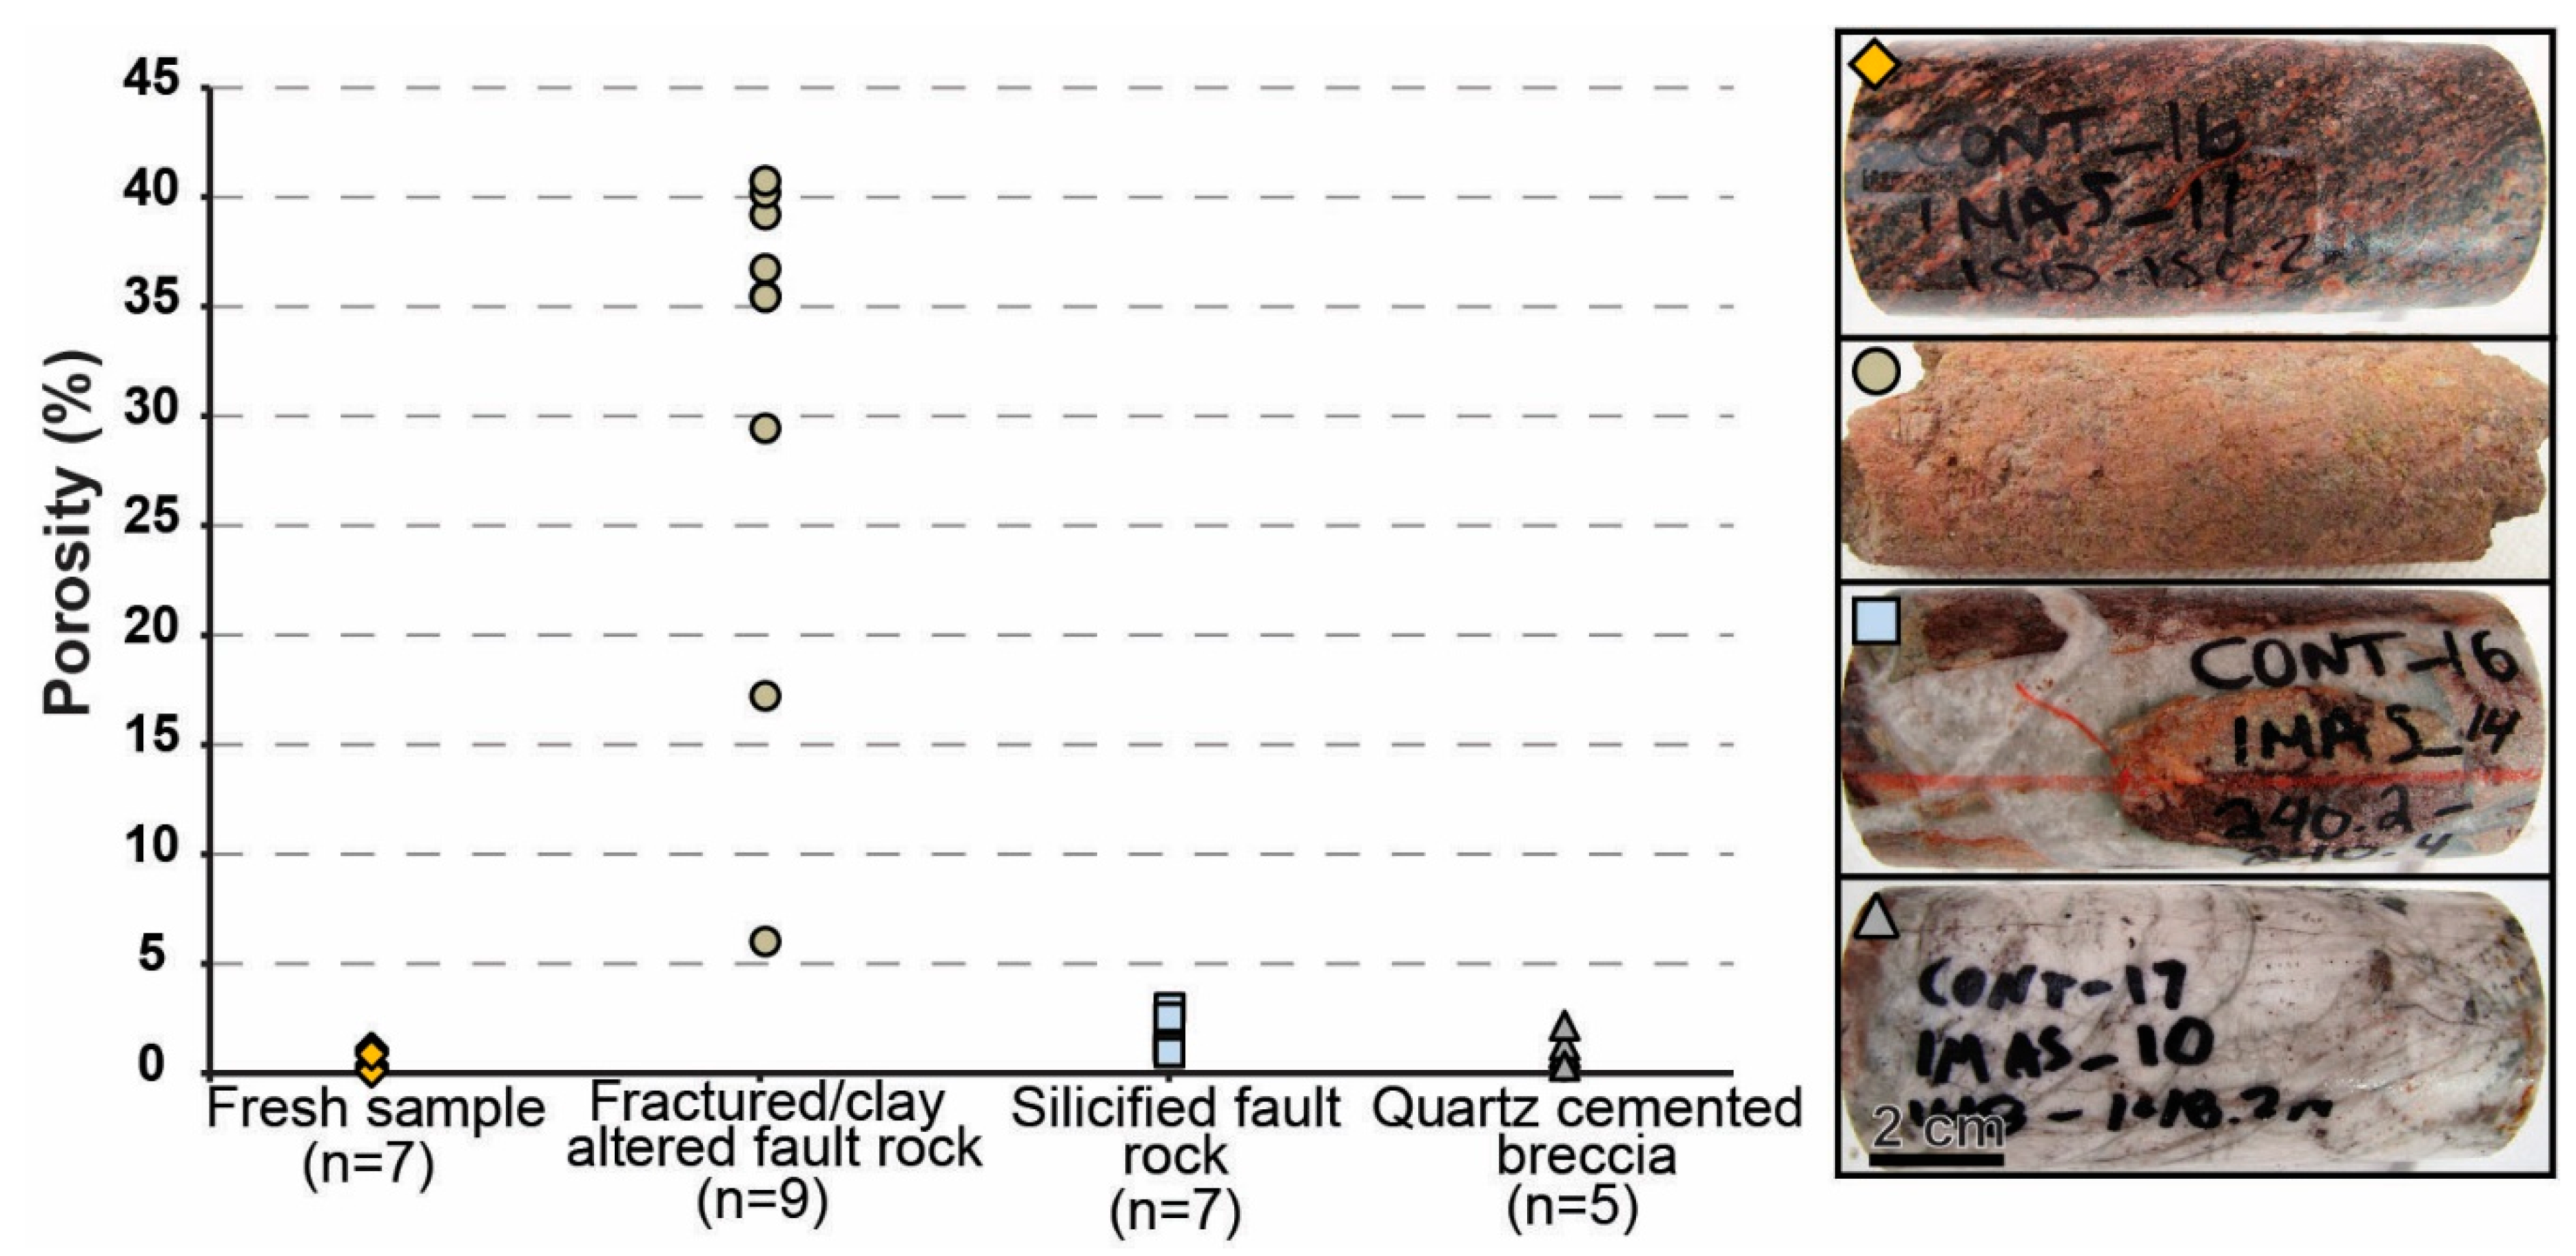
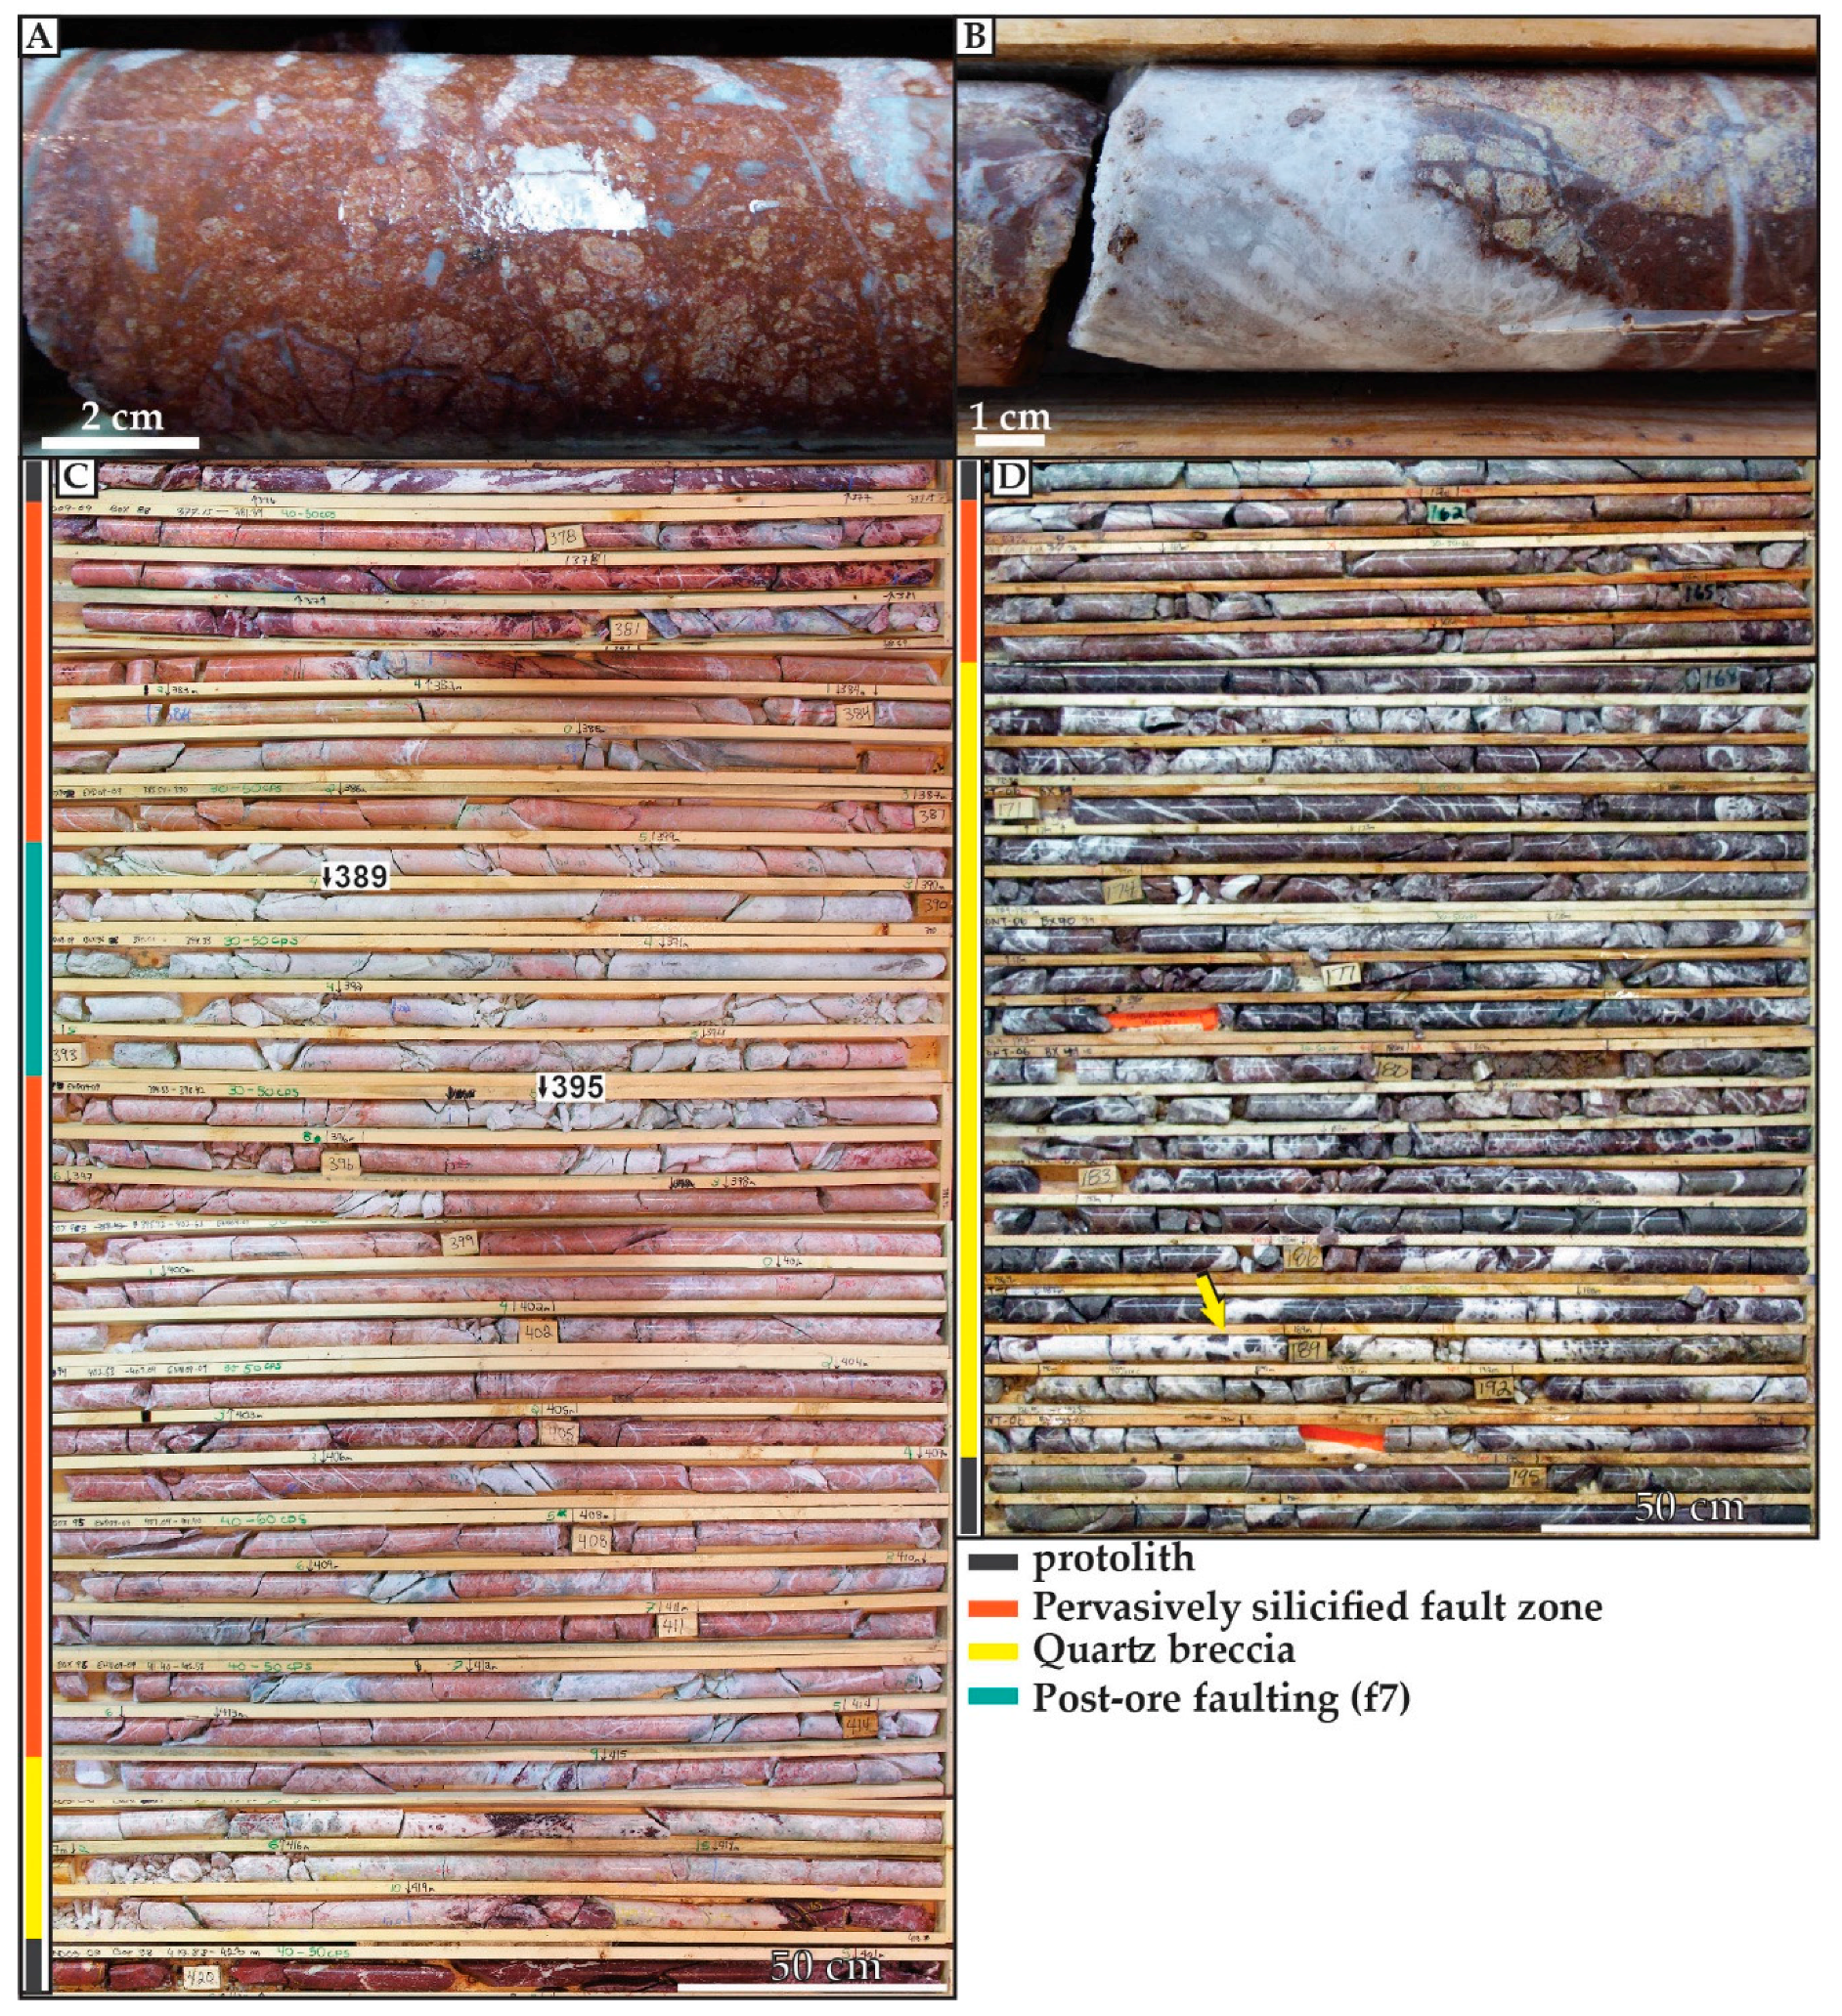
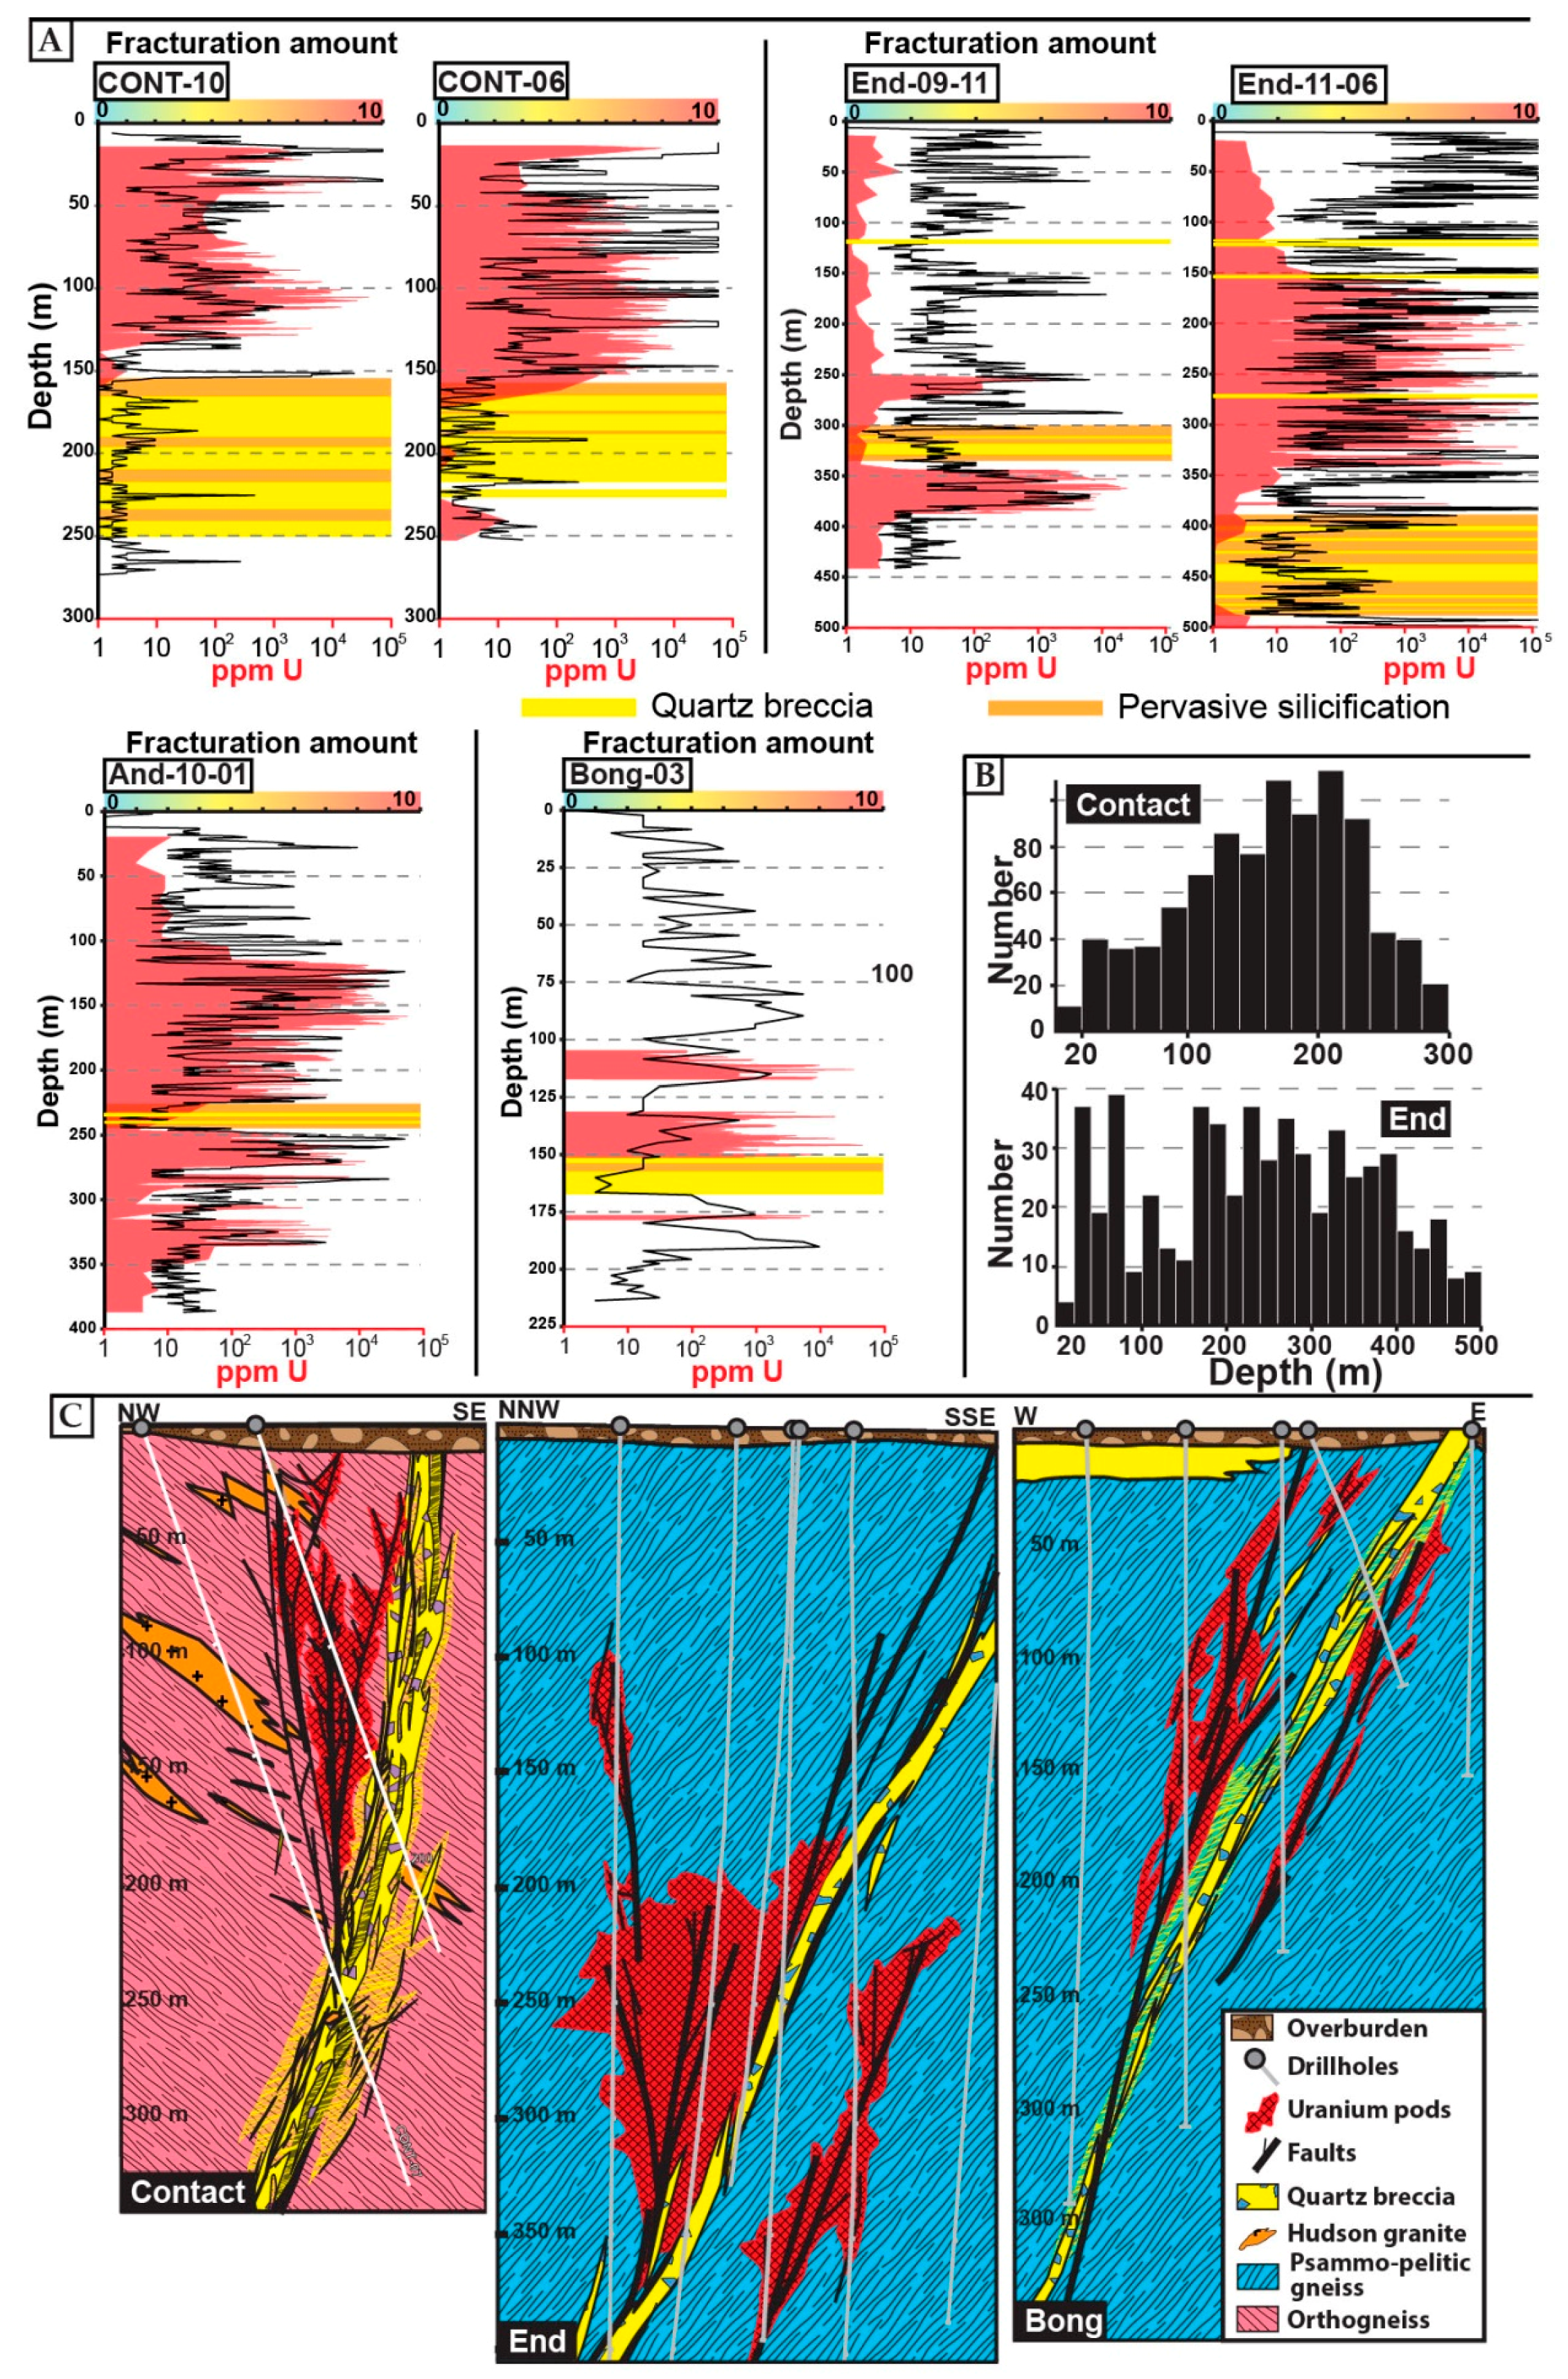
4.1. Spatial Organisation and Macroscopic Characteristics of the QB

Occurrence of QB has been recognized along various segments of the major faults within the Kiggavik area (e.g., ALF, JSF, Figure 1C,D and Figure 2A). The QB consists of a up to 30 m thick complex network of mosaic quartz-sealed breccia and veins (Figure 2A–C), typically displaying angular fragments and jigsaw pattern (Figure 2B), and associated with a pervasive iron-oxidation of the host rock (Figure 2B). This kind of observation is common in drill holes. Lithologies within and around the QB display a pervasive red-purple hematization, as documented at the Contact prospect [31]. Clasts bearing veins of the QB are observed in the sandstones of the Thelon formation (Figure 2D), indicating that QB predates formation of the Thelon Basin, as already suggested by several authors [29,31] and crosscuts, thus postdates, Hudsonian intrusions (ca. 1.83 Ga). Fault zones outlined by the QB are presumably better preserved in the field due to the silicification process that increases their resistance to erosion.
The outcrop shown in Figure 2B illustrates the complexity of the identification of the main structural trends on limited exposures. We considered that the most regionally significant structural trend of the breccia bodies is given by the thicker (>10 cm) veins and breccias, because where they are visible, minor quartz veins are more randomly oriented or give a mean statistical value that is different between two (2) nearby drill holes. By plotting the orientations of thick veins we infer the true orientation of the quartz breccia (Figure 2E), which was revealed to be consistent with the major fault trends in map view (Figure 1D). The QB usually displays a consistent high angle dip, reflecting the orientation of the main fault trend: N30, dip to the NW at Contact, N175, dip to the W at Bong, N50 and N90, dip to the NW and to the S, respectively, at End (Figure 2E). Even though the majority of minor quartz veins display throughout the Kiggavik area a steep dip (60–90°), a significant amount of veins (Figure 2F) shows relatively shallow dip angles (<30°).
Figure 3 summarizes the data collected on drill holes at the Contact prospect (Figure 3A). The QB bodies usually display two main distinct zones, an outer zone and an inner (core) zone. The outer zone (blue in Figure 3B) is represented by a dense to scarce network of millimeter to centimeter-thick quartz veins, while the inner (core) zone (red in Figure 3B) is represented by thick (>10 cm thick) quartz veins and a dense quartz vein network, where angular clasts of the fragmented host rock are barely observable. Several QB core zones were crosscut by drill holes (Cont-24, Cont-16, Cont-06). These core zones are discontinuous from the SW to the NE. They are tapering toward their ends (Figure 3C) both laterally (for example, between Cont-26 and Cont-25, Figure 3B), and vertically (for example, between Cont-10 and Cont-11, Figure 3B). This supports that they have elliptical shapes, connected by quartz vein networks. This observation explains the important changes in thickness of the QB between two nearby drill holes (e.g., Cont-06 and Cont-13).
One observation not highlighted by previous studies in the Kiggavik area is the presence of a large (20–100 m) brittle fault zone predating emplacement of the QB but systematically spatially associated with it. Macroscopically, the QB consists of thin to massive quartz veins as described in Figure 2; however, our detailed observations document numerous quartz healing events crosscutting clay-altered cataclastic to ultra-cataclastic fault rocks that are now silicified and “preserved”. Clasts are monomictic, sub-rounded, millimetric to centimetric in size and clay altered, embeded in a light red to brown matrix (Figure 4A,B).
The quartz veins of the QB were observed in several locations as cutting across the cataclasites (Figure 4B). These early cataclastic fault rocks therefore predate the QB; they could be related to extensional to trans-tensional faulting during formation of the Baker Lake Basin [31]. This early, now silicified fault zones and the QB are spatially associated, indicating that the pervasive silicification likely occurred at the onset of emplacement of the QB. However, even though the pervasive silicification of the fault zone is spatially and likely roughly temporally associated with the QB, we differentiate hereafter these two features: The silicified fault zone on one hand and the QB that results from brecciation sealed by quartz on the other hand.
Both features display different thicknesses: In Figure 4C, the pervasively silicified fault zone with its light reddish color is observable along 40 m of drill core and is cut by numerous small quartz veins and a 4 m thick core zone of the QB. A late faulting and white clay alteration pattern is observed at depth 389–395 m (Figure 4C, post ore faulting f7). In Figure 4D, the silicified fault zone is observed along 5 m of drill core and is cut by 23 m of QB.
The pre-QB silicified fault zone displays evidence of multiple events of tectonic brecciation and comminution. In the sample observed at micro-scale under transmitted light (Figure 5A), three generations of cataclastic fault rocks are observed, with each generation of cataclasis consuming the previous one. They are crosscut by at least three generations of quartz veins, building a complex pattern (Figure 5B,C). Minerals from the original host rock (psammo-pelitic gneiss with quartz, apatite, illite, muscovite, pyrite) are preserved in the first generation of clasts (pink, Figure 5B). A closer look at the cataclastic fault rocks reveals that the different cements are made of micro-crystalline quartz and white micas (Figure 5D,E). The superimposition of multiple generations of cataclasites indicates that the localized zone of deformation was repeatedly reactivated during progressive deformation.
In order to better understand and characterize the influence of silicification on fluid circulation, we selected porosity data measured in the field for four types of rocks: Fresh host rock (granitic gneiss, before fracturing and alteration), silicified type 1 (pervasively silicified fault zone), silicified type 2 (typical white QB), and clay-altered/fractured samples. Results are presented in Figure 6. Fresh granitic gneiss yields the lowest porosity values, <2%. Fault rock and samples displaying quartz brecciation and pervasive silicification yield values slightly higher but <5%. Fractured and clay altered fault rock display much higher values, up to 40%. Cataclastic fault rocks formed before the QB should have displayed a high porosity, but after pervasive silicification they have a porosity comparable to fresh rock (Figure 6), unlike strongly clay altered and fractured samples (Figure 6).

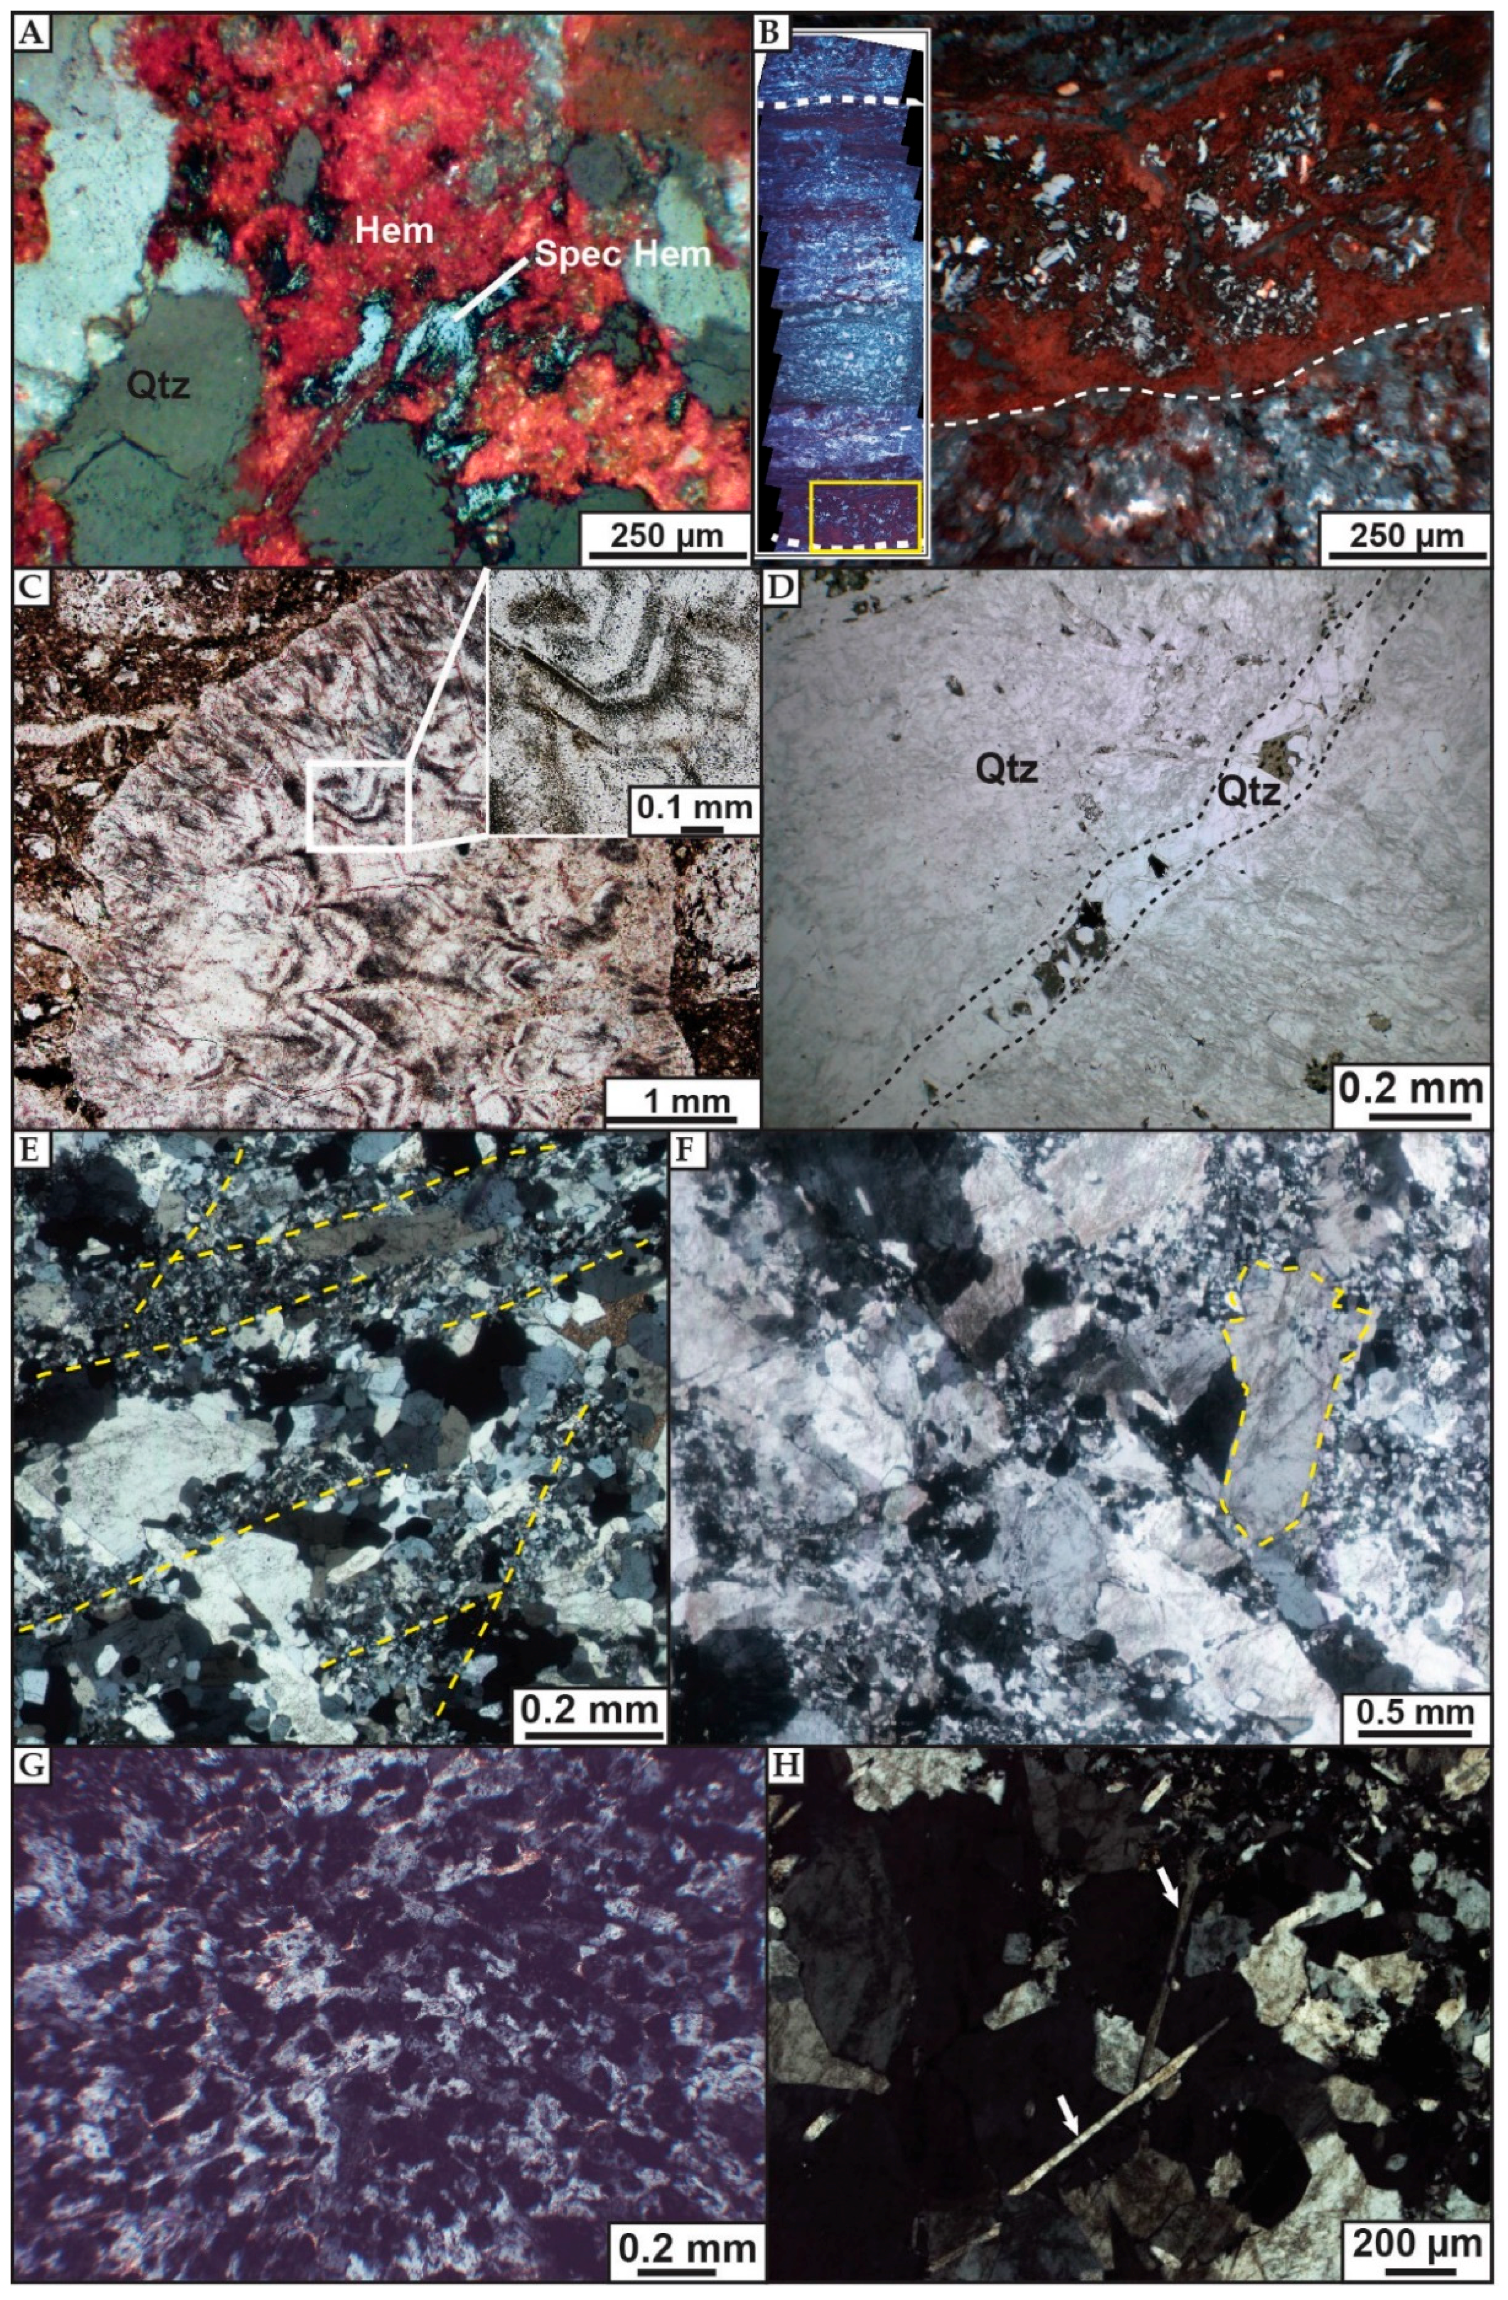
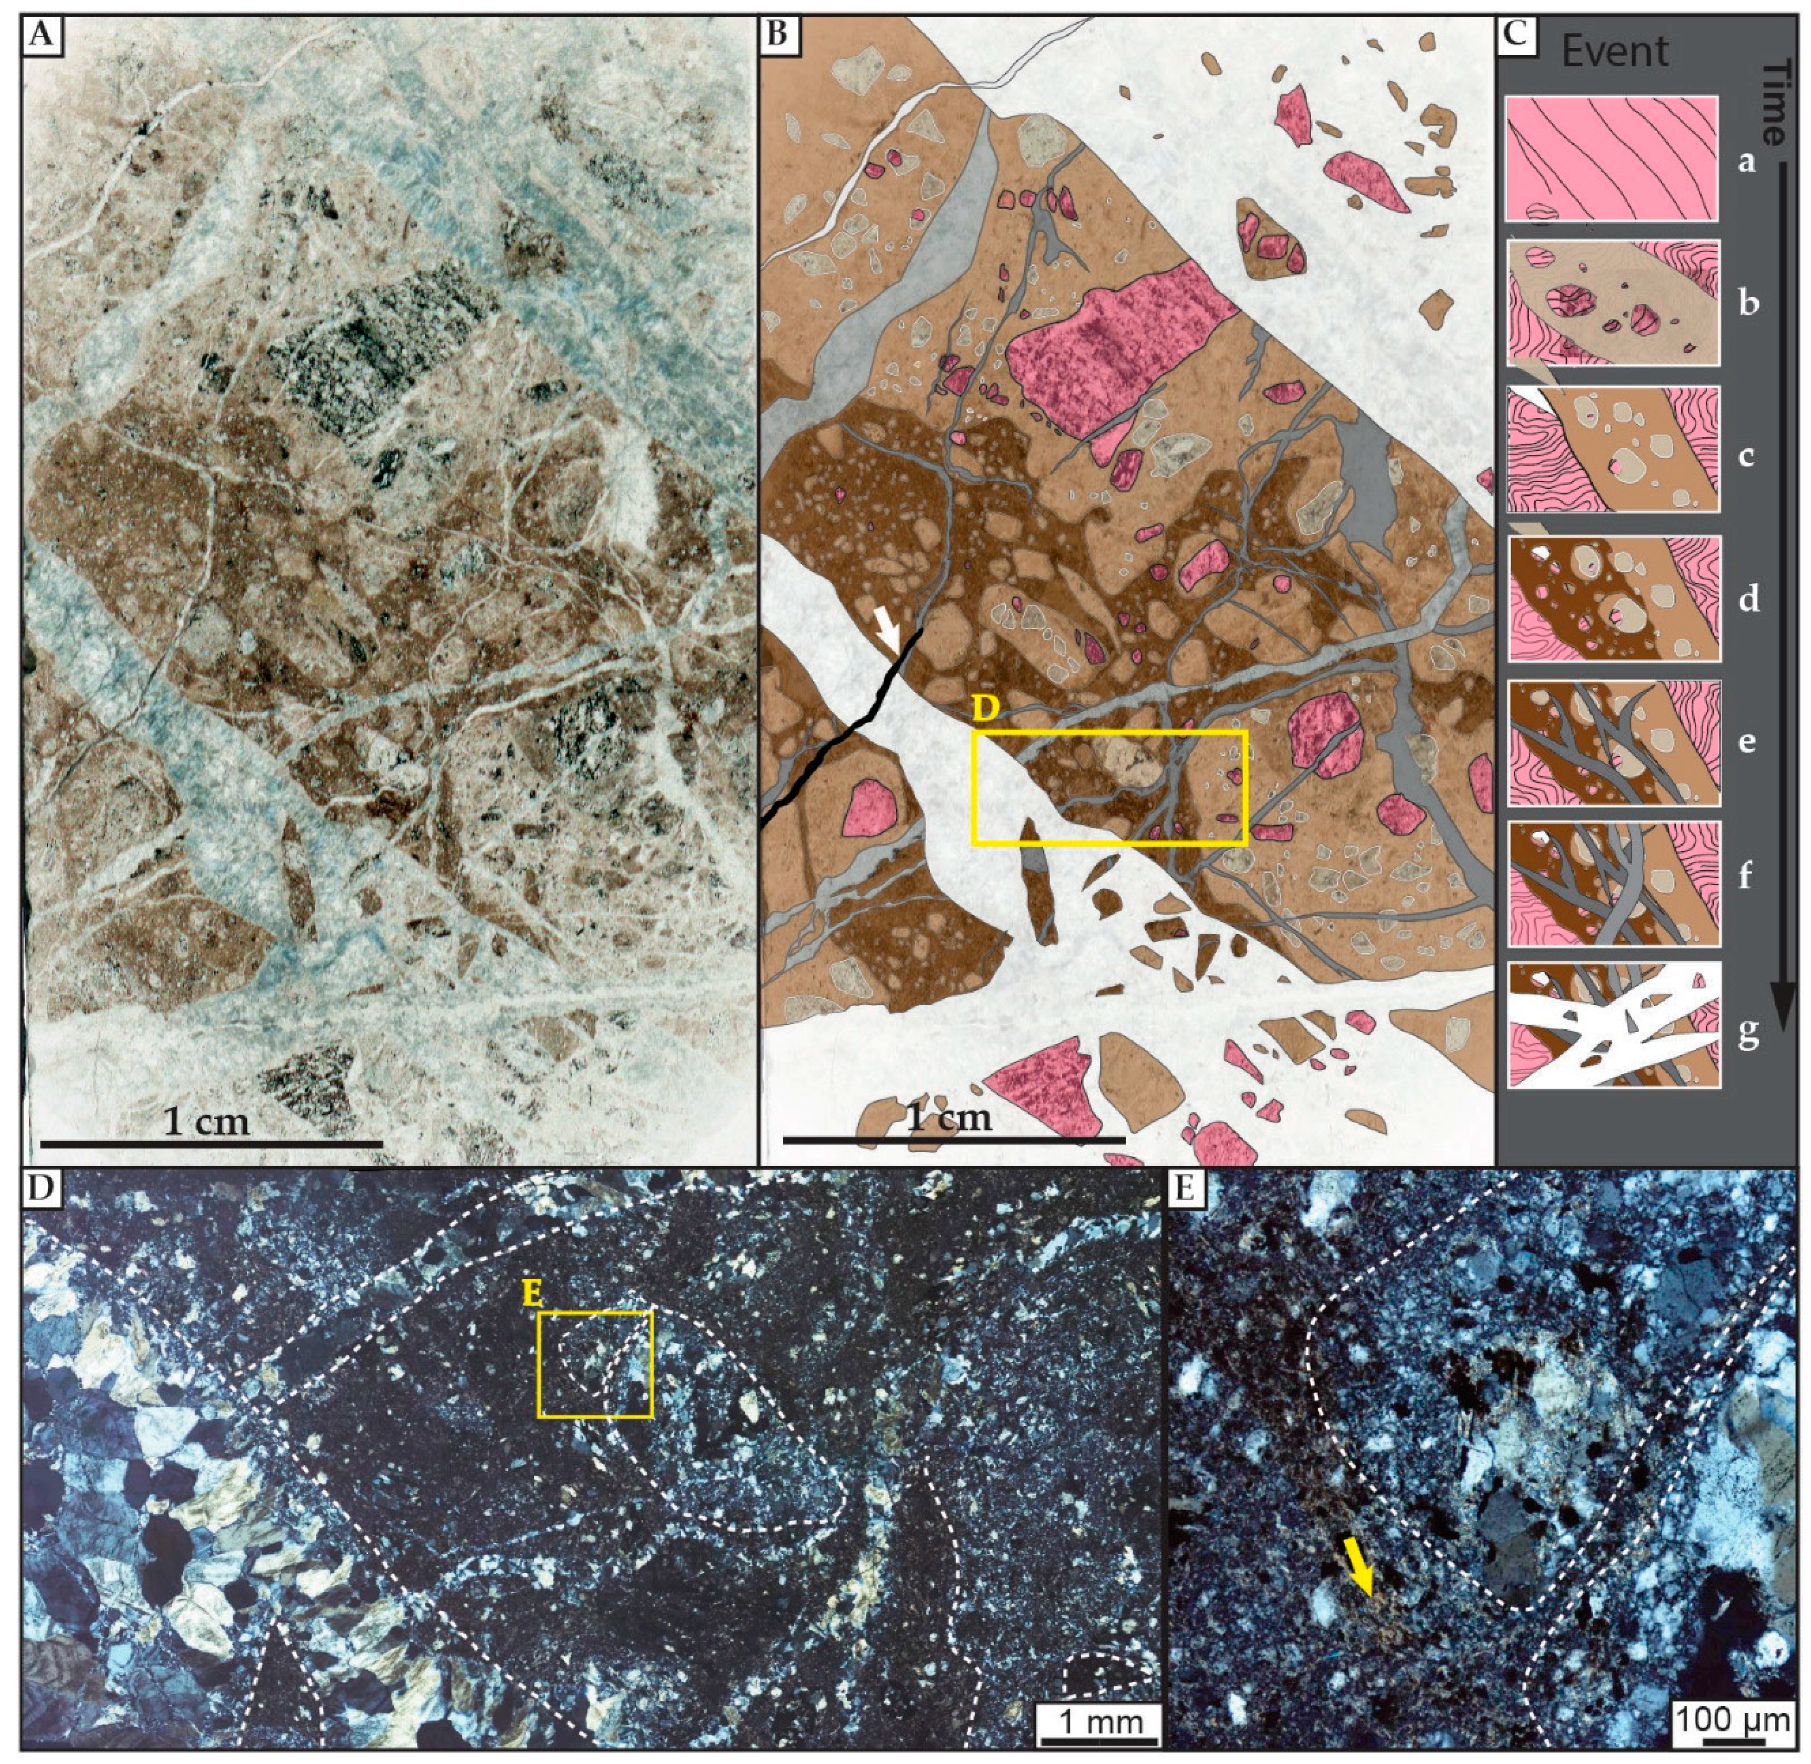
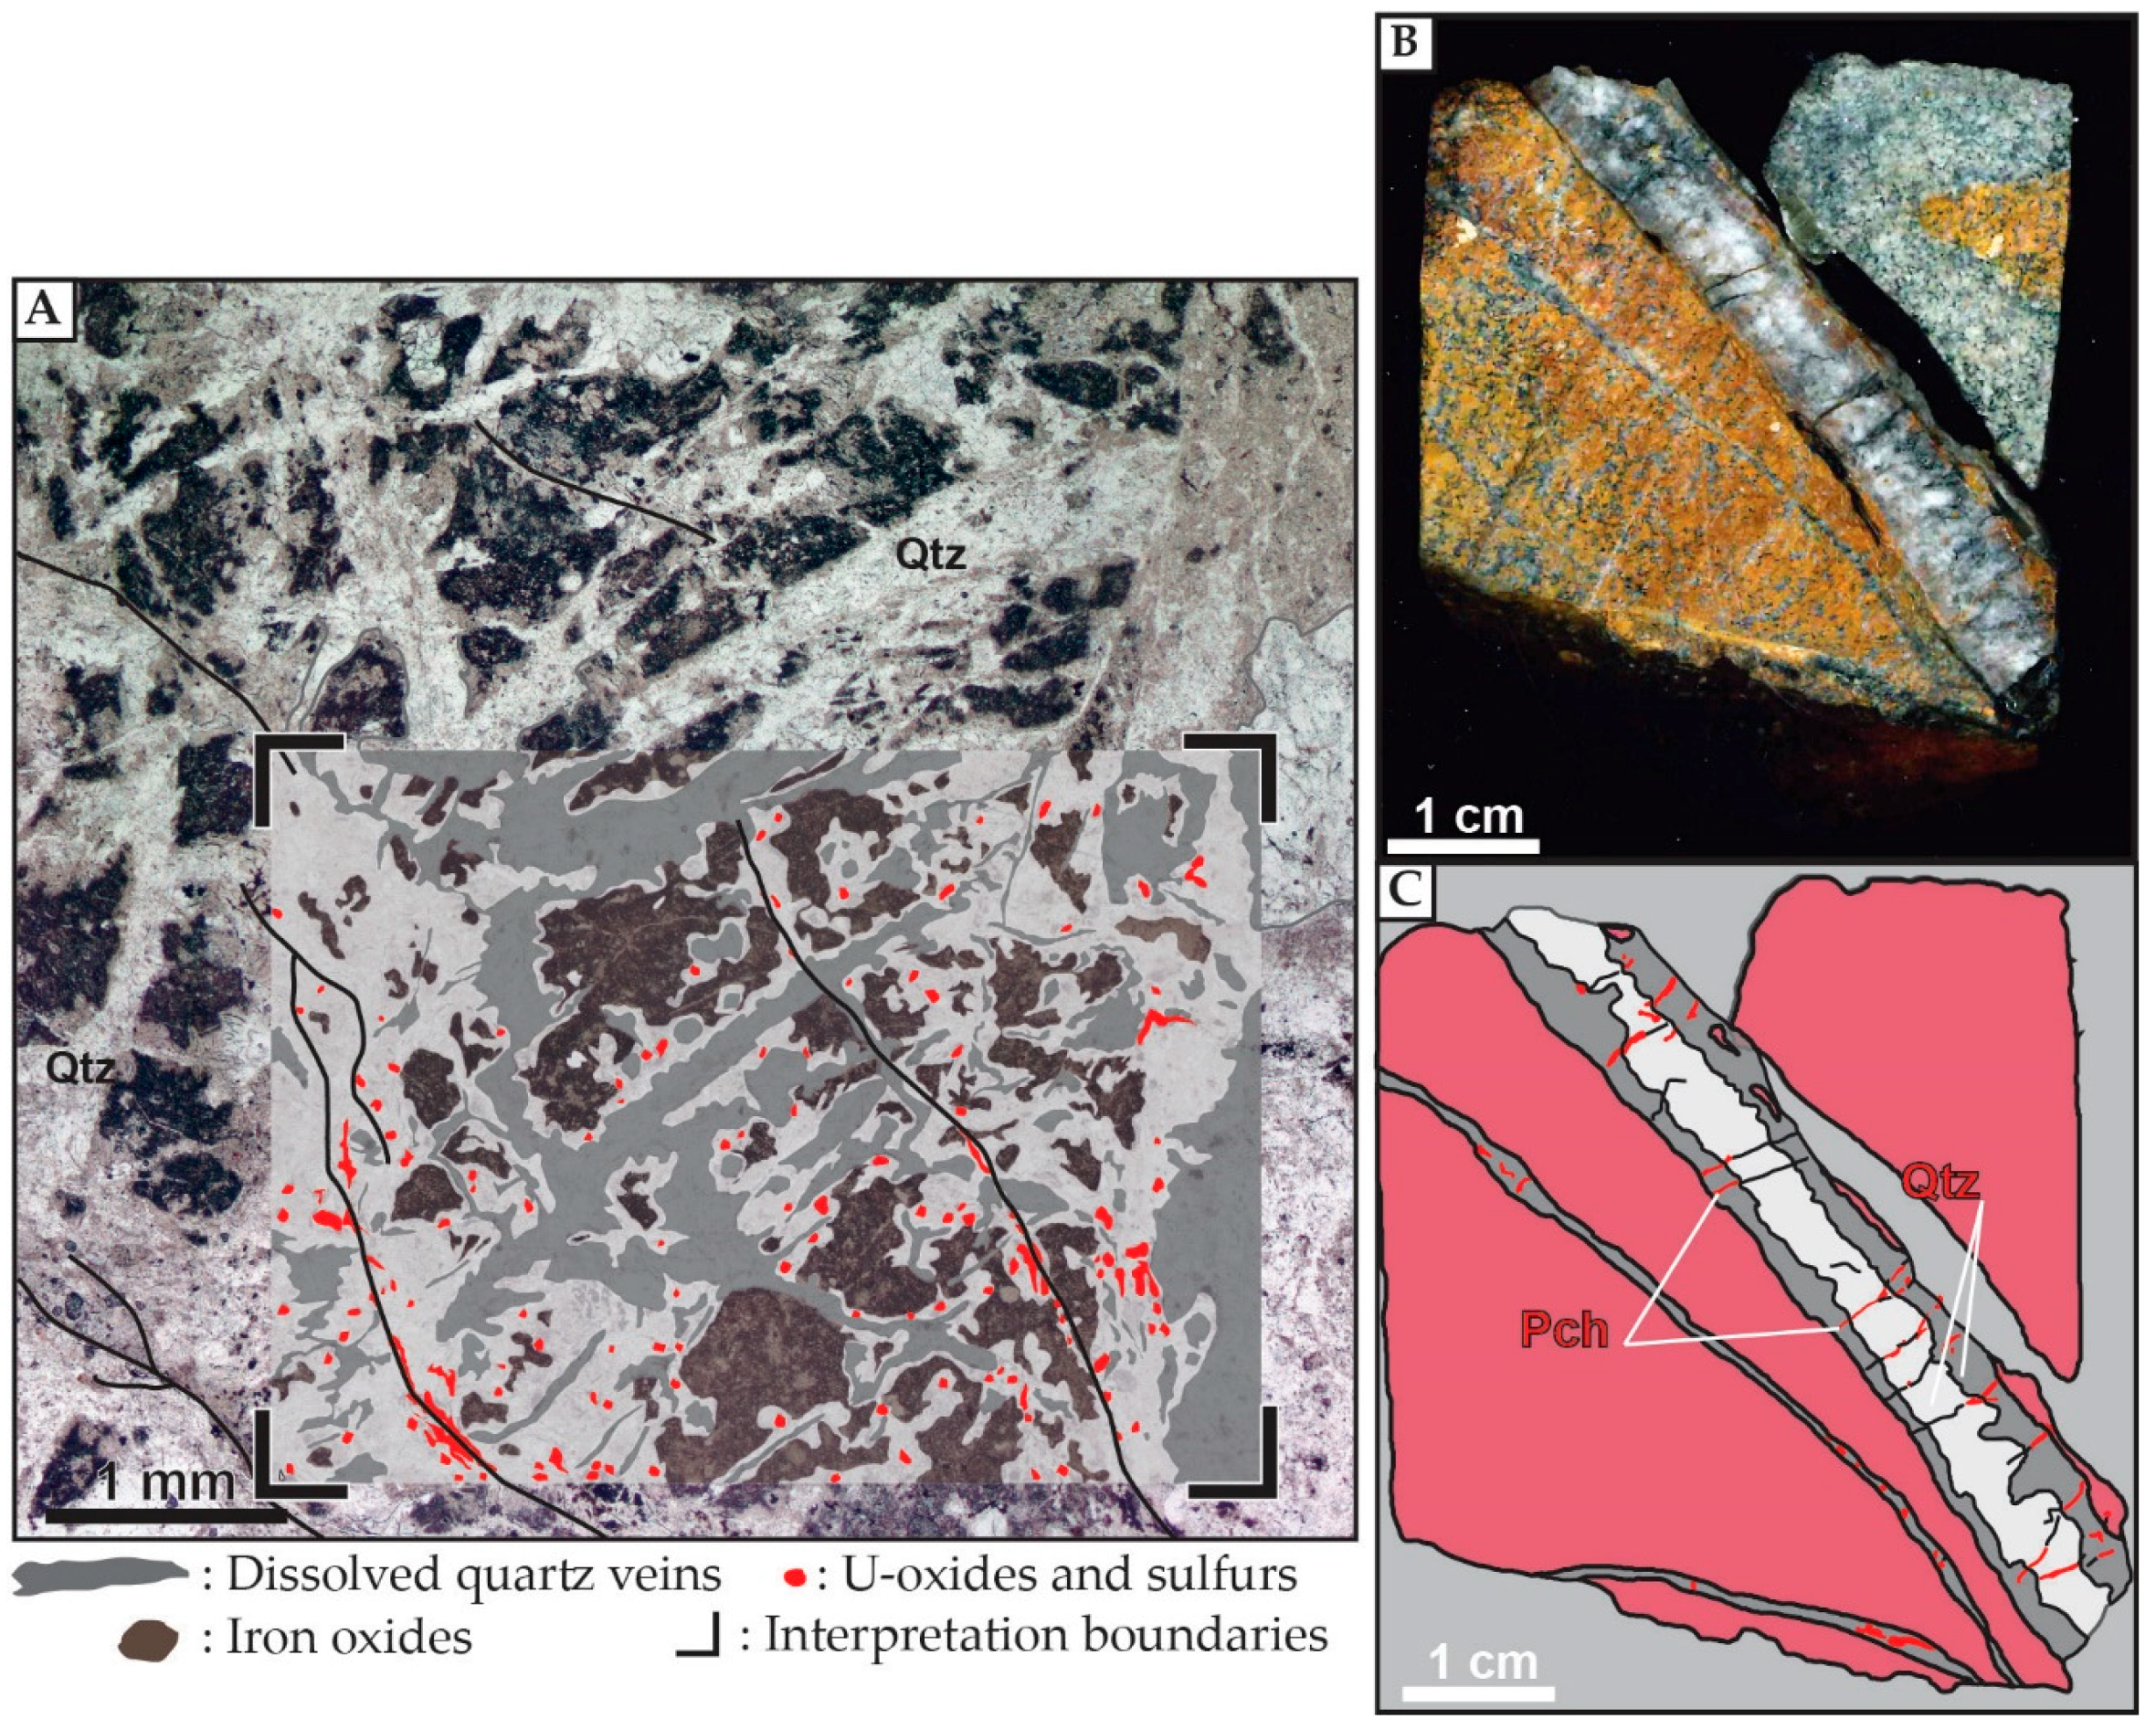
4.2. Microscopic-Scale Characteristics of the QB

Microscopic observations indicate that the pervasive hematization spatially associated with the QB is defined by disseminated micro-grains of hematite (aggregates of micrometric grains) and specular hematite (Figure 7A; specular hematite being less common in samples compared to hematite); possibly observed in banded veins synchronous with microcrystalline quartz (Figure 7B). Subhedral specular hematite (~100–200 µm) is observed filling quartz vugs and disseminated in the host rock. Where present, the specular hematite is responsible for the dark-red to purplish color of the oxidized host rock. Anhedral magnetite (50–100 µm) was locally observed as being mixed with (likely replaced by) hematite (Figure 7B) in banded quartz veins and likely represents changes in the oxidation state of the fluid. These observations, along with the spatial association of iron oxidation and quartz brecciation, support the overall synchronicity of the two phenomena. However, the precise timing of the oxidation, within the several episodes of silicification, remains unconstrained.
Microscopic observations also document a variety of quartz textures (Figure 7C–F for example), mutually crosscutting each other, and defining different conditions of quartz precipitation. The two most common types of quartz are: Euhedral quartz (comb quartz, ~200 µm in size) and microcrystalline quartz (~<50 µm). Two generations of euhedral white quartz can be distinguished: One (millimetric quartz) being characterized by dense arrays of monophase fluid inclusions (vapor rich), usually at the tip of the quartz crystal (Figure 7C); and the second, clearer, nearly fluid inclusions-free, usually observed as a late quartz generation (~100 µm, Figure 7D). In addition to the banded microcrystalline quartz-hematite texture, microcrystalline quartz is also observed filling vugs, and as conjugate “trends” (Figure 7E) in subhedral quartz veins. In other samples, subhedral quartz can be found as clasts in a microcrystalline quartz mass (Figure 7F). In term of quartz texture, comb quart, microcrystalline quartz and “moss” textures were observed (Figure 7G). Additionally, rare recrystallized bladed calcite were found (Figure 7H).
Quartz observed under cathodoluminescence display weak luminescence intensity, with a 20 s exposure time required in order to get enough signal for imaging. The most recurrent color observed under cathodoluminescence is a deep blue observed for microcrystalline quartz veins, sometimes synchronous with hematite (Figure 8A), and quartz cementing microbreccias. The fluid inclusion (FI)-rich euhedral quartz crystals exhibit alternating growth zones of brown and blue luminescence (oscillatory growth-zoning, Figure 8B). Clasts of euhedral quartz crystals are found within a blue luminescent quartz matrix (Figure 8C). The brown luminescence is also observed in breccias where the quartz has likely completely recrystallized, leaving the breccia texture only observable under cathodoluminescence; the “cement” of the breccia displays a brown luminescence (Figure 8D). These colors characterize the main generations of quartz in the QB.
The luminescence of the latest generation of quartz (i.e., euhedral quartz filling vugs and open fractures), is dark blue with rare concentric zoning. It also displays greenish luminescence associated with primary to pseudo-secondary fluid inclusions (Figure 8E). In terms of spatial occurrence of this quartz generation, it is more frequently observed in the vicinity of the QB than in its inner zone.
Quartz which was formerly in contact with uranium minerals displays a characteristic luminescence: Red/pink close to uranium-bearing minerals and yellow/greenish further from the uranium-bearing mineral (Figure 8F). This is especially well observed in quartz veins that were later microfractured as described by Grare et al. [31] and in quartz of the host rock (when not dissolved by circulation of the uranium-bearing fluid). This peculiar luminescence is brighter than the original luminescence of the quartz and displays a nearly uniform circular shape of 35–45 µm width (Figure 8F). The latest quartz generation, which fills vugs and open fractures, is characterized by dark blue luminescence with rare concentric zoning. This generation is observed more in the vicinity of the QB.

4.3. Geochemical Signature of Quartz

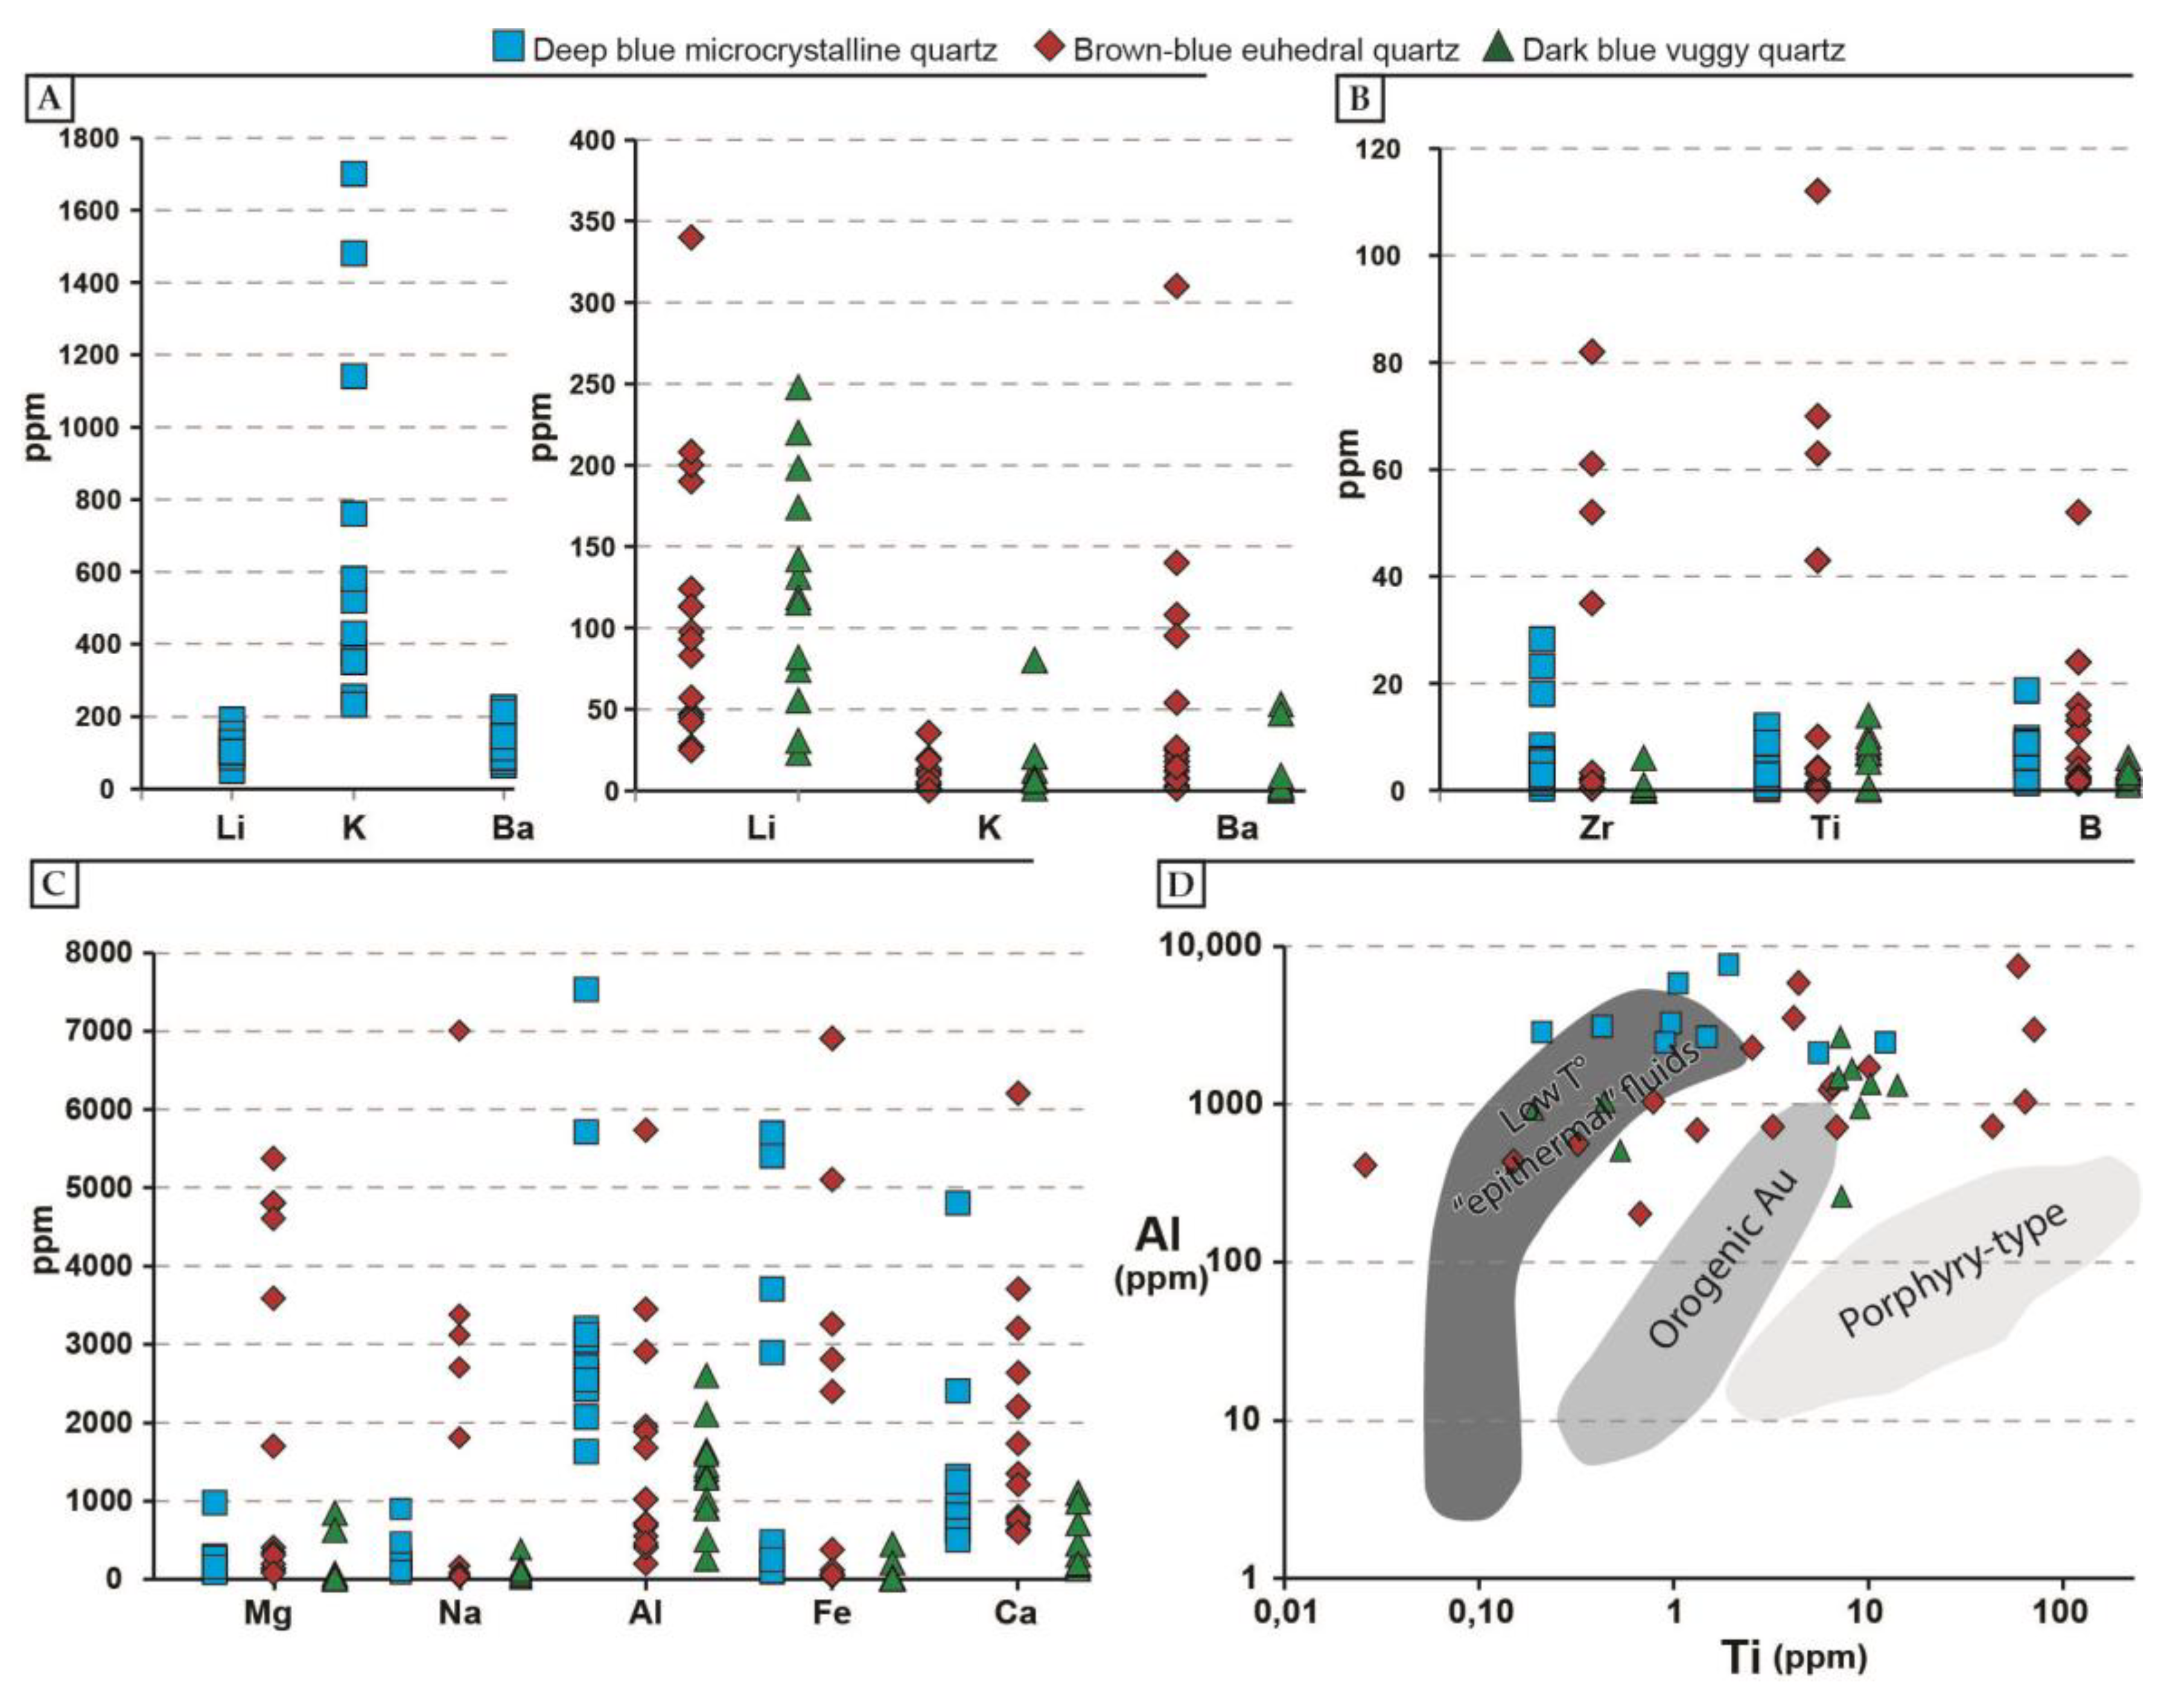
4.3.1. Trace Element Concentrations

Concentrations of selected elements were measured with LA-ICP-MS for the three main quartz generations (identified through microscopic texture and luminescence color): Deep blue microcrystalline quartz, blue euhedral quartz with brown concentric zoning, late dark blue euhedral vuggy quartz. Results are presented in Figure 9A for Li, K, and Ba; in Figure 9B for Zr, Ti, and B; in Figure 9C for Mg, Na, Al, Fe, and Ca. Several elements we tried to measure show values below the limit of detection and thus are not displayed here.
In some analyses, trace elements display extreme values above 10,000 ppm (e.g., Al or Mg, Figure 9) which likely represent analysis of undetected solid inclusions, hence are not displayed in Figure 9. The high Fe content in both the deep blue microcrystalline and brown-blue euhedral quartz could reflect the analysis of micro-inclusions of iron oxides, related to the pervasive hematization synchronous with the QB event. Microcrystalline quartz in banded veins associated with iron oxides shows a small range of values for all elements except for K and Fe. Brown-blue euhedral quartz displays bimodal concentrations for most of the elements consistent with observed concentric zoning. For all quartz generations, Li, K, and Na are positively correlated with Al. Dark blue vuggy quartz usually display a small range of values for most elements compared to other quartz generation, except for Li (23–248 ppm) and Al (255–2593 ppm).
Li contents are homogeneous between the three quartz generations and are below 250 ppm. Such values correlate positively with Al concentrations, Li balancing the replacement of Si by Al [61]. K is enriched in deep blue microcystalline quartz with values up to 1700 ppm, compared to concentrations below 100 ppm in the case of the two other quartz generations. Fe yields high values (up to 7000 ppm) in the case of the two quartz generations of the QB (deep blue microcrystalline and brown-blue euhedral quartz). B displays concentrations below 20 ppm except for 2 analysis. Concentrations in B are lower in the case of post-QB dark blue vuggy quartz.
Deep blue microcrystalline and dark blue vuggy quartz yield low values of Ti (<20 ppm for most measurements). Bi-modal concentrations of Ti were measured for brown-blue euhedral quartz, with one group of values below 20 ppm and the other above 40 ppm.

4.3.2. Oxygen Isotope Values

Oxygen isotopes were measured in the main quartz generations while paying attention to variations in luminescence, for instance for quartz displaying concentric zoning. Results are shown in Table 1. δ18Oquartz values are relatively homogeneous within one quartz generation (maximum variation of 5‰) and are independent of Cathodoluminescence (CL) color variations except for dark blue vuggy quartz: Zones of this quartz close to fluid inclusions display a green luminescence with higher δ18Oquartz.
The different quartz generation display different ranges of δ18Oquartz, with values ranging between +12‰ and +14‰ for microcrystalline quartz with hematite, between +7.5‰ and +9.3‰ for brown blue quartz and between +14.4‰ and +15.5‰ for druzy/vug-filling quartz. These ranges show two exceptions: Vug-filling euhedral quartz displaying green luminescence with higher isotopic values (from +16.2‰ to +21.9‰) in zones close to fluid inclusions (Figure 7C), and a microcrystalline quartz vein crosscutting the one cemented with microcrystalline quartz and iron-oxides exhibiting much higher isotopic values (from +18.8‰ to +23.9‰).
δ18Oquartz values between the two main generations of quartz in the QB are different with an average of +12.9‰ for banded microcrystalline quartz and +8.4‰ for zoned euhedral quartz.
δ18Oquartz and temperatures measured by fluid inclusion microthermometry in quartz veins in the area [26,29,62] were used to calculate the δ18Ofluid following the equation of Clayton et al. [63], set for measuring oxygen isotope exchange between quartz and water (assuming that the fluid was in equilibrium with the quartz at the temperature of mineralisation). We considered homogenisation temperatures in the range of 200–300 °C, avg. 250 °C (i.e., the range of temperatures revealed by low salinity fluid inclusions), to be representative for the quartz generations of the QB and of 100–200 °C, avg. 150 °C (i.e., the range of temperature revealed by high salinity fluid inclusions), to be representative for late druzy quartz probably precipitating from basinal brines [29]. However, a microthermometric study on primary fluid inclusions for each quartz generation is missing actually and would give a more accurate calculation of fluid isotopic values. Results are displayed in Table 1. The δ18Ofluid value range from 2.4‰ to 5.3‰ (+3.9‰ on average) for microcrystalline quartz associated with hematite. In contrast, late veinlets of micro-crystalline quartz display a much higher δ18Ofluid value: Between +11.5‰ and +14.8‰ (+12.4‰ on average). Brown-blue quartz precipitated from a fluid with a lighter δ18Ofluid value comprised between −1.6‰ and +0.3‰ (−0.6‰ on average). Late vug-filling euhedral quartz yield lighter isotopic values from −5.3‰ to −3.3‰ (−3.3‰ on average).

5. Interpretation of Results and Discussion

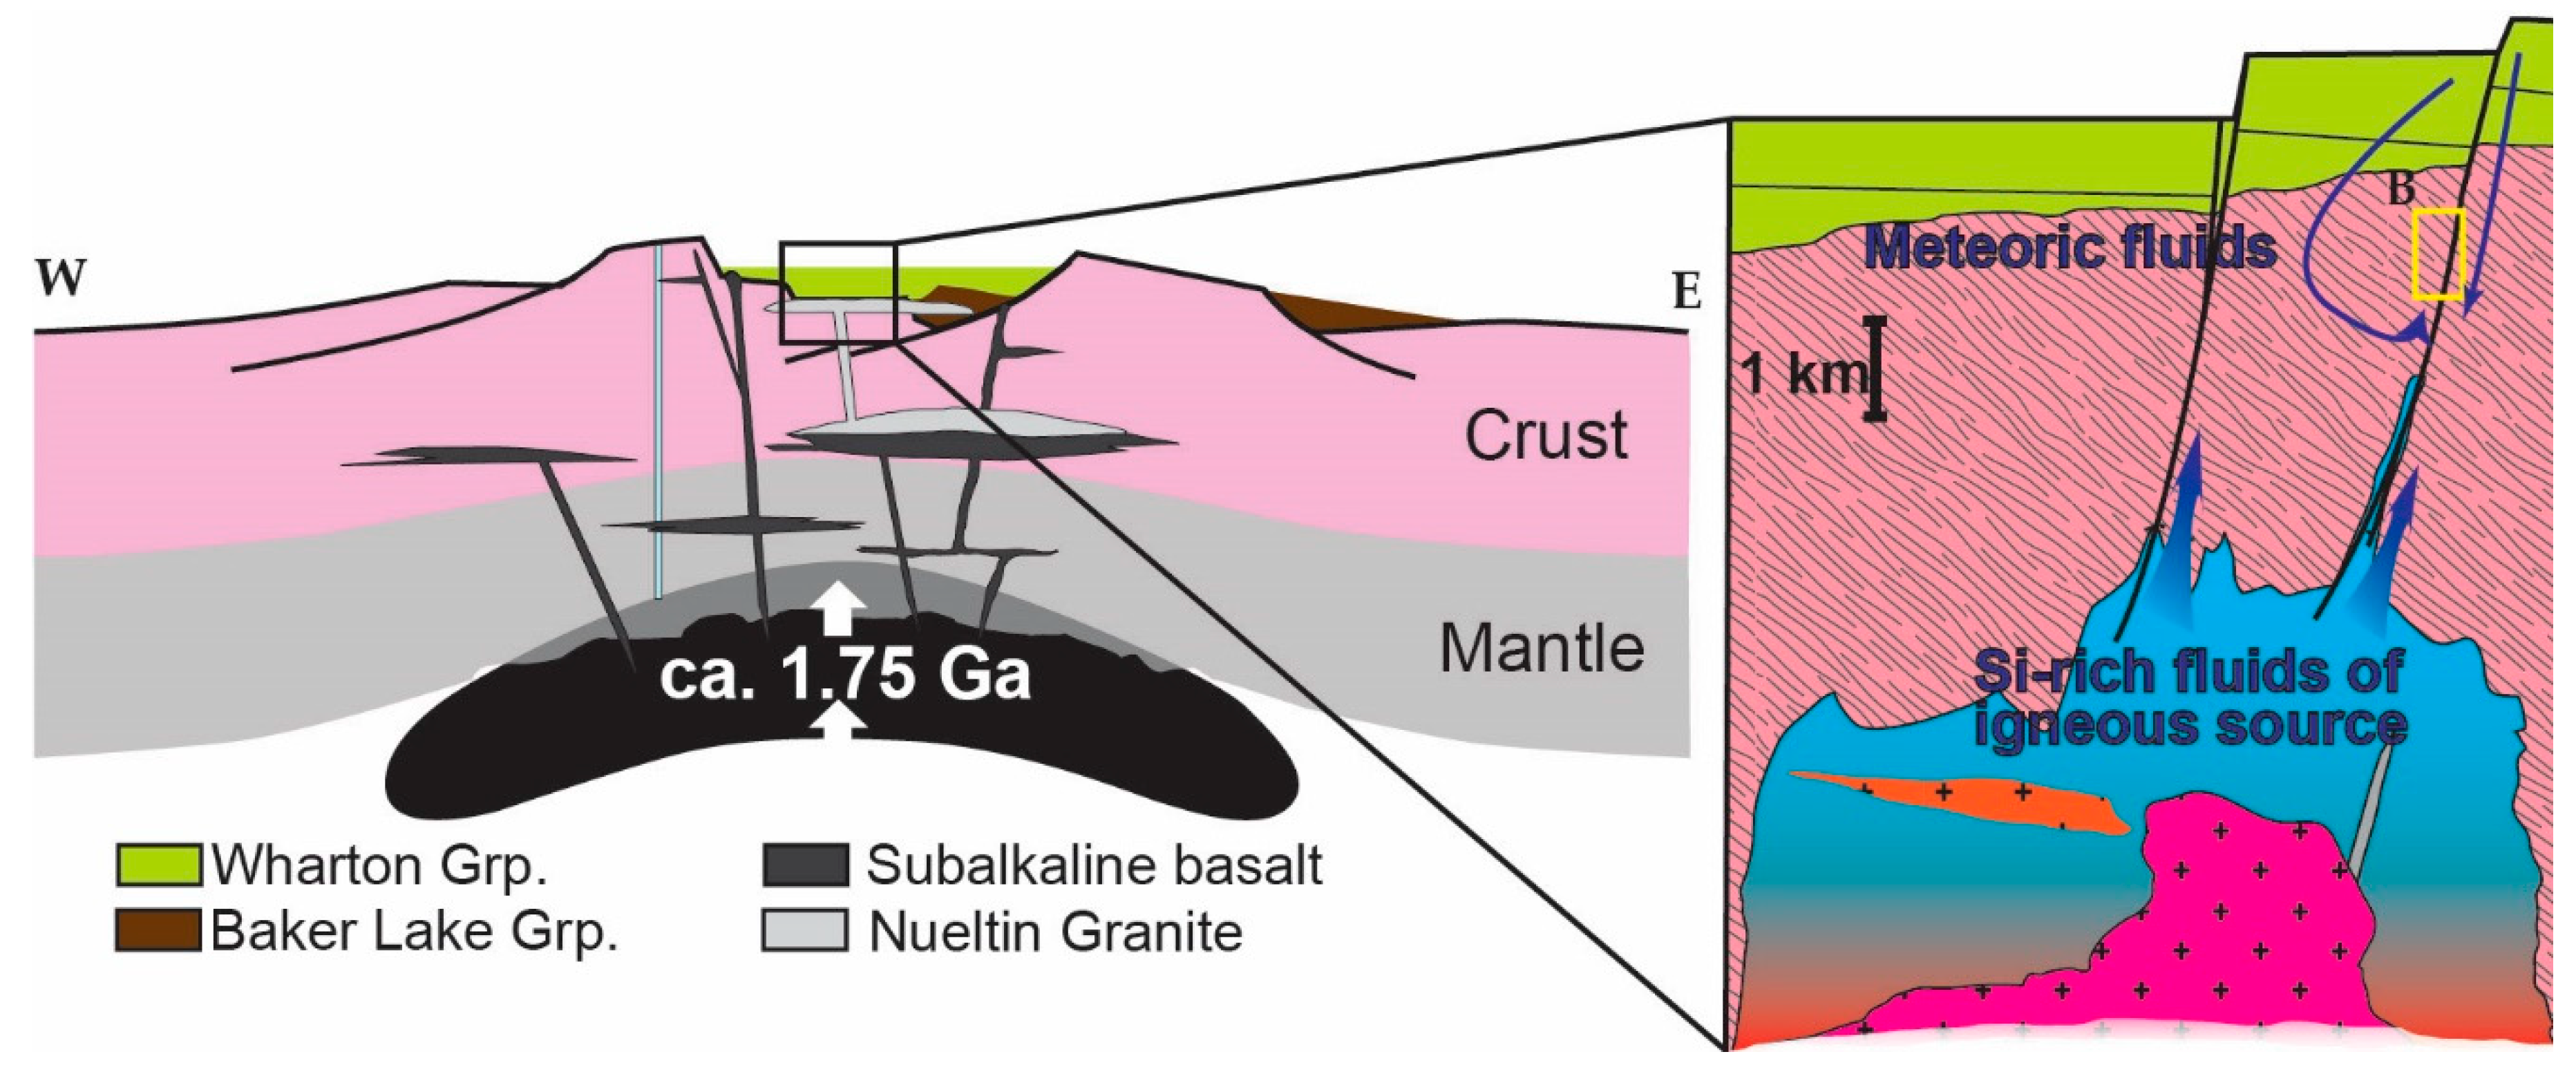
5.1. Origin and Nature of Silicifying Fluids

Although relations between most quartz trace elements and the conditions of quartz formation are not direct, recent studies suggest that the quartz trace element composition may be influenced by the rate of crystallization [64], pressure, temperature [65], and fluid composition [66,67]. Nevertheless, it has been shown that—like CL textures, colors and intensity—the concentrations of trace elements vary systematically among ore deposit types [67], and thus can be used to fingerprint the type of ore deposits. Combined with oxygen isotope signature, trace elements of quartz generations can be used to constrain the origin and nature of the fluids responsible for the formation of the QB.
Quartz analyses yield low but detectable (<20 ppm) values of Ti except for quartz with concentric zoning (>40 ppm). Additionally, all the quartz observed under cathodoluminescence display a weak luminescence. Several authors showed that Ti content in quartz is positively correlated with the fluid temperature and also with CL intensities [67,68,69], while Al is anti-correlated with CL intensity in most of low temperature deposits (e.g., [70]). Such Ti-T °C relationship can be used to directly estimate the temperature of the fluid in some specific case (i.e., the TitaniQ thermobarometer [71]).
Ti values for the QB indicate an overall temperature of formation below 350 °C [67], a value consistent with temperatures obtained from fluid inclusion microthermometric studies at the End and Andrew Lake deposit [26,27,28,29]. Concentric zoning with low and high Ti values (>40 ppm, characterizing higher temperature) could reflect cyclic episodes of circulation of >350 °C fluids, which would agree with concentric zoning and with the occurrence of dense trends of monophase vapor rich FIs at the tip of some growth zones (Figure 7B). Associated with the bi-modal concentration of Al [67], these observations support precipitation of quartz from a low temperature (<~350 °C) fluids, mixing cyclically with high temperature (>~350 °C) fluids.
The δ18Ofluid value of +3.9‰ in average for microcrystalline quartz associated with hematite points toward a magmatic origin (+5.5 to +10‰, although this may vary for a particular intrusion) for the high temperature fluids [72,73]. This is consistent with the presence of the KIS at the presumable time of emplacement of the QB (ca. 1750 Ma [46]). Moreover, oxygen isotopic values for the main quartz generations of the QB are comparable to those obtained for quartz veins at the nearby Mallery lake epithermal (low-sulfidation) deposit by Turner et al. [62]. The Mallery lake deposit displays similar quartz brecciation formed at the time of emplacement of the KIS (ca. 1.75 Ga). In contrast, brown-blue quartz precipitated from a fluid with a lighter δ18Ofluid value of −0.62‰ in average, which could represent mixing between the magmatic derived fluids and a meteoric fluid: The δ18Ofluid value of meteoric fluids at the latitude of the Kiggavik area at this time would have been ~−13‰ [74]. Such interpretation is consistent with the bi-modal distribution of Ti concentrations for this quartz generation but also with the differences in concentrations for different trace elements between the two quartz within the QB. This phenomenon is more easily explained by a fluid mixing rather by changes in temperature for a same fluid (which could explained only the difference in δ18O values). The two quartz generations have clearly different δ18O values as the internal precision of the SIMS measurements is <0.1‰. The observation of hematite surrounding magnetite in some microcrystalline banded vein further supports an input of fluids with different redox signatures in the system.
Higher values of δ18Ofluid (~12.9‰) for microcrystalline quartz (another generation within the same sample) could suggest a stronger input of magmatic fluids, which is however unsupported by Ti values for this quartz generation. This apparent discrepancy could be explained by cooling of the fluid before quartz precipitation. Contrasting δ18Ofluid values between similar quartz generation in the same samples (2 generations of microcrystalline quartz, deciphered on the basis of δ18Ofluid) could be explained by a local effect of rock buffering within breccia cavity. As a result, veinlets would have formed from an isotopically isolated fluid reservoir, thus yielding higher δ18Oquartz values.
Cathodoluminescence observations support the above interpretations, as blue-purple quartz luminescence is commonly found in quartz precipitated in magmatic/hydrothermal environments [75] while brown luminescence is rather observed in sedimentary-diagenetic (i.e., lower temperature) environments [76]).
The very low B content of the post-QB dark blue vuggy quartz could be explained by co-crystallization of other minerals enriched in B in the uranium deposits of the Kiggavik area; such as magnesiofoitite (dravite), which is commonly observed in environments seeing brine circulations [77]. Accordingly, the isotopic values for vug-filling euhedral quartz (post-QB) are consistent with those obtained for quartz precipitated from relatively low temperature (~150 °C) brines in the Proterozoic Athabasca [78] and Kombolgie basins [79,80] and linked to the formation of U deposits. Considering that the QB predates the formation of the Thelon Basin, from which brines are likely derived, this supports that brines circulated after the emplacement of the QB, in agreement with the findings of Grare et al. [31]. In the Kiggavik area, the fluid inclusion studies by Pagel [26] on the hydrothermal quartz, at Andrew Lake, and by Chi et al. [29] on the hydrothermal quartz, at End, are in agreement with our observations. Indeed, these authors documented low temperature (100–200 °C)-high salinity (25–38 wt % NaCl) fluids, low temperature (150–200 °C)-low salinity (<9 wt % NaCl) fluids, and high temperature (200–300 °C)-low salinity (<9 wt % NaCl) fluids within the QB. Our study indicates that low-T °C/high salinity fluids (brines) circulated after formation of the QB, while the high-T °C/low salinity fluids are more characteristic of the QB that formed earlier in the history of the Kiggavik area.
Using data from several deposits type, it has been shown that deposits linked to low (Mississippy Valley type, Carlin, Epithermal) and high (porphyry Cu-Au) fluid temperatures can be distinguished one from another based on Al and Ti concentrations in quartz associated with orebodies [60]. Figure 9D plots Al-Ti concentrations for the main quartz generations in our study. The epithermal domain of Figure 9D was built after data from low temperature (~100–350 °C) hydrothermal fluids. The distribution is scattered even within one quartz generation (e.g., deep blue microcrystalline). Primary (comb quartz) and secondary (“moss” quartz) textures [81,82] indicate primary quartz deposition and recrystallization. Bobis [83] also attributed the rounded shapes of the moss texture to recrystallisation of silica gel, which preserved the original structure and impurities of the silicate phase. These quartz textures, along with recrystallized bladed calcite, also characterize phases of silica precipitation by boiling and non-boiling hydrothermal fluids in a geothermal/epithermal system [84]. Some textures observed within the QB are typical of epithermal deposits, but they are rare. Commonly encountered precious metals (e.g., Au, Ag) are lacking within the breccia even though they were observed at the nearby Mallery Lake deposit [62]. However, such environment of formation is consistent with the geochemical signature of quartz in the QB and is much more plausible for the formation of the QB than orogenic Au and porphyric deposits.
To sum up, even though it is difficult to be truly conclusive with the measured trace elements concentrations only, the combination of these data with oxygen isotope values and quartz textures points toward a scenario in which high (magmatic-derived) and low (meteoric-derived) temperature fluids interacted and mixed during silicification of the fault zone that led to the formation of the QB. The important volumes of Si would have been provided by intrusive bodies of the KIS emplaced at depth and related to the rift-related extensional tectonics that occurred at ca. 1750 Ma (Figure 10).

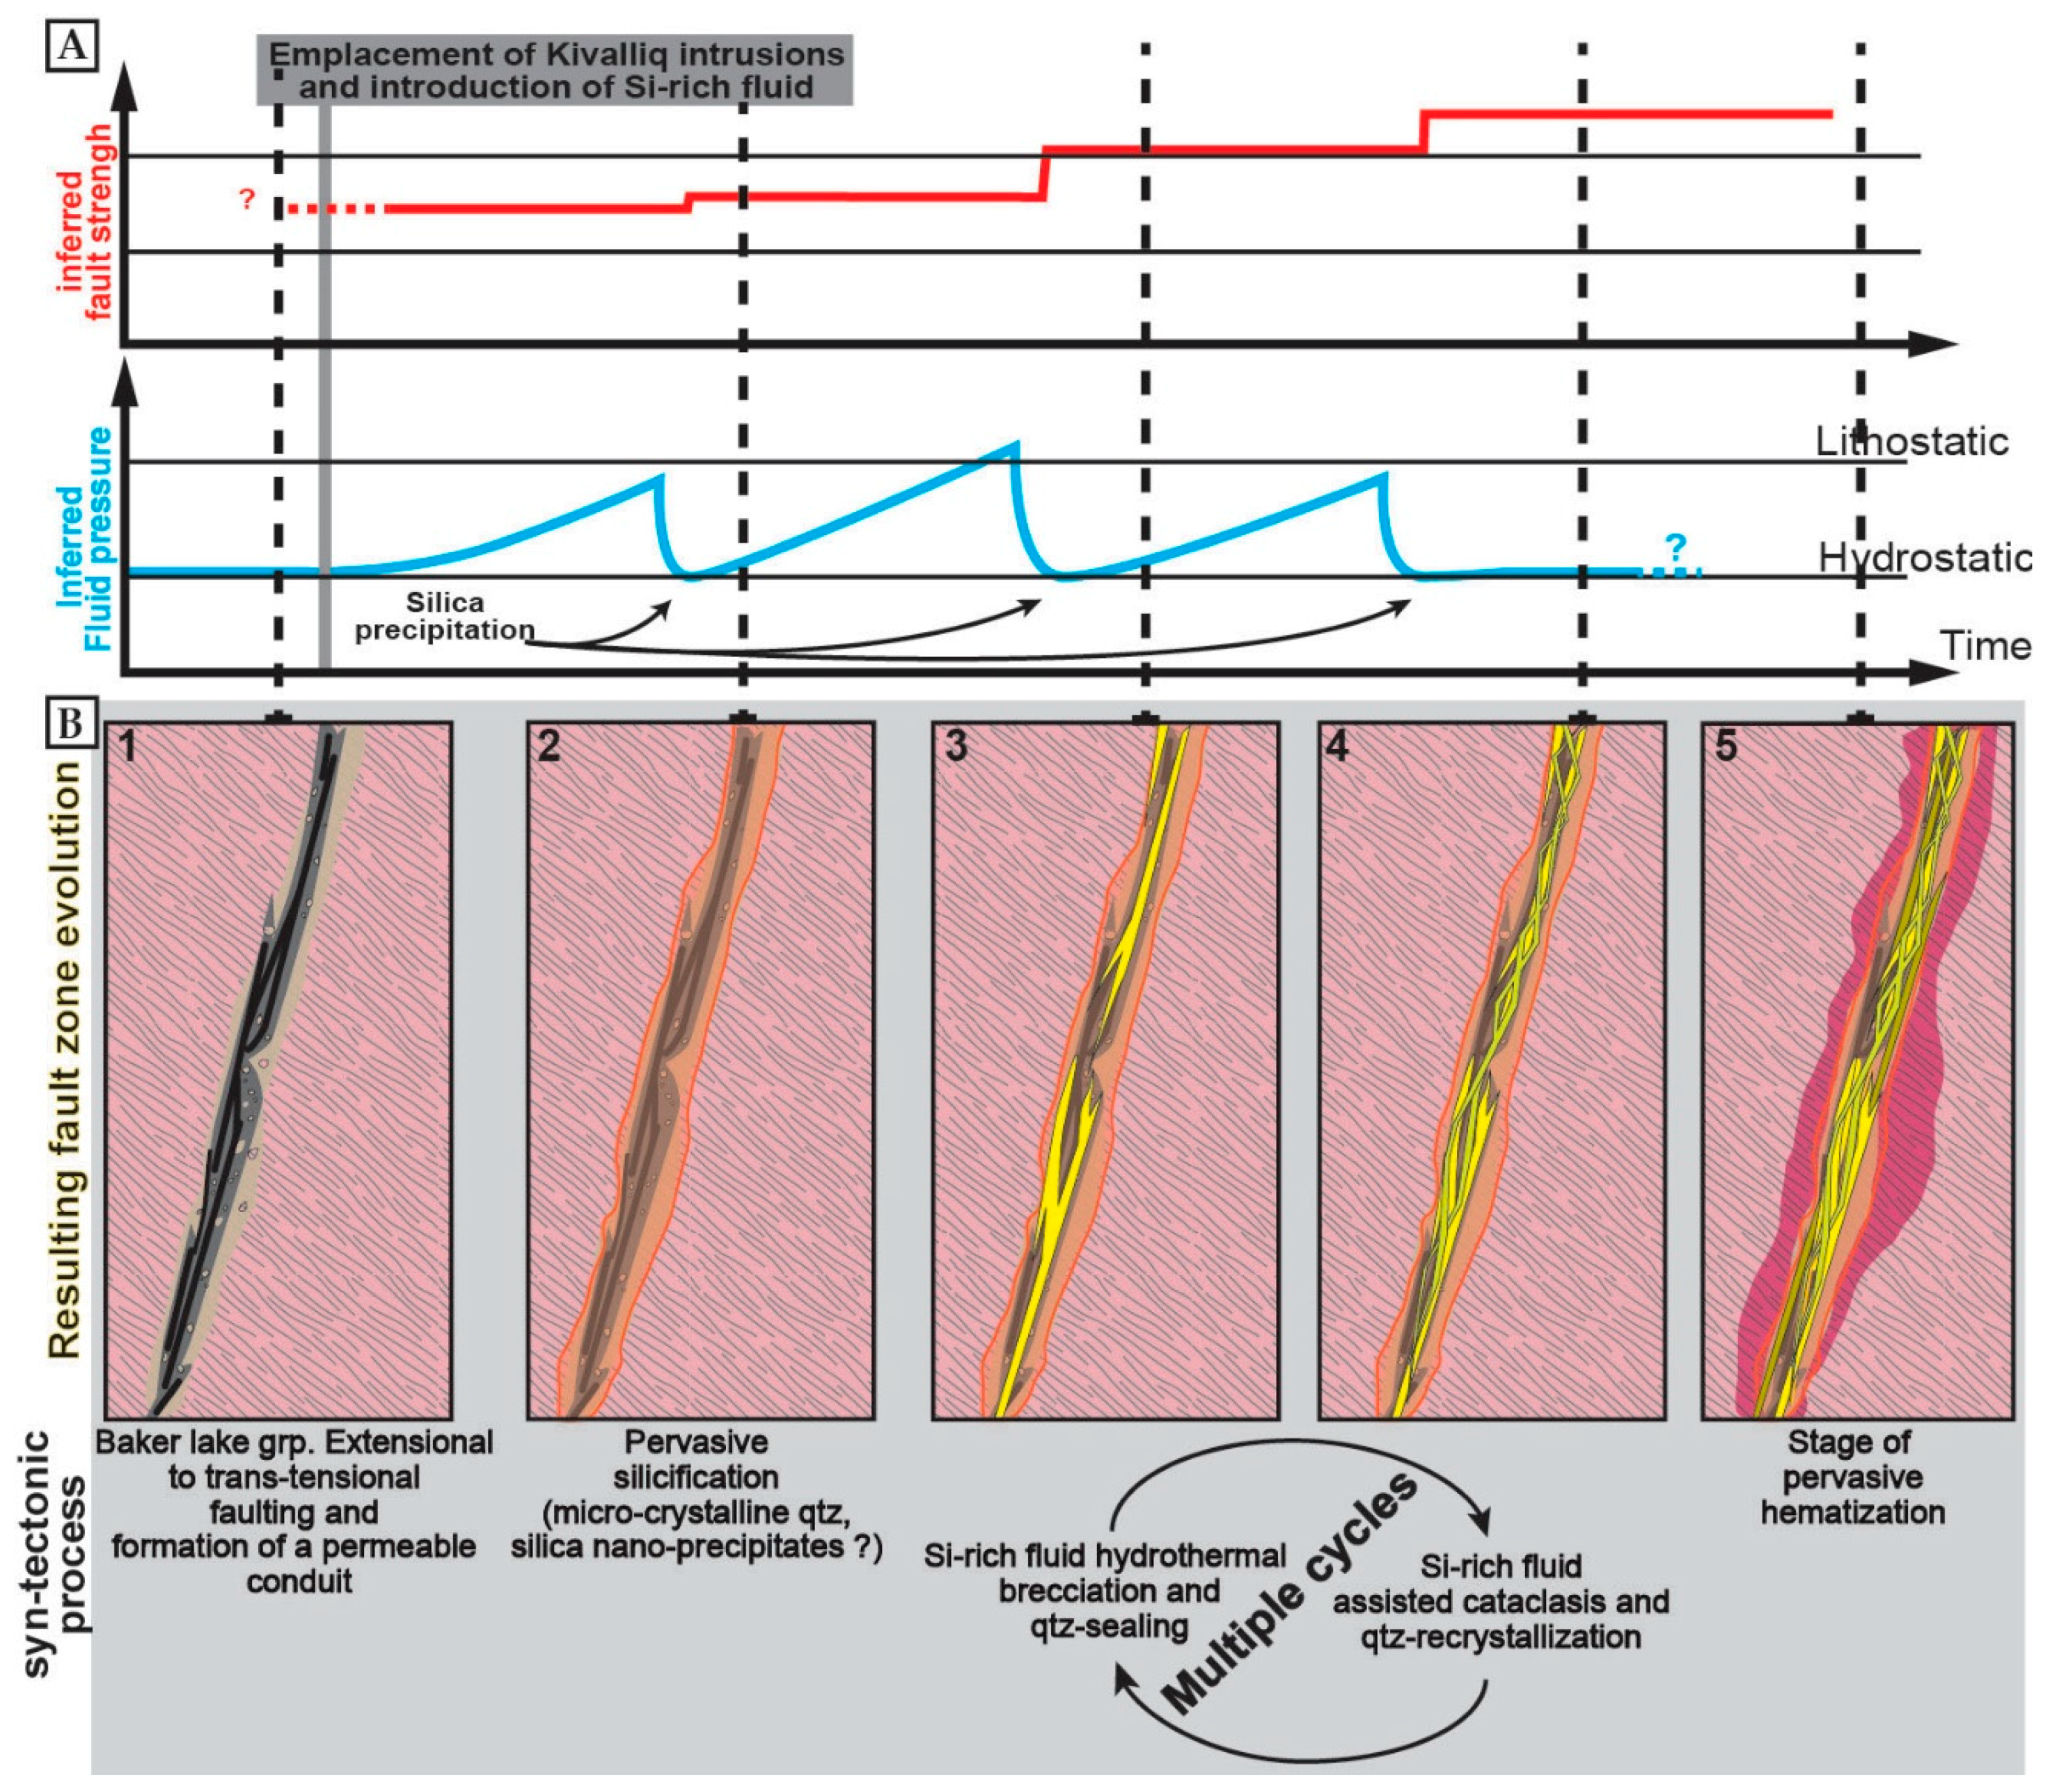
5.2. Fault Zone Processes Leading to the Formation of the QB: Cataclasis, Silicification and Hydraulic Brecciation

Macroscopic observations of the QB and petrographic and textural observations on quartz, although lacking a simple and clear chronology of events, provide additional constraints on the processes behind its formation. Before emplacement of quartz cemented veins and breccias, the superimposition of multiple generations of cataclasites indicates that a localized zone of deformation was repeatedly reactivated during progressive deformation. The presence of microcrystalline quartz in clasts generated before emplacement of quartz veins show that the pervasive silicification of the fault zone was a syn-tectonic process. Regarding quartz-cemented fractures, the common macroscopic textural observation of quartz cemented breccia with angular fragments and jigsaw pattern indicates hydraulic brecciation [14] of the host rock. The pervasive silicification of the fault zone was a first step (Figure 11A,B) before emplacement of the quartz veins and breccias of the QB: It likely triggered fluid pressure build up in the fault zone leading to hydraulic brecciation of the host rock, hence to the “building” of the so-called QB.
The complex patchwork of quartz textures observed under optical microscope shows a still more complex pattern under cathodoluminescence, but highlights several events of quartz fracturing (reworked quartz clasts) and recrystallization. The white quartz mass which displays fine-grained subhedral quartz crystals also shows in some locations numerous fragments of earlier aggregates. The conjugate trends of microcrystalline quartz likely reflect shearing in the quartz mass and synchronous quartz recrystallization. A better evidence for such fracturing and synchronous quartz crystallization is provided by white quartz veins in which euhedral quartz grains are surrounded by microcrystalline quartz and other quartz of heterogeneous sizes (Figure 7F). We interpret this as cataclasis and tectonic comminution (i.e., fracture propagation and wear abrasion) of previously formed quartz mass and recrystallization of quartz (i.e., syn-tectonic). This process differs from the formation of sub-horizontal quartz veins and hydraulic breccias related to transient fluid overpressurization followed by fluid pressure drop and quartz precipitation [21].
To summarize, textures and crosscutting relationships of quartz cements reveal the following sequence of events: (1) Episodes of brittle faulting and cataclasis, before silicification and quartz-brecciation; (2) pervasive silicification of the fault zones (beginning of the QB event); and (3) episodes of brittle fracturing synchronous with the circulation of silica-rich fluids (QB event). During this last event, there were stages of hydrothermal hydraulic brecciation with slow and rapid silica precipitation in relation to boiling of magmatic and/or meteoric fluids (trace elements and δ18O data inconclusive). This boiling process is supported by the monophase fluid inclusions within the quartz generations of the QB. The presence of 100% of monophase vapor inclusions can be only explained by a boiling process, affecting either magmatic fluids (with a spatial separation between vapor and brines) or meteoric fluids heated due to emplacement of a magmatic intrusion at low depth at ca. 1750 Ma. Boiling process can be marked in other geological environments by the presence of monophase vapor fluid inclusions spatially associated with multiphase and of relatively high-salinity brines due to demixion of the magmatic fluids. The absence of two-phase fluid inclusion in the observed samples of the QB could indicate that the vapor migrated farther than the magmatic brines. The hydraulic brecciation alternated with stages of fluid-assisted cataclasis and quartz recrystallization (Figure 11A). Arrays of monophase fluid inclusions (vapor-rich) also indicate abrupt pressure drops following rupture of the “seal” of the system [78]. The so-called QB therefore appears to be a composite structural feature much more complex than previously thought, which consists of a mass of quartz emplaced by alternating quartz healed hydraulic brecciation and tectonic-induced cataclasis with synchronous quartz recrystallization during fault zone reactivation.
Intense multi-episodic hydraulic brecciation of the early fault zone at the time of QB formation would have occurred during the interaction of two isotopically distinct fluids: Meteoric water, mixed with a magmatic-derived fluid. The processes of faulting/fracturing discussed in this section, that led to the formation of the QB, likely occurred at shallow depth (~2 km, [29]) and, looking at relative chronology and geochemical constraints, were likely initiated by the emplacement of the KIS (Figure 10). To a first glance, the fluid temperature of ~350 °C is not easy to reconcile with this shallow depth even if considering an abnormal thermal gradient related to the emplacement of the Kivalliq intrusions. We infer that hydrothermal fluids originated at a greater depth (about 5 km, which may indicate a 70°/km geothermal gradient), and flowed upward sufficiently fast to prevent any significant cooling before they mixed with downward-moving meteoric fluids and precipitated the quartz generations of the QB in thermal disequilibrium with the hosting basement rocks. Interestingly, such a quartz cemented breccia and its complex spatial organization are similar to the meter-thick hydrothermal quartz breccia related to the emplacement of an igneous intrusion described by Tanner et al. [85] in Scotland.
We therefore propose a conceptual tectono-hydrological model for the QB formation involving mixing of deep silica-rich fluids of igneous origin with downward-moving meteoric fluids. The possible mechanisms allowing for such meteoric fluid downward flow in fault zones are either active seismic pumping or passive meteoric infiltration throughout a permeable fault zone. We favor a mechanism of syn-tectonic seismic pumping because beside the formation of quartz-filled fractures, the intrinsic low permeability of the unaltered basement rock surrounding the fault zone and the impermeabilization of the fault zone—including its damage zone—through multiple silicification events presumably make a simple, gravity-driven downflow of meteoric fluids difficult, hence unlikely. Fluid pressure built up at depth through the input of meteoric fluids and magmatic-derived fluids together with likely pore cementation of basement rocks (that decreased porosity). Fluid mixed and flowed upward to higher crustal levels along the fault zones which served as conduits (Figure 10 and Figure 11). This upward flow likely occurred cyclically as the fluid pressure evolved between hydrostatic and supralithostatic (Figure 11A), depending, among other factors, on the sealing effectivity of the reactivated fault zone by quartz precipitation [86]. In turn, fluid pressure increased during the QB event also likely favored multiple reactivations of the high angle fault zone under the regional stress field.

5.3. Evolution of the Fault Zone Properties though Time and Structural Control on Later Uranium Mineralization

The QB is found along many segments of the main fault (Figure 1C) trends, and uranium orebodies are systematically spatially associated with more or less thick bodies of QB along these fault zones. Even though a systematical study of QB thickness could not be undertaken throughout the area, the QB was observed as being usually thinner where it is not associated with uranium mineralization, which implies a possible control on later uranium mineralization by the thickness of the QB in fault zones.
Cataclastic fault rocks formed before the QB should have displayed an initial high porosity, but after pervasive silicification they likely ended with a low porosity comparable to that of the fresh basement rocks, unlike strongly clay altered and fractured samples (Figure 6). Since the evolution of the porosity can be to some extent directly linked to the evolution of permeability since it is controlled by fracturing and mineralogical destabilization/dissolution, we can safely infer that these multiple events of pervasive silicification, faulting/fracturing and quartz cementation caused the destruction of the porosity (hence of the permeability) and thus directly impacted the fluid circulation within the conduit.
At all deposits and prospects in Kiggavik, three main fracturing events postdate emplacement of the QB (two stages of faulting/fracturing and uranium mineralization and one stage of faulting and strong clay alteration [31]). The distribution of fractures and mineralization in some drill holes intersecting uranium orebodies in the vicinity of the QB is shown in Figure 12A for Contact, End, Bong and Andrew Lake. Post-QB fracturing and uranium mineralization are clearly restricted to the hanging wall of the QB in Contact, where the thickness of the breccia is far greater compared to the earlier silicified fault zone. At End, Andrew Lake and Bong, post-QB fracturing and uranium mineralization are observed in both the hanging wall and the footwall, but still not within the QB (inner zone). In the case of End, the QB displays lateral variations in thickness comparable—even less important—to what is observed at Contact. This distribution indicates that post-QB fracturing was preferentially localized in the hanging-wall and/or in the footwall of the QB, along its contact with the host rocks, while most of the QB (core zone) remained poorly fractured.
A significant amount of quartz veins (Figure 12B) were observed up to the top of drill holes, i.e., in the transition from the outer zone of the QB to the host rock. Such quartz veins are typically re-opened and were also used as pathways for uranium bearing fluids at the first stage of uranium mineralization [31]. Ore minerals are observed along the vein boundaries (Figure 13A) and cementing orthogonal microfractures (Figure 13B,C; see also Chi et al. [29]). Quartz with uranium-oxides in their vicinity display specific luminescence which has been described in many places worldwide [87,88,89,90]; it has been explained by the destabilization of the crystal lattice by radiation damages (due to liberation of alpha particles through U238 decay series).
This change of the luminescence, together with the fact that the micro-fractures cemented with uranium minerals crosscut several generations of quartz, show that formation of the QB and deposition of uranium bearing minerals are two distinctive events, supporting isotope data on dark blue vuggy quartz. Uranium minerals and associated specific luminescence are only observed in the vicinity of the QB. Vuggy quartz precipitated from basinal brines (potentially U-bearing; [29]) are observed mainly in the outer zone and in the vicinity of the QB and further demonstrate the barrier role played by the QB in fluid flow partitioning. These observations suggest that the QB behaved as a rigid and hard body compared to the weaker host rocks, so that later deformation preferentially localized in the host rocks along the contact with the strong QB body.
Quartz veins in the outer zone of the QB form a network that, when microfractured, helped focusing mineralizing fluid flow—thus creating local traps for uranium deposition. Post QB fractures located in its vicinity acted as preferential pathways parallel to the QB for later, uranium-rich brines, leading to deposition of uranium ore bodies at ca. 1500–1300 Ma for main stages [28,29,30]. To conclude, the silicification processes ultimately led to the building of a complex quartz-cemented breccia body, up to tens of meters thick, acting as a transverse hydraulic barrier depending on the vertical and lateral variations in thickness and the degree of quartz cementation. As a result, the distribution of mineralization in the Kiggavik area was heavily controlled—at different scales—by the mechanical and hydraulic properties of the reactivated pre-existing fault zones where the QB was emplaced. The QB behaved as a mechanically strong, transverse hydraulic barrier, that localized later fracturing and compartmentalized/channelized vertical flow of uranium-bearing fluids, hence orebodies (Figure 12C) in its hanging-wall and/or footwall during fault zone reactivation.
Even if the 3D architecture is not perfectly constrained, and would deserve proper 3D geometrical and kinematic modelling, we could expect that relays within the QB, vertical and horizontal variations in thickness, and overlap between QB bodies would likely influence fluid flow properties (e.g., fluid velocity)—hence would impact uranium deposition rate [91]. The quartz breccia in the Kiggavik area seems to be a good example of the “physical seal” developed by McCuaig and Hronsky [92] in their mineral system concept, in conjunction with other factors to generate ore in a considered area.

6. Conclusions

Based on a structural analysis combined with vein cement petrography, trace elements, and oxygen stable isotope analysis of quartz, we constrain the nature, emplacement and significance of the QB which strongly controlled the location of uranium deposits in the Kiggavik area (Nunavut, Canada). The formation of the breccia bodies appears to be linked to fluctuations in pressure, temperature and compositions of fluids during tectonic reactivation of the fault zones along which the QB was emplaced. Faults formed during syn- to post-orogenic rifting processes and formation of the Baker Lake basin (ca. 1850–1750 Ma) were subsequently reactivated, and cycles of underwent pervasive silicification, hydraulic brecciation, and quartz recrystallization linked to cataclasis. This was associated with the circulation of meteoric-derived fluids mixing with Si-rich magmatic-derived fluids at depth. This is interpreted to be linked to the emplacement of the KIS at ca. 1750 Ma.
Post-QB fracturing at 1500–1300 Ma was constrained in the hanging wall and footwall of the QB, with flow of basin-derived brines being channeled along the fault zones where QB emplaced. The network of quartz veins in the vicinity of the QB was a favorable pathway for circulation of these uranium-rich fluids and related uranium precipitation, as they were re-opened and micro-fractured. Thus, the QB bodies likely exerted a major structural and hydrological control on the formation of significant uranium orebodies in the Kiggavik area. Beyond regional implications, this study demonstrates how an unconventional trap was built in impermeable Archean basement rocks. It also emphasizes the importance of the spatial organization, and long-term evolution of fault zones in the location of uranium orebodies of economic interest.

Author Contributions

A.G. and O.L. conceptualized both the study and the final model and wrote the original draft. J.M., A.B., A.T., P.L., J.R. reviewed and edited the draft. A.G. performed macro to micro-scale petrographic and microstructural characterization; A.G. and A.T. performed cathodoluminescence microscopy; A.G. and J.M. performed trace elements and isotopes analyses and their interpretation. P.L. and J.R. gave their validation. Funding acquisition and project administration were performed by A.B. and P.L., and geochemical analyses were funded by O.L. and J.M.

Funding

This research was funded by Orano Canada and the laboratory ISTeP.

Acknowledgments

The authors thank ORANO and ORANO Canada for the full financial support and access to the Kiggavik camp and exploration data. Special thanks to geologists R. Zerff, R. Hutchinson, K. Martin, and D. Hrabok for their help and enriching discussions during field work. The authors also want to acknowledge the first exploration geologists (Cogema and/or Orano) that worked on, and developed preliminary concepts on the quartz breccia in the Kiggavik area: D. Baudemont, N. Flotte, J.-L. Feybesse, J.-L. Lescuyer. The authors thank The SIMS team of the CRPG (Vandoeuvre-lès-Nancy, France) for their assistance in measuring the O isotopic composition of the quartz by SIMS. Special thanks to A. Pêtre for his thoughtful comments.

Conflicts of Interest

The authors declare no conflict of interest. The founding sponsors had no role in the design of the study; in the collection, analyses, or interpretation of data; in the writing of the manuscript, and in the decision to publish the results”.

References

  1. Sibson, R.H.; Robert, F.; Poulsen, K.H. High-angle reverse faults, fluid-pressure cycling, and mesothermal gold-quartz deposits. Geology 1988, 16, 551–555. [Google Scholar] [CrossRef]
  2. Blundell, D.J.; Karnkowski, P.H.; Alderton, D.H.M.; Oszczepalski, S.; Kucha, H. Copper mineralization of the polish Kupferschierfer: A proposed basement fault-fracture system of fluid flow. Econ. Geol. 2003, 98, 1487–1495. [Google Scholar] [CrossRef]
  3. Micklethwaite, S.; Cox, S.F. Fault-segment rupture, aftershock-zone fluid flow, and mineralization. Geology 2004, 32, 813–816. [Google Scholar] [CrossRef]
  4. Cox, S.F. Coupling between deformation, fluid pressures, and fluid flow in ore-producing hydrothermal systems at depth in the crust. Econ. Geol. 2005, 100th Anniv. Vol, 39–75. [Google Scholar] [CrossRef]
  5. Muchez, P.; Heijlen, W.; Banks, D.; Blundell, D.; Boni, M.; Grandia, F. 7: Extensional tectonics and the timing and formation of basin-hosted deposits in Europe. Ore Geol. Rev. 2005, 27, 241–267. [Google Scholar] [CrossRef]
  6. Micklethwaite, S.; Sheldon, H.A.; Baker, T. Active fault and shear processes and their implications for mineral deposit formation and discovery. J. Struct. Geol. 2010, 32, 151–165. [Google Scholar] [CrossRef]
  7. Caine, J.S.; Evans, J.P.; Forster, C.B. Fault zone architecture and permeability structure. Geology 1996, 24, 1025–1028. [Google Scholar] [CrossRef]
  8. McCuaig, T.; Kerrich, R. P-T-t-deformation-fluid characteristics of lode gold deposits: Evidence from alteration systematics. Ore Geol. Rev. 1998, 12, 381–453. [Google Scholar] [CrossRef]
  9. Ridley, J.R.; Diamond, L. Fluid chemistry of orogenic lode gold deposits and implications for genetic models. Rev. Econ. Geol. 2000, 13, 141–162. [Google Scholar]
  10. Kolb, J.; Rogers, A.; Meyer, F.M.; Vennemann, T.W. Development of fluid conduits in the auriferous shear zones of the Hutti Gold Mine, India: Evidence for spatially and temporally heterogeneous fluid flow. Tectonophysics 2004, 378, 65–84. [Google Scholar] [CrossRef]
  11. Sibson, R. Earthquake rupturing as a mineralizing agent in hydrothermal systems. Geology 1987, 15, 701–704. [Google Scholar] [CrossRef]
  12. Sibson, R.H. Fault rocks and fault mechanisms. J. Geol. Soc. Lond. 1977, 133, 191–213. [Google Scholar] [CrossRef]
  13. Phillips, W.J. Hydraulic fracturing and mineralization. J. Geol. Soc. Lond. 1972, 128, 337–359. [Google Scholar] [CrossRef]
  14. Jébrak, M. Hydrothermal breccias in vein-type ore deposits: A review of mechanisms, morphology and size distribution. Ore Geol. Rev. 1997, 12, 111–134. [Google Scholar] [CrossRef]
  15. Laznicka, P. Breccias and Coarse Fragmentites: Petrology, Environments, Associations, Ores; Developments in Economic Geology Series; Elsevier Science & Technology Books: New Yrok, NY, USA, 1988; ISBN 9780444412508. [Google Scholar]
  16. Simmons, S.F.; White, N.C.; John, D. Geological characteristics of epithermal precious and base metal deposits. Econ. Geol. 2005, 100, 485–522. [Google Scholar]
  17. Zhong, J.; Pirajno, F.; Chen, Y.-J. Epithermal deposits in South China: Geology, geochemistry, geochronology and tectonic setting. Gondwana Res. 2017, 42, 193–219. [Google Scholar] [CrossRef]
  18. Goldfarb, R.; Christie, A.; Bierlein, F. The orogenic gold deposit model and New Zealand: Consistencies and anomalies. In Proceedings of the 2005 New Zealand Minerals Conference: Realising New Zealand’s Mineral Potential, Auckland, New Zealand, 13–16 November 2005; pp. 105–114. [Google Scholar]
  19. Cannell, J.; Cooke, D.R.; Walshe, J.L.; Stein, H. Geology, mineralization, alteration, and structural evolution of the El Teniente Porphyry Cu-Mo Deposit. Econ. Geol. 2005, 100, 979–1003. [Google Scholar] [CrossRef]
  20. Landtwing, M.R.; Furrer, C.; Redmond, P.B.; Pettke, T.; Guillong, M.; Heinrich, C.A. The Bingham Canyon Porphyry Cu-Mo-Au deposit. III. Zoned copper-gold ore deposition by magmatic vapor expansion. Econ. Geol. 2010, 105, 91–118. [Google Scholar] [CrossRef]
  21. Henderson, I.H.C.; McCaig, A.M. Fluid pressure and salinity variations in shear zone-related veins, central Pyrenees, France: Implications for the fault-valve model. Tectonophysics 1996, 262, 321–348. [Google Scholar] [CrossRef]
  22. Rusk, B.; Reed, M. Scanning electron microscope-cathodoluminescence analysis of quartz reveals complex growth histories in veins from the Butte porphyry copper deposit, Montana. Geology 2002, 30, 727–730. [Google Scholar] [CrossRef]
  23. Tóth, J.; Corbet, T. Post-Palaeocene evolution of regional groundwater flow systems and their relation to petroleum accumulations, Taber Area, southern Alberta, Canada. Geol. Soc. Lond. Spec. Publ. 1987, 34, 45–77. [Google Scholar] [CrossRef]
  24. Hiatt, E.E.; Palmer, S.E.; Kyser, K.; O’Connor, E.; Terrence, K.H. Basin evolution, diagenesis and uranium mineralization in the Paleoproterozoic Thelon Basin, Nunavut, Canada. Basin Res. 2010, 22, 302–323. [Google Scholar] [CrossRef]
  25. Reynolds, R.L.; Goldhaber, M.B. Origin of a South Texas roll-type uranium deposit; I, Alteration of iron-titanium oxide minerals. Econ. Geol. 1978, 73, 1677–1689. [Google Scholar] [CrossRef]
  26. Pagel, M.; Ahamdach, N. Etude des Inclusions Fluides dans les Quartz des Gisements U de l’Athabasca et du Thelon; Internal Report of Centre de Recherches sur la Géologie des Matières Premières Minérales et Energétiques (CREGU): Nancy, France, 1995. [Google Scholar]
  27. Riegler, T.; Lescuyer, J.-L.; Wollenberg, P.; Quirt, D.; Beaufort, D. Alteration related to uranium deposits in the kiggavik-andrew lake structural trend, Nunavut, Canada: New insights from petrography and clay mineralogy. Can. Mineral. 2014, 52, 27–45. [Google Scholar] [CrossRef]
  28. Sharpe, R.; Fayek, M.; Quirt, D.; Jefferson, C.W. Geochronology and genesis of the Bong Uranium deposit, Thelon Basin, Nunavut, Canada. Econ. Geol. 2015, 110, 1759–1777. [Google Scholar] [CrossRef]
  29. Chi, G.; Haid, T.; Quirt, D.; Fayek, M.; Blamey, N.; Chu, H. Petrography, fluid inclusion analysis, and geochronology of the End uranium deposit, Kiggavik, Nunavut, Canada. Miner. Depos. 2017, 52, 211–232. [Google Scholar] [CrossRef]
  30. Shabaga, B.M.; Fayek, M.; Quirt, D.; Jefferson, C.W.; Camacho, A. Mineralogy, geochronology, and genesis of the Andrew Lake uranium deposit, Thelon Basin, Nunavut, Canada. Can. J. Earth Sci. 2017, 54, 850–868. [Google Scholar] [CrossRef]
  31. Grare, A.; Benedicto, A.; Lacombe, O.; Trave, A.; Ledru, P.; Blain, M.; Robbins, J. The Contact uranium prospect, Kiggavik project, Nunavut (Canada): Tectonic history, structural constraints and timing of mineralization. Ore Geol. Rev. 2018, 93, 141–167. [Google Scholar] [CrossRef] [Green Version]
  32. Hiatt, E.E.; Kyser, K.; Dalrymple, R.W. Relationships among sedimentology, stratigraphy, and diagenesis in the Proterozoic Thelon Basin, Nunavut, Canada: Implications for paleoaquifers and sedimentary-hosted mineral deposits. J. Geochem. Explor. 2003, 80, 221–240. [Google Scholar] [CrossRef]
  33. Davis, W.J.; Gall, Q.; Jefferson, C.W.; Rainbird, R.H. Fluorapatite in the Paleoproterozoic Thelon Basin: Structural-stratigraphic context, in situ ion microprobe U-Pb ages, and fluid-flow history. GSA Bull. 2011, 123, 1056–1073. [Google Scholar] [CrossRef]
  34. Jefferson, C.; Thomas, D.J.; Gandhi, S.; Ramaekers, P.; Delauney, G.; Brisbin, D.; Cutts, C.; Portella, P.; Olson, R. Unconformity-associated uranium deposits of the Athabasca Basin, Saskatchewan and Alberta. Bull. Geol. Surv. Can. 2007, 588, 23–67. [Google Scholar]
  35. AREVA (Areva, Paris, France). Internal Reference Document 2015. Available online: http://www.sa.areva.com/EN/finance-1176/regulated-financial-information.html (accessed on 24 July 2018).
  36. Hadlari, T.; Rainbird, R.H. Retro-arc extension and continental rifting: A model for the Paleoproterozoic Baker Lake Basin, Nunavut1Geological Survey of Canada Contribution 2010 04 36. Can. J. Earth Sci. 2011, 48, 1232–1258. [Google Scholar] [CrossRef]
  37. Rainbird, R.H.; Davis, W.J.; Stern, R.A.; Peterson, T.D.; Smith, S.R.; Parrish, R.R.; Hadlari, T. Ar-Ar and U-Pb geochronology of a Late Paleoproterozoic Rift Basin: Support for a Genetic Link with Hudsonian Orogenesis, Western Churchill Province, Nunavut, Canada. J. Geol. 2006, 114, 1–17. [Google Scholar] [CrossRef]
  38. Rainbird, R.H.; Davis, W.J. U-Pb detrital zircon geochronology and provenance of the late Paleoproterozoic Dubawnt Supergroup: Linking sedimentation with tectonic reworking of the western Churchill Province, Canada. GSA Bull. 2007, 119, 314. [Google Scholar] [CrossRef]
  39. Rainbird, R.H.; Hadlari, T.; Aspler, L.B.; Donaldson, J.A.; LeCheminant, A.N.; Peterson, T.D. Sequence stratigraphy and evolution of the paleoproterozoic intracontinental Baker Lake and Thelon basins, western Churchill Province, Nunavut, Canada. Precambrian Res. 2003, 125, 21–53. [Google Scholar] [CrossRef]
  40. Pehrsson, S.J.; Berman, R.G.; Eglington, B.; Rainbird, R. Two Neoarchean supercontinents revisited: The case for a Rae family of cratons. Precambrian Res. 2013, 232, 27–43. [Google Scholar] [CrossRef]
  41. Peterson, T.D. Geological setting and geochemistry of the ca. 2.6 Ga Snow island Suite in the central Rae Domain of the Western Churchill Province, Nunavut. Geol. Surv. Can. Open File 2015, 7841. [Google Scholar] [CrossRef]
  42. Jefferson, C.; Pehrsson, S.; Peterson, T.; Chorlton, L.; Davis, B.; Keating, P.; Gandhi, S.; Fortin, R.; Buckle, J.; Miles, W.; et al. Northeast Thelon region geoscience framework–new maps and data for uranium in Nunavut. Geol. Surv. Can. 2011, 288791. [Google Scholar] [CrossRef]
  43. McEwan, B. Structural style and regional comparison of the Paleoproterozoic Ketyet River group in the region North-Northwest of Baker Lake, Nunavut. Master’s Thesis, University of Regina, Regina, SK, Canada, 2012; p. 155. [Google Scholar]
  44. Tschirhart, V.; Morris, W.A.; Jefferson, C.W. Framework geophysical modelling of granitoid vs. supracrustal basement to the northeast Thelon Basin around the Kiggavik uranium camp, Nunavut. Can. J. Earth 2013, 50, 667–677. [Google Scholar] [CrossRef]
  45. Tschirhart, V.; Jefferson, C.W.; Morris, W.A. Basement geology beneath the northeast Thelon Basin, Nunavut: Insights from integrating new gravity, magnetic and geological data. Geophys. Prospect. 2017, 65, 617–636. [Google Scholar] [CrossRef]
  46. Peterson, T.D.; Scott, J.M.J.; LeCheminant, A.N.; Jefferson, C.W.; Pehrsson, S.J. The Kivalliq Igneous Suite: Anorogenic bimodal magmatism at 1.75 Ga in the western Churchill Province, Canada. Precambrian Res. 2015, 262, 101–119. [Google Scholar] [CrossRef]
  47. Johnstone, D.; Bethune, K.M.; Quirt, D. Lithostratigraphic and structural controls of uranium mineralization in the Kiggavik East, Centre and Main Zone deposits, Nunavut. In Proceedings of the Geological Association of Canada-Mineralogival Association of Canada, Joint Annual Meeting, WhiteHorse, YT, Canada, 1–3 June 2016. [Google Scholar]
  48. Peterson, T.D.; Van Breemen, O.; Sandeman, H.; Cousens, B. Proterozoic (1.85–1.75 Ga) igneous suites of the Western Churchill Province: Granitoid and ultrapotassic magmatism in a reworked Archean hinterland. Precambrian Res. 2002, 119, 73–100. [Google Scholar] [CrossRef]
  49. Hoffman, P.F. United Plates of America, The Birth of a Craton: Early Proterozoic Assembly and Growth of Laurentia. Annu. Rev. Earth Planet. Sci. 1988, 16, 543–603. [Google Scholar] [CrossRef]
  50. Van Breemen, O.; Peterson, T.D.; Sandeman, H.A. U-Pb zircon geochronology and Nd isotope geochemistry of Proterozoic granitoids in the western Churchill Province: Intrusive age pattern and Archean source domains. Can. J. Earth Sci. 2005, 42, 339–377. [Google Scholar] [CrossRef]
  51. Scott, J.M.J.; Peterson, T.D.; Davis, W.J.; Jefferson, C.W.; Cousens, B.L. Petrology and geochronology of Paleoproterozoic intrusive rocks, Kiggavik uranium camp, Nunavut. Can. J. Earth Sci. 2015, 52, 495–518. [Google Scholar] [CrossRef]
  52. Zaleski, E.; Pehrsson, N.D.; Davis, W.J.; L’Heureux, R.; Greiner, E.; Kerswill, J.A. Quartzite Sequences and Their Relationships, Woodburn Lake Group, Western Churchill Province, Nunavut; West. Churchill NATMAP Project; Geological Survey of Canada: Ottawa, ON, Canada, 2000; pp. 1–10.
  53. Rainbird, R.H.; Davis, W.J.; Pehrsson, S.J.; Wodicka, N.; Rayner, N.; Skulski, T. Early Paleoproterozoic supracrustal assemblages of the Rae domain, Nunavut, Canada: Intracratonic basin development during supercontinent break-up and assembly. Precambrian Res. 2010, 181, 167–186. [Google Scholar] [CrossRef]
  54. LeCheminant, A.N.; Heaman, L.M. Mackenzie igneous events, Canada: Middle Proterozoic hotspot magmatism associated with ocean opening. Earth Planet. Sci. Lett. 1989, 96, 38–48. [Google Scholar] [CrossRef]
  55. Heaman, L.M.; LeCheminant, A.N. Paragenesis and U-Pb systematics of baddeleyite (ZrO2). Chem. Geol. 1993, 110, 95–126. [Google Scholar] [CrossRef]
  56. Anand, A.; Jefferson, C.W. Reactivated fault systems and their effects on outcrop patterns of thin-skinned early thrust imbrications in the Kiggavik uranium camp, Nunavut. Geol. Surv. Can. 2017. [Google Scholar] [CrossRef]
  57. Peter, J.K.; Ulrike, W.; Brigitte, S.; Dmitry, K.; Qichao, Y.; Ingrid, R.; Andreas, S.; Karin, B.; Detlef, G.; Jacinta, E. Determination of Reference Values for NIST SRM 610–617 Glasses Following ISO Guidelines. Geostand. Geoanal. Res. 2010, 35, 397–429. [Google Scholar] [CrossRef]
  58. Paton, C.; Hellstrom, J.; Paul, B.; Woodhead, J.; Hergt, J. Iolite: Freeware for the visualisation and processing of mass spectrometric data. J. Anal. At. Spectrom. 2011, 26, 2508–2518. [Google Scholar] [CrossRef]
  59. Hervig, R.L.; Williams, L.B.; Kirkland, I.K.; Longstaffe, F.J. Oxygen isotope microanalyses of diagenetic quartz: Possible low temperature occlusion of pores. Geochim. Cosmochim. Acta 1995, 59, 2537–2543. [Google Scholar] [CrossRef]
  60. Kempe, U.; Götze, J.; Dombon, E.; Monecke, T.; Poutivtsev, M. Quartz: Deposits, Mineralogy and Analytics; Springer: Berlin, Germany, 2012; pp. 331–355. [Google Scholar]
  61. Dennen, W.H. Stoichiometric substitution in natural quartz. Geochim. Cosmochim. Acta 1966, 30, 1235–1241. [Google Scholar] [CrossRef]
  62. Turner, W.; Richards, J.; Nesbitt, B.; Muehlenbachs, K.; Biczok, J. Proterozoic low-sulfidation epithermal Au-Ag mineralization in the Mallery Lake area, Nunavut, Canada. Miner. Depos. 2001, 36, 442–457. [Google Scholar] [CrossRef]
  63. Clayton, R. Oxygen isotope exchange between quartz and water. J. Geophys. Res. 1972, 77, 3057–3067. [Google Scholar] [CrossRef]
  64. Lowenstern, J.B.; Sinclair, W.D. Exsolved magmatic fluid and its role in the formation of comb-layered quartz at the Cretaceous Logtung W-Mo deposit, Yukon Territory, Canada. Trans. R. Soc. Edinb. Earth Sci. 1996, 87, 291–303. [Google Scholar] [CrossRef]
  65. Thomas, J.B.; Bruce Watson, E.; Spear, F.S.; Shemella, P.T.; Nayak, S.K.; Lanzirotti, A. TitaniQ under pressure: The effect of pressure and temperature on the solubility of Ti in quartz. Contrib. Mineral. Petrol. 2010, 160, 743–759. [Google Scholar] [CrossRef]
  66. Perny, B.; Eberhardt, P.; Ramseyer, K.; Pankrath, R. Microdistribution of Al, Li, and Na in α quartz: Possible causes and correlation with short-lived cathodoluminescence. Am. Mineral. 1992, 77, 534–544. [Google Scholar]
  67. Rusk, B.G.; Lowers, H.A.; Reed, M.H. Trace elements in hydrothermal quartz: Relationships to cathodoluminescent textures and insights into vein formation. Geology 2008, 36, 547–550. [Google Scholar] [CrossRef]
  68. Spear, F.; Wark, D. Cathodoluminescence imaging and titanium thermometry in metamorphic quartz. J. Metamorph. Geol. 2009, 27, 187–205. [Google Scholar] [CrossRef]
  69. Leeman, W.P.; MacRae, C.M.; Wilson, N.C.; Torpy, A.; Lee, C.-T.; Student, J.J.; Thomas, J.B.; Vicenzi, E.P. A Study of cathodoluminescence and trace element compositional zoning in natural quartz from volcanic rocks: Mapping titanium content in quartz. Microsc. Microanal. 2012, 18, 1322–1341. [Google Scholar] [CrossRef] [PubMed]
  70. Rusk, B.; Koenig, A.; Lowers, H. Visualizing trace element distribution in quartz using cathodoluminescence, electron microprobe, and laser ablation-inductively coupled plasma-mass spectrometry. Am. Mineral. 2011, 96, 703–708. [Google Scholar] [CrossRef]
  71. Huang, R.; Audétat, A. The titanium-in-quartz (TitaniQ) thermobarometer: A critical examination and re-calibration. Geochim. Cosmochim. Acta 2012, 84, 75–89. [Google Scholar] [CrossRef]
  72. Taylor, H.P. The Application of oxygen and hydrogen isotope studies to problems of hydrothermal alteration and ore deposition. Econ. Geol. 1974, 69, 843–883. [Google Scholar] [CrossRef]
  73. Bettencourt, J.S.; Leite, W.B.; Goraieb, C.L.; Sparrenberger, I.; Bello, R.M.S.; Payolla, B.L. Sn-polymetallic greisen-type deposits associated with late-stage rapakivi granites, Brazil: Fluid inclusion and stable isotope characteristics. Lithos 2005, 80, 363–386. [Google Scholar] [CrossRef]
  74. Bowen, G.J. Statistical and Geostatistical Mapping of Precipitation Water Isotope Ratios. In Isoscapes: Understanding Movement, Pattern, and Process on Earth through Isotope Mapping; West, J.B., Bowen, G.J., Dawson, T.E., Tu, K.P., Eds.; Springer: Dordrecht, The Netherlands, 2010; pp. 139–160. ISBN 978-90-481-3354-3. [Google Scholar]
  75. Vollbrecht, A.; Oberthür, T.; Ruedrich, J.; Weber, K. Microfabric analyses applied to the Witwatersrand gold- and uranium-bearing conglomerates: Constraints on the provenance and post-depositional modification of rock and ore components. Miner. Depos. 2002, 37, 433–451. [Google Scholar] [CrossRef]
  76. Kraishan, G.; Rezaee, R.; Worden, R. Significance of trace element composition of quartz cement as a key to reveal the origin of silica in sandstones: An example from the cretaceous of the Barrow Sub-Basin, Western Australia. Quartz Cementation Sandstones 2009, 29, 317–331. [Google Scholar]
  77. Rosenberg, P.E.; Foit, F.F. Magnesiofoitite from the uranium deposits of the Athabasca Basin, Saskatchewan, Canada. Can. Mineral. 2006, 44, 959–965. [Google Scholar] [CrossRef]
  78. Richard, A.; Boulvais, P.; Mercadier, J.; Boiron, M.-C.; Cathelineau, M.; Cuney, M.; France-Lanord, C. From evaporated seawater to uranium-mineralizing brines: Isotopic and trace element study of quartz–dolomite veins in the Athabasca system. Geochim. Cosmochim. Acta 2013, 113, 38–59. [Google Scholar] [CrossRef]
  79. Polito, P.A.; Kyser, T.K.; Thomas, D.; Marlatt, J.; Drever, G. Re-evaluation of the petrogenesis of the Proterozoic Jabiluka unconformity-related uranium deposit, Northern Territory, Australia. Miner. Depos. 2005, 40, 257–288. [Google Scholar] [CrossRef]
  80. Derome, D.; Cathelineau, M.; Fabre, C.; Boiron, M.-C.; Banks, D.; Lhomme, T.; Cuney, M. Reconstitution of paleo-fluid composition by Raman LIBS and crush-leach techniques: Application to mid-Proterozoic evaporitic brines (Kombolgie Formation basin, Northern Territory, Australia). Chem. Geol. 2007, 237, 240–254. [Google Scholar]
  81. Bodnar, R.J.; Reynolds, T.J.; Kuehn, C.A. Fluid-Inclusion Systematics in Epithermal Systems. In Geology and Geochemistry of Epithermal Systems; Berger, B.R., Bethke, P.M., Eds.; Society of Economic Geologists: Littleton, CO, USA, 1985. [Google Scholar]
  82. Dong, G.; Morrison, G.; Jaireth, S. Quartz textures in epithermal veins, Queensland; classification, origin and implication. Econ. Geol. 1995, 90, 1841–1856. [Google Scholar] [CrossRef]
  83. Bobis, E.R. A review of the description, classification, and origin of quartz textures in low-sulphidation epithermal veins. J. Geol. Soc. Philipp. 1994, 99, 15–39. [Google Scholar]
  84. Moncada, D.; Mutchler, S.; Nieto, A.; Reynolds, T.J.; Rimstidt, J.D.; Bodnar, R.J. Mineral textures and fluid inclusion petrography of the epithermal Ag–Au deposits at Guanajuato, Mexico: Application to exploration. J. Geochem. Explor. 2012, 114, 20–35. [Google Scholar] [CrossRef]
  85. Tanner, P.W. The giant quartz-breccia veins of the Tyndrum-Dalmally area, Grampian Highlands, Scotland: Their geometry, origin and relationship to the Cononish gold-silver deposit. Earth Environ. Sci. Trans. R. Soc. Edinb. 2012, 103, 51–76. [Google Scholar] [CrossRef]
  86. Sibson, R.H. Implications of fault-valve behaviour for rupture nucleation and recurrence. Tectonophysics 1992, 211, 283–293. [Google Scholar] [CrossRef]
  87. Meunier, J.D.; Sellier, E.; Pagel, M. Radiation-damage rims in quartz from uranium-bearing sandstones. J. Sediment. Res. 1990, 60, 53–58. [Google Scholar] [CrossRef]
  88. Hu, B.; Pan, Y.; Botis, S.; Rogers, B.; Kotzer, T.; Yeo, G. Radiation-induced defects in drusy quartz, Athabasca basin, Canada: A new aid to exploration of uranium deposits. Econ. Geol. 2008, 103, 1571–1580. [Google Scholar] [CrossRef]
  89. MacRae, C.M.; Wilson, N.C.; Torpy, A. Hyperspectral cathodoluminescence. Mineral. Petrol. 2013, 107, 429–440. [Google Scholar] [CrossRef]
  90. Cerin, D.; Götze, J.; Pan, Y. Radiation-Induced Damage In Quartz At the Arrow Uranium Deposit, Southwestern Athabasca Basin, Saskatchewan. Can. Mineral. 2017, 55, 457–472. [Google Scholar] [CrossRef]
  91. Zhang, Y.; Robinson, J.; Schaubs, P.M. Numerical modelling of structural controls on fluid flow and mineralization. Geosci. Front. 2011, 2, 449–461. [Google Scholar] [CrossRef]
  92. McCuaig, T.C.; Hronsky, J.M.A. The Mineral System Concept: The Key to Exploration Targeting. In Building Exploration Capability for the 21st Century; Kelley, K.D., Golden, H.C., Eds.; Society of Economic Geologists: Littleton, CO, USA, 2014; ISBN 9781629491424. [Google Scholar]
Figure 1. (A) Outline of Canada and location of the Thelon basin in yellow; (B) geological map of the Churchill-Wyoming craton showing the location of the Thelon basins and the Kiggavik area on its Eastern border; (C) simplified geological map of the Kiggavik area (Orano internal document) highlighting the occurrence of the QB (yellow) along the major faults; and (D) cross-section from the Thelon fault to the Judge Sisson fault. Deposits and prospects are indicated with red circles.
Minerals 08 00319 g001
Figure 2. (A) Outcrop view looking east on the N80-trending steeply dipping to the north Judge Sisson fault (JSF) underlain by at least 10 m of white quartz veins; (B) heterogeneous size, pervasively hematized clasts cemented by a white quartz matrix; (C) right lateral relay step, N80 trending main veins (outcrop on the JSF); (D) optical microphotograph picture (OM): Clasts bearing quartz veins in the Thelon sandstones; (E) oriented data of thick quartz veins for deposits and prospects; and (F) histogram of all measured quartz vein dips in the Kiggavik area.
Minerals 08 00319 g002
Figure 3. Organisation of inner (core) and outer zones of the quartz breccia (QB) crosscut in drillholes at Contact. (A) Plan view of the drill holes; (B) lateral variation in thickness of QB inner (core) and outer zones; and (C) simplified interpretative drawing of the QB intersected in drill holes (grey plane).
Minerals 08 00319 g003
Figure 4. (A) Pervasively silicified cataclastic fault rock; (B) same as (A), crosscut by a white quartz vein of the QB; (C) pervasively silicified fault zone crosscut by late fracturing and clay alteration event (End deposit); and (D) typical intersection of the QB displaying deep purple hematized rock, massive and minor white quartz veins. Jigsaw textures are locally observable (e.g., at 189 m, yellow arrow; Contact prospect).
Minerals 08 00319 g004
Figure 5. (A,B) Thin section of a polyphase cataclastic fault rock crosscut by several generations of quartz veins of the QB. White arrow indicates a late microcrystalline quartz veinlet; (C) simplified chronology of the events; (D) zoom on the different generations of clasts; and (E) matrix of the latest cataclastic event displaying white micas and micro-crystalline quartz.
Minerals 08 00319 g005
Figure 6. Porosity measured for fresh samples (granitic gneiss from the Contact prospect), pervasively silicified cataclastic fault rock, thick quartz veins within granitic gneiss, and clay-altered, fractured host rock (examples for each category are displayed on the right of the chart).
Minerals 08 00319 g006
Figure 7. Optical microscope microphotograph (OM): (A) Disseminated hematite (Hem) and specular hematite (Spec Hem). Qtz: Quartz; (B) banded microcrystalline quartz (Qtz) with synchronous anhedral hematite and magnetite; (C) euhedral quartz crystals and arrays of dense monophase fluid inclusions (vapor rich); (D) euhedral clear quartz cement a fracture that crosscuts previous quartz generations; (E) trends of microcrystalline quartz (yellow); (F) comb quartz grains (example in yellow) engulfed in a fine-grained quartz matrix; (G) moss quartz texture; and (H) bladed lattice calcite (white arrow) replaced by quartz.
Minerals 08 00319 g007
Figure 8. Cathodoluminescence microphotograph (CM): (A) Deep blue luminescent microcrystalline quartz and red luminescent hematite in banded vein; (B) fracture cemented with euhedral quartz (blue-brown luminescence in concentric zoning, yellow dotted line) and arrays of purplish FIs (white arrow); (C) quartz breccia (green) cemented by subhedral, sub-millimetric blue-purple quartz, crosscut by dark blue luminescent subhedral millimetric quartz vein (yellow), the white arrow highlight brown-luminescent overgrowth; (D) OM and CM of the same zone: Subhedral and microcrystalline quartz (blue luminescence) displaying microbrecciation/recrystallization (brown luminescence). Yellow dashed line outlines a quartz crystal; (E) dark blue luminescent euhedral syntaxial quartz. The boundary of the fracture on the left is lined with U-oxides (black and calcite (orange); and (F) quartz vein orthogonally crosscut by a microfracture and cemented with pitchblende. The boundaries of the microfractures display a “buffer area” where the luminescence of the quartz is modified, from pink to yellow.
Minerals 08 00319 g008
Figure 9. Concentration of trace elements measured in quartz through LA-ICP-MS, for main quartz generations: (A) Li, K, and Ba; (B) Zr, Ti, and B; (C) Mg, Na, Al, Fe, and Ca; and (D) Al vs. Ti concentrations of main quartz generation. Zones correspond to values of hydrothermal quartz from low T °C, orogenic Au, and porphyry-type deposits [60].
Minerals 08 00319 g009
Figure 10. Cross-section after Peterson et al. [46] and zoom in the zone of formation of the QB.
Minerals 08 00319 g010
Figure 11. (A) Evolution of inferred fault strength (frictional shear resistance) and fluid pressure in the fault zone as a response of fluid pulse, fracturing and silica-precipitation. (B) Scheme depicting the succession of events that produced the QB.
Minerals 08 00319 g011
Figure 12. (A) Distribution of fracture density and uranium mineralization as a function of depth, for selected drillholes from Contact (Cont), End, Andrew Lake (And) and Bong. Fracture density as black lines; 0: Non-fractured drill-core, 10: Intensely fractured drill-core. Uranium mineralization in red: U in ppm measured by assays, logarithmic scale). (B) Number of quartz veins as a function of depth for Contact and End. (C) Simplified cross sections.
Minerals 08 00319 g012
Figure 13. (A) Plane polarized light picture and interpretation drawing of a quartz vein network guiding the mineralizing fluid along its boundaries. Quartz and iron oxides display evidence for dissolution; (B,C) macroscopic drill core sample scan and interpretation drawing: Examples of a QB related quartz vein bearing pitchblende (Pch) along edges or in orthogonal microfractures.
Minerals 08 00319 g013
Table 1. δ18Oquartz measured in main quartz generations and calculated values of δ18Ofluid. To calculate δ18Ofluid, an average temperature of 250 °C was used for quartz generations of the QB (lines 1–3 of the table), while an average temperature of 150 °C was used for late druzy quartz (lines 4–5).
Quartz TypeCL Luminescence Colorδ18OquartzAvg.nδ18OfluidAvg.
Banded microcrystalline quartz (alternated with iron oxides)Deep blue12.0–14.012.9142.4–5.33.9
Euhedral quartz with concentric zoningAlternating blue and brown luminescence7.5–9.38.418−1.6–0.3−0.6
“Late” microcrystalline quartzDeep blue18.8–23.922.11011.5–14.812.4
Vuggy quartzDark blue14.4–15.514.929−5.3–2.5−3.3
Quartz alteration associated with fluid inclusionsGreen16.2–22.017.85−2.5–3.8−0.3

