Article

Mapping Surface Quartz Content in Sand Dunes Covered by Biological Soil Crusts Using Airborne Hyperspectral Images in the Longwave Infrared Region

1
The Remote Sensing Laboratory, Department of Geography, Tel Aviv University, 10 Zelig St., Tel Aviv 69978, Israel
2
Institute of Soil, Water and Environmental Sciences, Agricultural Research Organization, Volcani Center, HaMaccabim Road 68, P.O. Box 15159, Rishon LeZion 7528809, Israel
*
Author to whom correspondence should be addressed.
Minerals 2018, 8(8), 318; https://doi.org/10.3390/min8080318
Submission received: 31 May 2018 / Revised: 6 July 2018 / Accepted: 22 July 2018 / Published: 26 July 2018
(This article belongs to the Special Issue Hyperspectral Imaging for Mineral Mapping)

Abstract

:
Biological soil crusts (BSCs), composed of cyanobacteria, algae, mosses, lichens, and fungi, are important ecosystem engineers that stabilize the quartz-rich dunes in the Nitzana study area near the Israel–Egypt border. The longwave infrared (LWIR) region of the electromagnetic spectrum is very useful for quartz identification since quartz reflectance in the visible, near infrared, and shortwave infrared (VIS-NIR-SWIR, 0.4–2.5 µm) spectral regions lacks identifying features, whereas in the LWIR region, the quartz emissivity spectrum presents a strong doublet feature. This emissivity feature can be used as a diagnostic tool for BSCs development in desert environments, because BSCs attenuate the quartz feature as a function of their successional development. A pair of day and night airborne hyperspectral images were acquired using the Specim AisaOWL LWIR sensor (7.7–12 µm) and processed using an innovative algorithm to reduce the atmospheric interference in this spectral domain. The resulting day and night apparent emissivity products were used to produce a surface quartz content map of the study area. The significant reduction in atmospheric interference resulted in a high correlation (R2 = 0.88) between quartz content in field samples determined by X-ray powder diffraction analysis and emissivity estimations from the airborne images. This, in turn, served as the ground truth to our quartz content map of the surface, and by proxy to the BSC.

1. Introduction

Remote-sensing data, particularly in the visible, near infrared, and shortwave infrared spectral regions (VIS-NIR-SWIR, 0.4–2.5 µm), has been extensively used to study and map different minerals on the Earth’s surface from air and space platforms [1]. However, the VIS-NIR-SWIR region is useless for identifying quartz, because it does not present spectral features in that spectral region. Yet, in the longwave infrared (LWIR) spectral region (8–14 µm), quartz presents a strong doublet emissivity feature, making this region suitable for quartz identification and quantification [2,3]. Nonetheless, remote sensing in the LWIR has some limitations: the signal in this domain is mainly attenuated by tropospheric ozone and water vapor and separating the temperature and emissivity from the measured radiance (intrinsic, downwelling and path radiance) remains a challenge [4].
Several methods have been suggested to correct the atmospheric effects across the LWIR region from airborne or spaceborne platforms, in order to facilitate the separation of surface emissivity from its temperature (e.g., [5,6,7,8,9,10]). However, these methods require various prior assumptions and ancillary data, and are generally computationally intensive. A simple method for identifying surface minerals, without the need to correct for atmospheric interference, was recently developed by comparing the day and night airborne hyperspectral apparent emissivity spectra of the same scene [11]. The at-sensor radiance ( L s ) recorded from an airborne sensor can be described as:
  L s =   ε ( λ ) L b b ( λ , τ ) τ ( λ ) + [ 1 ε ( λ ) ] L d ( λ ) τ ( λ )   + L u ( λ )  
where Lbb is the blackbody radiance emitted towards the sensor, ε is the emissivity, τ is the atmospheric transmittance, Ld is the downwelling radiance from the atmosphere, and Lu is the upwelling radiance (path radiance) from atmospheric emission and scattering that reaches the sensor directly [12].
Biological soil crusts (BSCs) are composed of cyanobacteria, algae, mosses, lichens, and fungi that bind soil particles together [13]. They are in essence ecosystem engineers that stabilize soils, participate in hydrological processes, and fix carbon and nitrogen [14,15,16,17,18,19]. While all BSCs significantly modify the surfaces that they occupy, the manner in which they affect their environment depends on the composition of the microphytic community [20]. As BSCs develop and mature through succession, they accumulate fine-grained soil particles and integrate them into their structure [21]. When BSCs develop in a quartz-rich environment, such as dune fields, this addition of fine-grained soil particles masks the quartz emissivity feature and increases the emissivity [20,22,23]. This trait enables us to assess BSCs’ successional development using LWIR remote sensing; however, this has only been performed qualitatively by aerial survey [20]. Moreover, BSC emissivity undergoes minute diurnal changes due to variations in topsoil moisture, but its emissivity signal remains higher than that of quartz-rich sandy soils [20,23,24]. Thus, attenuation of the quartz signal is indicative of a BSC’s successional level, and by proxy, of the surface properties and the ecological functions performed by the BSC. Accordingly, there is great interest in assessing the quartz content of quartz-rich surfaces occupied by BSCs in order to make inferences about the surface properties.
The aim of the current study was to apply airborne hyperspectral LWIR remote sensing to assess the quartz content on the surface of a dune field covered by BSCs as an indicator of BSC development. Accordingly, our specific objectives were to: (1) enhance spectral surface features using a recently developed technique and quantify the surface quartz content, and (2) link the surface quartz content with BSC successional maturity. Accordingly, first, we apply a technique to reduce the atmospheric effects, then we apply a decision tree to classify the quartz in the image and use field samples to validate our procedure.

2. Materials and Methods
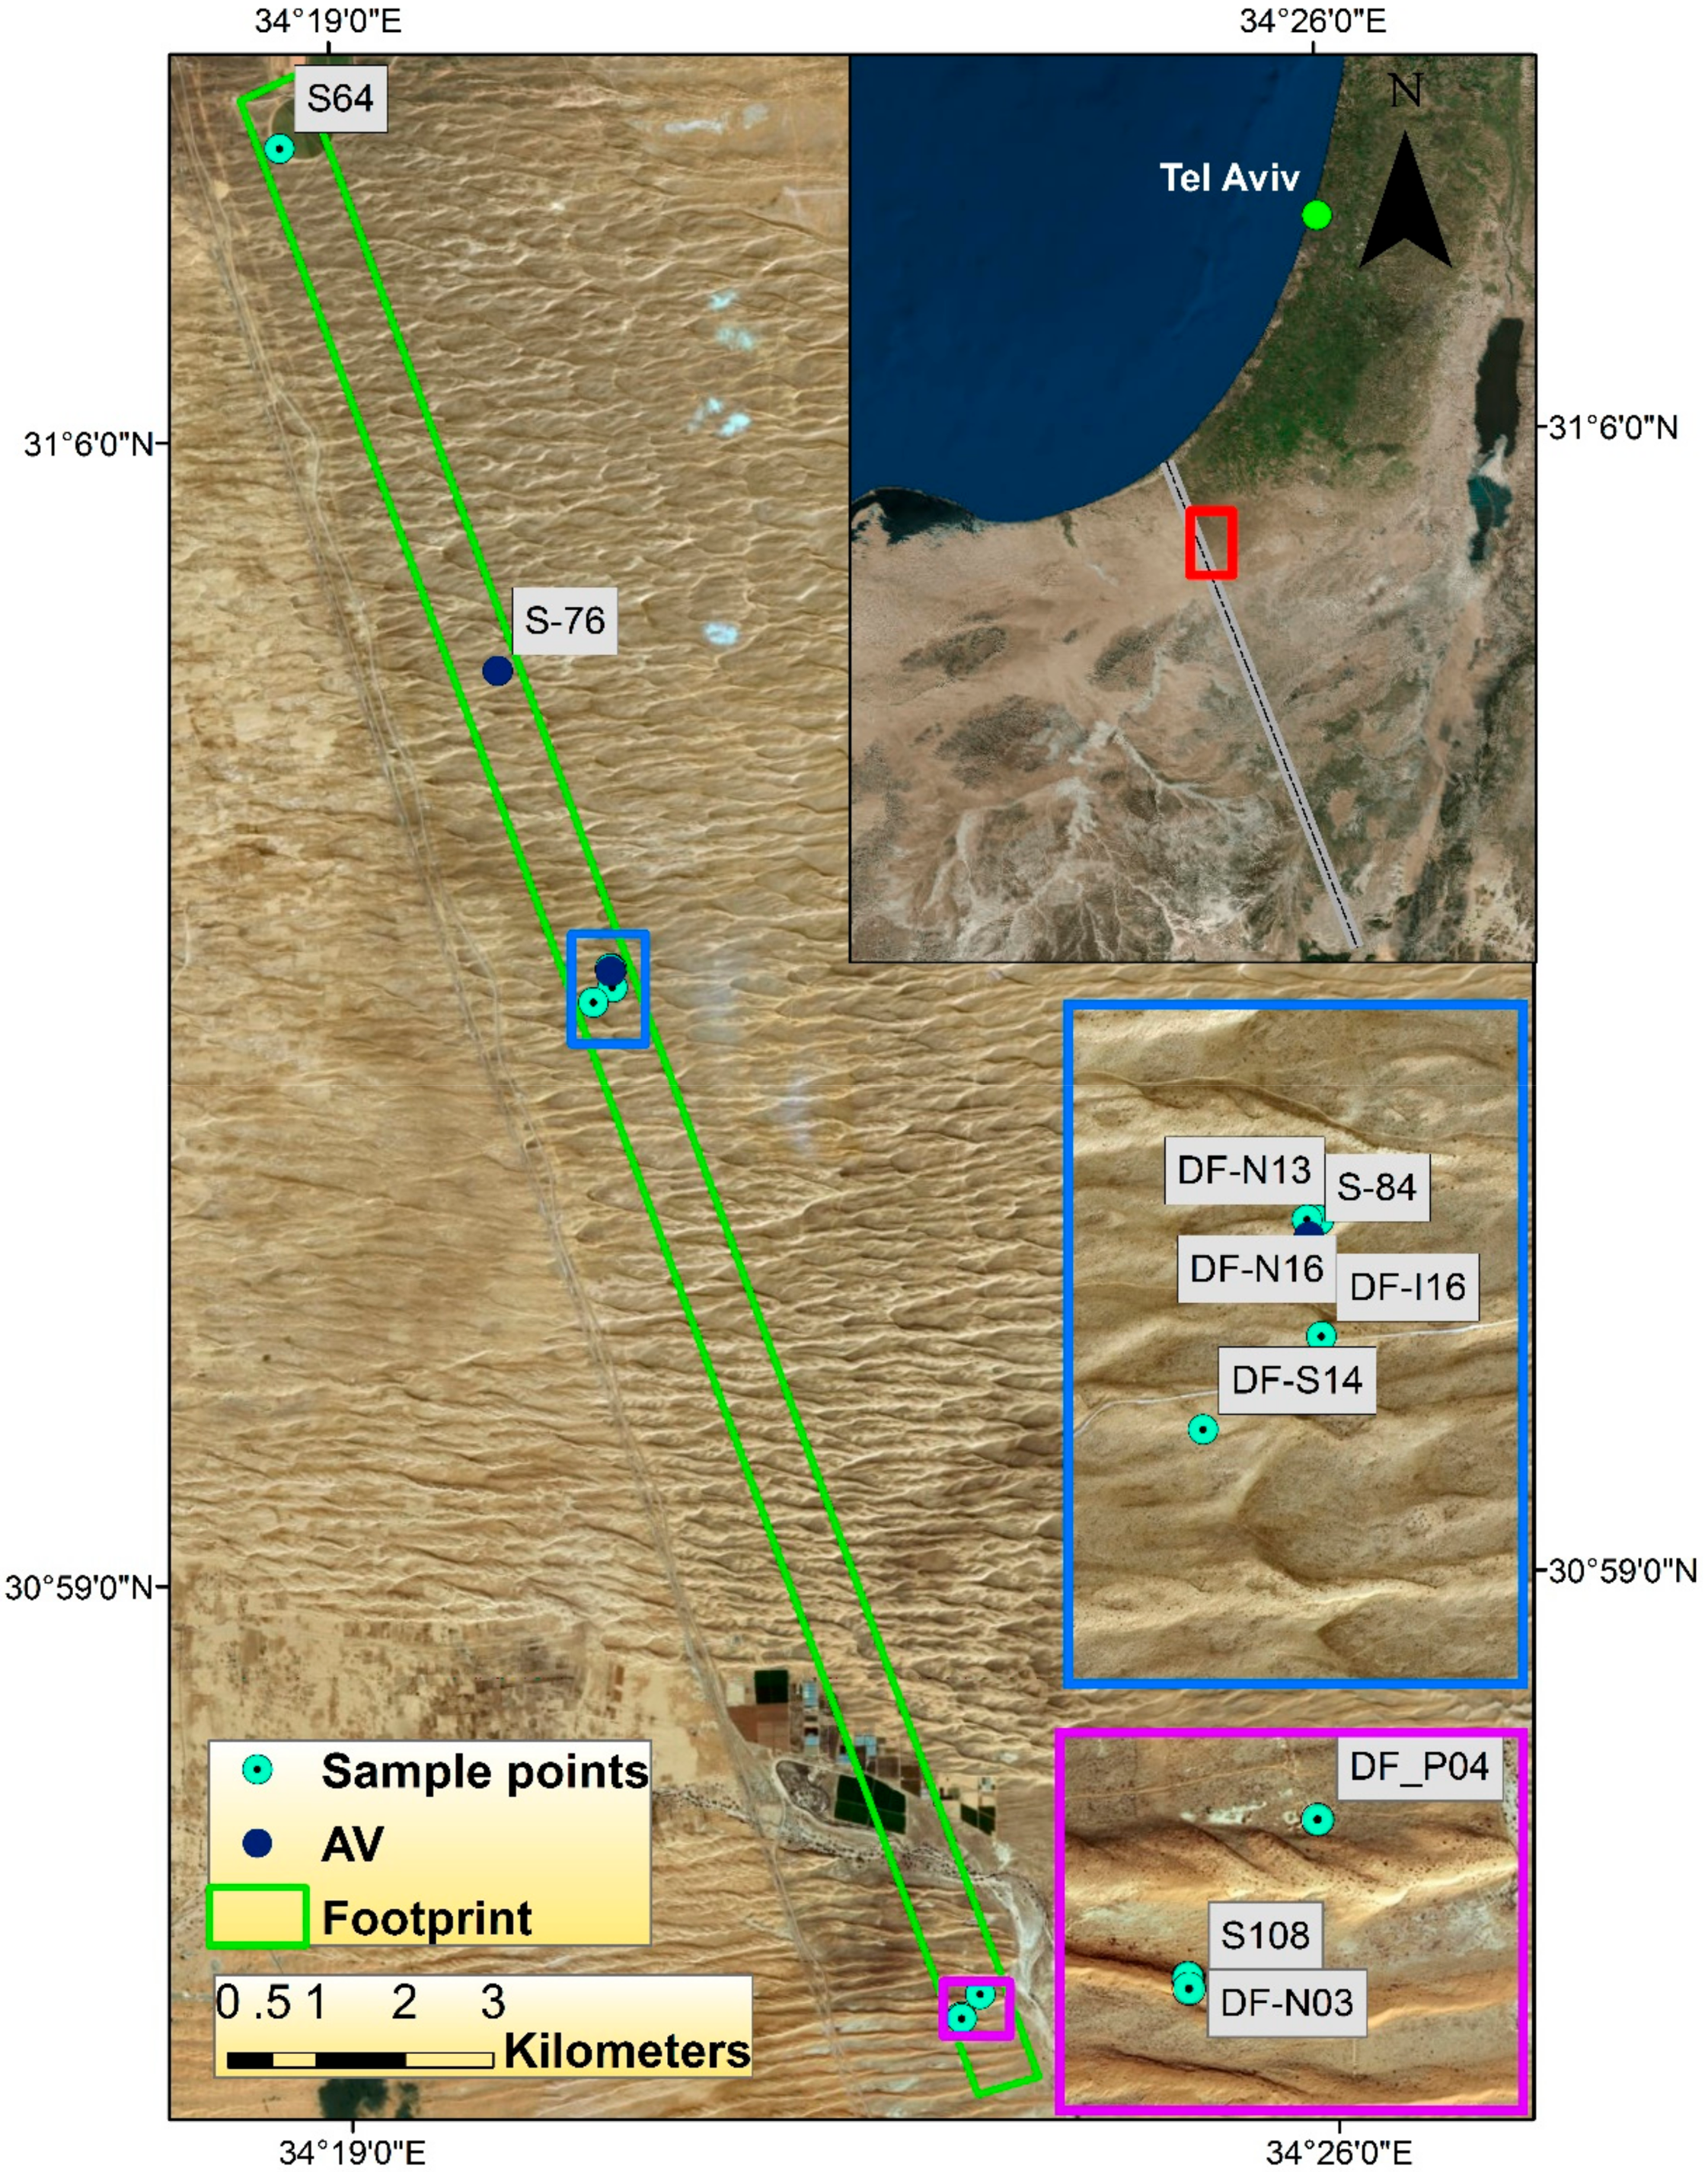
2.1. The Study Area

The northern Sinai linear dunes spread in a West-East orientation, encroaching from Sinai into the Israeli Northwestern (NW) Negev. The NW Negev dune field covers approximately 1300 km2, located at the downwind end of the erg, where sand has been accumulating since the Late Pleistocene [25,26]. The erg formed along a desert fringe between the climatic zones of the Mediterranean Levant and the global desert belts (Figure 1). While the Egyptian side of the border is characterized by active sand dunes shifting with winds, on the Israeli side BSCs’ presence on the surface fixes the dunes. This is the result of a strict nature conservation program on the Israeli side, while on the Egyptian side Bedouin and their livestock trample the soil surface, breaking the BSC and preventing its establishment, thus inhibiting the dunes from stabilizing [27,28]. The different landcover on either side of the border creates a sharp albedo contrast that can be seen from space [29] (Figure 1). This area has been extensively studied using various field and laboratory methods, as well as remote-sensing techniques, to determine its formation, aeolian dynamics, changes in surface chemistry, and color, hydrology, ecology, and anthropogenic effects [20,23,25,26,27,30]. The area is characterized by a sharp rainfall gradient along a 30-km transect at the Israel–Egypt border, with an annual average of 150 mm in the north and only 70 mm in the south [31]. Accordingly, the BSCs are several millimeters thicker to the north [25]. Additionally, BSCs of different types and thicknesses tend to cover almost all of the dunes, except for the dune crest (which is not stabilized by a BSC) and patches of fine-grained playa (sedimented carbonates on shallow surfaces where flood water dammed up and evaporated) scattered in the study area [32]. Moreover, on every dune, BSCs on the north-facing slopes are more developed than those on the south-facing slopes and inter-dune areas [33].

2.2. Airborne Data

Airborne data were acquired using the Specim AisaOWL hyperspectral sensor, covering the LWIR spectral region (7.7–12 µm). The spectral range was slightly reduced to exclude detector edge noise (to 8.02–11.6 μm), with 78 spectral bands and a spectral resolution of 50 nm, on 1 June 2013 at 12:08 and 23:12 UTC (Coordinated Universal Time). The flight altitude was 1.8 km above ground level, resulting in a spatial resolution of 2 m. The flight was run parallel to the Israel-Egypt border to capture the variance along the rain gradient and the corresponding levels of successional development of the BSCs. It covered an area of about 33 km2 of the surface with one flight line. The mean surface elevation across the entire flight line was 160 m above sea level.

2.3. Atmospheric-Feature Reduction and Surface-Feature Enhancement

Materials such as rock, soil, and vegetation have emissivity values close to 1 and their at-sensor radiance can be approximated as the radiance emitted by a blackbody, whereas the contribution of the two right components of Equation (1) is very small in comparison, and it can therefore be reduced to:
  L s =   ε ( λ ) L b b ( λ , τ ) τ ( λ )  
The deviation of the at-sensor radiance from a blackbody curve is therefore caused by the surface emissivity and the atmospheric transmittance. Assuming that the surface emissivity of minerals is a function of their chemical and physical attributes and does not change between day and night, the at-sensor radiance is affected by the different expression of the atmospheric contribution during the day and at night [4]. During the day, the radiance emitted by the warm surface is absorbed by the colder atmosphere while at night, when the surface becomes colder than the atmosphere, its emittance is lower than that of the atmosphere, and therefore the atmospheric contribution adds to the radiance from the surface. Accordingly, a pair of day and night images can be used to perform a reduction of the atmospheric effects while emphasizing the spectral features of minerals [4,11].
A Planck curve (Lbb) was fitted to the original day and night at-sensor-radiance images (Ls) on a pixel-by-pixel basis using a dedicated image-processing tool [12]. The day and night Ls images were then divided by the day and night Lbb images to produce pseudo emissivity images (Ls/Lbb) that still contained the atmospheric interference, downwelling radiance, and path radiance. These day and night pseudo emissivity images were compared on a pixel-by-pixel basis using a recently developed algorithm to calculate a gain factor [11] and apply it to reduce the atmospheric effects while emphasizing the surface features. This gain factor is represented by the mean Ls/Lbb of pixels for which each absorption feature during the day appears as an emission feature at night, thus representing the atmospheric contribution. This day and night difference in the Ls/Lbb spectrum is termed the day-night spectral opposite (DNSO) of a pixel and is given by:
DNSO = I N 1
where the DNSO is calculated by dividing the number of day and night opposite signs of slopes (ΣI) by the number of spectral intervals (N − 1) [11]. There is a trade-off between the number of pixels used to form the atmospheric gain factor and their accurate representation of the atmosphere. Large differences between the day and night of the same pseudo emissivity pixel are an indicator for a blackbody-like pixel and are caused by the atmosphere. Large differences would also result in higher DNSO values and fewer selected pixels. However, these pixels represent the atmospheric signal more accurately. Accordingly, the average spectrum of the pixels with a particular DNSO value was used as the gain spectrum, representing the atmospheric signal (τ) in (3), then the entire day or night pseudo emissivity image (Ls/Lbb) was divided by the corresponding day or night average spectrum to produce the day or night apparent emissivity image.

2.4. Laboratory and Ground Measurements

Ten topsoil samples were collected at specific locations along the study area (Figure 1), representing several types of BSCs and sediment (i.e., BSCs of different aspect and succession level, bare sand, and playa) in a manner which best captures the heterogeneity in the large study area. Each sample, corresponding to a specific pixel in the image, represented an abundant specific surface cover over very large areas of the image (such as dune sand, BSC, Playa). However, it is important to emphasize that BSCs in this area do not change greatly between very small intervals on the ground along the dunes (several centimeters to a few meters), but they do change as a function of their location on the slope and its aspect, soil texture, and microclimate [20,34]. The samples were analyzed by X-ray powder diffraction (XRD, Panalytical, Almelo, The Netherlands) at the Ilse Katz Institute for Nanoscale Science and Technology at Ben-Gurion University of the Negev. The amount of definite phase was estimated using the relative intensities ratio and the major minerals for every sample are presented in Table 1. The quartz content of each sample was compared with the quartz content extracted from the image spectra. In addition, 2 out of the 10 samples were also measured by the same spectral imaging sensor on the ground at a distance of approximately 15 m from the samples and are hereafter referred to as ground measurements and will be further discussed in Section 3.2.
The image pixels that correspond to the locations where the samples were collected were identified and their apparent emissivity spectra were extracted to a spectral library using the ENVI software (Exelis Visual Information Solutions, Boulder, CO, USA). The spectral angle mapper (SAM) algorithm [35] was used to measure the degree of similarity between ground-measured spectra and spectra extracted from the image. An example of a sample point that was rich in quartz is presented in Figure 2.

2.5. Quartz Classification

A thematic map of the scene, which classifies the quartz mineral, was generated according to a decision tree (DT) that was previously implemented on airborne hyperspectral LWIR data [4]. This DT is based on performing continuum removal (CR) in the range 8.12–9.29 µm and setting thresholds on the center wavelengths of the quartz doublet feature (CRλ = 8.26 µm < 0.993 and CRλ = 9.12 µm < 0.995) to both day and night images to classify pixels as quartz (Figure 2). The intersection between a classified pixel in the day and night images was considered as quartz-containing pixels.

3. Results

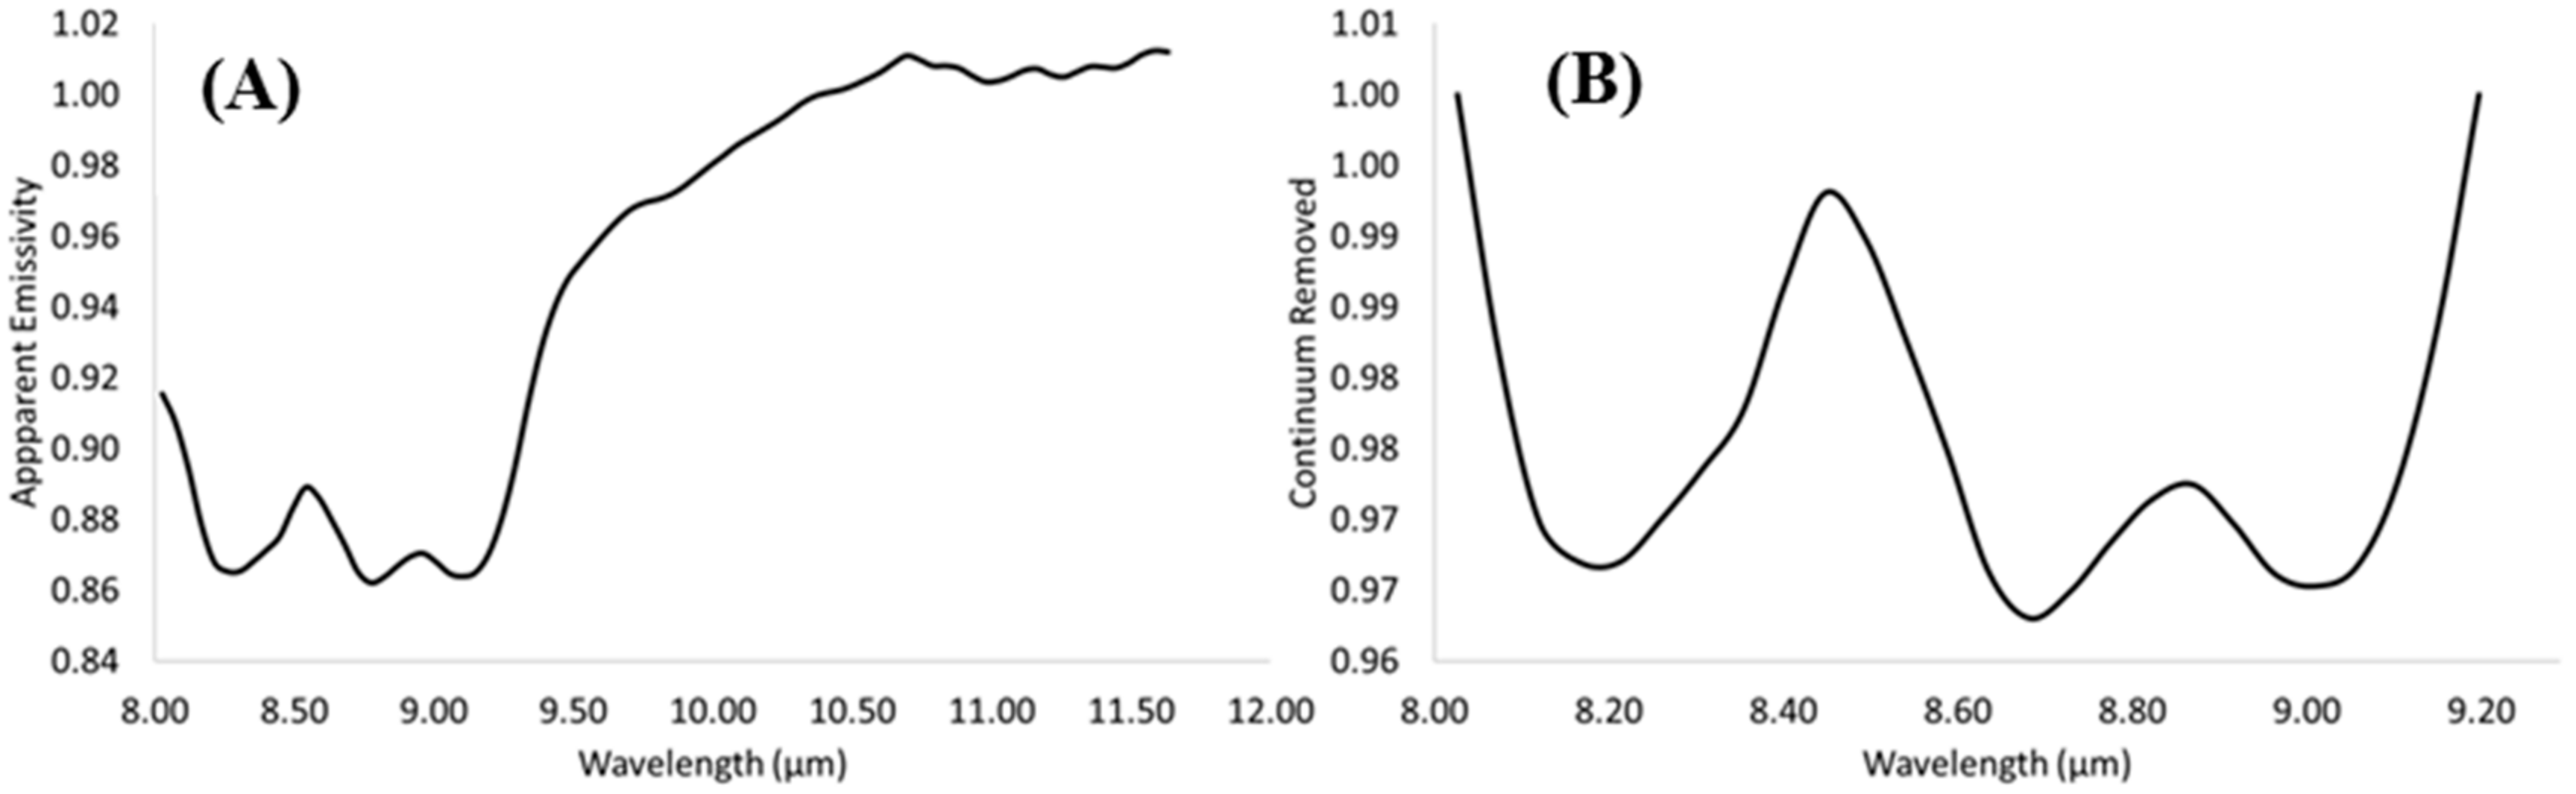
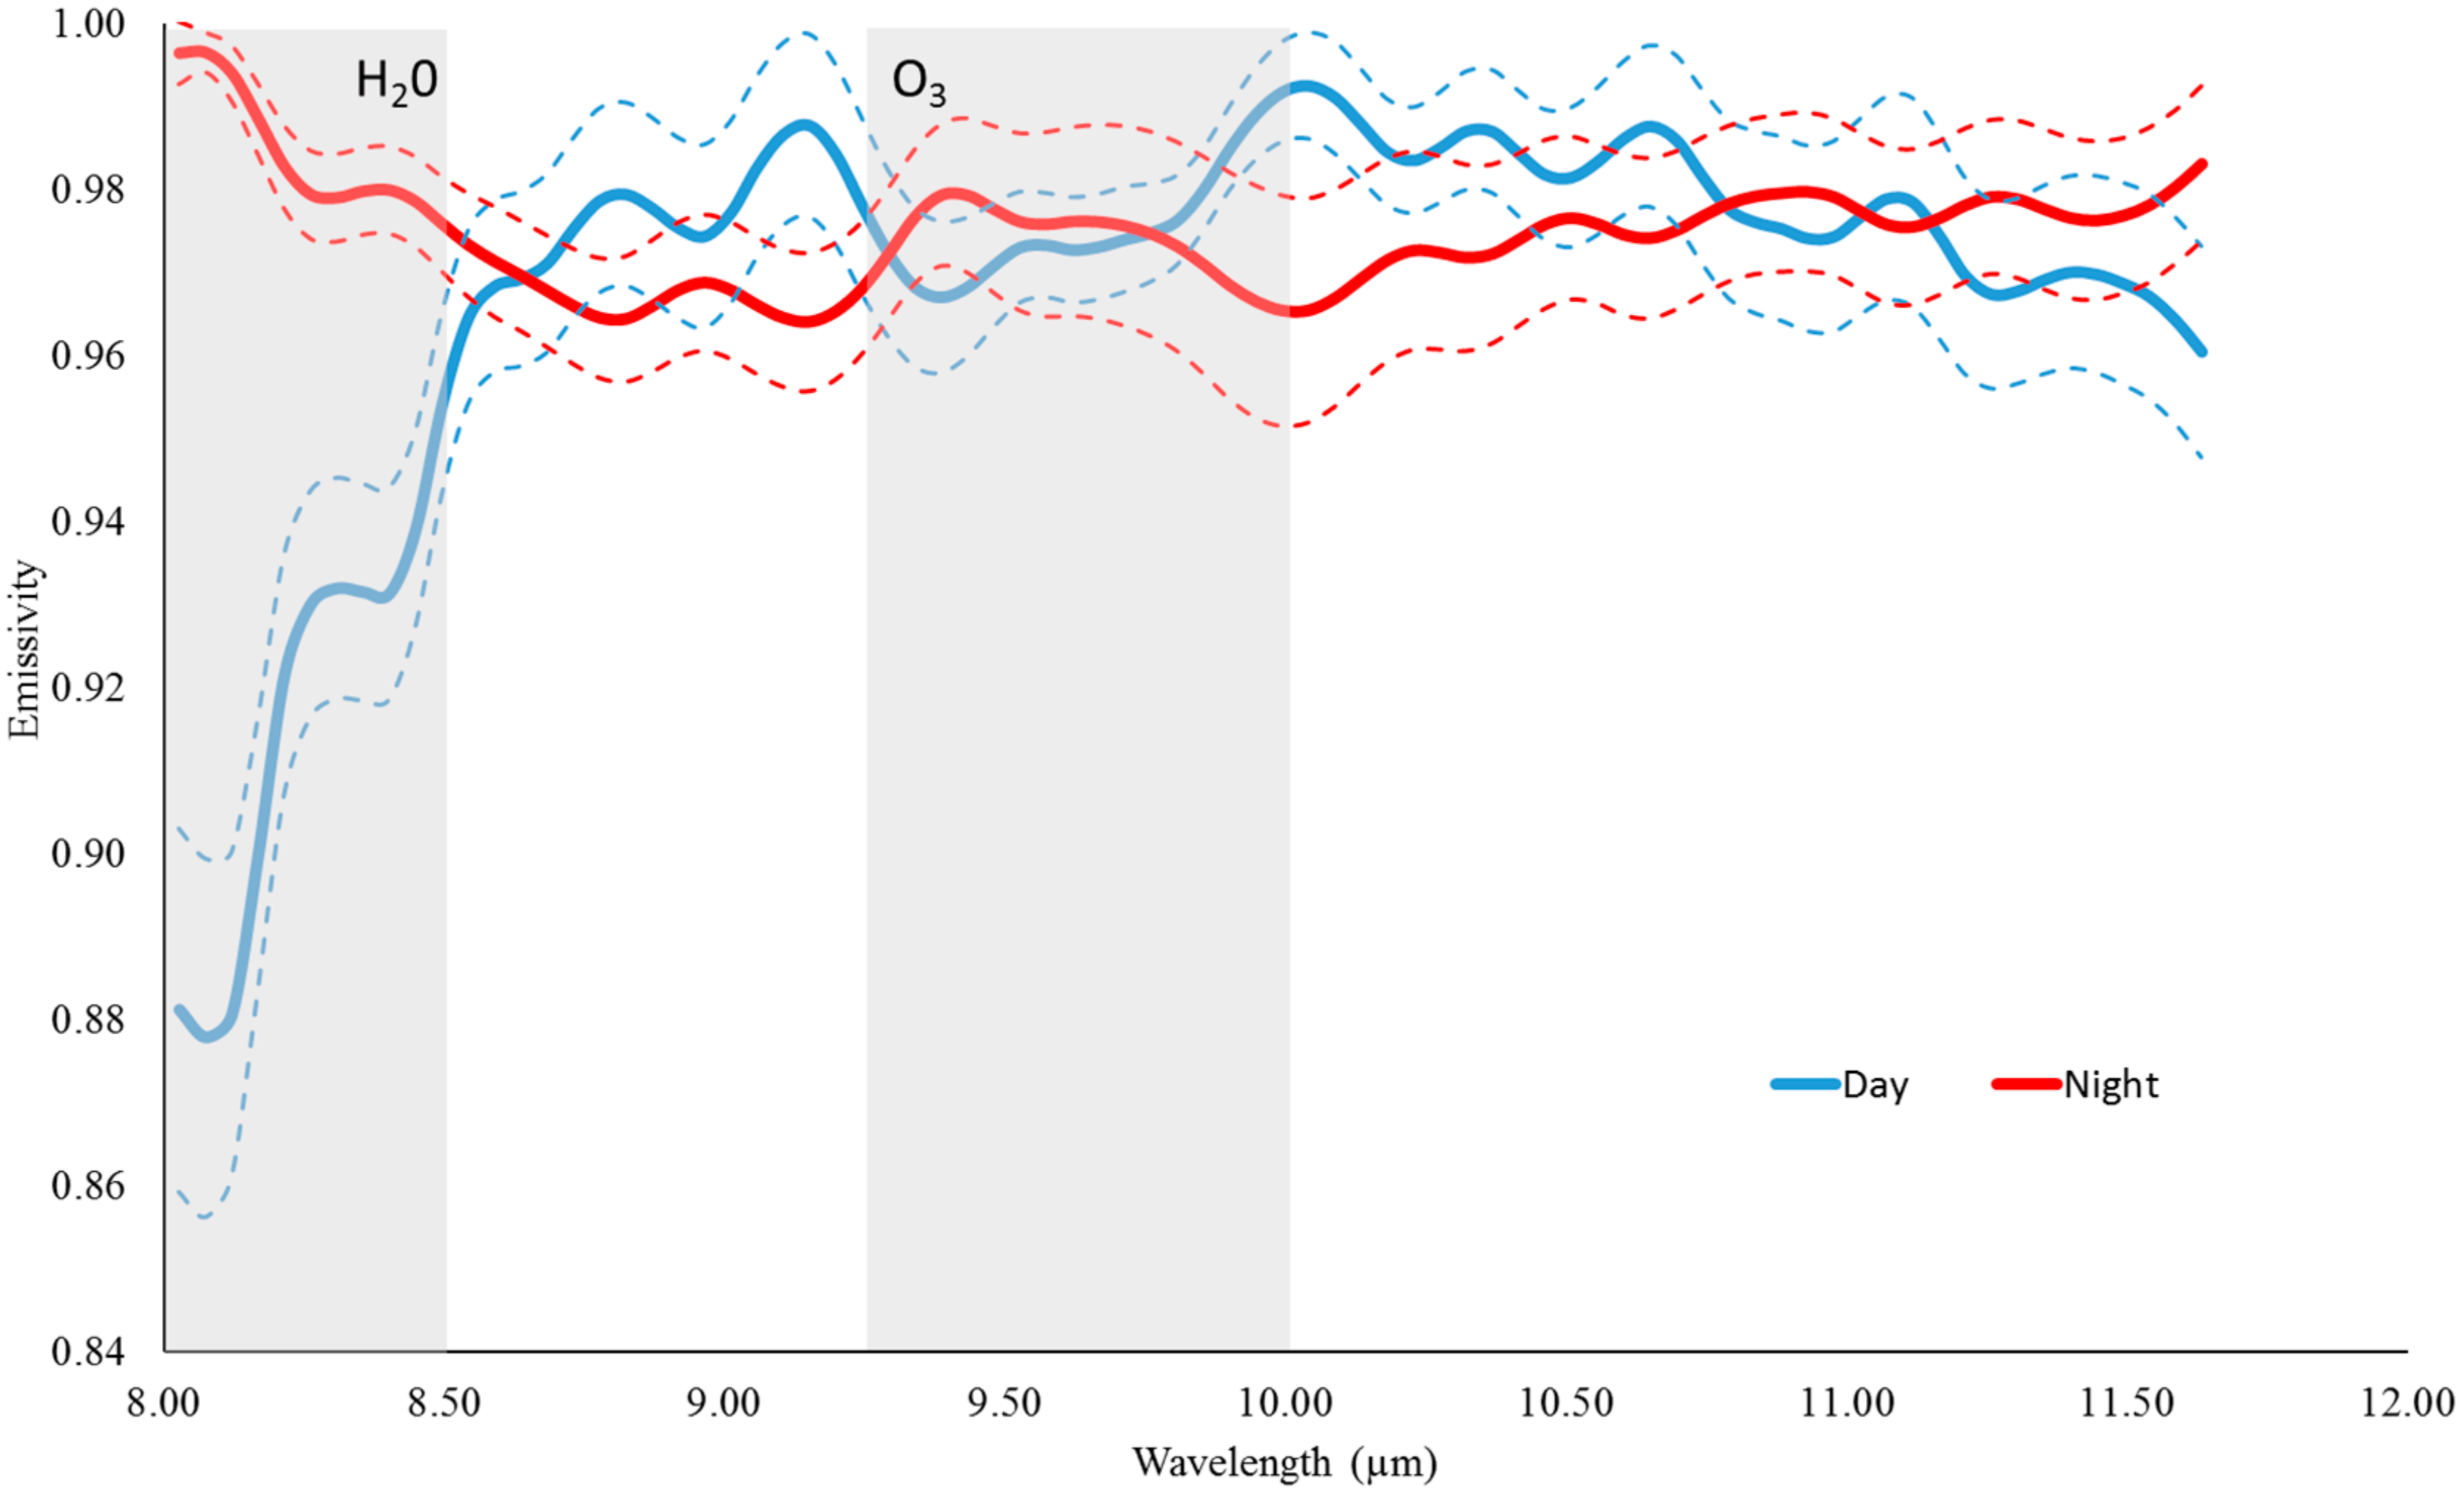
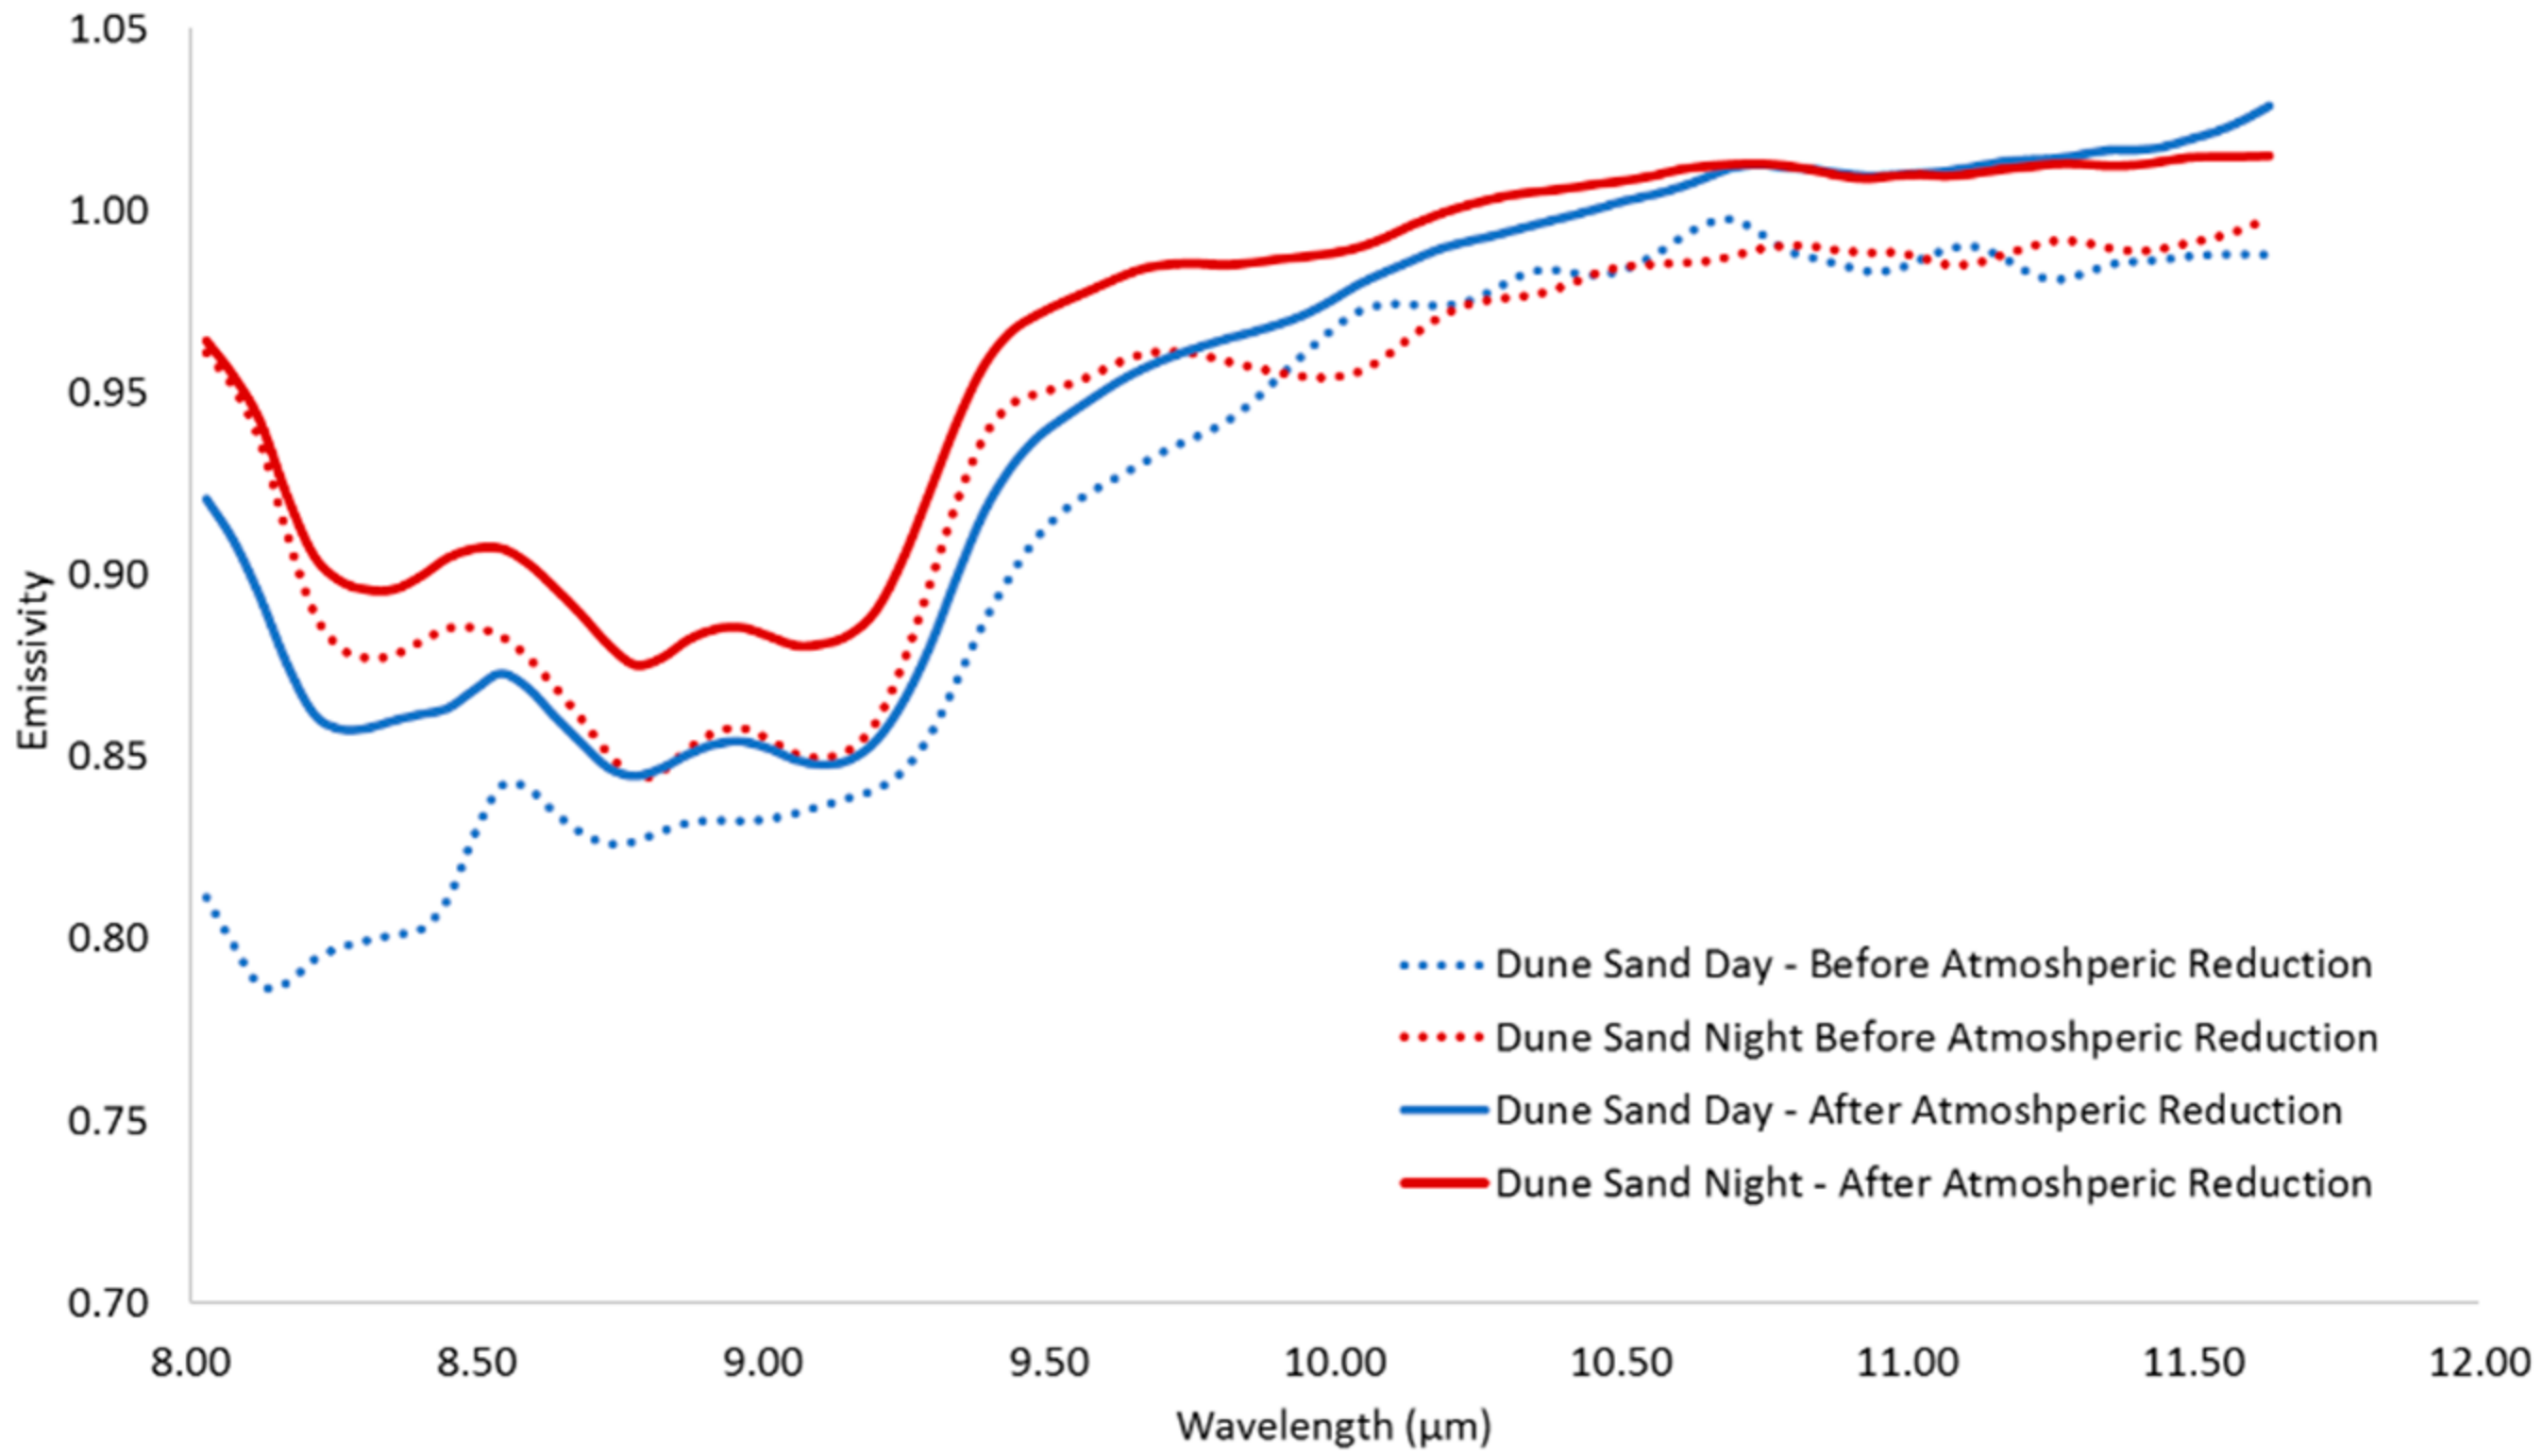
3.1. Atmospheric Reduction

Applying the atmospheric reduction algorithm to the day and night at-sensor radiance images produced DNSO values with complementary pixel frequency (Table 2). We selected a threshold of DNSO = 0.83, resulting in a selection of 199 pixels, since this value is a good compromise between a high DNSO value and a sufficient number of pixels for analysis. The selected pixels contain mainly desert plants and agricultural crop surface, and their average pseudo emissivity spectra (Ls/Lbb) lack surface features, and therefore represent the atmospheric contribution (Figure 3). Dividing the spectrum of each pixel in the day or night pseudo emissivity image by the corresponding day or night DNSO average spectrum (henceforth, gain spectrum) reduced the atmospheric contribution to enhance the surface features as demonstrated by the similarities of the day and night sand dune spectra (Figure 4).

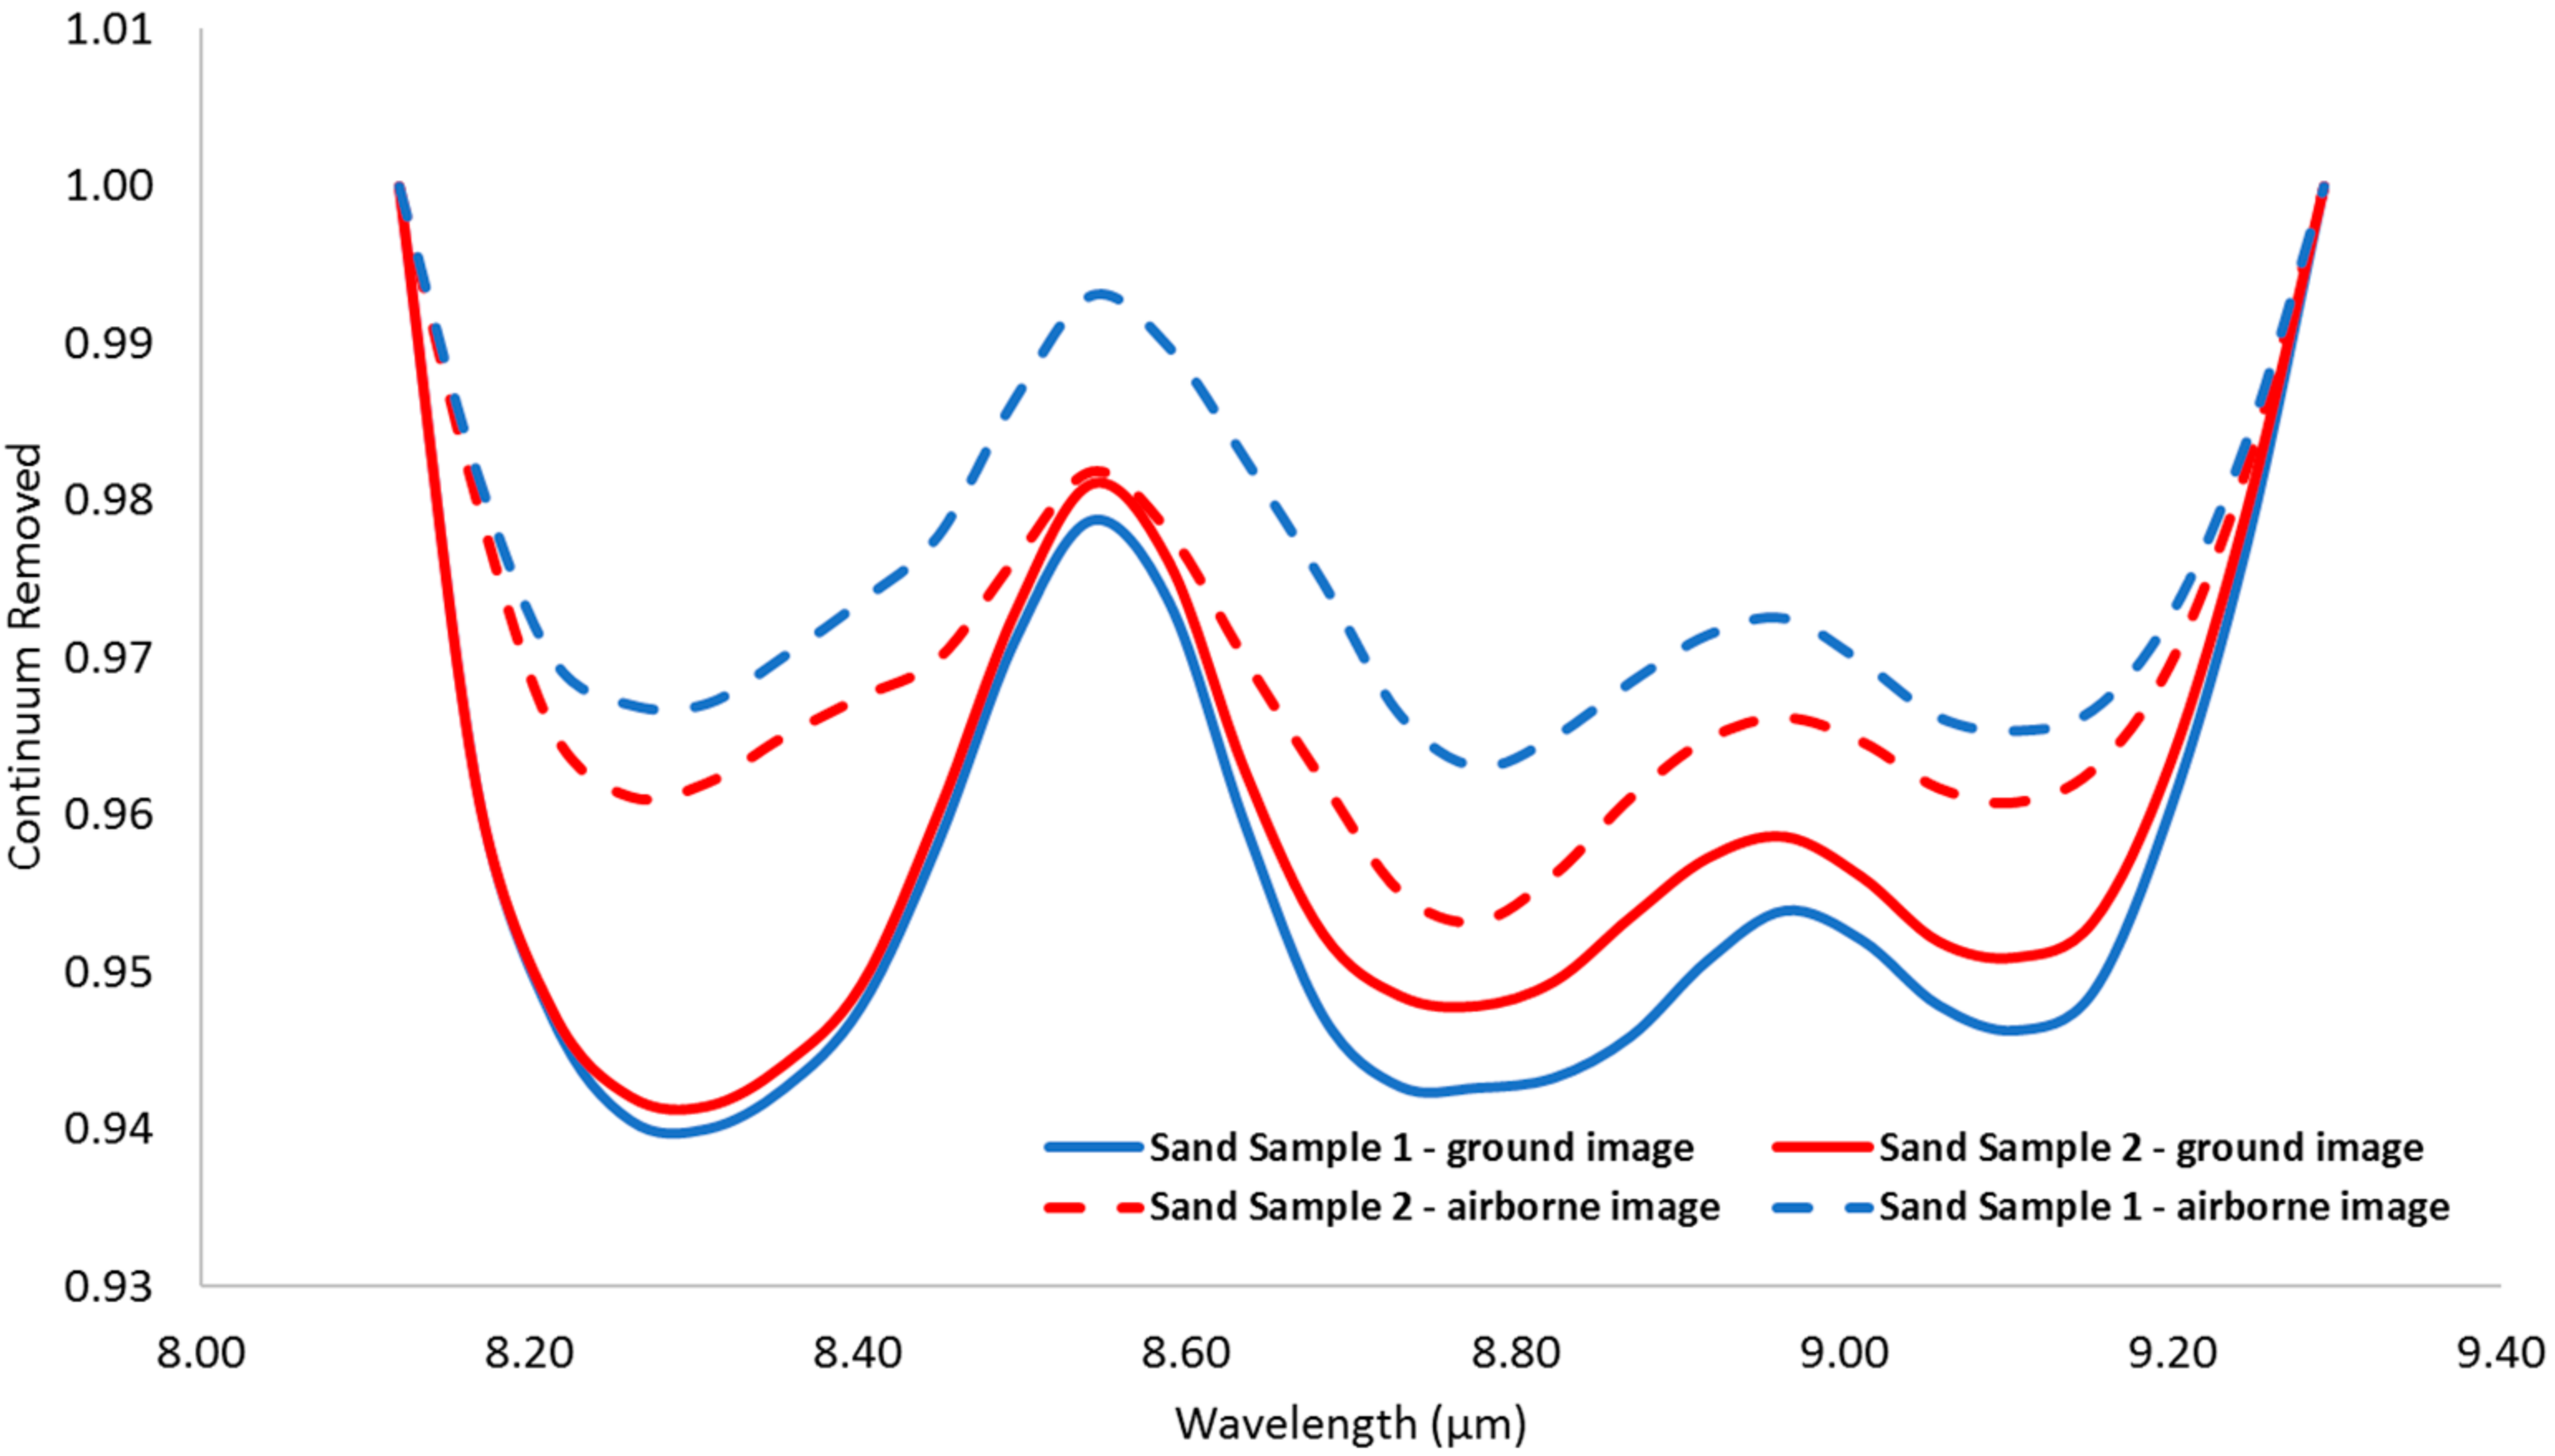
3.2. Validation of the Atmospheric Feature Reduction Procedure
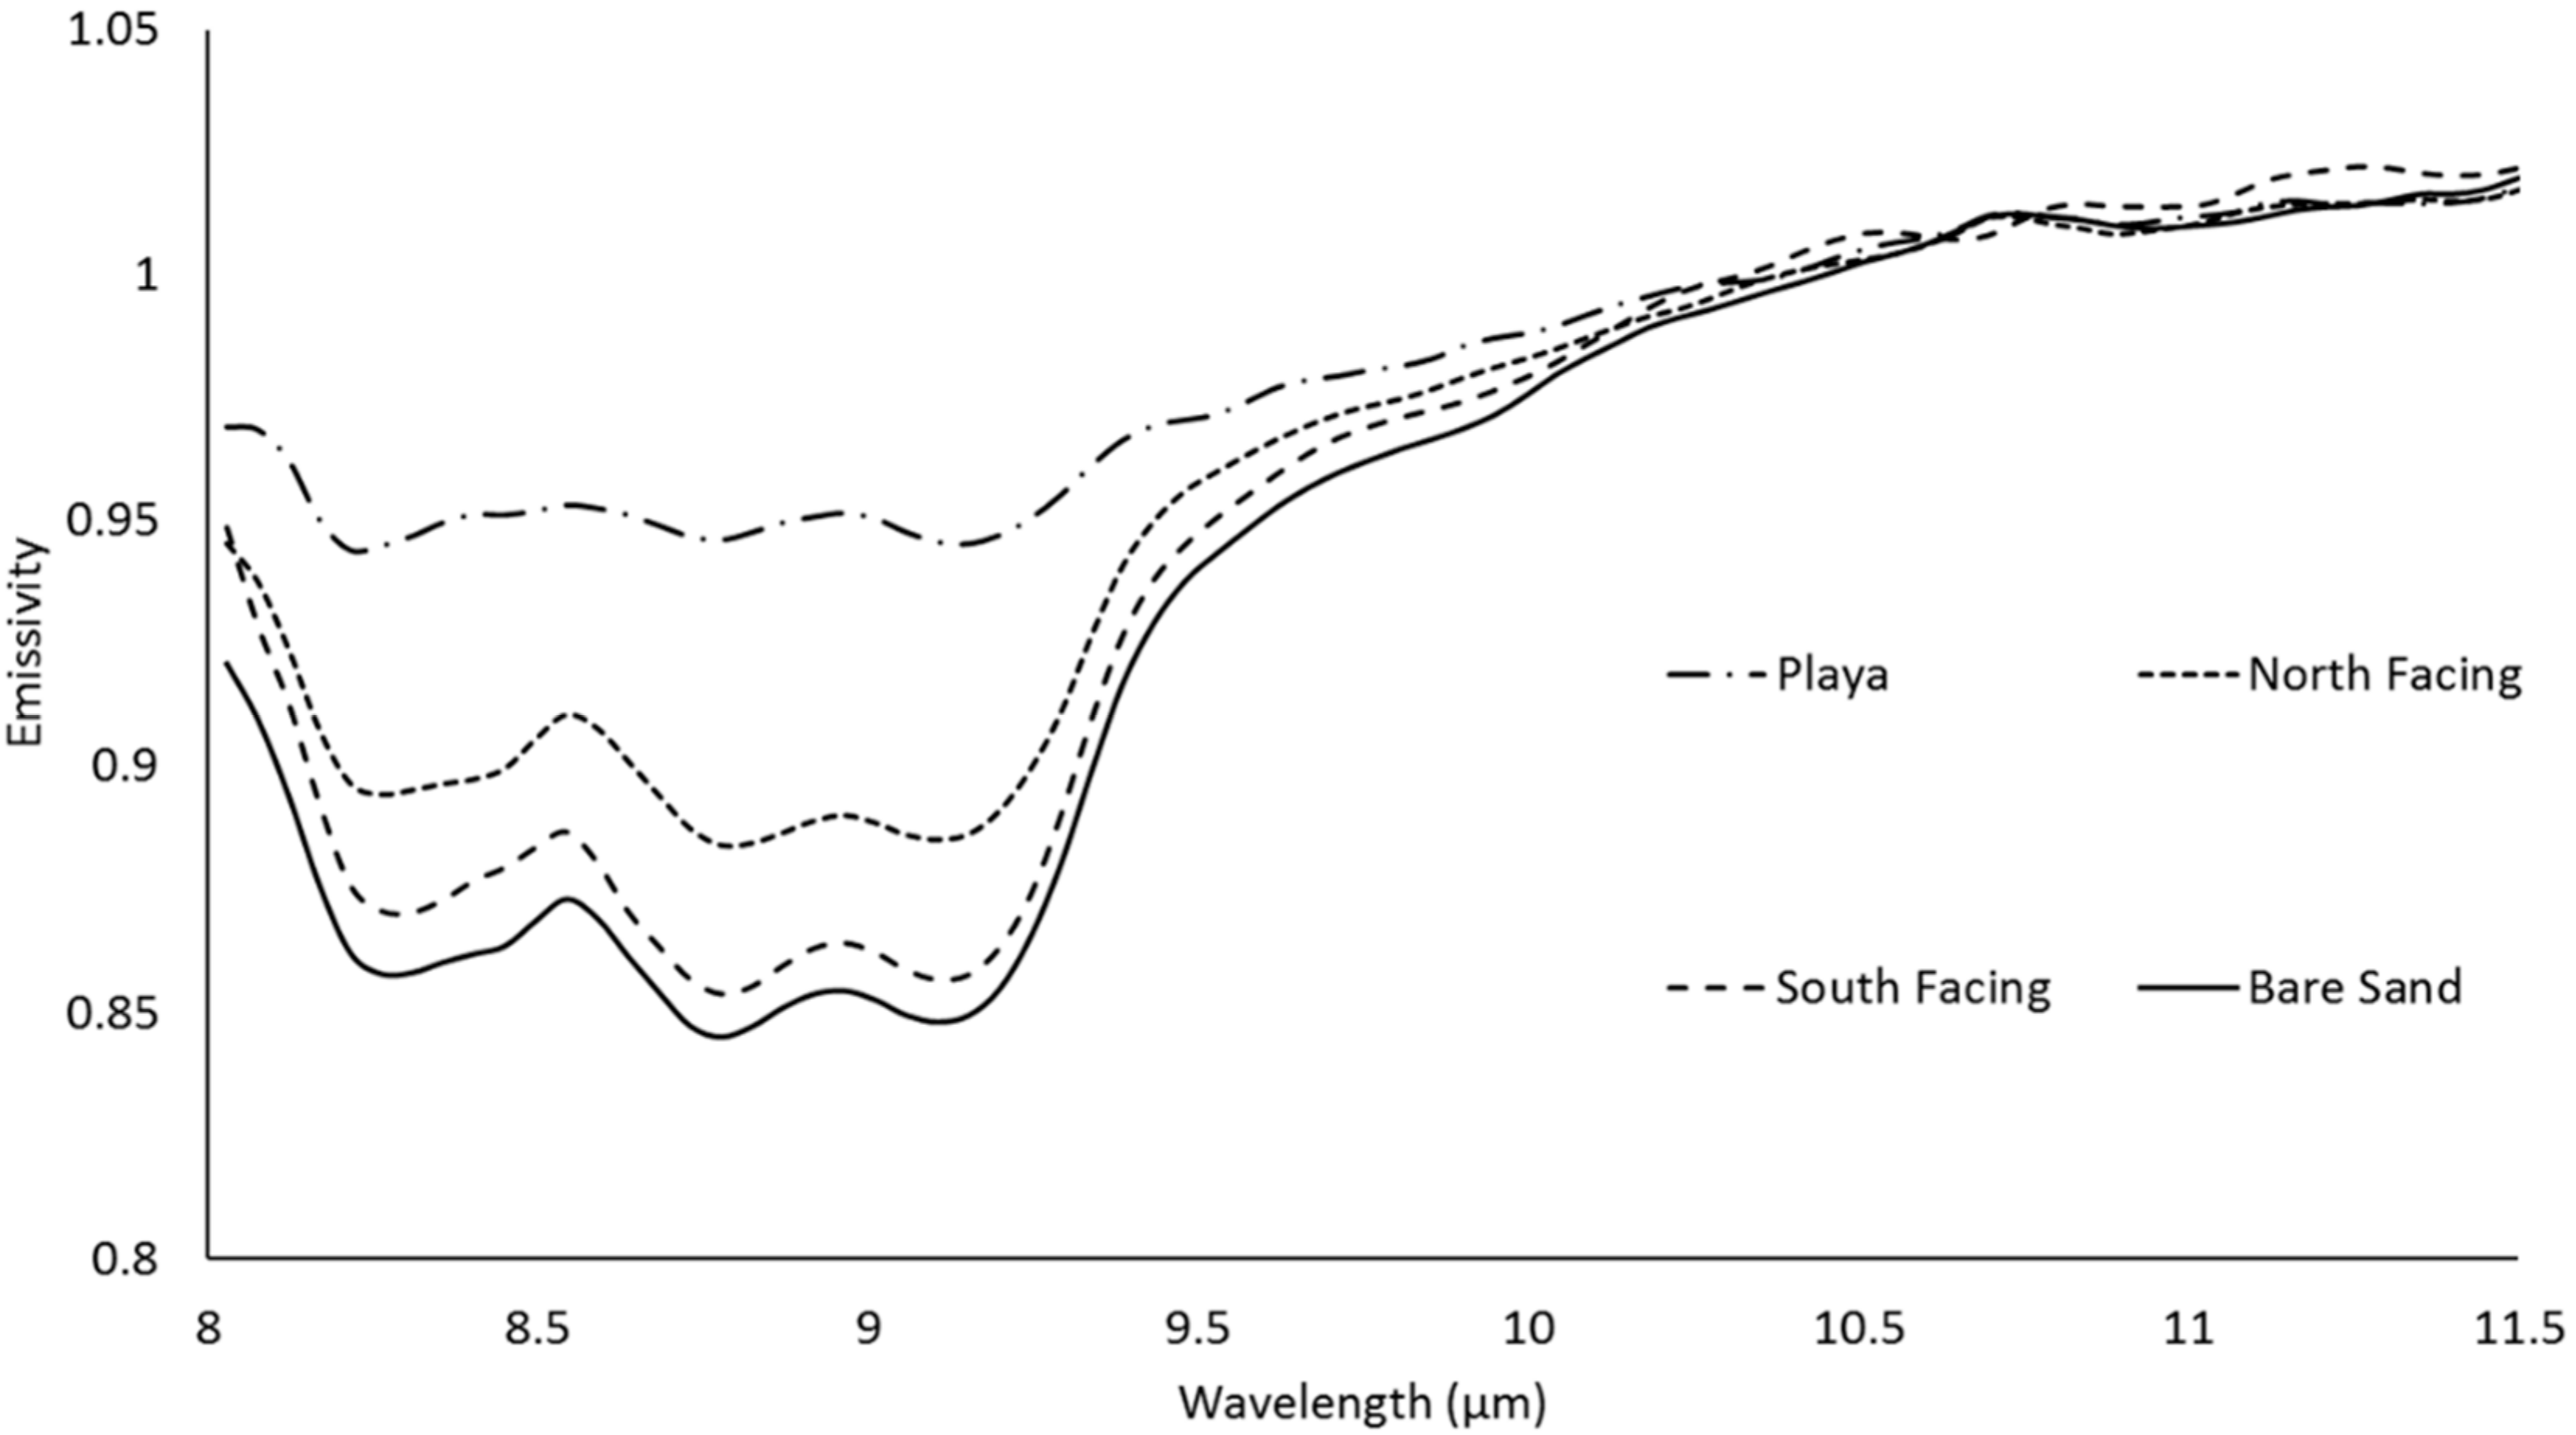
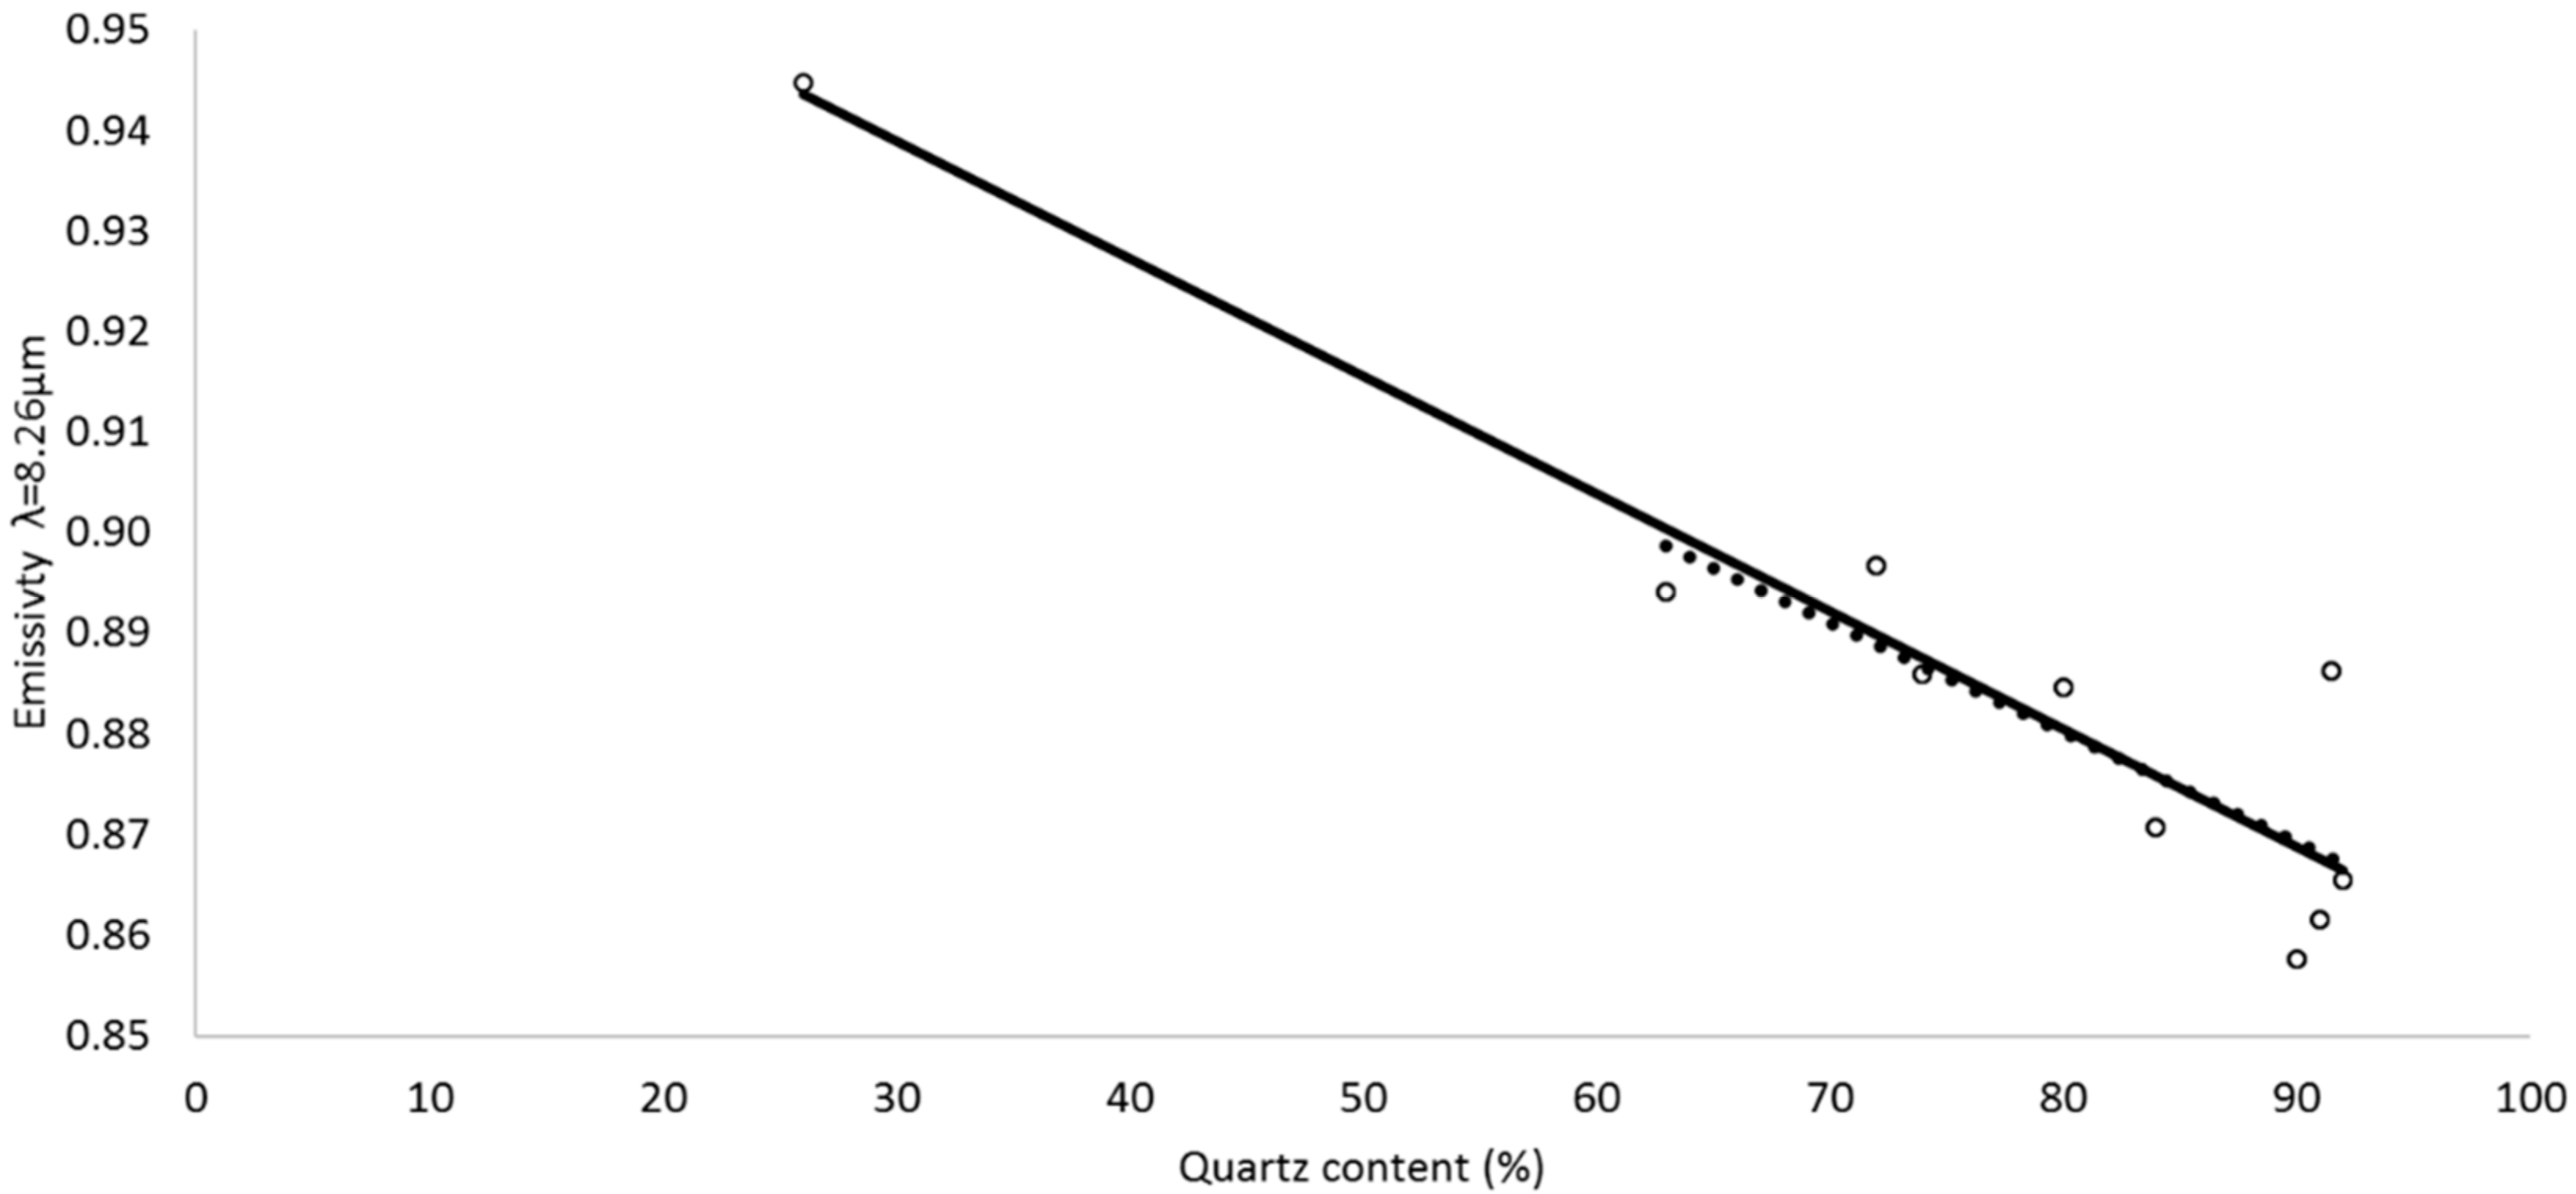
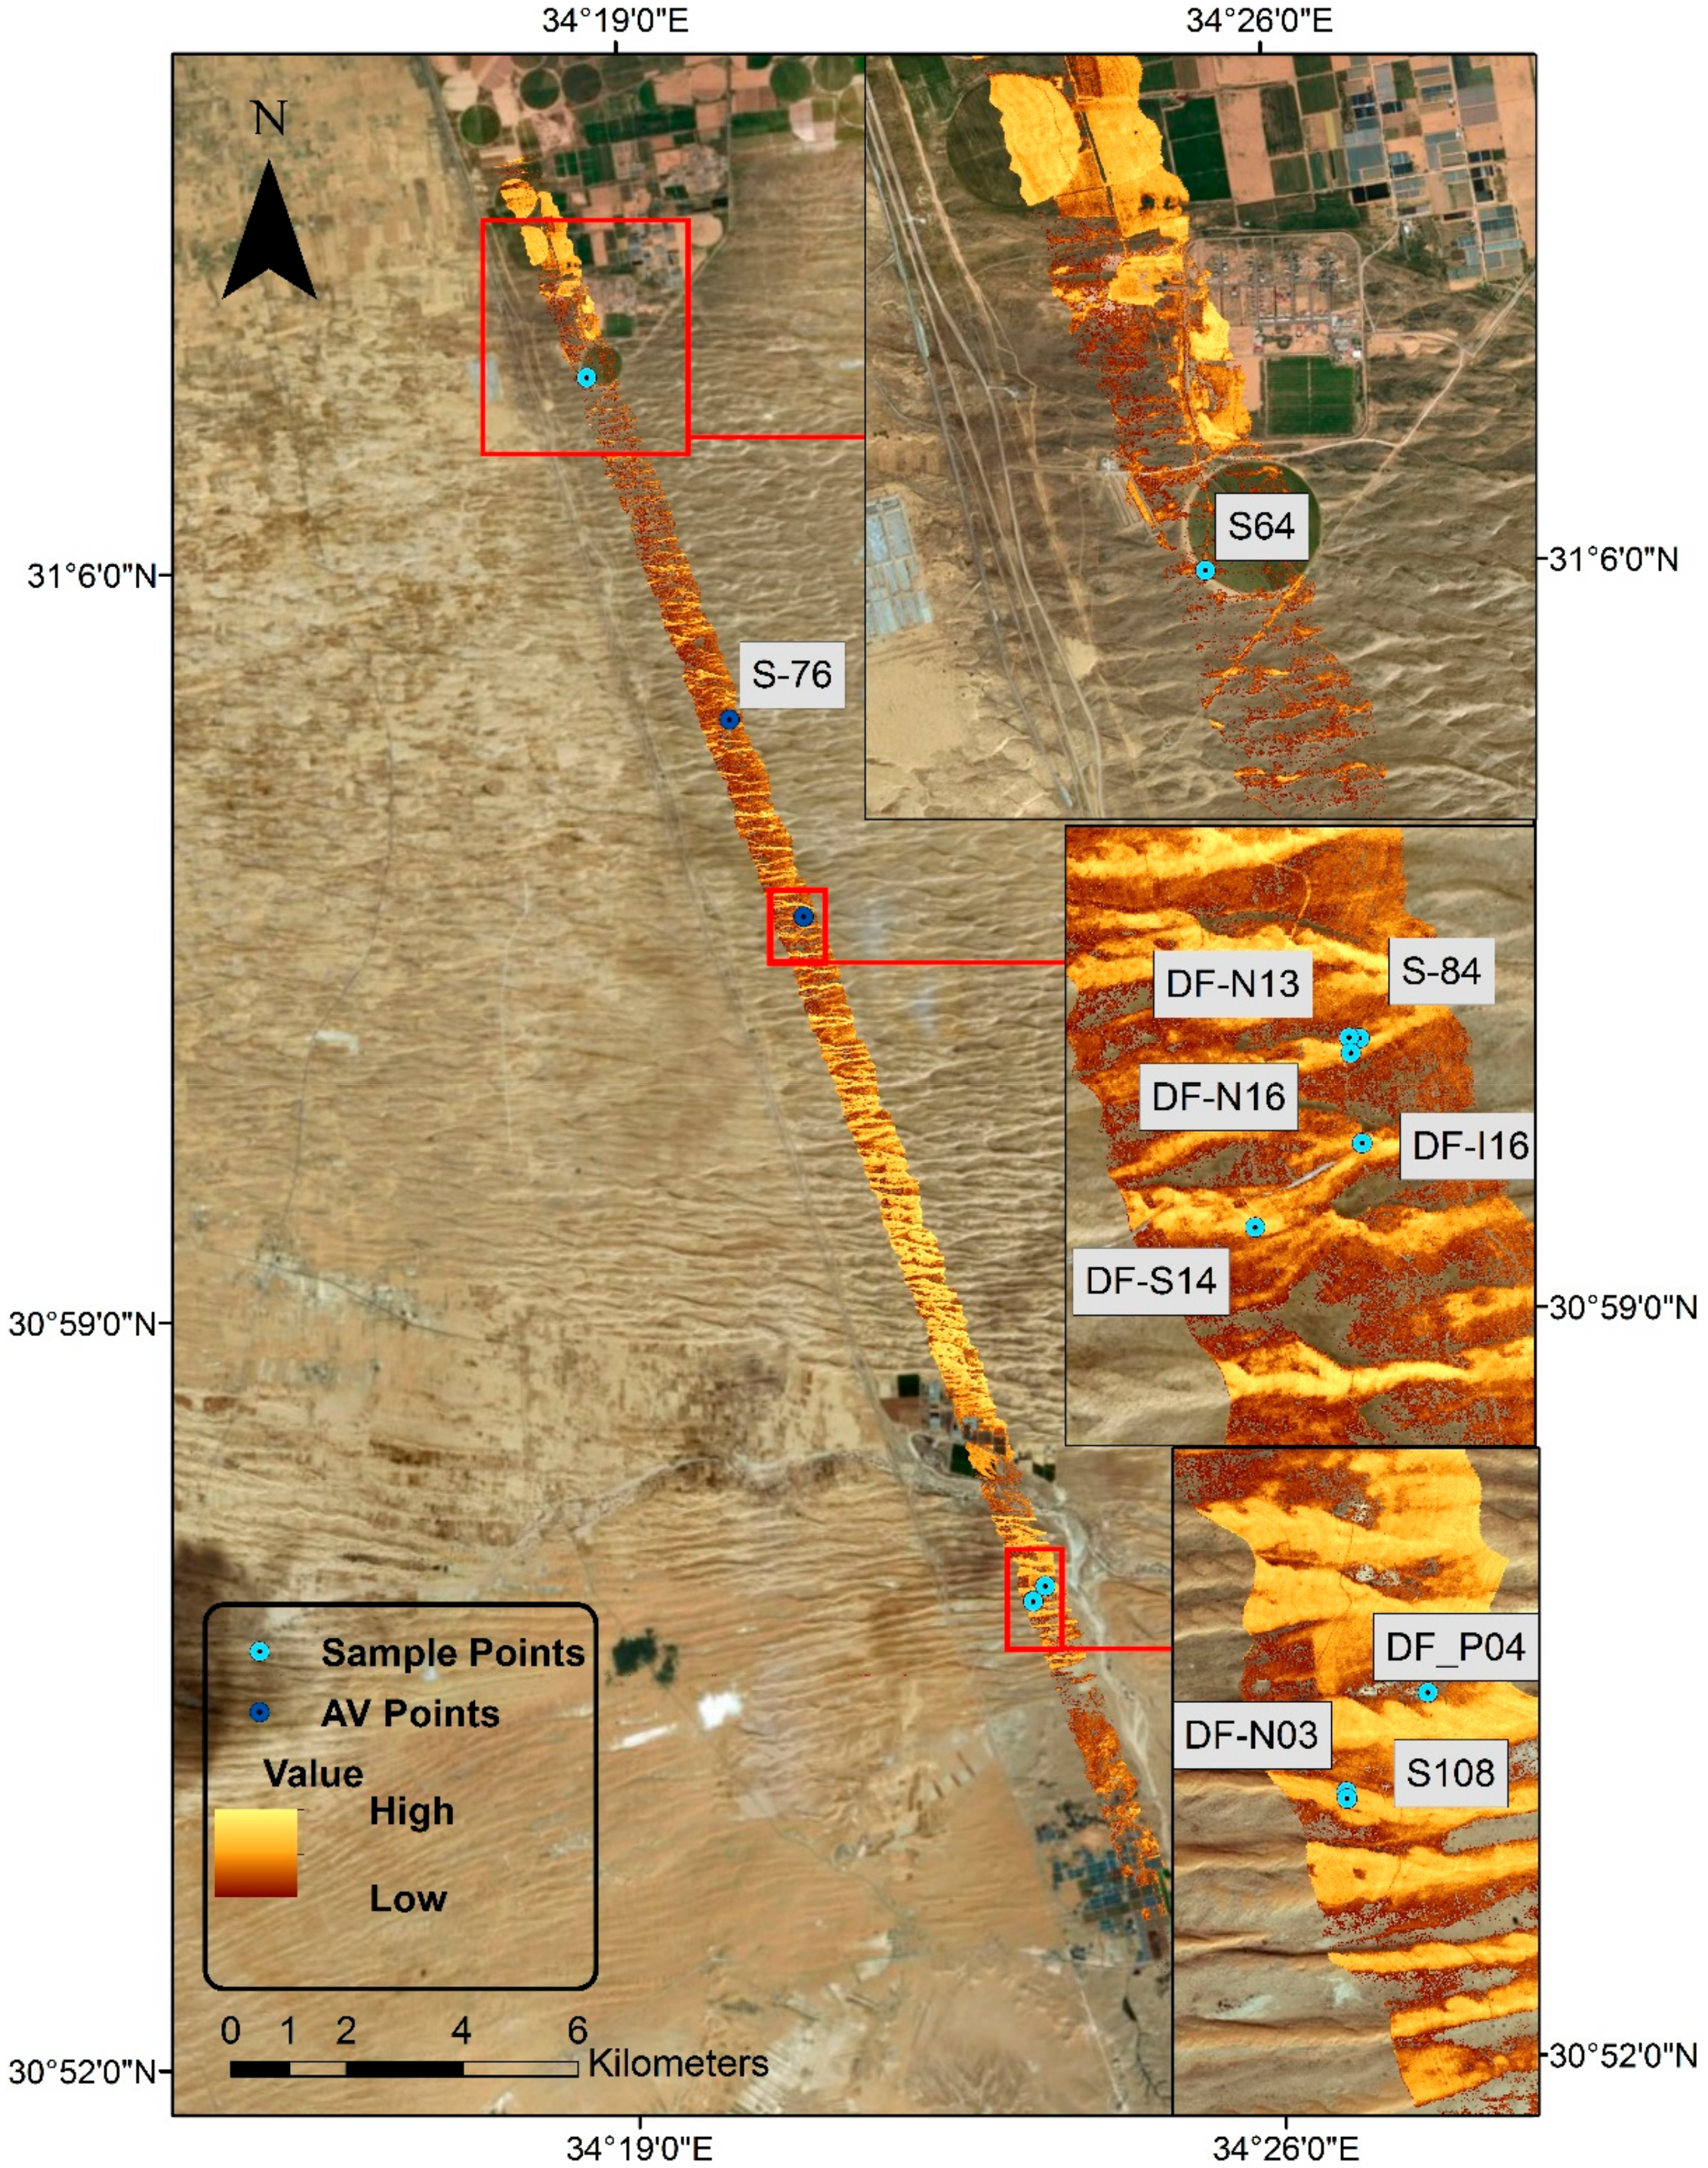
The differences in the quartz features (8.0–9.5 µm) between the day and night images prior to gain spectrum application (Figure 4, dashed curves) were greatly reduced by the application of the gain spectrum, albeit still affected by downwelling radiance, and similar quartz features were enhanced (Figure 4, solid curves). A comparison of the spectral resemblance between the two ground images and their matching pixels in the airborne image, using the CR spectrum, showed very good similarities (Figure 5), with a decreasing SAM angle following the application of the gain spectrum (Table 3).

3.3. Quartz Content

Attenuation of the quartz feature (Figure 6) seemed to be related to the surface cover: a difference between the south-facing, less-developed BSC and the north-facing, mature and well-developed BSC was observed. The playa surface and bare sand constituted the extreme ends of the overall emissivity signal (highest and lowest emissivity, respectively) (Figure 6).
The spectra of the 10 samples were extracted from the image pixels. The high coefficient of determination (R2 = 0.88) between the quartz content and the emissivity at the quartz center of absorption band (λ = 8.26) showed a good linear correlation, although one sample had very little quartz content in both the image spectra and the XRD analysis (Figure 7). This was a playa surface sample characterized as fine-grained carbonate sediment [20,25]. Calculating the linear correlation without the playa sample resulted in a lower coefficient of determination (R2 = 0.61), yet the slope of the regression line barely changed.
Applying the classification methodology to both day and night images produced slightly different results (presumably because of uncorrected downwelling radiance). Some pixels that were classified as quartz during the day were not classified as quartz during the night and vice versa. We therefore applied an extra step to produce a quartz map (Figure 8) based on pixels that were classified as quartz in both day and night images. The relative amounts of surface quartz content can be mapped for day or night apparent emissivity images using the values of either wavelength at the center of the quartz doublet feature (λ = 8.26 µm, λ = 9.15 µm). This is due to the fact that an excellent correlation (R2 ≈ 0.99) is exhibited between these values in both day and night images. Accordingly, we demonstrate this using the day image, λ = 8.26 µm (Figure 8).

4. Discussion

The north-facing, well-developed, and mature BSC exhibited a shallow quartz emissivity feature with high overall emissivity. The south-facing BSC, which is less developed, masked the quartz emissivity feature to a lesser degree, and bare sand had the lowest emissivity spectrum in the quartz region, showing the strongest quartz emissivity feature (Figure 6). These results are in agreement with a previous study of the area that showed this for samples in petri dishes using a point radiometer [20]. The current study shows these effects for the first time using high-spatial-resolution airborne hyperspectral LWIR imagery.
The quartz content map (Figure 8) shows different regions that are not classified as containing quartz. Validation using an orthophoto revealed that these are quartz-poor areas (e.g., riverbed covered with limestone pebbles, very thick BSC and playa). Our ground sample mineralogy is in agreement with the results published by Kidron et al. [32], showing that BSC is composed of 10–40% silt and clay particles, while our findings showed similar values for various types of BSC. In addition, we show that in sand samples, these values drop to less than 10%, whereas Kidron et al. [32] reported less than 5%. The small differences between our results and those of Kidron et al. [32] are within the margin of error of the XRD analysis.
The DNSO algorithm was able to enhance the surface emissivity signal and remove a great deal of the atmospheric contribution across the entire 8–12 µm spectrum in images acquired by an airborne sensor. The underlying assumption of the algorithm is that the surface emissivity does not change between day and night. However, minute diurnal fluctuations of the surface emissivity of the dunes in this area, due to minor changes in topsoil moisture, were demonstrated by Rozenstein et al. [20]. The authors reported that these fluctuations were on the order of ~0.1 at 8.7 µm and ~0.01 at 10.8 µm and 12 µm. This explains the greater agreement between day and night apparent emissivity signatures at longer wavelengths compared to the quartz feature wavebands. The algorithm succeeded in producing a surface quartz content map even in this environment where significant emissivity fluctuations occur diurnally because of water vapor adsorption by the surface. This is probably because the night pass was relatively early into the night (23:12 UTC), while the increase in emissivity due to water vapor adsorption by the surface was still ongoing.
While most of the playa surfaces in the scene were classified as not containing quartz due to our classification threshold, during our field campaign, we did observe that the playas were covered by some windblown sand particles. The XRD analysis also showed some quartz content on the playa’s surface (albeit much less than for the sand dune). Therefore, we saw fit to include the playa sample in the linear regression analysis (Figure 7). In addition, the long distance covered by this flight line (33 km) is difficult to cover on the ground, particularly due to restrictions imposed by the army in recent years. Therefore, the 10 sample points were selected in a manner which captured as much heterogeneity of the area as possible. Furthermore, quantification of the quartz content on the surface by remote sensing was achieved using only one narrow band that correlated with the quartz content determined by the XRD analysis. A high coefficient of determination (R2 = 0.88) was achieved despite great differences in scale representation: the image spectra represent a pixel area of 2 m2, and the XRD analysis is produced from several grains of small particles. The high correlation across these scales is very encouraging. This case study contributes to our understanding of the strengths and limitations of our recently developed method for surface emissivity extraction from hyperspectral remote sensing in the LWIR region, and thus paves the way to advancing our understanding of BSCs in quartz-rich environments.
Moreover, as the surface cover is almost always a mixture of different elements, the quartz feature may well be attenuated by other minerals, such as clay-sized silicates, carbonates, water, or vegetation (e.g., [36]), besides BSCs, which are the dominant surface cover in this scene.

5. Conclusions

A newly developed method for atmospheric reduction in the LWIR domain was successfully applied to day and night hyperspectral airborne images of a desert dune environment. The results of this method enabled us to enhance the surface emissivity features while minimizing the atmospheric effects and to yield an apparent surface emissivity product. Based on this approach, using airborne hyperspectral LWIR imagery, we were able to map the surface quartz content and found a good match with laboratory measurements (R2 = 0.88). Consequently, this study lays the foundation for mapping surface properties in quartz-rich environments dominated by BSCs and sets the scene for mapping their ecosystem functions.

Author Contributions

S.W. processed the airborne and ground data, analyzed the results, and is the main contributor to the paper. O.R. conceived and designed the field sampling for validation, supervised the modeling work, and revised the paper. E.B.-D. was the project supervisor, participated in all stages of the work, and revised the manuscript.

Funding

This work was supported by the Israel Science Foundation fund, grant No. [1395/15] and by the Ministry of Science and Technology, fund 68740.

Acknowledgments

The authors wish to acknowledge the contribution of Gila Notesco (Tel-Aviv University) to the data analysis steps and Arnon Karnieli (Ben-Gurion University) for facilitating the XRD analysis.

Conflicts of Interest

The authors declare no conflict of interest.

References

  1. Ben-Dor, E.; Chabrillat, S.; Demattê, J.A.M.; Taylor, G.R.; Hill, J.; Whiting, M.L.; Sommer, S. Using imaging spectroscopy to study soil properties. Remote Sens. Environ. 2009, 113, S38–S55. [Google Scholar] [CrossRef]
  2. Eisele, A.; Chabrillat, S.; Hecker, C.; Hewson, R.; Lau, I.C.; Rogass, C.; Segl, K.; Cudahy, T.J.; Udelhoven, T.; Hostert, P.; et al. Advantages using the thermal infrared (TIR) to detect and quantify semi-arid soil properties. Remote Sens. Environ. 2015, 163, 296–311. [Google Scholar] [CrossRef]
  3. Vaughan, R.G.; Calvin, W.M.; Taranik, J.V. SEBASS hyperspectral thermal infrared data: surface emissivity measurement and mineral mapping. Remote Sens. Environ. 2003, 85, 48–63. [Google Scholar] [CrossRef]
  4. Notesco, G.; Ogen, Y.; Ben-Dor, E. Mineral classification of Makhtesh Ramon in Israel using hyperspectral longwave infrared (LWIR) remote-sensing data. Remote Sens. 2015, 7, 12282–12296. [Google Scholar] [CrossRef]
  5. Gillespie, A.; Rokugawa, S.; Matsunaga, T.; Steven Cothern, J.; Hook, S.; Kahle, A.B. A temperature and emissivity separation algorithm for advanced spaceborne thermal emission and reflection radiometer (ASTER) images. IEEE Trans. Geosci. Remote Sens. 1998, 36, 1113–1126. [Google Scholar] [CrossRef]
  6. Coll, C.; Caselles, V.; Rubio, E.; Sospedra, F.; Valor, E. Temperature and emissivity separation from calibrated data of the digital airborne imaging spectrometer. Remote Sens. Environ. 2001, 76, 250–259. [Google Scholar] [CrossRef]
  7. Young, S.J.; Johnson, B.R.; Hackwell, J.A. An in-scene method for atmospheric compensation of thermal hyperspectral data. J. Geophys. Res. Atmos. 2002, 107, 1–20. [Google Scholar] [CrossRef]
  8. Cheng, J.; Liang, S.; Wang, J.; Li, X. A stepwise refining algorithm of temperature and emissivity separation for hyperspectral thermal infrared data. IEEE Trans. Geosci. Remote Sens. 2010, 48, 1588–1597. [Google Scholar] [CrossRef]
  9. Borel, C.C.; Tuttle, R.F. Recent advances in temperature-emissivity separation algorithms. In Proceedings of the 2011 Aerospace Conference, Big Sky, MT, USA, 5–12 March 2011; pp. 1–14. [Google Scholar]
  10. Lahaie, P. Performance estimation tools for: Decoupling by filtering of temperature and emissivity (Defilte), an algorithm for thermal hyperspectral image processing. Int. J. High Speed Electron. Syst. 2008, 18, 675–699. [Google Scholar] [CrossRef]
  11. Weksler, S.; Notesco, G.; Ben-Dor, E. An automated procedure for reducing atmospheric features and emphasizing surface emissivity in hyperspectral longwave infrared (LWIR) images. Int. J. Remote Sens. 2017, 38, 4481–4493. [Google Scholar] [CrossRef]
  12. Notesco, G.; Kopačková, V.; Rojík, P.; Schwartz, G.; Livne, I.; Dor, E. Mineral classification of land surface using multispectral LWIR and hyperspectral SWIR remote-sensing data. A case study over the Sokolov Lignite Open-Pit Mines, the Czech Republic. Remote Sens. 2014, 6, 7005–7025. [Google Scholar] [CrossRef]
  13. West, N.E. Structure and function of microphytic soil crusts in wildland ecosystems of arid to semi-arid regions. Adv. Ecol. Res. 1990, 20, 179–223. [Google Scholar]
  14. Bowker, M.A. Biological soil crust rehabilitation in theory and practice: An underexploited opportunity. Restor. Ecol. 2007, 15, 13–23. [Google Scholar] [CrossRef]
  15. Burgheimer, J.; Wilske, B.; Maseyk, K.; Karnieli, A.; Zaady, E.; Yakir, D.; Kesselmeier, J. Relationships between normalized difference vegetation index (NDVI) and carbon fluxes of biologic soil crusts assessed by ground measurements. J. Arid Environ. 2006, 64, 651–669. [Google Scholar] [CrossRef]
  16. Belnap, J. The potential roles of biological soil crusts in dryland hydrologic cycles. Hydrol. Process. 2006, 20, 3159–3178. [Google Scholar] [CrossRef]
  17. Wu, N.; Zhang, Y.M.; Downing, A. Comparative study of nitrogenase activity in different types of biological soil crusts in the Gurbantunggut Desert, Northwestern China. J. Arid Environ. 2009, 73, 828–833. [Google Scholar] [CrossRef]
  18. Belnap, J.; Prasse, R.; Harper, K.T. Influence of Biological Soil Crusts on Soil Environments and Vascular Plants. In Ecological Studies; Springer: Berlin/Heidelberg, Germany, 2001; pp. 281–300. [Google Scholar]
  19. Belnap, J.; Weber, B.; Büdel, B. Biological Soil Crusts as an Organizing Principle in Drylands. In Ecological Studies; Springer International Publishing: Basel, Switzerland, 2016; pp. 3–13. [Google Scholar]
  20. Rozenstein, O.; Karnieli, A. Identification and characterization of biological soil crusts in a sand dune desert environment across Israel-Egypt border using LWIR emittance spectroscopy. J. Arid Environ. 2015, 112, 75–86. [Google Scholar] [CrossRef]
  21. Rozenstein, O.; Zaady, E.; Katra, I.; Karnieli, A.; Adamowski, J.; Yizhaq, H. The effect of sand grain size on the development of cyanobacterial biocrusts. Aeolian Res. 2014, 15, 217–226. [Google Scholar] [CrossRef]
  22. Rozenstein, O.; Adamowski, J. A review of progress in identifying and characterizing biocrusts using proximal and remote sensing. Int. J. Appl. Earth Obs. Geoinform. 2017, 57, 245–255. [Google Scholar] [CrossRef]
  23. Rozenstein, O.; Agam, N.; Serio, C.; Masiello, G.; Venafra, S.; Achal, S.; Puckrin, E.; Karnieli, A. Diurnal emissivity dynamics in bare versus biocrusted sand dunes. Sci. Total Environ. 2015, 506–507, 422–429. [Google Scholar] [CrossRef] [PubMed]
  24. Qin, Z.; Berlinerw, P.; Karnieli, A. Micrometeorological modeling to understand the thermal anomaly in the sand dunes across the Israel-Egypt border. J. Arid Environ. 2002, 51, 281–318. [Google Scholar] [CrossRef]
  25. Roskin, J.; Blumberg, D.G.; Porat, N.; Tsoar, H.; Rozenstein, O. Do dune sands redden with age? The case of the northwestern Negev dunefield, Israel. Aeolian Res. 2012, 5, 63–75. [Google Scholar] [CrossRef]
  26. Roskin, J.; Porat, N.; Tsoar, H.; Blumberg, D.G.; Zander, A.M. Age, origin and climatic controls on vegetated linear dunes in the northwestern Negev Desert (Israel). Quat. Sci. Rev. 2011, 30, 1649–1674. [Google Scholar] [CrossRef]
  27. Karnieli, A.; Tsoar, H. Spectral reflectance of biogenic crust developed on desert dune sand along the Israel-Egypt border. Int. J. Remote Sens. 1995, 16, 369–374. [Google Scholar] [CrossRef]
  28. Tsoar, H.; Blumberg, D.G.; Wenkart, R. Formation and Geomorphology of the North-Western Negev Sand Dunes; Springer: Berlin/Heidelberg, Germany, 2008; pp. 25–48. [Google Scholar]
  29. Tsoar, H.; Karnieli, A. What determines the spectral reflectance of the Negev-Sinai sand dunes. Int. J. Remote Sens. 1996, 17, 513–525. [Google Scholar] [CrossRef]
  30. Breckle, S.W.; Yair, A.; Veste, M. Arid Dune Ecosystems: The Nizzana Sands in the Negev Desert; Springer: Berlin/Heidelberg, Germany, 2008; ISBN 9783540754978. [Google Scholar]
  31. Zaady, E.; Katra, I.; Yizhaq, H.; Kinast, S.; Ashkenazy, Y. Inferring the impact of rainfall gradient on biocrusts’ developmental stage and thus on soil physical structures in sand dunes. Aeolian Res. 2014, 13, 81–89. [Google Scholar] [CrossRef]
  32. Kidron, G.J.; Barzilay, E.; Sachs, E. Microclimate control upon sand microbiotic crusts, western Negev Desert, Israel. Geomorphology 2000, 36, 1–18. [Google Scholar] [CrossRef]
  33. Karnieli, A.; Kidron, G.J.; Glaesser, C.; Ben-Dor, E. Spectral characteristics of cyanobacteria soil crust in semiarid environments. Remote Sens. Environ. 1999, 69, 67–75. [Google Scholar] [CrossRef]
  34. Qin, Z.; Berliner, P.R.; Karnieli, A. Ground temperature measurement and emissivity determination to understand the thermal anomaly and its significance on the development of an arid environmental ecosystem in the sand dunes across the Israel-Egypt border. J. Arid Environ. 2005, 60, 27–52. [Google Scholar] [CrossRef]
  35. Kruse, F.A.; Lefkoff, A.B.; Boardman, J.W.; Heidebrecht, K.B.; Shapiro, A.T.; Barloon, P.J.; Goetz, A.F.H. The spectral image processing system (SIPS)—Interactive visualization and analysis of imaging spectrometer data. Remote Sens. Environ. 1993, 44, 145–163. [Google Scholar] [CrossRef]
  36. Cudahy, T.; Caccetta, M.; Thomas, M.; Hewson, R.; Abrams, M.; Kato, M.; Kashimura, O.; Ninomiya, Y.; Yamaguchi, Y.; Collings, S.; et al. Satellite-derived mineral mapping and monitoring of weathering, deposition and erosion. Sci. Rep. 2016, 6, 23702. [Google Scholar] [CrossRef] [PubMed] [Green Version]
Figure 1. The study area with 10 sample points (cyan), of which 2 points (dark blue) were used for atmospheric validation (AV). The image footprint is marked with green polygone. S symbolizes exposed sand, DF-N symbolizes north-facing slopes, DF-S symbolizes south-facing slopes, and DF-P symbolizes playa. Background image source: Esri, DigitalGlobe, GeoEye, Earthstar Geographics, CNES/Airbus DS, USDA, USGS, AEX, Getmapping, Aerogrid, IGN, IGP, swisstopo, and the (GIS) User Community.
Minerals 08 00318 g001
Figure 2. (A) Apparent emissivity spectrum of a selected image pixel. (B) Continuum-removed (CR) function on the spectrum in the range 8.12–9.29 µm. This pixel was classified as quartz using the index: CRλ = 8.26 µm < 0.993 and CRλ = 9.12 µm < 0.995 from [4].
Minerals 08 00318 g002
Figure 3. The mean atmospheric signal as represented by the 199 selected pixels with a DNSO value of 0.83 for day (solid blue) and night (solid red). Standard deviation marked as dashed lines. Gray shading marks the main atmospheric features’ regions (water vapor and tropospheric ozone).
Minerals 08 00318 g003
Figure 4. Day and night emissivity spectra of a pixel from a sand dune before applying the gain spectrum (pseudo emissivity, dashed curves) and afterwards (apparent emissivity, solid curves). The shape similarity between the day and night emissivity signatures increased, but there is still a gap in the absolute emissivity values (presumably because of a downwelling radiance effect that was not assessed in the DNSO method). This gap is larger in the quartz absorption region than at longer wavelengths. Notice that several values exceed unity.
Minerals 08 00318 g004
Figure 5. Comparison of the quartz emissivity feature (CR values 8.12 < λ < 9.29) in the ground image and airborne image pixels. The same features are noticeable in the spectra after applying the gain spectrum calculated from the algorithm’s result.
Minerals 08 00318 g005
Figure 6. Pixel emissivity spectra of the four major types of samples taken from the field for analysis: A playa surface with the highest overall emissivity followed by a north-facing biological soil crust (BSC), a south-facing BSC, and bare sand showing the strongest quartz feature.
Minerals 08 00318 g006
Figure 7. Quartz content determined by XRD analysis of 10 samples collected in the field and their corresponding apparent emissivity values at 8.26 µm extracted from the AisaOWL image. R2 = 0.88, p < 0.05, and slope = −0.0012 were calculated for the linear regression line through all of the samples (solid) and R2 = 0.61, p < 0.05, and slope = −0.0011 for just nine points, excluding the playa sample with the low quartz content (dashed).
Minerals 08 00318 g007
Figure 8. Relative amounts of quartz along the study area calculated from the AisaOWL image overlaid on a true color image. The 10 field sample points are marked in cyan. The two points used for validation of the atmospheric feature reduction procedure are marked in dark blue (AV). Background image source: Esri, DigitalGlobe, GeoEye, Earthstar Geographics, CNES/Airbus DS, USDA, USGS, AEX, Getmapping, Aerogrid, IGN, IGP, swisstopo, and the GIS User Community.
Minerals 08 00318 g008
Table 1. Mineral content (%) of the collected samples according to the XRD analysis.
SampleQuartzCarbonates (Calcite, Dolomite)Silicates (Albite, Anorthite)Clay (Illite, Kaolinite)
S84900.59.5-
S1089136-
S7692trace8-
S6491.50.58-
DF-N0380812trace
DF-N166319.510.57
DF-N137215112
DF-S1484214-
DF-I16749152
DF-P0426511013
Table 2. Day-Night Spectral Opposite (DNSO) values output.
DNSO1.00.880.870.860.840.830.820.810.79
No. of pixels02422771994369262058
DNSO value selected for further processing is gray shaded.
Table 3. Spectral angle mapper (SAM) angles between sand sample measurements on the ground and the corresponding airborne image pixels before and after applying the DNSO algorithm; the best angle is in bold.
Sand Sample 1 before DNSOSand Sample 1 after DNSOSand Sample 2 before DNSOSand Sample 2 after DNSO
Angle0.0490.0310.0390.020

