Accumulation of Platinum Group Elements in Hydrogenous Fe–Mn Crust and Nodules from the Southern Atlantic Ocean

Abstract
:1. Introduction
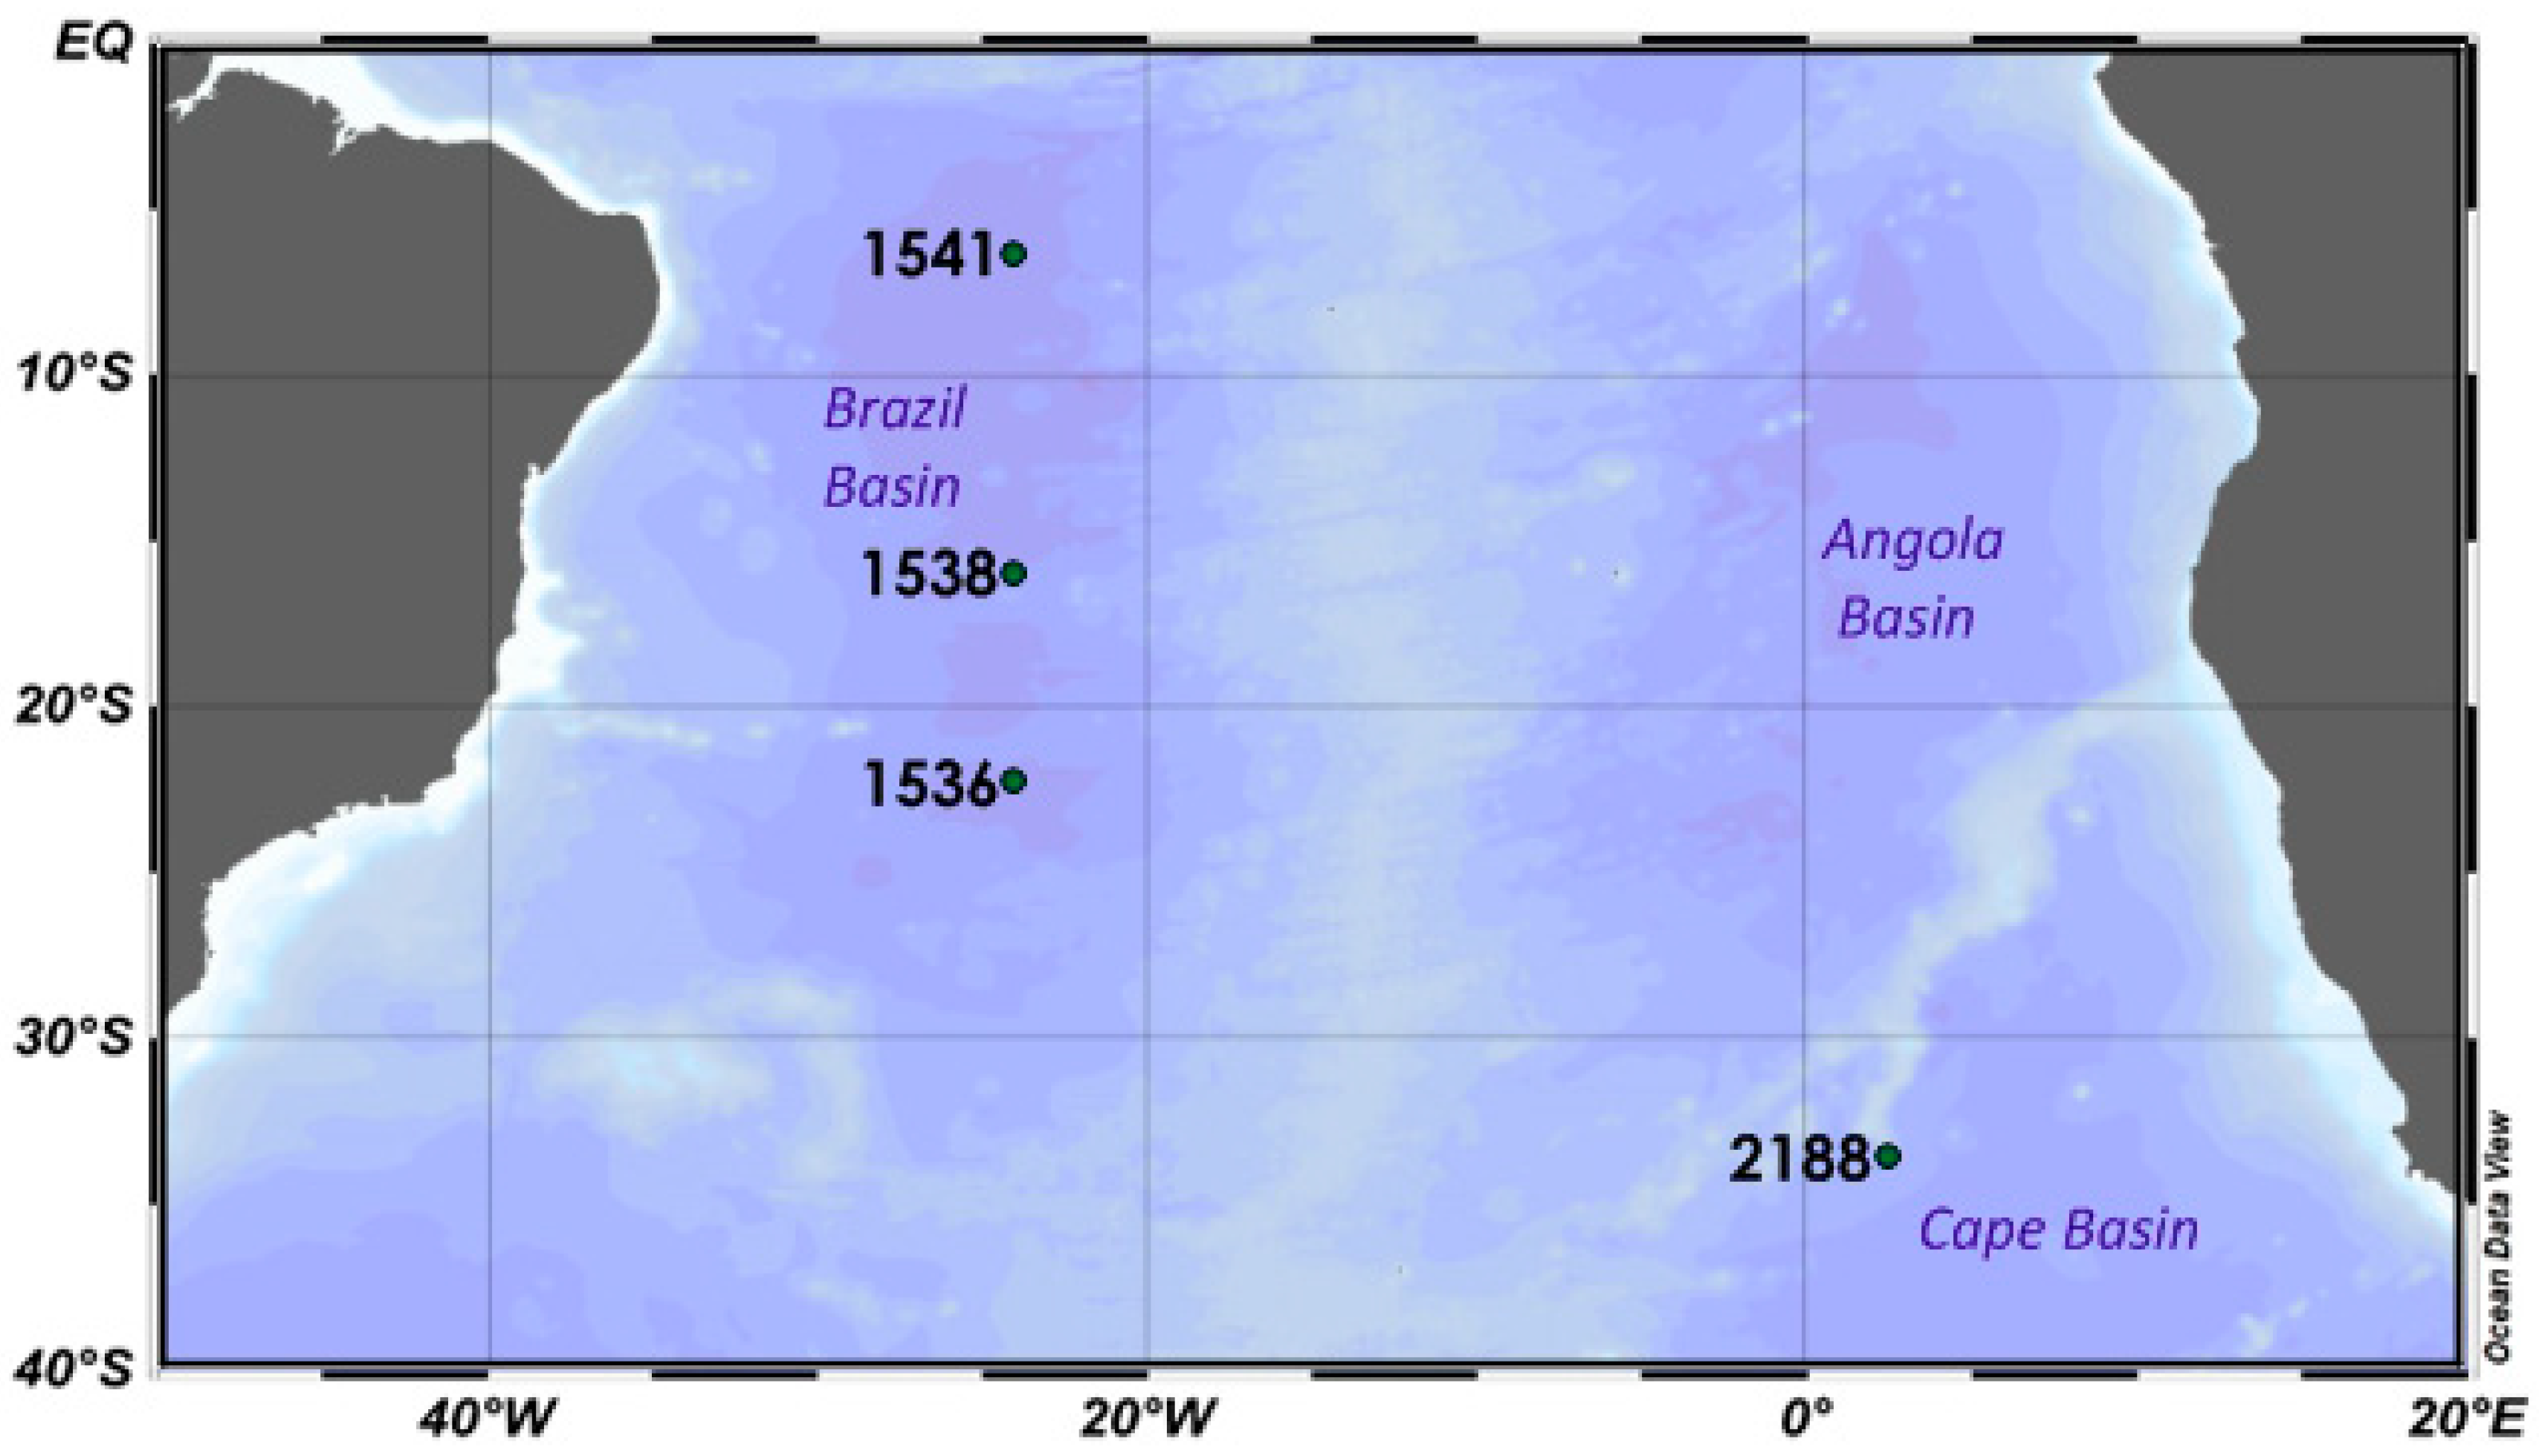
2. Regional Setting
3. Materials and Methods
4. Results
5. Discussion
5.1. Variations of PGE Contents in Nodules and Crusts
5.2. Platinum Group Elements in Buried Nodules
5.3. Platinum Fluxes in Fe–Mn Crusts and Nodules
6. Conclusions
Author Contributions
Funding
Acknowledgments
Conflicts of Interest
Appendix A

| Mn | Fe | Mn/Fe | Al | Li | Mg | Be | Ti | V | Co | Ni | Cu | Zn | As | Rb | Sr | Y | Mo | Cd | Cs | Ba | W | Tl | ||
| Mn | 1.00 | |||||||||||||||||||||||
| Fe | 0.18 | 1.00 | ||||||||||||||||||||||
| Mn/Fe | 0.57 | −0.70 | 1.00 | |||||||||||||||||||||
| Al | 0.25 | −0.16 | 0.33 | 1.00 | ||||||||||||||||||||
| Li | 0.88 | 0.15 | 0.52 | 0.57 | 1.00 | |||||||||||||||||||
| Mg | 0.82 | 0.57 | 0.38 | 0.83 | 0.91 | 1.00 | ||||||||||||||||||
| Be | −0.40 | −0.62 | 0.22 | −0.04 | −0.53 | −0.74 | 1.00 | |||||||||||||||||
| Ti | −0.58 | −0.39 | −0.10 | 0.33 | −0.51 | −0.64 | 0.63 | 1.00 | ||||||||||||||||
| V | 0.46 | 0.93 | −0.44 | 0.05 | 0.48 | 0.90 | −0.80 | −0.54 | 1.00 | |||||||||||||||
| Co | 0.53 | 0.54 | −0.09 | 0.11 | 0.64 | 0.63 | −0.92 | −0.63 | 0.77 | 1.00 | ||||||||||||||
| Ni | 0.89 | 0.22 | 0.47 | 0.49 | 0.98 | 0.83 | −0.63 | −0.51 | 0.55 | 0.74 | 1.00 | |||||||||||||
| Cu | 0.92 | 0.15 | 0.56 | 0.36 | 0.93 | 0.97 | −0.39 | −0.65 | 0.43 | 0.48 | 0.88 | 1.00 | ||||||||||||
| Zn | 0.93 | −0.07 | 0.75 | 0.24 | 0.81 | 0.69 | −0.24 | −0.44 | 0.20 | 0.35 | 0.82 | 0.85 | 1.00 | |||||||||||
| As | 0.36 | 0.86 | −0.27 | 0.21 | 0.25 | 0.36 | −0.34 | 0.24 | 0.72 | 0.07 | 0.31 | 0.27 | 0.48 | 1.00 | ||||||||||
| Rb | 0.04 | −0.06 | 0.11 | 0.93 | 0.37 | 0.73 | −0.07 | 0.50 | 0.06 | 0.05 | 0.32 | 0.12 | 0.07 | 0.46 | 1.00 | |||||||||
| Sr | −0.60 | −0.44 | −0.09 | −0.42 | −0.85 | −0.86 | 0.79 | 0.59 | −0.69 | −0.85 | −0.85 | −0.72 | −0.48 | −0.26 | −0.33 | 1.00 | ||||||||
| Y | −0.71 | −0.24 | −0.33 | −0.57 | −0.92 | −0.93 | 0.69 | 0.56 | −0.56 | −0.70 | −0.89 | −0.83 | −0.59 | −0.16 | −0.42 | 0.89 | 1.00 | |||||||
| Mo | 0.82 | 0.35 | 0.54 | 0.83 | 0.92 | 0.97 | −0.73 | −0.75 | 0.77 | 0.68 | 0.83 | 0.98 | 0.66 | 0.12 | 0.65 | −0.83 | −0.96 | 1.00 | ||||||
| Cd | 0.94 | 0.27 | 0.46 | 0.35 | 0.96 | 0.91 | −0.61 | −0.67 | 0.59 | 0.71 | 0.97 | 0.95 | 0.84 | 0.28 | 0.15 | −0.82 | −0.88 | 0.92 | 1.00 | |||||
| Cs | 0.45 | 0.50 | −0.05 | 0.64 | 0.70 | 0.77 | −0.54 | −0.11 | 0.64 | 0.55 | 0.70 | 0.53 | 0.38 | 0.65 | 0.67 | −0.81 | −0.69 | 0.63 | 0.60 | 1.00 | ||||
| Ba | 0.60 | 0.57 | −0.05 | 0.07 | 0.65 | 0.88 | −0.74 | −0.85 | 0.76 | 0.74 | 0.64 | 0.69 | 0.33 | −0.06 | −0.10 | −0.74 | −0.78 | 0.95 | 0.75 | 0.38 | 1.00 | |||
| W | 0.66 | 0.08 | 0.59 | 0.99 | 0.92 | 0.76 | −0.92 | −0.25 | 0.59 | 0.97 | 0.92 | 0.75 | 0.62 | 0.08 | 0.90 | −0.96 | −0.92 | 0.79 | 0.84 | 0.76 | 0.61 | 1.00 | ||
| Tl | 0.16 | −0.57 | 0.57 | −0.21 | −0.02 | −0.73 | 0.31 | 0.14 | −0.51 | −0.13 | 0.06 | −0.03 | 0.41 | −0.12 | −0.26 | 0.23 | 0.31 | −0.71 | −0.02 | −0.27 | −0.52 | −0.22 | 1.00 | |
| Pb | −0.63 | −0.38 | −0.17 | −0.67 | −0.88 | −0.98 | 0.57 | 0.40 | −0.62 | −0.58 | −0.82 | −0.80 | −0.49 | −0.35 | −0.56 | 0.88 | 0.93 | −0.94 | −0.80 | −0.85 | −0.70 | −0.85 | 0.44 | |
| Bi | −0.88 | −0.59 | −0.43 | −0.82 | −0.92 | −0.99 | 0.78 | 0.61 | −0.93 | −0.64 | −0.87 | −0.98 | −0.78 | −0.43 | −0.73 | 0.83 | 0.93 | −0.95 | −0.94 | −0.77 | −0.85 | −0.74 | 0.67 | |
| Th | −0.56 | 0.30 | −0.67 | −0.53 | −0.78 | −0.56 | 0.23 | 0.27 | 0.00 | −0.44 | −0.74 | −0.67 | −0.64 | 0.12 | −0.32 | 0.67 | 0.64 | −0.62 | −0.66 | −0.48 | −0.25 | −0.95 | −0.37 | |
| U | −0.60 | −0.48 | −0.04 | −0.32 | −0.81 | −0.93 | 0.80 | 0.73 | −0.72 | −0.83 | −0.79 | −0.75 | −0.42 | −0.13 | −0.18 | 0.96 | 0.91 | −0.94 | −0.82 | −0.68 | −0.88 | −0.90 | 0.38 | |
| La | −0.62 | 0.07 | −0.55 | −0.84 | −0.85 | −0.82 | 0.31 | 0.03 | −0.21 | −0.36 | −0.82 | −0.69 | −0.67 | −0.41 | −0.76 | 0.67 | 0.79 | −0.78 | −0.70 | −0.77 | −0.25 | −0.93 | −0.02 | |
| Ce | −0.41 | 0.32 | −0.61 | −0.82 | −0.55 | −0.85 | −0.21 | −0.34 | 0.15 | 0.17 | −0.46 | −0.47 | −0.54 | −0.61 | −0.76 | 0.22 | 0.41 | −0.76 | −0.36 | −0.53 | 0.16 | −0.81 | −0.11 | |
| Pr | −0.65 | −0.01 | −0.49 | −0.83 | −0.87 | −0.83 | 0.39 | 0.07 | −0.30 | −0.43 | −0.85 | −0.70 | −0.66 | −0.41 | −0.75 | 0.71 | 0.83 | −0.79 | −0.74 | −0.79 | −0.33 | −0.92 | 0.04 | |
| Nd | −0.67 | −0.04 | −0.48 | −0.79 | −0.89 | −0.81 | 0.46 | 0.14 | −0.35 | −0.51 | −0.88 | −0.72 | −0.68 | −0.39 | −0.71 | 0.76 | 0.86 | −0.78 | −0.77 | −0.80 | −0.37 | −0.93 | 0.03 | |
| Sm | −0.70 | −0.06 | −0.49 | −0.77 | −0.92 | −0.82 | 0.49 | 0.20 | −0.37 | −0.55 | −0.91 | −0.75 | −0.70 | −0.37 | −0.67 | 0.79 | 0.88 | −0.79 | −0.81 | −0.80 | −0.42 | −0.94 | 0.02 | |
| Eu | −0.72 | −0.09 | −0.47 | −0.73 | −0.94 | −0.82 | 0.55 | 0.26 | −0.41 | −0.61 | −0.93 | −0.77 | −0.71 | −0.34 | −0.62 | 0.83 | 0.90 | −0.80 | −0.84 | −0.80 | −0.47 | −0.94 | 0.03 | |
| Gd | −0.71 | −0.06 | −0.49 | −0.76 | −0.93 | −0.84 | 0.50 | 0.24 | −0.38 | −0.57 | −0.92 | −0.78 | −0.70 | −0.32 | −0.65 | 0.81 | 0.90 | −0.82 | −0.83 | −0.79 | −0.46 | −0.95 | 0.05 | |
| Tb | −0.72 | −0.14 | −0.43 | −0.70 | −0.94 | −0.83 | 0.61 | 0.32 | −0.47 | −0.66 | −0.94 | −0.78 | −0.69 | −0.32 | −0.59 | 0.86 | 0.93 | −0.82 | −0.86 | −0.80 | −0.54 | −0.95 | 0.08 | |
| Dy | −0.72 | −0.19 | −0.39 | −0.70 | −0.95 | −0.88 | 0.63 | 0.36 | −0.51 | −0.66 | −0.93 | −0.80 | −0.66 | −0.31 | −0.58 | 0.88 | 0.96 | −0.87 | −0.87 | −0.81 | −0.60 | −0.95 | 0.16 | |
| Ho | −0.71 | −0.22 | −0.35 | −0.68 | −0.94 | −0.90 | 0.65 | 0.41 | −0.53 | −0.68 | −0.92 | −0.81 | −0.63 | −0.27 | −0.56 | 0.90 | 0.98 | −0.90 | −0.87 | −0.79 | −0.65 | −0.95 | 0.23 | |
| Er | −0.72 | −0.29 | −0.31 | −0.58 | −0.94 | −0.91 | 0.73 | 0.51 | −0.60 | −0.74 | −0.93 | −0.82 | −0.62 | −0.27 | −0.46 | 0.93 | 0.99 | −0.91 | −0.90 | −0.77 | −0.73 | −0.94 | 0.24 | |
| Tm | −0.71 | −0.35 | −0.25 | −0.47 | −0.91 | −0.88 | 0.81 | 0.57 | −0.65 | −0.82 | −0.93 | −0.78 | −0.61 | −0.30 | −0.38 | 0.95 | 0.96 | −0.87 | −0.89 | −0.76 | −0.74 | −0.95 | 0.20 | |
| Yb | −0.72 | −0.37 | −0.23 | −0.52 | −0.92 | −0.91 | 0.79 | 0.56 | −0.67 | −0.80 | −0.92 | −0.80 | −0.60 | −0.30 | −0.41 | 0.94 | 0.98 | −0.90 | −0.90 | −0.77 | −0.76 | −0.93 | 0.27 | |
| Lu | −0.70 | −0.28 | −0.29 | −0.58 | −0.92 | −0.89 | 0.75 | 0.49 | −0.59 | −0.75 | −0.92 | −0.78 | −0.61 | −0.29 | −0.48 | 0.92 | 0.98 | −0.89 | −0.88 | −0.77 | −0.70 | −0.94 | 0.24 | |
| Ce an | 0.27 | 0.55 | −0.29 | −0.15 | 0.36 | 0.36 | −0.92 | −0.65 | 0.70 | 0.93 | 0.47 | 0.23 | 0.07 | −0.37 | −0.17 | −0.66 | −0.51 | 0.51 | 0.47 | 0.27 | 0.72 | 0.83 | −0.23 | |
| Ru | 0.01 | −0.50 | 0.32 | −0.80 | −0.32 | −0.85 | 0.17 | −0.25 | −0.48 | −0.04 | −0.22 | −0.23 | 0.11 | −0.45 | −0.81 | 0.44 | 0.47 | −0.75 | −0.15 | −0.72 | −0.24 | −0.65 | 0.79 | |
| Pd | −0.50 | 0.17 | −0.63 | 0.05 | −0.23 | −0.17 | 0.16 | 0.30 | −0.09 | −0.05 | −0.24 | −0.32 | −0.44 | 0.11 | 0.18 | −0.15 | 0.24 | −0.27 | −0.35 | 0.31 | −0.36 | 0.02 | 0.03 | |
| Ir | −0.03 | 0.20 | −0.23 | 0.02 | 0.18 | −0.16 | −0.61 | −0.17 | 0.32 | 0.74 | 0.30 | −0.08 | −0.09 | −0.29 | 0.05 | −0.51 | −0.22 | −0.10 | 0.17 | 0.28 | 0.21 | 0.50 | 0.16 | |
| Pt | 0.58 | 0.47 | 0.01 | 0.18 | 0.71 | 0.62 | −0.91 | −0.61 | 0.72 | 0.99 | 0.80 | 0.54 | 0.43 | 0.11 | 0.10 | −0.88 | −0.74 | 0.66 | 0.76 | 0.59 | 0.72 | 0.96 | −0.06 | |
| Pt/Pd | 0.83 | −0.17 | 0.99 | 0.30 | 0.78 | 0.48 | −0.79 | −0.56 | 0.39 | 0.79 | 0.81 | 0.71 | 0.81 | −0.16 | 0.06 | −0.55 | −0.73 | 0.61 | 0.82 | 0.20 | 0.65 | 0.65 | 0.26 | |
| Pb | Bi | Th | U | La | Ce | Pr | Nd | Sm | Eu | Gd | Tb | Dy | Ho | Er | Tm | Yb | Lu | Ce An | Ru | Pd | Ir | Pt | Pt/Pd | |
| Pb | 1.00 | |||||||||||||||||||||||
| Bi | 0.96 | 1.00 | ||||||||||||||||||||||
| Th | 0.57 | 0.52 | 1.00 | |||||||||||||||||||||
| U | 0.87 | 0.89 | 0.56 | 1.00 | ||||||||||||||||||||
| La | 0.81 | 0.84 | 0.75 | 0.55 | 1.00 | |||||||||||||||||||
| Ce | 0.52 | 0.89 | 0.51 | 0.09 | 0.85 | 1.00 | ||||||||||||||||||
| Pr | 0.84 | 0.86 | 0.70 | 0.59 | 0.99 | 0.80 | 1.00 | |||||||||||||||||
| Nd | 0.85 | 0.84 | 0.73 | 0.65 | 0.98 | 0.75 | 1.00 | 1.00 | ||||||||||||||||
| Sm | 0.86 | 0.84 | 0.75 | 0.68 | 0.98 | 0.72 | 0.99 | 1.00 | 1.00 | |||||||||||||||
| Eu | 0.87 | 0.84 | 0.76 | 0.73 | 0.96 | 0.66 | 0.97 | 0.99 | 1.00 | 1.00 | ||||||||||||||
| Gd | 0.88 | 0.86 | 0.77 | 0.72 | 0.97 | 0.70 | 0.98 | 0.99 | 1.00 | 1.00 | 1.00 | |||||||||||||
| Tb | 0.89 | 0.85 | 0.75 | 0.78 | 0.93 | 0.61 | 0.96 | 0.98 | 0.99 | 1.00 | 0.99 | 1.00 | ||||||||||||
| Dy | 0.92 | 0.89 | 0.72 | 0.82 | 0.92 | 0.58 | 0.94 | 0.96 | 0.98 | 0.99 | 0.98 | 1.00 | 1.00 | |||||||||||
| Ho | 0.94 | 0.91 | 0.70 | 0.85 | 0.89 | 0.54 | 0.92 | 0.94 | 0.95 | 0.97 | 0.97 | 0.98 | 1.00 | 1.00 | ||||||||||
| Er | 0.93 | 0.92 | 0.67 | 0.90 | 0.83 | 0.44 | 0.87 | 0.90 | 0.92 | 0.94 | 0.94 | 0.97 | 0.98 | 0.99 | 1.00 | |||||||||
| Tm | 0.89 | 0.89 | 0.64 | 0.92 | 0.76 | 0.33 | 0.81 | 0.86 | 0.88 | 0.91 | 0.90 | 0.94 | 0.95 | 0.96 | 0.99 | 1.00 | ||||||||
| Yb | 0.92 | 0.92 | 0.62 | 0.92 | 0.78 | 0.36 | 0.83 | 0.86 | 0.89 | 0.92 | 0.90 | 0.94 | 0.96 | 0.97 | 0.99 | 1.00 | 1.00 | |||||||
| Lu | 0.91 | 0.91 | 0.65 | 0.88 | 0.83 | 0.43 | 0.87 | 0.90 | 0.92 | 0.94 | 0.93 | 0.97 | 0.98 | 0.99 | 1.00 | 0.99 | 0.99 | 1.00 | ||||||
| Ce an | −0.34 | −0.36 | −0.17 | −0.70 | −0.04 | 0.49 | −0.12 | −0.20 | −0.25 | −0.31 | −0.27 | −0.38 | −0.40 | −0.43 | −0.52 | −0.62 | −0.60 | −0.54 | 1.00 | |||||
| Ru | 0.71 | - | 0.15 | 0.43 | 0.58 | 0.74 | 0.56 | 0.52 | 0.49 | 0.45 | 0.49 | 0.45 | 0.50 | 0.52 | 0.47 | 0.38 | 0.44 | 0.46 | 0.23 | 1.00 | ||||
| Pd | 0.02 | 0.25 | −0.17 | −0.02 | 0.06 | 0.09 | 0.13 | 0.11 | 0.12 | 0.13 | 0.12 | 0.13 | 0.14 | 0.15 | 0.17 | 0.15 | 0.17 | 0.18 | −0.14 | −0.32 | 1.00 | |||
| Ir | −0.11 | 0.19 | −0.38 | −0.40 | −0.09 | 0.34 | −0.11 | −0.18 | −0.21 | −0.26 | −0.22 | −0.29 | −0.26 | −0.26 | −0.29 | −0.39 | −0.34 | −0.31 | 0.75 | 0.15 | 0.44 | 1.00 | ||
| Pt | −0.62 | −0.64 | −0.53 | −0.84 | −0.46 | 0.07 | −0.52 | −0.59 | −0.63 | −0.68 | −0.65 | −0.73 | −0.73 | −0.74 | −0.79 | −0.86 | −0.84 | −0.80 | 0.88 | −0.05 | −0.05 | 0.73 | 1.00 | |
| Pt/Pd | −0.46 | −0.53 | −0.63 | −0.58 | −0.59 | −0.35 | −0.62 | −0.64 | −0.67 | −0.70 | −0.69 | −0.71 | −0.69 | −0.69 | −0.72 | −0.74 | −0.72 | −0.72 | 0.82 | 0.20 | −0.65 | 0.27 | 0.78 | 1.00 |
References
- Halbach, P.E.; Jahn, A.; Cherkashov, G. Marine Co-Rich Ferromanganese Crust Deposits: Description and Formation, Occurrences and Distribution, Estimated World-wide Resources. In Deep-Sea Mining; Springer: Cham, Switzerland, 2017; pp. 65–141. [Google Scholar]
- Kuhn, T.; Wegorzewski, A.; Rühlemann, C.; Vink, A. Composition, formation, and occurrence of polymetallic nodules. In Deep-Sea Mining; Springer: Cham, Switzerland, 2017; pp. 23–63. [Google Scholar]
- Hein, J.R.; Mizell, K.; Koschinsky, A.; Conrad, T.A. Deep-ocean mineral deposits as a source of critical metals for high- and green-technology applications: Comparison with land-based resources. Ore Geol. Rev. 2013, 51, 1–14. [Google Scholar] [CrossRef]
- Balaram, V.; Mathur, R.; Banakar, V.K.; Hein, J.R.; Rao, C.R.M.; Gnaneswara Rao, T.; Dasaram, B. Determination of the platinum—Group elements (PGE) and gold (Au) in manganese nodule reference samples by nickel sulfide fire-assay and Te coprecipitation with ICP-MS. Indian J. Mar. Sci. 2006, 35, 7–16. [Google Scholar]
- Usui, A.; Someya, M. Distribution and composition of marine hydrogenetic and hydrothermal manganese deposits in the northwest Pacific. Geol. Soc. Lond. Spec. Publ. 1997, 119, 177–198. [Google Scholar] [CrossRef]
- Halbach, P.; Kriete, C.; Prause, B.; Puteanus, D. Mechanisms to explain the platinum concentration in ferromanganese seamount crusts. Chem. Geol. 1989, 76, 95–106. [Google Scholar] [CrossRef]
- Hein, J.R.; Mcintyre, B.; Koschinsky, A. The Global Enrichment of Platinum Group Elements in Marine Ferromanganese Crusts. Ext. Abstr. 2005, 10, 98–101. [Google Scholar]
- Koide, M.; Stallard, M.; Hodge, V.; Goldberg, E.D. Preliminary studies on the marine chemistry of ruthenium. Neth. J. Sea Res. 1986, 20, 163–166. [Google Scholar] [CrossRef]
- Anbar, A.D.; Wasserburg, G.J.; Papanastassiou, D.A.; Andersson, P.S. Iridium in natural waters. Science 1996, 273, 1524–1528. [Google Scholar] [CrossRef]
- Banakar, V.K.; Hein, J.R.; Rajani, R.P.; Chodankar, A.R. Platinum group elements and gold in ferromanganese crusts from Afanasiy-Nikitin seamount, equatorial Indian Ocean: Sources and fractionation. J. Earth Syst. Sci. 2007, 116, 3–13. [Google Scholar] [CrossRef] [Green Version]
- Baturin, G.N. Geochemistry of Oceanic Ferromanganese Nodules; Nauka: Moscow, Russia, 1986. [Google Scholar]
- Dubinin, A.V.; Uspenskaya, T.Y. Geochemistry and specific features of manganese ore formation in sediments of oceanic bioproductive zones. Lithol. Miner. Resour. 2006, 41, 1–14. [Google Scholar] [CrossRef]
- Dubinin, A.V. Rare Earth Element Geochemistry in the Ocean; Nauka: Moscow, Russia, 2006. [Google Scholar]
- Stueben, D.; Glasby, G.P.; Eckhardt, J.-D.; Berner, Z.; Mountain, B.W.; Usui, A. Enrichments of platinum-group elements in hydrogenous, diagenetic and hydrothermal marine manganese and iron deposits. Explor. Min. Geol. 1999, 8, 233–250. [Google Scholar]
- Cabral, A.R.; Sattler, C.D.; Lehmann, B.; Tsikos, H. Geochemistry of some marine Fe–Mn nodules and crusts with respect to Pt contents. Resour. Geol. 2009, 59, 400–406. [Google Scholar] [CrossRef]
- Hein, J.R.; Conrad, T.; Mizell, K.; Banakar, V.K.; Frey, F.A.; Sager, W.W. Controls on ferromanganese crust composition and reconnaissance resource potential, Ninetyeast Ridge, Indian Ocean. Deep-Sea Res. Part Oceanogr. Res. Pap. 2016, 110, 1–19. [Google Scholar] [CrossRef]
- Guan, Y.; Sun, X.; Ren, Y.; Jiang, X. Mineralogy, geochemistry and genesis of the polymetallic crusts and nodules from the South China Sea. Ore Geol. Rev. 2017, 89, 206–227. [Google Scholar] [CrossRef]
- Muiños, S.B.; Hein, J.R.; Frank, M.; Monteiro, J.H.; Gaspar, L.; Conrad, T.; Pereira, H.G.; Abrantes, F. Deep-sea Fe–Mn Crusts from the Northeast Atlantic Ocean: Composition and Resource Considerations. Mar. Georesour. Geotechnol. 2013, 31, 40–70. [Google Scholar] [CrossRef]
- Marino, E.; González, F.J.; Somoza, L.; Lunar, R.; Ortega, L.; Vázquez, J.T.; Reyes, J.; Bellido, E. Strategic and rare elements in Cretaceous-Cenozoic cobalt-rich ferromanganese crusts from seamounts in the Canary Island Seamount Province (northeastern tropical Atlantic). Ore Geol. Rev. 2017, 87, 41–61. [Google Scholar] [CrossRef]
- Wen, X.; De Carlo, E.H.; Li, Y.H. Interelement relationships in ferromanganese crusts from the central Pacific ocean: Their implications for crust genesis. Mar. Geol. 1997, 136, 277–297. [Google Scholar] [CrossRef]
- Asavin, A.M.; Kubrakova, I.V.; Mel’nikov, M.E.; Tyutyunnik, O.A.; Chesalova, E.I. Geochemical zoning in ferromanganese crusts of Ita-MaiTai guyot. Geochem. Int. 2010, 48, 423–445. [Google Scholar] [CrossRef]
- Goldberg, E.D.; Koide, M. Understanding the marine chemistries of the platinum group metals. Mar. Chem. 1990, 30, 249–257. [Google Scholar] [CrossRef]
- Koschinsky, A.; Audroing, J. The Enrichment of Platinum and the Fractionation of Pt from Pd in Marine Ferromanganese Crusts. Ext. Abstr. 2005, 10, 429–432. [Google Scholar]
- Baturin, G.N.; Konopleva, E.V.; Dubinchuk, V.T.; Mel’nikov, M.E. Marine Geology-Platinum and Gold in the Ferromanganese Crusts of the Pacific Ocean. Oceanol. Russ. Acad. Sci. 2005, 45, 269–276. [Google Scholar]
- Astakhova, N.V. Noble metals in ferromanganese crusts from marginal seas of the Northwest Pacific. Oceanology 2017, 57, 558–567. [Google Scholar] [CrossRef]
- Glasby, G.P. Incorporation of transition and Platinum Group Elements (PGE) in Co-rich Mn crusts at Afanasiy-Nikitin Seamount (AFS) in the Equatorial S Indian Ocean. Resour. Geol. 2010, 60, 212–215. [Google Scholar] [CrossRef]
- Kubrakova, I.V.; Koshcheeva, I.Y.; Tyutyunnik, O.A.; Asavin, A.M. Role of organic matter in the accumulation of platinum in oceanic ferromanganese deposits. Geochem. Int. 2010, 48, 655–663. [Google Scholar] [CrossRef]
- Litvin, V.M. The Morphostructure of the Atlantic Ocean Floor: Its Development in the Meso-Cenozoic; Springer: Dordrecht, The Netherlands, 1984; ISBN 978-94-009-6245-3. [Google Scholar]
- Stramma, L.; England, M. On the water masses and mean circulation of the South Atlantic Ocean. J. Geophys. Res. Oceans 1999, 104, 20863–20883. [Google Scholar] [CrossRef] [Green Version]
- Shannon, L.V.; Chapman, P. Evidence of Antarctic bottom water in the Angola Basin at 32°S. Deep Sea Res. Part A Oceanogr. Res. Pap. 1991, 38, 1299–1304. [Google Scholar] [CrossRef]
- Sval’nov, V.N.; Dmitrenko, O.B.; Kazarina, G.K.; Berezhnaya, E.D. Sedimentation in the Angola and Cape basins during the quaternary. Lithol. Miner. Resour. 2014, 49, 281–291. [Google Scholar] [CrossRef]
- Dubinin, A.V.; Rimskaya-Korsakova, M.N. Geochemistry of rare earth elements in bottom sediments of the Brazil Basin, Atlantic Ocean. Lithol. Miner. Resour. 2011, 46, 1–16. [Google Scholar] [CrossRef]
- Berezhnaya, E.D.; Dubinin, A.V. Determination of Platinum-Group Elements and Gold in Ferromanganese Nodule Reference Samples. Geostand. Geoanal. Res. 2017, 41, 137–145. [Google Scholar] [CrossRef]
- Dubinin, A.V.; Sval’nov, V.N.; Berezhnaya, E.D.; Rimskaya-Korsakova, M.N.; Demidova, T.P. Geochemistry of trace and minor elements in sediments and manganese micronodules from the Angola Basin. Lithol. Miner. Resour. 2013, 48, 175–197. [Google Scholar] [CrossRef]
- McArthur, J.M.; Howarth, R.J.; Shields, G.A. Strontium isotope stratigraphy. In The Geologic Time Scale; Elsevier: Cambridge, UK; 2012; pp. 127–144. [Google Scholar]
- Dubinin, A.V.; Uspenskaya, T.Y.; Rimskaya-Korsakova, M.N.; Demidova, T.P. Rare elements and Nd and Sr isotopic composition in micronodules from the Brazil Basin, Atlantic Ocean. Lithol. Miner. Resour. 2017, 52, 81–101. [Google Scholar] [CrossRef]
- Dubinin, A.V.; Kuznetsov, A.B.; Rimskaya-Korsakova, M.N.; Safin, T.T. Nd and Sr isotope composition in enamel of teeth from Fe–Mn nodules of the Cape Basin (Atlantic Ocean): Age and sources of matter. Geochem. Int. 2018. accepted. [Google Scholar]
- Manheim, F.T.; Lane-Bostwick, C.M. Cobalt in ferromanganese crusts as a monitor of hydrothermal discharge on the Pacific sea floor. Nature 1988, 335, 59–62. [Google Scholar] [CrossRef]
- Frank, M.; O’Nions, R.K.; Hein, J.R.; Banakar, V.K. 60 Myr records of major elements and Pb–Nd isotopes from hydrogenous ferromanganese crusts: Reconstruction of seawater paleochemistry. Geochim. Cosmochim. Acta 1999, 63, 1689–1708. [Google Scholar] [CrossRef]
- Bonatti, E. Classification and Genesis of Submarine Iron-Manganese Deposits. Available online: https://eurekamag.com/research/018/560/018560418.php (accessed on 28 June 2018).
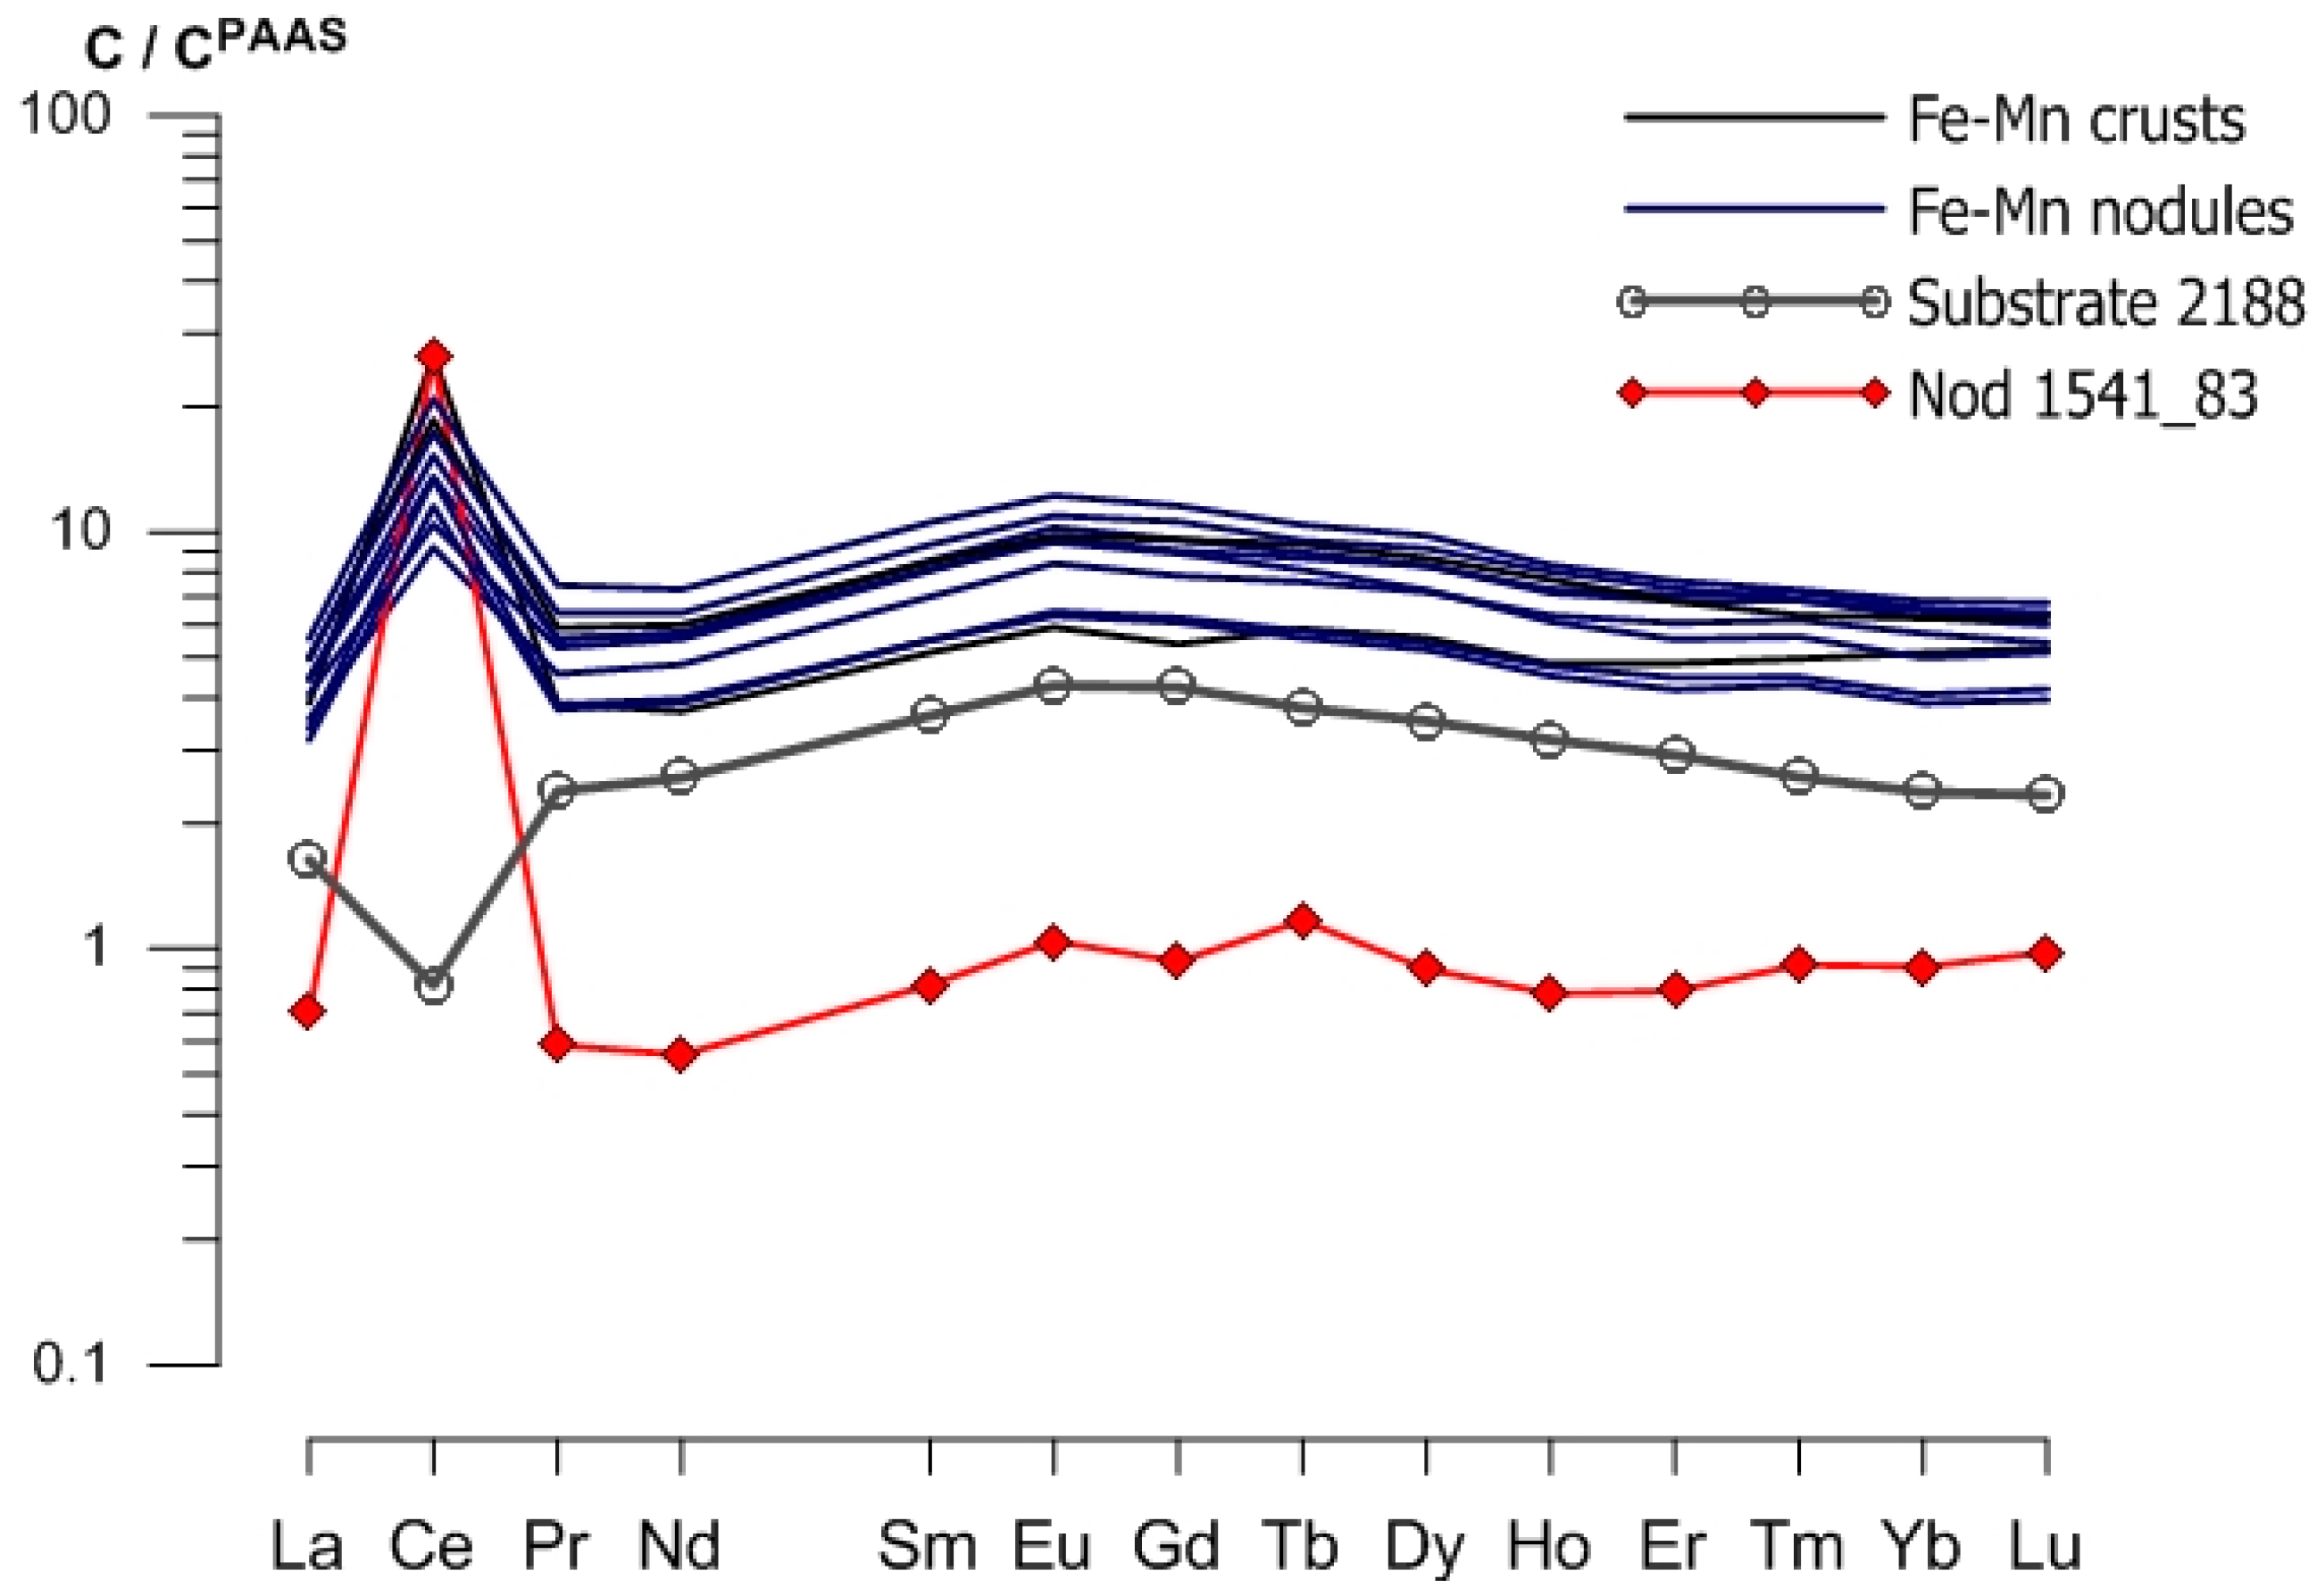
- Bau, M.; Schmidt, K.; Koschinsky, A.; Hein, J.; Kuhn, T.; Usui, A. Discriminating between different genetic types of marine ferro-manganese crusts and nodules based on rare earth elements and yttrium. Chem. Geol. 2014, 381, 1–9. [Google Scholar] [CrossRef]
- McLennan, S.M. Rare earth elements in sedimentary rocks; influence of provenance and sedimentary processes. Rev. Mineral. Geochem. 1989, 21, 169–200. [Google Scholar]
- Ravizza, G.E. Platinum Group Elements and their Isotopes in the Ocean. In Encyclopedia of Ocean Sciences, 2nd ed.; Elsevier: Cambridge, UK; 2008; pp. 494–503. [Google Scholar]
- Terashima, S.; Mita, N.; Nakao, S.; Platinum, S.I. Platinum and palladium abundances in marine sediments and their geochemical behavior in marine environments. Bull. Geol. Surv. Jpn. 2002, 53, 725–747. [Google Scholar] [CrossRef]
- Wedepohl, K.H. The composition of the continental crust. Geochim. Cosmochim. Acta 1995, 59, 1217–1232. [Google Scholar] [CrossRef]
- Bézos, A.; Lorand, J.P.; Humler, E.; Gros, M. Platinum-group element systematics in Mid-Oceanic Ridge basaltic glasses from the Pacific, Atlantic, and Indian Oceans. Geochim. Cosmochim. Acta 2005, 69, 2613–2627. [Google Scholar] [CrossRef]
- McDonough, W.F.; Sun, S.-S. The composition of the Earth. Chem. Geol. 1995, 120, 223–253. [Google Scholar] [CrossRef]
- Falkner, K.K.; Edmond, J.M. Determination of gold at femtomolar levels in natural waters by flow-injection inductively coupled plasma quadrupole mass spectrometry. Anal. Chem. 1990, 62, 1477–1481. [Google Scholar] [CrossRef]
- Peach, C.L.; Mathez, E.A.; Keays, R.R. Sulfide melt—Silicate melt distribution coefficients for the noble metals as deduced from MORB: Implications for partial melting. Geochim. Cosmochim. Acta 1990, 54, 3379–3389. [Google Scholar] [CrossRef]
- Halbach, P.; Segl, M.; Puteanus, D.; Mangini, A. Co-fluxes and growth rates in ferromanganese deposits from central Pacific seamount seas. Nature 1983, 304, 716–719. [Google Scholar] [CrossRef]
- Hein, J.R.; Schwab, W.C.; Davis, A. Cobalt- and platinum-rich ferromanganese crusts and associated substrate rocks from the Marshall Islands. Mar. Geol. 1988, 78, 255–283. [Google Scholar] [CrossRef]
- Dubinin, A.V.; Rimskaya-Korsakova, M.N.; Berezhnaya, E.D.; Uspenskaya, T.Y.; Dara, O.M. Ferromanganese crusts of the Southern Atlantic: Evolution of composition and features of ore formation. Geochem. Int. 2018, in press. [Google Scholar]
- Cosden, J.M.; Byrne, R.H. Comparative geochemistries of PdII and PtII:. Geochim. Cosmochim. Acta 2003, 67, 1331–1338. [Google Scholar] [CrossRef]
- Koschinsky, A.; Hein, J.R. Uptake of elements from seawater by ferromanganese crusts: Solid-phase associations and seawater speciation. Mar. Geol. 2003, 198, 331–351. [Google Scholar] [CrossRef]
- Maeno, M.Y.; Ohashi, H.; Yonezu, K.; Miyazaki, A.; Okaue, Y.; Watanabe, K.; Ishida, T.; Tokunaga, M.; Yokoyama, T. Sorption behavior of the Pt(II) complex anion on manganese dioxide (δ-MnO2): A model reaction to elucidate the mechanism by which Pt is concentrated into a marine ferromanganese crust. Miner. Depos. 2016, 51, 211–218. [Google Scholar] [CrossRef]
- Moffett, J.W. A radiotracer study of cerium and manganese uptake onto suspended particles in Chesapeake Bay. Geochim. Cosmochim. Acta 1994, 58, 695–703. [Google Scholar] [CrossRef]
- Takahashi, Y.; Shimizu, H.; Usui, A.; Kagi, H.; Nomura, M. Direct observation of tetravalent cerium in ferromanganese nodules and crusts by X-ray-absorption near-edge structure (XANES). Geochim. Cosmochim. Acta 2000, 64, 2929–2935. [Google Scholar] [CrossRef]
- Colodner, D.C.; Boyle, E.A.; Edmond, J.M.; Thomson, J. Post-depositional mobility of platinum, iridium and rhenium in marine sediments. Nature 1992, 358, 402–404. [Google Scholar] [CrossRef]
- Peucker-Ehrenbrink, B.; Ravizza, G. The marine osmium isotope record. Terra Nova 2000, 12, 205–219. [Google Scholar] [CrossRef]
- Soyol-Erdene, T.O.; Huh, Y. Dissolved platinum in major rivers of East Asia: Implications for the oceanic budget. Geochem. Geophys. Geosyst. 2012, 13, 1–13. [Google Scholar] [CrossRef]
- Cave, R.R.; Ravizza, G.E.; German, C.R.; Thomson, J.; Nesbitt, R.W. Deposition of osmium and other platinum-group elements beneath the ultramafic-hosted Rainbow hydrothermal plume. Earth Planet. Sci. Lett. 2003, 210, 65–79. [Google Scholar] [CrossRef]
- Lee, D.S. Palladium and nickel in north-east Pacific waters. Nature 1983, 305, 47–48. [Google Scholar] [CrossRef]
- Kuhn, T.; Bau, M.; Blum, N.; Halbach, P. Origin of negative Ce anomalies in mixed hydrothermal–hydrogenetic Fe–Mn crusts from the Central Indian Ridge. Earth Planet. Sci. Lett. 1998, 163, 207–220. [Google Scholar] [CrossRef]


| Station | Coordinates | Depth (m) | Sampling | |
|---|---|---|---|---|
| Latitude | Longitude | |||
| 1536 | 22°17.6′ S | 24°01.1′ W | 5500 | Gravity corer |
| 1538 | 15°52.9′ S | 24°04.6′ W | 5200 | Gravity corer |
| 1541 | 6°10.8′ S | 24°01.1′ W | 5800 | Gravity corer |
| 2188 | 33°41.3′ S | 2°31.48′ E | 4700 | Sigsbee trawl |
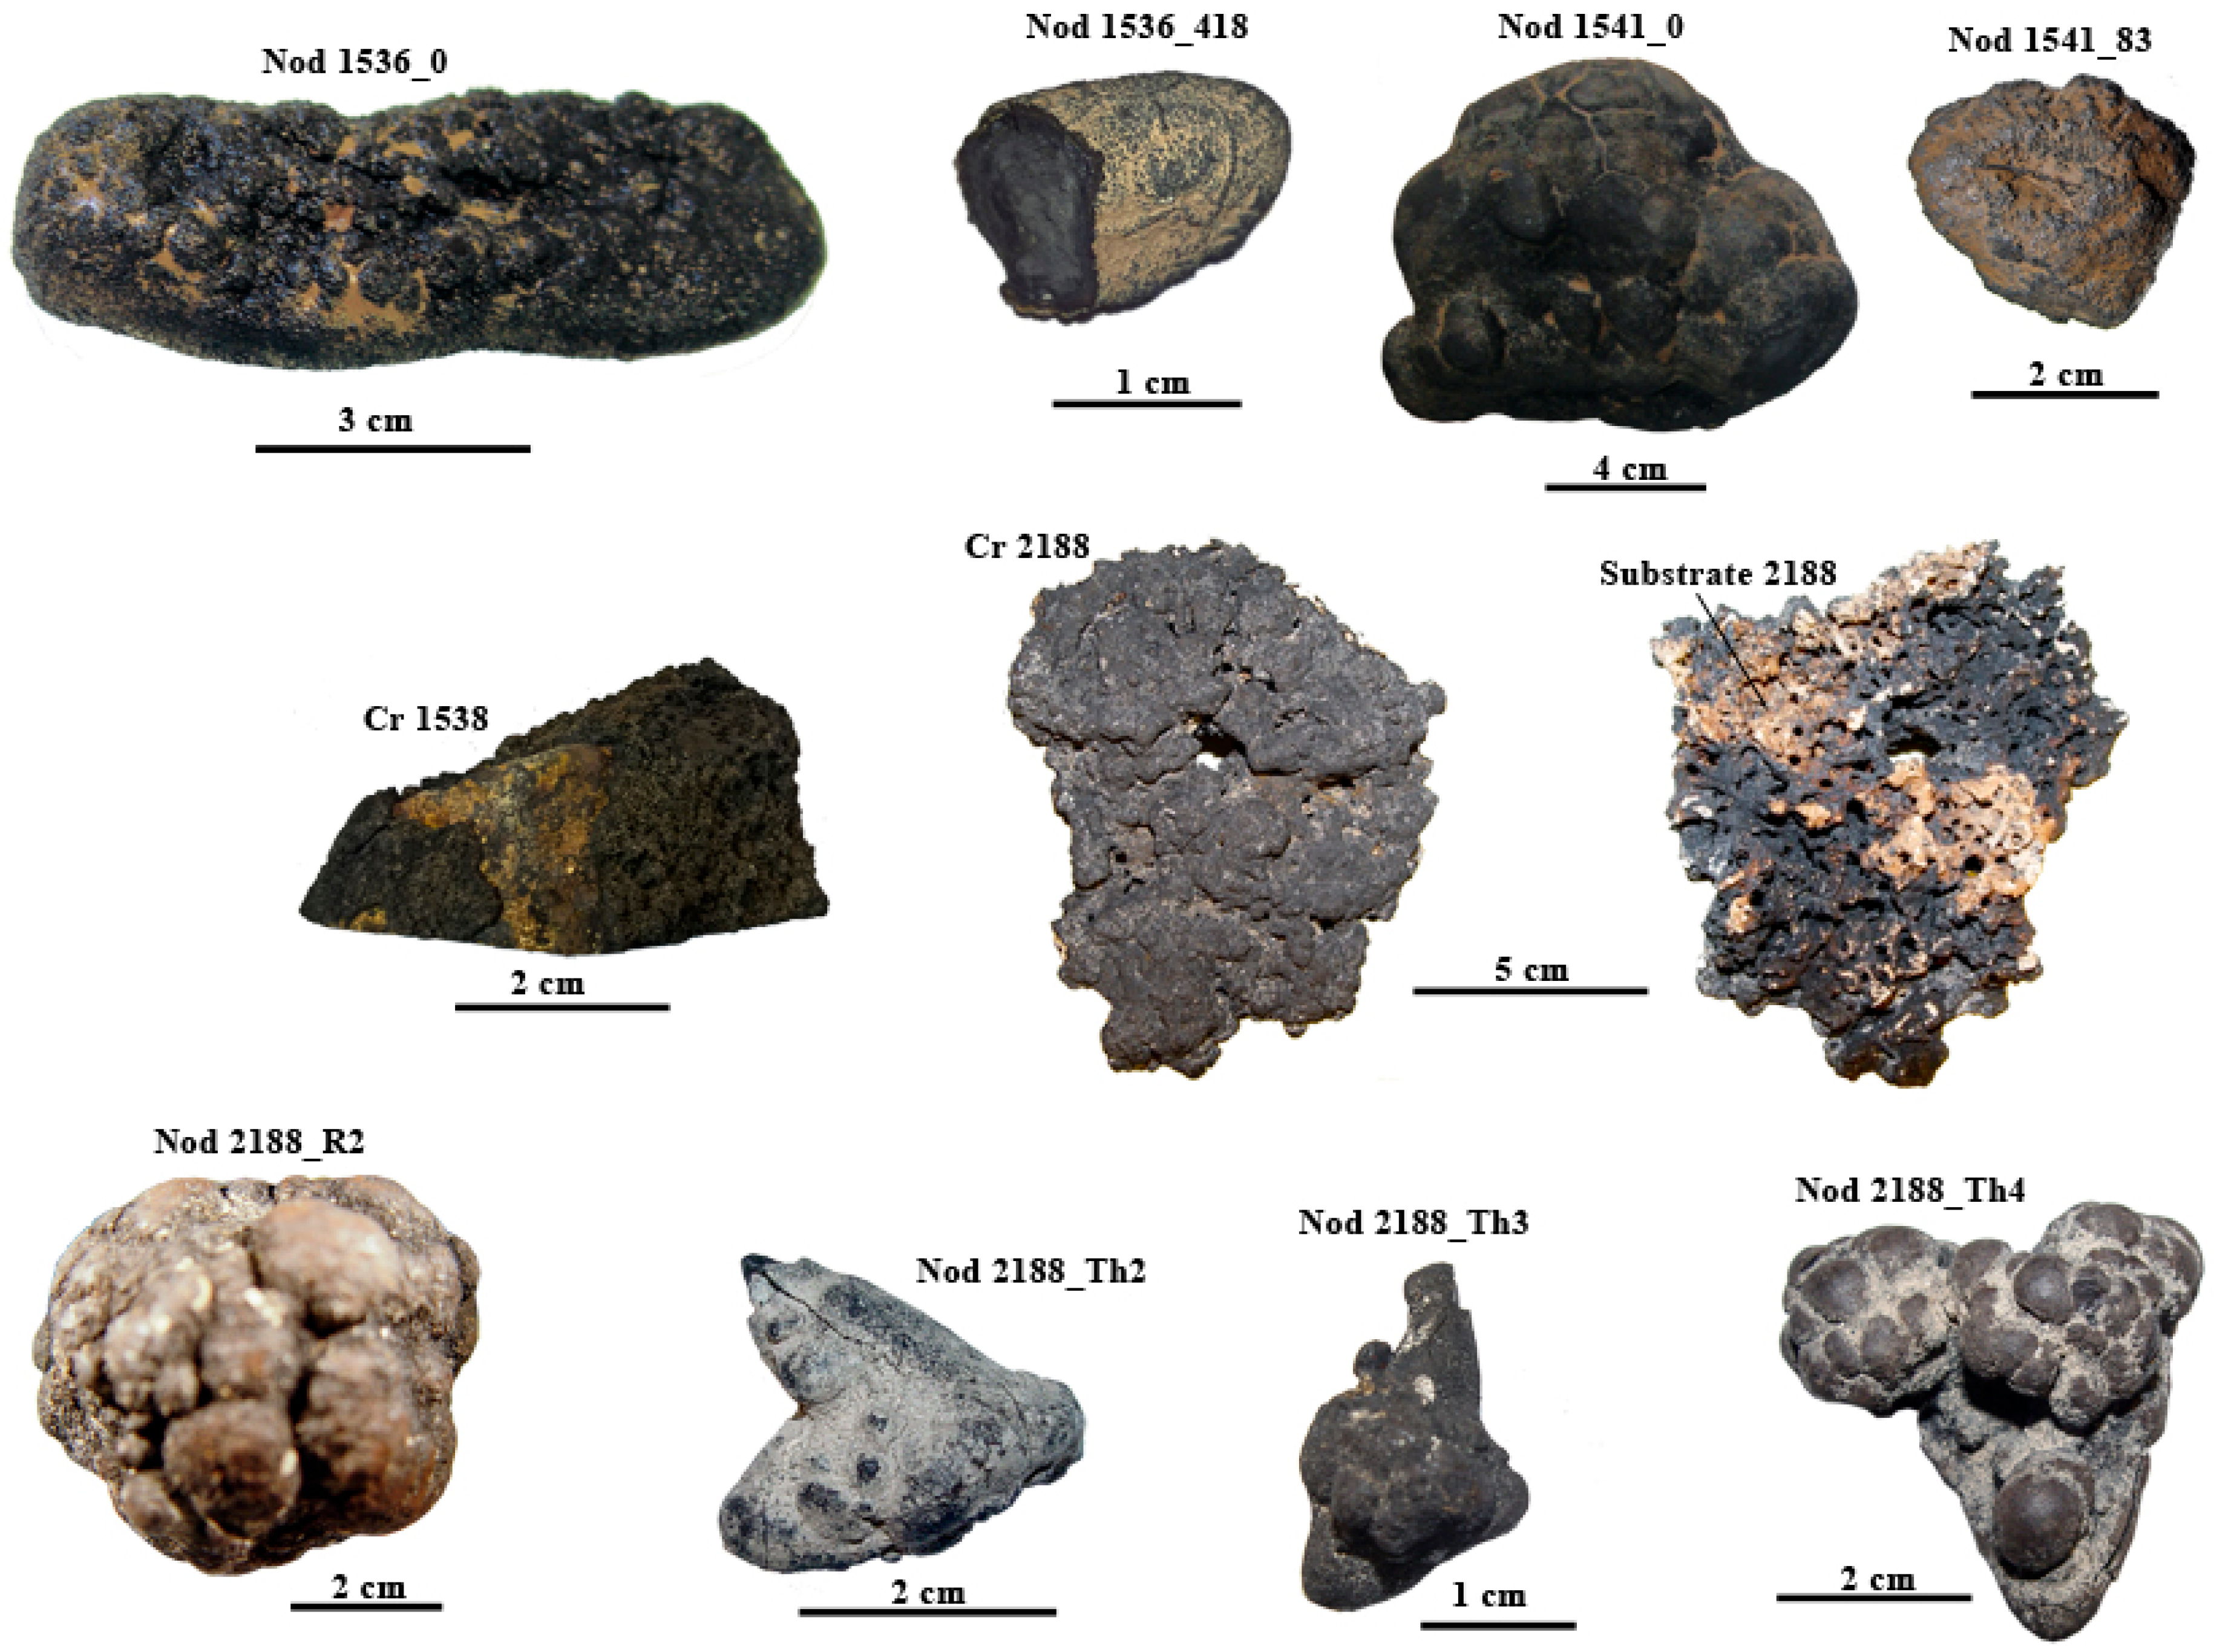
| Sample | Description | Main Minerals (Minor Minerals) |
|---|---|---|
| Nod 1536_0 | Black Fe–Mn nodule 85 × 35 × 20 mm in size with rugged surface and disc-like extended shape | Buserite-2 (asbolane-buserite) |
| Nod 1536_418 | Buried nodule 23 × 15 × 11 mm in size | Buserite-2, Fe-vernadite (asbolane-buserite, birnessite, goethite) |
| Nod 1541_0 | Polynuclear ferromanganese nodule with rugged black surface 115 × 85 × 60 mm in size | Buserite-2, Fe-vernadite (asbolane-buserite, birnessite) |
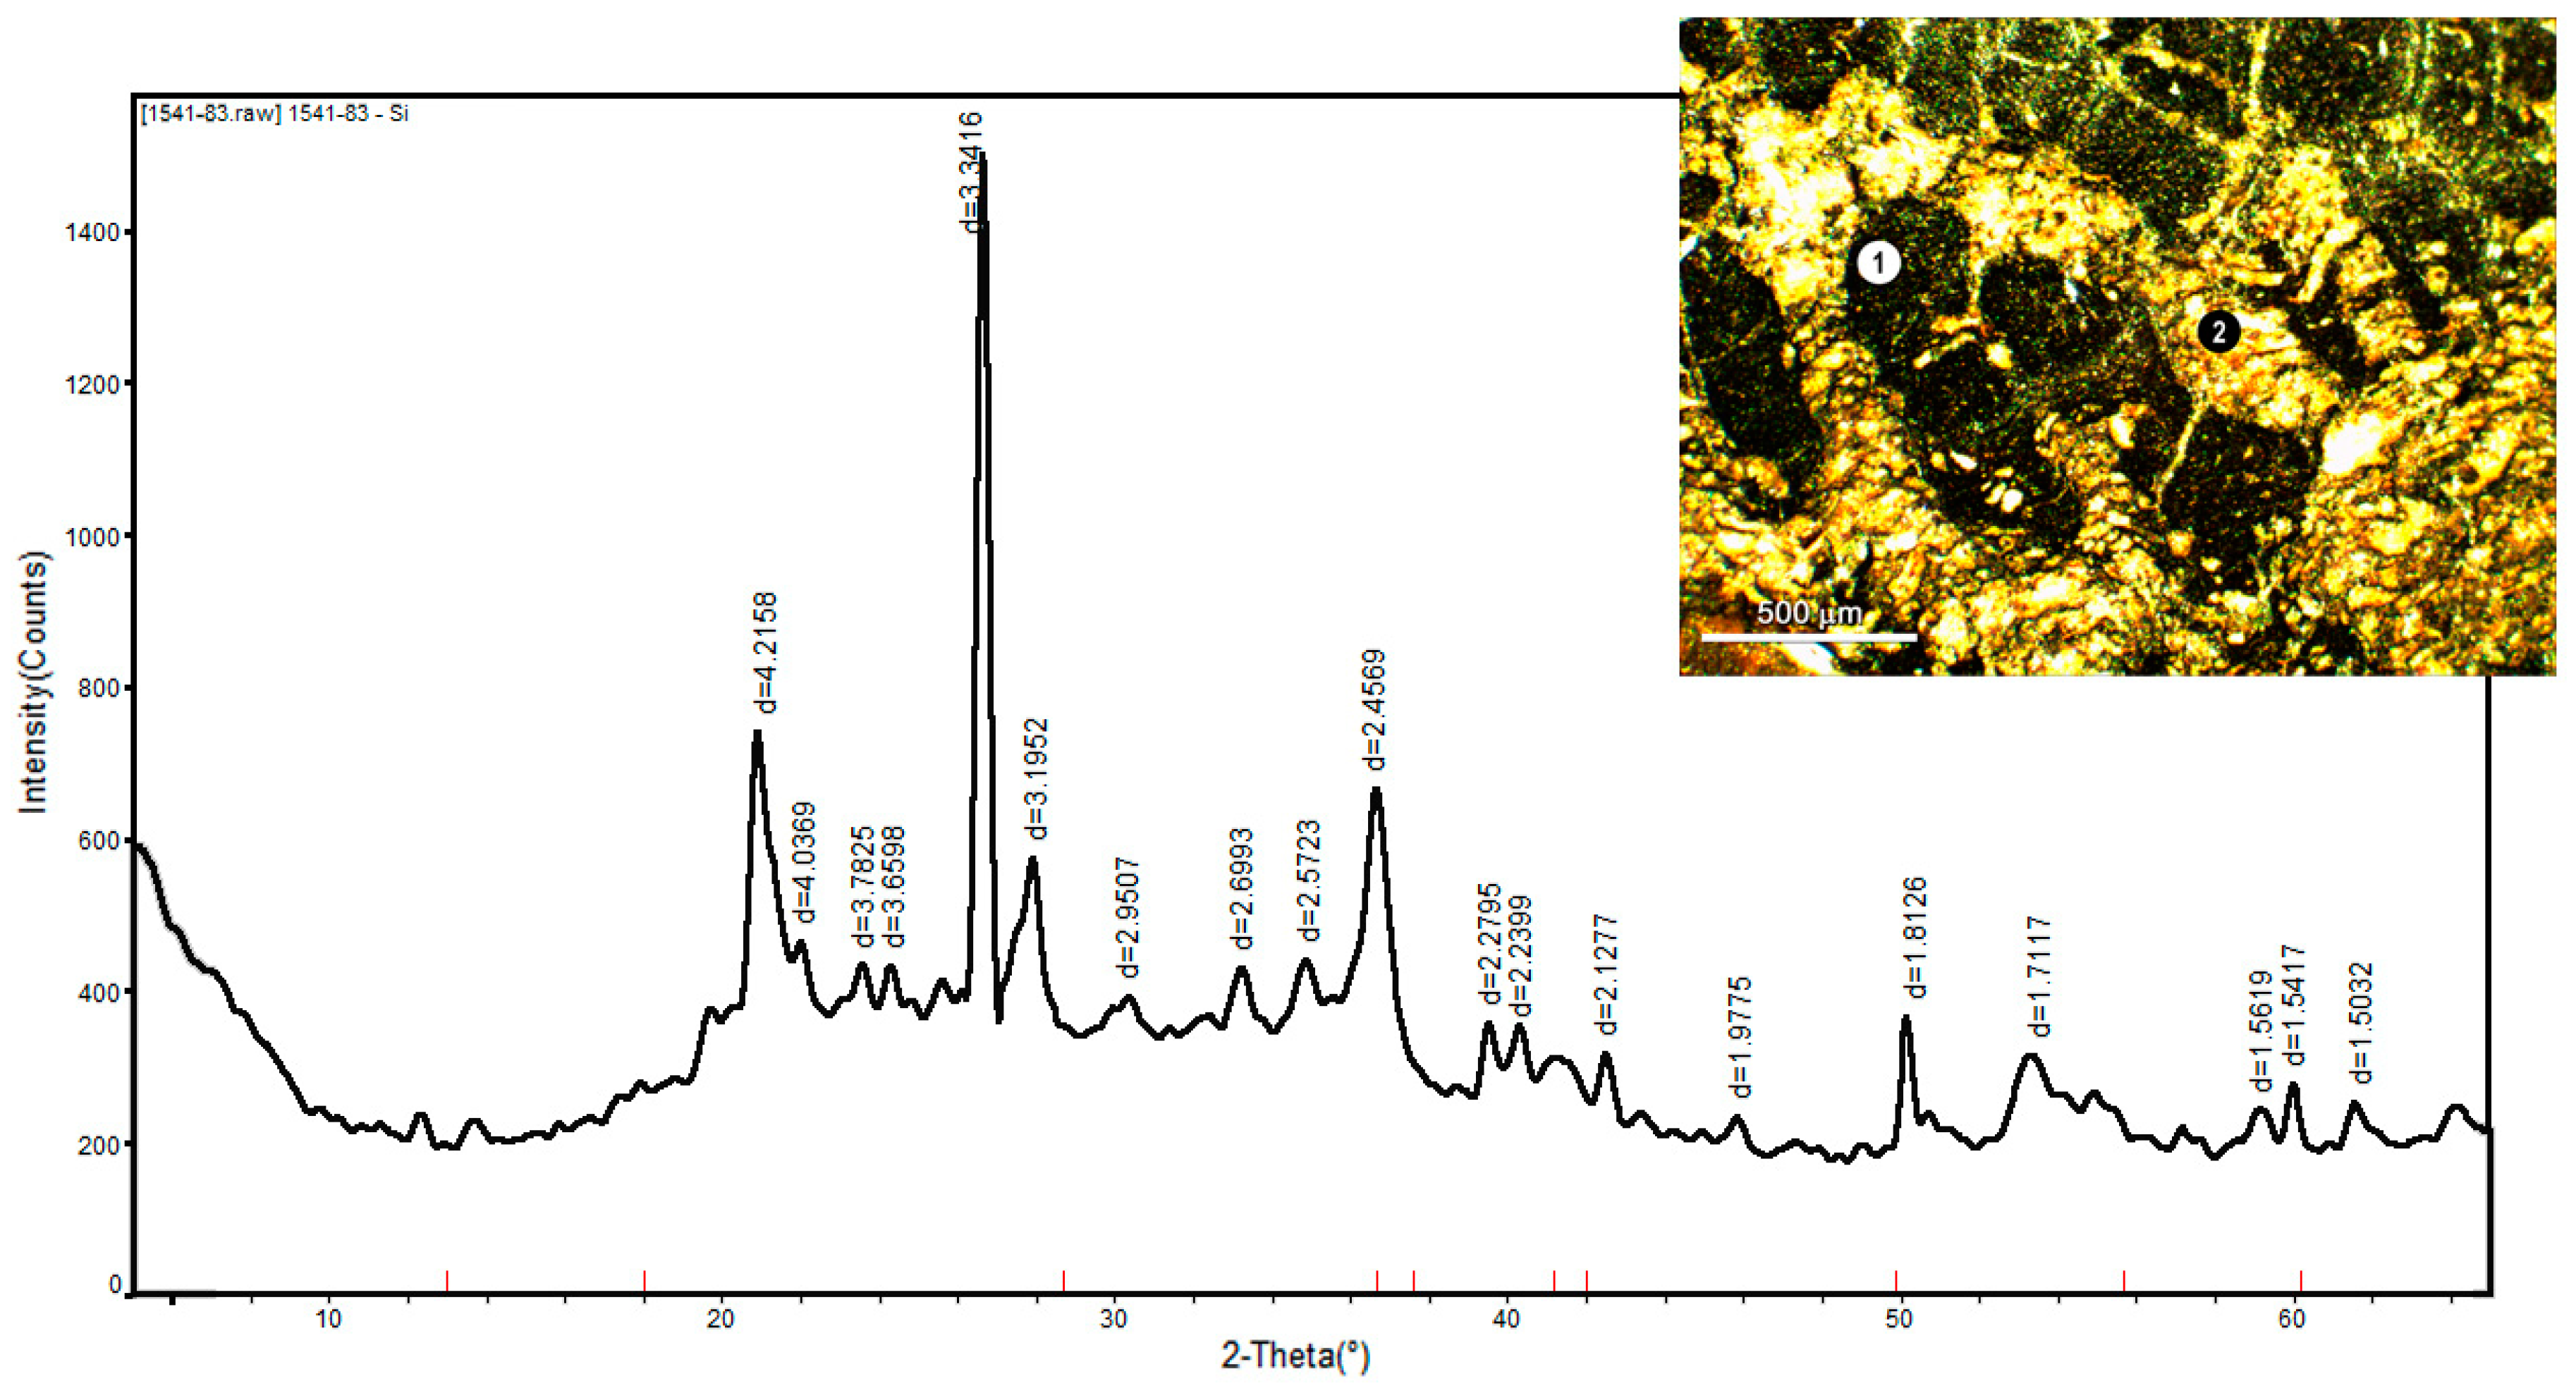
| Nod 1541_83 | Buried nodule 45 × 30 × 7 mm | Feroxyhyte, goethite (Fe-vernadite, hematite) |
| Cr 1538 | Fe–Mn crust 2–3 mm thick on basalt fragment | Fe-vernadite, feroxyhyte (quartz) |
| Nod 2188-R2_0-3 | Spherical nodule 37–41 mm in diameter, outer black layer 0–3 mm from surface | Fe-vernadite, feroxyhyte (vernadite, asbolane-buserite, buserite-1, birnessite) |
| Nod 2188-R2_3-15 | Spherical nodule 37–41 mm in diameter, grey layer 3–15 mm from surface | Fe-vernadite, feroxyhyte (vernadite, asbolane-buserite, nontronite) |
| Nod 2188-Th2 | Biomorphous nodules 24 × 16 × 16 mm, oxyhydroxide layers 1.5–3 mm thick | Fe-vernadite, feroxyhyte (vernadite, asbolane-buserite, nontronite) |
| Nod 2188-Th3 | Biomorphous nodules 20 × 12 × 12 mm, oxyhydroxide layers 1–3 mm thick | Fe-vernadite, feroxyhyte (vernadite, asbolane-buserite, nontronite) |
| Nod 2188-Th4 | Large biomorphous nodule 43 × 41 × 29 mm with shark teeth in nuclei, oxyhydroxide layers 3–14 mm thick | Fe-vernadite, feroxyhyte (vernadite, asbolane-buserite, nontronite) |
| Cr 2188 | Fe–Mn crusts 3−10 mm thick | Fe-vernadite (quartz, plagioclase) |
| Sub 2188 | The substrate of Cr 2188, a fragment of porous pumice transformed into zeolite and clay | Phillipsite, clay (quartz, plagioclase) |
| Sample | Brazil Basin | Cape Basin | ||||||||||
|---|---|---|---|---|---|---|---|---|---|---|---|---|
| Nod 1536_0 | Nod 1536_418 | Nod 1541_0 | Nod 1541_83 | Cr 1538 | Nod 2188-Th2 | Nod 2188-Th3 | Nod 2188-Th4 | Nod 2188-R2 0-3 | Nod 2188-R2 3-15 | Cr 2188 | Substrate 2188 | |
| Mn | 17.8 | 19.7 | 18.6 | 9.3 | 18.0 | 17.7 | 16.9 | 13.9 | 16.9 | 14.2 | 13.5 | 0.8 |
| Fe | 15.7 | 13.1 | 15.7 | 23.5 | 15.1 | 12.4 | 10.4 | 13.7 | 14.4 | 13.0 | 16.3 | 2.9 |
| Mn/Fe | 1.1 | 1.5 | 1.2 | 0.4 | 1.2 | 1.4 | 1.6 | 1.0 | 1.2 | 1.1 | 0.8 | 0.3 |
| Al | 3.66 | 3.58 | 2.95 | 2.90 | 2.18 | 3.50 | 3.45 | 3.63 | 2.4 | 2.5 | 2.20 | 8.29 |
| Mg | 4.87 | 4.49 | 5.14 | 4.30 | 1.28 | - | - | - | 1.2 | 1.0 | 1.27 | 1.75 |
| P | 0.267 | 0.272 | 0.272 | 0.287 | 0.300 | 0.255 | 0.234 | 0.286 | 0.260 | 0.212 | 0.321 | 0.156 |
| Ti | 0.62 | 0.52 | 0.45 | 0.50 | 0.63 | 0.78 | 0.68 | 0.84 | 0.65 | 0.60 | 0.69 | 0.28 |
| Li | 126.3 | 144.0 | 101.2 | 8.5 | 43.4 | 81.9 | 89.2 | 36.4 | 43.9 | 30.0 | 16.5 | 95.4 |
| Be | 2.42 | 2.28 | 3.26 | 7.87 | 3.36 | 5.23 | 4.48 | 3.90 | 3.4 | 3.9 | 3.35 | 1.36 |
| V | 521 | 481 | 511 | 1177 | 605 | 416 | 368 | 441 | 459 | 418 | 561 | 53 |
| Co | 2048 | 2181 | 1617 | 1096 | 3263 | 1254 | 1176 | 1324 | 1556 | 1573 | 1538 | 56 |
| Ni | 6940 | 7665 | 5403 | 347 | 3616 | 4835 | 4917 | 3127 | 4197 | 2969 | 2022 | 528 |
| Cu | 2583 | 2879 | 2896 | 317 | 1353 | 2216 | 2396 | 1215 | 1641 | 1425 | 615 | 571 |
| Zn | 655 | 713 | 643 | 460 | 538 | 655 | 678 | 465 | 636 | 489 | 429 | 186 |
| As | 139 | 120 | 130 | 277 | 188 | - | - | - | 134 | 114 | 200 | 4 |
| Rb | 29.0 | 23.4 | 16.8 | 23.4 | 14.3 | 23.0 | 24.5 | 30.1 | 14.7 | 12.9 | 17.7 | 70.1 |
| Sr | 515 | 591 | 693 | 733 | 947 | 854 | 786 | 850 | 869 | 805 | 988 | 117 |
| Y | 87 | 76 | 93 | 13 | 86 | 122 | 103 | 116 | 128 | 127 | 127 | 89 |
| Mo | 377 | 422 | 416 | 508 | 385 | - | - | - | 212 | 239 | 187 | 11 |
| Cd | 8.4 | 9.8 | 8.3 | 0.9 | 4.1 | 6.4 | 6.5 | 4.0 | 5.8 | 4.5 | 2.9 | 0.4 |
| Cs | 1.8 | 1.1 | 1.1 | 0.6 | 0.8 | 1.0 | 1.0 | 1.0 | 0.8 | 0.7 | 0.9 | 3.0 |
| Ba | 1048 | 1183 | 1228 | 2072 | 985 | 835 | 845 | 879 | 869 | 947 | 739 | 190 |
| W | 72.0 | 75.5 | 48.1 | 19.8 | 42.3 | - | - | - | 32.2 | 40.3 | 24.6 | 1.6 |
| Tl | 121.0 | 130.2 | 89.0 | 20.3 | 157.9 | 148.0 | 145.8 | 90.7 | 150 | 132 | 52.4 | 4.9 |
| Pb | 565 | 688 | 690 | 1056 | 825 | 978 | 896 | 942 | 1191 | 1162 | 1290 | 25 |
| Bi | 7.8 | 8.4 | 7.0 | 6.6 | - | - | - | - | 17.6 | 20.6 | - | - |
| Th | 62.4 | 60.2 | 86.8 | 70.3 | 75.9 | 73.5 | 65.2 | 96.5 | 95.0 | 79.9 | 102.5 | 13.9 |
| U | 4.3 | 4.5 | 4.9 | 7.6 | 7.0 | 7.6 | 6.8 | 7.3 | 7.7 | 6.6 | 7.6 | 0.9 |
| La | 121 | 129 | 171 | 27 | 149 | 156 | 136 | 169 | 192 | 212 | 189 | 62 |
| Ce | 919 | 1072 | 1216 | 2108 | 2103 | 830 | 732 | 1079 | 1378 | 1667 | 1482 | 65 |
| Pr | 33.1 | 34.0 | 49.1 | 5.2 | 34.2 | 46.6 | 40.3 | 48.6 | 56.6 | 65.8 | 52.0 | 21.1 |
| Nd | 132.1 | 134.7 | 192.3 | 18.9 | 126.0 | 187.8 | 163.1 | 194.9 | 217 | 247 | 203.1 | 87.1 |
| Sm | 30.6 | 30.5 | 45.3 | 4.5 | 28.5 | 44.8 | 38.8 | 47.5 | 51.8 | 58.6 | 47.0 | 20.1 |
| Eu | 6.97 | 6.81 | 10.2 | 1.13 | 6.4 | 10.5 | 9.09 | 11.1 | 11.8 | 13.2 | 10.6 | 4.63 |
| Gd | 29.0 | 28.3 | 41.5 | 4.3 | 25.1 | 42.1 | 36.6 | 44.8 | 49.4 | 53.9 | 44.7 | 19.7 |
| Tb | 4.48 | 4.32 | 6.29 | 0.90 | 4.53 | 6.71 | 5.89 | 6.92 | 7.4 | 8.1 | 7.24 | 2.93 |
| Dy | 25.3 | 24.4 | 34.0 | 4.2 | 26.1 | 38.8 | 33.6 | 38.9 | 42.8 | 45.9 | 40.5 | 16.5 |
| Ho | 4.71 | 4.47 | 6.04 | 0.77 | 4.79 | 7.22 | 6.25 | 7.08 | 8.0 | 8.3 | 7.62 | 3.14 |
| Er | 12.7 | 11.9 | 15.8 | 2.3 | 13.8 | 20.2 | 17.2 | 19.5 | 20.9 | 21.8 | 19.4 | 8.3 |
| Tm | 1.82 | 1.74 | 2.27 | 0.37 | 2.01 | 2.91 | 2.49 | 2.78 | 2.8 | 2.9 | 2.56 | 1.05 |
| Yb | 11.5 | 11.0 | 14.1 | 2.5 | 14.5 | 18.5 | 16.1 | 17.6 | 18.2 | 19.3 | 17.5 | 6.7 |
| Lu | 1.82 | 1.71 | 2.23 | 0.42 | 2.28 | 2.77 | 2.35 | 2.60 | 2.8 | 2.9 | 2.69 | 1.01 |
| Ce an | 3.3 | 3.7 | 3.1 | 41.1 | 6.8 | 2.2 | 2.2 | 2.7 | 3.0 | 3.2 | 3.4 | 0.4 |
| ∑REY | 1422 | 1570 | 1899 | 2193 | 2627 | 1537 | 1343 | 1806 | 2187 | 2554 | 2253 | 409 |
| L/H | 0.85 | 0.92 | 1.00 | 0.68 | 0.76 | 0.74 | 0.75 | 0.82 | 0.90 | 0.97 | 0.89 | 0.88 |
| Sample | Ru | Pd | Ir | Pt | Au | |
|---|---|---|---|---|---|---|
| Brazil | Nod 1536_0 | 9.5 | 2.1 | 3.3 | 161 | 0.3 |
| Basin | Nod 1536_418 | 19.3 | 1.1 | 3.3 | 174 | <0.2 |
| Nod 1541_0 | 13.7 | 1.3 | 1.2 | 110 | <0.2 | |
| Nod 1541_83 | 16.2 | 2.8 | 3.4 | 247 | 0.2 | |
| Cr 1538 | 16.7 | 1.8 | 4.6 | 184 | 0.3 | |
| Cape | Nod 2188-Th2 | - | - | 1.7 | 79 | <0.2 |
| Basin | Nod 2188-Th3 | - | - | 1.4 | 78 | <0.2 |
| Nod 2188-Th4 | 9.9 | 1.6 | 2.1 | 80 | 1.2 | |
| Nod 2188-R2_0-3 | 25.9 | 1.4 | 2.2 | 107 | <0.2 | |
| Nod 2188-R2_3-15 | 22.3 | 2.0 | 3.2 | 105 | <0.2 | |
| Cr 2188 | 5.3 | 1.3 | 1.4 | 47 | 0.8 | |
| Sub 2188 | 0.2 | 3.1 | <0.2 | 6 | 0.8 | |
| Seawater [43] | 2 × 10⁻⁶ | 60 × 10−6 | 0.1 × 10⁻⁶ | 50 × 10−6 | 9.8 × 10⁻⁶ * | |
| Pelagic sediments [44] | - | 8.0 | - | 9.5 | 1.4 | |
| Earth crust [45] | 0.1 | 0.4 | 0.05 | 0.4 | 2.5 | |
| MORB [46] | 0.103 | 1.5 | 0.04 | 0.6 | 0.7 ** | |
| CI chondrite [47] | 710 | 550 | 455 | 1010 | 140 |
| Sample | Growth Rate (mm∙Ma−1) | Pt Flux (ng∙cm−2∙Ma−1) |
|---|---|---|
| Nod 1541_0 | 2.4 | 42.2 |
| Nod 2188-Th4 | 2.8 | 35.2 |
| Cr 1538 | 2.2 | 64.8 |
| Cr 2188 | 6.5 | 48.9 |
© 2018 by the authors. Licensee MDPI, Basel, Switzerland. This article is an open access article distributed under the terms and conditions of the Creative Commons Attribution (CC BY) license (http://creativecommons.org/licenses/by/4.0/).
Share and Cite
Berezhnaya, E.D.; Dubinin, A.V.; Rimskaya-Korsakova, M.N.; Safin, T.H. Accumulation of Platinum Group Elements in Hydrogenous Fe–Mn Crust and Nodules from the Southern Atlantic Ocean. Minerals 2018, 8, 275. https://doi.org/10.3390/min8070275
Berezhnaya ED, Dubinin AV, Rimskaya-Korsakova MN, Safin TH. Accumulation of Platinum Group Elements in Hydrogenous Fe–Mn Crust and Nodules from the Southern Atlantic Ocean. Minerals. 2018; 8(7):275. https://doi.org/10.3390/min8070275
Chicago/Turabian StyleBerezhnaya, Evgeniya D., Alexander V. Dubinin, Maria N. Rimskaya-Korsakova, and Timur H. Safin. 2018. "Accumulation of Platinum Group Elements in Hydrogenous Fe–Mn Crust and Nodules from the Southern Atlantic Ocean" Minerals 8, no. 7: 275. https://doi.org/10.3390/min8070275