Article

Archaean Gold Mineralization in an Extensional Setting: The Structural History of the Kukuluma and Matandani Deposits, Geita Greenstone Belt, Tanzania

by
Shimba D. Kwelwa
1,2,
Paulus H. G. M. Dirks
1,3,
Ioan V. Sanislav
1,3,*,
Thomas Blenkinsop
4 and
Sergio L. Kolling
2
1
Economic Geology Research Centre (EGRU), Townsville, QLD 4811, Australia
2
Geita Gold Mine, Geita, P.O. Box 532, Geita Region, Tanzania
3
Department of Geosciences, James Cook University, Townsville, QLD 4811, Australia
4
School of Earth & Ocean Sciences, Cardiff University, Cardiff CF10 3AT, UK
*
Author to whom correspondence should be addressed.
Minerals 2018, 8(4), 171; https://doi.org/10.3390/min8040171
Submission received: 22 March 2018 / Accepted: 22 March 2018 / Published: 21 April 2018

Abstract

:
Three major gold deposits, Matandani, Kukuluma, and Area 3, host several million ouncez (Moz) of gold, along a ~5 km long, WNW trend in the E part of the Geita Greenstone Belt, NW Tanzania. The deposits are hosted in Archaean volcanoclastic sediment and intrusive diorite. The geological evolution of the deposits involved three separate stages: (1) an early stage of syn-sedimentary extensional deformation (D1) around 2715 Ma; (2) a second stage involving overprinting ductile folding (D2–4) and shearing (D5–6) events during N-S compression between 2700 and 2665 Ma, coeval with the emplacement of the Kukuluma Intrusive Complex; and (3) a final stage of extensional deformation (D7) accommodated by minor, broadly east-trending normal faults, preceded by the intrusion of felsic porphyritic dykes at ~2650 Ma. The geometry of the ore bodies at Kukuluma and Matandani is controlled by the distribution of magnetite-rich meta-ironstone, near the margins of monzonite-diorite bodies of the Kukuluma Intrusive Complex. The lithological contacts acted as redox boundaries, where high-grade mineralization was enhanced in damage zones with higher permeability, including syn-D3 hydrothermal breccia, D2–D3 fold hinges, and D6 shears. The actual mineralizing event was syn-D7, and occurred in an extensional setting that facilitated the infiltration of mineralizing fluids. Thus, whilst gold mineralization is late-tectonic, ore zone geometries are linked to older structures and lithological boundaries that formed before gold was introduced. The deformation-intrusive history of the Kukuluma and Matandani deposits is near identical to the geological history of the world-class Nyankanga and Geita Hill deposits in the central part of the Geita Greenstone Belt. This similarity suggests that the geological history of much of the greenstone belt is similar. All major gold deposits in the Geita Greenstone Belt lack close proximity to crustal-scale shear zones; they are associated with intrusive complexes and volcanics that formed in an oceanic plateau rather than subduction setting, and formed late-tectonically during an extensional phase. They are not characteristic of typical orogenic gold deposits.

1. Introduction

Archean deposits are a major source for gold across most cratonic regions in the world [1,2,3,4]. Except for gold deposits linked to supra-crustal basins, such as the giant deposits in the Witwatersrand Basin, the bulk of Archean gold is hosted within or adjacent to greenstone belts; these are commonly classified as orogenic [5,6,7,8,9] or Archaean lode gold deposits, to use a less generic term.
Archean orogenic gold deposits show many common features, including a common association with major fault systems that cut volcano-sedimentary sequences in greenstone belts (e.g., [4,10]). These faults channel mineralising fluids from deeper crustal levels to traps in an episodic manner through seismic pumping [11,12]. The fluids that transport the gold are typically aqueous-carbonic fluids, with 5–20 mol % CO2, derived from metamorphic devolatilization reactions [8], and are associated with a quartz-carbonate alteration and a low-sulphidation ore assemblage dominated by pyrite-arsenopyrite, with deposition typically (but not exclusively) occurring in greenschist facies domains [6,13].
Whilst many studies of world-class gold deposits in well-endowed areas, such as the Yilgarn and Superior Cratons, suggest that mineralization involved multiple stages of gold enrichment [13,14,15,16,17], evidence for this can be equivocal, because of the complexities associated with structural overprints and reactivations of peak-metamorphic shear zones during later events [18]. Some authors [9] argue strongly that the notion of multiple mineralizing events is wrong, and that all orogenic gold deposits, including the Archean deposits, formed during a single late-tectonic stage and in a subduction-related tectonic setting in accretionary to collisional orogenic belts, where fluid flow is driven by a change in far-field stress shortly before cratonization [9]. By classifying the deposits in this way, Archaean gold deposits are placed in a plate-tectonic setting that is similar to today—a contention that remains strongly contested [18,19,20,21,22].
Because gold mineralization occurs late in most granite-greenstone terrains [2,6,9,18], irrespective of what underlying tectonic model is applied, gold trapping structures can be highly diverse in geometry, and will be controlled by the interplay of multiple overprinting deformational and intrusive events [9]. To understand the detailed structural architecture of a greenstone sequence in relation to the timing of mineralization is therefore important when working out gold distribution patterns. The aim of this study is to do this for a set of major gold deposits in a relatively poorly known greenstone sequence in the Lake Victoria goldfield in Tanzania (Figure 1 and Figure 2)
The Geita Greenstone Belt (GGB) in the northern part of the Tanzania Craton (Figure 1) hosts world-class gold deposits spread along a 35 km long corridor in the central part of the greenstone belt (Figure 2). These deposits, include (from west to east) the Star and Comet, Nyangkanga, Lone Cone, Geita Hill, Matandani, and Kukuluma deposits (Figure 2), and are commonly referred to collectively as the Geita mine [7]. All these deposits are largely hosted in silicified, magnetite-rich metasedimentary units (referred to in the mine as meta-ironstones) near the intrusive contacts of monzonitic to dioritic bodies that intruded the greenstone belt [23,24,25,26].
To date no detailed work has been published on the major deposits that occur in the eastern part of the GGB (Figure 2 and Figure 3). These include the Matandani, Kukuluma, and Area 3 deposits that collectively host several Moz of gold. In this paper, a deformation model for the area around the Matandani and Kukuluma pits will be presented, based on detailed mapping and core logs from the pits and surrounding areas. The deformation model will be linked to the relative timing of intrusive units and gold mineralization, and forms the basis for geochemical and geochronological studies in the area [26,28].

2. Regional Geological Framework

The Tanzania craton consists of a core of >3.0 giga annum (Ga) high-grade mafic and felsic granulite (the Dodoman Supergroup), overlain by a volcano-sedimentary package dominated by mafic volcanics (the 2820–2700 Ma Nyanzian Supergroup) and younger (<2650 Ma), mostly coarse clastic sediment of the Kavirondian Supergroup [31,32,33,34,35,36,37]. Rocks belonging to the Dodoman Supergroup are restricted to the southern part of the craton, with the northern craton comprised of younger (<2.82 Ga), juvenile crust [36,38,39]. The latter has been alternatively interpreted as accretionary volcanic arc systems [40] or vertically accreting and chemically evolving oceanic plateaus [39] that docked with the older cratonic core during the Neoarchaean.
The Nyanzian and Kavirondian sequences in the northern part of the Tanzania Craton have been grouped into six greenstone belts (Figure 1) clustered around the margins of Lake Victoria [34]. Each of these greenstone belts comprises a series of disconnected greenstone domains that were grouped based on perceived stratigraphic correlations and geographic proximity [41], in spite of the presence of large shear zones that separate parts of each greenstone belt [27]. Of the six greenstone belts, the Sukumaland Greenstone Belt is the largest, containing fragments that are large enough, and tectonically and stratigraphically distinct enough to be categorized as greenstone belts in their own right. This includes a greenstone domain along the northern margin of the Sukumaland Greenstone Belt, which we have termed the Geita Greenstone Belt (Figure 2), following terminology introduced by [25,37].

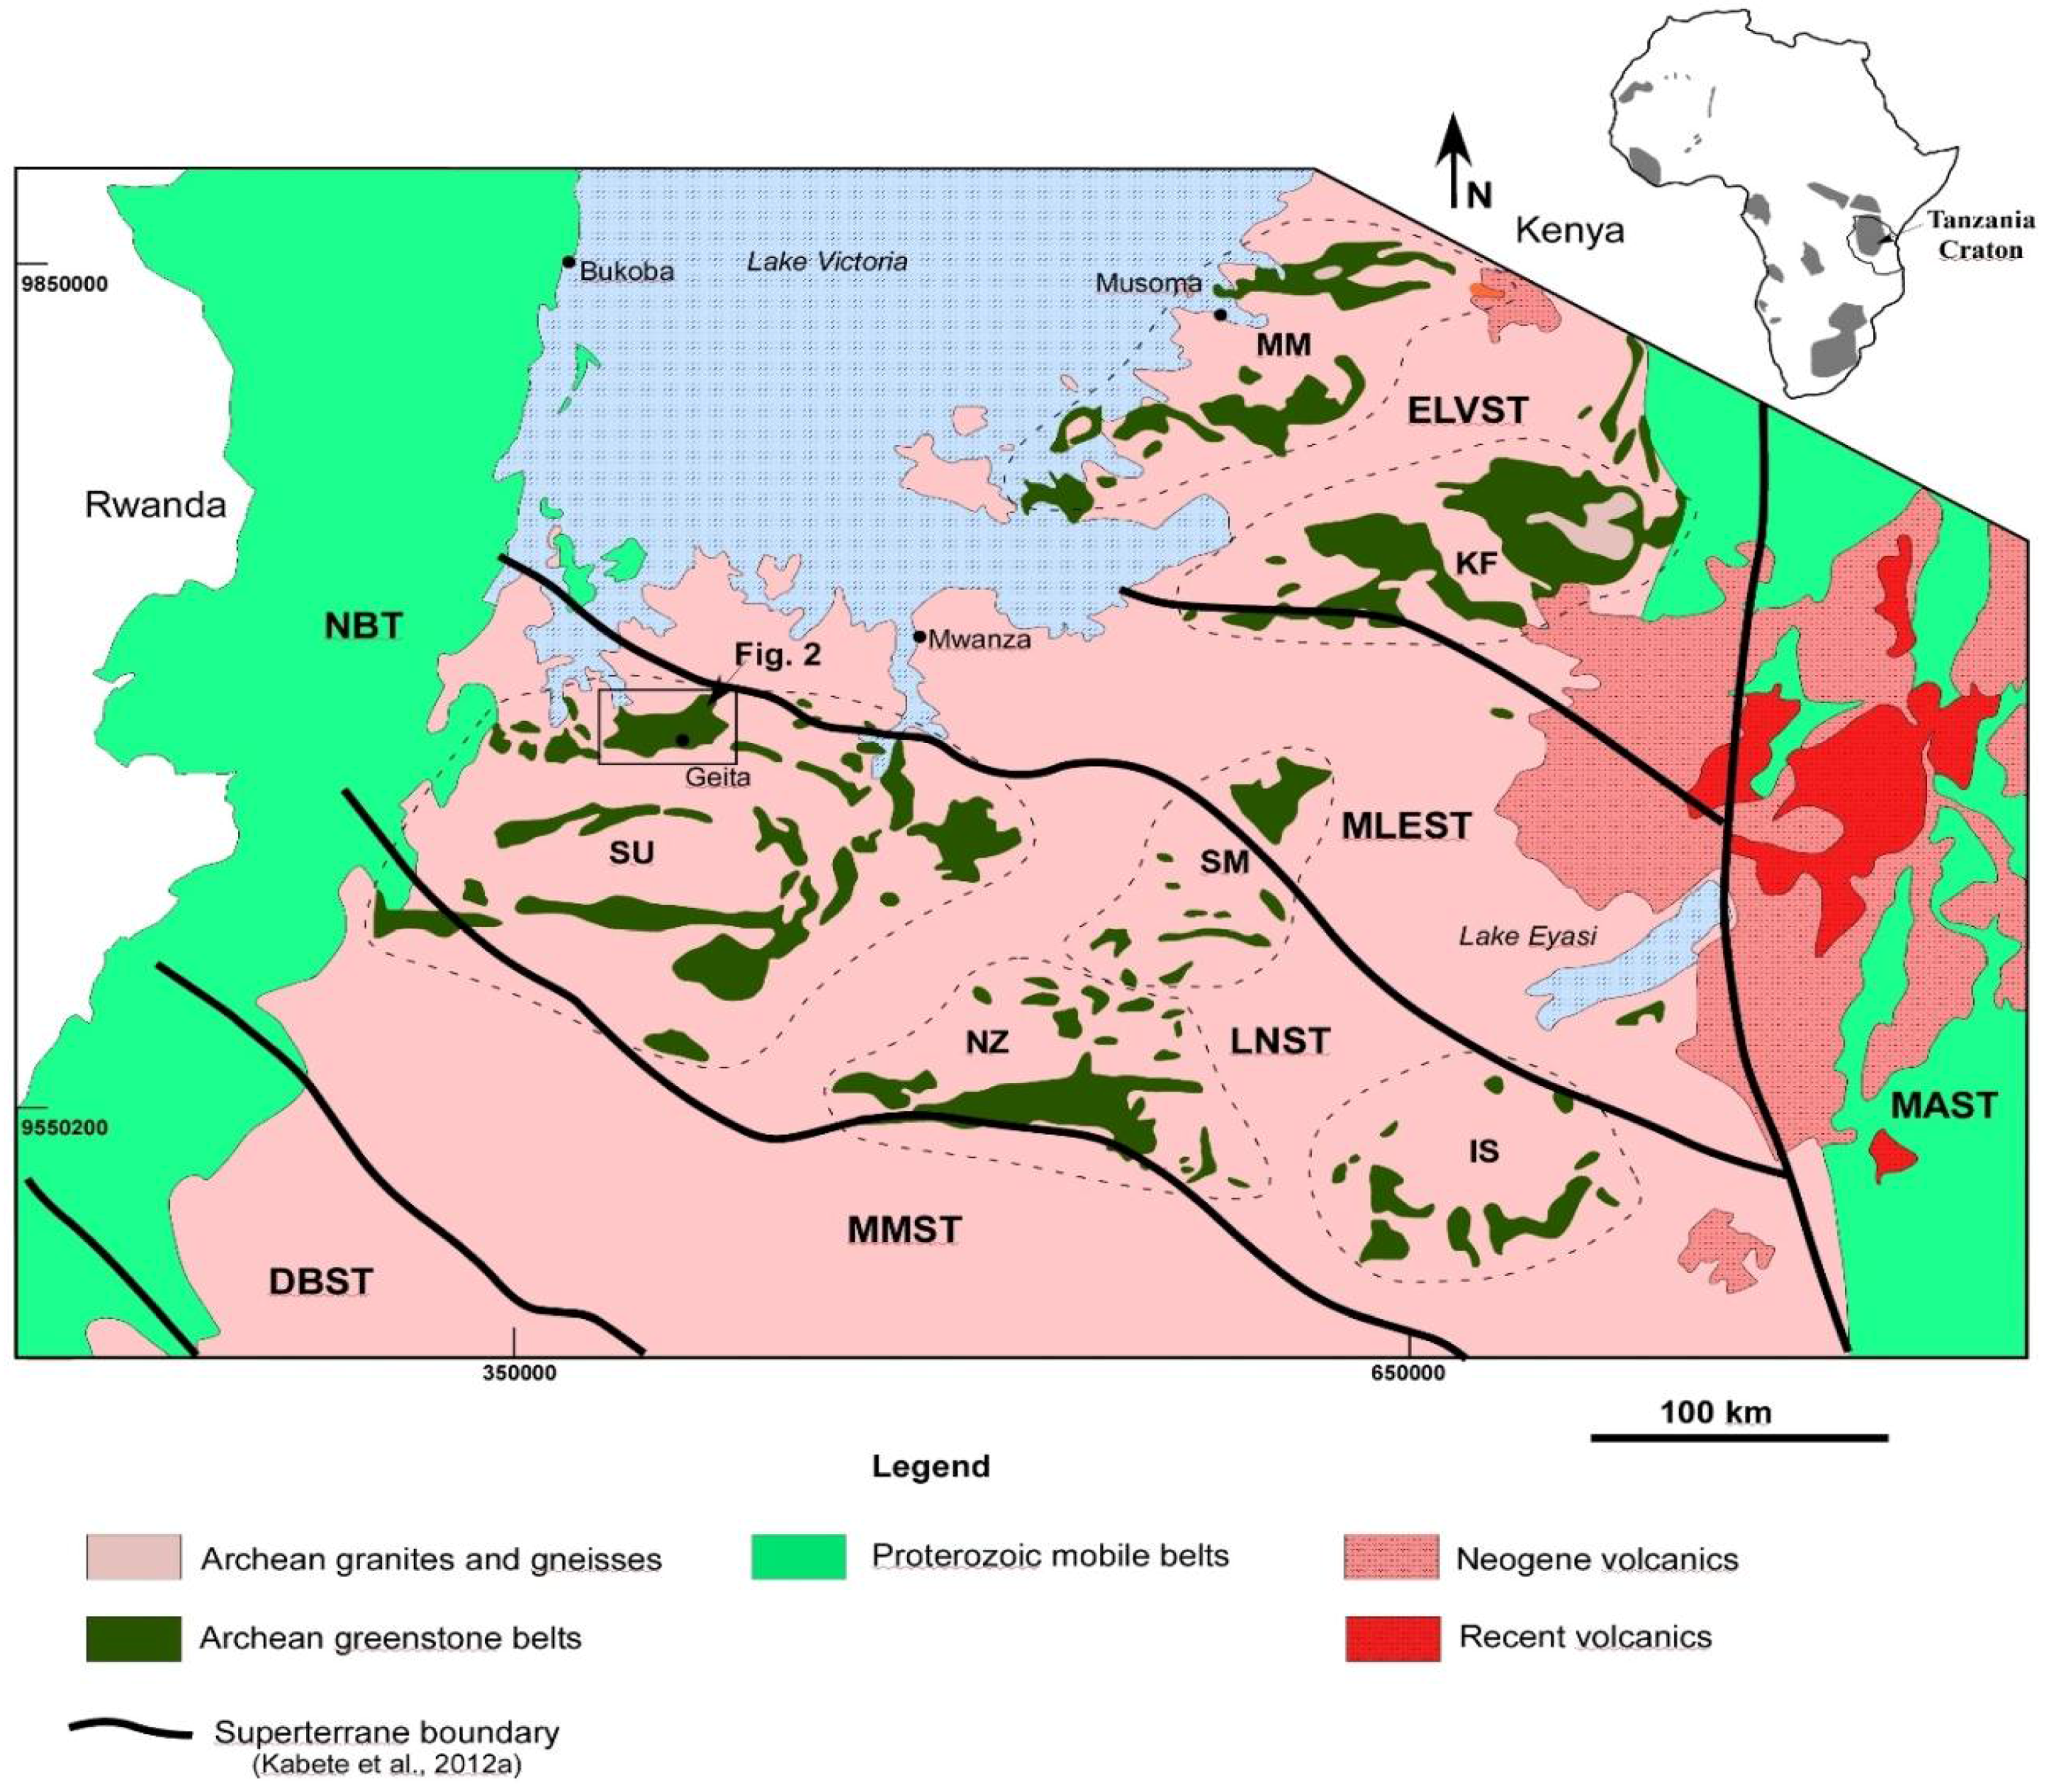
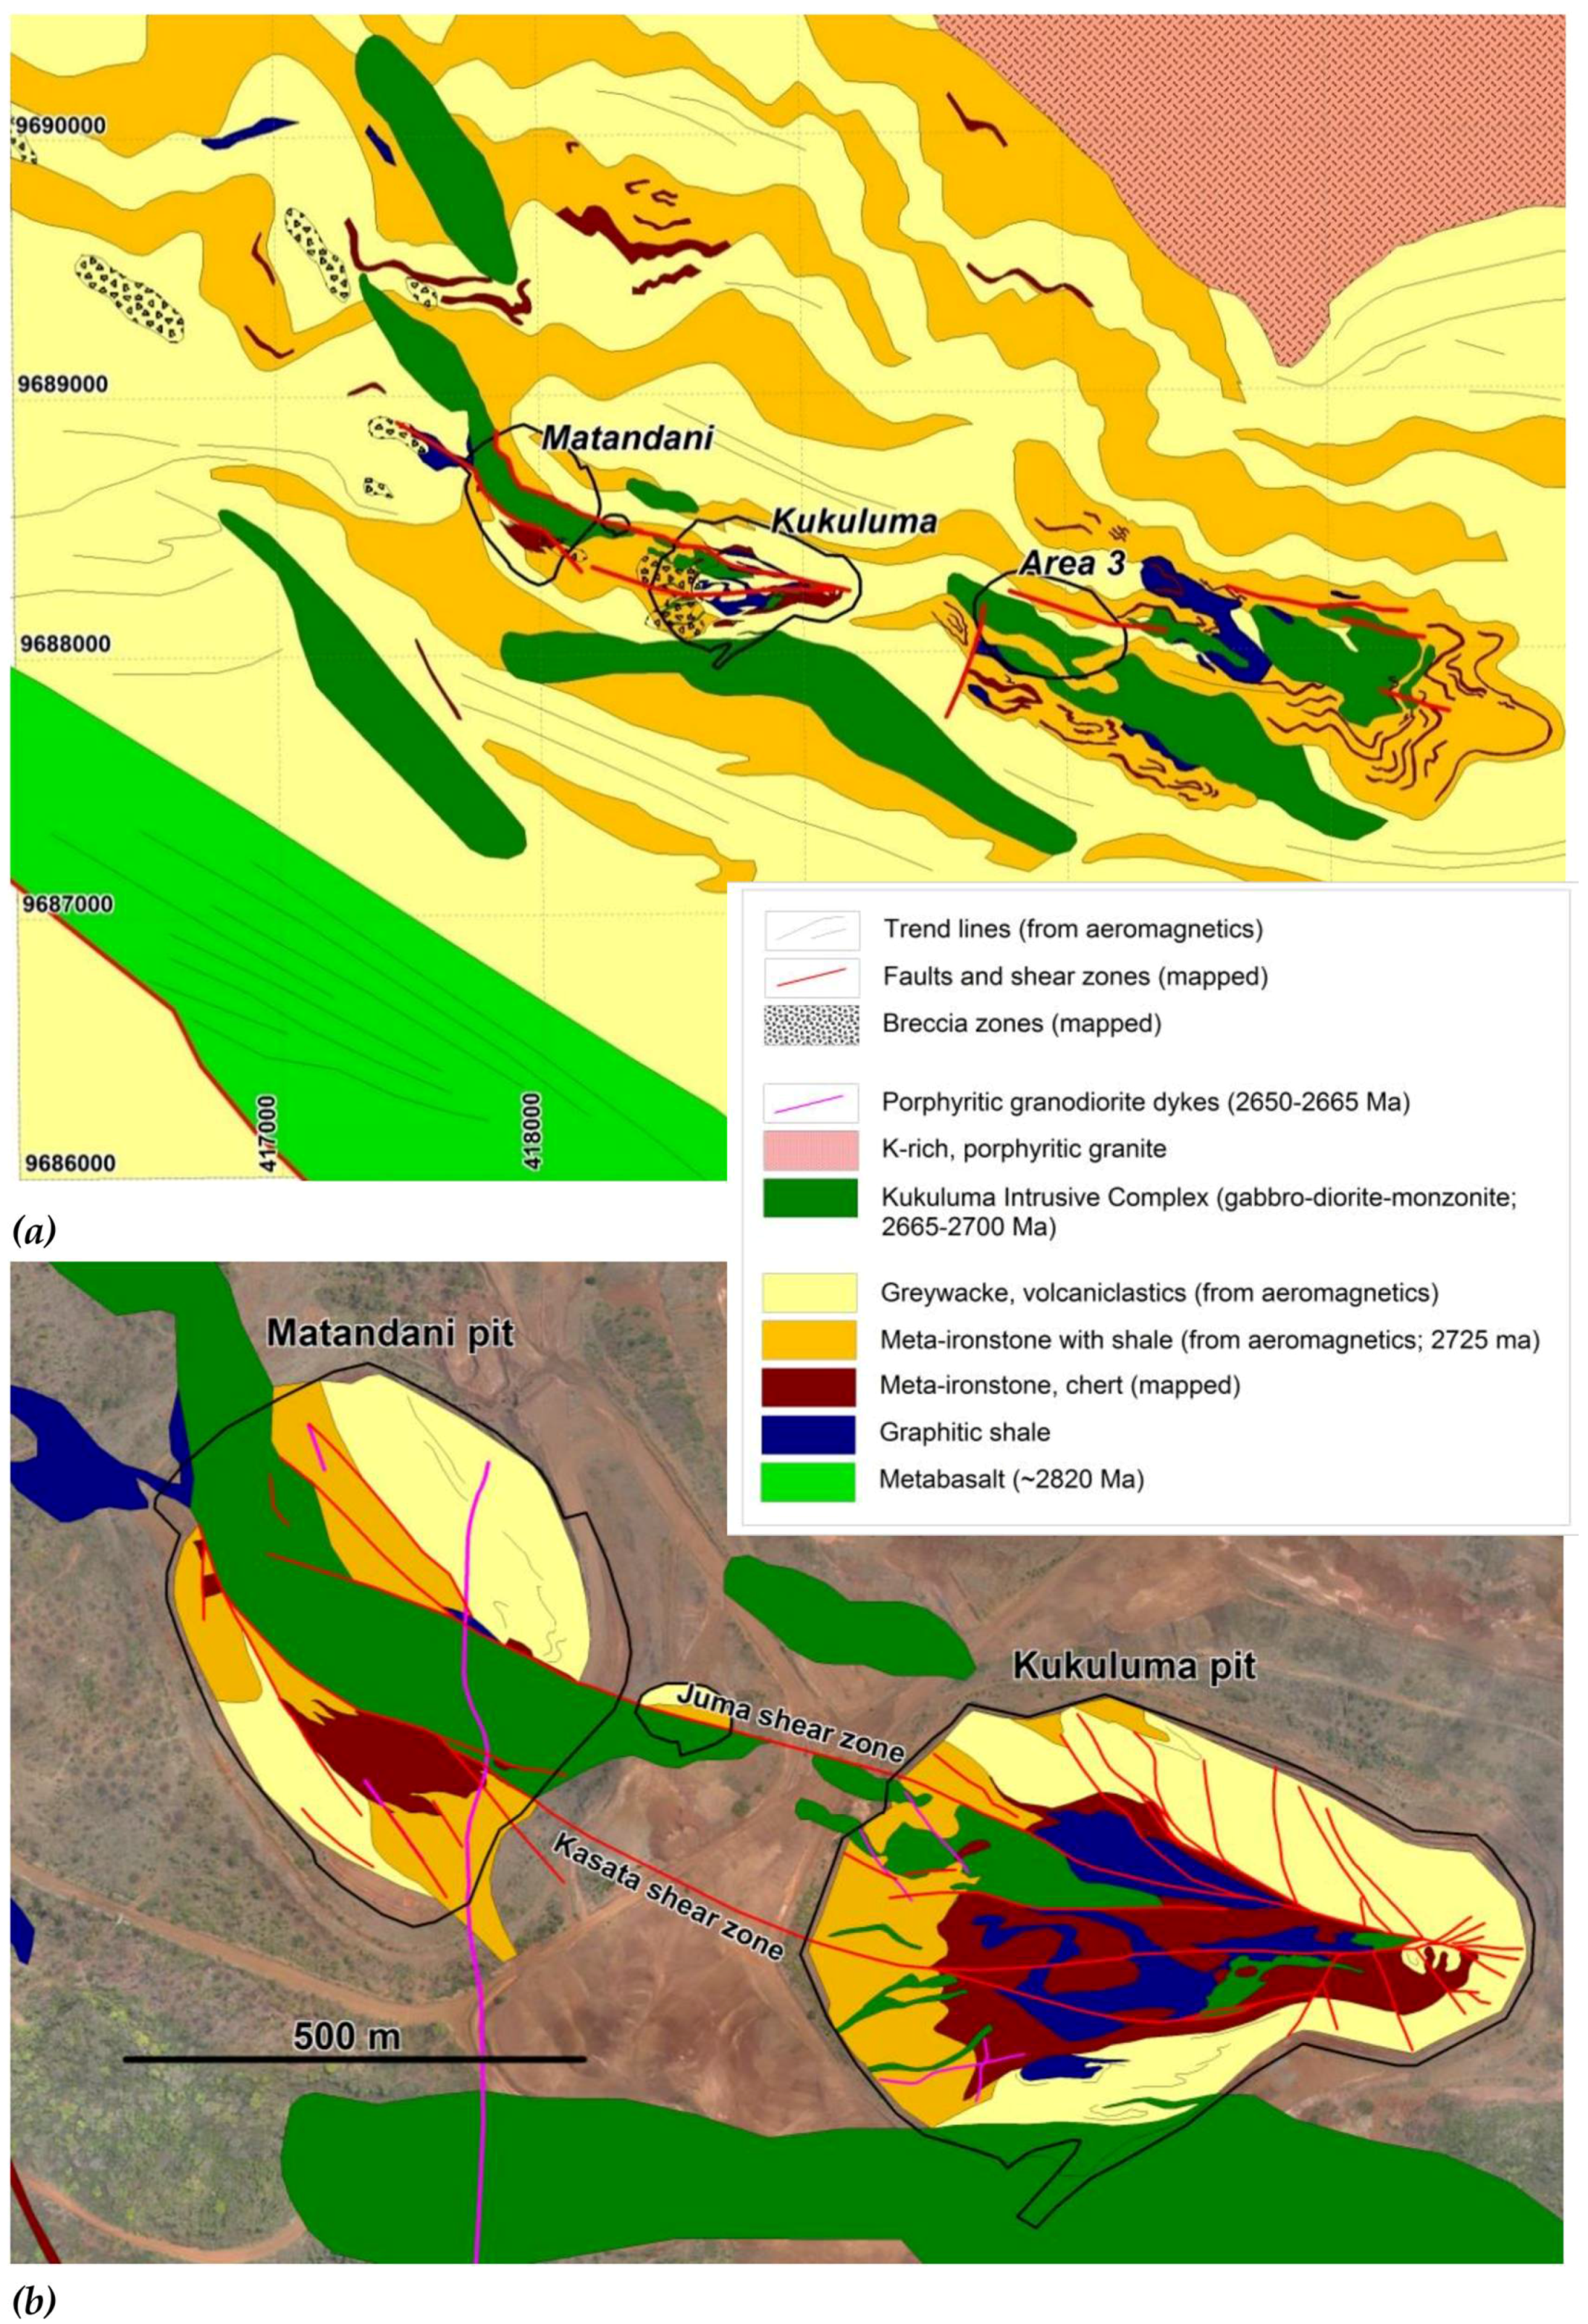
2.1. The Geita Greenstone Belt (GGB)

The Geita Greenstone Belt (GGB, Figure 2) forms an 80 km × 25 km large, generally east–west trending portion of mafic-felsic volcanic, volcanoclastic, and sedimentary rocks, bounded to the south by a large, east–west trending shear zone that separates the belt from gneiss and mylonitic granitoid [29]. To the north, east, and west the greenstone units were intruded by late syn- to post-tectonic granitoid plutons dated at 2660–2620 Ma [30]. The southern part of the GGB contains meta-basalt, with minor gabbro and a MORB-like affinity yielding ages of ~2823 Ma [36,37], which were deposited through vertical melt segregation in an oceanic plateau environment [37,39]. The remainder of the greenstone belt is dominated by meta-ironstone units intercalated with and overlain by turbiditic meta-sedimentary units and volcanoclastic beds older than 2699 ± 9 Ma [25,35]. These units were intruded by syn-tectonic igneous complexes of dioritic to tonalitic composition [24,25,26]. The diorite intrusive complex around Nyankanga and Geita Hill were dated at 2686 ± 13 Ma and 2699 ± 9 Ma (U-Pb zircon, [35]), and the intrusive complex around Kukuluma at between 2717 ± 12 Ma and 2667 ± 17 Ma (Figure 2 and Figure 3, [26,28]).
Meta-ironstone units are exposed in three distinct northwest-southeast trending terrains, separated by areas with little or no outcrop underlain by meta-sediments. The boundaries of these terrains are characterized by major lineaments visible on aero-magnetic datasets and interpreted as large shear zones (Figure 2). These terrains are the Nyamulilima terrain to the west, the Central terrain in the middle, and Kukuluma terrain to the east (Figure 2). The Kukuluma terrain contains the Matandani and Kukuluma deposits, which were mined until 2007 (Figure 2 and Figure 3). The nearby Area 3 deposit is undeveloped.
Initial models for the deformation history of the GGB invoked early upright folding, overprinted by a second folding event characterized by steeply plunging axes and cut by later regional and subsidiary shear zones, which represent the main pathways for hydrothermal fluids [23,33,41]. Mine models in the early 2000s assumed that mineralized shear zones in the GGB were part of complex thrust stacks associated with horizontal shortening and stacking of the greenstone sequence, with gold mineralization concentrating in dilatant zones along thrusts and near fold hinges [42,43]. Subsequent mining has demonstrated that complex thrust stacks with stratigraphic duplication do not exist, but instead that gold is related to a complex interplay of folding and intrusive events cut by late, mainly eastern-trending fracture zones as seen in the Nyankanga and Geita Hill deposits (Figure 2, [24,25]). Detailed structural work in these deposits [24,25] has shown that the mineralization is centered on northwest dipping reverse faults (referred to in Geita Hill as D6) that overprint a complexly folded (referred to in Geita Hill as D1–5) stack of meta-ironstone and chert, and were reactivated as later normal faults at the time of mineralization (called D8 at Geita Hill). Gold-deposition preferentially occurred along diorite-meta-ironstone contacts exploited by the fracture systems [24,25] after emplacement of a lamprophyre dyke at 2644 ± 3 Ma [35], i.e., 20–30 Ma later than the formation of reverse faults [24].

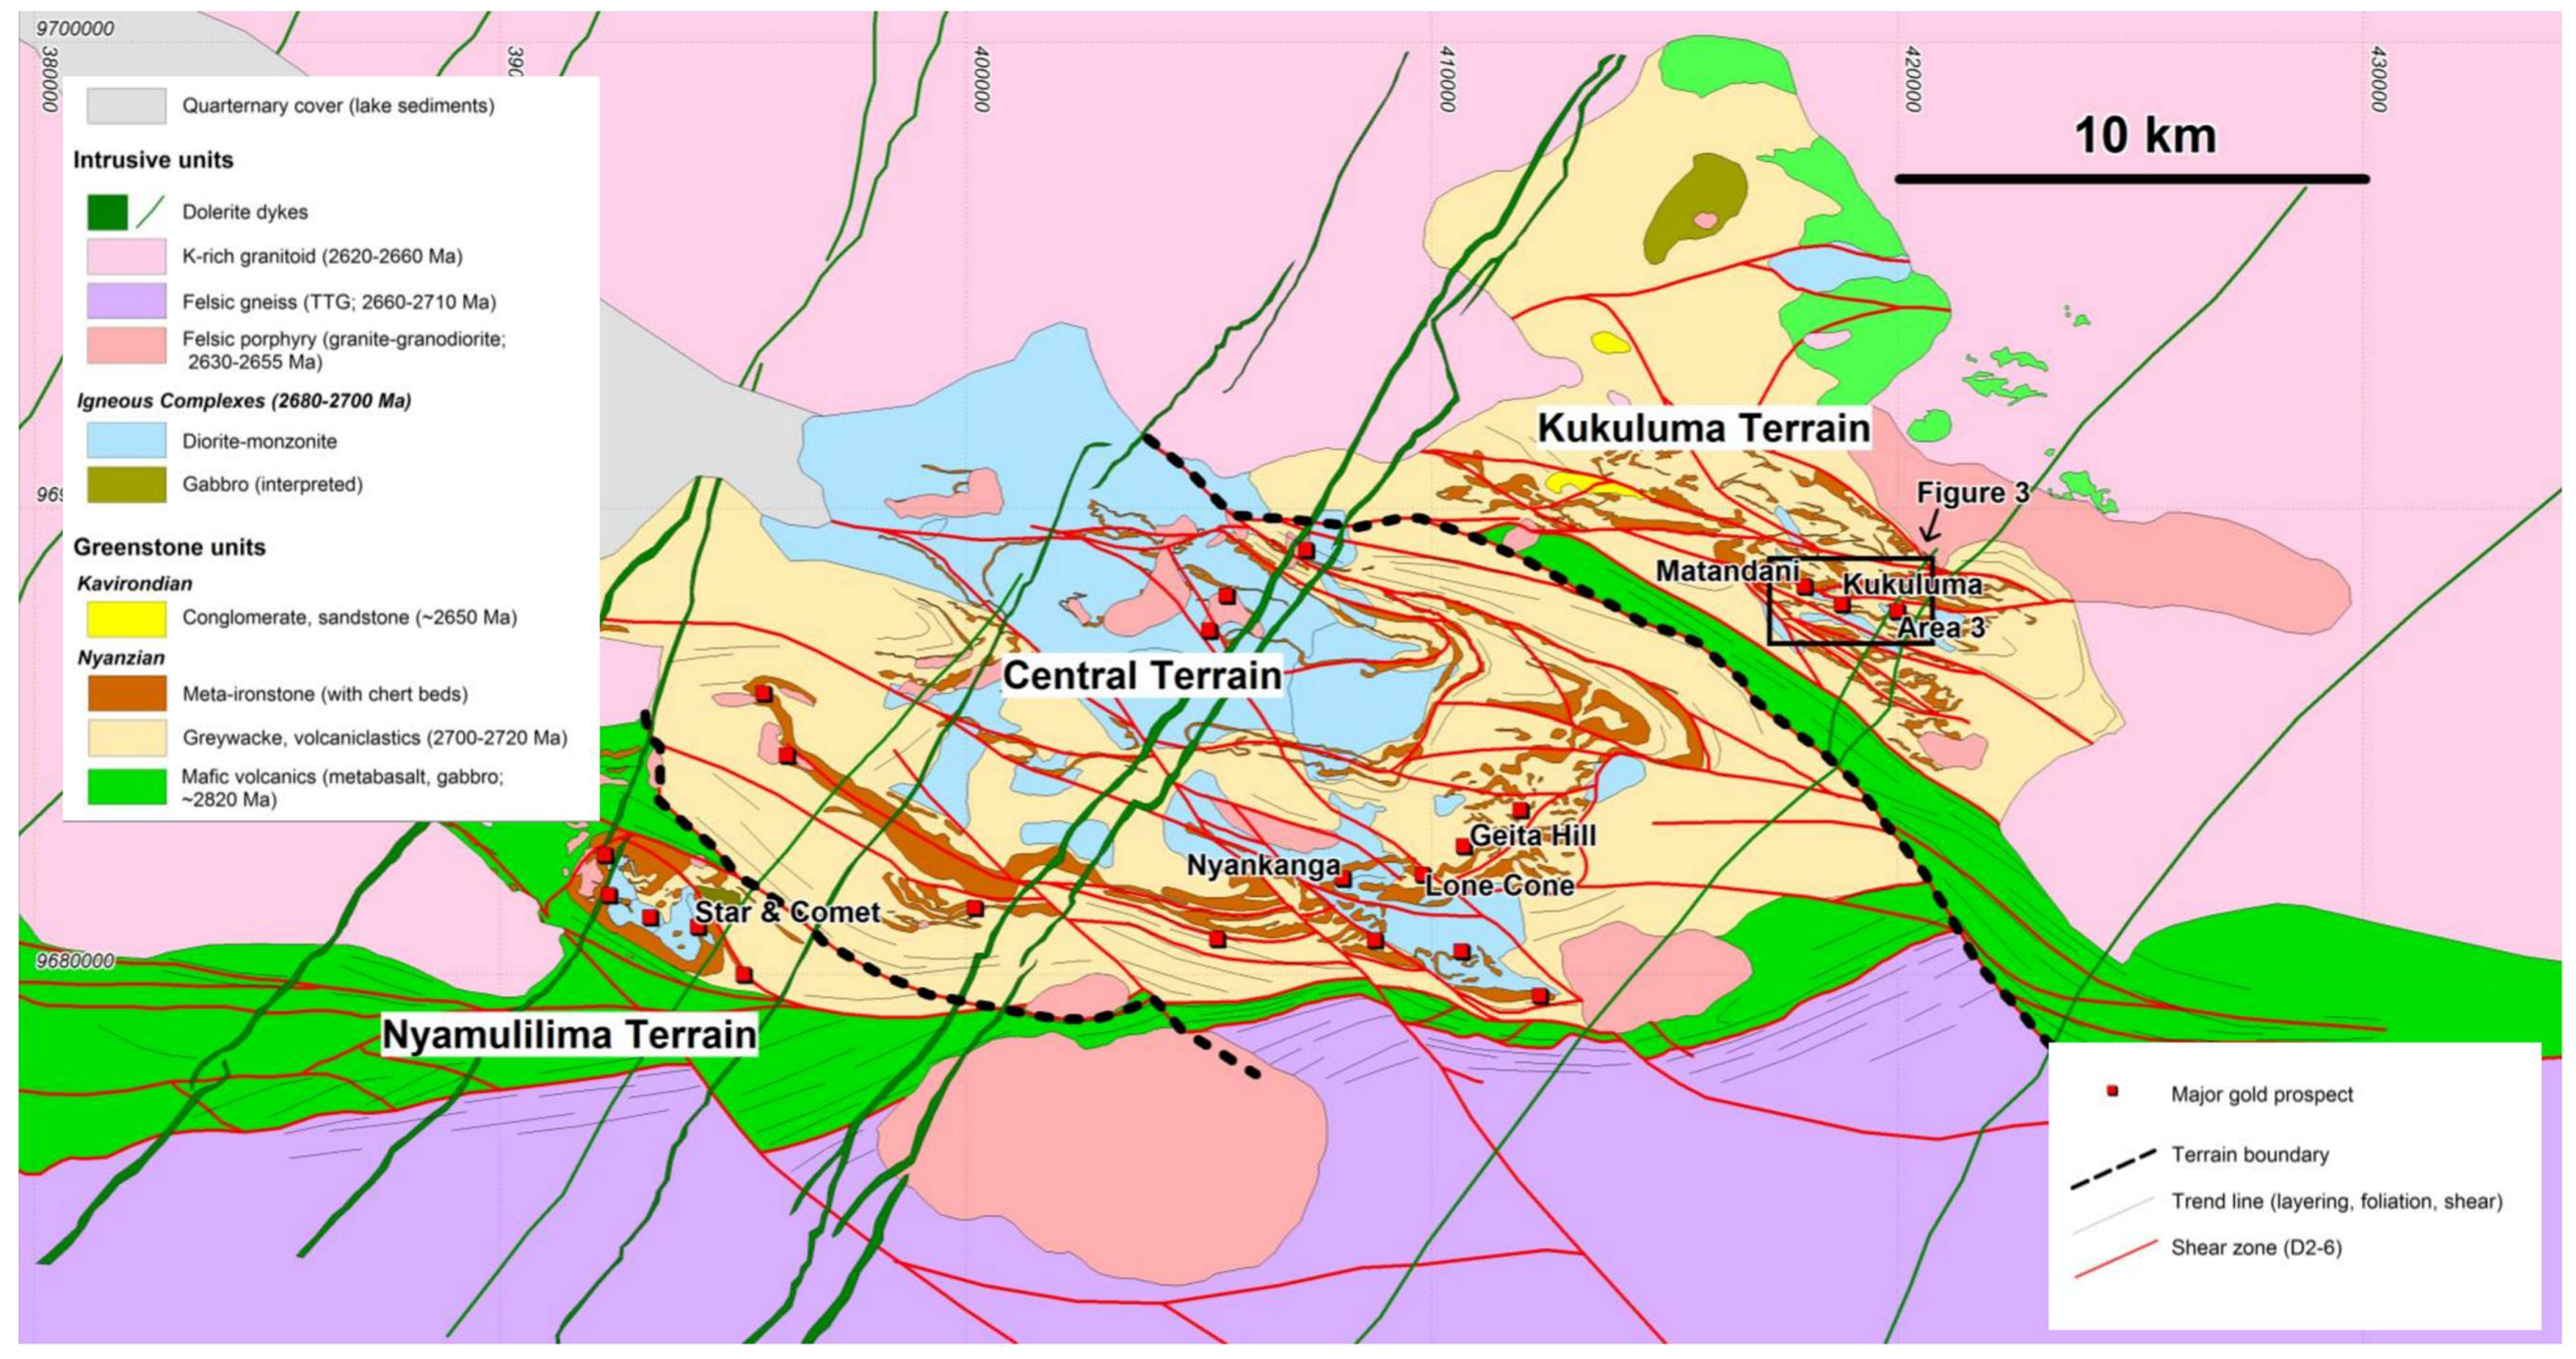
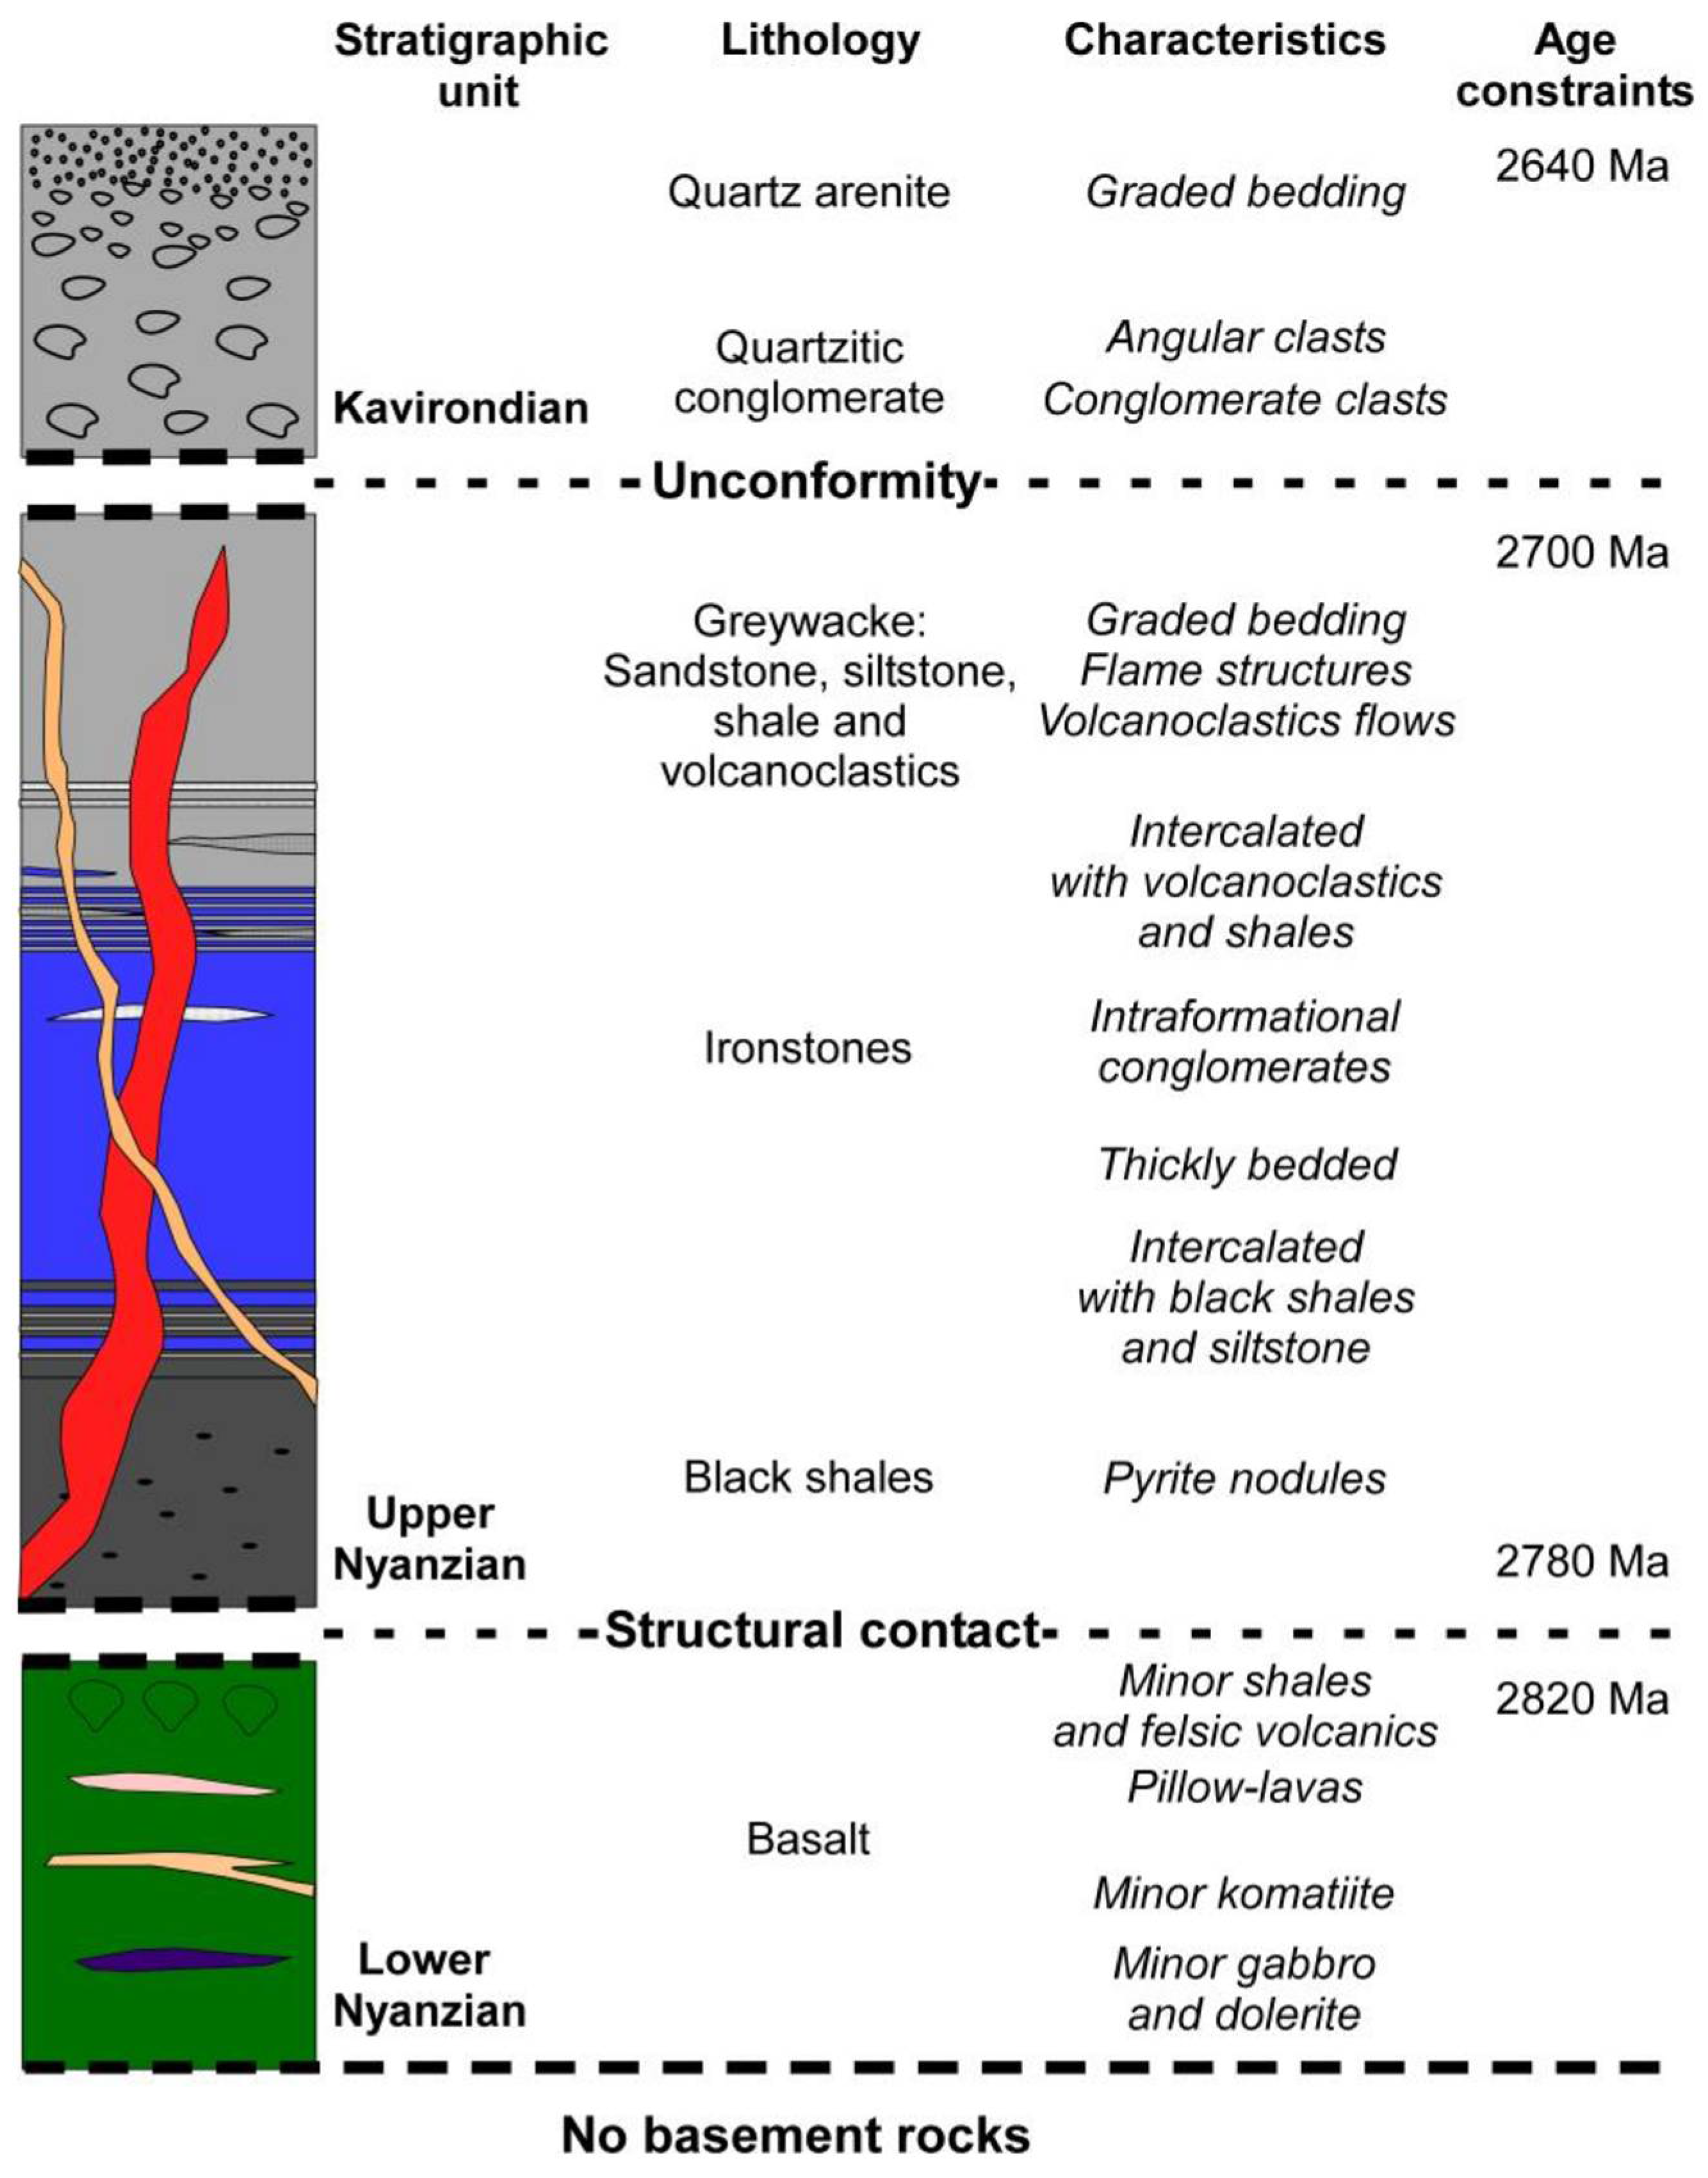
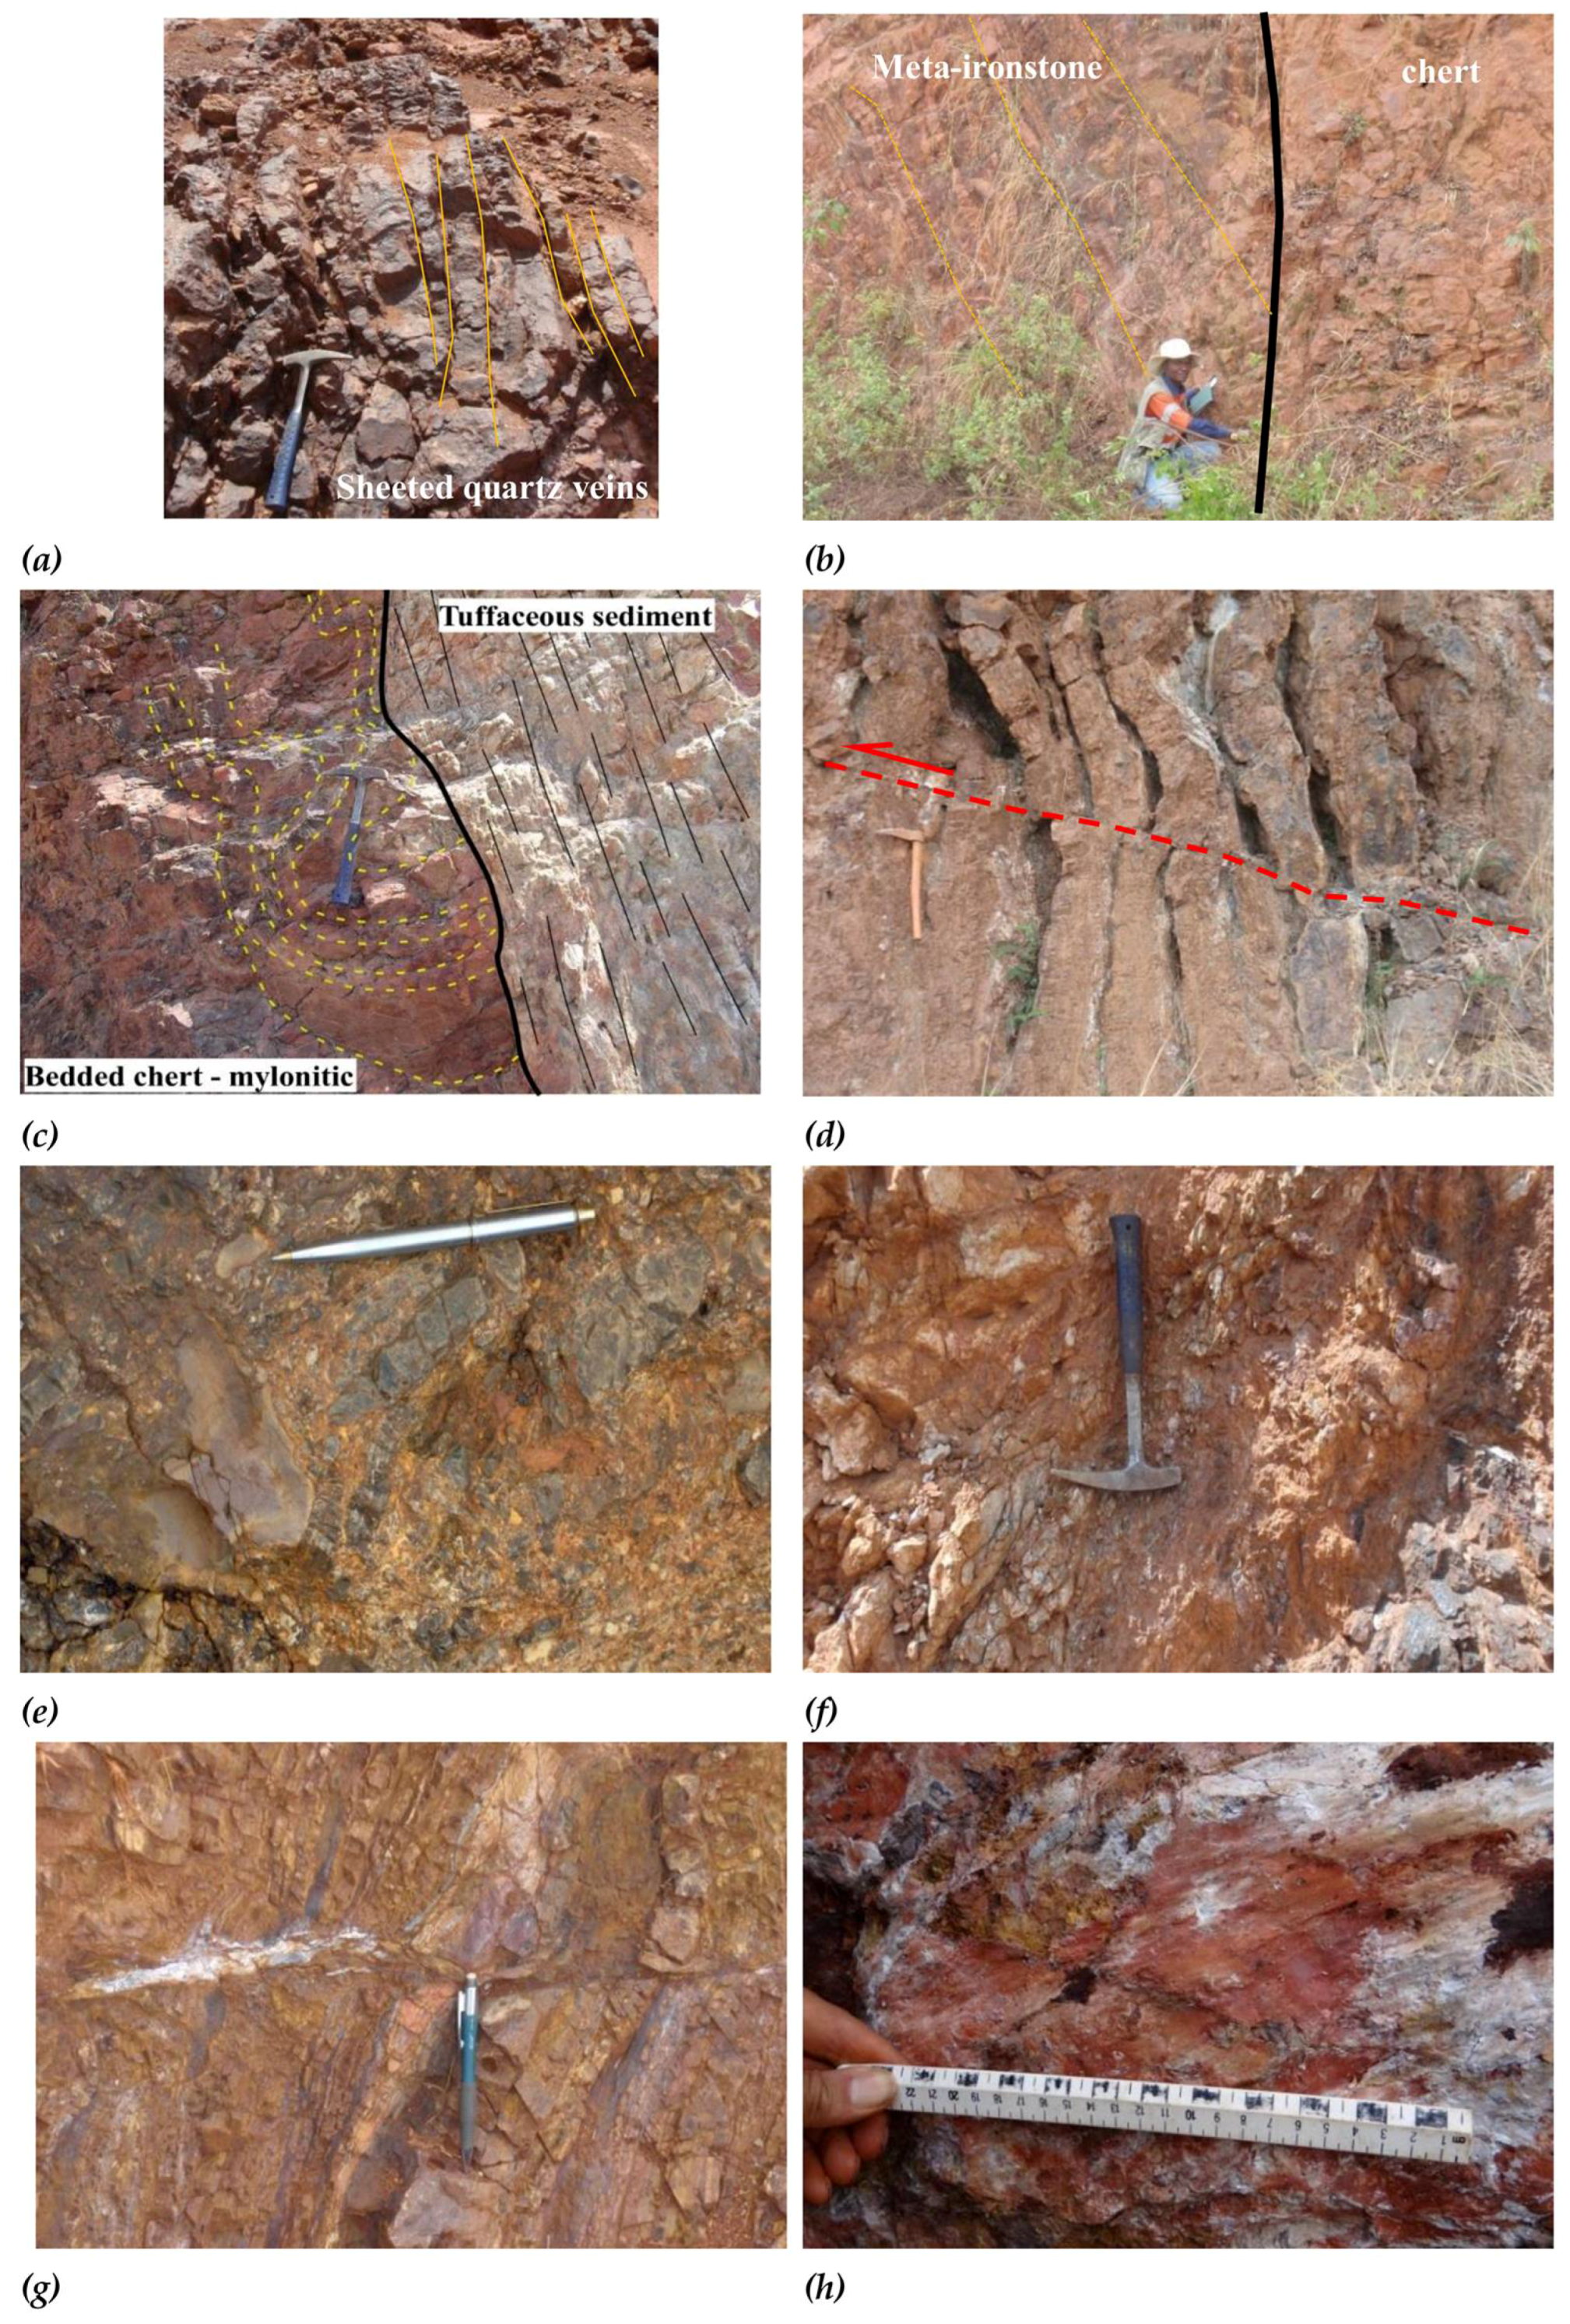
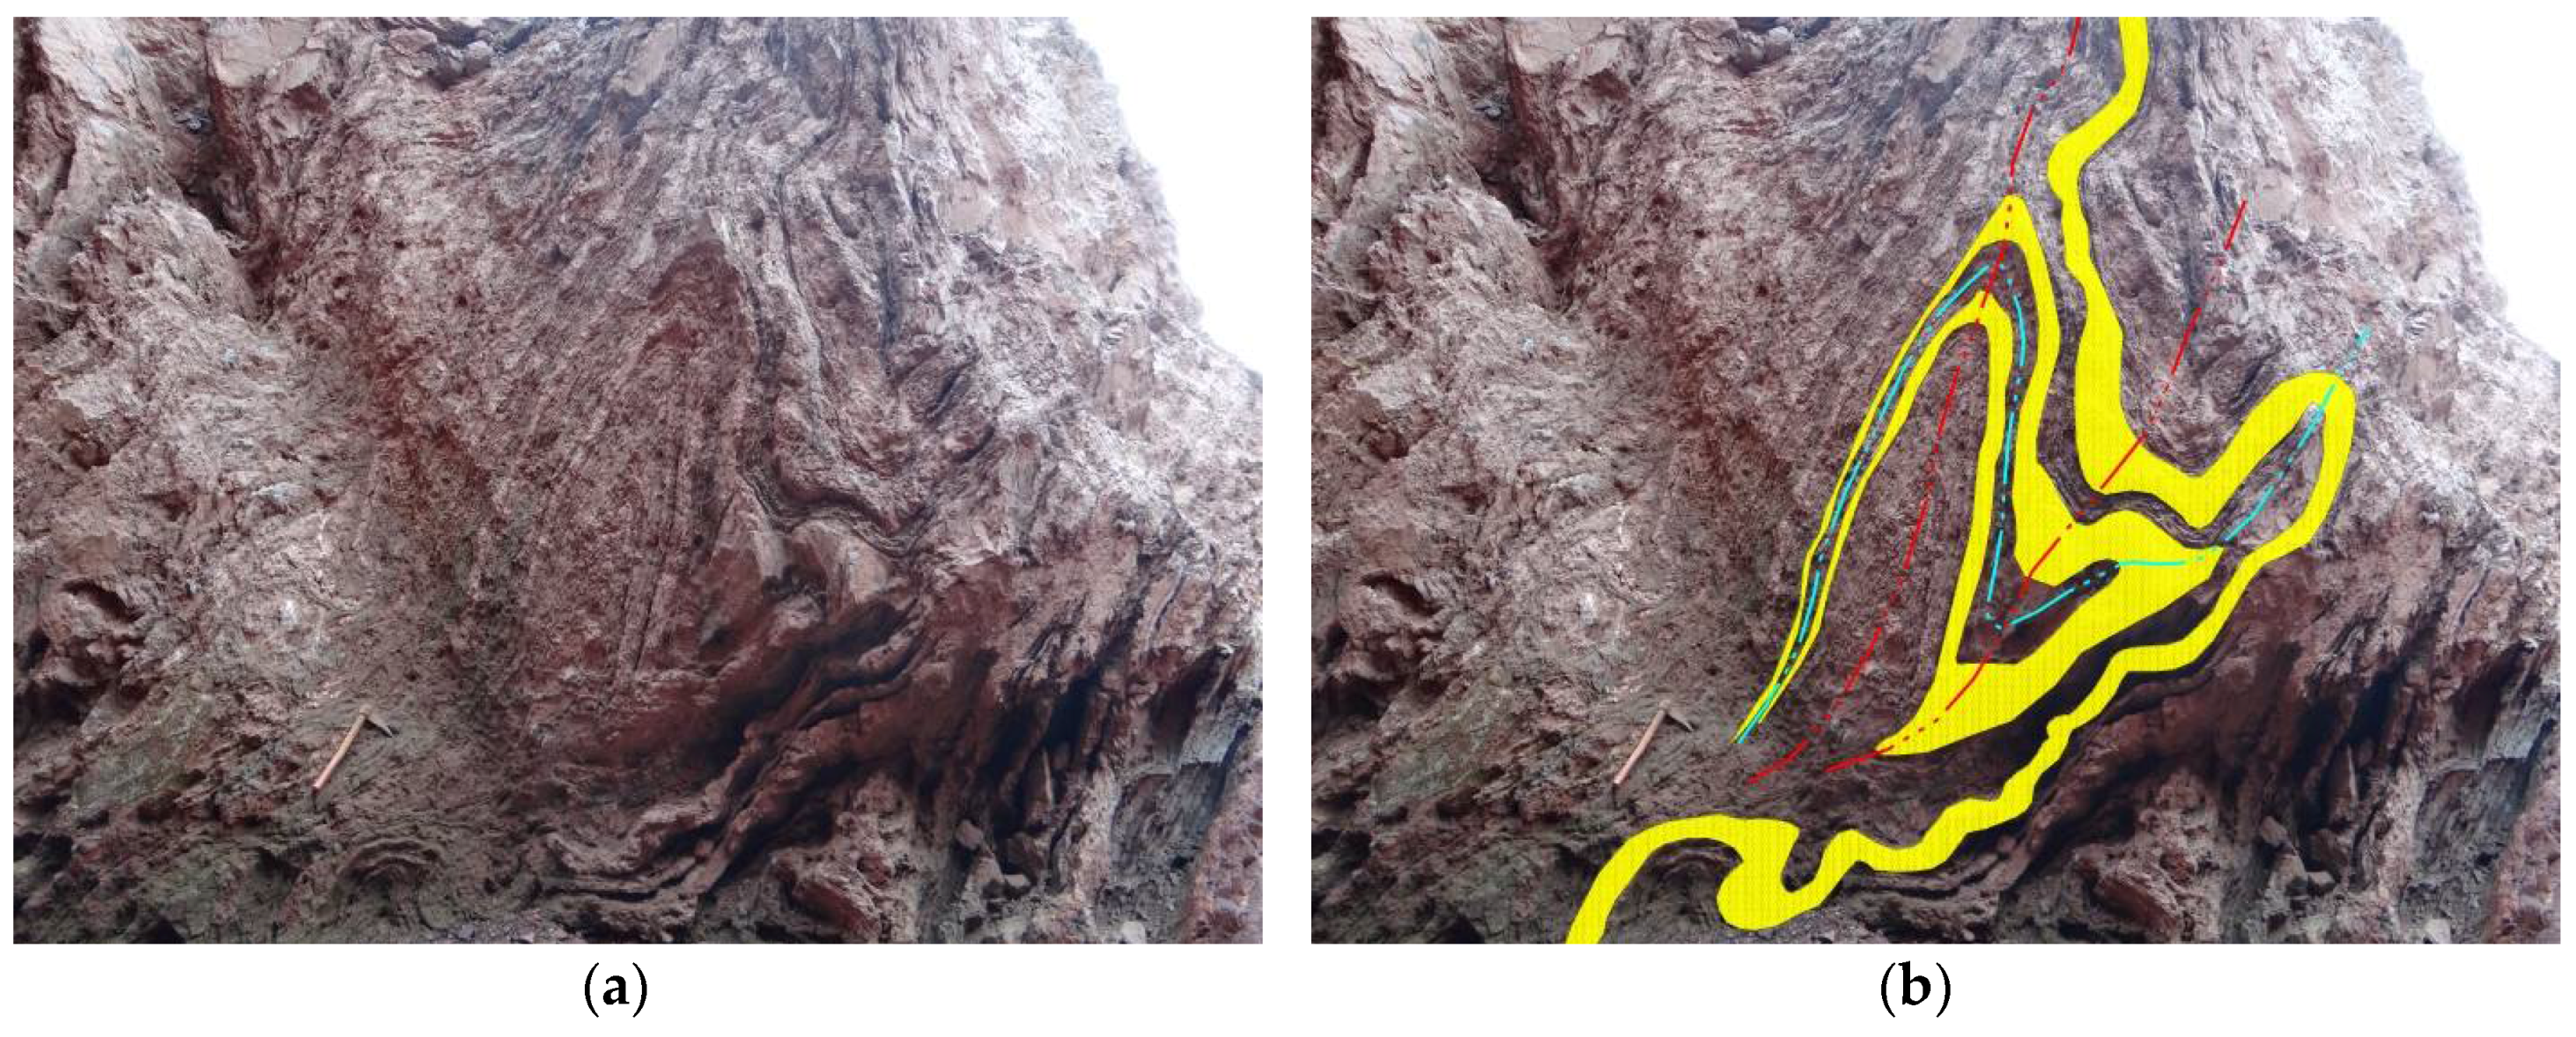
2.2. Stratigraphy of the Kukuluma Terrain

A generalized stratigraphic column for the Kukuluma terrain is presented in Figure 4. This column has been reconstructed from mapping and drilling around the Kukuluma and Matandani pits, as presented in this study, combined with age constraints from intercalated volcaniclastics and cross-cutting porphyry dykes [28]. The Kukuluma terrain is bounded to the west by a major northwest-trending shear zone, which juxtaposes lower greenschist facies meta-sediments of the Central terrain, and lower amphibolite facies mafic to ultramafic meta-basalts at the stratigraphic base of the Kukuluma terrain (Figure 2; [37]).
The sedimentary sequence in the central parts of the Kukuluma terrain is composed of a volcano-sedimentary pile with a black, graphitic shale unit of undefined thickness (pit outcrops indicate a minimum thickness of ~30 m) at its base. This unit is well-exposed at the bottom of the Kukuluma pit, and probably overlies metabasalt [28]. The black shale unit transitions into a well-layered meta-ironstone unit that is variable in thickness due to deformational effects (described below). The meta-ironstone unit is widely distributed (Figure 3), and consists of regularly layered packages of magnetite-rich sandstone and siltstone interlayered with shale beds and silicified, quartzite beds. The meta-ironstone unit transitions into meta-greywacke, comprised of laminated shale- to sandstone beds (Figure 4) interlayered with fine-grained meta-tuff and volcaniclastics. The greywackes have characteristics similar to deposits laid down on the proximal parts of a marine fan-delta system, with input of immature sediment [44]. Rocks of the Upper Nyanzian are intruded by diorites, monzonites, and granodiorites of the Kukuluma Intrusive Complex (Figure 4). In the northern part of the Kukuluma terrain, the meta-ironstone and meta-greywacke units are unconformably overlain by cross-bedded sandstone and clast, supported conglomerate ascribed to the Kavirondian Supergroup.

3. The History of Deformation in the Kukuluma Terrain

The deformation events in the Kukuluma-Matandani area comprise three groups of structures: (1) structures that formed during an extensional deformation episode (D1) at the time of sedimentation and early volcanism, which are best preserved in drill core; (2) penetrative structures (D2–D6) involving overprinting folding, shearing, and brecciation events, which occurred when the rocks mostly behaved in a ductile manner during the main compressional stage of deformation; and (3) localized late tectonic structures that formed during extensional deformation, when strain was partitioned into discrete normal faults and joints (D7). Deformation events were accompanied by the emplacement of syn-tectonic intrusions of the Kukuluma Intrusive Complex (KIC, [26]). A mineralized, late-tectonic felsic porphyry dyke cross-cuts all units, and provides an upper age constraint for gold mineralization in the area [28].
The deformation events have been summarized in Table 1 and are described in detail below. In reading the deformation history, it is important to realize that the D1–D6 deformation geometries, in combination with intrusive boundaries, provide the deformational architecture that trap the auriferous fluids, which percolated late in the deformation history of the area [9].

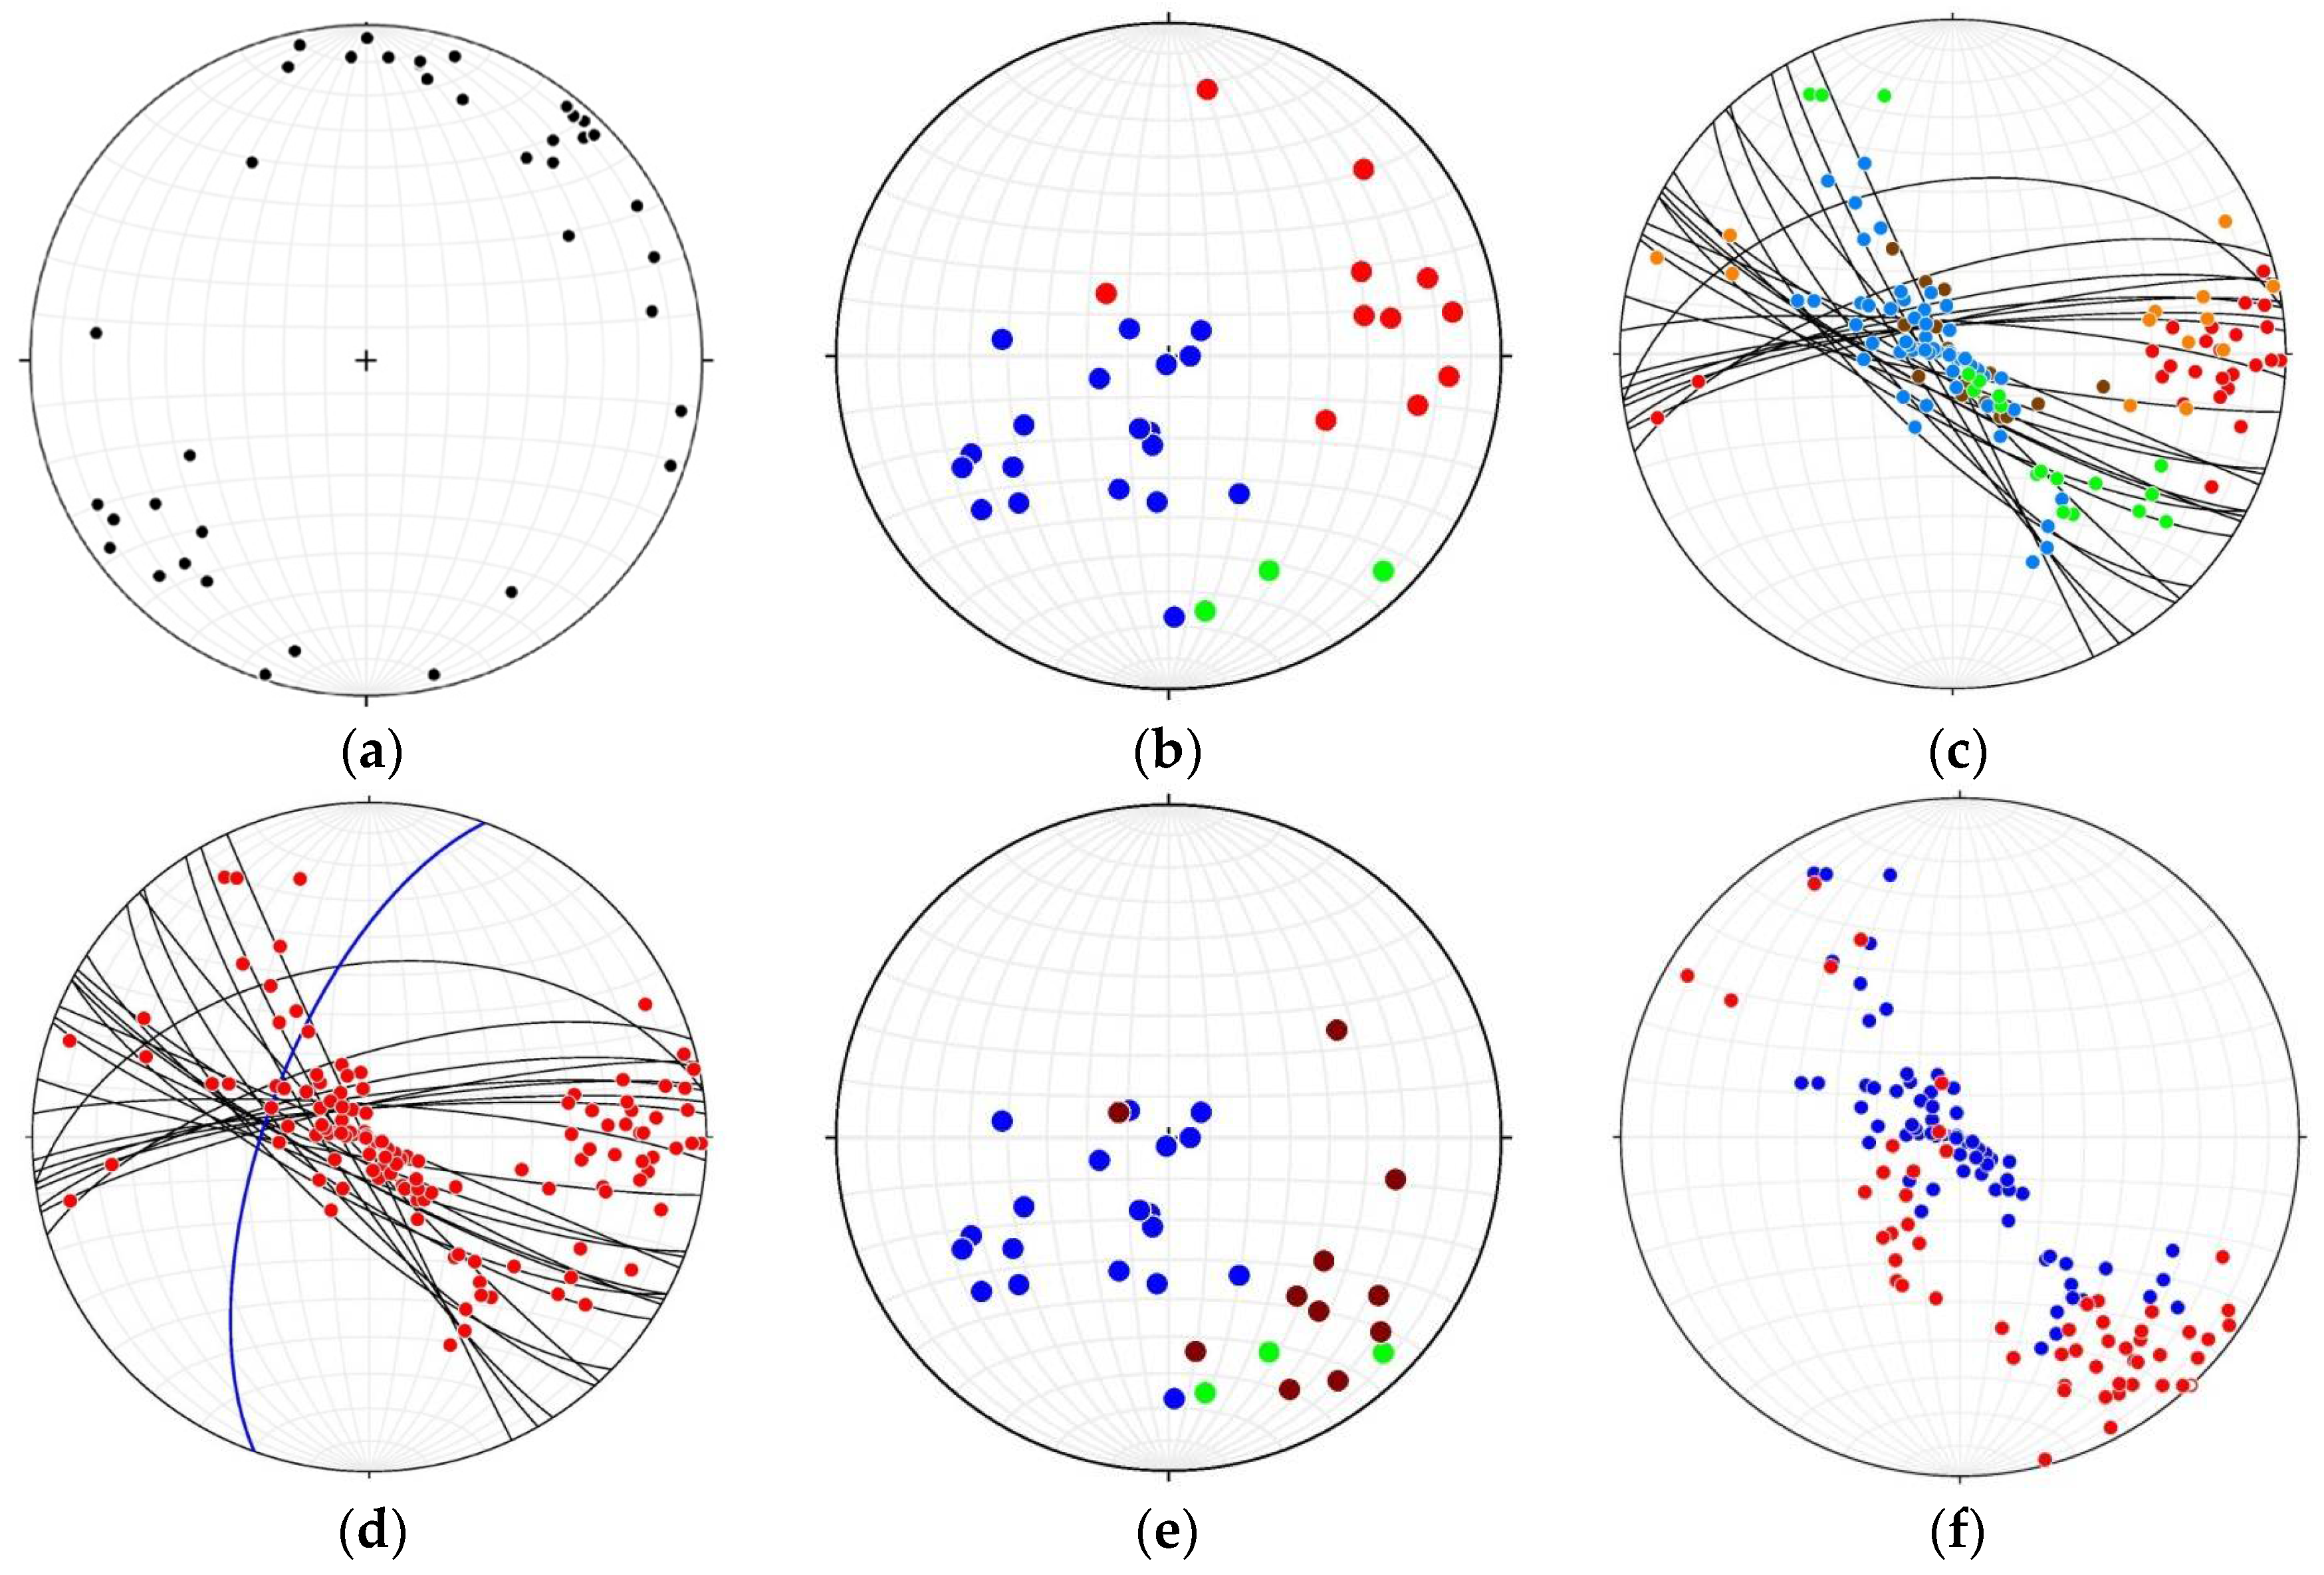
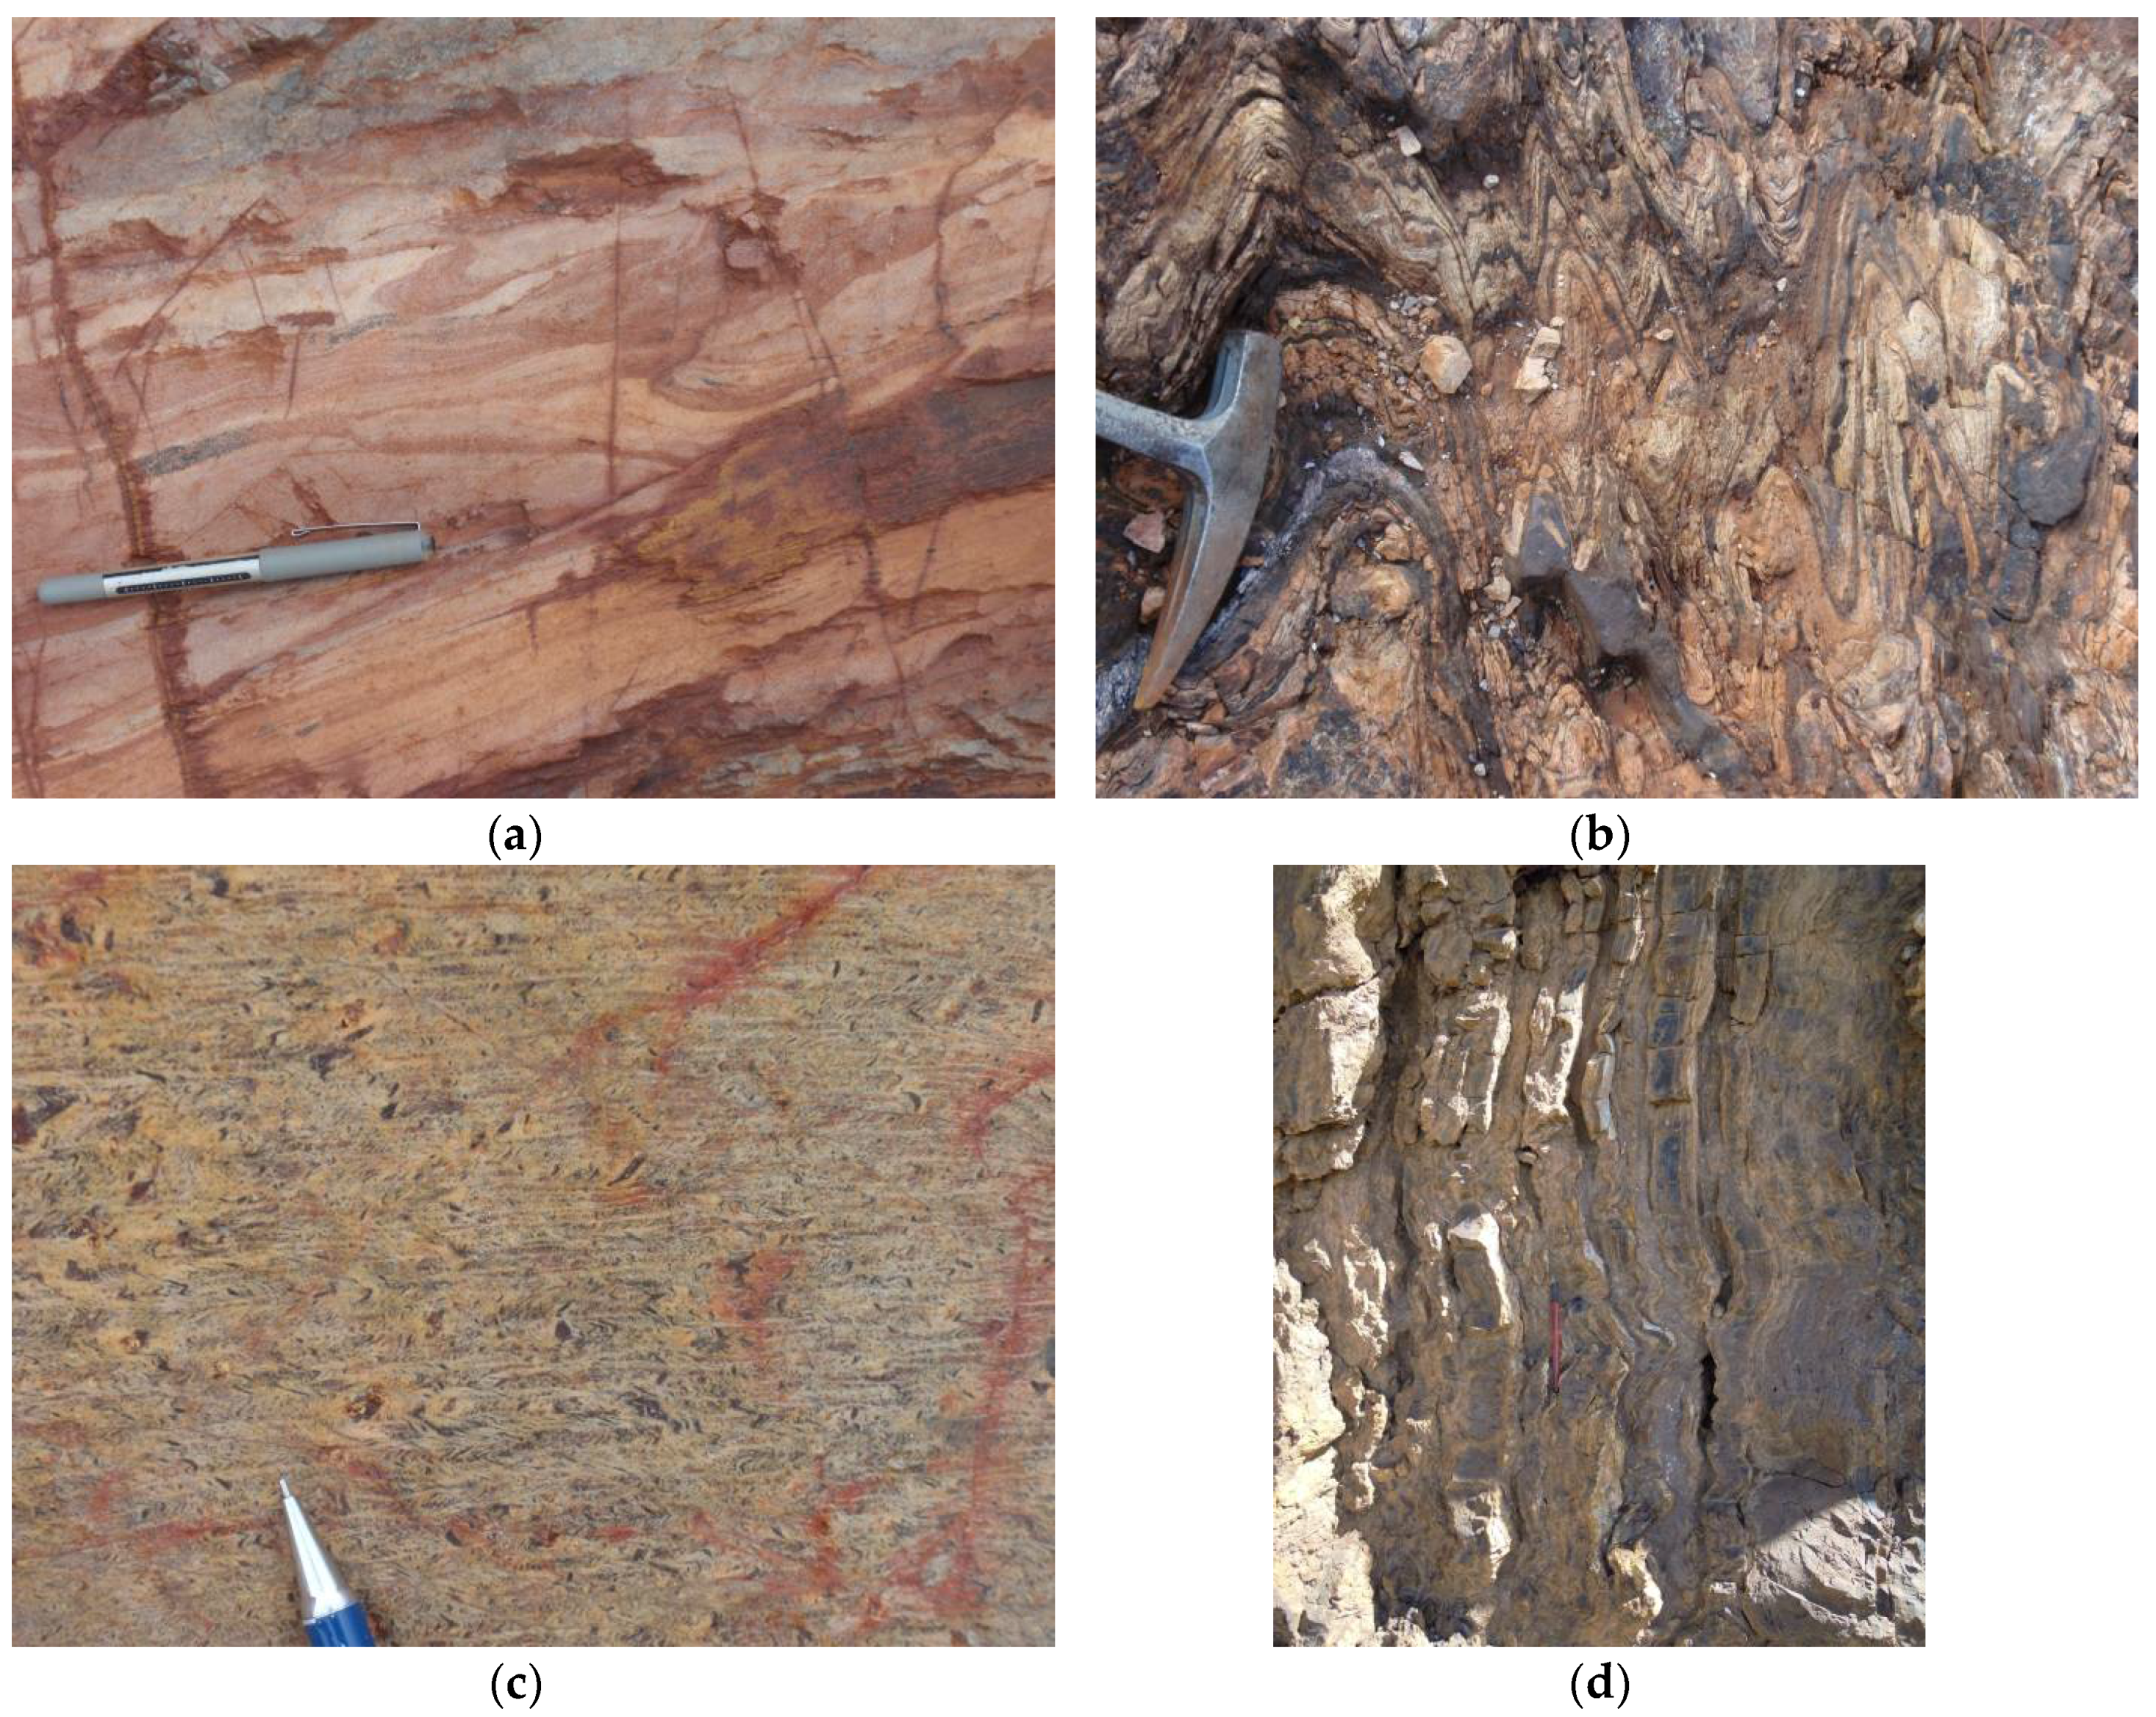
3.1. D1 Normal Faulting and Bedding Parallel Shearing Events

D1 comprises a complex family of structures that formed prior to the development of D2 folds. These structures formed in part during sedimentation of the meta-ironstone and meta-greywacke sequences, and partly after these units were buried (presumably as extension-sedimentation continued higher up in the stratigraphy). Centimeter-scale growth faulting visible in the drill core in meta-sediment indicates active extension during sedimentation. In places, the growth faults are listric, and associated with layer-parallel zones of brecciation and folding characterized by cm- to dm-scale disharmonic folding, interpreted as layer-parallel deformation zones similar to low-angle detachments.
Meta-ironstone units preserve an early-layer-parallel foliation (S1) that locally intensifies. A good example of this occurs along the access ramp into Kukuluma pit between GR (grid reference) 418900-9688150 and 418950-9688180 (all grid references are in WGS84, zone 36S), where a well-layered greywacke unit is intruded by dark grey, planar quartz veins with a chert-like appearance (Figure 5a). Over a horizontal distance of about 15 m, the density of these intrusive veins increases as the rock changes from bedded meta-greywacke into a massive glassy chert, and coarser grained sandstone beds are boudinaged. S1 is well-developed in this zone, together with rare intrafolial folds, dextral shear bands, and an L1 mineral lineation, and the zone is interpreted as a D1 shear zone. Although the shear sense across this zone is unclear, it cuts out part of the stratigraphy, which together with the associated boudinaging and extension of the host rock layering suggests an extensional origin. It may link to basin opening, and is interpreted to represent a deeper level manifestation of the syn-sedimentary growth faults seen in drill core.
Similar discordant chert horizons displaying complex internal folding and fine-grained fabrics with mylonitic affinities are common throughout the central Kukuluma terrain. In many places (e.g., Figure 5b) the chert layers transect bedding in the surrounding meta-ironstone or meta-greywacke units at a low angle. In other places, the orientation of chert beds is parallel to layering within the wall rock (Figure 5c). On a regional scale, the chert bands form low ridge lines that can be traced for several kilometers (Figure 3). The chert horizons display sudden thickness variations along the strike, and in places bifurcate or merge to form anastomosing patterns. The chert bands are affected by all later folding events described below, and formed early in the tectonic history of the Kukuluma terrain.

3.2. D2–D3 Folding and Shearing

The composite S1/S0 fabric in the central Kukuluma terrain was folded and sheared during D2 and D3 events (Figure 6, Figure 7 and Figure 8). This has resulted in locally complex, D2–D3 interference folding of the volcano-sedimentary stratigraphy, including those units that preferentially host gold mineralization.
F2 folds occur on outcrop scale as tight to isoclinal folds that develop a penetrative axial planar cleavage in fine-grained shale. F2 fold axes are highly variable in orientation (Figure 6), in part due to the non-cylindrical nature of D2 folds [24], and in part due to later folding overprints causing regional (domainal) variability in the D2 fold axes. In single outcrops, where F2–F3 interference folding is well-developed (e.g., Figure 8), the orientation of F2 fold axes varies from near-parallelism with F3 fold axes, to high angles, to F3 fold axes—a trend reflected in stereoplots of F2 (Figure 6). The existence of large-scale (>100 m) D2 folds is evident from the regional distribution patterns of chert ridges (Figure 3), and can also be inferred from the domainal distribution of D3 fold axes orientations (Figure 6), as explained below.
D3 folds are common, and comprise upright to vertical folds that vary from open to near-isoclinal, with tightening of the folds occurring near planar high strain zones. The S3 axial planar surface is generally near vertical, and varies in trend from west to northwest, with orientations in the pits showing two clear maxima around 210/80 and 350/75 (Figure 6c) as a result of D4 folding (discussed below). S3 fabrics vary in character, from well-developed, closely spaced (<1 mm), planar crenulation cleavages in shale (Figure 7c), to more widely spaced fracture cleavages in more competent silicified meta-ironstone beds.
The orientation of F3 fold axes varies in a systematic manner across the pits, as a result of D2–D3 fold interference (Figure 6). Along the southern wall and western ramp of Kukuluma pit, F3 fold axes generally plunge shallowly eastward (ave. F3 = 091/17; Figure 6c). Towards the north wall of the Kukuluma pit, F3 fold axes rotate to near-vertical (ave. F3 = 287/83; Figure 6c). The same near-vertical D3 fold orientation also dominates outcrops in the area between the Kukuluma and Matandani pits, and in the southwestern wall of the Matandani pit. Towards the northeastern wall of the Matandani pit, F3 fold axes vary between a near vertical plunge and a gentle northwest-southeast plunge (Figure 6c). The bimodal distribution of the F3 fold axes indicates that large-scale D2 folds are present, with the hinge zone of one such fold trending in a general northeastern direction along the northwest margin of Kukuluma pit, and a possible second F2 hinge zone passing through Matandani pit. Before upright D3 folding, the orientation of the composite S0/S1 layering would have varied from steeply north to northwest, dipping into the southern part of the Matandani pit and the area between Matandani and Kukuluma pits, to generally shallow dipping layering in most of the Kukuluma pit and in the northern part of the Matandani pit. This pattern suggests the presence of a 500 m scale, possibly southeast verging, asymmetric, antiformal D2 fold, with a northwest-dipping axial planar surface.
Outcrop scale vergence of D3 folds varies across the pits, reflecting large-scale D3 folding. Along the southern and western walls of the Kukuluma pit, D3 folds generally verge northward, whereas the D3 folds along the northern wall of the pit verge southward. This suggests that the Kukuluma pit is positioned in the centre of a 500 m scale, east to southeast trending, upright D3 fold, and occurs together with the Matandani pit along the hinge zone of a large-scale D3 anticlinorium.
D2–D3 fold interference patterns are common on an outcrop-scale (e.g., 0418140-9688080; Figure 8), and are generally of Type 2 [45,46]. Interference patterns are characterized by crescent and hook shapes (Figure 8), and locally converge to Type 3 fold patterns, where F2 and F3 fold hinges reach near-parallelism [45]. Around Area 3, chert ridges define 500–800 m scale Type 2 fold interference patterns (Figure 3).
Locally, D2–D3 fold domains are truncated by planar foliation domains that are unaffected by D2–D3 folding, except for the presence of isoclinal intrafolial folds within the foliation. Good examples can be seen along the southeast wall of the Matandani pit (e.g., 418180-9688300). These foliation domains trend northwest across the central Kukuluma terrain, and are generally near-vertical. The domains contain a moderate to steep west to northwest plunging mineral lineation, L3, which parallels the axes of intrafolial folds within the high strain domains. The layering in these foliation domains is composite in nature with S0/S1/S2/S3, all transposed and parallel to each other, and they developed at the same time as the D3 folding. The regional distribution of these D3, high-strain zones cannot be assessed, due to poor outcrop exposure.

3.3. D4 Gentle Upright Folding

D4 folds are gentle, cylindrical, upright folds, with steep axial planes that warp S3 (and earlier foliations) on a 0.5–1 km scale. D4 folds are not clearly visible in the outcrop, but can be seen when tracing D1 chert horizons or S3 along strike; e.g., across Kulkuluma pit S3 orientations changing from steeply southwest-dipping (ave. 210/80) in the northwest corner of the pit to steeply north-dipping (ave. 350/75) across the rest of the pit, as a result of large-scale, D4 folding, with steeply western-plunging fold axes and a northwest-dipping fold axial plane (Figure 6d). Similar open folding of D3 structures is apparent across the area (Figure 3), with the fold axial trace of D4 folds trending roughly north-northeast–south-southwest. No penetrative S4 fabric has developed, but where D4 folds affect thick chert layers, e.g., around Area 3, a spaced north-northeast-trending fracturing can be observed in D4 hinge zones.

3.4. D5 Recumbent Folding and Low-Angle Reverse Faulting

D5-involved, localized, low-angle reverse faulting and associated recumbent folding is poorly visible in areas without good vertical exposure. Low-angle reverse fault planes are best developed within the well-bedded ironstone units in the west side of the Kukuluma pit (Figure 5d). Fault zones vary in thickness from several mm to ~20 cm, but are generally thin and discrete, and visible as thin grey clay zones that ramp up through the ironstone units. The larger (i.e., wider) fault zones generally dip gently north (around 000/20), but they vary locally in orientation, with secondary fractures moving into parallelism with bedding planes. The faults accommodated reverse movements of up to ~10 m, with most faults accommodating significantly less.
Folding is common in spatial association with the fault planes. D5 folds vary in scale from 0.1–5 m, and are generally open recumbent folds with near-horizontal to shallowly dipping axial planar surfaces (Figure 5d and Figure 7d), and shallowly east- or west-plunging fold axes. In some places, D5 folds are asymmetric, and appear as drag folds associated with the thrusts (Figure 5d). Elsewhere, D5 folds form open corrugations in well-bedded meta-ironstone, with widely spaced fracture cleavages.

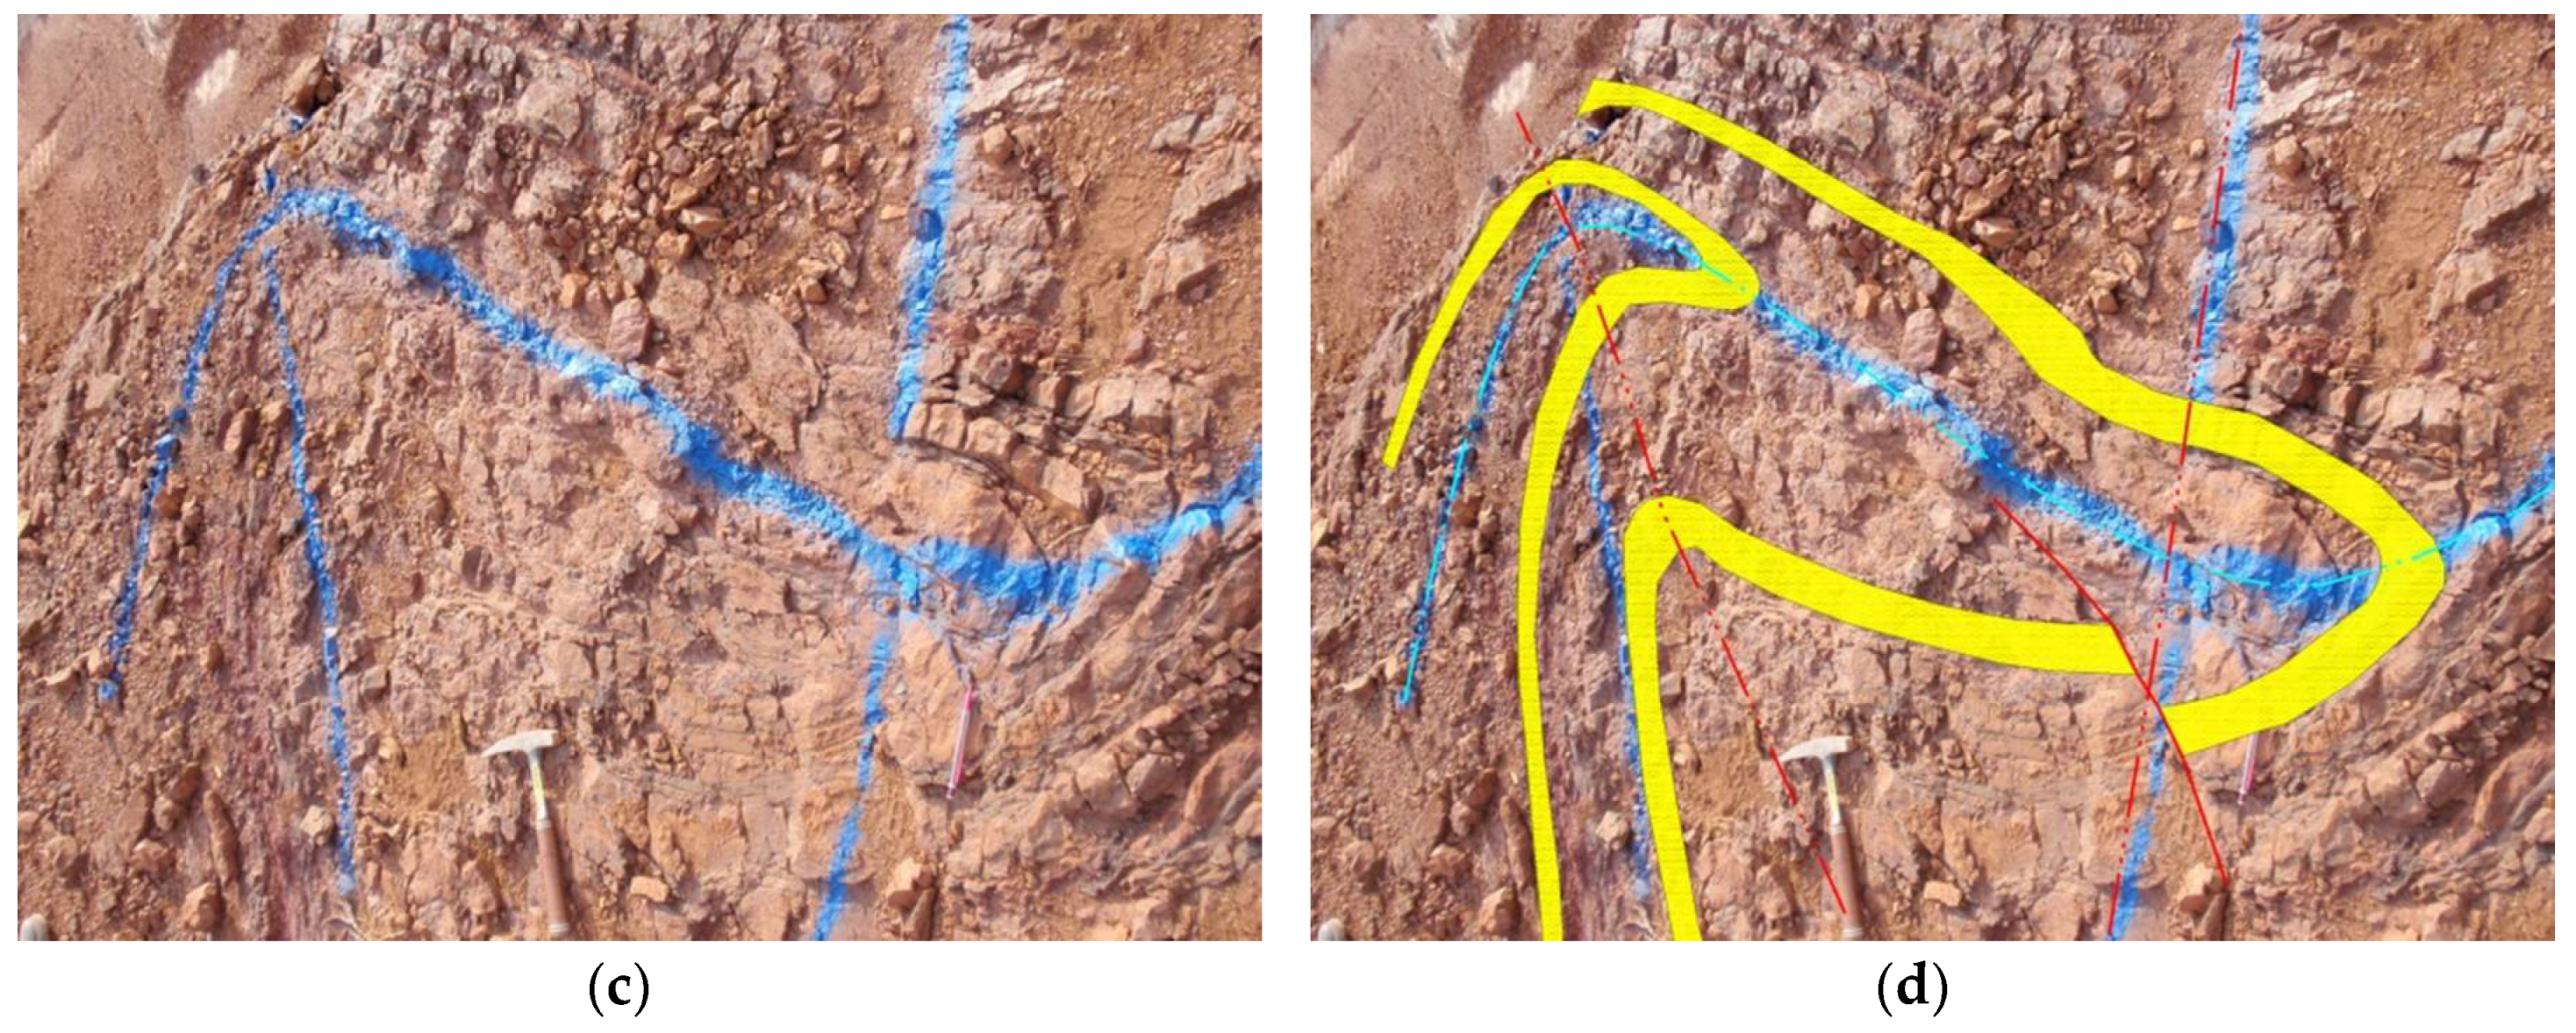
3.5. D6 Brittle-Ductile Shear Zones

A network of generally steeply dipping, northwest- to west-northwest-trending shear zones can be traced across the central Kukuluma terrain (Figure 3). These D6 shears crosscut the folded sequence, and have been linked to mineralization [47,48]. In the Kukuluma and Matandani pits the system of D6 shear zones is referred to as the Juma and Kasata shear zones (Figure 3b; [47]. In Area 3, similar west- to northwest-trending shear zones can be seen in the drill core, but poor outcrop prevents these shears from being mapped.
The Juma shear zone can be traced along the entire length of the Kukuluma and Matandani pits, and occurs within the small open pit between Kukuluma and Matandani (Figure 3b). The shear zone is positioned along the west-northwest- to northwest-trending northern contact of a major intrusive diorite sill belonging to the KIC (Figure 3b; [28]). Towards the eastern end of the Kukuluma pit, the Juma shear terminates into a network of smaller, moderately- to steeply-dipping fracture zones with variable trends (Figure 3b).
The Kasata shear zone can be traced through the centre of the Kukuluma pit as a composite, steeply-dipping, and generally west- to west-northwest-trending fracture zone. In Matandani pit, the shear zone re-appears in the south corner of the pit as several west-northwest-trending, semi-parallel fracture zones that merge towards the northwestern part of the pit, into a single northwest-trending brittle-ductile shear zone, which follows the contact of the same intrusive diorite bordering the Juma shear (Figure 3b). In the eastern part of Kukuluma pit, the Juma and Kasata shears merge across a complex network of mostly east-west trending fractures.
Individual D6 shear planes are accompanied by damage zones up to several meters in width, which are associated with secondary jointing, brecciation, veining, and silicic alteration. Mineralization occurs mainly as disseminated sulphide impregnations along microfractures in the damage zones. Where several shear planes are in close proximity to one another (e.g., in the south corner of the Matandani pit, or where the Kasata and Juma shears merge in the eastern part of the Kukuluma pit), extensively fractured and altered (strongly silicificied) domains occur, up to 15 m wide. Where the shears transect micaceous schist, chlorite-muscovite shear bands have developed into S-C-like fabrics (e.g., Figure 5f). Brittle deformation structures (veins, breccia, and cataclasite zones) are more common in portions where the shear zone cuts across massive, chert-rich meta-ironstone units (Figure 9). L6 lineations are visible as mineral alignments, striations, and quartz rods. In places, mineralization appears to be concentrated along D6 shear zones, but elsewhere (e.g., the northwest and south walls of the Matandani pit and the northeast corner of Kukuluma pit), well-exposed portions of the D6 shears are not mineralized.
The orientations of the D6 fracture zones associated with the Juma and Kasata shears, as measured in the Kukuluma pit, are shown in Figure 9a. The main strands of the Juma and Kasata shears trend west-northwest (020/80), with a gently northwestern- or southeastern-plunging lineation recording a dextral sense of movement with a reverse component. A prominent set of second-order shears trends more northwest, with a steep southwest dip (average 235/75) and a moderately south-plunging lineation recording reverse dextral movements. A third set of steeply north-northwest- to northwest-dipping shear zones (average 324/72), with moderately to steeply north-plunging lineations record sinistral-reverse movements; in addition, a fourth set of steeply south-dipping, east–west trending faults (average 175/76) host down dip lineations and a pure reverse (south over north) sense of movement (Figure 9a). This network of shears is generally non-mineralized, and is consistent with Y-shears (the Juma shear), Riedel shears (northwest-trending set) and anti-Riedel shears (southwest-trending set) within a wider dextral transpressional shear system [46], which combines with high-angle reverse faults (the east-trending set). On a larger scale, the distribution of the main D6 shear zones is reminiscent of a right-stepping en-echelon array of west-northwest- to northwest-trending shears within a more east-west trending shear envelope, accommodating reverse dextral movement (Figure 3).
A paleo-stress analysis for the D6 faults in Kululuma and Matandani pits using Faultkin [18,49,50] was performed on 27 shear planes, for which kinematic data was obtained. These shear zones are part of the interconnected network of fractures that form the Juma and Kasata shear network (Figure 3), and hence it is assumed that they formed simultaneously in response to the same far field stress [18]. In doing the analysis, all shear planes were given the same weight; the methodology to conduct paleo-stress analysis has been explained in Appendix A. Results are shown in Figure 9b, and indicate that the D6 shear zones in the central Kukuluma terrain formed in response to horizontal, near north-south shortening, in a plane-strain to flattening-strain environment (Rev = 0.35).

3.6. D7 Faulting

Where D6 shear zones are outcropping, they commonly show evidence of reactivation along discrete, mm-wide, D7 fracture surfaces that are slickensided, with slickenfibres defined by sericite or quartz (Figure 5g,h). Reactivation of D6 shear zones during D7 is most clearly demonstrated in Matandani pit, where a north-trending porphyry dyke dated at 2651 ± 14 Ma [28] transects the D6 shear fabric, but is fractured and displaced by several centimeters, as a result of brittle reactivation along D7 fractures that formed as discrete planes in the center of the D6 shear zone. Where the D7 fractures cut the dyke, an alteration halo of quartz-sericite-sulphide has developed, and the dyke is mineralized. The D7 fracture planes contained as reactivation surfaces in D6 shear zones are generally associated with lineation directions that record a normal sense of movement. A network of well-developed D7 fracture planes can be seen in the eastern corner of the Kukuluma pit, where they occur near the termination of the Juma shear, and where they are highlighted by artisanal miners who have excavated high-grade mineralization along the fracture planes.
Away from D6 shear zones, narrow fracture zones attributed to D7 occur in parts of the pits and in Area 3 (Figure 5g,h). Such fractures are mineralized with disseminated sulphide (mainly pyrite) alteration of the wall rocks, and they have the appearance of (shear) joints. The fractures are locally paralleled by thin grey quartz stringers, which return free gold in pan.
In the western wall of the Matandani pit, three 15–20 m wide, D7 fracture zones occur to the west of the Kasata shear zone, within deeply weathered, layered turbiditic meta-sediment and ironstone. Each fracture zone comprises an interconnected network of variably orientated fractures, within envelopes that trend roughly 290–110°. The three fracture zones are arranged in an en echelon array along a northwest trend. Within each fracture zone, individual fractures have maximum strike lengths of several tens of meters, but most are shorter in length. The fractures are narrow (<3 mm) and characterized by sericitic alteration (now mostly visible as white clay staining) with disseminated sulphide (cubic pyrite, now mostly oxidized).
The fault planes preserve excellent slickenlines and shear sense indicators, indicative of predominantly sinistral normal movement (Figure 5h). Displacements on the D7 fracture planes are small, i.e., in the order of centimeters. To the southeast, along the floor of the Matandani pit, where the east-southeast-trending envelope of the fracture planes transects the Kasata shear along the contact of ironstone and diorite, the main ore zone occurs that is targeted by Geita mine (Figure 3).
Paleo-stress analyses for the D7 fracture zones in Kululuma and Matandani pits using Faultkin [18,49,50]) was performed on 53 fracture planes, for which kinematic data was obtained. These fractures are all part of interconnected fracture zones targeted by artisanal workers, and are associated with the same sericite–sulphide alteration, and hence it is assumed that they formed simultaneously in response to the same far field stress. In doing the analysis, all fracture planes were given the same weight (Appendix A). Results are shown in Figure 10, and indicate that D7 shear zones in the central Kukuluma terrain formed in response to a horizontal, north-northeast extension in a plane strain environment.
Similar D7 fractures are also targeted by artisanal miners in Area 3, where many are decorated by stringers of thin (<1 cm wide) grey quartz containing visible gold. The larger scale distribution of the D7 faults, beyond the pit areas is not clear, because the structures are subtle and not exposed beyond the workings of artisanal miners.

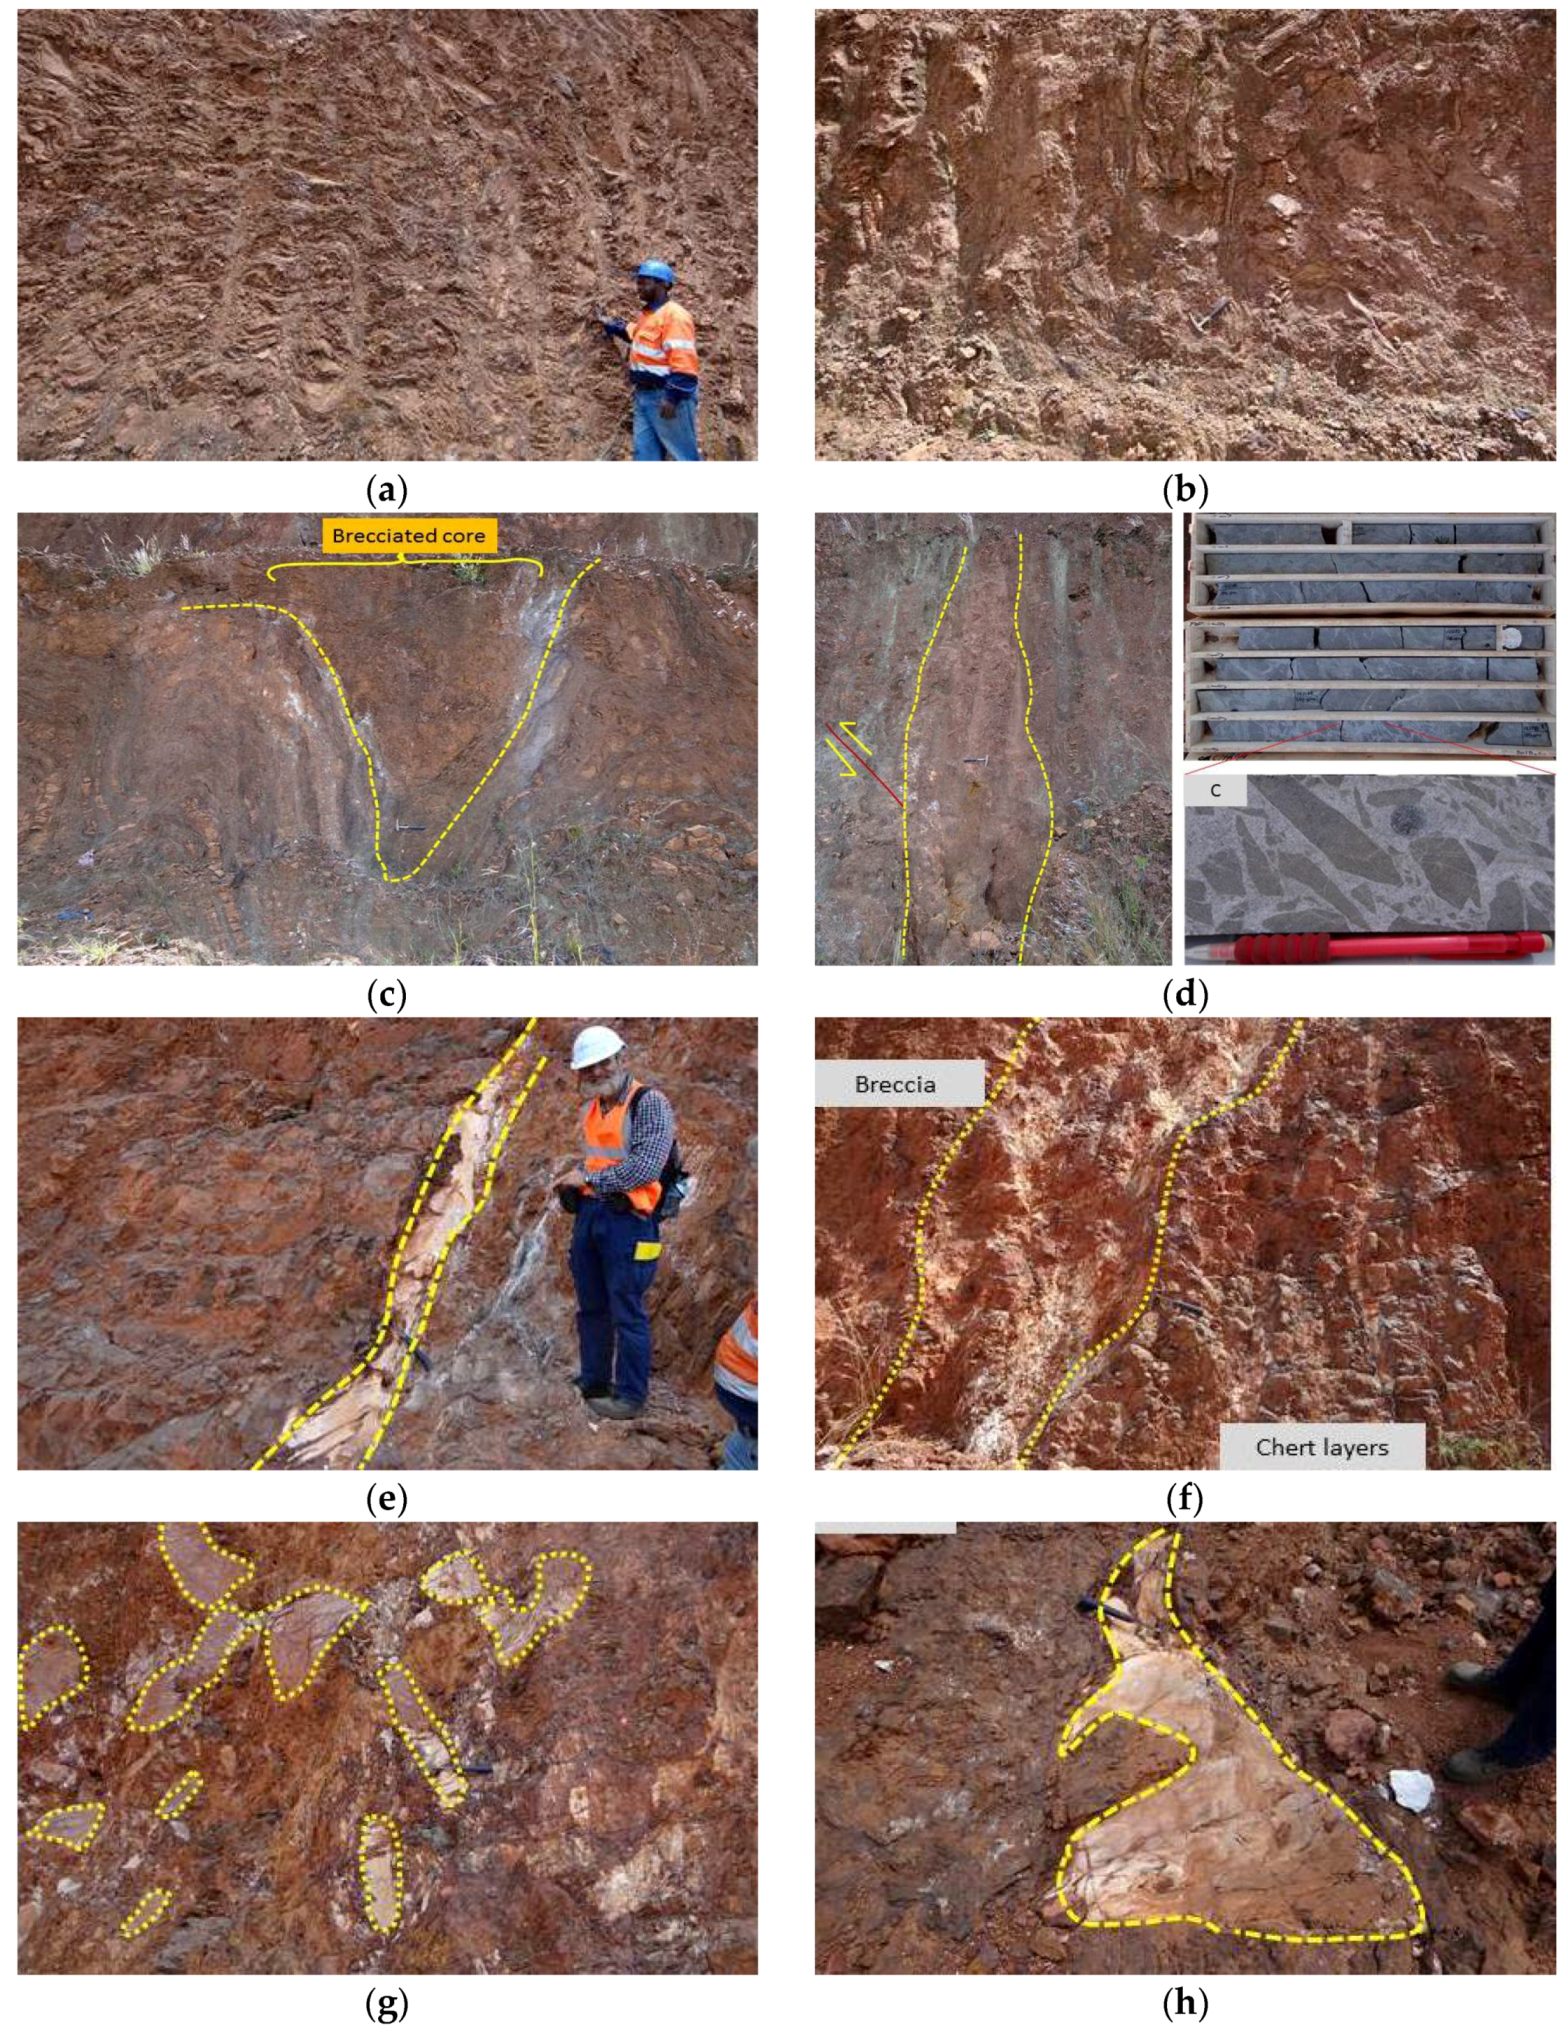
4. The Timing of Intrusions and Breccia Formation during Deformation

4.1. The Emplacement of Intrusions during Deformation

Deformation events were accompanied by the emplacement of two separate suites of syn-tectonic intrusions, one dioritic to monzonitic in composition, and a second granodioritic in composition that manifests itself as a first generation of porphyry dykes and sills. These intrusions are collectively called the Kukuluma Intrusive Complex (KIC; [26]) and they occur across the central part of the Kukuluma terrain (Figure 3), where they were emplaced between 2715–2665 Ma [28]. They have been overprinted by a second generation of granodioritic porphyry dykes, emplaced around 2650 Ma [28].
The diorite-monzonite suite of the KIC is dominated by equigranular, fine- to medium-grained, sheet-like bodies, stocks of diorite and plagioclase-rich porphyritic diorite dykes of irregular thickness (e.g., northwest corner of the Kukuluma pit), which locally form interconnected networks that both transect and parallel bedding (Figure 3). The granodiorite suite comprises thin (<2 m wide) dykes with porphyritic textures that occur in a variety of orientations (steeply dipping dykes with west, north-northwest, and north trends have been observed) [26].
The intrusive bodies belonging to the diorite-monzonite suite are weakly to moderately foliated as a result of D3 deformation. In places, intrusive margins and vein systems internal to the intrusions are folded during D3 (e.g., 0418900-9687780). More commonly, intrusions form sheet-like bodies that were emplaced along axial planar orientations of D3 folds, with intrusive contacts cutting through (D3) folded meta-sedimentary sequences, whilst foliations parallel to S3 develop within the intrusions. In the southwestern part of Matandani pit, rafts of D3 folded meta-ironstone occur within an intrusive diorite body that is foliated in an orientation parallel to S3. Nowhere did we see diorite or monzonite intrusions being folded around D2 structures, but the intrusions are affected by D4 folding. Plagioclase-rich, porphyritic diorite dykes that form part of the diorite-monzonite suite cut through more massive diorite bodies, and are foliated. Where these dykes cut through meta-sediment, and especially D3 planar high strain zones, they can be slightly folded as a result of D3.
The field relationships indicate that the diorite-monzonite suite was emplaced after D2, but immediately before and during D3. The porphyritic granodiorite dykes of the KIC are not foliated, and intrude into the diorite and monzonite bodies within the Kukuluma and Matandani pits. The exact relationship of these dykes with D5-6 shear zones is not clear, but they appear largely unaffected by these events. Two granodiorite dykes and a small granodiorite intrusion belonging to this suite of intrusion yield U-Pb zircon ages of 2667 ± 17 Ma, 2661 ± 16 Ma, and 2663 ± 11 Ma [28].
A second generation of felsic porphyry dykes of granodioritic composition, represented by a single, north-trending, 1–2 m wide, porphyritic felsic dyke transects the Matandani pit (Figure 3b). The dyke has chilled margins and no internal fabric, and cuts through D1–D6 structures. Where this dyke cuts through the Juma and Kasata shears, it can be seen to transect D6 fabrics. However, the dyke is cut by narrow D7 fracture planes, associated with slickensides, a sinistral normal sense of movement with limited displacement (<5 cm), and alteration, including sulphide growth and gold mineralization, i.e., the timing of emplacement of this dyke is post-D6, but pre-D7 and pre-mineralization (Table 1). This dyke yields a zircon age of 2651 ± 14 Ma [28], which provides a maximum age constraint to mineralization.

4.2. Syn-Tectonic Brecciation Events

Parts of the folded meta-sedimentary sequences in the Kukuluma and Matandani pits have been brecciated. In Kukuluma pit, breccia zones are largely restricted to the western wall of the pit, and occur as elongated bodies, 5–50 m thick, covering the entire height of the pit wall. The zones occur within the strongly D2–D3 folded package of meta-ironstone units, with clasts consisting mostly of chert embedded in a more micaceous and feldspar-rich matrix, in close spatial association with the intrusive dykes and stocks of the KIC. In the Matandani pit, extensive brecciation occurs in the southwest part of the pit, within strongly D2–D3 folded meta-ironstone intercalated with micaceous and graphitic shale, and concentrated along the western contact of a diorite intrusion that transects the centre of the pit (Figure 3b). Outside the open pits, a major breccia body (~100 × 50 m in size) occurs to the northwest of Matandani pit (Figure 3a).
Breccia varies from crackle breccia, in which blocks have a jigsaw fit and the underlying folds and layering are preserved in a semi-coherent manner (Figure 11a), to massive chaotic breccia in which the primary layering is destroyed (Figure 11b). The change from jigsaw breccia to chaotic breccia is gradational, and along the western wall of Kukuluma pit, zones of more intense brecciation alternate with folded zones, where brecciation is weak. Zones that display both D2 and D3 folds are brecciated, with some of the brecciation appearing more intense near fold hinge zones, i.e., in areas where the S3, axial planar fracture cleavage was more intensely developed. Elsewhere (0418580-9688000; Figure 11c), strongly brecciated layers in sharp contact with non-brecciated meta-ironstone are folded during D3, indicating that some brecciation pre-dates D3 folding and is strata-bound, possibly even indicating a syn-sedimentary origin for this breccia. The breccia zones are truncated by low angle reverse faults of D5 origin and affected by D5 recumbent folding. In areas where D5 thrusts cut through the highly folded and fractured meta-ironstone units, brecciation also appears to occur in spatial association with the D5 fault planes.
Zones of brecciation show a close spatial relationship with meta-ironstone units and dykes belonging to the KIC, with breccia occurring along the margins of intrusive diorite-monzonite bodies, or with dykes intruding into breccia zones. In one location (GR0418636-9687782; Figure 11e–h) a porphyritic diorite dyke intruded into the breccia and displays highly irregular boundaries, involving a planar trail of irregular, blob-like intrusive bodies up to 2 m in size, with indented boundaries and irregular protrusions and apophyses of dyke material. This relationship suggests that the dyke was emplaced at the time the wall rocks had lost coherency, as a result of brecciation; i.e., this dyke was emplaced at the same time as breccia formation. In the Matandani pit, a raft of crackle breccia is embedded within a diorite intrusion with an S3 foliation.
Locally (e.g., GR0418621-9687801), polymict breccia occurs with rare mafic clasts mixed with meta-ironstone clasts, in chaotic breccia zones that transect folded meta-ironstone beds, indicating considerable movement between breccia clasts. Locally, the breccia bodies show a much higher degree of matrix material and a much smaller clast size along highly-altered, clay-rich planar zones that are reminiscent of fluid pathways in intrusive breccia pipes (Figure 11d).
Based on available evidence, most breccia in the Kukuluma and Matandani pits formed immediately preceding or during D3, during the emplacement of the diorite and monzonite bodies to which they are spatially linked. They are best developed in the chert-rich meta-ironstone unit affected by D2–D3 folding. Although most brecciation appears to have been in situ, as a result of magmatic-hydrothermal activity, some “streaming” of breccia blocks with pipe-like characteristics did occur.
Apart from the hydrothermal breccia associated with the KIC, there are planar breccia zones or cataclasite zones associated with D6 shear zones (Figure 5e), and syn-sedimentary chert clast breccias. The D6 breccia zones are limited in areal extent and restricted to places where D6 shear zones transect thick chert beds. Fragmental volcanoclastic sediments are common as intercalations within the meta-greywacke along the north wall of Kukuluma pit. These volcaniclastic rocks consist of strata-bound, matrix-supported breccia layers, with angular clasts and layer fragments of chert embedded in a matrix of arenitic sandstone. They differ from hydrothermal breccia in the proportion of clasts to matrix, the fact that some display grading, and that they are stratabound.

5. Gold Mineralization
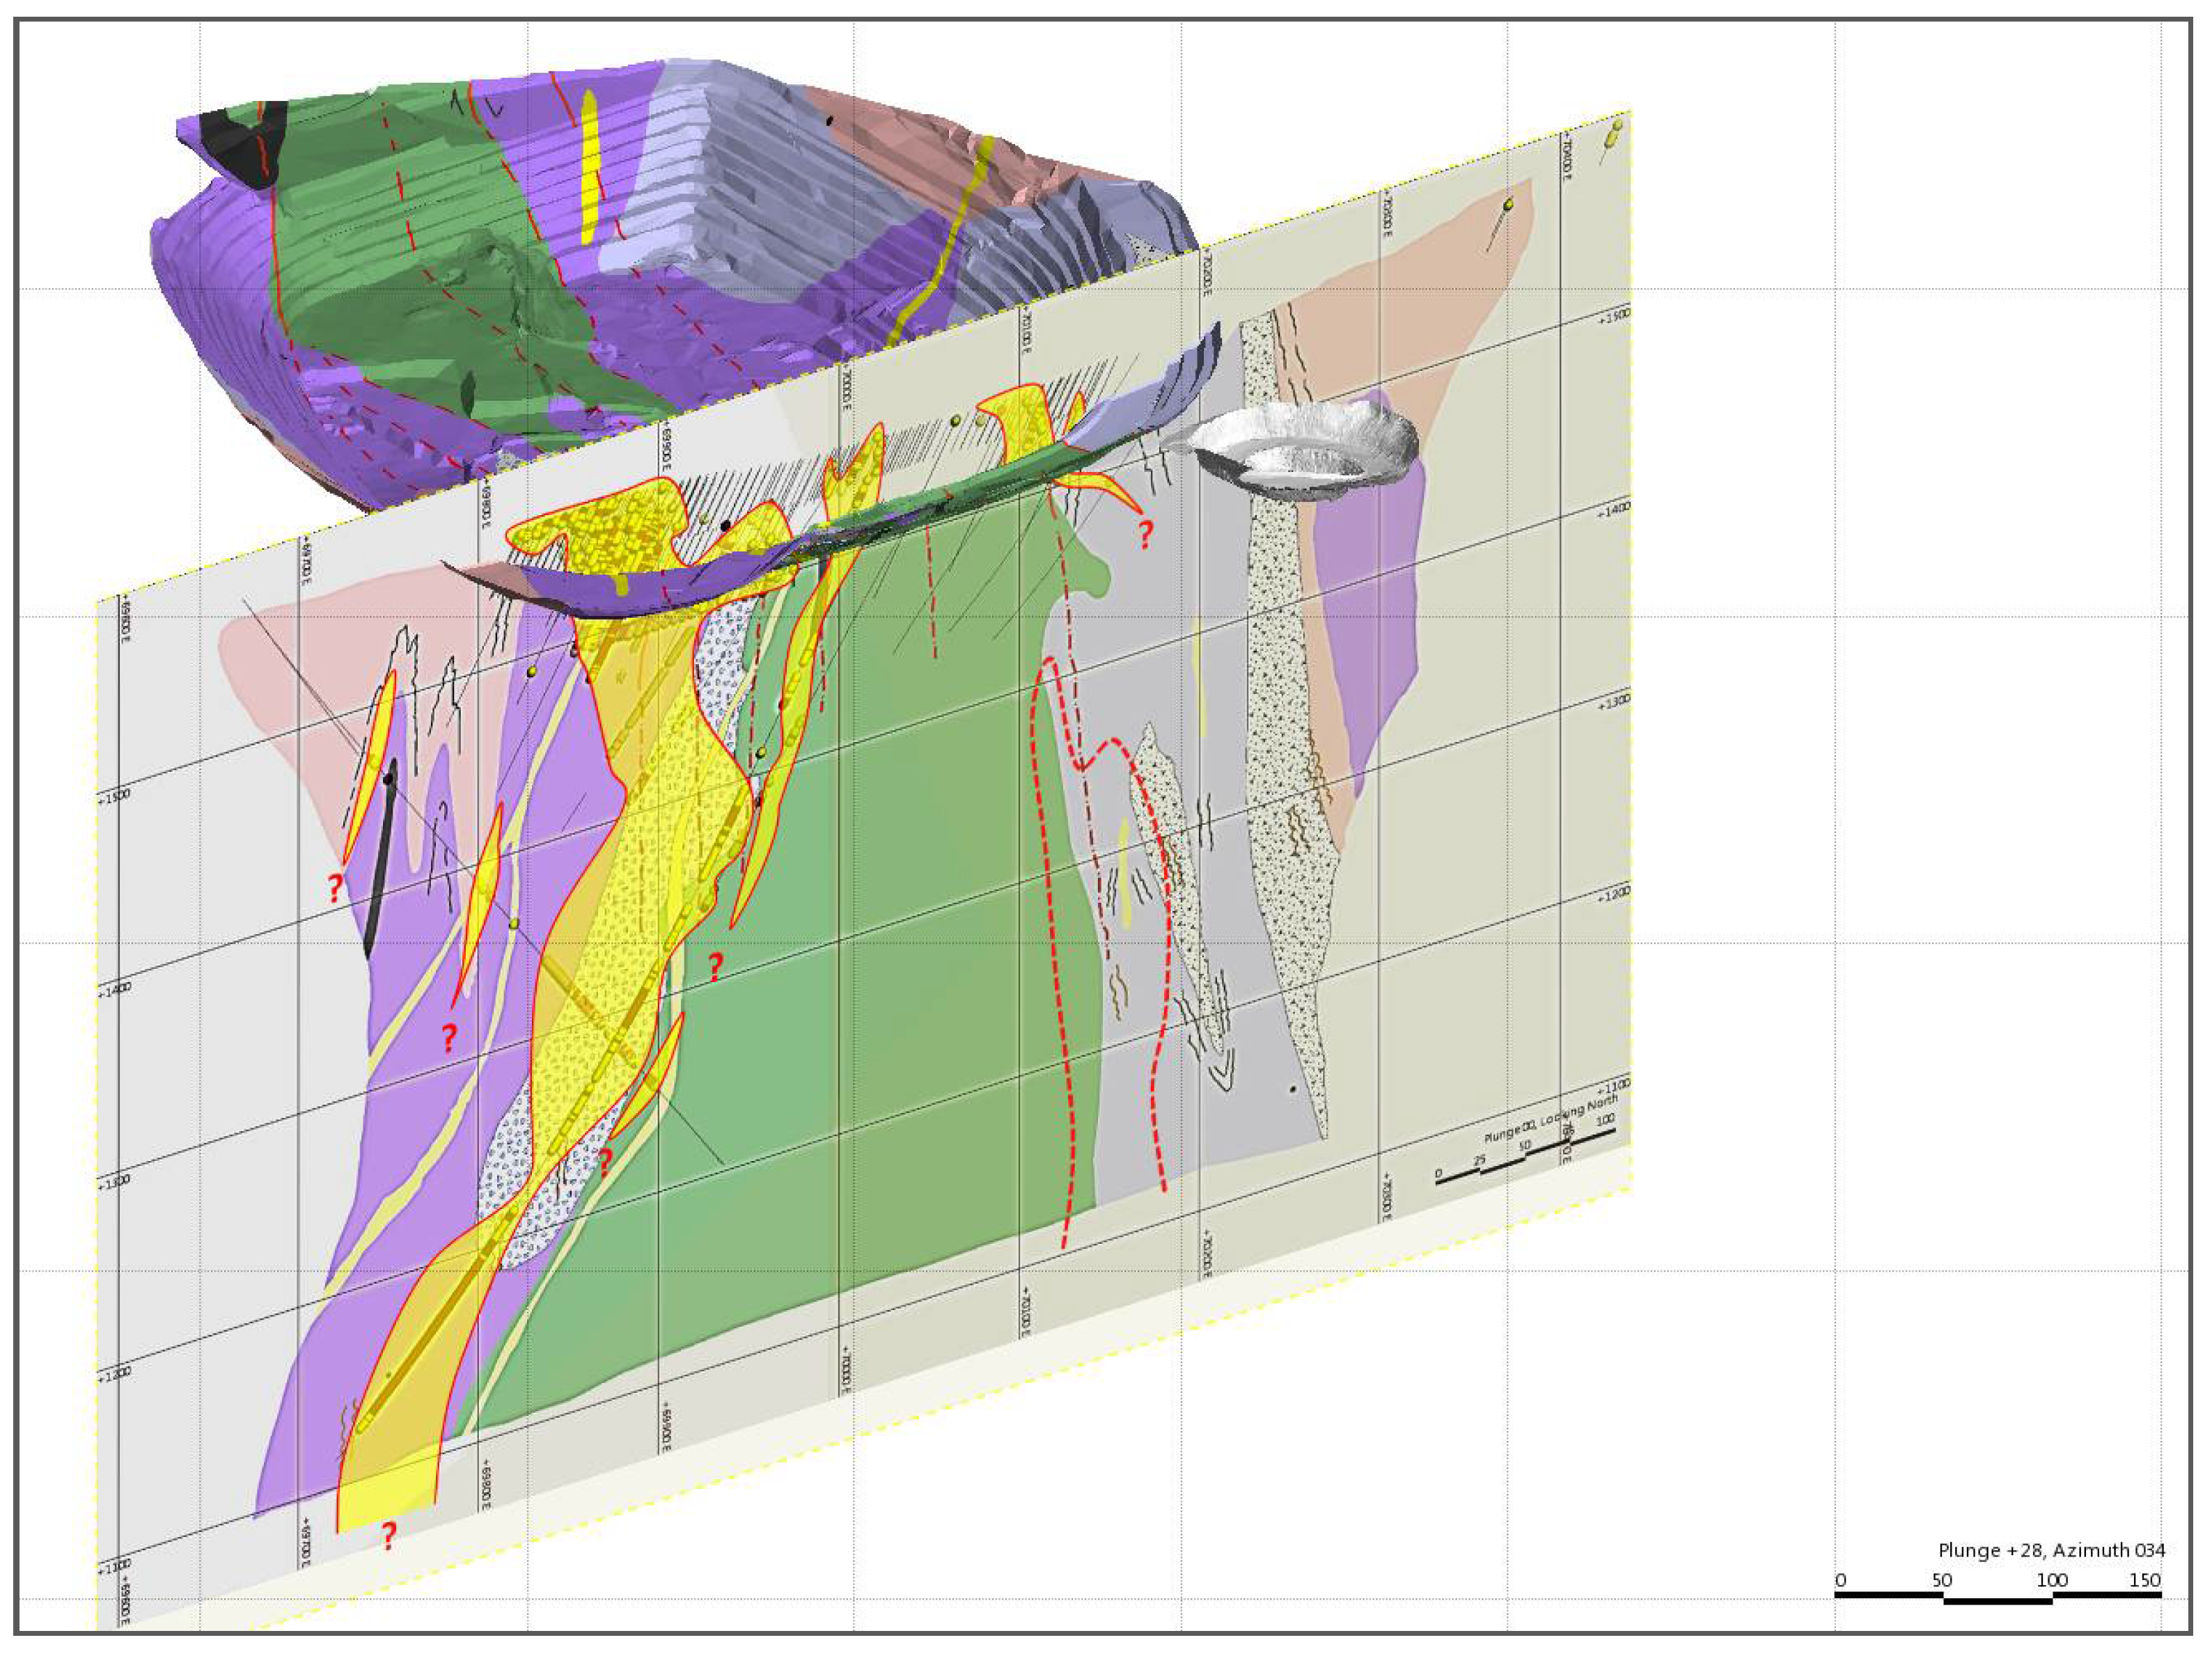
The Kukuluma and Matandani deposits occur on a deeply weathered erosional plateau, interpreted to have formed part of the (Cretaceous) African Erosion Surface. Complete oxidation and weathering of all rock types occurs to depths of >100 m, and influenced gold distribution, with leaching of gold in the top 20 m of the regolith profile, and supergene enrichment of gold near the base of the regolith [47]. The gold anomalies in Area 3 occur along the edge of the plateau, where the thick regolith has been largely removed by erosion.
Initial trenching of a weak soil anomaly in deeply weathered and leached rock in the Kukuluma-Matandani area gave few indications of the large ore bodies at depth, although free “leaf” gold in old artisanal workings indicated gold was present. Exploratory drilling revealed a general 2–3 g/t increase in mean grade between 60 and 105 m deep at Kukuluma, and a planar zone of gold enrichment between the base of the regolith and the top of fresh rock [47]. Mining of the oxidized ore zones took place between 2002 and 2007, but once primary mineralization was reached mining stopped due to the refractory nature of the ore (arsenopyrite-rich with abundant graphite).
Gold mineralization is spatially related to (a) competent lithologies, including meta-ironstone and chert that are distributed in a complex manner due to D2–D4 fold interference; (b) the locally brecciated, intrusive contacts between the ironstone, diorite, and monzonite of the KIC; and (c) fracture networks of D6 and D7 origin (e.g., Figure 12; [26]). The ore zones that consist mostly of disseminated mineralization are generally tabular in shape, with a north-northwest strike and steep dips, parallel to the contact zones of intrusions (Figure 12). In the Kukuluma pit, it was observed that mineralization widens along the Juma shear, where it cuts across the nose of an east-plunging D3 fold, and narrows again where the Juma shear runs oblique along the limbs of D3 folds. A second ore zone in the pit occurs along the Kasata shear, and is up to 50 m wide, trending 290°, where the Kasata shear intersects a complex D2–D3 antiformal fold interference structure in meta-ironstone; i.e., the presence of the D3 fold hinge zones appears to have affected the width of ore zones.
Direct observations of ore zones targeted by artisanal workers in the Matandani and Kukuluma pits, as well as Area 3, indicate that high grade ore zones occur along D7 fracture planes, which locally parallel and reactivate portions of the Juma and Kasata shears. This relationship is clearly visible in the western part of Matandani pit, where the main ore zone widens in a pocket of D2–D3 folded ironstone, transected by two strands of the D6 Kasata shear and overprinted by an east-southeast-trending D7 fracture zone. Sulphide mineralization in the outcrop is spatially related to D7 fracture planes, and occurs in association with grey to tan quartz stringers and sericite alteration. D7 faulting and associated gold mineralization and alteration in Matandani pit postdates the emplacement of a granite dyke at 2651 ± 14 Ma [28], which itself transects the D6 shear zones.
Higher grade ore in the Matandani, Kukuluma, and Area 3 deposits is normally found within meta-ironstone and chert units, with low-grade ore distributed over a larger range of lithologies (Table 2, Figure 12). For 30 diamond drill holes, representing a total length of 6094 m from Matandani (2160 m), Kukuluma (1787 m), and Area 3 (2147 m), which transect the main ore zones, the total length of mineralized rock at grades of >0.1, >0.5, >1, and >5 ppm gold was measured as a function of rock type. It was noted that rocks were not always logged in the same manner, so generalizations had to be made. All deposits show similar relationships between host lithology and ore grade, with >75% of high-grade material (>5 ppm) hosted in grunerite-magnetite-chlorite-biotite-rich meta-ironstone and chert units (81% at Matandani, 73% at Kukuluma, and 82% at Area 3; Table 2), suggesting a close relationship between mechanically competent, iron-rich lithologies and gold mineralization. Significant high-grade mineralization also occurs in sedimentary units (30% at Kukuluma) and in the monzodiorite-diorite intrusions (11% at Matandani, 21% at Kukuluma, and 5% at Area 3; Table 2). The latter are generally mineralized to within ~3 m from the contact with mineralized meta-ironstone, especially near zones where the margin is sheared and meta-ironstone xenoliths occur within the intrusions. At lower grades (<1 ppm), other lithologies host some mineralization, but the bulk of the ore (~70–80%) continues to be hosted in the highly fractured, silicified meta-ironstone and chert lithologies (Table 2).
Gold in fresh meta-ironstone is fine-grained (<20 µm), and occurs preferentially as inclusions in magnetite, pyrrhotite, pyrite, and arsenopyrite grains, which are spatially associated with fibrous grunerite aggregates, silicification, and chlorite–biotite alteration. Grunerite is not restricted to ore zones, but is also a regional metamorphic mineral that formed during D2–D3 events. In mineralized zones, magnetite is replaced by pyrrhotite, and arsenopyrite–pyrrhotite–pyrite–stibnite–scheelite assemblages occur in fracture networks, and as disseminations associated with gold. The alteration assemblage affects intrusive units of the KIC at or near the sheared contact zones (Figure 12). Higher grades are recorded in areas where arsenopyrite is dominant, and chlorite alteration less prominent. In highly mineralized zones, gold is associated with a network of mm-scale micro-fractures, probably of D7 origin, that are in-filled with pyrrhotite and arsenopyrite, and that are best developed in chert-rich layers of brecciated and folded meta-ironstone units. High-grade gold mineralization has also been observed in breccia zones that are not obviously (D6) sheared, but that are close to shears and occur next to the contact with the diorite and monzonite intrusives. In such areas, intense micro-fracturing can be observed in a drill core, with progressive infill of pyrrhotite in fractures within the ore zone.

6. Discussion

6.1. Tectonic and Magmatic History of the Central Kukuluma Terrain

A summary of the deformation, intrusive, and mineralizing events encountered in the central part of the Kukuluma terrain is presented in Table 1. The deformation events in the Kukuluma-Matandani area comprise three groups of structures that formed during three separate stages in the tectonic history of the belt. These groups are (a) D1 structures that formed during Stage 1, extensional deformation, which involved small-scale, syn-sedimentary growth faulting, layer-parallel shearing with silicification, and stratigraphic attenuation, and which formed at the time of sedimentation and early volcanism around 2717 ± 12 Ma, in an oceanic plateau environment [28]; (b) penetrative structures (D2–D6) that involved overprinting folding, shearing, and brecciation events during the main compressional Stage 2 of deformation, including an early episode of upright folding (D2) followed by distributed shearing and cylindrical upright folding with northwest-trending axial planar surfaces (D3), overprinted by open vertical folding (D4) and then recumbent folding and thrusting (D5) in response to north-south shortening. This was followed by the development of a network of brittle-ductile shear zones, recording reverse movements consistent with continued north-south shortening (D6; Figure 9), all happening before the emplacement of a set of felsic dykes around 2665 Ma as a result of the Geita greenstone terrain docking against an older cratonic terrain to the south [28,39]; and (c) localized D7 structures that formed during Stage 3 extensional deformation (Figure 10), when strain was partitioned into discrete normal faults and joints (D7) sometime after 2650 Ma [28], during the stabilization phase of the craton [30].
Deformation events were accompanied by the emplacement of a diorite-monzonite suite that largely intruded during D3, and a granodiorite suite (mostly dykes) that intruded around 2665 Ma [28], probably after D6. Collectively, these intrusions form the Kukuluma Intrusive Complex (KIC, [26]). Rocks of the KIC have an adakite-like signature, but the trace element geochemistry and very narrow variation in Th/U ratios is inconsistent with a subduction origin [26]. It has, therefore, been proposed that the KIC formed by partial melting of garnet-bearing, mafic crust at the base of a thickened oceanic plateau, and did not involve subduction [26], similar to other volcanic units in the area [37] and mafic–felsic crust in other greenstone belts [20,51,52,53,54].
The intrusions of the KIC are spatially associated with breccia bodies that formed along intrusive margins with meta-ironstone units. Late-tectonic felsic porphyry dykes cross-cut all units and D1–D6 structures, and one such dyke, which is cut by D7 faults, has been mineralized and dated at 2651 ± 14 Ma [28]. This dyke provides an upper age constraint for gold mineralization in the area. With respect to gold mineralization, the ductile group of compressional D2–6 structures created the architecture that influenced the distribution of rock types favorable for gold precipitation, whereas the D7 faults appear to have controlled fluid infiltration, which would have been facilitated by the extensional environment in which these structures formed [8,12,18].
The deformation and intrusive sequence of events described for the gold deposits in the Kukuluma terrain (Table 1) is near-identical to the deformation–intrusive sequences described in the Nyankanga [25] and Geita Hill [24] deposits in the Central terrain, even though the latter occur across a major shear zone at somewhat lower peak metamorphic conditions (Figure 2). Both areas record early D1 events associated with syn-sedimentary extensional faulting and chert formation along discordant zones. D2–4 events in both areas are near identical, with the exception that D2–4 structures in the Kukuluma terrain preserve a greater diversity in fold–axes orientation. Unlike the Nyankanga–Geita Hill area, the central parts of the Kukuluma terrain also preserve localized, planar D3 high strain zones with northwest-plunging lineations, in which S0, S1, S2, and S3 fabrics have been transposed.
D5 events in the Kukuluma pit area are more clearly developed than at Geita Hill or Nyankanga [24,25], with recumbent folding showing a clear relationship with low-angle reverse faults. Such structures are common in greenstone belts, and may have resulted from the rise of diapirs and the consequent steepening of the margins of the greenstone belt [55,56].
D6 brittle-ductile shears in the Kukuluma terrain correlate to the north-dipping sinistral thrust zones in Nyankanga and Geita Hill; they are identical in metamorphic grade and only vary in the orientation and dominant shear sense, but both are consistent with north-south shortening [24]. In the Kukuluma and Matandani pits, the network of D6 shear zones share a common, steeply west-northwest-plunging (Figure 10) intersection lineation that more or less parallels the D4 fold axes, a dominant cluster of D3 fold axes (Figure 6d), and the mineral elongation lineation in D3 high strain zones. This co-linearity of deformation features was also noted in the Geita Hill deposit [24], where mineralization followed the same general trend, and it has been interpreted to reflect a co-genetic relationship of D2–D6 events linked to the same large-scale compressional processes [24,25,57].
Later reactivation of D6 shears in Geita Hill and Nyankanga involved several events, including strike-slip and normal movements grouped as D7–8 events, whilst in the central Kukuluma terrain these events are grouped as D7, with normal movement being dominant. In both areas, the late extensional events are spatially and temporally associated with gold mineralization that occurred after 2650 Ma [24,35]. In parallel with the deformation sequence, the intrusive rocks of the KIC correlate in composition and relative timing with the Nyankanga Intrusive Complex [26,28,30], and both areas show evidence of igneous events associated with felsic dykes and lamprophyres that were emplaced after D6 and before D7.
The similarity in the deformation–intrusive histories of the Central and Kukuluma terrains suggests that the tectonic history for much of the GGB is similar, and that terrain boundaries internal to the GGB do not separate diverse domains, as has been suggested in accretionary terranes [15,27,58]. It also means that age constraints obtained from the Nyankanga-Geita area can probably be applied to the Kukuluma-Matandani area, and vice versa. Thus, D1–6 events near Kukuluma probably occurred at the same time as D1–6 events at Geita Hill [25,39], i.e., between 2720 and 2660 Ma, including the emplacement of the KIC, which, in comparison with the Nyankanga Intrusive Complex, may have occurred between 2700–2685 Ma [24,35]. A date of 2717 ± 12 Ma for syn-sedimentary volcanics from the Kukuluma pit [28] provides an estimate for the timing of extensional D1 events. Compressional D2–4 events at the Nyankanga and Geita pits are constrained to 2700–2675 Ma [25,35], whilst D5–6 events represent a later retrograde compressional stage of deformation, possibly at 2675–2660 Ma, as suggested by the ages obtained for the granodiorite dykes of the KIC [26,28]. A late granodiorite dyke in Matandani pit constrains the timing of D7 normal faulting and mineralization to <2650 Ma, consistent with observations in Geita Hill, where mineralization is <2644 Ma [24,35], which also coincided with the emplacement of 2620–2660 Ma granitoids to the east, north, and west of the GGB [30].

6.2. Controls on Gold Mineralization

Spatially, gold mineralization within the Kukuluma and Matandani deposits is associated with D6,7 shear zones, located along the contact zone between the diorite intrusions of the KIC and magnetite-rich, meta-ironstone units within the surrounding volcano sedimentary package (e.g., Figure 12). High-grade mineralization is also closely associated with networks of extensional D7 fractures, where they occur in ironstone and metasediment away from D6 shear zones. Ore zones occur almost entirely within the meta-ironstone units, and differ in this respect from the mineralization in Nyankanga and Geita Hill, where diorite of the Nyankanga Intrusive Complex is widely mineralized, be it at a lower grade [23,25,41]. The ore zones widen where D6,7 shear zones traverse intensely folded and highly brecciated areas. D3 fold axial zones and syn-D3 hydrothermal breccia zones near KIC intrusive margins were especially conducive to the infiltration of mineralizing fluids, which infiltrated the rock along preexisting micro-fracture networks. However, this relationship only holds where mineralized D6 shear zones are in close proximity to the folded and brecciated areas—i.e., brecciation of meta-ironstone units in itself does not guarantee gold mineralization. These relationships indicate that the D7 fracture zones in the Matandani-Kukuluma area acted as upper-crustal channels for the mineralizing fluids, facilitating the infiltration into fractured zones offered by the strongly folded and brecciated meta-ironstones [59]. In this context, it is important to note that the distribution of the meta-ironstone units is highly complex as a result of D2–4 fold interference, and therefore, the intersection zones of the D2–4 folded ironstones, D6,7 shears, and fracture zones is highly discontinuous, which contributes to the complex distribution patterns of the ore zones in the area.
Earlier mine reports argued that mineralization was controlled by the Juma and Kasata shears (Figure 3), and that their apparent displacement between the Kukuluma and Matandani pits was the result of later east-west sinistral faults. A similar east-west fault was assumed to have displaced the southern end of the Juma shear, in order to account for mineralization in Area 3 to the east [48,60]. Pit exposure shows that the Juma and Kasata shears anastomose and change in orientation from west-trending to northwest-trending, with no evidence for offsets by later east-west faults. Likewise, the eastern tip of the Juma fault displays a complex fault splay, characteristic for fault tips or terminations [46], with no evidence of displacement by cross-cutting faults. The Juma and Kasata shears do, however, show evidence for an earlier D6 compressional stage, overprinted by a later D7 extensional stage; the late east-west fracture zones identified [48] represent the cross-cutting D7 structures reported here, which are associated with hydrothermal alteration but have no major displacements. Thus, the spaced distribution of mineralization from Area 3 via Kukuluma to Matandani should be understood in terms of an en echelon array along a west-northwest-trending corridor, rather than a continuous northwest-trending ore zone displaced by later east-west faults. This en echelon array of faults did not accommodate large displacements, neither during D6 nor D7, because the strike length of the faults is generally <500 m [61,62]. The en echelon array probably originally formed in compression during D6, and was reactivated and partly overprinted by normal faults during D7, which developed along east-west corridors [24,48], and possibly visible as east-trending lineaments in geophysical data sets. Even though displacements would have been small, fluid ascents and penetration could have been highly effective during D7 extension, as a small shift in the far-field stress could have greatly enhanced the permeability of preexisting micro-fracture networks and facilitated improved fluid–rock interactions [12,59,63,64,65,66]. In this context, it is important to note that the ore zones in the Kukuluma and Matandani pits widen where the D6,7 shear zones display S-like bends (from northwest to west to northwest-trending). Such S-bends would be constraining [46] during D6 reverse faulting, but would be areas of maximum dilatancy during D7 [9,12,63]. The drop in fluid pressure and possibly temperature that would have occurred along the micro-fracture zones in extension would also have played a role in ore deposition [12].
The close spatial relationship of gold with meta-ironstone and the intrusive margins of the KIC indicate a litho-chemical control on mineralization, with sulphidation of the magnetite-rich units being particularly important. It is therefore assumed that much of the gold entered the system as sulphur complexes, which destabilized upon contact with Fe-rich lithologies, i.e., magnetite-rich units [25,67,68,69,70,71]. Compared to other major deposits in the GGB, mineralization in Kukuluma and Matandani is more pyrrhotite-arsenopyrite-rich, which may reflect a combination of higher metamorphic grade, reduced conditions due to the presence of graphitic shale, and host-rock control. The presence of porphyry dykes in association with mineralization, not just in the Matandani pit but also at Geita Hill [24] and Nyankanga [25], would suggest that igneous fluids may have caused mineralization; even though for Archaean Greenstone terrains in general devolatization reactions during regional metamorphism are generally credited as being the primary source for mineralizing fluids [3,8,70]. It is beyond the scope of this paper to fully discuss the origin of gold-bearing fluids, which will require additional isotopic and fluid inclusion studies.
In terms of the timing of gold mineralization in the Kukuluma terrain, the situation is similar to the Geita Hill and Nyankanga deposits, with mineralization spatially linked to D2–D3 fold noses and D6 reverse faults that formed during the compressional stages of the deformation history [25]. The mineralizing event (i.e., D8 at Nyankanga and Geita Hill [24,25] and D7 at Matandani-Kukuluma; Table 1), however, is late-tectonic, and associated with normal fault reactivation of the older reverse faults. The mineralizing events post-date an intrusive event, dated at 2651 Ma in the Matandani pit [28] and at 2644 Ma in the Geita Hill deposit [35], where lamphrophyre dykes occured in association with mineralization [24,35]. Thus, whilst the ore-body geometries are entirely controlled by deformational geometries and lithological distributions that formed during the second stage (i.e., ~2700–2665 Ma) evolution of the GGB, the actual mineralizing events probably occurred later, when fluids, possibly linked to a deeper igneous source, moved into the dilatant zones during extension [9,24,25]. A similar relative timing relationship of deformation structures, intrusions, and gold mineralization also exists in other parts of the Tanzania Craton ([72,73,74]; for example, in the Golden Pride deposit in the Nzega Greenstone Belt (Figure 1), mineralization was introduced along a crustal scale shear zone during late-stage reactivation, and accompanied by the intrusion of lamprophyre and quartz porphyry dykes. Mineralization was concentrated along late cross-cutting fractures near redox fronts provided by BIFs [74].
The structural controls on gold mineralization at Kukuluma and Matandani conform with models for Archaean gold mineralization more broadly, as summarized by [8,9], in the sense that mineralization is late-tectonic, appears to occur as a single event during a shift in the far field stress, precedes cratonic stabilization, and is associated with a range of structural traps created earlier in the deformation and intrusive history of the belt. However, the Kukuluma, Matandani, and Area 3 deposits do not fit the orogenic model, as defined by [9,70] or [2]. In review papers on gold mineralization, the Geita mine is commonly classified as a Neoarchaean, BIF-hosted, orogenic gold deposit [1,2,3,6,7] related to subduction–accretion systems, with all mafic sequences deposited in a subduction-back arc environment [27,36]. More recent work [24,25,37,39] shows that this interpretation needs adjustment. Rather than forming in a classic orogenic setting, mineralization entered the greenstone belt during an extensional phase concomitant with the emplacement of widespread high-K granites [30], ~20–30 Ma after compressional deformation and accretion of the greenstone sequence. The mafic-intermediate volcanics in the GGB evolved from melt segregation of a primitive mantle, to form thick oceanic plateaus away from subduction systems and accretionary margins [37,39]. Compressional deformation events coincided with the emplacement of diorite-monzonite complexes like the KIC, which formed from partial melting of the garnet-bearing mafic crust at the base of the oceanic plateaus, suggesting that the greenstone sequence may have never experienced the accretion–subduction processes as postulated by earlier workers [27]. If so, this would invalidate a traditional orogenic setting for the gold deposits in the GGB [1].

7. Conclusions

Detailed mapping of the central part of the Kukuluma terrain in the eastern GGB shows that the deformation-intrusive history of the area (Table 1) is near identical to the geological history of the Central terrain, which hosts the world-class Nyankanga and Geita Hill deposits. This similarity occurs across major shear zones, and suggests that the geological history of much of the GGB is similar, with syn-sedimentary extension (D1) followed by an early compressional-accretionary stage (D2–6) between 2700–2665 Ma, associated with the emplacement of internal intrusions of the KIC, a later extensional stage (D7) associated with a second generation of felsic intrusions, and gold mineralization that occurred after 2650 Ma.
The geometry of the ore bodies at Kukuluma and Matandani is controlled by the distribution of magnetite-rich meta-ironstone, near the margins of monzonite-diorite bodies of the KIC where they are cut by D7 fractures. The lithological contacts act as redox boundaries, with high-grade mineralization enhanced in zones of improved permeability and fluid infiltration, including syn-D3 hydrothermal breccia zones, D2–D3 fold hinge domains associated with a high density of micro-fracturing, and D6 shears with associated damage zones. The actual mineralizing events were late-tectonic (<2650 Ma), and occurred in an extensional setting during D7. Extension facilitated the infiltration of mineralizing fluids along preexisting micro-fracture networks of D2–D6 origin, as well as D7 deformation zones.
The Kukuluma and Matandani deposits provide excellent examples of complex trapping structures that formed as a result of multiple overprinting deformation events before the gold was introduced [9]. Thus, whilst gold mineralization is late-tectonic, ore body geometries are associated with older structures and lithological boundaries.
In the GGB, deformation and intrusive sequences on an outcrop scale are similar to other greenstone belts. However, the major gold deposits in the GGB lack the proximity of crustal-scale shear zones, are associated with intrusive complexes like the KIC, do not show a clear link to a subduction–accretion setting, and formed late-tectonically during an extensional phase. These deposits are not characteristic of typical orogenic gold deposits.

Acknowledgments

This study is part of a PhD study undertaken by the first author at James Cook University. SDK would like to thank James Cook University for waiving the tuition fees and Geita Gold Mine for providing the research funding for this study.

Author Contributions

S.D.K., P.H.G.M.D., I.V.S., T.B. and S.L.K. have conceived and designed the project and performed the field work; S.D.K. and P.H.G.M.D. analysed the data; S.D.K., P.H.G.M.D. and I.V.S. wrote the paper.

Conflicts of Interest

The authors declare no conflict of interest.

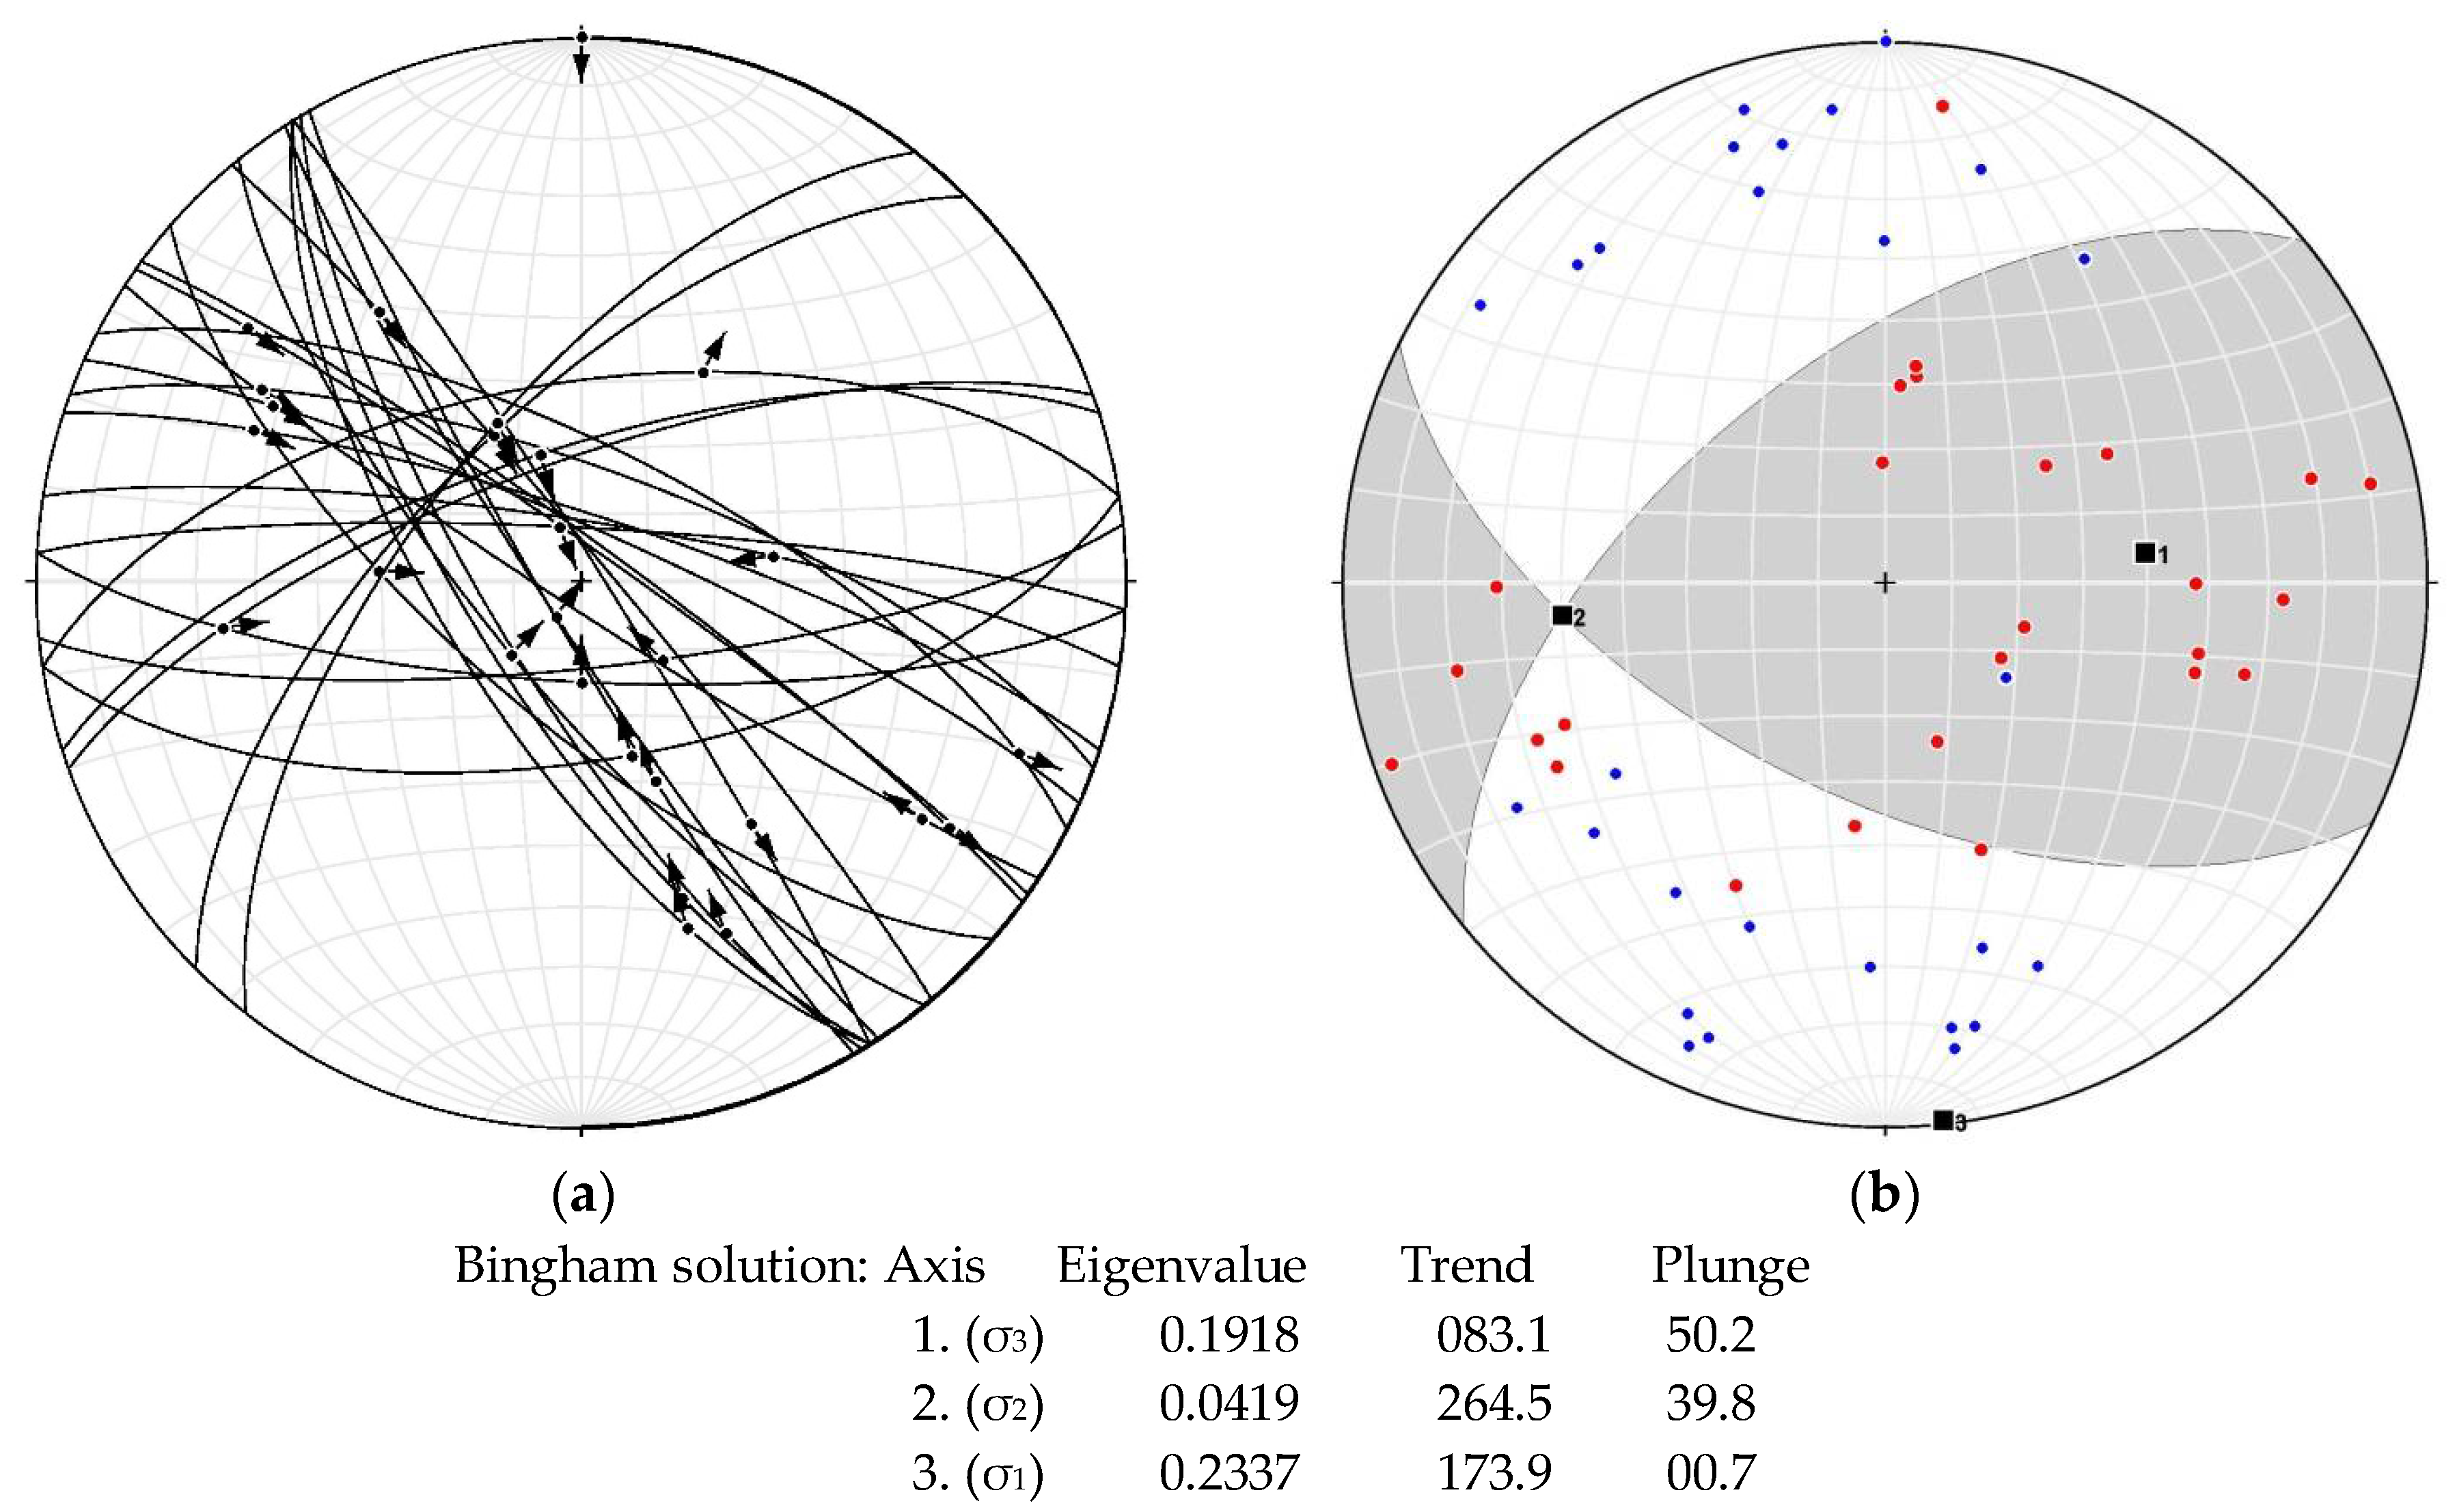
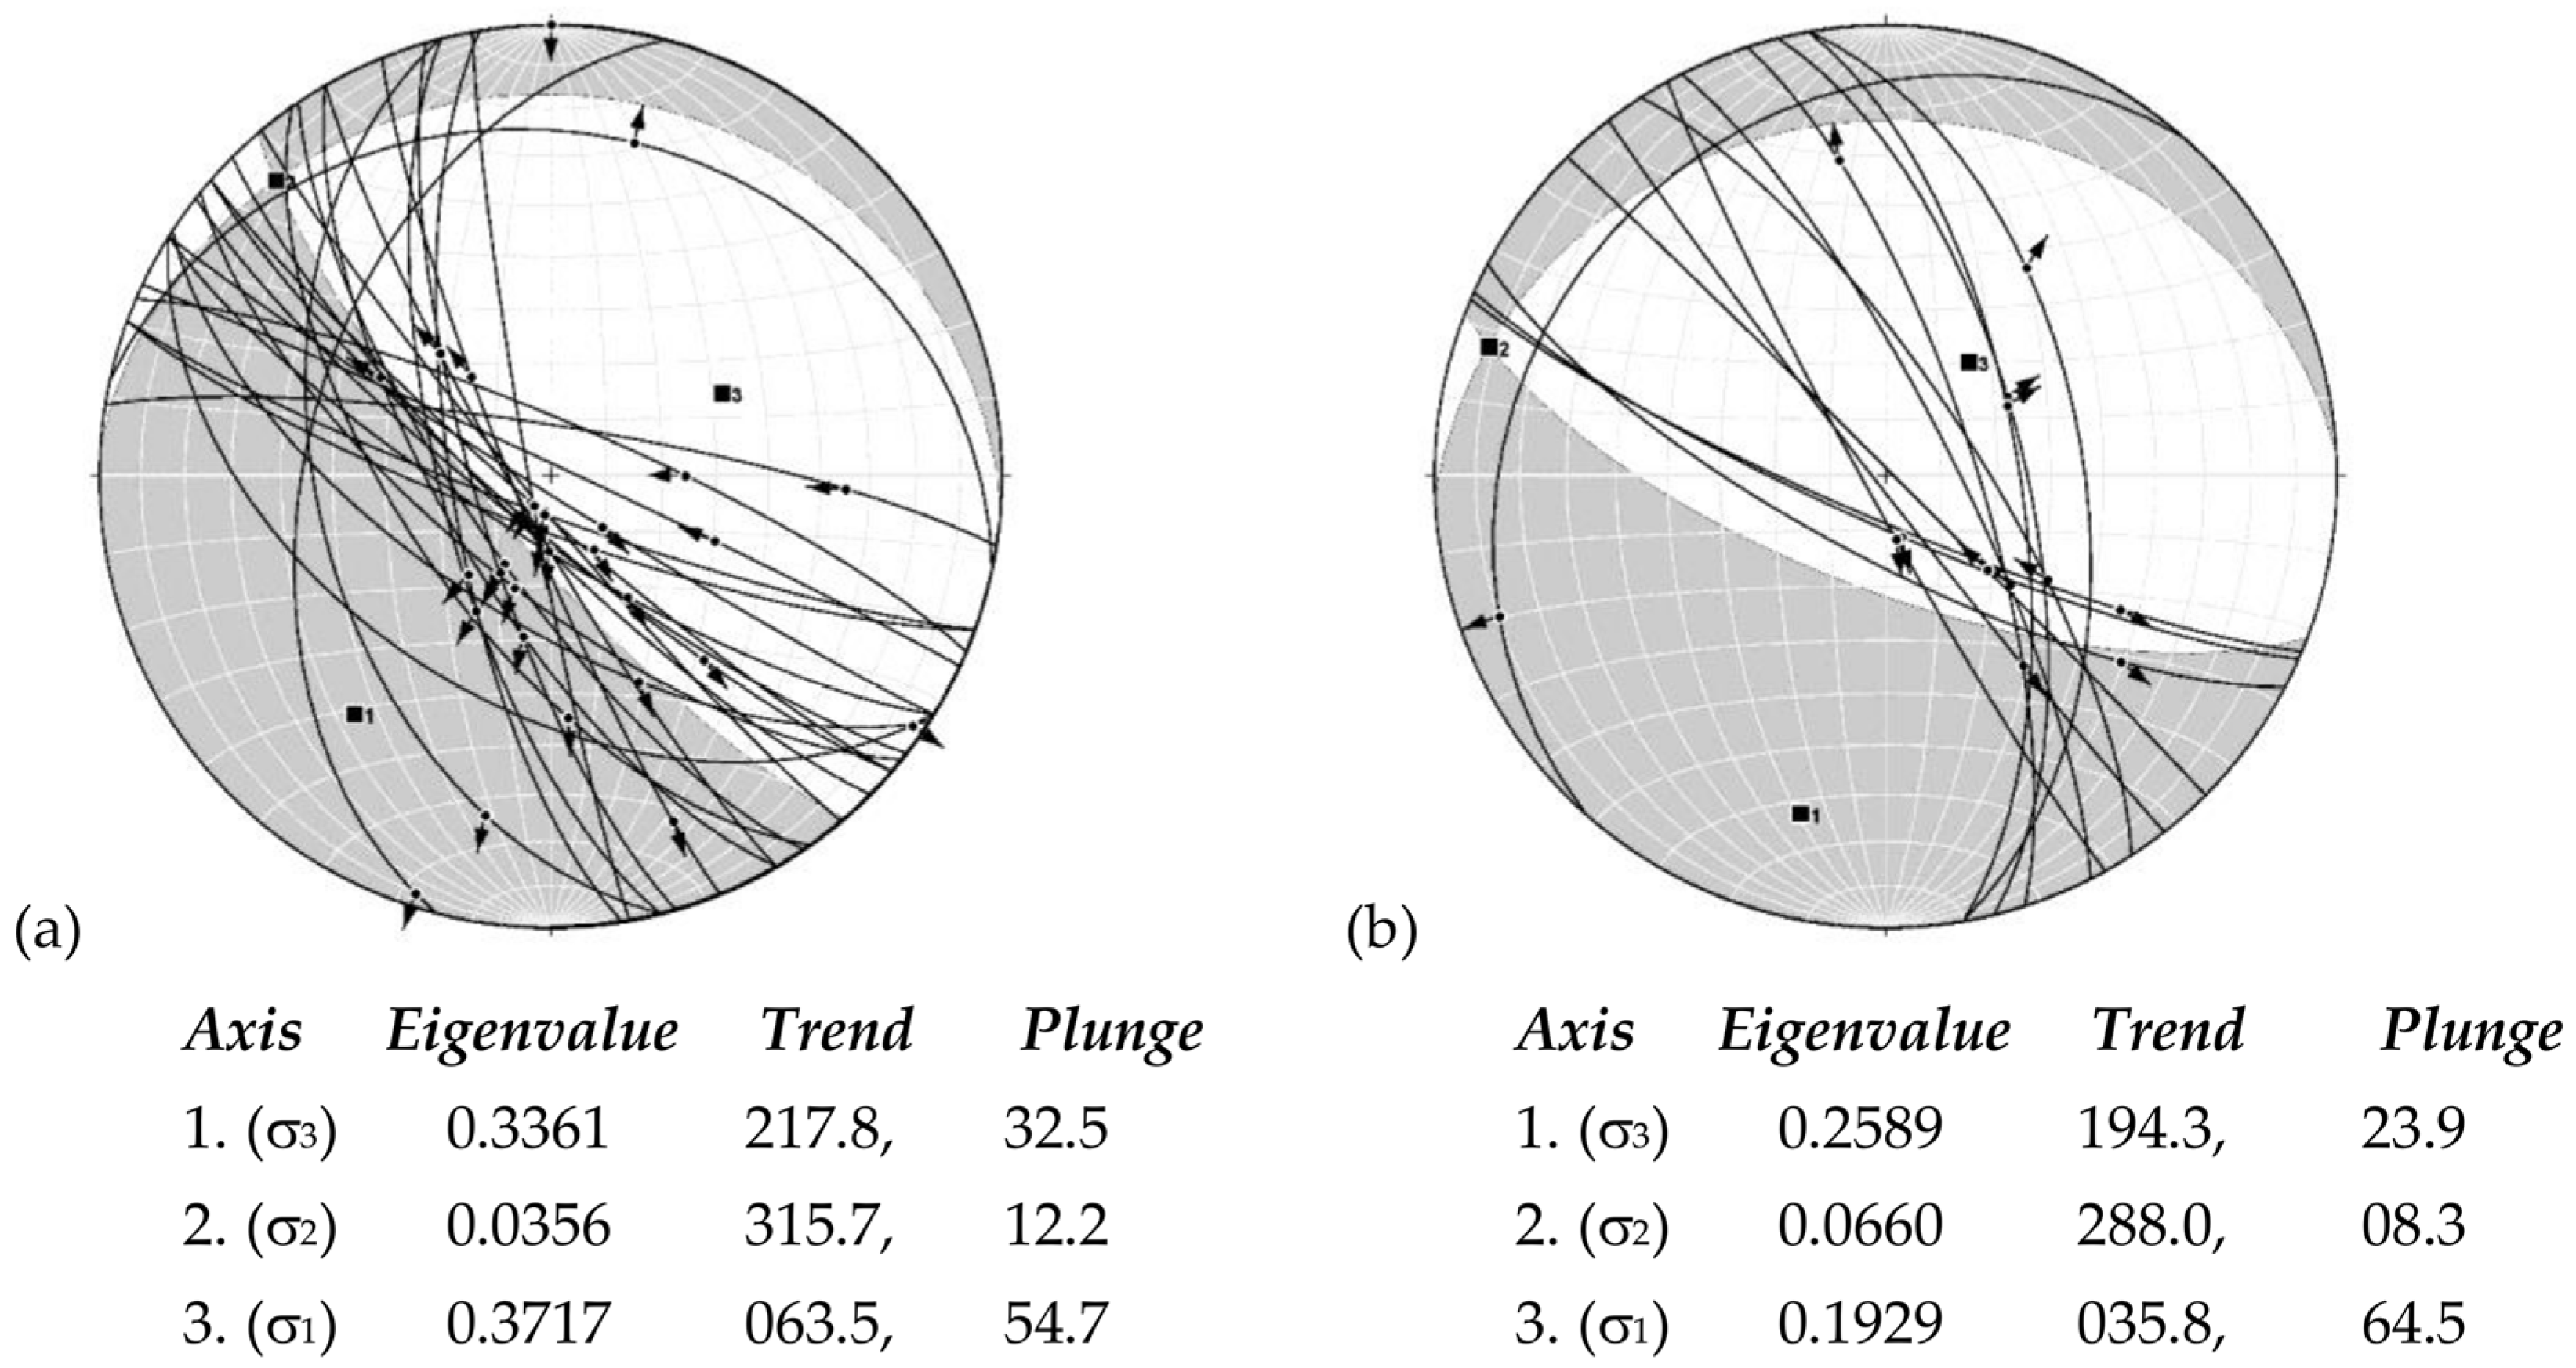
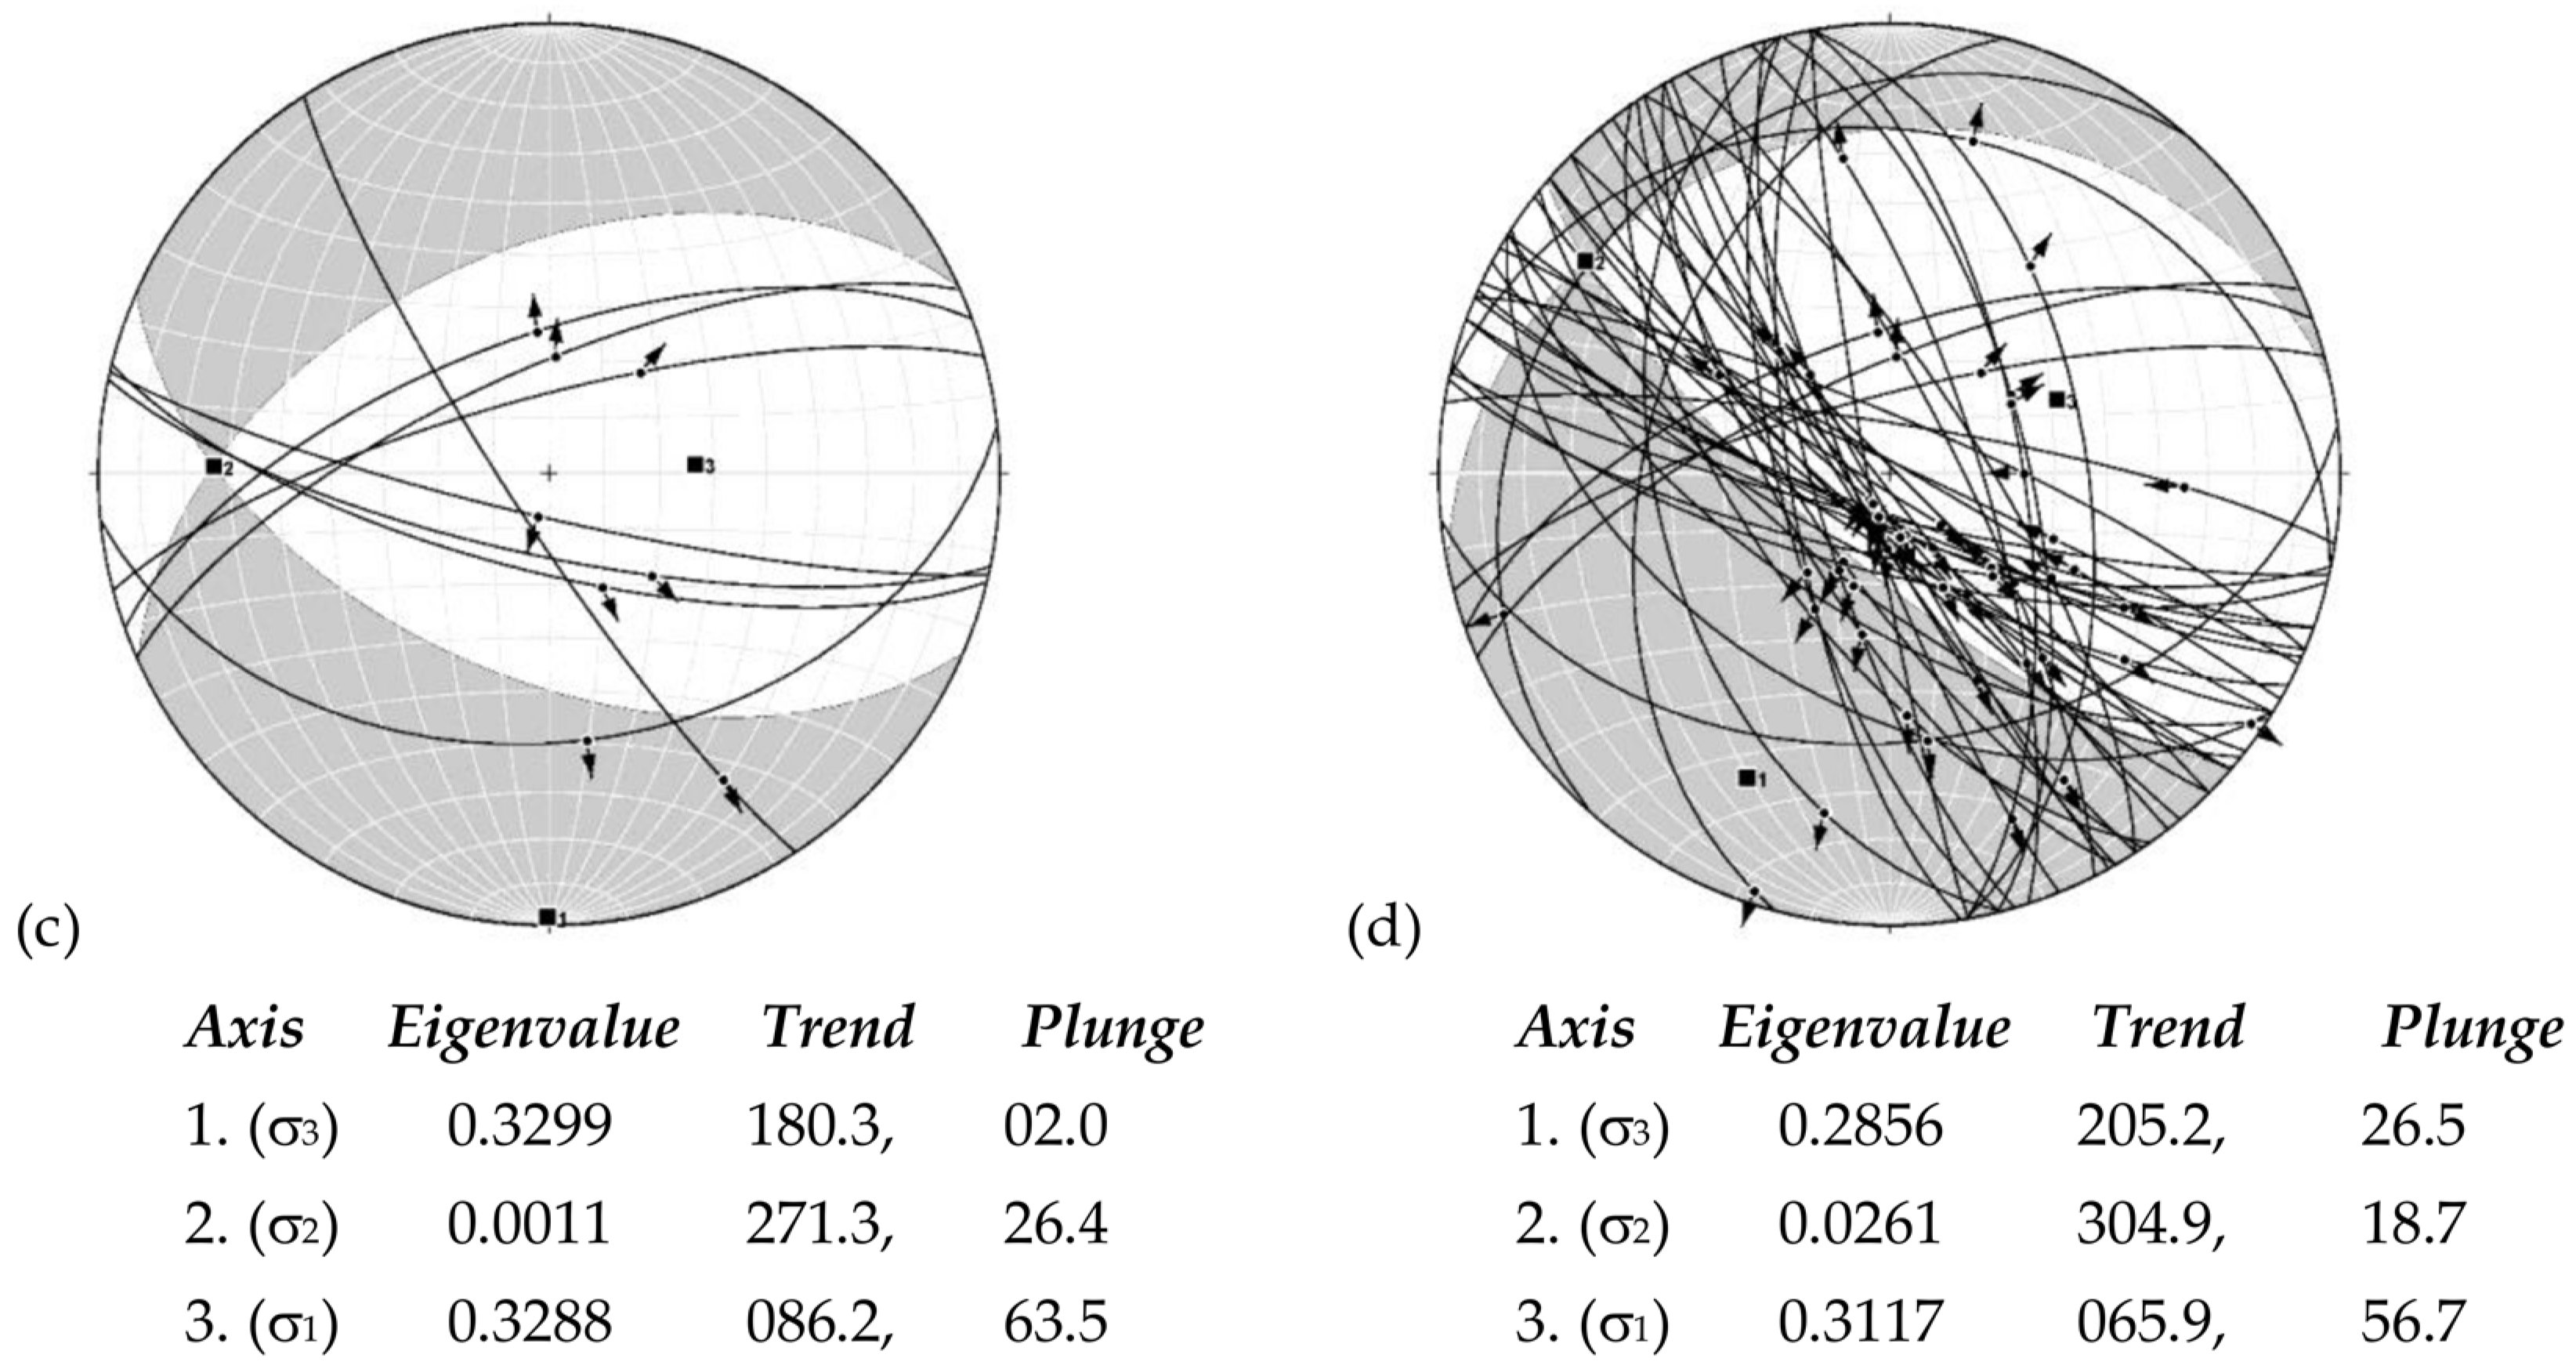
Appendix A. Fault Kinematic Analysis

Kinematic data from faults can be used to reconstruct paleo-stress fields [75]. To do this, information is required on the orientation of the fault plane, the slip direction visible as slickenlines, striations or gouge marks, and the sense of movement. Stress inversion techniques rely on the assumption that the slip direction coincides with the resolved shear stress on the fault plane, and that the set of faults used in the analysis formed or were active in response to the same far-field stress. Fault-slip data can be inverted to a reduced moment tensor, with information on the direction of the principal stress axes and their relative size expressed as a stress ratio [76,77]. This reduced stress tensor can be calculated using the P (principal compression) and T (principal tension) axes that bisect the fault plane, and an auxiliary plane perpendicular to the fault, by using least-square minimization techniques of direction cosines [49] or iterative methods that test a variety of possible tensor solutions [78]. Stress axes can also be determined graphically using the right dihedron method [76,79], which constrains the orientation of principal stress axes by determining the area of maximum overlap of compressional and extensional quadrants for a suite of faults.
In analyzing the fault-slip data, we have used a linked Bingham distribution tensor calculated with the program FaultKinWin [80], following methods described by [49,81]. The FaultKinWin programme [80] uses the distribution of the P and T axes for a suite of faults [75], in order to calculate a Bingham axial distribution based on a least-squares minimization technique for direction cosines. In this technique, the dihedral angle between the fault plane and an auxiliary plane is 90° and bisected by the P and T axes. The eigenvectors for the calculated Bingham axial distribution provide average orientations for the maximum, minimum, and intermediate concentration direction of the P and T axes, and the eigenvalues provide a measure of the relative concentration or distribution of P and T axes. These eigenvalues vary between −0.5 and +0.5, with maximum values reached when the P and T axes are perfectly concentrated. Variations in the eigenvalues (ev) can be linked to the stress regime, using the relative size of the normalized eigenvalues expressed in a ratio, Rev, with Rev = (ev2 − ev3)/(ev1 − ev3) (constrictional stress: Rev = 1 when ev1 = ev2; plane stress: Rev = 0.5 when ev2 = 0; flattening stress: Rev = 0 when ev2 = ev3). The FaultKinWin programme output is a plot of linked Bingham axes, with eigenvalues and a related fault plane solution diagram displaying P and T quadrants in a manner similar to earthquake focal mechanisms (Figure 9 and Figure 10).
Although stress analysis from fault slip data is widely applied, debate continues whether the obtained solutions represent a stress field or provide a measure of strain and strain rate [82,83]. Marrett [49], along with Allmendinger and Faultkinwin [80], using FaultKinWin, prefer to interpret the fault plane solutions as an indicator of strain rather than stress.
Here, the linked Bigham fault plane solution through FaultKinWin has been interpreted as an indication of the paleo-stress field. In doing this, we are aware of the various pitfalls. Faults, once formed, can interact in complex ways in response to an imposed stress field due to scale-dependent strain partitioning, complex fault interactions, block rotations, inhomogeneities in the rock mass, etc. [83]. In spite of such limitations, the paleo-stress analysis technique has been successfully applied in a wide variety of tectonic settings [18,66,84], and we believe it provides valuable insights to the tectonic controls on gold mineralization at Kukuluma and Matandani.
Misfits in collected datasets may have resulted from observational errors, the mixing of unrelated data points, or limitations in the approach used. They can also be due to non-uniform stress fields, as a result of fracture interactions, anisotropies in the rock mass, block rotations, or slip partitioning. In near vertical shear fractures there is the added problem that a small rotation of the fracture plane around a horizontal axis can change it, from a normal fracture compatible with the overall data set to a reverse fracture that is radically incompatible when using the computer programs. In calculating a Bingham tensor solution using FaultKinWin, all data points were included. It is stressed that throughout the analyses of datasets, very few data points were incompatible with the final results, suggesting generally homogeneous data
As a general rule, the results from the paleo-stress analyses are best constrained for large data sets that combine fracture planes with different directions and movement sense. Thus, conjugate fracture sets, or Riedel, anti-Riedel, and P-shear arrays, provide good results that are more likely to be indicative of the regional paleo-stress field, especially if the stress inversion is based on at least 15 fracture planes [76,84]; sites in which only few planes, or planes in a limited number of directions, can be measured to provide at best an indication only of the local paleo-stress field, which may or may not conform with the regional results.

References

  1. Goldfarb, R.J.; Groves, D.I.; Gardoll, S. Orogenic gold and geologic time: A global synthesis. Ore Geol. Rev. 2001, 18, 1–75. [Google Scholar] [CrossRef]
  2. Goldfarb, R.J.; Baker, T.; Dube, B.; Groves, D.; Hart, C.; Gosslein, P. Distribution, character and genesis of gold deposits in metamorphic terranes. In Economic Geology One Hundredth Anniversary Volume; Society of Economic Geologists, Inc.: Littleton, CO, USA, 2005; pp. 407–450. [Google Scholar]
  3. Groves, D.I.; Vielreicher, R.M.; Goldfarb, R.J.; Condie, K.C. Controls on the heterogeneous distribution of mineral deposits through time. Geol. Soc. Lond. Spec. Publ. 2005, 248, 71–101. [Google Scholar] [CrossRef]
  4. Laznicka, P. Giant metallic deposits—A century of progress. Ore Geol. Rev. 2014, 62, 259–314. [Google Scholar] [CrossRef]
  5. Groves, D.I.; Goldfarb, R.J.; Gebre-Mariam, M.; Hagemann, S.G.; Robert, F. Orogenic gold deposits: A proposed classification in the context of their crustal distribution and relationship to other gold deposit types. Ore Geol. Rev. 1998, 13, 7–27. [Google Scholar] [CrossRef]
  6. Bierlein, F.P.; Groves, D.I.; Cawood, P.A. Metallogeny of accretionary orogens—The connection between lithospheric processes and metal endowment. Ore Geol. Rev. 2009, 36, 282–292. [Google Scholar] [CrossRef]
  7. Bierlein, F.P.; Groves, D.I.; Goldfarb, R.J.; Dubé, B. Lithospheric controls on the formation of provinces hosting giant orogenic gold deposits. Miner. Depos. 2006, 40, 874–886. [Google Scholar] [CrossRef]
  8. Goldfarb, R.J.; Groves, D.I. Orogenic gold: Common or evolving fluid and metal sources through time. Lithos 2015, 233, 2–26. [Google Scholar] [CrossRef]
  9. Groves, D.I.; Santosh, M.; Goldfarb, R.J.; Zhang, L. Structural geometry of orogenic gold deposits: Implications for exploration of world-class and giant deposits. Geosci. Front. 2018. [CrossRef]
  10. Kabete, J.M.; Groves, D.I.; McNaughton, N.J.; Mruma, A.H. A new tectonic and temporal framework for the tanzanian shield: Implications for gold metallogeny and undiscovered endowment. Ore Geol. Rev. 2012, 48, 88–124. [Google Scholar] [CrossRef]
  11. Sanislav, I.V.; Kolling, S.L.; Brayshaw, M.; Cook, Y.A.; Dirks, P.H.G.M.; Blenkinsop, T.G.; Mturi, M.I.; Ruhega, R. The geology of the giant Nyankanga gold deposit, Geita Greenstone Belt, Tanzania. Ore Geol. Rev. 2015, 69, 1–16. [Google Scholar] [CrossRef]
  12. Frimmel, H.E. Earth’s continental crustal gold endowment. Earth Planet. Sci. Lett. 2008, 267, 45–55. [Google Scholar] [CrossRef]
  13. Sibson, R.H. Controls on maximum fluid overpressure defining conditions for mesozonal mineralisation. J. Struct. Geol. 2004, 26, 1127–1136. [Google Scholar] [CrossRef]
  14. Cox, S.F. Coupling between deformation, fluid pressures, and fluid flow in ore-producing hydrothermal systems at depth in the crust. In One Hundredth Anniversary Volume; Hedenquist, J.W., Thompson, J.F.H., Goldfarb, R.J., Richards, J.P., Eds.; Society of Economic Geologists: Littleton, CO, USA, 2005. [Google Scholar]
  15. Robert, F.; Poulsen, K.H.; Cassidy, K.F.; Hodgson, C.J. Gold metallogeny of the Superior and Yilgarn Cratons. In One Hundredth Anniversary Volume; Hedenquist, J.W., Thompson, J.F.H., Goldfarb, R.J., Richards, J.P., Eds.; Society of Economic Geologists: Littleton, CO, USA, 2005. [Google Scholar]
  16. Bateman, R.; Hagemann, S. Gold mineralisation throughout about 45 MA of Archaean orogenesis: Protracted flux of gold in the Golden Mile, Yilgarn Craton, Western Australia. Miner. Depos. 2004, 39, 536–559. [Google Scholar] [CrossRef]
  17. Blewett, R.S.; Henson, P.A.; Roy, I.G.; Champion, D.C.; Cassidy, K.F. Scale-integrated architecture of a world-class gold mineral system: The Archaean Eastern Yilgarn Craton, Western Australia. Precambrian Res. 2010, 183, 230–250. [Google Scholar] [CrossRef]
  18. Baker, T.; Bertelli, M.; Blenkinsop, T.; Cleverley, J.S.; McLellan, J.; Nugus, M.; Gillen, D. P-T-X conditions of fluids in the Sunrise Dam gold deposit, Western Australia, and implications for the interplay between deformation and fluids. Econ. Geol. 2010, 105, 873–894. [Google Scholar] [CrossRef]
  19. Jones, S. Contrasting structural styles of gold deposits in the leonora domain: Evidence for early gold deposition, eastern goldfields, western australia. Aust. J. Earth Sci. 2014, 61, 881–917. [Google Scholar] [CrossRef]
  20. Dirks, P.H.G.M.; Charlesworth, E.G.; Munyai, M.R.; Wormald, R. Stress analysis, post-orogenic extension and 3.01GA gold mineralisation in the Barberton Greenstone Belt, South Africa. Precambrian Res. 2013, 226, 157–184. [Google Scholar]
  21. Bédard, J.H.; Brouillette, P.; Madore, L.; Berclaz, A. Archaean cratonization and deformation in the northern Superior Province, Canada: An evaluation of plate tectonic versus vertical tectonic models. Precambrian Res. 2003, 127, 61–87. [Google Scholar] [CrossRef]
  22. Bédard, J.H. A catalytic delamination-driven model for coupled genesis of archaean crust and sub-continental lithospheric mantle. Geochimica et Cosmochimica Acta 2006, 70, 1188–1214. [Google Scholar] [CrossRef]
  23. Hamilton, W.B. Plate tectonics began in neoproterozoic time, and plumes from deep mantle have never operated. Lithos 2011, 123, 1–20. [Google Scholar] [CrossRef]
  24. Van Kranendonk, M.J. Cool greenstone drips and the role of partial convective overturn in Barberton greenstone belt evolution. J. Afr. Earth Sci. 2011, 60, 346–352. [Google Scholar] [CrossRef]
  25. Borg, G. The geita gold deposit, NW-Tanzania. Geology, ore petrology, geochemistry and timing of events. Geol. Jahrb. D 1994, D100, 545–595. [Google Scholar]
  26. Sanislav, I.V.; Brayshaw, M.; Kolling, S.L.; Dirks, P.H.G.M.; Cook, Y.A.; Blenkinsop, T.G. The structural history and mineralization controls of the world-class Geita Hill gold deposit, Geita Greenstone Belt, Tanzania. Miner. Depos. 2017, 52, 257–279. [Google Scholar] [CrossRef]
  27. Kwelwa, S.D.; Sanislav, I.V.; Dirks, P.H.G.M.; Blenkinsop, T.; Kolling, S.L. The petrogenesis of the Neoarchean Kukuluma Intrusive Complex, NW Tanzania. Precambrian Res. 2018, 305, 64–78. [Google Scholar] [CrossRef]
  28. Kwelwa, S.D.; Sanislav, I.V.; Dirks, P.H.G.M.; Blenkinsop, T.; Kolling, S.L. Zircon U-Pb ages and Hf isotope data from the Kukuluma Terrain of the Geita Greenstone Belt, Tanzania Craton: Implications for stratigraphy, crustal growth and timing of gold mineralization. J. Afr. Earth Sci. 2018, 139, 38–54. [Google Scholar] [CrossRef]
  29. Sanislav, I.V.; Dirks, P.H.G.M.; Blenkinsop, T.; Kolling, S.L. The tectonic history of a crustal-scale shear zone in the tanzania craton from the Geita Greenstone Belt, NW-Tanzania Craton. Precambrian Res. 2018, 310, 1–16. [Google Scholar] [CrossRef]
  30. Sanislav, I.V.; Wormald, R.J.; Dirks, P.H.G.M.; Blenkinsop, T.G.; Salamba, L.; Joseph, D. Zircon U–Pb ages and Lu–Hf isotope systematics from late-tectonic granites, Geita Greenstone Belt: Implications for crustal growth of the Tanzania Craton. Precambrian Res. 2014, 242, 187–204. [Google Scholar] [CrossRef]
  31. Gabert, G. Lithostratigraphic and tectonic setting of gold mineralization in the Archean Cratons of Tanzania and Uganda, East Africa. Precambrian Res. 1990, 46, 59–69. [Google Scholar] [CrossRef]
  32. Kuehn, S.; Ogola, J.; Sango, P. Regional setting and nature of gold mineralization in Tanzania and southwest Kenya. Precambrian Res. 1990, 46, 71–82. [Google Scholar] [CrossRef]
  33. Borg, G. New aspects of the lithostratigraphy and evolution of the Siga Hills, an Archaean Granite-Greenstone Terrain in NW Tanzania. Zeitschrift fur Angewandte Geologie 1992, 38, 89–93. [Google Scholar]
  34. Borg, G.; Shackleton, R.M. The Tanzania and Ne-Zaire Cratons; Oxford University Press: Oxford, UK, 1997. [Google Scholar]
  35. Borg, G.; Krogh, T. Isotopic age data of single zircons from the Archaean Sukumaland Greenstone Belt, Tanzania. J. Afr. Earth Sci. 1999, 29, 301–312. [Google Scholar] [CrossRef]
  36. Manya, S.; Maboko, M.A.H. Geochemistry of the neoarchaean mafic volcanic rocks of the geita area, NW Tanzania: Implications for stratigraphical relationships in the Sukumaland greenstone belt. J. Afr. Earth Sci. 2008, 52, 152–160. [Google Scholar] [CrossRef]
  37. Cook, Y.A.; Sanislav, I.V.; Hammerli, J.; Blenkinsop, T.G.; Dirks, P.H.G.M. A primitive mantle source for the Neoarchean mafic rocks from the Tanzania Craton. Geosci. Front. 2016, 7, 911–926. [Google Scholar] [CrossRef]
  38. Kabete, J.M.; McNaughton, N.J.; Groves, D.I.; Mruma, A.H. Reconnaissance shrimp U–Pb zircon geochronology of the Tanzania Craton: Evidence for Neoarchean granitoid–greenstone belts in the central Tanzania Region and the Southern East African Orogen. Precambrian Res. 2012, 216–219, 232–266. [Google Scholar] [CrossRef]
  39. Sanislav, I.V.; Blenkinsop, T.G.; Dirks, P.H.G.M. Archean crustal growth through successive partial melting events in an oceanic plateau-like setting in the Tanzania Craton. Terra Nova 2018, 1–10. [Google Scholar] [CrossRef]
  40. Manya, S. Petrogenesis and emplacement of the TTG and K-rich granites at the Buzwagi gold mine, northern Tanzania: Implications for the timing of gold mineralization. Lithos 2016, 256–257, 26–40. [Google Scholar] [CrossRef]
  41. Borg, G.; Lyatuu, D.R.; Rammlmair, D. Genetic aspects of the Geita and Jubilee Reef Archean BIF-hosted gold deposits, Tanzania. Geologische Rundschau 1990, 79, 355–371. [Google Scholar] [CrossRef]
  42. Skead, M.B.; Chuwa, G. Geita West Deposit—Geological and Mineralization Model; Internal AngloGold Report; Geita Gold Mine—Exploration Departmen: Geita, Tanzania, 2003; p. 26. [Google Scholar]
  43. Painter, M. Mineralisation and Structural Architecture of the Geita Hill Shear Zone; Internal AngloGold Report; Geita Gold Mine: Geita, Tanzania, 2004; p. 26. [Google Scholar]
  44. Hofmann, A.; Dirks, P.H.G.M.; Jelsma, H.A. Late Archaean foreland basin deposits, Belingwe greenstone belt, Zimbabwe. Sediment. Geol. 2001, 141–142, 131–168. [Google Scholar] [CrossRef]
  45. Thiessen, R. Two-dimensional refold interference patterns. J. Struct. Geol. 1986, 8, 563–573. [Google Scholar] [CrossRef]
  46. Fossen, H. Structural Geology; Cambridge University Press: Cambridge, UK, 2010. [Google Scholar]
  47. Bansah, D.; Chase, R.; Davidson, A.; Michael, H.; Skead, M. The Geita and Kukuluma mineralized trends, Lake Victoria Goldfield, Tanzania—Ore body characteristics and project planning. In Proceedings of the 4th International Mining Geology Conference, Coolum, Queensland, Australia, 14–17 May 2000; pp. 115–127. [Google Scholar]
  48. Skead, M.B. Geology and Structure of the Kukuluma Deposit, Geita Greenstone Belt, Tanzania; Internal AngloGold Report; Geita Gold Mine: Geita, Tanzania, 2003; p. 27. [Google Scholar]
  49. Marrett, R.; Allmendinger, R.W. Kinematic analysis of fault-slip data. J. Struct. Geol. 1990, 12, 973–986. [Google Scholar] [CrossRef]
  50. Allmendinger, R.W.; Cardozo, N.; Fisher, D.M. Structural Geology Algorithms: Vectors and Tensors; Cambridge University Press: Cambridge, UK; New York, NY, USA, 2012. [Google Scholar]
  51. Vlaar, N.J.; van Keken, P.E.; van den Berg, A.P. Cooling of the earth in the Archaean: Consequences of pressure-release melting in a hotter mantle. Earth Planet. Sci. Lett. 1994, 121, 1–18. [Google Scholar] [CrossRef]
  52. Champion, D.C.; Smithies, R.H. Chapter 4.3 Geochemistry of Paleoarchean Granites of the East Pilbara Terrane, Pilbara Craton, Western Australia: Implications for Early Archean Crustal Growth. In Developments in Precambrian Geology; van Kranendonk, M.J., Smithies, R.H., Bennett, V.C., Eds.; Elsevier: New York, NY, USA, 2007; Volume 15, pp. 369–409. [Google Scholar]
  53. Smithies, R.H.; Champion, D.C.; Van Kranendonk, M.J. Formation of paleoarchean continental crust through infracrustal melting of enriched basalt. Earth Planet. Sci. Lett. 2009, 281, 298–306. [Google Scholar] [CrossRef]
  54. Van Kranendonk, M. Two types of Archean continental crust: Plume and plate tectonics on early Earth. Am. J. Sci. 2010, 310, 1187–1209. [Google Scholar] [CrossRef]
  55. Jelsma, H.A.; Vinyu, M.L.; Wijbrans, J.R.; Verdurmen, E.A.T.; Valbracht, P.J.; Davies, G.R.; Valbracht, P.J. Constraints on Archaean crustal evolution of the Zimbabwe Craton: A U-Pb zircon, Sm-Nd and Pb-Pb whole-rock isotope study. Contrib. Mineral. Petrol. 1996, 124, 55–70. [Google Scholar] [CrossRef]
  56. Lin, S.; Beakhouse, G.P. Synchronous vertical and horizontal tectonism at late stages of Archean cratonization and genesis of Hemlo gold deposit, Superior Craton, Ontario, Canada. Geology 2013, 41, 359–362. [Google Scholar] [CrossRef]
  57. Sanislav, I.V. Porphyroblast rotation and strain localization: Debate settled!: Comment. Geology 2010, 38, e204. [Google Scholar] [CrossRef]
  58. Dirks, P.H.G.M.; Jelsma, H.A.; Hofmann, A. Thrust-related accretion of an Archaean greenstone belt in the midlands of Zimbabwe. J. Struct. Geol. 2002, 24, 1707–1727. [Google Scholar] [CrossRef]
  59. Cox, S.; Knackstedt, M.; Braun, J. Principles of structural control on permeability and fluid flow in hydrothermal systems. Rev. Econ. Geol. 2001, 14, 1–24. [Google Scholar]
  60. Porter, C. Structural Analysis and Target Generation, Kukuluma-Matandani Area, Geita Greenstone Belt, Tanzania; Internal AngloGold Report; Geita Gold Mine: Geita, Tanzania, 2002; p. 24. [Google Scholar]
  61. Schultz, R.A.; Fossen, H. Displacement–length scaling in three dimensions: The importance of aspect ratio and application to deformation bands. J. Struct. Geol. 2002, 24, 1389–1411. [Google Scholar] [CrossRef]
  62. Schultz, R.A.; Okubo, C.H.; Wilkins, S.J. Displacement-length scaling relations for faults on the terrestrial planets. J. Struct. Geol. 2006, 28, 2182–2193. [Google Scholar] [CrossRef]
  63. Ridley, J. The relations between mean rock stress and fluid flow in the crust: With reference to vein- and lode-style gold deposits. Ore Geol. Rev. 1993, 8, 23–37. [Google Scholar] [CrossRef]
  64. Schultz, R.A.; Soliva, R.; Fossen, H.; Okubo, C.H.; Reeves, D.M. Dependence of displacement–length scaling relations for fractures and deformation bands on the volumetric changes across them. J. Struct. Geol. 2008, 30, 1405–1411. [Google Scholar] [CrossRef]
  65. Weinberg, R.F.; van der Borgh, P. Extension and gold mineralization in the Archean Kalgoorlie Terrane, Yilgarn Craton. Precambrian Res. 2008, 161, 77–88. [Google Scholar] [CrossRef]
  66. Dirks, P.H.G.M.; Charlesworth, E.G.; Munyai, M.R. Cratonic extension and archaean gold mineralisation in the Sheba-Fairview Mine, Barberton Greenstone Belt, South Africa. S. Afr. J. Geol. 2009, 112, 291–316. [Google Scholar] [CrossRef]
  67. Seward, T.M. The hydrothermal geochemistry of gold. In Gold Metallogeny and Exploration; Springer: New York, NY, USA, 1991; pp. 37–62. [Google Scholar]
  68. Seward, T.M. Thio complexes of gold and the transport of gold in hydrothermal ore solutions. Geochimica et Cosmochimica Acta 1973, 37, 379–399. [Google Scholar] [CrossRef]
  69. Kerrich, R.; Goldfarb, R.; Groves, D.; Garwin, S. The geodynamics of world-class gold deposits: Characteristics, space-time distribution, and origins. In Gold in 2000; Society of Economic Geologists, Inc.: Littleton, CO, USA, 2000; Volume 13, pp. 501–551. [Google Scholar]
  70. Campbell McCuaig, T.; Kerrich, R. P—T—t—deformation—fluid characteristics of lode gold deposits: Evidence from alteration systematics. Ore Geol. Rev. 1998, 12, 381–453. [Google Scholar] [CrossRef]
  71. Likhoidov, G.G.; Plyusnina, L.P.; Shcheka, Z.A. The behavior of gold during listvenitization: Experimental and theoretical simulation. Dokl. Earth Sci. 2007, 415, 723–726. [Google Scholar] [CrossRef]
  72. Chamberlain, C.M. Geology and Genesis of the Bulyanhulu Gold Deposit, Sukumaland Greenstone Belt, Tanzania. Unpublished Ph.D. Thesis, Imperial College, London, UK, 2003; p. 410. [Google Scholar]
  73. Chamberlain, C.M.; Tosdal, R.M. U–Pb Geochronology of the Lake Victoria Greenstone Terrane, Tanzania; Anglo-Gold Ashanti internal report; Mineral Deposit Research Unit, The University of British Columbia: Vancouver, BC, Canada, 2007; p. 43. [Google Scholar]
  74. Vos, I.M.A.; Bierlein, F.P.; Standing, J.S.; Davidson, G. The geology and mineralisation at the golden pride gold deposit, Nzega Greenstone Belt, Tanzania. Miner. Depos. 2009, 44, 751. [Google Scholar] [CrossRef]
  75. Angelier, J.; Mechler, P. Sur une méthode graphique de recherche des contraintes principales également utilisable en tectonique et en séismologie: La méthode des dièdres droits. Bulletin de la Société Géologique de France 1977, 7, 1309–1318. [Google Scholar] [CrossRef]
  76. Delvaux, D.; Sperner, B. New aspects of tectonic stress inversion with reference to the tensor programme. Geol. Soc. Lond. Spec. Publ. 2003, 212, 75–100. [Google Scholar] [CrossRef]
  77. Angelier, J. Fault slip analysis and palaeostress reconstruction. In Continental Deformation; Hancock, P.L., Ed.; Pergamon: Oxford, UK, 1994; pp. 101–120. [Google Scholar]
  78. Etchecopar, A.; Vasseur, G.; Daignieres, M. An inverse problem in microtectonics for the determination of stress tensors from fault striation analysis. J. Struct. Geol. 1981, 3, 51–65. [Google Scholar] [CrossRef]
  79. Lisle, R.J. Principal stress orientations from faults: An additional constraint. Ann. Tecton. 1987, 1, 155–158. [Google Scholar]
  80. Allmendinger, R.W. Faultkinwin, Version 1.1: A Program for Analyzing Fault Slip Data for Windows™. 2001. Available online: https://www.scienceopen.com/document?vid=d520a2b8-1b84-41f7-b341-8479edd4eb19 (accessed on 21 April 2018).
  81. Cladouhos, T.T.; Allmendinger, R.W. Finite strain and rotation from fault slip data. J. Struct. Geol. 1993, 15, 771–784. [Google Scholar] [CrossRef]
  82. Molnar, P. Average regional strain due to slip on numerous faults of different orientations. J. Geophys. Res. 1983, 88, 6430–6432. [Google Scholar] [CrossRef]
  83. Twiss, R.J.; Unruh, J.R. Analysis of fault slip inversions: Do they constrain stress or strain rate? J. Geophys. Res. 1998, 101, 8335–8361. [Google Scholar] [CrossRef]
  84. Sperner, B.; Müller, B.; Heidbach, O.; Delvaux, D.; Reinecker, J.; Fuchs, K. Tectonic stress in the Earth’s crust: Advances in the world stress map project. Geol. Soc. Lond. Spec. Publ. 2003, 212, 101–116. [Google Scholar] [CrossRef]
Figure 1. Geological map of the northern half of the Tanzania Craton, showing the main geological and tectonic units: IS—Iramba-Sekenke Greenstone Belt; KF—Kilimafedha Greenstone Belt; MM—Musoma-Mara Greenstone Belt; NZ—Nzega Greenstone Belt; SM—Shinyanga-Malita Greenstone Belt; SU—Sukumaland Greenstone Belt. Super-terrane boundaries are as proposed by [27]: DBST—Dodoma Basement; ELVST—East Lake Victoria; LNST—Lake Nyanza; MAST—Mbulu-Masai; MLEST—Mwanza Lake Eyasi; MMST—Moyowosi-Manyoni; NBT—Nyakahura-Burigi. The inset map of Africa shows the location of Archaean blocks. The figure has been adapted from [25]. The red square shows the study area as shown in Figure 2.
Minerals 08 00171 g001
Figure 2. Geological map of the Geita Greenstone Belt, showing the location of the major gold deposits and the main geological terrains, lithological units, and structures (listed ages from [25,28,29]). The insert shows the study area in Figure 3. The grid is in UTM WGS84, zone 36S.
Minerals 08 00171 g002
Figure 3. (a) Geological map of the central Kukuluma Terrain, showing the position of the main gold deposits in the area. The distribution of the meta-ironstones in the area is derived from geophysics. Map projection is UTM WGS84 zone 36S; (b) Close-up view of the Matandani and Kukuluma pits. The age estimates in the legend are from [28,29,30].
Minerals 08 00171 g003
Figure 4. Summary stratigraphy for the Kukuluma terrain. Age constraints are from [28,37].
Minerals 08 00171 g004
Figure 5. Examples of shear zones in the Kukuluma terrain: (a) Closely spaced magnetite-bearing sheeted quartz veins intruded along a D1 shear zone (Kukuluma pit); (b) Planar chert ridge (right) cuts at a low-angle through primary bedding in a meta-ironstone unit along access road to Kukuluma. The chert is interpreted as a D1 shear zone; (c) Planar chert horizon east of Area 3. The margin of the chert parallels S0 in the surrounding sediments, but internally the chert is folded with mylonitic characteristics attributed to D1; (d) D5 low-angle reverse fault and associated recumbent folding in chert in Kukuluma pit; (e) Cataclasite and tectonic breccia zone along the D6 shear zone in chert in Kukuluma pit; (f) D6, Kasata shear in the northwest corner of the Matandani pit; (g) D7 fracture plane characterized by the presence of (white) sericite and sulphide alteration in artisanal workings along the western wall of Matandani pit; (h) D7 fracture plane with (white) sericite and slickenlines indicative of normal-sinistral movement in artisanal workings along the western wall of the Matandani pit.
Minerals 08 00171 g005
Figure 6. (a) Orientation of poles to the intrusive diorite-sediment contacts, as observed in the drill core and the field (N = 38); (b) Orientation of F2 fold axes in Kukuluma and Matandani pits (N = 33). Colour coding: red = southern ramp in the Kukuluma pit; blue = southwest side in the Matandani pit; green = northeast side in the Matandani pit; (c) Orientation of S3 fold axial planes (great circles) and F3 fold axes in the Kukuluma and Matandani pits. Colour coding: red = southern ramp in Kukuluma pit; orange = western ramp in Kukuluma pit; brown = northwest wall in Kukuluma pit; blue = southwest side in Matandani pit; green = northeast side in Matandani pit; (d) Orientation of S3 fold axial planes (great circles) and F3 fold axes (red dots) in the Kukuluma and Matandani pits. S3 and F3 are distributed in two clusters in either limb of D4 folds. S4 (blue great circle) equals the plane bisecting the obtuse angle = 290/65; (e) Orientation of F2 fold axes in Kukuluma and Matandani pits, in which the Kukuluma axes have been rotated clockwise by 50 degrees around an axes of 287/65, to remove the effects of D4 open folding. Colour coding: brown = rotated orientations along the southern ramp in the Kukuluma pit; blue = southwest side in the Matandani pit; green = northeast side in the Matandani pit; (f) Orientation of F3 fold axes in Kukuluma and Matandani pits, in which the Kukuluma axes have been rotated clockwise by 50 degrees around an axes of 287/65, to remove the effects of D4 open folding. Colour coding: red = rotated F3 orientations in Kukuluma pit; blue = F3 orientations in Matandani pit.
Minerals 08 00171 g006
Figure 7. Examples of fold structures in the central Kukuluma terrain: (a) Ductile, flame-like isoclinal folds in turbiditic greywacke, interpreted as folding associated with fluidization during D1; (b) Tight D3 vertical folds in ironstone in the southwest Matandani pit; (c) Close up of S3 spaced crenulation cleavage in shale; (d) Open recumbent D5 folding in chert bands.
Minerals 08 00171 g007
Figure 8. Examples of outcrop-scale D2–D3 fold interference patterns in the central Kukuluma terrain, shown as annotated pairs. Marker layers have been highlighted in yellow; the D2 fold axial trace is shown in light blue; the D3 fold axial trace is shown in red. (a,b) Vertical view of fold pair in erosion gully along the eastern face of Matandani pit; (c,d) Horizontal view of fold pair on the upper benches in the southwest corner of Matandani pit.
Minerals 08 00171 g008aMinerals 08 00171 g008b
Figure 9. Orientation and paleo-stress analysis for D6 shear zones measured in the Kukuluma and Matandani pits (N = 27). (a) Plot of fault planes and lineations, with arrows pointing in the direction of movement of the hanging wall; (b) Fault plane solution (Bingham matrix solution) for the measured D6 faults (compression dihedron in white; tension dihedron in grey). P axes are shown in blue, T axes in red. The Bingham solution shows north-south shortening with a near-horizontal σ1, and a dispersed distribution of the P and T axes, i.e., σ2 and σ3 are similar.
Minerals 08 00171 g009
Figure 10. Orientation and paleo-stress analysis for D7 fracture arrays measured in the Kukuluma and Matandani pits. For each area, the plot shows the fault planes as great circles and the lineations as arrows that point in the direction of movement of the hanging wall; these are placed on top of the fault plane solution (Bingham matrix solution) for the measured D7 faults (compression dihedron in white; tension dihedron in grey). The Bingham solutions for each data set are shown below the stereoplots. (a) West wall of Matandani pit (N = 30); (b) Northeast wall of Matandani pit (N = 13); (c) East wall of Kukuluma pit (N = 8); (d) All measurements from Kukuluma and Matandani pits combined (N = 51). All plots show north-south to northeast-southwest extension with a steep σ1, and near horizontal σ2 and σ3 orientations.
Minerals 08 00171 g010aMinerals 08 00171 g010b
Figure 11. Examples of hydrothermal, syn-D3 breccia and intrusions in Kukuluma pit: (a,b) Progressive brecciation in meta-ironstones, including a complexly folded zone with crackle breccia, in which the original folded bedding is still visible (a), and more advanced brecciation, in which individual clasts have moved, but remnants of underlying folds are visible (b); (c) Layer-parallel breccia in the core of a D3 fold; (d) Fine-grained breccia pipe transecting a folded meta-ironstone package. The inset shows hydrothermal breccia in a diorite intrusive (drill hole ID: MTRD0005-588m); (e,f) Diorite dyke (outlined with yellow stipple line) with highly irregular margins is emplaced into the breccia zone; (g,h) Irregular blebs and fragments of diorite (outlined with yellow stipple line) mixed within the breccia near the intrusive contacts of the dyke shown in (e,f).
Minerals 08 00171 g011
Figure 12. Example of a cross-section through Matandani pit, showing the ore distribution along the margin of a dioritic body (green) in contact with meta-ironstone (purple) and breccia (stipple). Other units include interbedded meta-ironstone, greywacke (light blue), and volcaniclastics (pink). The inferred position of D6 shear zones is shown with red stipple lines. The cut-off grade of the ore envelope shown in yellow is 0.5 ppm. The section is vertical and trends 060/240, right–left.
Minerals 08 00171 g012
Table 1. Summary of deformation and intrusive events that affect the Kukuluma terrain. Listed age estimates are based on [25,28,29]. Mineralization occurs during D7 events, and gold-bearing fluids are trapped in structures of D1 to D6 origin. Apy = arsenopyrite; Po = pyrrhotite; Py = pyrite.
Deform. EventIntrusive Event [Age]Description of StructuresMineralization [Trapping Structures]
D1Volcanism
(2715 Ma)
Layer-parallel shears
Growth faulting
Mineralisation trapped by Fe-rich lithologies
D2Start of emplacement of KIC:
Gabbro-diorite-monzonite suite
(2700–2680 Ma)
Non-cylindrical folding (1–500 m scale)
Formation of penetrative S2 fabric
Sills, dykes and plugs
Mineralization in F2–F3 fold hinge zones
Mineralization along diorite-ironstone contacts
D3Further emplacement
of KIC:
Gabbro-diorite-monzonite suite
(2700–2680 Ma)
Folding on 1-500 m scale
Plunge varies across F2 fold limbs
Associated with S3 axial planar cleavage that dips steeply SW
High-strain domains bound folded domains
Emplacement of KIC along D3 axial planes with S3 fabric in KIC
Extensive brecciation of D2–D3 folded ironstone near margins of KIC
Mineralization trapped along F3 fold axial planes characterized by microfracturing
Mineralization in breccia zones
D4 Open, cylindrical upright folding
Symmetric folds plunge steeply WNW
Limited S4 fabric development
D5
N-S compression
Open cylindrical recumbent folds
Low angle reverse faults with small offsets (<10 m)
Minerals 08 00171 i001Further emplacement
of KIC:
Granodiorite suite
(2680–2665 Ma)
Felsic porphyry dykes truncate D1–4 folds
D6
N-S compression
Minerals 08 00171 i001
NW to WNW trending, steeply dipping, brittle ductile shear zones.
Dextral-reverse
Fracture networks overprint F2–F3 folds and breccia zones
Associated with tectonic breccia
D6 shear zones and associated damage zones facilitate fluid infiltration and fluid-rock interaction
Emplacement of felsic dykes (2650 Ma)N trending felsic porphyry dykeMineralization overprints dykes
D7
N-S extension
Normal faulting
Reactivation of D6 shears as sinistral normal faults
D7 shear zones are mineralized, and acted as the main fluid channel ways apy-po-py ore assemblage
Minerals 08 00171 i002Granitoids plutons
(2620–2640 Ma)
Table 2. (a) Length of logged drill core expressed in metres, listed by grade and rock type for the Matandani, Kukuluma, and Area 3 west deposits. (b) Length of logged drill core expressed in % of total, listed by grade and rock type for the Matandani, Kukuluma, and Area 3 west deposits. The lithological units listed comprise chert, including massively banded chert and highly silicified laminated sedimentary units; ironstone, referring to well-bedded, silicified, magnetite-rich units including BIF (banded ironstone formations), transitional with chert; Volc, which references volcanoclastic units including agglomerate, fragmental tuff, and ignimbrite; Seds represents sediments comprising alternating siltstone–shale units, with layers of coarser-grained sandstone, grit, and rare conglomerate; Bshale, or graphitic black shale; and Diorite, representing monzonite and diorite of the Kukuluma Intrusive Complex.
(a)
DepositgradeChertIronstoneVolcSedsBshaleDioriteFPTotal
Matandani>0.1 ppm Au (m)533.44300.49112.0169.3530.2431.495.191082.21
>0.5 ppm Au (m)287.65208.3832.7629.045.4515.602.54581.42
>1.0 ppm Au (m)193.59174.7020.0418.641.5015.600.00424.07
>5.0 ppm Au (m)33.2865.179.001.000.0013.000.00121.45
Kukuluma>0.1 ppm Au (m)175.79283.0773.0792.1117.9740.470.00682.48
>0.5 ppm Au (m)111.30111.4116.2052.894.008.300.00304.10
>1.0 ppm Au (m)86.6545.983.0041.753.004.300.00184.68
>5.0 ppm Au (m)21.004.451.0015.980.0011.000.0053.43
Area 3 West>0.1 ppm Au (m)127.75265.3449.867.0017.3517.000.00484.30
>0.5 ppm Au (m)60.11128.5027.001.002.5010.000.00229.11
>1.0 ppm Au (m)37.3693.3412.700.000.004.000.00147.40
>5.0 ppm Au (m)10.2128.442.000.000.002.000.0042.65
(b)
DepositgradeChertIronstoneVolcSedsBshaleDioriteFPTotal
Matandani>0.1 ppm Au (%)49.2927.7710.356.412.792.910.48100.00
>0.5 ppm Au (%)49.4735.845.634.990.942.680.44100.00
>1.0 ppm Au (%)45.6541.204.734.400.353.680.00100.00
>5.0 ppm Au (%)27.4053.667.410.820.0010.700.00100.00
Kukuluma>0.1 ppm Au (%)25.7641.4810.7113.502.635.930.00100.00
>0.5 ppm Au (%)36.6036.645.3317.391.322.730.00100.00
>1.0 ppm Au (%)46.9224.901.6222.611.622.330.00100.00
>5.0 ppm Au (%)39.308.331.8729.910.0020.590.00100.00
Area 3 West>0.1 ppm Au (%)26.3854.7910.301.453.583.510.00100.00
>0.5 ppm Au (%)26.2456.0911.780.441.094.360.00100.00
>1.0 ppm Au (%)25.3563.328.620.000.002.710.00100.00
>5.0 ppm Au (%)23.9466.684.690.000.004.690.00100.00

