Article

The Evidence of Decisive Effect of Both Surface Microstructure and Speciation of Chalcopyrite on Attachment Behaviors of Extreme Thermoacidophile Sulfolobus metallicus

1
School of Minerals Processing and Bioengineering, Central South University, Changsha 410083, China
2
Key Lab of Biometallurgy of Ministry of Education of China, Central South University, Changsha 410083, China
3
CSIRO Mineral Resources, Clayton 3169, Victoria, Australia
4
Beijing Synchrotron Radiation Facility, Institute of High Energy Physics, Chinese Academy of Sciences, Beijing 100049, China
*
Authors to whom correspondence should be addressed.
Minerals 2018, 8(4), 159; https://doi.org/10.3390/min8040159
Submission received: 25 January 2018 / Revised: 4 April 2018 / Accepted: 9 April 2018 / Published: 13 April 2018
(This article belongs to the Collection Bioleaching)

Abstract

:
The effect of the surface microstructure and chemical speciation of chalcopyrite on the attachment behaviors of thermoacidophilic archaeon Sulfolobus metallicus was evaluated for the first time by using integrated techniques including epifluorescence microscopy (EFM) and sulfur K-edge X-ray absorption near edge structure (S K-edge XANES) spectroscopy, as well as scanning electron microscopy with energy dispersive spectrometry (SEM/EDS) and Fourier transform infrared (FT-IR) spectroscopy. In order to obtain the specific surface, the chalcopyrite slices were electrochemically oxidized at 0.87 V and reduced at −0.54 V, respectively. The EFM analysis showed that the quantity of cells attaching on the mineral surface increased with time, and the biofilm formed faster on the electrochemically treated slices than on the untreated ones. The SEM-EDS analysis indicated that the deficiency in energy substrate elemental sulfur (S0) in the specific microsize of local defect sites was disadvantageous to the initial attachment of cells. The XANES and FT-IR data suggested that the elemental sulfur (S0) could be in favor of initial attachment, and surface jarosites inhibited the adsorption and growth of S. metallicus. These results demonstrated that not only the surface microstructure but also the chemical speciation defined the initial attachment behaviors and biofilm growth of the extreme thermophilic archaeon S. metallicus.

1. Introduction

Bioleaching is as an eco-friendly and cost-effective way to extract the precious metals from low-grade ores, and was recognized as one of ten top world challenge technologies by Scientific American in 2011 [1]. In this method, bioleaching microbes oxidize ferrous ion (Fe2+) and S0 into ferric iron and sulfuric acid that attack and dissolve the rocky materials and release the metals. However, this process could be detrimental to the environment due to the formation of acid mine drainages (AMDs) in the sites of abandoned ores or tailings if it is not constrained and prevented. It is recognized that the interaction between microbe and mineral can be determined mainly by the properties of the microenvironment of the interface between mineral and microbe, including the surface microstructure and chemical speciation of mineral and extracellular polymer substances (EPSs) of the microbe. The microstructure is the crystal structure in terms of individual atoms on the surface of the mineral, and it can strongly influence the physical properties (e.g., roughness, corrosion resistance, etc.) of the mineral surface and govern the interaction between microbe and mineral [2,3,4,5,6]. To date, there have been few studies on this topic [3,4,5,6,7,8], and the microbe-mineral interfacial interaction is still unclear, especially for the case of iron- and sulfur-oxidizing archaea, whose cellular structure and physiological temperature are quite different from the mesophilic or moderate thermophilic bioleaching bacteria.
The microbe-mineral interaction includes the following processes: adsorption, growing with Fe/S oxidation, and desorption of the cells. These processes can be affected by the category of minerals, microorganisms, and environmental parameters [4]. It was also found that the redox reaction, adsorption of intermediates, and superficial interaction had decisive influences on the productivity of copper extraction [9].
Microbial adsorption on the mineral surface is the prerequisite for efficient interfacial interaction, which plays an important role during mineral dissolution [10]. It was reported that the electrostatic force and hydrophobicity, as well as the crystal lattice defect of the mineral surface can affect the adsorption behavior of microbes [11]. Specific adsorption or attachment is often mineral-selective, mediated by the bacterial EPS [12] and restricted to crystal boundary, which have higher chemical energy than normal areas and lead to the increase of internal energy and reactivity [13]. It was also reported that in the early stage of attachment, the cracks and the creviced areas of mineral surfaces are more readily corroded [14,15,16], and the electrochemically oxidized chalcopyrite surface favors bacterial attachment [5]. These studies show that the microstructure and physicochemical properties of a mineral can significantly affect the attachment behaviors of the bioleaching microbes, and consequently affect the microbe-mineral interaction.
Considering that chalcopyrite (CuFeS2) is the most abundant and refractory copper-bearing mineral [17], and S. metallicus is the thermoacidophilic archaeon that demonstrates inherent distinct advantages for the industrial application of chalcopyrite bioleaching [18,19], we used them to get insight into the correlation between the surface microstructure, the mineral speciation, and the specific adsorption behavior of the microbe. The original chalcopyrite was electrochemically corroded at specific redox potentials that were chosen based on cyclic voltammetry studies. Then, the microstructure and chemical speciation of the treated surface as well as the specific adsorption of S. metallicus were analyzed by using integrated in situ techniques including epifluorescence microscopy (EFM) and sulfur K-edge X-ray absorption near-edge structure (S K-edge XANES) spectroscopy, as well as scanning electron microscope with energy dispersive spectrometer (SEM/EDS) and Fourier transform infrared (FT-IR) spectroscopy. This research could lead to a better understanding of the molecular mechanism of the specific interaction between chalcopyrite and the thermoacidophilic archaeon S. metallicus.

2. Materials and Methods

2.1. Strain and Culture Medium

The thermoacidophilic archaeon strain S. metallicus DSM-6482 was purchased from Deutsche Sammlung von Mikroorganismen und Zellkulturen GmbH. S. metallicus is a thermophilic obligate autotrophic archaeon which grows by oxidizing ferrous iron, S0, and reductive inorganic sulfur compounds at temperatures between 65 and 80 °C [20,21]. It was activated on a rotary shaker at 65 °C in 500 mL Erlenmeyer flasks with 200 mL basal medium with 1% chalcopyrite as the sole energy source [22]. For microscopy studies, cells were cultivated in the basal medium 88 (M88) with chalcopyrite slices. The M88 medium contained 1.3 g/L (NH4)2SO4, 0.28 g/L KH2PO4, 0.25 g/L MgSO4·7H2O, 0.07 g/L CaCl2·2H2O, 0.02 g/L FeCl3·6H2O, 1.8 mg/L MnCl2·4H2O, 4.5 mg/L NaB4O7·10H2O, 0.22 mg/L ZnSO4·7H2O, 0.05 mg/L CuCl2·2H2O, 0.03 mg/L NaMoO4·2H2O, 0.03 mg/L VOSO4·2H2O, 0.03 mg/L CoSO4, and 0.2 g/L yeast extract.

2.2. Mineral Samples

The chalcopyrite sample was bought from Wantong Gao’s mineral museum in Guilin City, Guangxi Province, China. X-ray fluorescence spectroscopy (PANalytical, Eindhoven, The Netherlands) showed that the main contents of the mineral were (mass fraction): Cu 35.84%, Fe 31.03%, S 29.25%, O 3.38%, Si 0.36%, Al 0.04%, P 0.02%, Ca 0.02%, and Se 0.01%. The X-ray diffraction (XRD, PANalytical, Eindhoven, The Netherlands) analysis indicated that chalcopyrite was the main phase.

2.3. Electrochemical Experiments

The electrochemical experiments including cyclic voltammetry (CV) and potentiostatic corrosion were performed on a potentiostat PAR 283 (EG&G, Gaithersburg, MD, USA). The electrochemical cell was a 500 mL glass cell with a typical three-electrode system composed of a massive chalcopyrite electrode as the working electrode, graphite rod (99.99% purity) as the counter electrode (Johnson Matthey, Princeton, NJ, USA), and saturated silver-silver chloride electrode in a Luggin capillary as the reference electrode.
The chalcopyrite working electrode was prepared as follows. The natural chalcopyrite sample was cut by a Rock slicer JKJQ-300 (Jack Machinery Factory, Taizhou, China) to get cylindrical slices with a diameter of 1.2–1.5 cm and thickness ~0.5 cm, and as far as possible, with no visible imperfections. Each chalcopyrite slice was mounted in a polytetrafluorethylene matrix. Before conducting each electrochemical experiment, the surface of the working electrode was sequentially polished with SiC abrasive papers of different mesh number from 200 to 3500, and then it was cleaned by ultrasonic treatment in deionized water three times
Forward CV was performed with a positive-going potential scan between −0.8 V (referred to standard hydrogen electrode (SHE), the same for the following text unless otherwise stated) and +1.0 V and reverse CV with a negative-going potential scan between +1.0 V and −0.8 V at a scan rate of 5 mV·s−1. Both the forward CV and reverse CV scans started at the open circuit potential (OCP). The same electrode used in the CV experiment was then applied for potentiostatic corrosion at a set of potentials based on the CV results. The reductive potential in this study was set at −0.54 V for 10 min. To determine the suitable oxidizing potential, 0.67 V, 0.72 V, 0.77 V, 0.82 V, 0.87 V, and 0.92 V potentials were tested for potentiostatic oxidation for 1 h. All the electrochemical experiments were performed at 25 °C in 9 K basal medium (pH 1.8) with N2 (99.999%) filling the container [5]. The composition of electrolyte (e.g., anions and pH) has an important impact on the electrochemical behavior of the chalcopyrite electrode. The 9 K medium contained 1.5 g/L (NH4)2SO4, 0.01 g/L CaCl2·2H2O, 0.25 g/L MgSO4·7H2O, and 0.25 g/L KH2PO4, which could accelerate the redox reaction of chalcopyrite in solution [23,24].

2.4. Bioleaching Experiments

Bioleaching was performed on a rotary shaker at 65 °C, 170 r/min in 250 mL Erlenmeyer flasks containing 100 mL culture medium with the addition of S. metallicus. Three kinds of chalcopyrite slices were placed in Erlenmeyer flasks: oxidized at 0.87 V, reduced at −0.54 V, and without redox treatment. The initial inoculated concentration was 2 × 10⁸ cells/mL, and the initial pH was adjusted to 1.8. Abiotic experiments performed at the same conditions were carried out as sterile controls.
The mineral samples were taken out at 2-day intervals to day 10 to detect the adsorption of microbes and the morphological changes on the chalcopyrite surface. All experiments were done in triplicate.

2.5. Adsorption Behaviors Analysis

The adsorption behaviors of S. metallicus on the different surfaces of chalcopyrite slices were characterized by both initial adsorption and biofilm formation, which were observed by SEM/EDS (Quanta FEG 250, FEI, Thermo Fisher Scientific, Hillsboro, OR, USA) and EFM (DM2500, Leica, Buffalo Grove, IL, USA), respectively. The initial adsorbed cells on the mineral surface were measured in carbon atom amount (at %). The formation of biofilm was visualized by staining with DAPI (4′6-diamidino-2-phenylindole) that was dissolved in phosphate buffered saline (PBS) to a concentration of 10 μg/mL for 10 min [22]. For each EDS result, at least six spots were used for statistical analysis.

2.6. Surface Structure and Chemical Species Analyses

The surface structure—both the surface morphology and phase composition of chalcopyrite—was analyzed by SEM/EDS (Quanta FEG 250, FEI, Thermo Fisher Scientific, Hillsboro, OR, USA).
As previously described, the evolution of surface chemical species was analyzed by FT-IR spectroscopy (Nicolet 630, Thermo Fisher Scientific, Hillsboro, OR, USA) and S K-edge XANES spectroscopy. For FT-IR, samples (leaching residues) were mixed with potassium bromide (KBr) and tabletting. The same sample was measured three times, and the optimal result was adopted in order to keep the accuracy of the FT-IR. The S K-edge XANES spectra were recorded at 4B7A beam-line (medium energy X-ray beamline 2100–6000 eV), Beijing Synchrotron Radiation Facility (BSRF), Beijing, China, in fluorescence mode at ambient temperature and scanned at step width of 0.2 eV from 2456 to 2498 eV [25,26]. The XANES spectra were normalized to the maximum of the absorption jump and fitted by the linear combination of reference spectra with the IFEFFIT program as previously described [27]. The R-factor is one of the statistical measures to evaluate the degree of fitting between empirical data and a corresponding model, and if the R-factor <0.02, then a good result was obtained.

3. Results

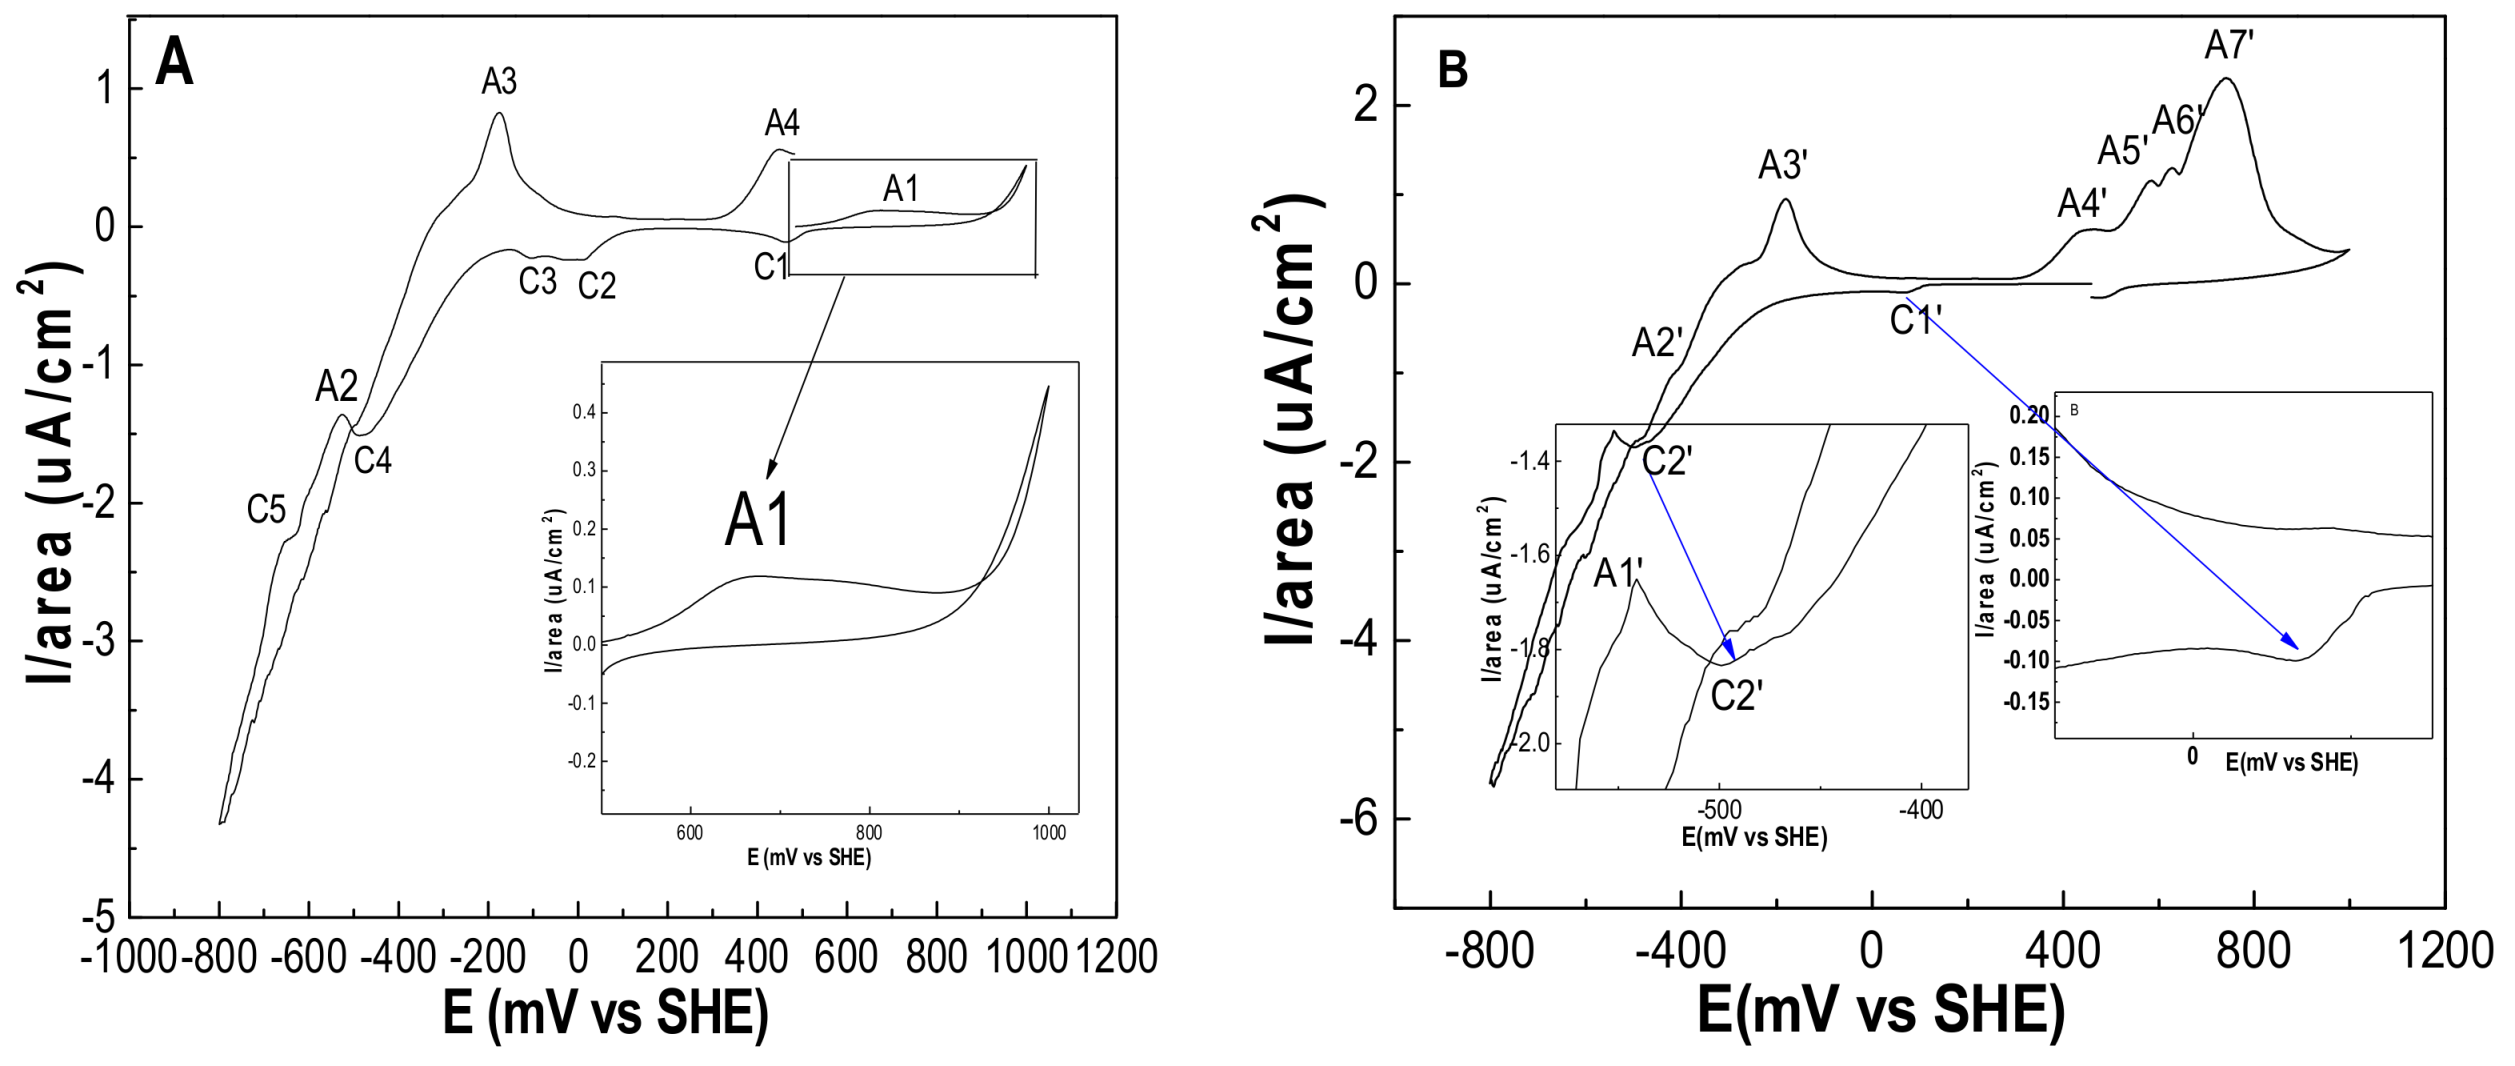
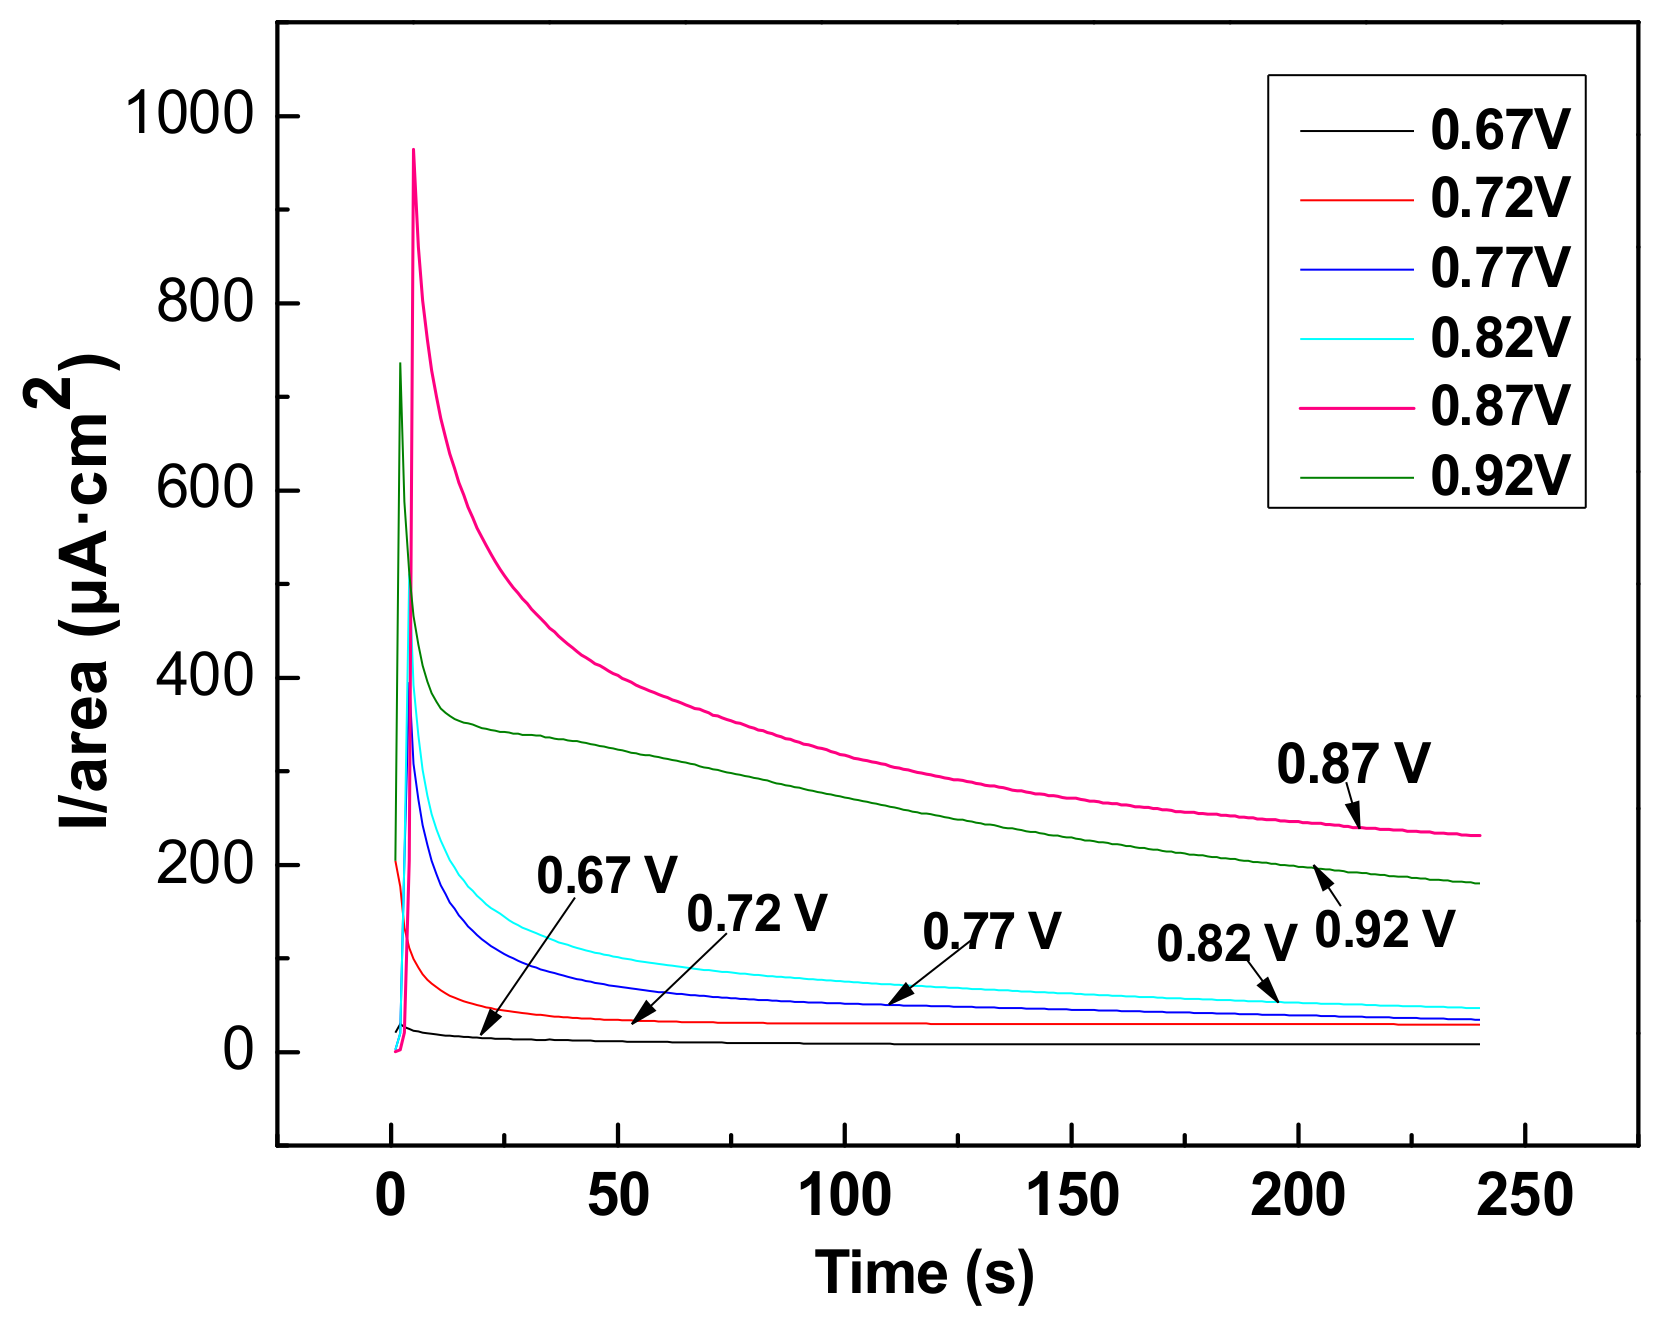
3.1. The Electrochemical Study and Characterization of Chalcopyrite

Both forward and reverse CV curves for chalcopyrite electrodes are shown in Figure 1. In the forward CV, A1 at about 0.67 V was the initial anodic peak, which was called the “prewave” by Xia et al. [5]. A1 represented the beginning of the oxidizing reaction on the surface of chalcopyrite and non-stoichiometric amorphous products that lacked Fe/S according to Price et al. [6] (see Equation (1)). In the reverse CV, two cathodic peaks C1 and C2 appeared at −0.07 V and −0.54 V, which were in accordance with the observation in Ref. [5] (see Equation (2) below):
CuFeS2 → Cu1-xFe1-yS2-z + xCu2+ + yFe2+ + zS0 + 2(x − y) e
2CuFeS2 + 6H+ + 2e→ Cu2S + 2Fe2+ + 3H2S
In order to get different surface structures of chalcopyrite and study the characteristics of selective attachment of S. metallicus, the potentials for a range of the anodic peaks were chosen to carry out potentiostatic corrosion. On account of the uncertain value of the A1 peak, a series of potentials of potentiostatic corrosion were carried out as shown in Figure 2, in order to obtain the optimal potential. The result showed that the electricity variation at 0.87 V was manageable to alter and it was suitable for the following corrosion experiments.
Prior to the cell adsorption experiment, the chalcopyrite electrodes were characterized by SEM/EDS. Before potentiostatic oxidation, each mineral slice was polished and cleaned in order to get closely identical sample surfaces. The results (Figure 3) showed that the chalcopyrite surface treated at 0.87 V and −0.54 V changed obviously, and the one treated at −0.54 V was corroded much more seriously. The normalized molecular formula of several regions on the mineral surface were calculated based on Cu, and they were CuFe0.99S2.05 for the untreated case, CuFe1.03S2.16 for the case treated at 0.87 V, and CuFe0.30S0.72 for the case treated at −0.54 V, indicating that the surface treated at 0.87 V was somewhat enhanced in the content of S, whereas there was a distinct deficiency in S and Fe for the surface corroded at −0.54 V.

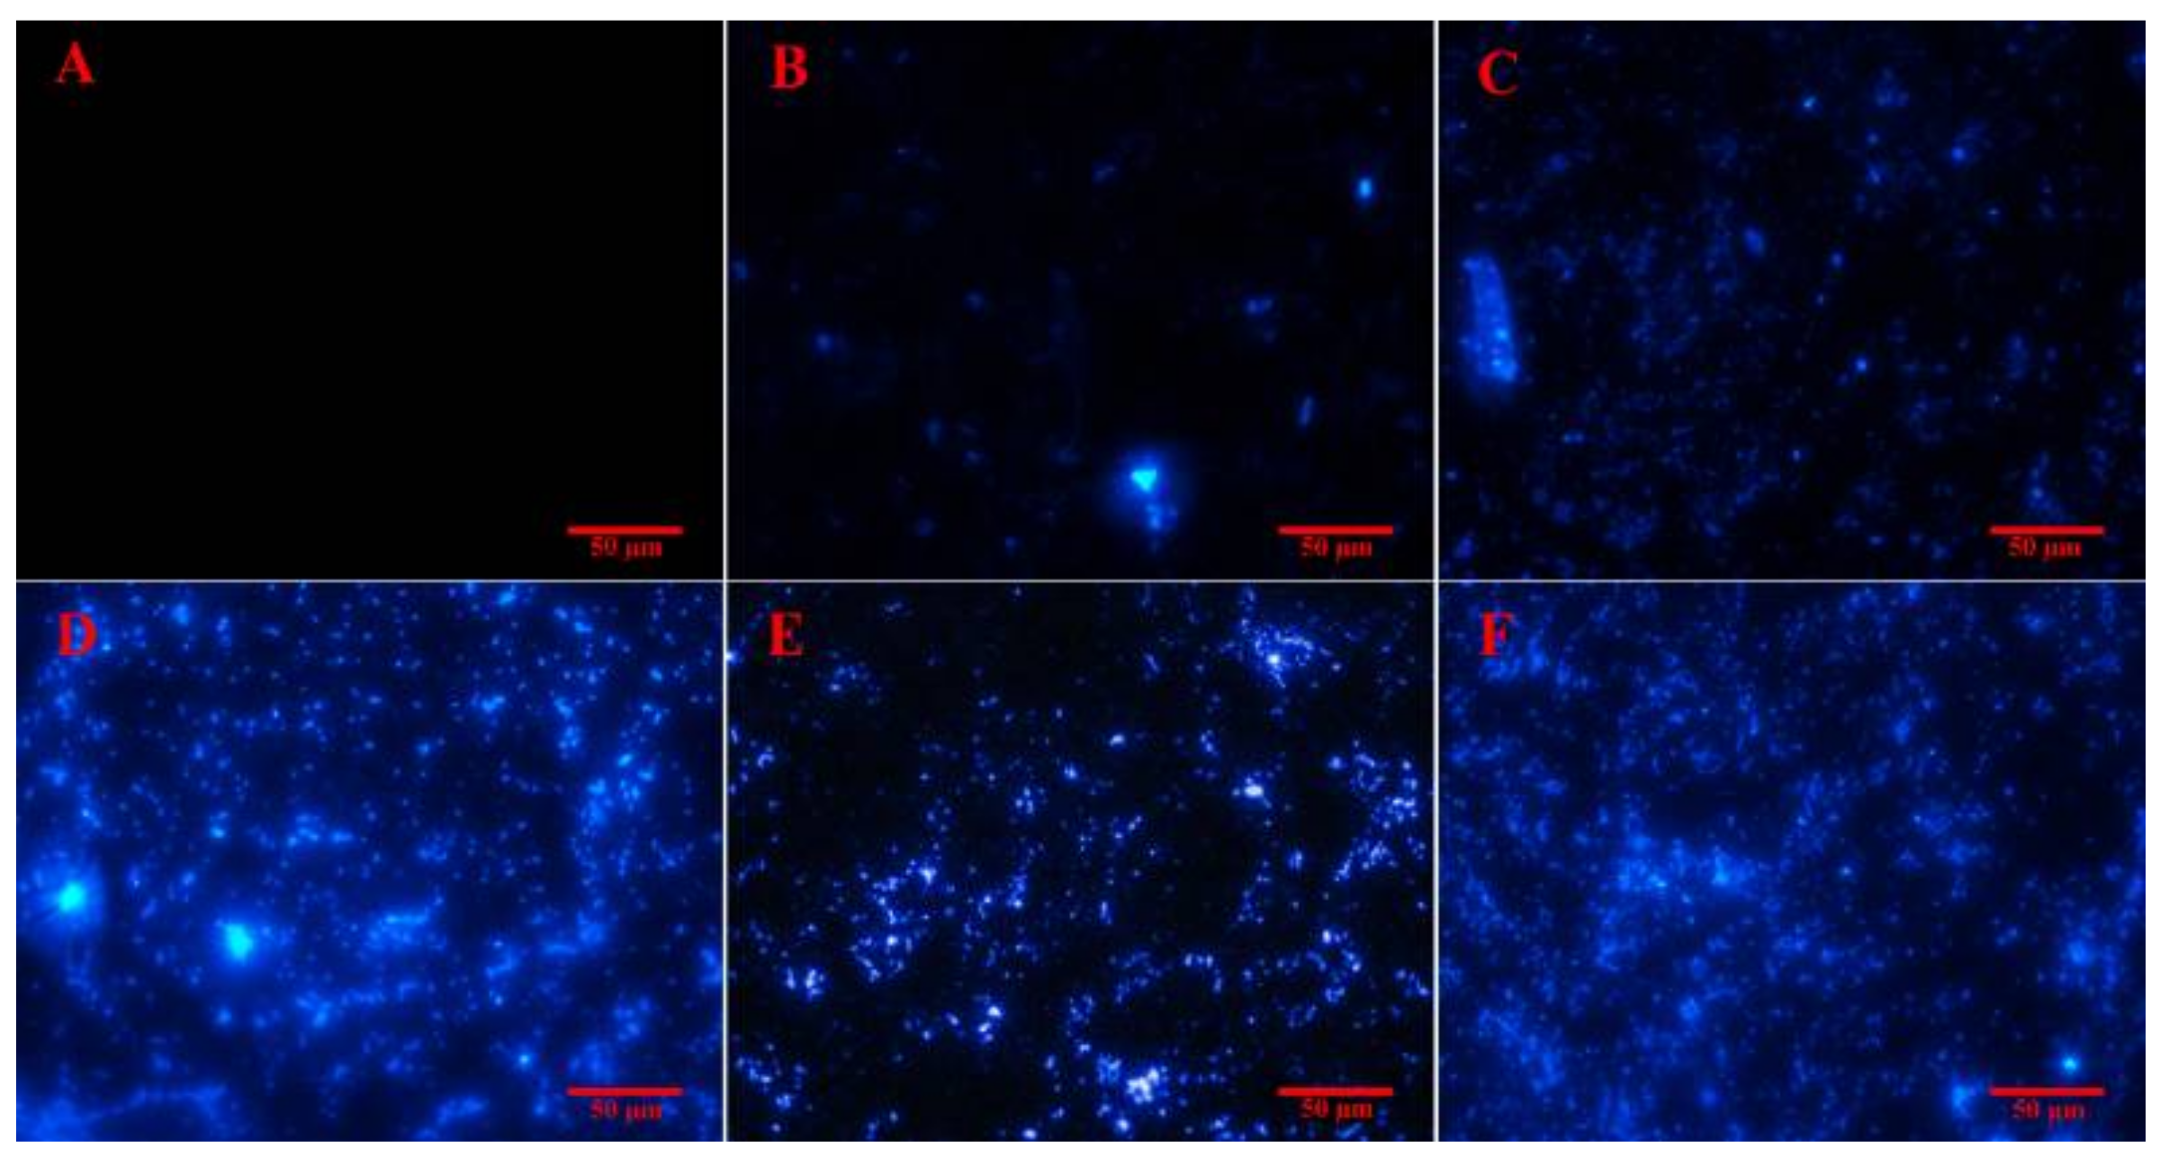
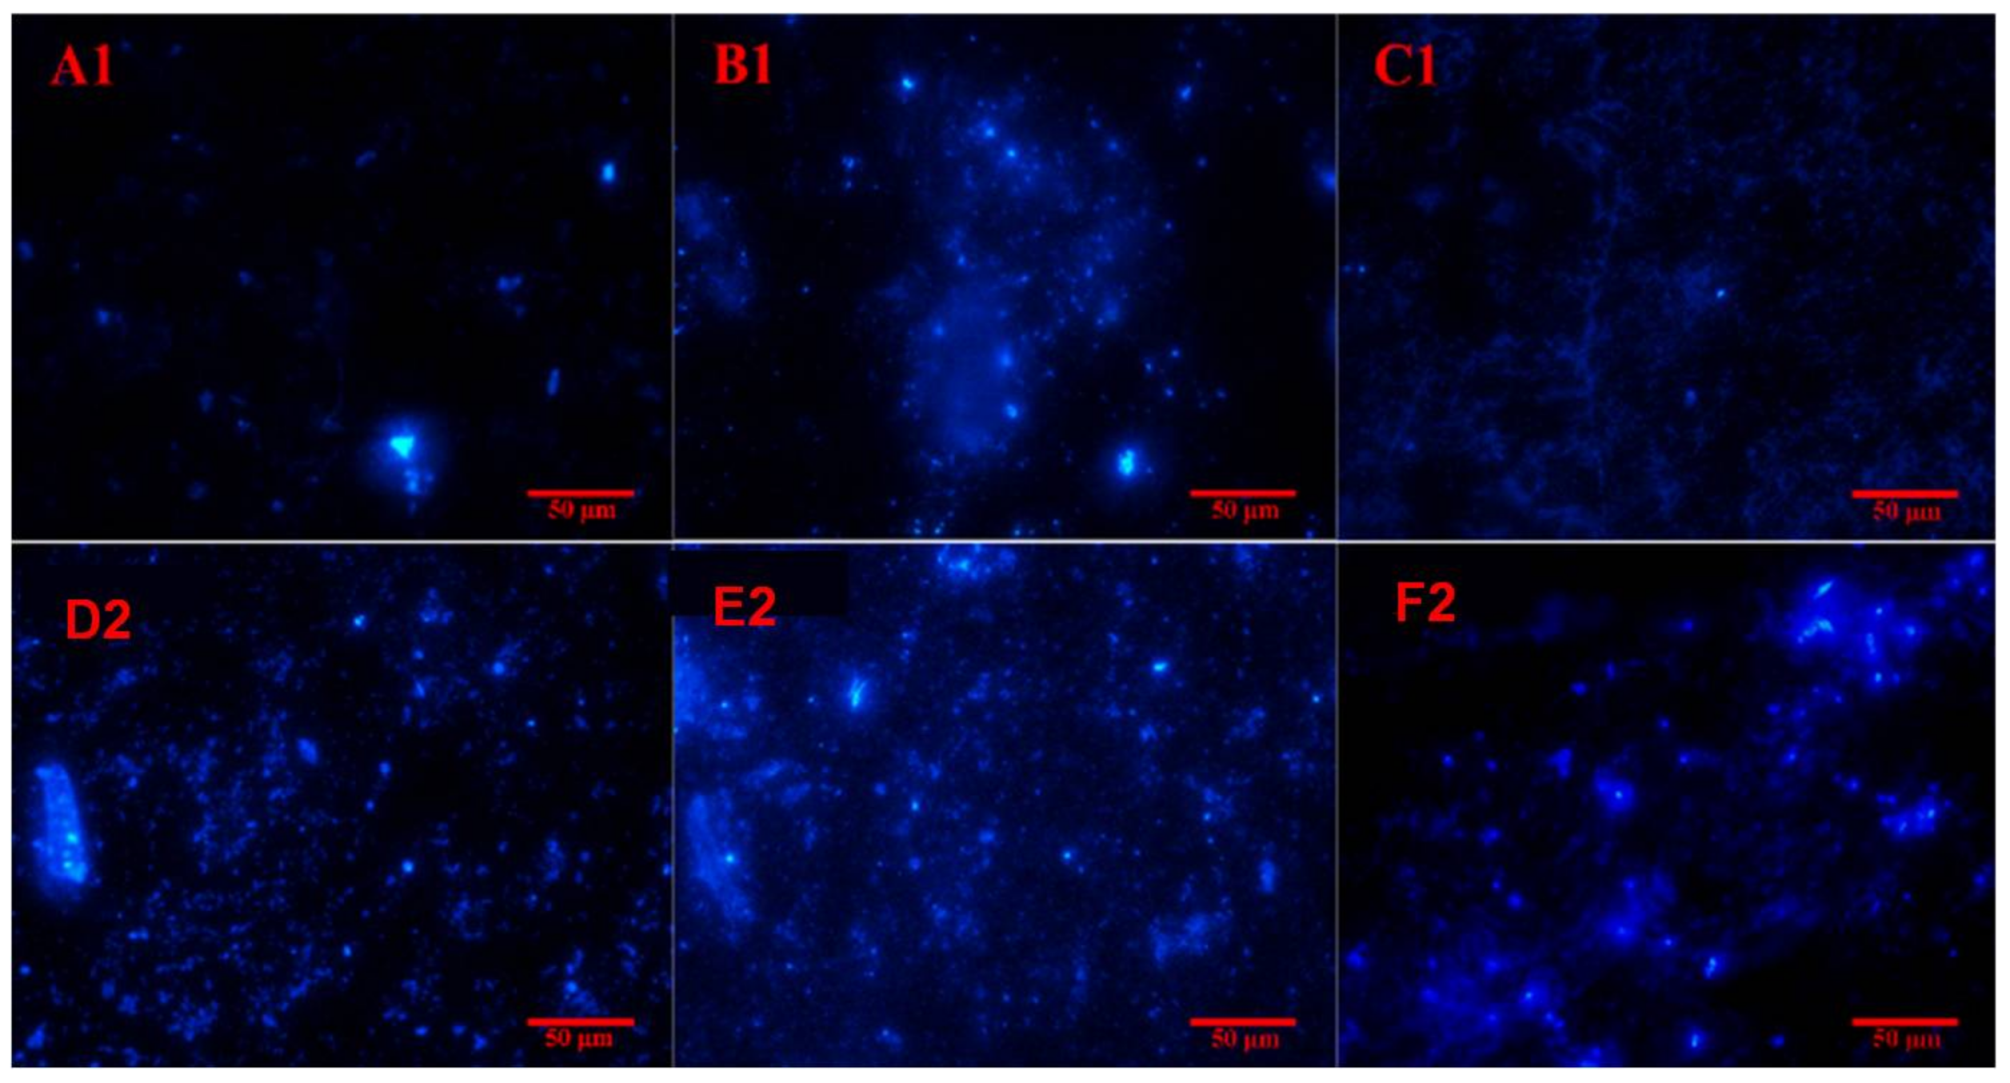
3.2. Cell Attachment and Biofilm Formation on Chalcopyrite Surface

The characterization of the attachment capacity of S. metallicus on the chalcopyrite surface was performed by EFM and FT-IR. The results (Figure 4) showed that the adsorption quantity of cells on the mineral surface increased with leaching time until day 6 when a biofilm formed.
By microscopically comparing the initial attachment of cells on the three chalcopyrite surfaces (Figure 5), it was found that the adsorption quantity of cells on the mineral surface became different starting on day 2, which was characterized by the blue bright spots of DAPI selectively stained DNA [14]. The bright blue spots at day 2 on the untreated surface were much less than those on the surfaces treated at 0.87 V (Figure 5B) and −0.54 V (Figure 5C), and those on the surfaces treated at 0.87 V were more than surfaces treated at −0.54 V. Thus, the adsorption quantity at day 2 was observed in the order: chalcopyrite treated at 0.87 V > chalcopyrite treated at −0.54 V >> untreated chalcopyrite. The same order was found at day 4, but from day 6 the cell quantities in the biofilm on the three mineral surfaces could not be clearly differentiated through EFM (data not shown). Therefore, other methods were adopted to characterize the evolution of cell absorption and surface morphology.
By using FT-IR spectroscopy, the functional groups as well as cell quantities on the chalcopyrite surfaces were examined. The results of sterile controls for the chalcopyrite surface (Figure 6A) showed that there was no FT-IR absorption for the untreated chalcopyrite surface, and there was some absorption near 711.6 cm−1 that could be assigned to the stretching band of Fe–O for the case of treated at 0.87 V, and there was some absorption near 1000 cm−1 that could be assigned to the stretching band of S–O for the case of surface treated at −0.54 V. For the bioleached chalcopyrite surfaces (Figure 6B–D), it was found that there were typical proteins bands near 1634 and 1539 cm−1 (amide I and amide II) [28]. The –NH2 and –OH broad bands were also found near 3000–3400 cm−1, as well as the –CH2 stretching band near 2850 cm−1 [29]. These peaks indicated the occurrence of biomass. At the same time, there was a S–O bending vibration band at 1000–1200 cm−1 that could be assigned to SO42−, and –NH vibration peaks at 1415 (Figure 6C) and 1427 cm−1 (Figure 6D) that could be assigned to ammonium, which were similar to that of potassium jarosites and ammonium jarosites [30]. It is clear that both biomass and jarosites increased much more with bioleaching at the two treated surfaces cases (Figure 6C,D) than that in the untreated surface case (Figure 6B).
By further comparing the FT-IR results for the two treated surfaces cases (Figure 6C,D), for the surface treated at 0.87 V, both biomass and jarosites were formed quickly in the early stage corresponding to the S-rich environment constructed by electrochemical corrosion (Figure 6C). On the contrary, the biomass and jarosites were slowly formed in the early stage on the surface treated at −0.54 V with a deficiency in S/Fe (Figure 6D). This indicates that the surface S species promoted the cell growth and the interaction between microbe and mineral. It was apparent that both cell attachment and surface structure were non-homogeneous (Figure 4 and Figure 5), which could reflect the effect of surface structure (richness or deficiency in S) on cell adsorption, in accordance with the surface chemical species as shown in Table 1 and Table 2 in the following section.

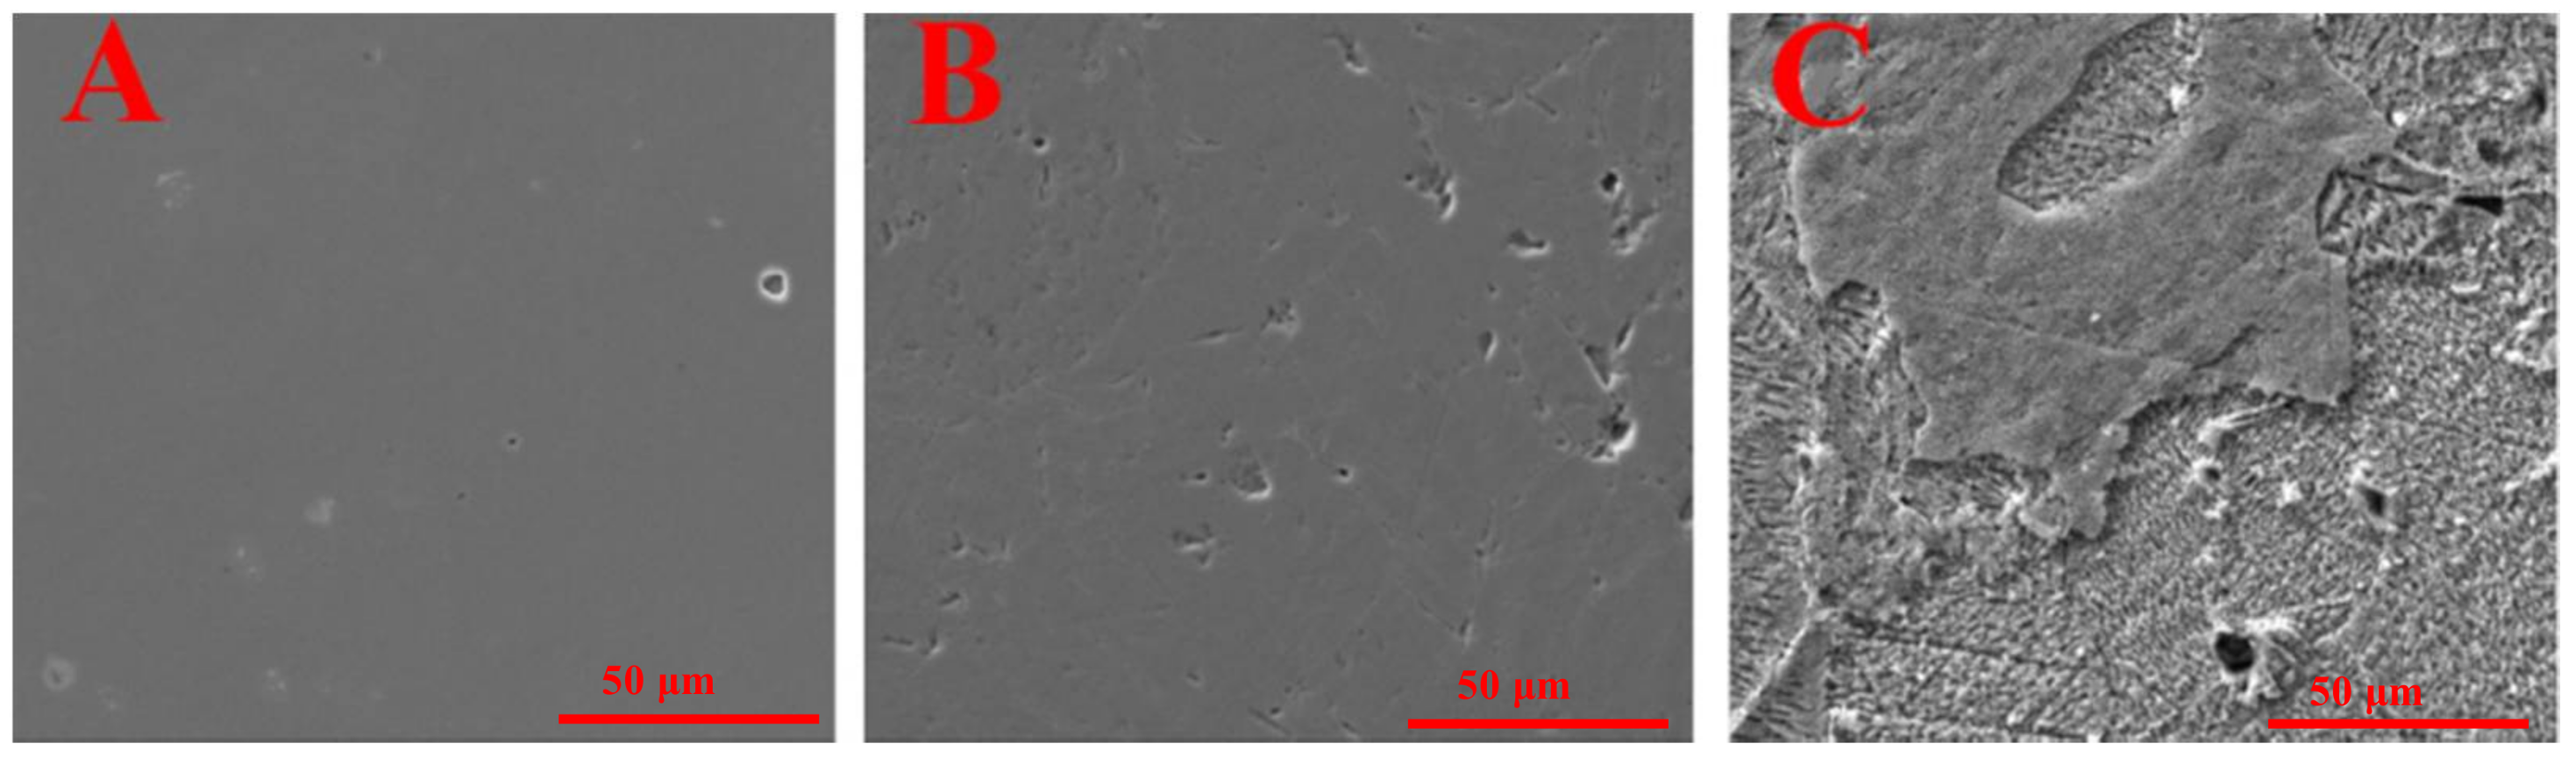
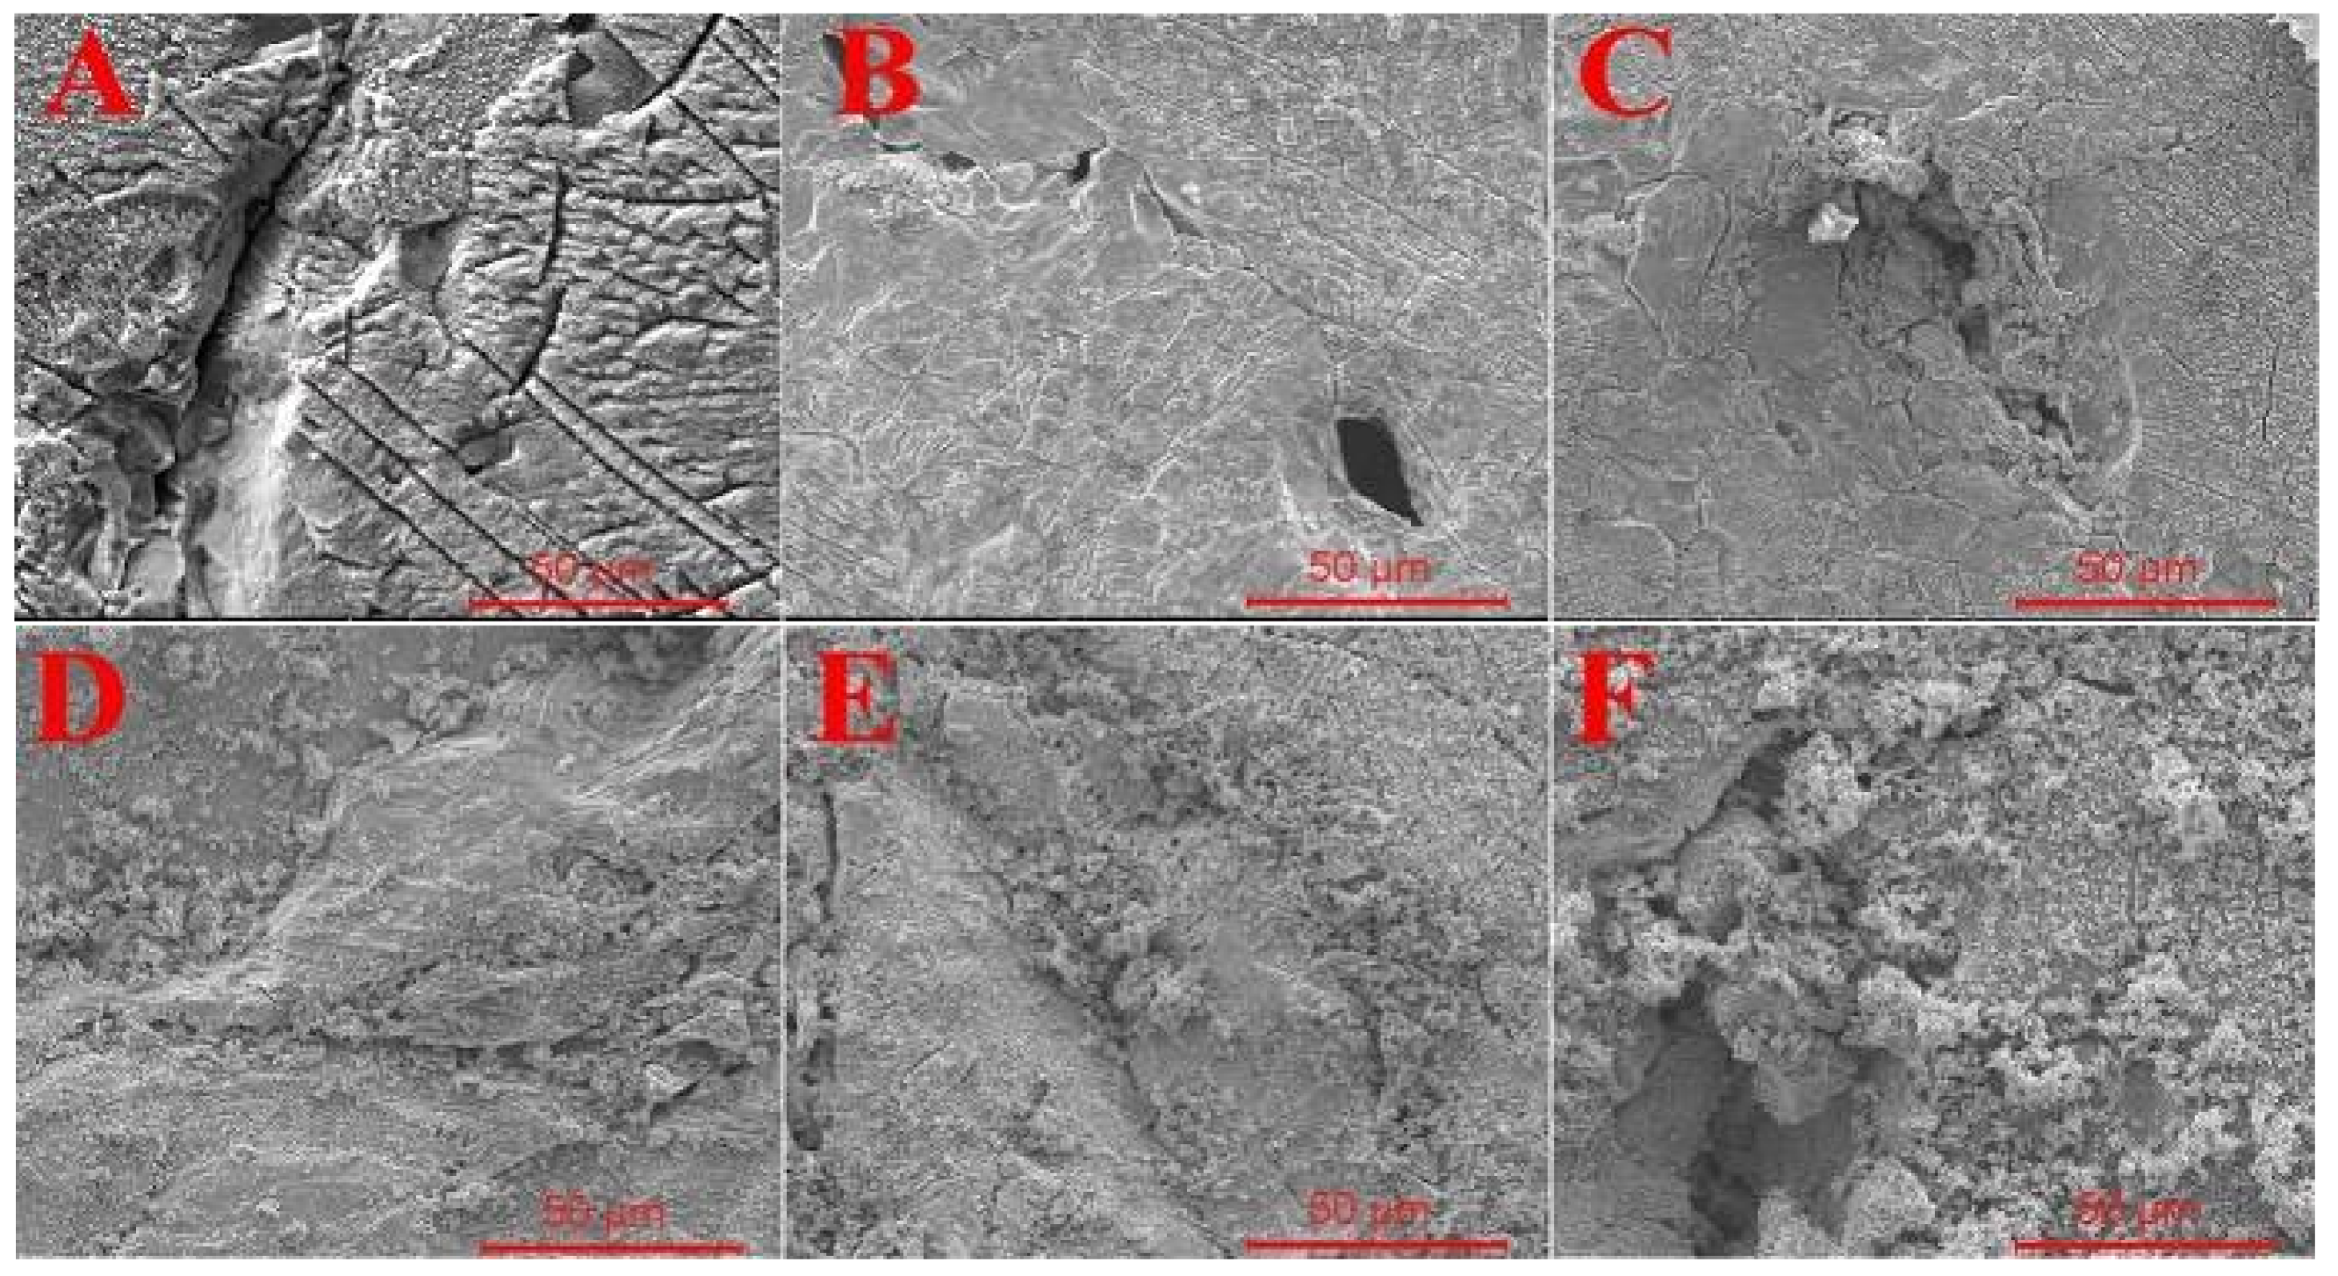
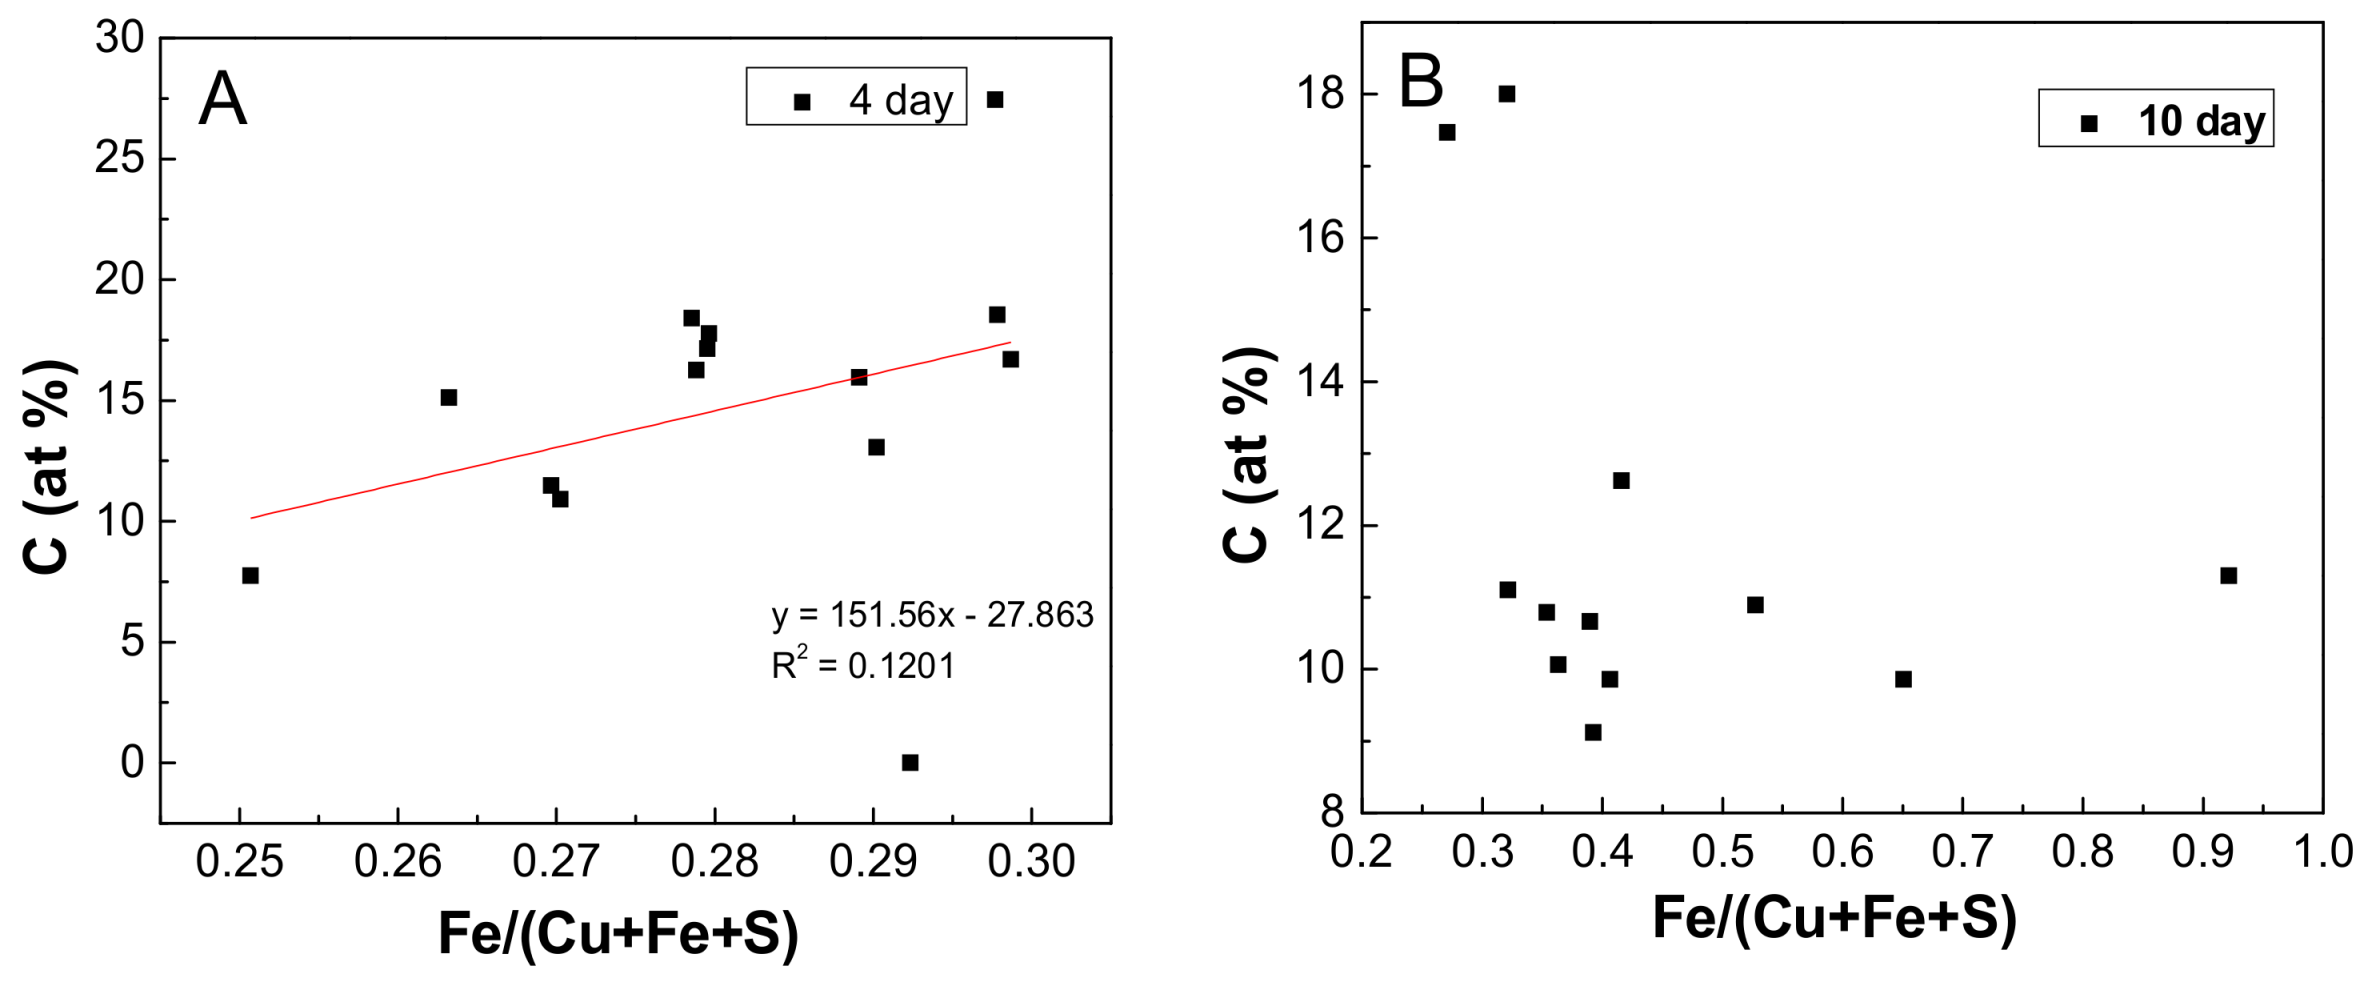
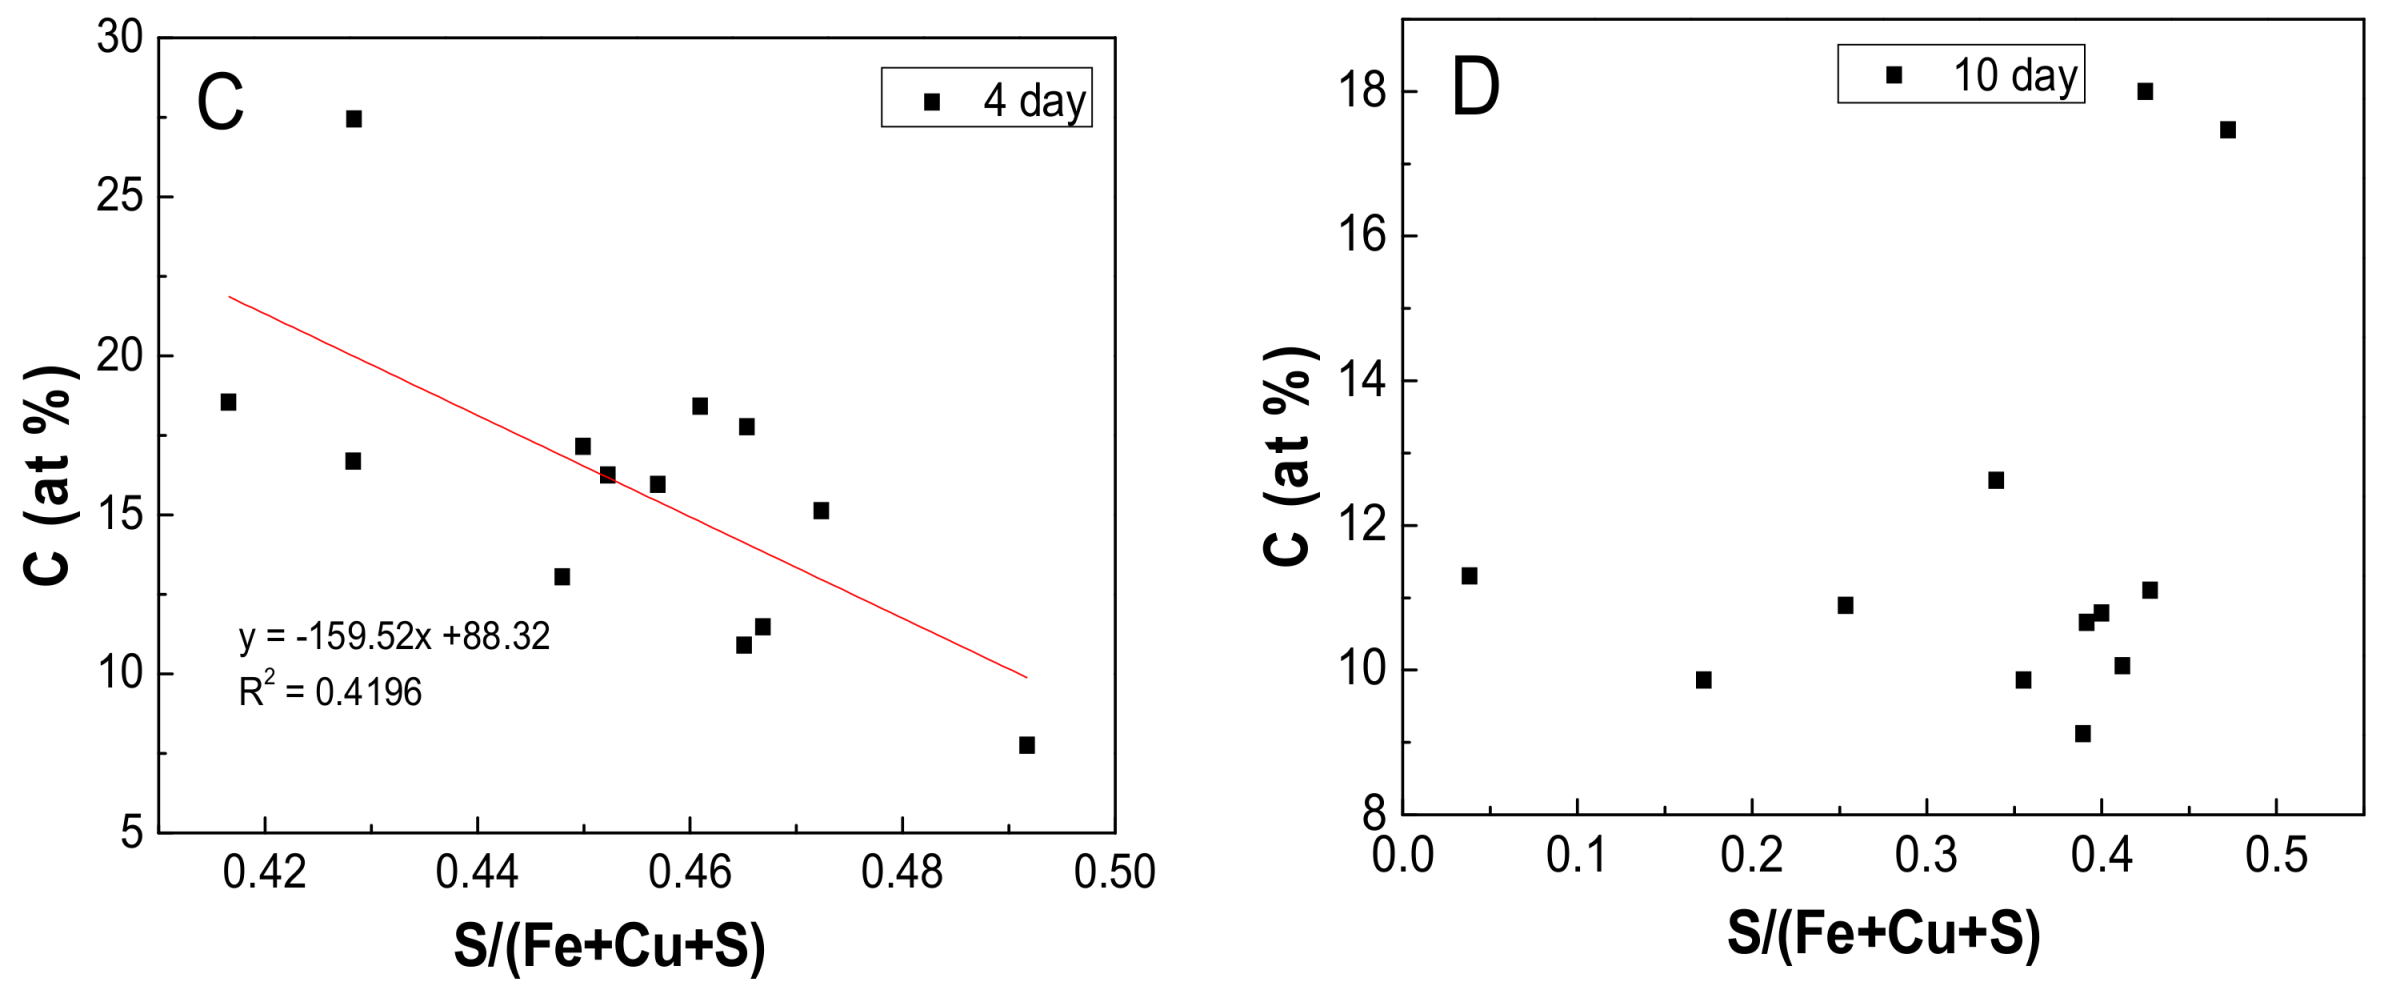
3.3. Analysis of Mineral Surface Morphology and Elemental Composition

To study the bioleaching process, the SEM/EDS results of chalcopyrite slices were analyzed to characterize the changes in mineral morphology, surface elemental composition, and surface content of cells.
The change in mineral surface morphology for the case treated at −0.54 V is shown as an example in Figure 7. It showed that during bioleaching the degree of surface corrosion gradually increased and the cell accumulation was visible from day 6. The cell adsorption on the creviced area was much greater than that on the flat area. The change in normalized surface elemental composition (CuxFeySz) and surface content of cells (could be roughly seen as the content of surface carbon (C), C %) for all three different surface cases are shown, respectively, in Table 1 for the creviced area and Table 2 for the flat area. The results showed that in the creviced region the content of C (i.e., the cell quantities) was generally greater than that in the flat area for all three different surfaces. Comparing more detail of C % for each kind of area for the three different surfaces, it was found that before day 2, the cell quantities followed the order for both the creviced and flat area: chalcopyrite treated at 0.87 V > original chalcopyrite > chalcopyrite treated at −0.54 V. Since day 2, the cell quantities on the flat area followed the order: chalcopyrite treated at 0.87 V > chalcopyrite treated at −0.54 V > original chalcopyrite, which was consistent with the results of EFM, and in the creviced area followed the order: chalcopyrite treated at 0.87 V > original chalcopyrite > chalcopyrite treated at −0.54 V. This means that in the early stage of bioleaching (i.e., initial cell adsorption), the area’s deficiency in S led to lower cell adsorption, but after that (i.e., during the bioleaching process), the surface with crystal defect resulting from electrochemical corrosion was more readily attacked [5,14,15,16], so the content of C on the two treated surfaces was much higher than the untreated one. It should be noted that for the creviced area the content of C was just dependent on surface energy substrates S0 during initial cell adsorption and the bioleaching process. This suggests that the interaction between microbe and mineral could be determined by both surface microstructure and chemical speciation.
Based on further analysis of the normalized molecular formula and the change of surface element composition (Table 1 and Table 2), it was clear that during bioleaching the changes in surface chemical composition of chalcopyrite for the three cases were quite different. For the case treated at −0.54 V, the surface chemical composition of chalcopyrite increased greatly in S and Fe in the early stage (i.e., CuFe0.24S0.69 to CuFe0.67S1.68 in 1 h and to CuFe0.96S1.66 at day 2). After that, the content of Fe increased slowly, meaning that in the early stage the surface Cu released quickly, which was most probably under attack by H+, and then attacked by Fe3+. For the case treated at 0.87 V, the surface content of S decreased gradually and the Fe increased from beginning. For the untreated case only, the surface content of S decreased gradually while the contents of Fe and Cu changed little from starting values, meaning that the bioleaching effect was not obvious, explaining the much lower IR absorption compared to the other two electrochemically treated cases. It is also noted that according to the changes in the content of C, it could be derived that the initial attachment of cells for the case treated at −0.54 V lasted until day 2, and that for the other two cases could be finished in 1 h as observed in [5]. That could explain the much smaller change in FT-IR before day 2 for the case treated at −0.54 V (Figure 6D). By combining the results of SEM/EDS and FT-IR, it is clear that the change in surface chemical composition is strongly related to the change in cell quantities on the surface, both of which resulted from the differences in the mineral-microbe interaction.
In order to evaluate the effect of available S and Fe species on the mineral–microbe interaction, the relationship between the content of C and the ratio S/(Cu+Fe+S) or Fe/(Cu+Fe+S) was analyzed. In Figure 8, the content of C increased with the ratio Fe/(Cu+Fe+S), and decreased with the ratio S/(Cu+Fe+S) at day 4, owing to the fact that S. metallicus is more likely to utilize the S0 and reductive inorganic sulfur compounds on the treated surface, and the utilization of surface S0 could lead to the increase in ratio Fe/(Cu+Fe+S) and decrease in ratio S/(Cu+Fe+S). Such a trend was not obvious at day 10. This may be due to the formation of the jarosites as discussed in the FT-IR results (Figure 6), which covered the mineral surface and could not be utilized by microbes.

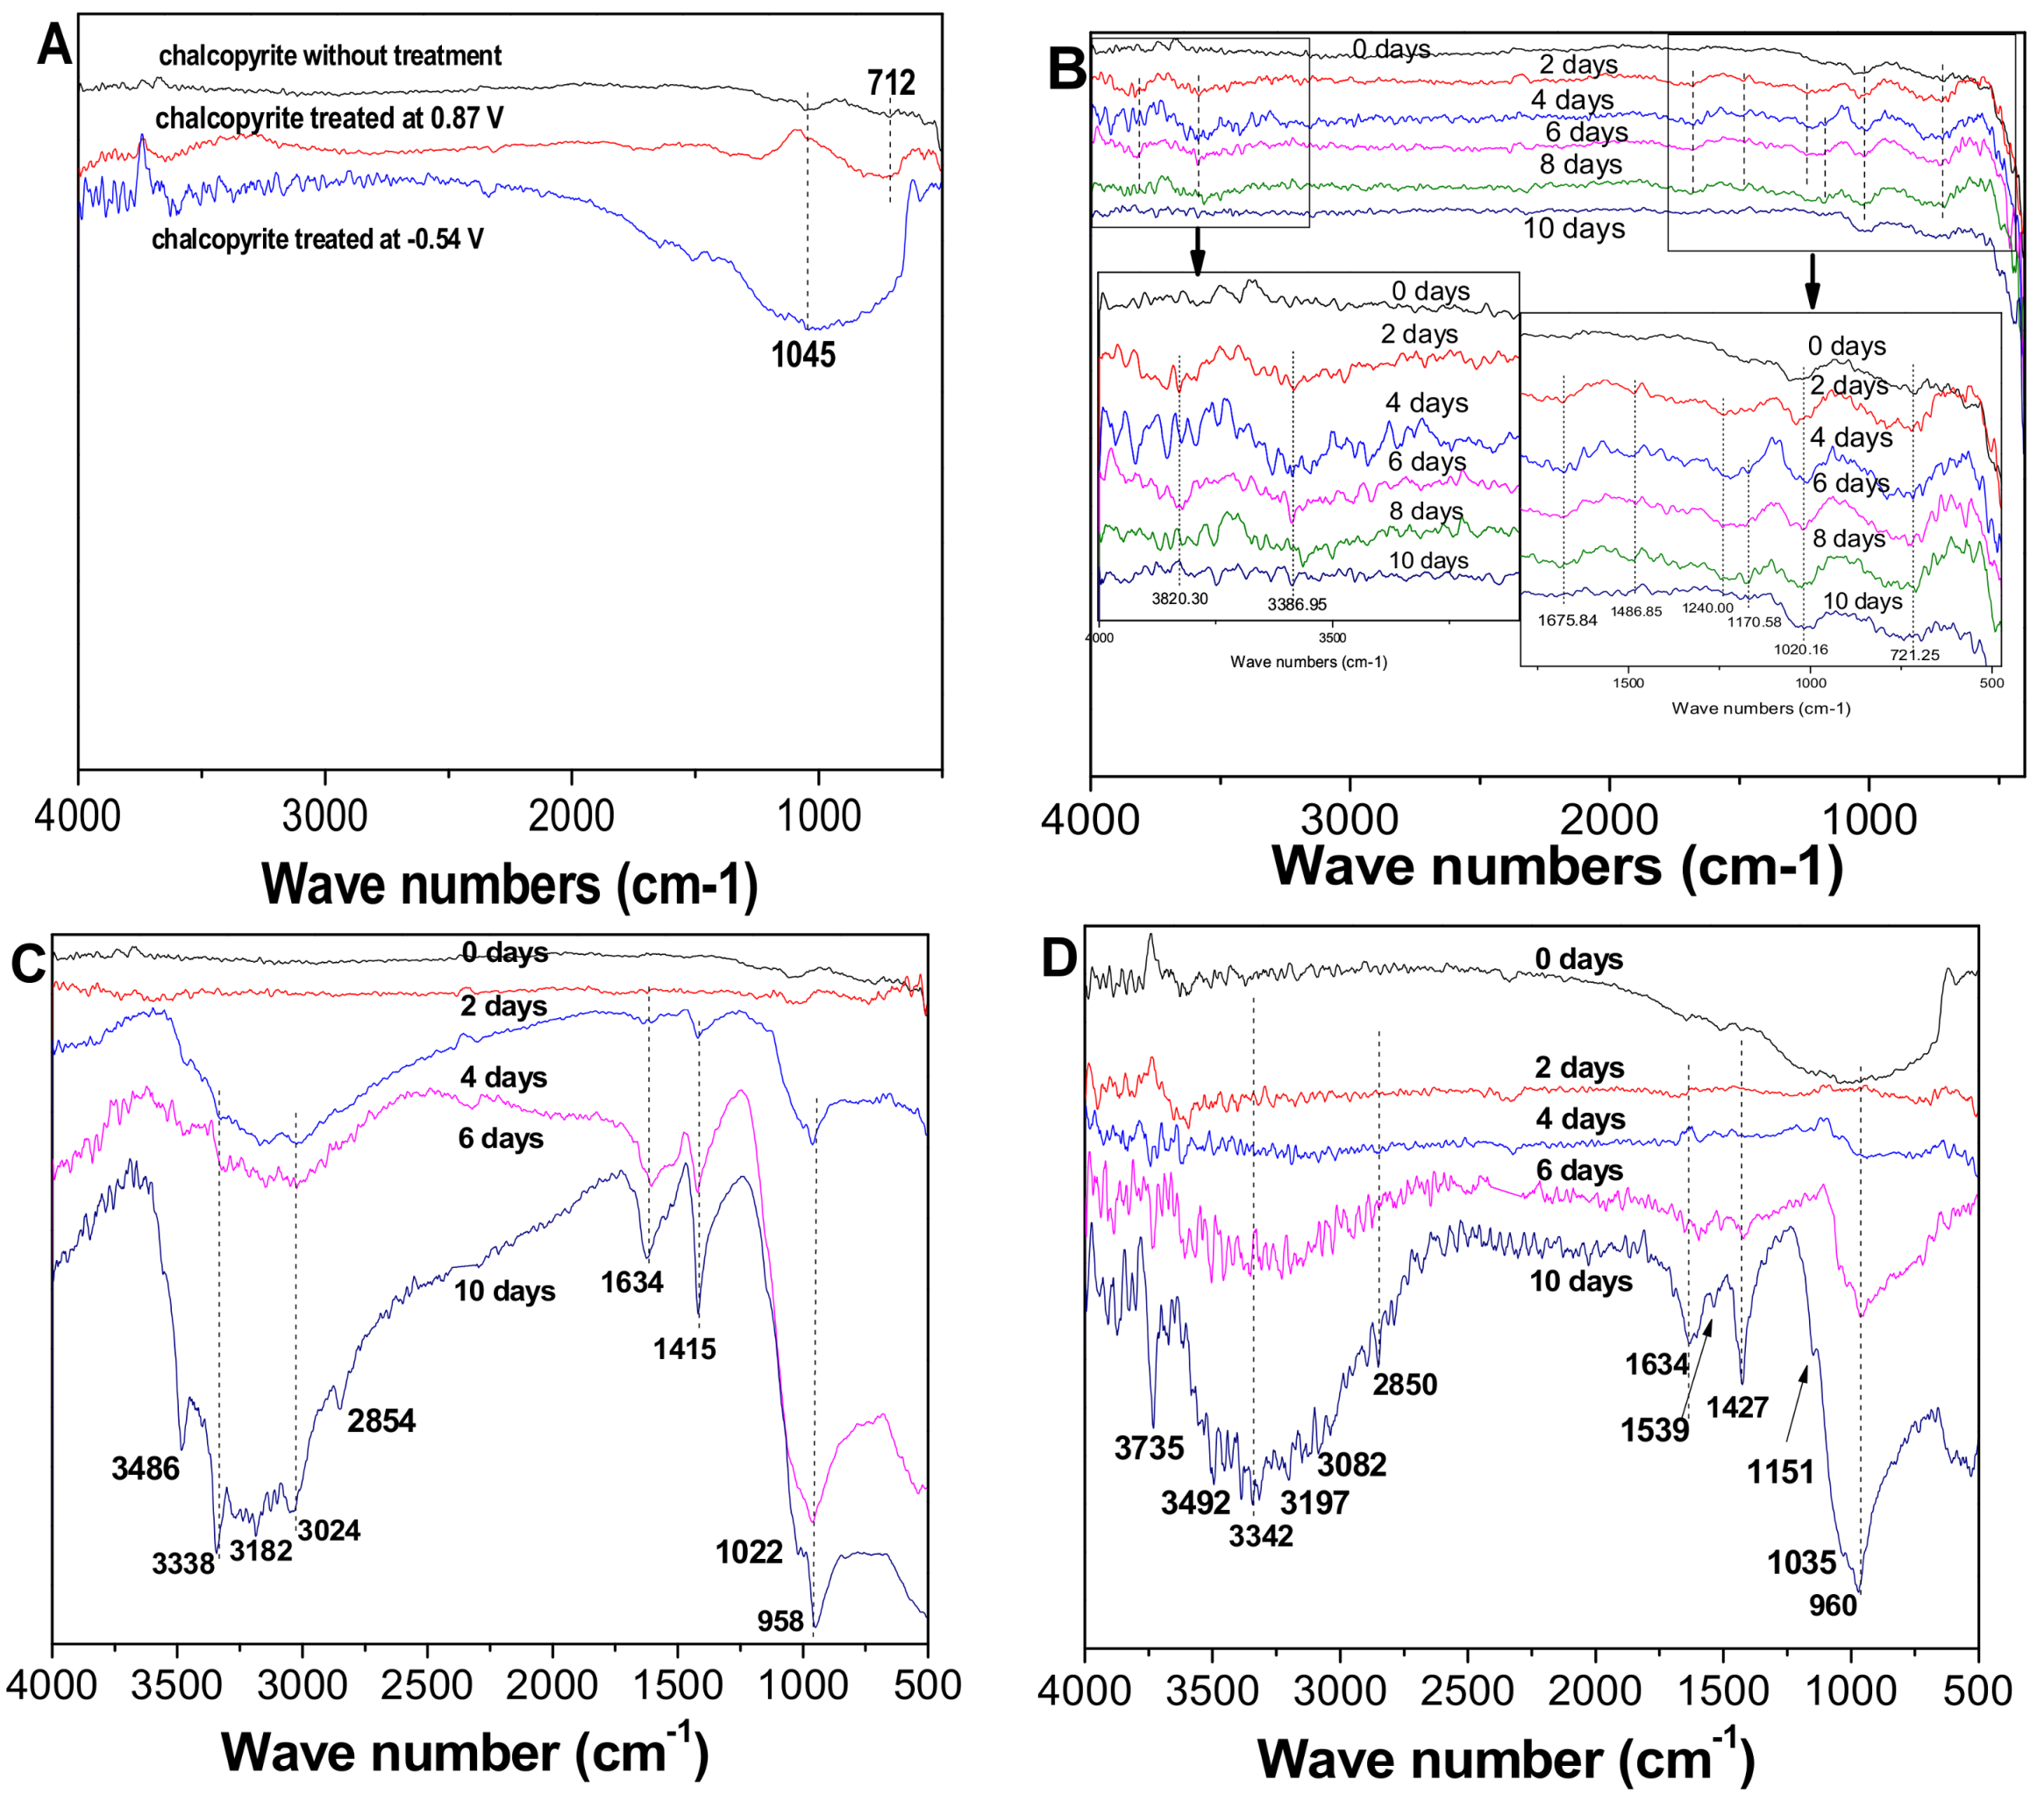
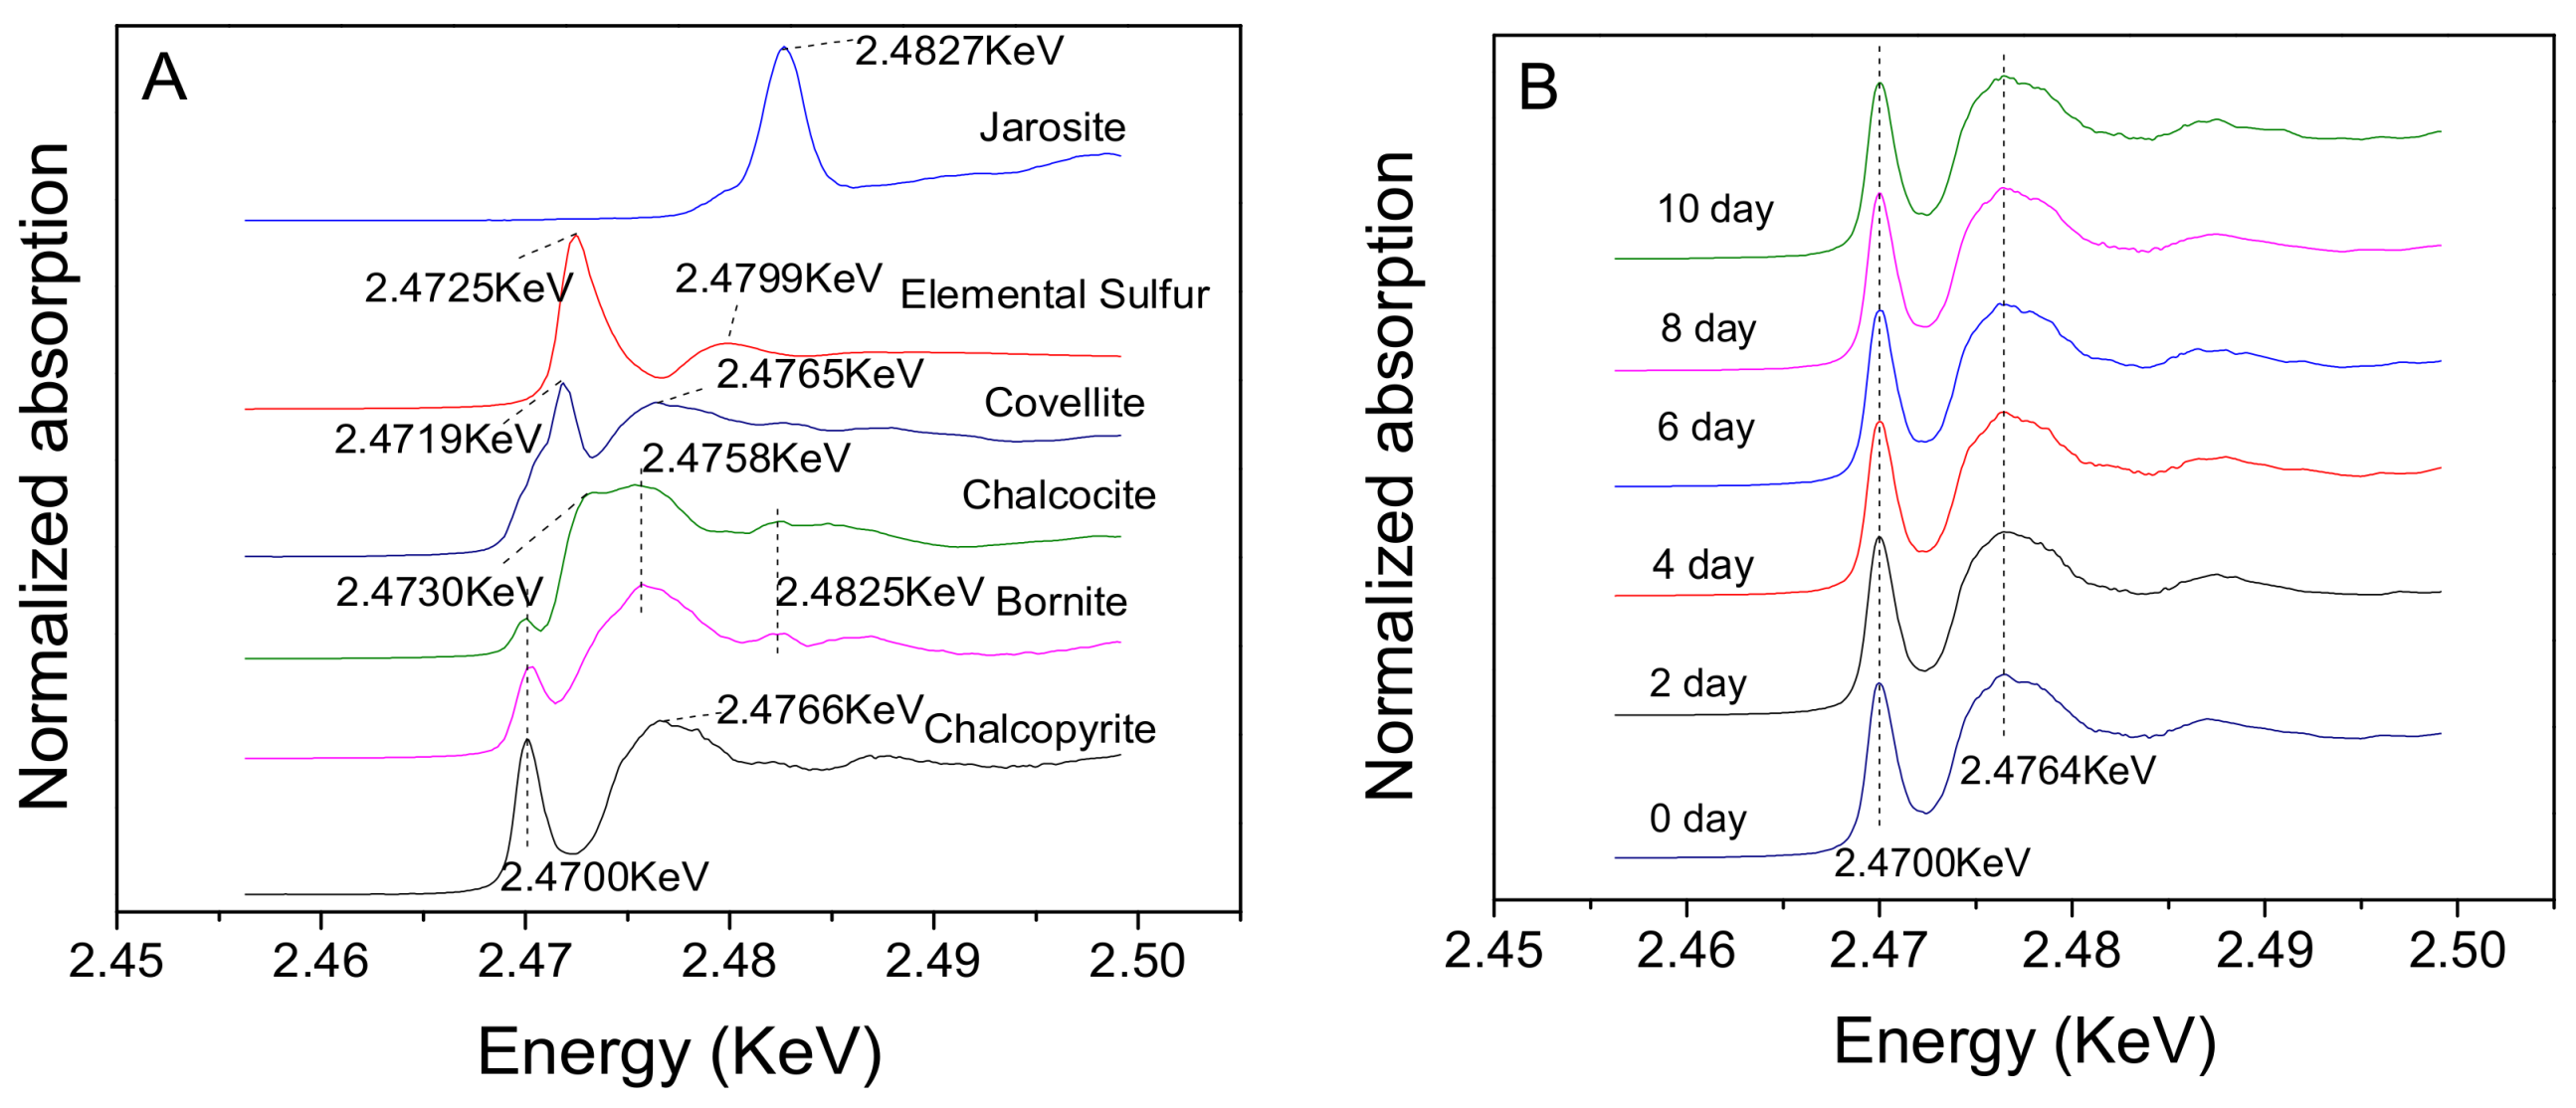
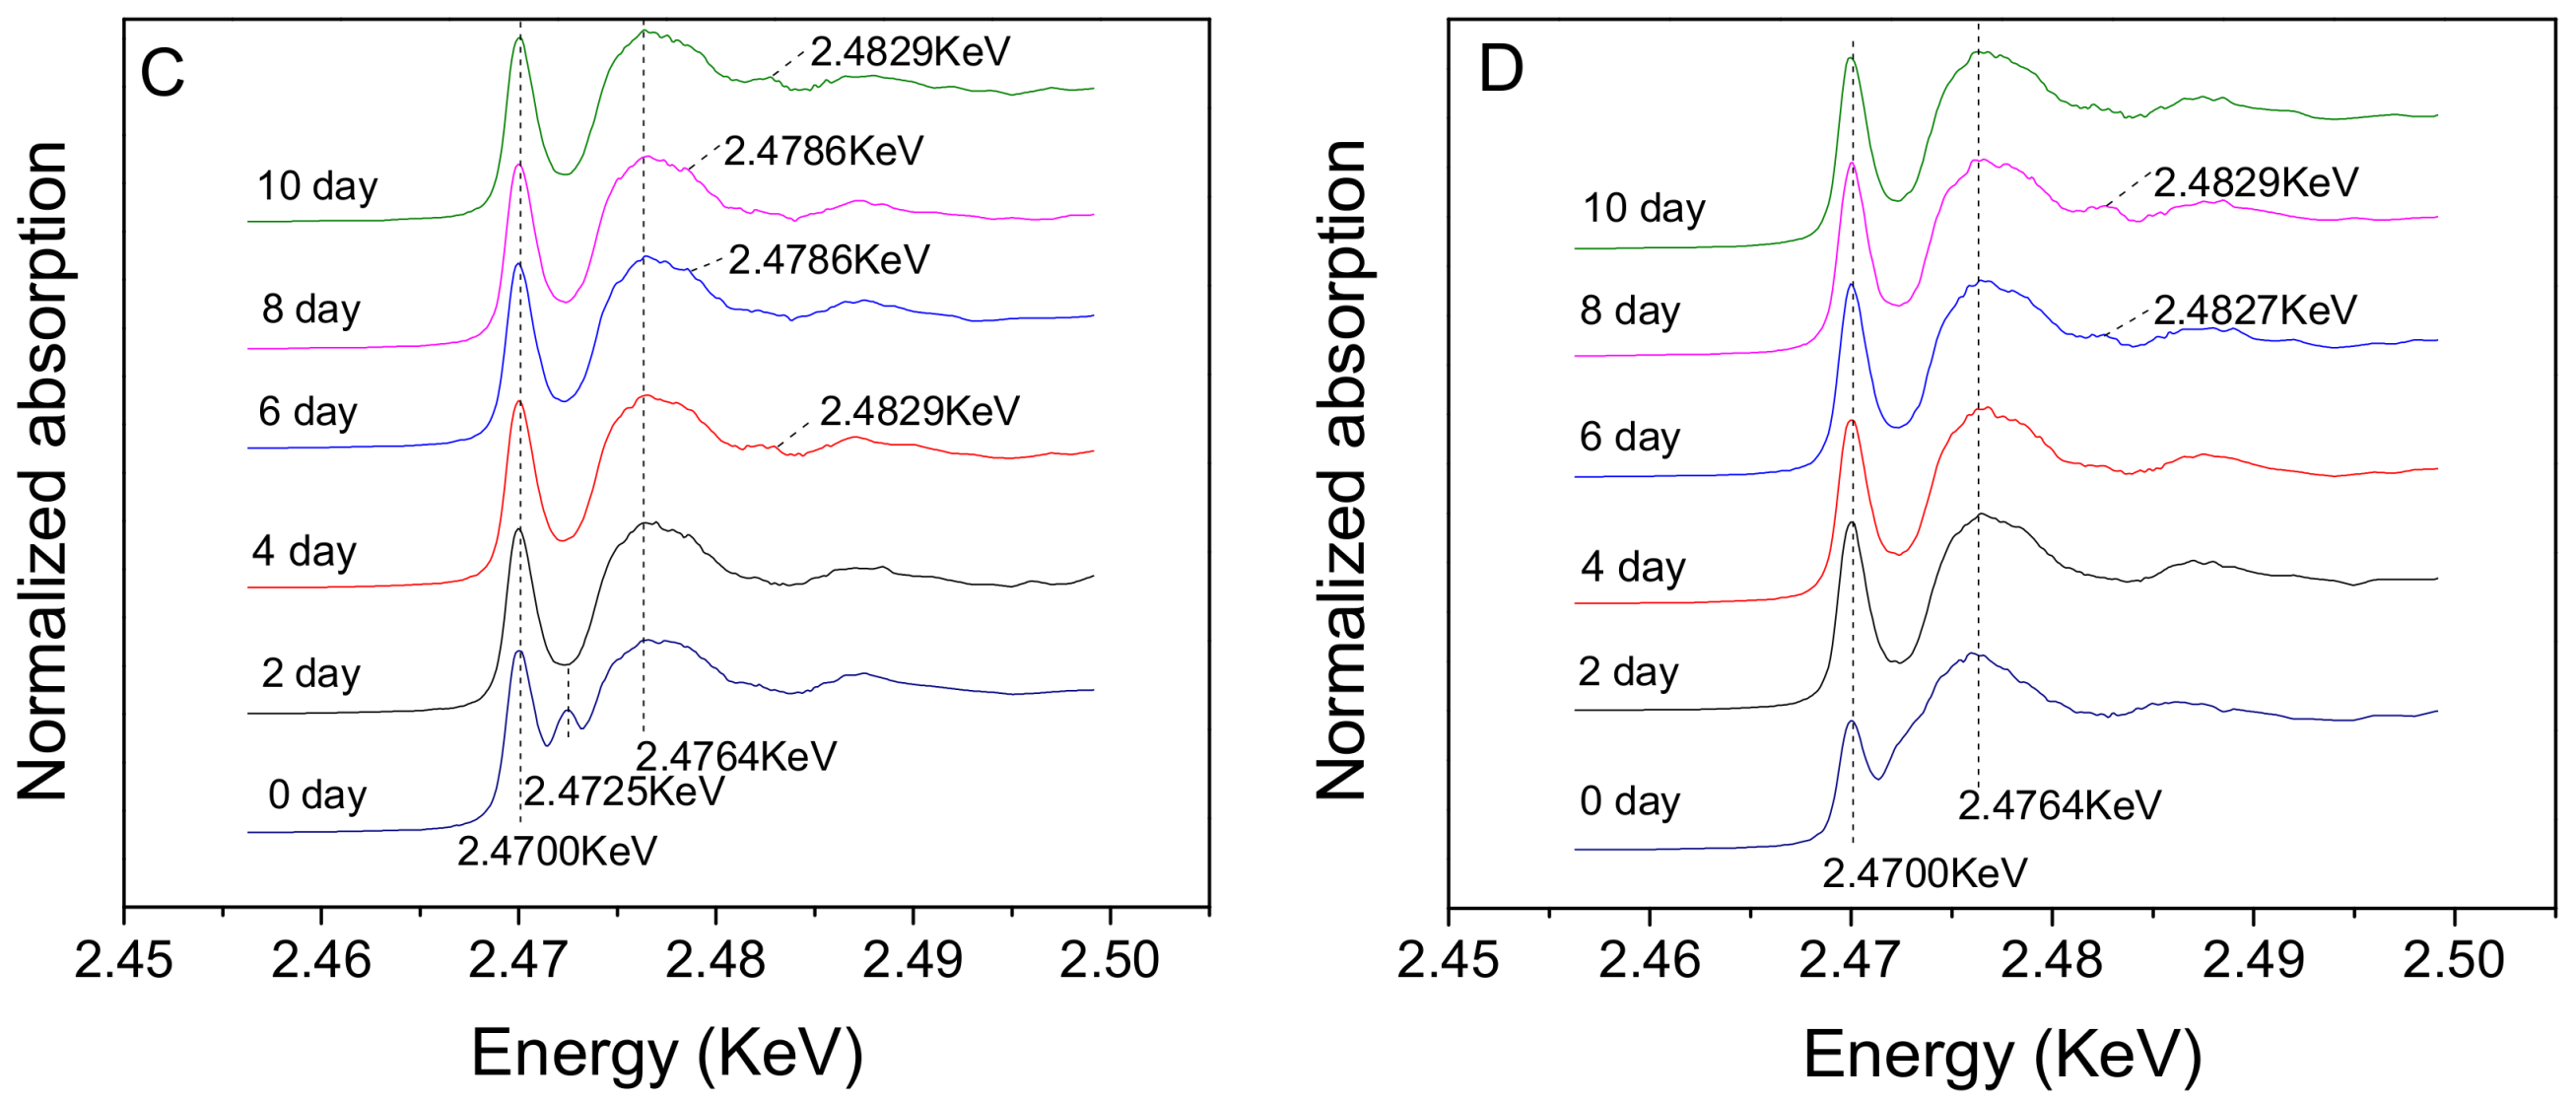
3.4. Analysis of Sulfur Speciation on the Chalcopyrite Surface

Considering that the surface sulfur species may affect the mineral-microbe interaction, they were further analyzed by S K-edge XANES. The S K-edge XANES spectra of a series of sulfur-bearing standards—including chalcopyrite, bornite, chalcocite, covellite, jarosites, and S0—are shown in Figure 9A. The characteristic peaks for these standards clearly differ from each other; that is, 2470.0 eV and 2476.6 eV for chalcopyrite, 2470.0 eV, 2475.8 eV, and 2482.5 eV for bornite, 2470.0 eV, 2473.0 eV, 2475.8 eV, and 2482.5 eV for chalcocite, 2471.9 eV and 2476.5 eV for covellite, 2472.5 eV and 2479.9 eV for S0, and 2482.7 eV for jarosite, which were similar to the results of Liu [31,32]. The evolution in S K-edge XANES spectra during bioleaching of the chalcopyrite samples, including the untreated chalcopyrite, chalcopyrite treated at 0.87 V, and chalcopyrite treated at −0.54 V are shown in Figure 9B–D, respectively. These spectra were fitted by their respective spectral standard spectra. The fitted results are shown in Table 3, which confirmed that covellite and S0 were produced on the chalcopyrite surface treated at 0.87 V, and bornite and S0 were produced on the chalcopyrite surface treated at −0.54 V.

4. Discussion

In the present study, both electrochemically treated surfaces—especially the surface treated at −0.54 V—clearly had more creviced area than the untreated surface (Figure 3). By electrochemical corrosion, the chalcopyrite treated at 0.87 V formed an S-rich surface and that treated at −0.54 V formed a Fe/S-deficient surface (Table 1 and Table 2). Moreover, the results of EDS showed that the initial attachment of cells observed the following order for both the creviced and flat areas: chalcopyrite treated at 0.87 V > original chalcopyrite > chalcopyrite treated at −0.54 V, indicating that the bacteria cells preferred S species on the mineral surface. On the mineral surface, the richness in S0 (treated at 0.87 V) made more S. metallicus cells adsorb to the mineral surface where they oxidized S0 sedimentation to sulfates (SO42−), as in Equation (3). On contrary, however, if the mineral surface was deficient in S0 (treated at −0.54 V), the chalcopyrite could first be attacked by H+ and the surface iron could be released as ferrous ion (Fe2+) into solution that can be further oxidized to ferric iron by the planktonic cells, as in Equations (4) and (5). After that, the corrosive surface was attacked by ferric iron and produced ferrous iron and S0 as in Equation (6), which attracted more cells to adsorb to the surface, causing the rapid formation of biofilm as shown in Figure 4B–D [33,34]. With ongoing bioleaching, the precipitated jarosites gradually increased as in Equation (7) and hindered the dissolution of chalcopyrite [35], and the extension of the biofilm (as shown in Figure 4E,F) was inhibited. It is noted that EFM can only observe the outermost layer of the cells of the biofilm; it can roughly exhibit the formation procedure of the biofilm, but it cannot differentiate the difference in fluorescence intensity for the inner cells of the biofilm. In contrast, FT-IR can detect the absorption of the multilayers of cells of the biofilm. The FT-IR data in Figure 6B for the attachment cells on the untreated surface are much less intense, and are not comparable with that in C and D. This may be because the much fewer cells in the biofilm on the untreated surface could not sensitively provide absorption of FT-IR. Nevertheless, by combing EFM with FT-IR, the quantities of cells determined during biofilm formation could be credible.
2 S 0   +   3 O 2   +   2 H 2 O   microorganisms   4 H +   +   2 SO 4 2
CuFeS 2   +   O 2   +   4 H +       Cu 2 +   +   Fe 2 +   +   2 S 0   +   2 H 2 O
4 Fe 2 +   +   O 2   +   4 H + microorganisms   4 Fe 3 +   +   2 H 2 O
CuFeS 2   +   4 Fe 3 +       Cu 2 +   +   5 Fe 2 +   +   2 S 0
M +   +   3 3 +   +   2 SO 4 2   +   6 H 2 O       MFe 3 ( SO 4 ) 2 ( OH ) 6   +   6 H +
In formula (7), M+ refers to cations such as K+, NH4+, and H3O+.
The intermediates may also affect the attachment behaviors of cells during bioleaching. Li and Huang [30] mentioned the appearance of S0 on the chalcopyrite surface treated by electrochemical methods. In this study, covellite, bornite, and jarosites were detected on the chalcopyrite surface treated at 0.87 V, and covellite, bornite, jarosites, chalcocite, and S0 were detected on the chalcopyrite surface treated at −0.54 V. Previous research showed that S0 had no evident inhibitory effect on the copper extraction, although α-S8 was produced as the predominant intermediate [28,31]. He et al. [36] stated that A. ferrooxidans can accelerate the accumulation of both linear polysulfide and α-S8 when the cells grew on sulfur powder and thiosulfate, and S0 may partially be derived from covellite and chalcocite [18]. The results in [28] showed the relationship between the organization of acidophilic archaeal biofilm and surface sulfur. For the chalcopyrite surface treated at 0.87 V, S0 was detected before bioleaching, disappeared in the early stage, and reappeared later. This may imply that S0 was in favor of the initial attachment of S. metallicus, which was in accordance with the results of SEM/EDS as presented in Section 3.3. These results demonstrate that both microstructure and chemical speciation on the minerals surface could effectively determine the attachment of cells and the growth of the biofilm of the extreme thermophilic archaeon S. metallicus.

5. Conclusions

The study investigated the relationship between the microbiological attachment, surface microstructure, and chemical speciation of chalcopyrite. The action of cells to the mineral energy substrate(s) can be roughly recognized as attachment followed by sulfur and iron oxidation. It was evident from microscopic observation for specific adsorption that attachment of cells was dependent on the surface availability of energy substrate elemental sulfur (S0), which was testified by the greater attachment on the mineral surface abundant in S0 than that deficient in S0. Surface defects resulting from the electrochemical corrosion can favor the minerals’ oxidation by ferric iron or microorganisms, which was in accordance with the greater growth of cells and the rapid formation of a biofilm on the creviced area compared to that on the flat area. On the other hand, the formation of S0 during the bioleaching process can favor cells’ growth.

Acknowledgments

This research was supported by the National Natural Science Foundation of China (No. 51774342), the Joint Funds of NSFC and Liao Ning Science Foundation (U1608254), and Open Funds of BSRF (2016-BEPC-PT-000887).

Author Contributions

Jinlan Xia, Hongchang Liu, Lei Wang and Weibo Ling conceived and designed the experiments; Weibo Ling, Lei Wang, Yun Yang and Zhenyuan Nie performed the experiments; Lei Wang and Weibo Ling analyzed the data; Yi Yang, Chenyan Ma, Lei Zheng and Yidong Zhao contributed reagents/materials/analysis tools; Jinlan Xia, Lei Wang and Weibo Ling wrote the paper.

Conflicts of Interest

The authors declare no conflict of interest.

References

  1. Fecht, S. Microbe Miners. Sci. Am. 2011, 305, 46. [Google Scholar] [CrossRef]
  2. George, F.; Vander, V. ASM Metal Handbook: Volume 9: Metallography and Microstructures, 9th ed.; ASM International: Geauga County, OH, USA, 2004; p. 12. ISBN 9780871707062. [Google Scholar]
  3. Zhang, R.Y.; Neu, T.R.; Bellenberg, S.; Kuhlicke, U.; Sand, W.; Vera, M. Use of lectins to in situ visualize glycoconjugates of extracellular polymeric substances in acidophilic archaeal biofilms. Microb. Biotechnol. 2015, 8, 448–461. [Google Scholar] [CrossRef] [PubMed]
  4. Vera, M.; Schippers, A.; Sand, W. Progress in bioleaching: Fundamentals and mechanisms of bacterial metal sulfide oxidation—Part A. Appl. Microbiol. Biotechnol. 2013, 97, 7529–7541. [Google Scholar] [CrossRef] [PubMed]
  5. Xia, J.L.; Zhu, H.R.; Wang, L.; Liu, H.C.; Nie, Z.Y.; Zhao, Y.D.; Ma, C.Y.; Hong, C.H.; Zhen, X.J. In situ characterization of relevance of surface microstructure and electrochemical properties of chalcopyrite to adsorption of Acidianus manzaensis. Adv. Mater. Res. 2015, 1130, 183–187. [Google Scholar] [CrossRef]
  6. Price, D.W.; Warren, G.W. The influence of silver ion on the electrochemical response of chalcopyrite and other mineral sulfide electrodes in sulfuric acid. Hydrometallurgy 1986, 15, 303–324. [Google Scholar] [CrossRef]
  7. Ruiz, L.M.; Valenzuela, S.; Castro, M.; Gonzalez, A.; Frezza, M.; Soulère, L.; Rohwerder, T.; Queneau, Y.; Doutheau, A.; Sand, W.; et al. AHL communication is a widespread phenomenon in biomining bacteria and seems to be involved in mineral-adhesion efficiency. Hydrometallurgy 2008, 94, 133–137. [Google Scholar] [CrossRef]
  8. González, A.; Bellenberg, S.; Mamani, S.; Ruiz, L.; Echeverría, A.; Soulère, L.; Doutheau, A.; Demergasso, C.; Sand, W.; Queneau, Y.; et al. AHL signaling molecules with a large acyl chain enhance biofilm formation on sulfur and metal sulfides by the bioleaching bacterium Acidithiobacillus ferrooxidans. Appl. Microbiol. Biotechnol. 2013, 97, 3729–3737. [Google Scholar] [CrossRef] [PubMed]
  9. Velásquez, P.; Leinen, D.; Pascual, J.; Ramos-Barrado, J.R.; Grez, P.; Gómez, H.; Schrebler, R.; Del Río, R.; Córdova, R. A chemical, morphological, and electrochemical (XPS, SEMEDX, CV, and EIS) analysis of electrochemically modified electrode surfaces of natural chalcopyrite (CuFeS2) and pyrite (FeS2) in alkaline solutions. J. Phys. Chem. B 2005, 109, 4977–4988. [Google Scholar] [CrossRef] [PubMed]
  10. Brierley, C.L. Microbiological mining. Sci. Am. 1982, 247, 44–53. [Google Scholar] [CrossRef]
  11. Sheng, X.; Ting, Y.P.; Pehkonen, S.O. Force measurements of bacterial adhesion on metals using a cell probe atomic force microscope. J. Colloid Interface Sci. 2007, 310, 661–669. [Google Scholar] [CrossRef] [PubMed]
  12. Harneit, K.; Göksel, A.; Kock, D.; Klock, J.H.; Gehrke, T.; Sand, W. Adhesion to metal sulfide surfaces by cells of Acidithiobacillus ferrooxidans, Acidithiobacillus thiooxidans and Leptospirillum ferrooxidans. Hydrometallurgy 2006, 83, 245–254. [Google Scholar] [CrossRef]
  13. Alfonso, D.R. Computational investigation of FeS2 surfaces and prediction of effects of sulfur environment on stabilities. J. Phys. Chem. C 2010, 114, 8971–8980. [Google Scholar] [CrossRef]
  14. Zhang, R.Y.; Vera, M.; Bellenberg, S.; Sand, W. Attachment to minerals and biofilm development of extremely acidophilic archaea. Adv. Mater. Res. 2013, 825, 103–106. [Google Scholar] [CrossRef]
  15. Florian, B.; Noël, N.; Sand, W. Visualization of initial attachment of bioleaching bacteria using combined atomic force and epifluorescence microscopy. Miner. Eng. 2010, 23, 532–535. [Google Scholar] [CrossRef]
  16. Noël, N.; Florian, B.; Sand, W. AFM & EFM study on attachment of acidophilic leaching organisms. Hydrometallurgy 2010, 104, 370–375. [Google Scholar]
  17. Wang, S. Copper leaching from chalcopyrite concentrates. JOM 2005, 57, 48–51. [Google Scholar] [CrossRef]
  18. Zhu, W.; Xia, J.L.; Yang, Y.; Nie, Z.; Zheng, L.; Ma, C.; Zhang, R.; Peng, A.; Tang, L.; Qiu, G. Sulfur oxidation activities of pure and mixed thermophiles and sulfur speciation in bioleaching of chalcopyrite. Bioresour. Technol. 2011, 102, 3877–3882. [Google Scholar] [CrossRef] [PubMed]
  19. Zhang, R.Y.; Liu, J.; Neu, T.R.; Li, Q.; Bellenberg, S.; Sand, W.; Vera, M. Interspecies Interactions of metal-oxidizing thermo-acidophilic archaea Acidianus and Sulfolobus. Adv. Mater. Res. 2015, 1130, 105–108. [Google Scholar] [CrossRef]
  20. Huber, G.; Stetter, K.O. Sulfolobus metallicus, sp. nov. A novel strictly chemolithoautotrophic thermophilic archaeal species of metal-mobilizers. Syst. Appl. Microbiol. 1991, 14, 372–378. [Google Scholar] [CrossRef]
  21. Bathe, S.; Norris, P.R. Ferrous iron- and sulfur-induced genes in Sulfolobus metallicus. Appl. Environ. Microbiol. 2007, 73, 2491–2497. [Google Scholar] [CrossRef] [PubMed]
  22. Castro, C.; Zhang, R.; Liu, J.; Bellenberg, S.; Neu, T.R.; Donati, E.; Sand, W.; Vera, M. Biofilm formation and interspecies interactions in mixed cultures of thermo-acidophilic archaea Acidianus spp. and Sulfolobus metallicus. Res. Microbiol. 2016, 167, 604–612. [Google Scholar] [CrossRef] [PubMed]
  23. Dutrizac, J.E. The dissolution of chalcopyrite in ferric sulfate and ferric chloride media. Metall. Trans. B 1981, 12, 371–378. [Google Scholar] [CrossRef]
  24. Lu, Z.Y.; Jeffrey, M.I.; Lawson, F. An electrochemical study of the effect of chloride ions on the dissolution of chalcopyrite in acidic solutions. Hydrometallurgy 2000, 56, 145–155. [Google Scholar] [CrossRef]
  25. Africa, C.J.; van Hille, R.P.; Sand, W.; Harrison, S.T.L. Investigation and in situ visualisation of interfacial interactions of thermophilic microorganisms with metal-sulphides in a simulated heap environment. Miner. Eng. 2013, 48, 100–107. [Google Scholar] [CrossRef]
  26. Xia, J.; Yang, Y.; He, H.; Liang, C.; Zhao, X.; Zheng, L.; Ma, C.; Zhao, Y.; Nie, Z.; Qiu, G. Investigation of the sulfur speciation during chalcopyrite leaching by moderate thermophile Sulfobacillus thermosulfidooxidans. Int. J. Miner. Process. 2010, 94, 52–57. [Google Scholar] [CrossRef]
  27. Newville, M. IFEFFIT: Interactive XAFS analysis and FEFF fitting. J. Synchrotron Radiat. 2001, 8, 322–324. [Google Scholar] [CrossRef] [PubMed]
  28. Zhang, R.; Neu, T.R.; Zhang, Y.; Bellenberg, S.; Kuhlicke, U.; Li, Q.; Sand, W.; Vera, M. Visualization and analysis of EPS glycoconjugates of the thermoacidophilic archaeon Sulfolobus metallicus. Appl. Microbiol. Biotechnol. 2015, 99, 7343–7356. [Google Scholar] [CrossRef] [PubMed]
  29. Xia, J.; Zhao, X.; Liang, C.; Yang, Y.; Nie, Z.; Tang, L.; Zhao, Y.; Zheng, L.; Ma, C.; Qiu, G. Sulfur speciation transformation during bioleaching of pyrite-containing sphalerite concentrate by thermophile Sulfolobus metallicus at 65 °C. J. Cent. South Univ. Technol. 2012, 19, 1961–1966. [Google Scholar] [CrossRef]
  30. Li, A.; Huang, S. Comparison of the electrochemical mechanism of chalcopyrite dissolution in the absence or presence of Sulfolobus metallicus at 70 °C. Miner. Eng. 2011, 24, 1520–1522. [Google Scholar] [CrossRef]
  31. Liu, H.; Xia, J.; Nie, Z. Relatedness of Cu and Fe speciation to chalcopyrite bioleaching by Acidithiobacillus ferrooxidans. Hydrometallurgy 2015, 156, 40–46. [Google Scholar] [CrossRef]
  32. Liu, H.C.; Nie, Z.Y.; Xia, J.L.; Xia, J.L.; Yang, Y.; Zhao, C.; Zheng, L.; Zhao, Y. Investigation of copper, iron and sulfur speciation during bioleaching of chalcopyrite by moderate thermophile Sulfobacillus thermosulfidooxidans. Int. J. Miner. Process. 2015, 137, 1–8. [Google Scholar] [CrossRef]
  33. Gautier, V.; Escobar, B.; Vargas, T. The catalytic influence of Sulfolobus metallicus in the bioleaching of chalcopyrite: Role of attached and planktonic population. Adv. Mater. Res. 2007, 20, 354–357. [Google Scholar] [CrossRef]
  34. Gautier, V.; Escobar, B.; Vargas, T. Cooperative action of attached and planktonic cells during bioleaching of chalcopyrite with Sulfolobus metallicus at 70 °C. Hydrometallurgy 2008, 94, 121–126. [Google Scholar] [CrossRef]
  35. He, H.; Xia, J.L.; Yang, Y.; Jiang, H.; Xiao, C.; Zheng, L.; Ma, C.; Zhao, Y.; Qiu, G. Sulfur speciation on the surface of chalcopyrite leached by Acidianus manzaensis. Hydrometallurgy 2009, 99, 45–50. [Google Scholar] [CrossRef]
  36. He, H.; Xia, J.L.; Jiang, H.C.; Yan, Y.; Liang, C.; Ma, C. Sulfur species investigation in extra- and intracellular sulfur globules of Acidithiobacillus ferrooxidans and Acidithiobacillus caldus. Geomicrobiol. J. 2010, 27, 707–713. [Google Scholar] [CrossRef]
Figure 1. The (A) forward cyclic voltammetry (CV) and (B) reverse CV of chalcopyrite at the scan rate of 5 mV s−1 in 9 K medium at pH 1.8. SHE: standard hydrogen electrode.
Minerals 08 00159 g001
Figure 2. The potentiostatic corrosion curves with a series of gradient voltages from 0.67 V to 0.92 V.
Minerals 08 00159 g002
Figure 3. SEM images of chalcopyrite (A) without treatment; (B) treated at 0.87 V; and (C) treated at −0.54 V.
Minerals 08 00159 g003
Figure 4. The epifluorescence microscopy (EFM) images of cells of S. metallicus adsorbed on the surface of untreated chalcopyrite: (A) day 0; (B) day 2; (C) day 4; (D) day 6; (E) day 8; (F) day 10.
Minerals 08 00159 g004
Figure 5. The EFM images of cells of S. metallicus adsorbed on the surface of (A,D) untreated chalcopyrite; (B,E) chalcopyrite treated at 0.87 V; (C,F) treated at −0.54 V. The suffix “1” indicates day 2; suffix “2” indicates day 4.
Minerals 08 00159 g005
Figure 6. The Fourier transform infrared (FT-IR) spectra of chalcopyrite leaching residues. (A) Sterile chalcopyrite; (B) Bioleached chalcopyrite untreated; (C) Bioleached chalcopyrite treated at 0.87 V; (D) Bioleached chalcopyrite treated at −0.54 V.
Minerals 08 00159 g006
Figure 7. SEM images of the chalcopyrite surface treated at −0.54 V at different leaching times: (A) day 0; (B) day 2; (C) day 4; (D) day 6; (E) day 8; and (F) day 10.
Minerals 08 00159 g007
Figure 8. The relationship between the content of C and Fe/(Cu+Fe+S) at (A) day 4 and (B) day 10 and the content of C with S/(Cu+Fe+S) at (C) day 4 and (D) day 10.
Minerals 08 00159 g008aMinerals 08 00159 g008b
Figure 9. The sulfur K-edge X-ray absorption near-edge structure (S K-edge XANES) of chalcopyrite surfaces with leaching time, where (A) standards; (B) untreated chalcopyrite; (C) chalcopyrite treated at 0.87 V; (D) chalcopyrite treated at −0.54 V.
Minerals 08 00159 g009aMinerals 08 00159 g009b
Table 1. The normalized energy dispersive spectroscopy (EDS) results of Cu, Fe, and S and atom percent (at %) of elemental carbon (C) for different chalcopyrite surfaces at different leaching time on creviced area.
MineralOriginal ChalcopyriteChalcopyrite Treated at 0.87 VChalcopyrite Treated at −0.54 V
Time Normalized ResultsC (at %)Normalized ResultsC (at %)Normalized ResultsC (at %)
0 hCuFe0.98S2.010CuFe1.00S2.160CuFe0.24S0.690
1 hCuFe1.02S1.986.47CuFe1.07S2.0310.38CuFe0.67S1.686.28
2 dCuFe1.04S1.9210.48CuFe1.07S1.9016.51CuFe0.96S1.666.36
4 dCuFe1.12S1.8111.47CuFe1.09S1.5716.69CuFe1.04S1.469.27
6 dCuFe1.01S1.7511.86CuFe1.25S1.2815.23CuFe1.10S1.6711.32
8 dCuFe0.97S1.5913.47CuFe1.16S1.8717.03CuFe1.02S1.7614.85
10 dCuFe1.06S1.8416.86CuFe1.62S1.8318.07CuFe1.48S1.5316.34
Table 2. The normalized EDS results of Cu, Fe, and S and atom percent (at %) of elemental carbon (C) for different chalcopyrite surfaces at different leaching times on flat area.
MineralOriginal ChalcopyriteChalcopyrite Treated at 0.87 VChalcopyrite Treated at −0.54 V
Time Normalized ResultsC (at %)Normalized ResultsC (at %)Normalized ResultsC (at %)
0 hCuFeS2.080CuFe1.05S2.160CuFe0.36S0.740
1 hCuFe1.01S2.052.53CuFe1.02S2.155.94CuFe0.63S1.531.97
2 dCuFe1.00S1.803.70CuFe1.05S1.948.28CuFe0.97S1.826.48
4 dCuFe1.02S1.774.81CuFe1.11S1.719.89CuFe1.02S1.715.49
6 dCuFe1.06S1.486.32CuFe1.03S1.407.07CuFe1.14S1.638.77
8 dCuFe0.96S1.548.9CuFe1.09S1.849.18CuFe0.99S1.7213.92
10 dCuFe1.04S1.8811.47CuFe1.80S1.7810.9CuFe1.49S1.6014.05
Table 3. The fitted S-K XANES results for Figure 9.
SampleTime (d)Percentage of Contribution of Reference Spectra (%)R-Factor (%)
ChalcopyriteJarositeBorniteS0ChalcociteCovellite
b: chalcopyrite untreated0100-----0.0017
2100-----0.0018
4 100-----0.0015
6 100-----0.0018
8 98.91.1----0.0016
10 96.62.1---1.30.0017
c: chalcopyrite treated at 0.87 V0 83.0--14.3-2.70.0015
2 98.8----1.20.0016
4 98.80.7--- 0.0016
6 98.71.3----0.0015
8 95.42.3-0.9-1.20.0014
10 92.63.5-1.9-2.00.0013
d: chalcopyrite treated at −0.54 V0 68.8-23.0-9.2-0.0013
2 89.5-10.1--0.40.0018
4 98.6-1.1--0.30.0015
6 98.91.1----0.0012
8 97.71.7-0.6--0.0014
10 96.72.2-1.1--0.0016

