The Merensky Cyclic Unit, Bushveld Complex, South Africa: Reality or Myth?


1
School of Geosciences, University of the Witwatersrand, Private Bag 3, Johannesburg 2050, South Africa
2
Department of Geology & Geophysics, Louisiana State University, E235 Howe Russell Kniffen, Baton Rouge, LA 70803, USA
*
Author to whom correspondence should be addressed.
Minerals 2018, 8(4), 144; https://doi.org/10.3390/min8040144
Submission received: 21 February 2018
/
Revised: 26 March 2018
/
Accepted: 28 March 2018
/
Published: 3 April 2018
(This article belongs to the Special Issue Mineral Textural and Compositional Variations as a Tool for Understanding Magmatic Processes)
Abstract
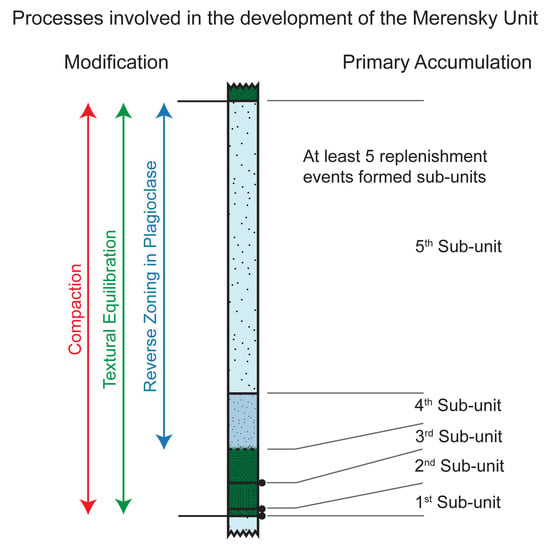
:The Merensky Unit, Bushveld Complex, is commonly described using genetic terms such as “cyclic unit”, typically without careful consideration of the connotations. We suggest that this contributes to the debate on processes forming the unit. This study integrates an extensive field study with detailed petrographic and textural analyses of the Merensky Unit to determine whether it is a “cyclic unit” sensu stricto. The study indicates that the bulk of the platinum-bearing chromitite-feldspathic orthopyroxenite developed through heterogeneous nucleation and in situ growth during multiple replenishment events. The overlying leuconorite developed above a gradational boundary, reflecting mixing following replenishment by a relatively more evolved magma. The bulk of this unit also formed in situ. The uppermost poikilitic anorthosite formed above a distinct boundary through a subsequent injection of a plagioclase-saturated magma, which crystallised in situ. Processes of gravitational settling and local remobilisation of crystals cannot be discounted from contributing to the development of the unit. The final textures throughout the unit developed through pervasive textural equilibration, with extensive fluid-mediated textural equilibration forming the megacrystic feldspathic orthopyroxenite. The evidence for at least five replenishment events indicates that the Merensky Unit is not a cyclic unit; therefore, the genetic term, “Merensky Cyclic Unit”, is misleading and its use should be carefully considered in future work.
1. Introduction
Igneous layering is a spectacular feature of many complexes around the world, with some of the best-known occurrences described in the Bushveld Complex, South Africa (Figure 1). This displays laterally persistent layering, which can be traced for up to 100 km across outcrops [1]. Yet, despite much geological interest in the development of igneous layering, there is surprisingly little consensus on the processes involved ([2] and references therein). Even fundamental concepts, such as the existence of magma chambers, have recently been questioned [3]. Partly, this debate is due to recent analytical developments that allow for increasingly precise age-dating of igneous rocks [4]. Yet, it is also related to the extensive debate over the last few decades on the relative effectiveness of gravitational settling, in situ crystallisation and remobilisation of cumulates within the development of igneous layering and economic deposits. However, understanding the role that each of these processes play within the primary accumulation of igneous rocks is complicated by processes of textural modification. Extensive field studies, in combination with detailed petrographic and textural analyses [5,6,7], are proving key to interpreting the relative importance of processes operating at the floor of a magma chamber [6,7,8,9], compared to processes operating within a cumulate pile [3,10,11,12].
We apply these concepts to the Merensky Unit of the Bushveld Complex (Figure 1) which, due to being a significant platinum-group element (PGE) resource [16], has extensive exposures within both surface and underground mining operations. The Merensky Unit is often referred to as the “Merensky Cyclic Unit” [10,17,18,19,20,21,22,23,24], yet this is a name with genetic connotations [25]. A cyclic unit is a type of rhythmic unit, i.e., it displays a set of layered rocks that are regularly repeated in the stratigraphy [20,25]. Importantly, the mineral sequence within a cyclic unit must be identified as the fractional crystallisation products of magma [25,26], although the entire crystallisation sequence does not have to be present [20,25]. Cyclicity on small scales (cm) can be referred to as microcyclic or on large scales (>200 m) as megacyclic [25]. Many models suggest that the Merensky Unit formed in association with a recharge event [1,7,21,27,28,29,30,31]; but the exact mechanics of its crystallisation, and even number of replenishment events involved in its development, are debated [6,32,33]. Therefore, without an understanding of processes involved in the development of the unit, the term “cyclic unit” can be misleading and act to further create confusion when it comes to understanding the genesis of layered igneous rocks.
The development of the Merensky Unit has been studied through a comprehensive field analysis of many kilometres of underground exposures in the Karee Mine, Western Limb (Figure 1b). These field data have been combined with detailed petrographic studies and quantitative textural analyses through the calculation of crystal size distributions (CSDs) to provide insight into the range of processes involved, from primary nucleation and growth to solidification. These data indicate that multiple replenishment events contributed to the development of the Merensky Unit. Thus, the Merensky Unit is not a “cyclic unit” sensu stricto, and the Bushveld magma chamber must have operated as an open-system during the formation of the unit.
1.1. The Bushveld Complex
The Bushveld Complex, South Africa (Figure 1) is well known as one of the world’s largest igneous complexes and is of significant importance as a major deposit of chromium and platinum-group elements (PGEs) [34]. The complex is made up of four igneous suites [35]: early mafic sills; the Rooiberg Group felsites (ca. 2061 Ma [36]); the Rustenberg Layered Suite (ca. 2055 Ma [37]); and the Lebowa Granite Suite (ca. 2054 Ma [38]). All of these Bushveld rocks are intruded or cross-cut by late alkaline intrusions, including the Pilanesberg Complex (1250 ± 60 Ma [39]). The rocks in the Rustenberg Layered Suite (RLS) have been the focus of much of the scientific attention on the complex, as they host the bulk of the economic resources. The full sequence of the RLS is well developed within the Western and Eastern Limbs (Figure 1a), with additional exposures in the Northern, Southeastern and Far Western Bushveld [35]. Much of the detail known about the complex is due to the extensive mining along the Northern, Western and Eastern Limbs resulting in increased exposure through open cast pits and underground workings that extend down to 2 km below the surface. Most of the economically significant rocks are hosted within the Critical Zone of the RLS (Figure 1c). This is split into the Lower Critical Zone of dunites and orthopyroxenites and the Upper Critical Zone of orthopyroxenites, norites and anorthosites (Figure 1c). The bulk of the economic resources are hosted in massive chromitites, with the economically viable layers being the LG-6, MG-1, MG-4 and UG-2 chromitites [23,35]. The bulk of the PGE resources are hosted within the UG-2 chromitite and orthopyroxenites within the Merensky Unit and the Platreef [40]. The present study focuses on underground exposures of the RLS in the Lonmin Karee mine in the Southern section of the Western Limb (Figure 1b). These workings are on the platinum-bearing rocks at the top of the Critical Zone of the RLS, the UG-2 chromitite and the Merensky Unit (MU; Figure 1), which is the focus of this study.
1.2. The Merensky Unit
We follow Cawthorn and Boerst [41] and Mitchell and Scoon [27] in defining the Merensky Unit as the sequence of rocks from the basal chromitite up to the base of the Bastard Unit (Figure 2a). The terminology for these rocks is, however, extremely variable due to the extensive mining operations around the Bushveld Complex. Due to this, a brief description of the nomenclature applied within the present study and the genetic connotations of these terms follows, to ensure clarity.
Rock names used in this study are based on primocryst mineralogy (e.g., [22]), determined from petrographic study. Thus, chromitite is used for a Cr-spinel rich rock (≥40% Cr-spinel), where Cr-spinel formed as a primocryst phase. Pyroxenite is used for a rock with primocryst orthopyroxene and may be modified by the prefix, feldspathic, where it contains a high proportion (>20%) of interstitial plagioclase (Figure 2d). Norite is used for a rock with both primocryst pyroxene and plagioclase, modified by the prefix leuco- where the rock is composed of 65% to 90% plagioclase (Figure 2e). Anorthosite is used for a rock with only primocryst plagioclase and may be modified by the prefix, poikilitic, where it contains large (>5 mm) oikocrysts of pyroxene (Figure 2f). Grain size definitions are taken from the recommendations of the International Union of Geological Sciences Subcommission on the Systematics of Igneous Rocks. Fine-grained is used for rocks with a mean crystal size less than 1 mm; medium grained between 1 and 3 mm; coarse-grained when greater than 3 mm; and megacrystic between 10 to 200 mm [42]. The terms pegmatite and pegmatoid are avoided due to the numerous definitions and genetic processes associated with these terms (e.g., [25,26]). Thus, the term megacrystic feldspathic pyroxenite is used for the rock referred to by other authors as pegmatoidal (feldspathic) pyroxenite (Figure 2c). Terms common in the mining industry, such as spotted anorthosite for leuconorite and mottled anorthosite for poikilitic anorthosite, are avoided.
The term “reef” is applied throughout the Bushveld Complex to refer to horizons that are economically mineralised or to the rocks that are being mined [22]. Thus, the term “Merensky Reef” refers to the PGE-rich rocks, which typically include the chromitites, megacrystic feldspathic orthopyroxenite and/or feldspathic orthopyroxenite. Thus, in the study area of Karee Mine, the term Merensky Reef is applied to the entire sequence from the basal chromitite up to the top of the feldspathic orthopyroxenite (Figure 2a,b). Footwall (denoted in figures as FW followed by a number increasing downwards from the unit of study) is used to refer to the rocks below a reef horizon, and hanging wall (denoted in figures as HW followed by a number increasing upwards from the unit of study) is used to refer to the rocks above a reef horizon.
The term “normal” Merensky Unit is applied when the unit is in apparent conformity with its footwall rocks. In the Karee region (Figure 1b), the normal Merensky Unit is made up of sub-horizontal layers dipping between 8 and 10 degrees to the north. The term “potholed” Merensky is applied when the unit steeply transgresses its footwall rocks within depressive features that occur at a variety of scales from a few tens to hundreds of metres across but are typically less than 15 m deep.
Theories for the Development of the Merensky Unit
The development and layering of the rocks within the Merensky Unit is still highly debated within the literature. A variety of models have been proposed to account for features observed around the Bushveld Complex including gravitational settling of crystals that homogenously nucleated within the magma chamber [8,9,30,43,44]; hydrodynamic sorting during crystal slurry events [45,46]; in situ crystallisation at the crystal mush—magma interface following a replenishment event [6,7]; reactions between a hydrous melt and a partially molten cumulate assemblage [11,47]; or intrusion of magmas, which may be crystal-bearing, as sills into undifferentiated noritic rocks [3,10,12,27].
An in situ model was developed from field observations involving the growth of the Merensky Unit on a temporary magma chamber floor [6,7]. This hypothesis follows the suggestion that some features of layered intrusions that are difficult to reconcile with density sorting models (e.g., [48]) and indicates heterogeneous nucleation at boundary layers [48,49,50,51,52]. Heterogeneous nucleation is kinetically more favourable than homogenous nucleation as it requires a lower activation energy, so is more likely to occur at the low rates of supercooling in magma chambers [53]. Nucleation mode is controlled by magma viscosity, cooling rate and saturation [48,51], so it is likely that both gravitational settling and in situ crystal growth operate in mafic magma chambers [51]. Key features of in situ crystallisation are a lack of change in major element composition [50] and the development of fabrics defined by the shape preferred orientation (SPO) of crystals [54].
Following in situ development of the unit, reaction of late-stage hydrous melts with an unconsolidated cumulate assemblage is considered by several authors to have played a key role. This is suggested to have developed the coarse-grained, often PGE-bearing, feldspathic orthopyroxenite and the bounding chromitites [8,11,47] at the base of the Merensky Unit. Hydrous residual melts are proposed to result in dissolution of an unconsolidated norite to develop a melt-filled cavity [11,47]. The bounding chromitites form either from the hydrous nature of the melt in the cavity resulting in Cr-spinel being the first stable phase [11], or through diffusion gradients in the melt [47]. With cooling, the megacrystic rocks crystallised in the sequence of olivine, pyroxene and then plagioclase [11]. Progression of the melt front into the leuconorite forms a zone of plagioclase and liquid, developing the anorthosite selvage [47].
The last model for the formation of the Merensky Unit involves the intrusion of magma into a pre-existing cumulate pile [3,10,12,27,55]. This model is principally based on field observations such as sharp contacts between the mafic and leucocratic portions of units [3,12,27]; bifurcations and truncation of sequences [12,55]; lack of systematic relationships between the thicknesses of mafic and leucocratic portions of units [12]; and flanking anorthosite selvages above and below units [3]. New high-precision U–Pb dating on zircon and baddeleyite has been used as further evidence as, if the ages are representative of crystallisation, it indicates that some of the units have out-of-sequence ages [3].
2. Methods
The Merensky Unit was studied during underground exposures within the K3 shaft of the Lonmin Karee Mine (Figure 1b) and through vertically drilled core taken from the same shaft. Samples were collected from both underground exposures and drill core. Fabrics and textures were examined in underground exposures, samples and thin sections. Thin sections were cut as close to the original vertical position as possible and were studied using a polarised light microscope with a circular stage and a polarised optical microscope utilising Differential Interference Contrast (DIC) as an approximation of circularly polarised light (CPL). Under CPL, all silicate minerals display their maximum birefringence; thus, the visibility of low birefringent minerals, such as plagioclase, is enhanced [56].
2.1. Element Mapping
Qualitative X-ray element mapping was performed on the CAMECA SXFiveFE electron probe microanalyser equipped with 5 WDS spectrometers and housed at the MMU (Microscopy and Microanalysis Unit) of the University of the Witwatersrand, Johannesburg, South Africa. Samples of EJH/15/068—feldspathic orthopyroxenite; EJH/15/071—leuconorite; and EJH/15/072—poikilitic anorthosite were analysed for Ca, Fe and Al, with the addition of Cr in the feldspathic orthopyroxenite to identify whether any chemical zoning was present. Analysis was performed with a beam current of 20 nA, a voltage of 15 kV and measurement times of 50 ms at a spacing of 2 µm. All element maps are available in the online supplementary material as Figures S1–S5. Quantitative compositional data were also obtained for plagioclase crystals from samples EJH/15/071 and EJH/15/072, using the same electron probe microanalyser. Compositions and acquisition parameters are detailed in the online supplementary material in Table S1.
2.2. Crystal Size Distribution Analysis
2.2.1. Crystal Size Distribution Theory
Textural analysis uses physical measurements of samples to provide a greater understanding of the processes involved in the development of the studied rock. Crystal size distribution (CSD) analysis provides insight into processes of nucleation and growth in igneous rocks (e.g., [57,58,59,60]) and can be used to distinguish texture-forming events. The term texture is used in this study to refer to the geometric arrangement and orientation of crystals (e.g., [58]); thus, it is used in a similar sense to the alternative terms fabric (shape, arrangement and orientation of minerals; [61]) and microstructure (grain shapes and arrangements; [61]).
It is important to note that within any CSD study, a wide range of kinetic and equilibration processes contribute to the final texture, and the effects of these often competing processes must be considered during the interpretation of CSD patterns (e.g., [58,62]). Detailed discussions on processes that form and modify rock textures can be found in several publications (e.g., [2,5,54,61,63,64,65] and references therein). Briefly, these have been broadly split into primary, secondary and tertiary processes by Holness, Vukmanovic and Mariani [5]. Primary processes are the kinetically driven forces that control the accumulation of crystals and development of the initial igneous textures through nucleation and growth [5,58,66]. Secondary processes modify the primary textures and include mechanical compaction and the physical rearrangement of crystals by magmatic currents, slumping or gravitational collapse of an unconsolidated crystal pile [5]. Tertiary processes control the resultant texture of the rock during the final stages of solidification through either dynamic or non-dynamic processes [5]. Dynamic processes act to modify crystal shapes through deformation, including: dislocation creep, dynamic recrystallisation and diffusion creep; or viscous compaction [5]. Non-dynamic processes are associated with recrystallisation as a means to minimise the total energy of the crystal population towards equilibration [54,65]. A variety of terms are used in the literature including textural coarsening, Ostwald ripening, textural maturation, annealing and crystal aging (cf. [63]). This work applies the term textural equilibration [65], as it does not have any genetic connotations.
CSDs are plotted as population density (logarithmic number of crystals per unit volume) against crystal size intervals (maximum length) [67]. Processes involved in textural formation are interpreted from plot shape changes, such as kinking and curvature [57,58,60]. Linear CSD slopes develop from steady-state nucleation and growth [57], which have been associated with in situ crystallisation [68]. A slope with upwards curvature and shallowing of the slope at large crystal sizes is commonly associated with sorting during gravitational settling of crystals, as this can result in an increased proportion of larger crystals at the base of the sequence [57]. The upper portions of a settled sequence would be marked by a CSD plot that displays curvature and a steep slope towards medium/large crystal sizes, due to increased proportions of the smaller crystals that settled out last. This plot shape is termed a fractionation curve [57]. Alternatively, a curved slope that is shallow at large crystal sizes can also develop from the mixing of two crystal populations with contrasting slope and intercept values. Combining two crystal populations can develop a CSD plot with a steep slope at small crystal sizes, which lessens towards larger sizes, generating an apparent curvature in the slope [58]. Alternatively, mixed crystal populations can be distinguished from CSD profiles that have sharply kinked plot shapes [57]. Textural equilibration is often suggested to modify CSD plots through the development of a steep downturn at the smallest crystal sizes, associated with preferential dissolution of the smallest crystals [58,68]. This process is often equated with Ostwald ripening, which allows for growth of larger grains at the expense of the smallest [58,63,68]. However, experimental data suggest that Ostwald ripening can only account for micron scale variations in igneous systems [69,70] and thus would not significantly affect CSD plot shapes. Instead, many other processes can contribute to a downturn at small crystal sizes, including those of nucleation, growth and equilibration [64]. Interpreting equilibration processes in CSD plots is best understood through the application of the Communicating Neighbours (CN) model [71,72], which infers growth rates are not only dependent on crystal size, but are also affected by individual crystal characteristics and the position of the crystal with respect to its neighbouring crystals [58,63]. Combining this model of crystal growth with natural temperature cycling in magma chambers [73] indicates that temperature cycles of only a few degrees can result in macroscopic coarsening. This is suggested to result in progressive shallowing of slopes through a counter-clockwise rotation around the intercept [63,68].
2.2.2. Crystal Size Distribution Methods
CSD analysis was performed on the two types of Merensky Reef—RPM and Marikana (Figure 2b)—which represent the bulk of the underground exposures in Karee Mine (Figure 1b). Their characteristics are described in detail in the field characteristics section. Additionally, one sample from the hanging wall leuconorite and one sample from the hanging wall poikilitic anorthosite were analysed. CSD analysis of these allows for investigation of processes of crystallisation and rock development over a range of the reef types present at Karee. Thus, this provides insight into the continuous range of processes from primary crystallisation through to sub-solidus textural equilibration.
This study has calculated CSDs from polished sections following the methodology of Higgins [67]. Each section was photographed with the Olympus BX-63 OM/FM microscope, housed at the MMU (Microscopy and Microanalysis Unit) of the University of the Witwatersrand, Johannesburg, South Africa. Silicate phases were photographed utilising the DIC function to maximise the visibility of individual crystals. Opaque phases, such as Cr-spinel, were photographed under reflected light to ensure grain boundaries were visible. Texture maps (available in the online Supplementary Material) were generated by hand digitisation of crystal outlines and processed with ImageJ [74] to obtain 2D spatial data. These were stereologically converted and plotted with CSDCorrections v. 1.4.0.2 as a measure of the number of crystals of a mineral per unit volume within a series of defined size intervals [57]. Aspect ratios for stereological conversion were calculated through the CSDSlice database [75] and correlated with 2D crystal shapes observed under the petrographic microscope and known crystal systems. The aspect ratios applied were 1:1:1 for Cr-spinel, 1:1.5:1.6 for orthopyroxene and 1:1.5:1.5 for plagioclase. Sections were not taken from orientated samples, but any apparent crystal alignment in the sections were measured with CSDCorrections and input during the calculation of the CSD profiles. The smallest grain sizes reported are suggested to be the lower limit of samples as the smallest crystals are easily visible under a light microscope (cross-checked with BSE images).
CSDs were calculated for the mineral phase that comprised the bulk of each layer, e.g., orthopyroxene in feldspathic orthopyroxenite, Cr-spinel in chromitite, and plagioclase in anorthosite and leuconorite. This allows for a more rigorous quantitative analysis due to the high percentage of each mineral phase (>40 mod %) and reduces the effects of interstitial mineral development on the interpretation of primary processes. This also allows for analysis of >200 crystals, providing a statistically robust analysis [76]. The megacrystic feldspathic orthopyroxenite was not analysed, as the large grain sizes do not allow for measurement of a statistically significant number of crystals from a single thin section. Plot profiles were interpreted in accordance with Marsh ([57] his Figure 7) and Higgins ([77] his Figure 8), taking into consideration the multiple and often competing effects of kinetic, mechanic and equilibration processes that can affect plot shapes. Lmax was calculated as the mean size of the four largest crystals. Characteristic length (Ci) was calculated as −1/slope, where the slope value was calculated from a linear regression of central slope portions excluding any curvature at either the smallest or largest crystal sizes.
3. Results
3.1. Field Characteristics of the Merensky Unit
The characteristics of the Merensky Unit have been described from various localities by many authors [7,9,29,41,78,79,80,81]. This study focuses on the characteristics of the “normal” Merensky Unit in the underground workings of the Karee Mine (Figure 1b), which has received comparatively little attention in the literature.
The “normal” Merensky Unit always overlies a poikilitic anorthosite (85% plagioclase with oikocrysts of orthopyroxene and clinopyroxene up to 5 cm in size), which varies in thickness from 0.5 to 5 m, thickening towards the East of Karee Mine. This is also referred to in this study as FW 1a (Figure 2a). The contact is always sharp (Figure 3a–c), but varies from planar (Figure 4a) to undulose or “dimpled” (Figure 4b,c). It is marked by a pure anorthosite, typically less than 5 cm thick, which is overlain by the basal chromitite of the Merensky Unit (Figure 3c).
The Merensky Unit at Karee has varying characteristics, which can change over a few tens of metres along the strike or dip. This has led to development of a classification scheme by the mine geologists, which divides the Merensky Reef into six types based on the number of chromitites; the presence or absence of the megacrystic feldspathic orthopyroxenite; and the thickness of the “reef” body (Figure 2b). The base is always marked by a chromitite (Figure 3c), which ranges in thickness from 0.1 to 5 cm, often thickening in “dimples” but still following the contours of the contact (Figure 4b,c). This basal chromitite is typically continuous but can be disrupted into multiple thinner chromitites or be discontinuous (Figure 4d). This may be overlain by a megacrystic feldspathic orthopyroxenite (Figure 2c and Figure 3c) that, when present, attains a maximum thickness of 0.5 m and is bound by an upper chromitite (Figure 3d and Figure 4e), but may be thinner or patchy (Figure 4b). The feldspathic orthopyroxenite (Figure 2d and Figure 4f), ranges in thickness from 0.8 to 2.5 metres and may contain a second or third chromitite in the upper part of the unit (Figure 3e and Figure 5a). This upper chromitite may be associated with discontinuous patches of megacrystic feldspathic orthopyroxenite (Figure 5a). The two most common types of “reef” in the Karee Mine are the Marikana and the RPM types. The Marikana type has a basal chromitite overlain by at least two metres of feldspathic orthopyroxenite, which contains an “upper” chromitite (Figure 2b and Figure 3e). The RPM type has a basal chromitite overlain by megacrystic feldspathic orthopyroxenite, which is at least 0.3 m thick. The upper contact of this is marked by the “middle” chromitite, which is overlain by at least one metre of feldspathic orthopyroxenite that contains an “upper” chromitite (Figure 2b).
The feldspathic orthopyroxenite within the “normal” Merensky Unit was always observed to have a gradational contact through norite to the overlying leuconorite (HW 1) typically over 10–25 cm (Figure 3f and Figure 5b), but can be more distinct (Figure 5c). Within Merensky Unit potholes, this contact may instead be sharp. The leuconorite (Figure 2e and Figure 5d) has an average thickness of 1.5 m and contains discontinuous microrhythmic layering (scale < 20 cm) marked by variations in the modal content of orthopyroxene. Rarely, layers of poikilitic anorthosite occur; these are marked by smaller oikocrysts (<3 cm) than those observed in the thick sequences of poikilitic anorthosite.
The HW 1 leuconorite displays a distinct contact with the HW 2 poikilitic anorthosite, where orthopyroxene becomes an interstitial phase, forming oikocrysts up to 5 cm in size. This boundary may be sharp or occur over 5 to 10 cm (Figure 3b). The poikilitic anorthosite (Figure 2f and Figure 5e) ranges in thickness from 6 to 8 m and does not contain internal layering (Figure 3b). It always displays a sharp contact with the overlying Bastard Reef orthopyroxenite (HW 3), and this contact is often associated with a serpentinised plane of movement (Figure 5f). The characteristics of the Bastard Unit are outside the scope of the present study.
3.2. Petrographic Characteristics of the Merensky Unit
The basal chromitite is principally composed of Cr-spinel (55%) with crystal sizes ranging from 0.07 to 1.7 mm. The bulk of the chromitite is typically fine-grained crystals (0.07 to 1.1 mm) with slightly coarser crystal sizes (0.1 to 1.7 mm) in contact with the megacrystic feldspathic orthopyroxenite. Interstitial plagioclase (25%) and orthopyroxene (20%) form the remainder of the chromitite. Cr-spinel crystal shapes range from rounded to lobate, and many crystals (50%) host inclusions (Figure 6a). Most of these inclusions are circular in 2D section, are polymineralic (phlogopite, clinopyroxene and plagioclase) and are within the coarse Cr-spinel crystals that are spatially associated with the megacrystic feldspathic orthopyroxenite. A small number (10%) are monomineralic and have optical continuity with the interstitial silicates. These are typically composed of plagioclase and are not circular in shape. The interstitial plagioclase displays wedge-shaped deformation twins and undulose extinction. The interstitial orthopyroxene also displays undulose extinction.
The megacrystic feldspathic orthopyroxenite, when present, is typically composed of 55% orthopyroxene, 35% plagioclase, 4% Cr-spinel, 3% clinopyroxene and 3% sulphides, with silicate crystal sizes ranging from 0.5 to 3 cm. Cr-spinel and sulphide crystals typically display smaller crystal sizes between 0.4 to 2.0 mm and 0.2 to 5.0 mm, respectively, and are commonly hosted within larger orthopyroxene crystals. Orthopyroxene crystals display lenticular lamellae, and plagioclase crystals display wedge-shaped deformation twins. Alteration of orthopyroxene to amphibole or biotite (Figure 6e) is common and these crystals also display undulose extinction.
The upper contact of the megacrystic feldspathic orthopyroxenite is always marked by a chromitite. This only occurs in conjunction with the megacrystic feldspathic orthopyroxenite (Figure 2b) and is referred to as the middle chromitite. It ranges in thickness from 0.2 to 1 cm. It is typically composed of 40% Cr-spinel with interstitial orthopyroxene (35%), plagioclase (24%) and minor sulphides (1%). Cr-spinel grain sizes range from 0.04 to 1.1 mm. The same range of crystal sizes are present throughout the chromitite, but a greater proportion of larger crystal sizes occur towards the base of the chromitite, in contact with the megacrystic feldspathic orthopyroxenite, while typically finer crystal sizes occur in contact with the medium-grained feldspathic orthopyroxenite (Figure 6b). The larger grains that are spatially associated with the megacrystic feldspathic orthopyroxene have a rounded shape and host inclusions that are circular in 2D section. These inclusions do not display any continuity with the interstitial silicates (Figure 6b) and are typically polymineralic (phlogopite, plagioclase and orthopyroxene). The smaller Cr-spinel crystals are typically angular and do not contain inclusions (Figure 6b). The interstitial orthopyroxene and plagioclase display undulose extinction.
The feldspathic orthopyroxenite is typically composed of 60% orthopyroxene, 26% plagioclase, 8% clinopyroxene, 4% sulphides and 2% Cr-spinel with minor (<5%) secondary biotite and/or amphibole. Olivine is commonly absent from the feldspathic orthopyroxenite at Karee; when present, it forms <1% of the rock. Orthopyroxene is subhedral to euhedral and ranges in size from 0.5 to 5 mm (Figure 6c,d). Undulose extinction and lenticular exsolution lamellae of clinopyroxene are commonly observed. Orthopyroxene crystals typically show the alignment of a foliation fabric with crystal long axes parallel to the macroscopic layering. No evidence of features corresponding to linear fabrics were observed. Plagioclase is always interstitial and often forms oikocrysts enclosing orthopyroxene crystals (Figure 6c,d). Most plagioclase crystals display undulose extinction and wedge-shaped deformation twins (Figure 6c,d). Clinopyroxene forms a small proportion of the feldspathic orthopyroxenite and occurs as large (1–2 cm) euhedral crystals that may enclose small (<3 mm) orthopyroxene crystals (Figure 6e). These orthopyroxene crystals also display undulose extinction and lenticular exsolution lamellae. Disseminated Cr-spinel occurs sporadically throughout the feldspathic orthopyroxenite; crystals are typically small (<1 mm), rounded and lack inclusions (Figure 6f). Sulphides occur throughout the feldspathic orthopyroxenite, but modal volumes are higher around the chromitites. They typically occur interstitially between orthopyroxene crystals or within fractures through orthopyroxene crystals (Figure 7a).
The upper chromitite, when present, is hosted entirely within the feldspathic orthopyroxenite and is typically composed of 40% Cr-spinel with interstitial plagioclase (38%) orthopyroxene (14%), and sulphides (8%). Cr-spinel crystals range in size from 0.04 to 1.1 mm. Unlike the middle chromitite (Figure 2a,b), there is no spatial distribution in the range of grain sizes. Inclusions are absent, and crystal shapes range from angular to rounded (Figure 7b). The interstitial plagioclase and orthopyroxene crystals display undulose extinction and lenticular or wedge-shaped deformation twins.
The mode of orthopyroxene varies throughout the feldspathic orthopyroxenite (Figure 8). Two reef types were studied, the first from drill core with three chromitites (basal, middle and upper), megacrystic feldspathic orthopyroxenite and feldspathic orthopyroxenite (RPM type, Figure 2b). The second is from underground exposures with two chromitites (basal and upper) with only feldspathic orthopyroxenite (Marikana type, Figure 2b). These represent the two reef types that are the most characteristic of the underground exposures in Karee Mine (Figure 1b). Orthopyroxene modal contents were determined from petrographic observations and quantitative measurements from hand-digitised texture maps. There is a general decrease from the base upwards, but importantly, the modal content also varies around the chromitites (Figure 8). The highest orthopyroxene concentrations (75%) are observed at the base of the reef, just above the basal chromitite or megacrystic feldspathic orthopyroxenite (Figure 8). The orthopyroxene content then gradually decreases upwards to 60% immediately below the upper chromitite (Figure 8). Immediately above the upper chromitite, the orthopyroxene content was measured to increase to 75%, which then gradationally decreases to 50% at the contact to the hanging wall leuconorite (Figure 8). Importantly, although reef type varies throughout Karee Mine, similar patterns were observed in all reef types, independent of lithology and number of chromitites.
The gradational contact between the feldspathic orthopyroxenite and the hanging wall leuconorite (HW 1) is marked by a progressive decrease in the modal content of orthopyroxene from 50% to <20% over 25 cm. The leuconorite is medium-grained and composed of 80% plagioclase, 18% orthopyroxene and 2% clinopyroxene. The plagioclase crystals are subhedral to euhedral and range in size from 0.2 to 1.8 mm (Figure 7c). They commonly display wedge-shaped deformation twins (Figure 7c) and undulose extinction. Plagioclase crystals typically show the alignment of a foliation fabric with crystal long axes parallel to the macroscopic layering. No evidence of features corresponding to linear fabrics were observed. The orthopyroxene crystals are subhedral, range in size from 0.8 to 5.3 mm, and may enclose small plagioclase crystals at the crystal margins (Figure 7d). They commonly display clinopyroxene exsolution lamellae, which often have a lenticular shape. Clinopyroxene is always interstitial and typically displays undulose extinction.
The HW 2 poikilitic anorthosite is composed of 88% plagioclase, 8% orthopyroxene oikocrysts and 4% clinopyroxene oikocrysts. The plagioclase crystals forming the bulk of the rock are euhedral and range in size from 0.3 to 2.8 mm (Figure 7e). Interlocking grain contacts (Figure 7e), wedge-shaped deformation twins (Figure 7e) and undulose extinction are common. Similar to the leuconorite, the plagioclase crystals typically show alignment as a foliation fabric with crystal long axes parallel to the macroscopic layering. No evidence of features corresponding to linear fabrics were observed. Orthopyroxene and clinopyroxene are interstitial and form grains up to 5 cm in size. These host numerous euhedral plagioclase crystals (Figure 7f), which are slightly smaller than those outside the oikocrysts (0.2 to 2.6 mm). They also often display undulose extinction and/or lenticular deformation twinning.
3.3. Element Maps
The Merensky feldspathic orthopyroxenite does not display any indicators of chemical zoning (Figure 9a–c and Figure S1). Within the element maps, the clinopyroxene exsolution lamellae are clearly visible in the orthopyroxene crystals along with alteration of the clinopyroxene to amphibole (Figure 9b,c).
The plagioclase in the leuconorite (Figure 9d–f) displays slight zoning in the Ca element map (Figure 9e), but very little compositional variation occurs within the central crystal as the anorthite content varies between An76 to An78. The Al element map displays identical variation (Figure S2). Some plagioclase crystals contain Cr-spinel inclusions that are represented as bright spots on the Fe element map (Figure 9f). Greater variation occurs in the plagioclase crystals hosted in orthopyroxene (Figure 9g–i), with anorthite contents varying from An78–81 in the crystal cores to An86–87 at the rims (Figure 9h, Table S1). The orthopyroxene shows alteration to biotite along fractures, marked by Fe depletion (Figure 9i) and Al enrichment (Figure S3). Some contacts between orthopyroxene and plagioclase, or clinopyroxene and plagioclase, also display alteration to amphibole (Figure 9g–i).
The plagioclase in the poikilitic anorthosite (Figure 9j–l) display minor variations in Ca counts across the map, similar to the leuconorite. This is represented by a variation in the anorthite content with relatively Ca-poor cores (Figure 9k). Identical variations were observed in the Al map (Figure S4). The Fe element map highlights small interstitial sulphide crystals (Figure 9l). The plagioclase chadacrysts in orthopyroxene oikocrysts (Figure 9m–p) have crystal cores that display a similar range of anorthite contents (An72–78) with relatively Ca-rich rims (Figure 9o, Table S1). Small interstitial clinopyroxene crystals occur between orthopyroxene and plagioclase or plagioclase and plagioclase (Figure 9o). The orthopyroxene and clinopyroxene are altered to amphibole at some contacts with plagioclase (Figure 9o,p). The orthopyroxene is altered to biotite along fractures (Figure 9p and Figure S5).
3.4. Crystal Size Distributions Results
The CSD data are presented in Table 1 and Figure 10, the raw data and texture maps are located in the online Supplementary Material. Plot shapes visually approximate as linear in the central portions, with variation in the larger and smaller grain sizes, indicating a range of processes were involved in the development of the Merensky Unit.
The middle (EJH/15/067A) and upper chromitites (EJH/15/067B; Figure 10a) display similar slope profiles and have similar Cr-spinel contents—40% in each—although they vary in thickness (middle = 1 cm; upper = 0.2 cm). Plots for both samples display an upwards curvature at large grain sizes and a downwards curvature at the smallest grain sizes (Figure 10b). Crystal sizes range from 0.04 to 1.1 mm with no systematic variation in the range of grain sizes present throughout the Merensky Unit chromitites. Despite this, there is a greater proportion of large crystals at the base of the middle chromitite in contact with the megacrystic feldspathic orthopyroxenite (Figure 10b). This is highlighted by the variation in Ci values from the basal portion of the middle chromitite at 0.15 mm, to the upper portion of the middle chromitite at 0.09 mm (Table 1). Slope values range from −6.59 to −11.43 mm−1 with R-squared coefficients between 0.936 and 0.992, highlighting the curvature of the profiles (Table 1).
Orthopyroxene in the feldspathic orthopyroxenite was analysed from both reef types (Figure 10a,f). Plot profiles range from visually linear to displaying minor upwards curvature over the middle portion of grain sizes (Figure 10c,g). All plots display downwards curvature at the smallest grain sizes (Figure 10c,g). Grain sizes range from 0.5 to 4.9 mm but are up to 7.8 mm in sample EJH/15/069A. Slope values range from −0.92 to −1.53 mm−1 with R-squared coefficients ranging from 0.953 to 1.000 (Table 1).
Plagioclase in the HW 1 leuconorite has a CSD profile that is visually linear with downwards curvature at the smallest grain sizes (Figure 10d). The slope value is −3.29 mm−1, and the R-squared coefficient is 0.997 (Table 1). Grain sizes range from 0.2 to l.8 mm. The plagioclase in the HW 2 poikilitic anorthosite has a visually linear slope with a downturn at the smallest crystal sizes. Comparatively, the chadacrysts hosted in an orthopyroxene oikocryst display a linear slope over the entire range of grain sizes without a downturn at the smallest crystal sizes (Figure 10e). The plagioclase comprising the bulk of the rock has a slope value of −3.23 mm−1 and an R-squared coefficient of 0.999. The plagioclase chadacrysts have a slope value of −4.13 mm−1 and an R-squared coefficient of 0.999 (Table 1). The chadacrysts have a slightly smaller grain size range, between 0.2 to 2.7 mm, compared to the remainder of the rock at 0.3 and 2.8 mm. The characteristic length (Ci) is also smaller for the chadacrysts at 0.24 mm, compared to 0.31 mm (Table 1).
The CSD data were verified through comparing the phase percentage calculated from the total area of the crystals and the CSD itself [82], applying equations for both linear and curved CSDs, where appropriate. The data are consistent; thus, the CSDs are inferred to have been correctly determined from 2D measurements.
4. Discussion
The Merensky Unit is laterally persistent across the entire Western and Eastern Limbs of the Bushveld Complex (Figure 1) and is potentially continuous at depth across the complex from west to east [13]. The continuity, at least across the Western and Eastern Limbs, indicates that the Merensky Unit must have formed from large-scale processes that operated efficiently across the entire magma chamber. The change in reef types observed at Karee (Figure 2b) with variations over a few 10 s of metres is, however, suggestive of local spatial controls that affected the development of the unit. All reef types show a progressive decrease upwards in the proportion of orthopyroxene. This reflects progressive evolution of the Merensky Unit towards less mafic compositions, suggesting the unit crystallised from the base upwards.
For the Merensky Unit to be considered as a true cyclic unit, the layering must represent the order of fractional crystallisation of the magma [25,26]. The more mafic portion of the unit, often referred to as the Merensky Reef, is made up from alternating chromitite and feldspathic orthopyroxenite (Figure 2b), which is representative of distinct “packages” based on the petrographic analysis performed during this study (Figure 8). Each new “package” is marked by a chromitite, which is overlain by feldspathic orthopyroxenite, where the modal content of orthopyroxene decreases upwards from 70% to 50% (Figure 8). Additionally, the percentage of oikocrystic plagioclase (Figure 6c,d) also decreases upwards, with the plagioclase becoming anhedral and interstitial (Figure 6f). Thus, up to three “packages” of rocks are observed within the feldspathic orthopyroxenite at Karee mine. The compositions of the basal and middle chromitites were studied by Nicholson and Mathez [11] who suggest that the systematic compositional variations they observed cannot be accounted for by fractional crystallisation.
The leuconorite occurs above a gradational contact from feldspathic orthopyroxenite through norite to leuconorite (Figure 5c,d). This gradational contact could indicate a genetic relationship between these rocks with a progressive change from orthopyroxene-dominated to plagioclase-dominated nucleation. However, this contact is not always gradational across the entire Bushveld Complex and, in some locations, can display spatially restricted chromitites at the pyroxenite-norite/leuconorite contact [83]. Chemical analysis of orthopyroxene crystals across this contact in the Rustenberg area shows a distinct compositional break in the Mg# ratios (Mg2+/[Mg2+ + Fe2+]) and modelled pre-equilibration pyroxene compositions (Mg#°) at the boundary [80]. The feldspathic orthopyroxenite has an Mg#° of 0.82, which decreases across the contact into the leuconorite to 0.78 [80]. This change in Mg#° ratio across the boundary is too great to be associated with simple magmatic fractionation and must be associated with a new influx of magma that was relatively more evolved (lower Mg#; e.g., [80]) than the one that developed the feldspathic orthopyroxenite. Analyses of trace elements suggests that the feldspathic orthopyroxenites developed from a magma with significantly higher incompatible trace element contents than the overlying leuconorites [84]. Following this, the leuconorite, although typically in gradational contact with the feldspathic orthopyroxenite, is not genetically related to it.
The poikilitic anorthosite occurs above a distinct boundary from the leuconorite, and this has been used, with the overall excess plagioclase content (above plagioclase-orthopyroxene cotectic proportions [19]), to indicate that it is not genetically related to the other rocks in the Merensky Unit. Initial Sr ratios provide further evidence for this as the plagioclase in the poikilitic anorthosite must have formed from a magma with an isotopic ratio of 0.7064, while the feldspathic orthopyroxenite developed from a magma with an isotopic ratio that was greater than 0.7075 [19]. These features cannot develop from a simple liquid line of descent through fractional crystallisation or differentiation through in situ crystallisation [50], so they are interpreted as evidence that multiple events contributed to the development of the Merensky Unit. Therefore, the unit cannot be considered to be a true cyclic unit.
4.1. Development of the Merensky Unit
4.1.1. Evaluation of the Role of Gravitational Settling
Density sorting during gravitational settling is one of the simplest explanations for the development of the Merensky Unit but must take into account both density and crystal size [48]. The textural analysis performed in this study provides size data through the characteristic length (Table 1) and aspect ratio (Section 2.2.2) for each studied phase, which can be combined with the density to determine the mass of the characteristic sizes for each phase. The heaviest crystals within the Merensky Unit are the orthopyroxene crystals, which, with a density of 3.189 g/cm3, would have a mass of 0.988 mg. The second heaviest phase is plagioclase, which, with a density of 2.710 g/cm3, would have a typical crystal mass of 0.058 mg. The lightest studied phase is Cr-spinel, which, with a density of 5.120 g/cm3, would have a mass of 0.005 mg. Thus, following Stokes’ Law, which indicates that the settling velocity is based on both density and size, the Merensky Unit should grade from pyroxene-rich rocks to plagioclase- and then Cr-spinel-rich rocks. These calculations are based on the characteristic length of each phase, which is affected by textural equilibration; thus, while these masses are not indicative of seed crystal sizes, it indicates that gravitational sorting as a function of both density and crystal size is unlikely to account for the observed layering from chromitite to feldspathic orthopyroxenite.
A weak to moderate shape preferred orientation fabric (SPO, Table 1) was observed within the feldspathic orthopyroxenite, leuconorite and poikilitic anorthosite. This is associated with a foliation fabric, which is orientated approximately parallel to the layering. Development of this fabric could be associated with the gravitational settling of crystals (e.g., [85]), but other features associated with this process, such as size grading, are lacking. Therefore, other processes must be investigated to account for all the features within the Merensky Unit.
4.1.2. Evaluation of the Role of Magmatic Flow and/or Crystal Slurries
The sharp, undulose basal contact of the Merensky Unit (Figure 4b,c) has been suggested to develop through erosion of a temporary chamber floor (e.g., [18]). This could develop through mechanical erosion of the footwall during crystal slurry emplacement [45,86], but this method is not consistent with the observations from this study. The thickness of the chromitite is variable (Figure 4a–d), thickening within dimples in the undulating contact, but always follows the contours of the contact (Figure 4b,c). This, combined with the truncation of chromitites (Figure 4d), indicates they did not form through flowing crystal slurries, as these should form a single, continuous layer with evenly filled dimples. A thin (typically 5 cm thick) pure anorthosite layer often occurs below the basal chromite, which cannot develop during a slurry event.
Magmatic flow is often suggested to develop lineation fabrics within rocks [5,54], but neither the field evidence, nor the textural analyses, indicate the presence of any lineation fabrics. This lack of lineation fabrics within Bushveld rocks has been used to suggest that magmatic flow and crystal slurries did not play a key role in their generation [62,87]. However, lack of lineation fabrics is not definitive proof that magmatic flow did not affect these rocks [88]. Literature dealing with the development of flow microstructures within igneous materials does suggest that magmatic flow develops SPO fabrics, which are parallel to the shear plane [89,90]. The key marker of flow in these textures is, however, the development of imbricated clasts in sedimentary rocks [91,92] or the tiling of rigid particles within igneous rocks [89]. Therefore, the lack of petrographic evidence of tiling or imbrication of crystals throughout the Merensky Unit indicates that magmatic flow was not a significant process. Thus, the Merensky Unit is not suggested to have developed through crystal slurries. While magmatic flow is not suggested to be wholly responsible for the development of the observed fabric, any flow would have enhanced the foliation fabric through the mechanical rearrangement of crystals [89,90] or through overgrowth on low strain surfaces [5].
4.1.3. Evaluation of the Role of Intrusion
Models suggesting that units formed as sill-like intrusions into a pre-existing cumulate pile are principally based on field evidence, which is not in agreement with the underground exposures of the Merensky Unit in the Karee Mine. The contacts between the mafic and leucocratic rocks are not sharp (e.g., [3,12,27]) and instead, typically form a gradational contact from feldspathic orthopyroxenite to leuconorite (Figure 3e and Figure 5b,c). A thin (typically 5 cm thick) anorthosite layer occurs below the basal contact of the Merensky Unit and could represent a flanking anorthosite (e.g., [3]), but a similar upper layer was not observed. The lack of systematic relationships between the thickness of the mafic and leucocratic portions of the units (e.g., [12]) is also observed at Karee, but can be related to the non-genetic relationship between the rocks in the Merensky Unit. Apparent out-of-sequence ages, derived from U–Pb dating of zircon and baddeleyite in the Bushveld Complex [3] and the Stillwater Complex, USA [93], have also been used. These minerals, however, crystallise very close to the solidus in the last pockets of melt [93]. The temperature of zircon crystallization in the Stillwater Complex (Ti-in-Zircon method) overlaps with the temperature of the country rocks in the contact aureole [93] suggesting that these ages may reflect protracted cooling times rather than the first stages in the development of the rocks. This lack of certainty over what the new ages represent, combined with the lack of field evidence for intrusion, suggests that an intrusive model cannot be confidently applied for the development of the Merensky Unit.
4.1.4. Evaluation of the Role of In Situ Crystallisation
In situ nucleation and growth of crystals is characterised by a linear CSD plot [68]. Many of the CSD plots from this study approximate to linear slopes, but there are some variations (Figure 10). The chromitites display either kinked or curved CSD plots, all indicating a relatively increased proportion of the larger crystal sizes (Figure 10b). These plot shapes are suggested, respectively, to represent mixed crystal populations (e.g., [57]) and density sorting of crystals during gravitational settling (e.g., [57]). However, as noted in Section 2.2.1, an upwards curvature can develop from a range of processes. Mixing of two or more crystal populations with differing slope gradients and intercepts can generate apparent upwards curvature when combined into one CSD plot [58]. The bimodal range of crystal sizes in the chromitites (Figure 7b) suggests that the apparent curvature is associated with differing growth histories throughout the crystal population within a single chromitite. This is unlikely to be associated with primary nucleation and growth processes as, within the upper chromitite, there is an apparently random distribution of grain sizes on the scale of a single thin section (see texture maps in the online Supplementary Material). An alternative in situ growth mode was proposed for the development of thin (<1 cm) chromitites in the Stillwater Complex, USA [94], which could account for some of the features of the Merensky chromitites. In this model, in situ processes of textural equilibration resulted in mineral segregation and redistribution of chromite into near monomineralic layers [94]. CSD patterns, and, in particular, observed downturns at the smallest crystal sizes, were used as evidence of significant modification during textural equilibration [94,95]. The Merensky chromitites also show downturns at the smallest crystal sizes (Figure 10b), but the suggested Ostwald ripening [94,95] is unlikely to account for any significant changes in crystal size [69,70] and is unlikely to have developed the observed CSD slope profiles. The other textures of the chromitites, such as the bimodal crystal sizes and, on a larger scale, the sharp truncation of some chromitites (Figure 4d), are not consistent with mineral segregation during textural equilibration. Although, equilibration must have contributed to the final textures observed. Instead, the accumulating chromitite is likely to have been gravitationally unstable along some of the “dimples” or irregularities in the temporary chamber floor; thus, the slumping of crystals is suggested to have also contributed to the formation of the chromitites.
The CSD plots for orthopyroxene in feldspathic orthopyroxenite are approximately linear, although samples EJH/15/043, 068 and 070 display a minor upwards curvature over the entire range of grain sizes (Figure 10c,g). This is typically associated with fractionation [57] during gravitational settling resulting in an increased proportion of smaller crystals. This curvature is, however, very slight, with only a minor deviation from a linear slope, as the R-squared values range from 0.927 to 0.978. Therefore, the predominance of linear slopes within the samples is indicative that gravitational settling did not play a significant role and instead suggests in situ development with some modification through textural equilibration. The regular crystal structures [96] and quasi-equant crystal shapes [53] support the interpretation of heterogeneous nucleation and in situ crystal growth. The SPO fabric in the rock may have been enhanced through epitaxial growth onto a substrate with a pre-existing fabric (e.g., [53]).
The leuconorite CSD plot has a linear profile with a downturn at the smaller crystal sizes (Figure 10d). This is indicative of in situ nucleation and growth of the plagioclase [57]. The regular crystal structures [96] and quasi-equant crystal shapes [53] support the interpretation of heterogeneous nucleation and in situ crystal growth. The inclusion free cores of the orthopyroxene (Figure 7d) indicate that both orthopyroxene and plagioclase were coevally nucleating and growing in the leuconorite, so both phases were on the liquidus. Orthopyroxene occurs as a relatively small number of large crystals compared to the numerous, smaller plagioclase crystals (Figure 7d), which indicates plagioclase had a greater nucleation rate and lower growth rate compared to orthopyroxene. The moderate SPO foliation fabric displayed by the plagioclase (Table 1) mimics the layer parallel foliation fabric in the underlying feldspathic orthopyroxenite. Similar to the feldspathic orthopyroxenite, it is suggested to have been enhanced through epitaxial growth [53] and magmatic flow [5]. While gravitational settling is not suggested to be an important process in the development of either the rock or the foliation fabric [85], it cannot be discounted from being a minor contributing process to the development of the rock.
The CSD plots for the plagioclase in the poikilitic anorthosite are linear with a downturn at the smallest crystal sizes (Figure 10e), indicating that the plagioclase crystallised in situ. The regular crystal structures [96] and quasi-equant crystal shapes [53] support the interpretation of heterogeneous nucleation and in situ crystal growth. The layer parallel foliation fabric, defined by a moderate SPO alignment of plagioclase crystals (Table 1), is again suggested to have been enhanced through epitaxial growth [53] and magmatic flow [5]. Importantly for the history of the unit, the CSD for the plagioclase chadacrysts is linear without a downturn at the smallest crystal sizes. Crystallisation of the oikocryst will preserve the size and grain shapes of the chadacrysts, providing a window into the early stages of rock solidification [65]. This allows the linear CSD plot to be associated with primary processes of nucleation and growth, rather than later textural modification [87]. Thus, the plot shape can be confidently associated with primary in situ growth of the plagioclase in the poikilitic anorthosite.
In situ nucleation and growth best describe the textural characteristics of the Merensky Unit and can explain the field observations of the development of chromitites along all irregularities in the temporary chamber floor (e.g., [6,7]). Magmatic flow, slumping of crystals and gravitational settling cannot account for formation of the entire unit, but texture variations indicate that they cannot be discounted from contributing to the development of the Merensky Unit.
4.2. Modification of Primary Textures within the Merensky Unit
4.2.1. Textural Modification through Equilibration
The effects of textural equilibration are seen in many igneous layered intrusions [65]. These effects are most readily seen in Cr-spinel, especially where it forms near monomineralic layers [54,58,60,63]. The lobate or amoeboidal shaped Cr-spinel crystals (Figure 6a) in contact with the megacrystic feldspathic orthopyroxenite have been suggested to develop during sintering as a process of textural equilibration [97]. Many of these crystals are associated with inclusions, some of which are circular and contain silicates that retain optical continuity with the surrounding silicates (Figure 6a). These may be true spherical inclusions (e.g., [98]) or tubular inclusions (e.g., [97]), both of which indicate sintering of crystals during processes of textural equilibration. The range of crystal sizes was observed to increase with proximity to the megacrystic feldspathic chromitite, with the largest crystals at the top of the basal chromitite and bottom of the middle chromitite. These larger crystals are often rounded (Figure 6a,b) with circular inclusions. This suggests that the increased grain sizes are reflective of enhanced textural equilibration around the megacrystic feldspathic orthopyroxenite. The downturn in the CSD plots at the smallest crystal sizes could be indicative of textural equilibration processes due to crystal growth reducing the number of smaller crystals [94,95]. However, it should be noted that this lack of small crystals could also be associated with primary processes of nucleation and growth.
The processes through which the megacrystic feldspathic orthopyroxenite formed are contentious within the literature—some authors suggest it has a pegmatitic origin, forming in conjunction with hydrous melts that were trapped within the cumulate pile (e.g., [11]). Other authors instead suggest it developed through extreme textural equilibration (e.g., [41]). Textural equilibration has already been noted to significantly modify the textures of the chromitites, as observed through the development of polygonal crystal aggregates, inclusions that retain optical continuity with the interstitial silicates [98], and the lobate or ameboidal crystal shapes [97]. The megacrystic feldspathic orthopyroxenite also displays textural features that have been linked to equilibration. These include rings of Cr-spinel grains hosted entirely within optically continuous orthopyroxene and olivine crystals and inclusions of plagioclase crystals with a tricuspidate shape [6,41]. Thus, textural equilibration has also, at least, modified the textures of the megacrystic feldspathic orthopyroxenite. Geochemical analyses do not show any enrichment in incompatible elements [6,41], indicating that it did not develop in conjunction with a hydrous melt; therefore, it is not a true pegmatite. Instead, the textural features described above were interpreted by Cawthorn and Boerst [41] to reflect primary features that were incorporated within single orthopyroxene or olivine grains during annealing and textural equilibration. The enhanced textural equilibration of the chromitites in contact with the megacrystic feldspathic orthopyroxenite provides further evidence for modification of this rock through textural equilibration. Textural equilibration in this extreme is unlikely to have occurred simply via variations in the degree of undercooling alone. Instead we follow Higgins [63] as well as Cawthorn and Boerst [41] in suggesting that an interstitial fluid must have been present. This would have allowed for more efficient diffusion of components, promoting crystal growth and developing the observed crystal sizes. The increased number of polymineralic inclusions in the coarser Cr-spinel crystals, which formed in association with a hydrous melt (e.g., [99]), provides evidence for the existence of this interstitial fluid.
The feldspathic orthopyroxenite is characterised by subhedral to euhedral orthopyroxene with many crystals displaying planar growth faces (Figure 6c,d and Figure 9a–c). Some crystals or portions of crystals display curved faces (Figure 6c,d), which are indicative of textural modification during equilibration, as a means of minimising the surface energy of the crystal [54,58,64,65]. All samples, except for EJH/15/069A, have a similar range of grain sizes and Lmax values (Table 1); however, the Ci values (Table 1) are variable around the chromitites. Around the chromitites (within 10 cm) the feldspathic orthopyroxenites have grain sizes between 0.49 and 7.80 mm, Lmax values between 4.49 to 5.67 mm and Ci values between 0.73 to 0.98 mm (Table 1). The feldspathic orthopyroxenites in the central portions of the “packages” have grain sizes between 0.50 and 4.81 mm, Lmax values between 3.41 to 5.44 mm and Ci values between 0.50 and 0.76 mm (Table 1). This indicates that comparable grain sizes and maximum crystal sizes have been achieved in all samples, but there is a significant difference in the Ci values. As the Ci value is calculated as −1/slope, this indicates that the slopes for the samples near the chromitites are significantly shallower than those in the central portions of the “packages”. The shallowing of the slopes is indicative of textural equilibration [63,68]; thus, we suggest that it reflects textural equilibration via variations in the degree of undercooling. One way this can be achieved is through temperature cycling in response to the addition of multiple magma batches (e.g., [73]). As the petrographic evidence indicates that multiple events contributed to the formation of the layers, temperature cycling in association with multiple replenishment events [73] is suggested to be responsible for the observed range of grain sizes.
The plagioclase within the leuconorite is typically subhedral (Figure 7c) with rounded crystal faces being common. Similar to the underlying feldspathic orthopyroxenite, this is suggested to result from textural modification during equilibration. The orthopyroxene oikocrysts within the leuconorite provide additional insight as they preserve the early texture of the plagioclase inclusions (e.g., [65]). The size of the plagioclase chadacrysts indicates that the plagioclase crystals outside the oikocrysts must have undergone growth during solidification. The plagioclase crystals within the poikilitic anorthosite typically show a granular texture with subhedral crystals (Figure 7e) that commonly have rounded crystal faces. Similar to the leuconorite, this is interpreted to reflect textural modification during equilibration, as curved crystal faces have lower surface energies [54].
4.2.2. Chemical Modification
There is no evidence of chemical zonation within the feldspathic orthopyroxenite (Figure 9a–c), apart from exsolution of clinopyroxene lamellae within the orthopyroxene crystals. The leuconorite and poikilitic anorthosite do, however, preserve chemical zonation within individual plagioclase crystals (Figure 9), which display relatively Ca-rich rims compared to crystal cores. This indicates that although the rocks visually resemble adcumulates, they are orthocumulates [65]. Therefore, overgrowth of the primary crystals must have occurred during solidification. There is no indication of any preferred orientation of this overgrowth, suggesting that overgrowth during magmatic flow (e.g., [5]) was not a significant process. Reverse zoning in plagioclase has been observed elsewhere in the Bushveld Complex with a variety of processes suggested (see review in [100]). The lack of textural indicators, such as embayment of plagioclase crystals or intergrowth of plagioclase and pyroxene (e.g., [100,101]), indicates that open-system processes cannot account for the zonation. Instead, we propose that the reverse zoning developed during the alteration of the primary mineral assemblage.
As the final mineral assemblage is identical in both the leuconorite and poikilitic anorthosite, we propose similar methods for assemblage modification. The leuconorite developed through (1) growth of primocryst plagioclase and orthopyroxene in a melt dominated system; (2) growth of clinopyroxene with plagioclase and orthopyroxene in a melt dominated system; (3) modification of the assemblage with plagioclase + orthopyroxene locally reacting to form clinopyroxene; and (4) at the final stages of solidification, orthopyroxene + clinopyroxene + plagioclase + a hydrous late-stage melt react to form amphibole and Ca-rich plagioclase, orthopyroxene also reacts with the hydrous late-stage melt to form biotite. This accounts for the reversely zoned plagioclase, the development of amphibole rims around clinopyroxene and orthopyroxene, and the development of biotite along fractures in the orthopyroxene (Figure 9h,i). The poikilitic anorthosite developed through (1) growth of primocryst plagioclase in a melt dominated system; (2) growth of clinopyroxene and orthopyroxene with plagioclase in a melt dominated system; (3) modification of the primocryst assemblage with plagioclase + orthopyroxene locally reacting to form clinopyroxene; and (4) at the final stages of solidification, orthopyroxene + clinopyroxene + plagioclase + a hydrous late-stage melt react to form amphibole and Ca-rich plagioclase. Again, the efficient diffusion of components through the melt [54,65] is suggested to account for the reversely zoned plagioclase in the groundmass (Figure 9k). The slight reverse zonation observed in the plagioclase crystals in the groundmass of each rock (Figure 9e,k) can be explained by efficient diffusion of components through the melt along grain boundaries (e.g., [54,65]). This would allow for overgrowth of the plagioclase by a slightly more anorthite-rich plagioclase.
4.2.3. Textural Modification through Compaction
All the rocks in the Merensky Unit have indicators of dynamic textural modification as markers of dislocation creep (undulose extinction, deformation twins and lenticular deformation lamellae [61]) are present and have been used to suggest compaction modified textures (e.g., [18,62]). These markers were observed in all silicate mineral species, including amphibole and biotite, which must have formed at a late stage during the development of the rock. The temperature required for dislocation creep to occur varies for each mineral phase: from >250 °C in biotite up to >700 °C for amphibole [102]. Therefore, the event that resulted in the dislocation creep must have occurred at high temperatures. There is evidence for regional low-grade metamorphism in the Transvaal Supergroup metasediments neighbouring the Bushveld Complex. The age of this metamorphism is disputed as to whether it occurred subsequent to the intrusion of the Bushveld Complex [103], or coevally [104]. Even if the former is true, the low temperature nature (250 to 300 °C) of this event [103] means it cannot be responsible for the formation of the dislocation creep features, as the plagioclase, clinopyroxene and amphibole, respectively, undergo dislocation creep at temperatures of >400 °C, >500 °C and >700 °C [102]. These high temperatures are instead much more likely to be associated with Bushveld magmatism. One study from the Northern Limb of the Bushveld Complex suggests a mean solidus temperature for the cumulate rocks of 732 ± 31 °C [105]. Thus, deformation during compaction at temperatures close to the solidus is the most likely cause of the observed features. The lack of evidence of dynamic recrystallisation, i.e., development of sub-grains [5,61], indicates that the rock did not undergo extensive deformation at high temperatures, so the textures were not extensively modified through compaction. This compaction is, however, likely to have enhanced fabric development within the rock and may have been a significant contributor to the development of the observed SPO.
4.3. Model for Development of the Merensky Unit
The textural data, including the linear CSD slope profiles, quasi-equant crystal shapes, regular crystal structures and orthocumulate textures are indicative of heterogeneous nucleation followed by in situ growth [53,68,96,106]. Due to this, we followed Latypov et al. [6,7] and expanded their model to the whole of the Merensky Unit. We infer initial replenishment with a dense magma, which became superheated during rapid adiabatic ascent. A superheated magma has been proposed, as adiabatic ascent of magma could, after taking into account various cooling mechanisms, result in superheating by ~10 °C [107]. This magma would have geologically instantaneously [108] spread out across the chamber floor as a basal flow. Prior to cooling, the superheated nature would result in widespread erosion and assimilation of the chamber floor (Figure 11a), with local development of potholes.
This model requires the lowermost rock layer to be the first to nucleate, which, in the case of the Merensky Unit, is the basal chromitite; thus, Cr-spinel must have nucleated first. Recent topological and thermodynamic modelling indicates that magmas could have been saturated in Cr-spinel on entering the Bushveld magma chamber [107], which supports the model. The basal chromitite is therefore suggested to have developed through heterogeneous nucleation and in situ growth of Cr-spinel at the interface between the crystal pile and basal magma (Figure 11b and Figure 12). Growth of Cr-spinel on the temporary magma chamber floor was likely accompanied, to a minor extent, by heterogeneous nucleation and in situ growth at the liquid–liquid interface between the basal magma and the stratified magma chamber (e.g., [51]). These crystals would have been gravitationally unstable and so settled on the floor, contributing to the non-linear CSD profiles. At this stage, the basal magma was vigorously convecting, which allowed for efficient scavenging of PGE resources from the magma. The second phase of nucleation was orthopyroxene with minor amounts of olivine and clinopyroxene. These phases likely also nucleated and grew in situ (Figure 11c), as heterogeneous nucleation onto a pre-existing substrate is kinetically favourable [53]. However, the CSD plots (Figure 10c,g) do not display linear slopes as would be expected from pure in situ crystallisation. These could be modifications from textural equilibration, but this indicates that gravitational settling and/or local plucking and remobilisation of crystals cannot be discounted as contributing to the development of the feldspathic orthopyroxenite. This is likely associated with heterogeneous nucleation and in situ growth of orthopyroxene at the liquid–liquid interface between the basal magma and the stratified magma chamber (e.g., [51]). Settling of these crystals would contribute to the curvature observed in the CSD profiles.
The multiple chromitites observed at Karee at varying stratigraphic heights throughout the feldspathic orthopyroxenite (Figure 3a,b) are each inferred to be associated with a replenishment event (Figure 11e,f and Figure 12); thus we suggest that multiple replenishment events contributed to the formation of the Merensky Unit. Each of these replenishment events is proposed to be associated with erosion (Figure 11d). The extensiveness of this erosion is suggested to vary, which accounts for the variation in reef types (Figure 2b) and truncation of some layers (Figure 4d). Enhanced erosion at spatially restricted ductile extensional zones could account for the excavation of potholes [109,110]. Evidence for bottom-up formation of the feldspathic orthopyroxenite sequence is indicated by these erosional contacts throughout the chromitite-feldspathic orthopyroxenite sequence, which are typically undulose (Figure 4a–c,e and Figure 5b,c). The feldspathic orthopyroxenite may have crystallised from the same batch of magma as the underlying chromitite. The modelled crystallisation sequence of an initially chromite-saturated magma subsequently crystallises orthopyroxene followed by plagioclase then clinopyroxene [107]; however, it is equally possible the feldspathic orthopyroxenite formed from a new injection of orthopyroxene-saturated magma.
The megacrystic feldspathic orthopyroxenite is not is not inferred to be primary, but instead we follow Cawthorn and Boerst [41] and consider it to have developed after initial crystallisation of a medium-grained feldspathic orthopyroxenite through melt-mediated growth during textural equilibration (Figure 11e). This growth is proposed to have occurred in conjunction with a replenishment event, as this would have increased the temperature of the crystal pile, while downwards infiltration of melt would have promoted crystal growth through effective diffusion. This also affected the bounding chromitites, with the Cr-spinel crystals in contact with the megacrystic feldspathic orthopyroxenite also undergoing enhanced equilibration. This contributed to the development of larger grain sizes in the portions of the chromitites that are in contact with medium-grained feldspathic orthopyroxenite.
While the leuconorite typically has a gradational contact with the feldspathic orthopyroxenite, this does not indicate a simple primary relationship. The variations in Mg#° reported by Wilson, Lee and Brown [80] are not consistent with simple fractionation resulting in the change from pyroxenite through to norite and leuconorite. Instead, these variations indicate that the contact between the feldspathic orthopyroxenite and leuconorite is representative of a new influx of magma (Figure 11g and Figure 12). The field observations of sharp contacts between feldspathic orthopyroxenite and leuconorite in association with potholes, observed during the present study and by others (e.g., [3,27]), are in accordance with a replenishment event at this contact. The gradational contact through norite may reflect a small amount of mixing of the replenishing magma with the magma that developed the leuconorite (Figure 11g). The relatively linear slope for the plagioclase CSD (Figure 10d) indicates that the plagioclase formed through in situ crystallisation, although, due to the extensive textural equilibration, gravitational settling cannot be ruled out as a contributing process to the development of the leuconorite.
The poikilitic anorthosite typically formed above a distinct boundary from the leuconorite (Figure 3b), which is suggestive of a sharp magmatic contact resulting from a replenishment event. This indicates a non-genetic relationship between these layers, which is confirmed by observations from authors who use the excess of plagioclase in the Merensky Unit and variations in 87Sr/86Sr to suggest that the rocks are not genetically related (e.g., [12,19]). Thus, magmatic replenishment must also have been key in the development of the poikilitic anorthosite (Figure 11h and Figure 12). The chadacrysts preserve more primary textures than the plagioclase crystals outside the oikocrysts. As their CSD plot (Figure 10e) displays a linear slope without significant evidence of textural equilibration, it indicates development through in situ nucleation. We follow Cawthorn and Spies [19] and suggest that the Merensky poikilitic anorthosite developed following emplacement of a plagioclase-saturated magma as a basal flow (Figure 11h). We differ in suggesting that this plagioclase-saturated magma was emplaced on top of the previously formed leuconorite, where it crystallised in situ. Thus, it was the final layer to develop within the Merensky Unit.
We conclude that, at Karee, there is evidence for the occurrence of at least five replenishment events during the formation of the Merensky Unit. These recharging melts need to be saturated in a range of components to generate the variety of layers from chromitite to poikilitic anorthosite. This does not require extreme compositional diversity as a melt can vary from orthopyroxene-saturated to chromite-saturated or plagioclase-saturated with minor compositional variations following the effects of pressure reduction (e.g., [107]). These compositional variations could develop in a staging chamber, during crustal transfer, or erosion and assimilation of a temporary chamber floor. These multiple replenishments mean that while the Merensky Unit crudely displays the features of a cyclic unit, i.e., upwards changes in mineralogy corresponding to a fractionation sequence, it is not a cyclic unit according to the terminology established by Irvine [25,26] as it did not form from a single fractionating batch of magma. We recommend the term Merensky Unit to avoid any genetic connotations that cannot account for the formation of the unit. Importantly, invoking numerous replenishment events during the development of the Merensky Unit helps to explain the range of field observations reported across the Bushveld Complex. Locally variable rates of solidification and compaction can preserve both gradational contacts, with low degrees of compaction and volumes of interstitial fluids, or sharp contacts where there were greater degrees of compaction and volumes of interstitial fluids. This is a significant step towards understanding the formation of the Merensky Unit and its PGE resources, while also accounting for the complex and wide-ranging set of field observations reported by many authors.
5. Conclusions
The first stage in the formation of the Merensky Unit was a replenishment event by a superheated magma. This rapidly spread over the magma chamber floor and resulted in widespread erosion, developing the undulating basal contact of the Merensky Unit and potholes in spatially restricted regions. The bulk of the chromitite-feldspathic orthopyroxenite “packages” are inferred to have formed in situ on the floor of the magma chamber, but processes of gravitational settling and local remobilisation of crystals cannot be discounted from contributing. Evidence for multiple replenishment events is preserved within the chromitite-feldspathic orthopyroxenite “packages”, with variable levels of erosion forming the observed range of “reef” types.
The overlying leuconorite is proposed to have formed following a further replenishment event by magma that was relatively more evolved than the magma that formed the feldspathic orthopyroxenite. This replenishment event was associated with mixing to develop the typical gradational contact, or with erosion in localised areas to form a sharp contact.
The poikilitic anorthosite is suggested to have formed following emplacement of a plagioclase-saturated magma above the leuconorite. The textural data indicate that the plagioclase crystallised in situ, with later crystallisation of the orthopyroxene and clinopyroxene oikocrysts, to form the poikilitic anorthosite. The final stages of development within the Merensky Unit were processes of compaction and textural equilibration, with local areas of the feldspathic orthopyroxenite coarsening in the presence of an interstitial melt to form the very coarse-grain sizes.
The multiple replenishment events with associated variable amounts of erosion may be key to explaining the range of field features described across the few hundred kilometres of strike in both the Western and Eastern Limbs. These events could have resulted in the potential for trapping varying amounts of interstitial fluid, which, combined with varying degrees of compaction, could have produced the range of field features described by many authors. Importantly, the multiple replenishment events required to form the Merensky Unit indicate that it is not a true cyclic unit. While consistency in terminology is recommended, future work should carefully consider how terms with genetic connotations are used to avoid misleading readers.
Supplementary Materials
The following are available online at https://www.mdpi.com/2075-163X/8/4/144/s1. The supplementary materials for this manuscript include the raw crystal size distribution (CSD) data. The element map data within Figure S1: sample EJH/15/068, feldspathic orthopyroxene; Figure S2: sample EJH/15/071, leuconorite groundmass, Figure S3: sample EJH/15/071, leuconorite oikocryst; Figure S4: sample EJH/15/072, poikilitic anorthosite groundmass, and Figure S5: sample EJH/15/072, poikilitic anorthosite oikocryst, Table S1: The electron probe microanalyser (EPMA) data for plagioclase within samples EJH/15/071 and EJH/15/072.
Acknowledgments
This work is derived from research supported by the National Research Foundation (NRF) of South Africa and the University of the Witwatersrand. Emma J. Hunt is supported through NRF research grant 87677, an NRF Innovation postdoctoral fellowship and a DST-NRF CIMERA postdoctoral fellowship. Rais Latypov is supported through NRF research grants 87677, 90834 and 91812. Péter Horváth is supported by an FRC grant from the University of the Witwatersrand. Any opinion, finding and conclusion or recommendation expressed in this material is that of the authors and the NRF does not accept any liability in this regard. The support of the DST-NRF Centre of Excellence for Integrated Mineral and Energy Resource Analysis (DST-NRF CIMERA) towards this research is hereby acknowledged. Opinions expressed and conclusions arrived at, are those of the authors’ and are not necessarily to be attributed to the CoE. The authors thank Lewis Ashwal for helpful discussions on the genesis of anorthosites; Grant Cawthorn for discussion of the tectonic history of the central Kaapvaal Craton; Dennis Hoffmann and Marian Holness for comments on an earlier version of the manuscript. Ryan McIntosh is acknowledged for assistance with drill core logging. The mine geologists at Lonmin Platinum are thanked for helpful discussions on many aspects of the Merensky Unit, their help with organizing underground visits and much assistance and advice during fieldwork. None of the above; however, bear any responsibility for the conclusions we have reached.
Author Contributions
E.J.H. and R.L. conceived the original idea; E.J.H. undertook the fieldwork and performed the petrographic and textural analyses; P.H. and E.J.H. performed mineral chemical analyses; E.J.H. analyzed and interpreted the field, petrographic and textural data; P.H. analyzed and interpreted the mineral chemical data. E.J.H. and R.L. wrote the original draft of the paper and all authors contributed to production of a final draft of the paper for peer review.
Conflicts of Interest
The authors declare no conflict of interest. The founding sponsors had no role in the design of the study; in the collection, analyses, or interpretation of data; in the writing of the manuscript, and in the decision to publish the results.
References
- Cawthorn, R.G. The Bushveld Complex, South Africa. In Layered Intrusions; Charlier, B., Namur, O., Latypov, R., Tegner, C., Eds.; Springer Geology: Dordrecht, The Netherlands, 2015; pp. 649–691. [Google Scholar]
- Namur, O.; Abily, B.; Boudreau, A.E.; Blanchette, F.; Bush, J.W.M.; Ceuleneer, G.; Charlier, B.; Donaldson, C.H.; Duchesne, J.-C.; Higgins, M.D.; et al. Igneous Layering in Basaltic Magma Chambers. In Layered Intrusions; Charlier, B., Namur, O., Latypov, R., Tegner, C., Eds.; Springer Geology: Dordrecht, The Netherlands, 2015; pp. 75–152. [Google Scholar]
- Mungall, J.E.; Kamo, S.L.; McQuade, S. U-Pb geochronology documents out-of-sequence emplacement of ultramafic layers in the Bushveld Igneous Complex of South Africa. Nat. Commun. 2016, 7, 13385. [Google Scholar] [CrossRef] [PubMed]
- Scoates, J.S.; Wall, C.J. Geochronology of Layered Intrusions. In Layered Intrusions; Charlier, B., Namur, O., Latypov, R., Tegner, C., Eds.; Springer Geology: Dordrecht, The Netherlands, 2015. [Google Scholar]
- Holness, M.B.; Vukmanovic, Z.; Mariani, E. Assessing the Role of Compaction in the Formation of Adcumulates: A Microstructural Perspective. J. Petrol. 2017, 58, 643–673. [Google Scholar] [CrossRef]
- Latypov, R.; Chistyakova, S.; Barnes, S.J.; Hunt, E.J. Origin of Platinum Deposits in Layered Intrusions by In Situ Crystallization: Evidence from Undercutting Merensky Reef of the Bushveld Complex. J. Petrol. 2017, 58, 715–761. [Google Scholar] [CrossRef]
- Latypov, R.; Chistyakova, S.; Page, A.; Hornsey, R. The Merensky Reef of the Bushveld Complex: Origin by In Situ Crystallization from a Basal Layer of Magma. J. Petrol. 2015, 56, 2341–2372. [Google Scholar] [CrossRef]
- Brynard, H.J.; De Villiers, J.P.R.; Viljoen, E.A. A Mineralogical Investigation of the Merensky Reef at the Western Platinum Mine, near Marikana, South Africa. Econ. Geol. 1976, 71, 1299–1307. [Google Scholar] [CrossRef]
- Vermaak, C.F. The Merensky Reef—Thoughts on its Environment and Genesis. Econ. Geol. 1976, 71, 1270–1298. [Google Scholar] [CrossRef]
- Kruger, F.J. The Merensky and Bastard cyclic units and the Platreef of the Bushveld Complex: Consequences of Main Zone magma influxes and dynamics. In Proceedings of the 4th International Platinum Conference, Platinum in Transition “Boom or Bust“, Sun City, North West, South Africa, 11–14 October 2010; Southern African Institute of Mining and Metallurgy: Johannesburg, South Africa, 2010; pp. 43–46. [Google Scholar]
- Nicholson, D.M.; Mathez, E.A. Petrogenesis of the Merensky Reef in the Rustenberg section of the Bushveld Complex. Contrib. Mineral. Petrol. 1991, 107, 293–309. [Google Scholar] [CrossRef]
- Lee, C.A.; Butcher, A.R. Cyclicity in the Sr isotope stratigraphy through the Merensky and Bastard Reef units, Atok section, Eastern Bushveld Complex. Econ. Geol. 1990, 85, 877–883. [Google Scholar] [CrossRef]
- Webb, S.J.; Cawthorn, R.G.; Nguuri, T.; James, D. Gravity modeling of Bushveld Complex connectivity supported by Southern African Seismic Experiment results. S. Afr. J. Geol. 2004, 107, 207–218. [Google Scholar] [CrossRef]
- Lonmin Platinum. Mineral Resource and Mineral Reserve Statement; Lonmin: Johannesburg, South Africa, 2016; p. 43. [Google Scholar]
- Eales, H.V.; Costin, G. Custally Contaminated Komatiite: Primary Source of the Chromitites and Marginal, Lower and Critical Zone Magmas in a Staging Chamber Beneath the Bushveld Complex. Econ. Geol. 2012, 107, 645–665. [Google Scholar] [CrossRef]
- Cawthorn, R.G. The platinum and palladium resources of the Bushveld Complex. S. Afr. J. Sci. 1999, 95, 481–489. [Google Scholar]
- Boudreau, A.E.; Kruger, F.J. Variation in the Composition of Apatite through the Merensky Cyclic Unit in the Western Busvheld Complex. Econ. Geol. 1990, 85, 737–745. [Google Scholar] [CrossRef]
- Roberts, M.D.; Reid, D.L.; Miller, J.A.; Basson, I.J.; Roberts, M.; Smith, D. The Merensky Cyclic Unit and its impact on footwall cumulates below Normal and Regional Pothole reef types in the Western Bushveld Complex. Mineralium Deposita 2007, 42, 271–292. [Google Scholar] [CrossRef]
- Cawthorn, R.G.; Spies, L. Plagioclase content of cyclic units in the Bushveld Complex, South Africa. Contrib. Mineral. Petrol. 2003, 145, 47–60. [Google Scholar] [CrossRef]
- Jackson, E.D. The Cyclic Unit in Layered Intrusions—A Comparison of Repetitive Stratigraphy in the Ultramafic Parts of the Stillwater, Muskox, Great Dyke, and Bushveld Complexes; Geological Society of South Africa Special Publications: Johannesburg, South Africa, 1970; Volume 1. [Google Scholar]
- Kruger, F.J. The origin of the Merensky cyclic unit: Sr-isotopic and mineralogical evidence for an alternative orthomagmatic model. Aust. J. Earth Sci. 1992, 39, 255–261. [Google Scholar] [CrossRef]
- Kruger, F.J.; Marsh, J.S. The Mineralogy, Petrology, and Origin of the Merensky Cyclic Unit in the Western Bushveld Complex. Econ. Geol. 1985, 80, 958–974. [Google Scholar] [CrossRef]
- Naldrett, A.J.; Wilson, A.; Kinnaird, J.; Chunnett, G. PGE tenor and metal ratios within and below the Merensky Reef, Busvheld Complex: Implications for its genesis. J. Petrol. 2009, 50, 625–659. [Google Scholar] [CrossRef]
- Scoon, R.N.; Teigler, B. Platinum-group mineralisation in the critical zone of the western Bushveld Complex; I, Sulphide poor-chromitites below the UG-2. Econ. Geol. 1994, 89, 1094–1121. [Google Scholar] [CrossRef]
- Irvine, T.N. Terminology for Layered Intrusions. J. Petrol. 1982, 23, 127–162. [Google Scholar] [CrossRef]
- Irvine, T.N. Processes involved in the formation and development of layered igneous rocks. In Origins of Igneous Layering; Parsons, I., Ed.; D. Reidel Publishing: Dordrecht, The Netherlands, 1987; Volume 196, pp. 649–656. [Google Scholar]
- Mitchell, A.A.; Scoon, R.N. The Merensky Reef at Winnaarshoek, Eastern Bushveld Complex: A primary magmatic hypothesis based on a wide reef facies. Econ. Geol. 2007, 102, 971–1009. [Google Scholar] [CrossRef]
- Naldrett, A.J. Stratiform PGE Deposits in layered intrusions. In Ore Deposition Associated with Magmas. Reviews in Economic Geology; Whitney, J.A., Naldrett, A.J., Eds.; Springer: Dordrecht, The Netherlands, 1989; pp. 135–166. [Google Scholar]
- Viljoen, M.J. The nature and origin of the Merensky Reef of the western Bushveld Complex based on geological facies and geophysical data. S. Afr. J. Geol. 1999, 102, 221–239. [Google Scholar]
- Campbell, I.H.; Naldrett, A.J.; Barnes, S.J. A model for the origin of platinum-rich sulphide horizons in the Bushveld and Stillwater complexes. J. Petrol. 1983, 24, 133–165. [Google Scholar] [CrossRef]
- Eales, H.V. Caveats in defining the magmas parental to the mafic rocks of the Bushveld Complex, and the manner of their emplacement: Review and commentary. Mineral. Mag. 2002, 66, 815–832. [Google Scholar] [CrossRef]
- Hutchinson, D.; Foster, J.; Prichard, H.; Gilbert, S. Concentration of Particulate Platinum-Group Minerals during Magma Emplacement; a Case Study from the Merensky Reef, Bushveld Complex. J. Petrol. 2015, 56, 113–159. [Google Scholar] [CrossRef]
- Maier, W.D.; Bowen, M.P. The UG2-Merensky Reef interval of the Bushveld Complex northwest of Pretoria. Miner. Depos. 1996, 31, 386–393. [Google Scholar]
- Lee, C.A. A Review of Mineralization in the Bushveld Complex and some other Layered Intrusions. In Layered Intrusions; Cawthorn, R.G., Ed.; Elsevier Science: Amsterdam, The Netherlands, 1996; Volume 15, pp. 103–145. [Google Scholar]
- Naldrett, A.J.; Kinnaird, J.; Wilson, A.; Yudoskaya, M.; McQuade, S.; Chunnett, G.; Stanley, C. Chromitite composition and PGE content of the Bushveld chromitites: Part 1—The Lower and Middle Groups. Appl. Earth Sci. 2009, 118, 131–161. [Google Scholar] [CrossRef]
- Walraven, F. Geochronology of the Rooiberg Group, Transvaal Supergroup, South Africa; Economic Geology Research Unit, University of the Witwatersrand: Johannesburg, South Africa, 1997; Volume 316. [Google Scholar]
- Zeh, A.; Ovtcharova, M.; Wilson, A.H.; Schaltegger, U. The Busvheld Complex was emplaced and cooled in less than one million years—Results of zirconology, and geotectonic implications. Earth Planet. Sci. Lett. 2015, 418, 103–114. [Google Scholar] [CrossRef]
- Walraven, F.; Hattingh, E. Geochronology of the Nebo Granite, Bushveld Complex. S. Afr. J. Geol. 1993, 96, 31–41. [Google Scholar]
- SACS. Stratigraphy of South Africa Handbook 8. Part 1: Lithostratigraphy of the Republic of South Africa, South West Africa/Namibia and the Republics of Bophuthatswana, Transkei and Venda, 1st ed.; Government Printer: Pretoria, South Africa, 1980; Volume 8.
- Cawthorn, R.G. The Platinum Group Element Deposits of the Bushveld Complex in South Africa. Platin. Met. Rev. 2010, 54, 205–215. [Google Scholar] [CrossRef]
- Cawthorn, R.G.; Boerst, K. Origin of the Pegmatitic Pyroxenite in the Merensky Unit, Bushveld Complex, South Africa. J. Petrol. 2006, 47, 1509–1530. [Google Scholar] [CrossRef]
- Le Maitre, R.W. Igneous Rocks A Classification and Glossary of Terms, 2nd ed.; Cambridge University Press: Cambridge, UK, 2002. [Google Scholar]
- Hunter, D. The Bushveld Complex and its Remarkable Rocks. Am. Sci. 1978, 66, 551–559. [Google Scholar]
- Ferguson, J.; Botha, E. Some aspects of igneous layering in the basic zones of the Bushveld Complex. Trans. Geol. Soc. S. Afr. 1963, 66, 259–278. [Google Scholar]
- Maier, W.D.; Barnes, S.-J.; Groves, D.I. The Bushveld Complex, South Africa: Formation of platinum–palladium, chrome- and vanadium-rich layers via hydrodynamic sorting of a mobilized cumulate slurry in a large, relatively slowly cooling, subsiding magma chamber. Miner. Depos. 2013, 48, 1–56. [Google Scholar] [CrossRef]
- Forien, M.; Tremblay, J.; Barnes, S.-J.; Burgisser, A.; Pagé, P. The role of viscous particle segregation in forming chromite layers from slumped crystal slurries: Insights from analogue experiements. J. Petrol. 2015, 56, 2425–2444. [Google Scholar] [CrossRef]
- Boudreau, A.E. Modeling the Merensky Reef, Busvheld Complex, Republic of South Africa. Contrib. Mineral. Petrol. 2008, 156, 431–437. [Google Scholar] [CrossRef]
- Campbell, I.H. Some problems with the cumulus theory. Lithos 1978, 11, 311–323. [Google Scholar] [CrossRef]
- Jackson, E.D. Primary Textures and Mineral Associations in the Ultramafic Zone of the Stillwater Complex, Montana; US Geological Survey: Washington, DC, USA, 1961. [Google Scholar]
- Langmuir, C.H. Geochemical consequences of in situ crystallization. Nature 1989, 340, 199–205. [Google Scholar] [CrossRef]
- Martin, D. Crystal settling and in situ crystallization in aqueous solutions and magma chambers. Earth Planet. Sci. Lett. 1990, 96, 336–348. [Google Scholar] [CrossRef]
- McBirney, A.R.; Noyes, R.M. Crystallization and layering of the Skaergaard Intrusion. J. Petrol. 1979, 20, 487–554. [Google Scholar] [CrossRef]
- Campbell, I.H. Fluid Dynamic Processes in Basaltic Magma Chambers. In Layered Intrusions: Developments in Petrology; Cawthorn, R.G., Ed.; Elsevier Science, B.V.: Amsterdam, The Netherlands, 1996; pp. 45–76. [Google Scholar]
- Hunter, R.H. Texture development in cumulate rocks. In Layered Intrusions; Cawthorn, R.G., Ed.; Elsevier Science, B.V.: Amsterdam, The Netherlands, 1996; Volume 15, pp. 77–101. [Google Scholar]
- Voordouw, R.; Gutzmer, J.; Beukes, N.J. Intrusive origin for Upper Group (UG1, UG2) stratifrom chromitite seams in the Dwars River area, Busvheld Complex, South Africa. Mineral. Petrol. 2009, 97, 75–94. [Google Scholar] [CrossRef]
- Higgins, M.D. Imaging birefringent minerals without extinction using circularly polarized light. Can. Mineral. 2010, 48, 231–235. [Google Scholar] [CrossRef]
- Marsh, B.D. Crystal size distribution (CSD) in rocks and the kinetics and dynamics of crystallization I. Theory. Contrib. Mineral. Petrol. 1988, 99, 277–291. [Google Scholar] [CrossRef]
- Higgins, M.D. Quantitative Textural Measurements in Igneous & Metamorphic Petrology; Cambridge University Press: Cambridge, UK, 2006; p. 265. [Google Scholar]
- Cashman, K.V.; Marsh, B.D. Crystal size distribution (CSD) in rocks and the kinetics and dynamics of crystallization II: Makaopuhi lava lake. Contrib. Mineral. Petrol. 1988, 99, 292–305. [Google Scholar] [CrossRef]
- Marsh, B.D. On the interpretation of crystal size distributions in magmatic systems. J. Petrol. 1998, 39, 553–599. [Google Scholar] [CrossRef]
- Vernon, R.H. A Practical Guide to rock Microstructure; Cambridge University Press: Cambridge, UK, 2004; p. 594. [Google Scholar]
- Boorman, S.; Boudreau, A.; Kruger, F.J. The Lower Zone-Critical Zone Transition of the Bushveld Complex: A Quantitative Textural Study. J. Petrol. 2004, 45, 1209–1235. [Google Scholar] [CrossRef]
- Higgins, M.D. Textural coarsening in igneous rocks. Int. Geol. Rev. 2011, 53, 354–376. [Google Scholar] [CrossRef]
- Holness, M.B.; Vernon, R.H. The Influence of Interfacial Energies on Igneous Microstructures. In Layered Intrusions; Charlier, B., Namur, O., Latypov, R., Tegner, C., Eds.; Springer Geology: Dordrecht, The Netherlands, 2015. [Google Scholar]
- Hunter, R.H. Textural Equilibrium in Layered Igneous Rocks. In Origins of Igneous Layering; Parsons, I., Ed.; D. Reidel Publishing: Dordrecht, The Netherlands, 1987; Volume 196, pp. 473–503. [Google Scholar]
- Toramaru, A.; Matsumoto, M. Numerical experiment of cyclic layering in a solidified binary eutectic melt. J. Geophys. Res. 2012, 117, B02209. [Google Scholar] [CrossRef]
- Higgins, M.D. Measurement of crystal size distributions. Am. Mineral. 2000, 85, 1105–1116. [Google Scholar] [CrossRef]
- Waters, C.; Boudreau, A.E. A reevaluation of crystal-size distributions in chromite cumulates. Am. Mineral. 1996, 81, 1452–1459. [Google Scholar] [CrossRef]
- Cabane, H.; Laporte, D.; Provost, A. Experimental investigation of the kinetics of Ostwald ripening of quartz in silicic melts. Contrib. Mineral. Petrol. 2001, 142, 361–373. [Google Scholar] [CrossRef]
- Cabane, H.; Laporte, D.; Provost, A. An experimental study of Ostwald ripening of olivine and plagioclase in silicate melts: Implications for the growth and size of crystals in magmas. Contrib. Mineral. Petrol. 2005, 150, 37–53. [Google Scholar] [CrossRef]
- DeHoff, R.T. A geometrically general theory of diffusion controlled coarsening. Acta Metall. Mater. 1991, 39, 2349–2360. [Google Scholar] [CrossRef]
- Higgins, M.D. Origin of Anorthosite by Textural Coarsening: Quantitative Measurements of a Natural Sequence of Textural Development. J. Petrol. 1998, 39, 1307–1323. [Google Scholar] [CrossRef]
- Simakin, A.G.; Bindeman, I.N. Evolution of crystal sizes in the series of dissolution and precipitation events in open magma systems. J. Volcanol. Geotherm. Res. 2008, 177, 997–1010. [Google Scholar] [CrossRef]
- Schneider, C.A.; Rasband, W.S.; Eliceiri, K.W. NIH Image to ImageJ: 25 years of image analysis. Nat. Methods 2012, 9, 671–675. [Google Scholar] [CrossRef] [PubMed]
- Morgan, D.J.; Jerram, D.A. On estimating crystal shape for crystal size distribution analysis. J. Volcanol. Geotherm. Res. 2006, 154, 1–7. [Google Scholar] [CrossRef]
- Mock, A.; Jerram, D.A. Crystal Size Distribution (CSD) in Three Dimensions: Insights from the 3D Reconstruction of a Highly Porphyritic Rhyolite. J. Petrol. 2005, 46, 1525–1541. [Google Scholar] [CrossRef]
- Higgins, M.D. Origin of megacrysts in granitoids by textural coarsening: A crystal size distribution (CSD) study of microcline in the Cathedral Peak Granodiorite, Sierra Nevada, California. In Understanding Granites: Integrating New and Classical Techniques; Castro, A., Fernández, C., Vigneresse, J.L., Eds.; Geological Society London, Special Publications: London, UK, 1999; Volume 168, pp. 207–219. [Google Scholar]
- Smith, D.S.; Basson, I.J.; Reid, D.L. Normal Reef Subfacies of the Merensky Reef at Northam Platinum Mine, Zwartklip Facies, Western Bushveld Complex, South Africa. Can. Mineral. 2003, 42, 243–260. [Google Scholar] [CrossRef]
- Wagner, P.A. The Platinum Deposits and Mines of South Africa; Oliver & Boyd: Edinburgh, UK, 1929; p. 326. [Google Scholar]
- Wilson, A.H.; Lee, C.A.; Brown, R.T. Geochemistry of the Merensky Reef, Rustenburg section, Bushveld Complex: Controls on the silicate framework and distribution of trace elements. Miner. Depos. 1999, 34, 657–672. [Google Scholar] [CrossRef]
- Barnes, S.-J.; Maier, W. Platinum-group elements and microstructures from Impala Platinum Mines, Bushveld Complex. J. Petrol. 2002, 43, 103–128. [Google Scholar] [CrossRef]
- Higgins, M.D. Closure in crystal size distributions (CSD), verification of CSD calculations, and the significance of CSD fans. Am. Mineral. 2002, 87, 171–175. [Google Scholar] [CrossRef]
- Brown, R.; Retired, Mpumulanga, South Africa. Personal communication, 2017.
- Arndt, N.; Jenner, G.; Ohnenstetter, M.; Deloule, E.; Wilson, A.H. Trace elements in the Merensky Reef and adjacent norites Bushveld Complex South Africa. Miner. Depos. 2005, 40, 550–575. [Google Scholar] [CrossRef]
- Brothers, R.N. Petrofabric analyses of Rhum and Skaergaard layered rocks. J. Petrol. 1964, 5, 255–274. [Google Scholar] [CrossRef]
- Maier, W.; Barnes, S.-J. Platinum-group elements in the UG1 and UG2 chromitites, and the Bastard reef, at Impala platinum mine, western Bushveld Complex, South Africa: Evidence for late magmatic cumulate instability and reef constitution. S. Afr. J. Geol. 2008, 111, 159–176. [Google Scholar] [CrossRef]
- Williams, E.; Boudreau, A.E.; Boorman, S.; Kruger, F.J. Textures of orthopyroxenites from the Burgersfort bulge of the eastern Bushveld Complex, Republic of South Africa. Contrib. Mineral. Petrol. 2006, 151, 480. [Google Scholar] [CrossRef]
- Holness, M.B.; University of Cambridge, Cambridge, UK. Personal communication, 2017.
- Ildefonse, B.; Launeau, P.; Bouchez, J.-L. Effect of mechanical interactions on the development of shape preferred orientations: A two-dimensional experimental approach. J. Struct. Geol. 1992, 14, 73–83. [Google Scholar] [CrossRef]
- Ildefonse, B.; Arbaret, L.; Diot, H. Rigid particles in simple shear flow: Is their preferred orientation periodic or steady-state? In Granite: From Segregation of Melt to Emplacement Fabrics; Bouchez, J.-L., Hutton, D.W., Stephens, W.E., Eds.; Kluwer Academic Publishers: Dordrecht, The Netherlands, 1997; pp. 177–185. [Google Scholar]
- Davies, I.C.; Walker, R.G. Transport and deposition of resedimented conglomerates: The Cap Enrage Formation, Cambro-Ordovician, Gaspé, Quebec. J. Sediment. Petrol. 1974, 44, 1200–1216. [Google Scholar]
- Rust, B.R. Pebble orientation in fluvial sediments. J. Sediment. Petrol. 1972, 42, 384–388. [Google Scholar]
- Wall, C.J.; Scoates, J.S.; Weis, D.; Friedman, R.M.; Amini, M.; Meurer, W.P. The Stillwater Complex: Integrating Zircon Geochronological and Geochemical Constraints on the Age, Emplacement History and Crystallization of a Large, Open-System Layered Intrusion. J. Petrol. 2018, accepted. [Google Scholar] [CrossRef]
- Boudreau, A.E. Mineral segregation during crystal aging in two-crystal, two-component systems. S. Afr. J. Geol. 1994, 97, 473–485. [Google Scholar]
- Boudreau, A.E. Crystal aging and the formation of fine-scale igneous layering. Mineral. Petrol. 1995, 54, 55–69. [Google Scholar] [CrossRef]
- Emmerich, H.; Virnau, P.; Wilde, G.; Spatschek, R. Heterogeneous nucleation and microstructure formation: Steps towards a system and scale bridging understanding. Eur. Phys. J. Spec. Top. 2014, 223, 337–346. [Google Scholar] [CrossRef]
- Vukmanovic, Z.; Barnes, S.J.; Reddy, S.M.; Godel, B.; Fiorentini, M.L. Morphology and microstructure of chromite crystals in chromitites from the Merensky Reef (Bushveld Complex, South Africa). Contrib. Mineral. Petrol. 2013, 165, 1031–1050. [Google Scholar] [CrossRef]
- Hulbert, L.J.; Von Gruenewaldt, G. Textural and Compositional Features of Chromite in the Lower and Critical Zones of the Bushveld Complex South of Potgietersrus. Econ. Geol. 1985, 80, 872–895. [Google Scholar] [CrossRef]
- Li, C.; Ripley, E.M.; Sarkar, A.; Shin, D.; Maier, W.D. Origin of phlogopite-orthopyroxene inclusions in chromites from the Merensky Reef of the Bushveld Complex, South Africa. Contrib. Mineral. Petrol. 2005, 150, 119–130. [Google Scholar] [CrossRef]
- Roelofse, F.; Ashwal, L.D.; Pineda-Vargas, C.A.; Pryzbylowicz, W.J. Enigmatic textures developed along plagioclase-augite grain boundaries at the base of the Main Zone, Northern Limb, Bushveld Complex—Evidence for late stage melt infiltration into a nearly solidified crystal mush. S. Afr. J. Geol. 2009, 112, 39–46. [Google Scholar] [CrossRef]
- Hayes, B.; Ashwal, L.D.; Webb, S.J.; Bybee, G.M. Large-scale magmatic layering in the Main Zone of the Bushveld Complex and episodic downward magma infiltration. Contrib. Mineral. Petrol. 2017, 172, 13. [Google Scholar] [CrossRef]
- Passchier, C.W.; Trouw, R.A.J. Microtectonics, 2nd ed.; Springer: Berlin/Heidelberg, Germany, 2005. [Google Scholar]
- Alexandre, P.; Andreoli, M.A.G.; Jamison, A.; Gibson, R.L. 40Ar/39Ar age constraints on low-grade metamorphism and cleavage development in the Transvaal Supergroup (central Kaapvaal craton, South Africa): Implications for the tectonic setting of the Bushveld Igneous Complex. S. Afr. J. Geol. 2006, 109, 393–410. [Google Scholar] [CrossRef]
- Reimold, W.U.; Wittek, A.; Jourdan, F. Comment on 40Ar/39Ar age constraints on low-grade metamorphism and cleavage development in the Transvaal Supergroup (central Kaapvaal craton, South Africa): Implications for the tectonic setting of the Bushveld Igneous Complex (South African Journal of Geology, 109, 393–410), by Alexandre et al. (2006). S. Afr. J. Geol. 2007, 110, 157–159. [Google Scholar]
- Buthelezi, M.; Ashwal, L.D.; Horváth, P. Application of titanium-in-quartz geothermometry to magmatic quartz in evolved rocks from the Bushveld Complex, South Africa. S. Afr. J. Geol. 2017, 120.2, 241–250. [Google Scholar]
- Campbell, I.H. Distribution of Orthocumulate Textures in the Jimberlana Intrusion. J. Geol. 1987, 95, 35–53. [Google Scholar] [CrossRef]
- Latypov, R.; Costin, G.; Chistyakova, S.; Hunt, E.J.; Mukherjee, R.; Naldrett, T. Platinum-bearing chromite layers are caused by pressure reduction during magma ascent. Nat. Commun. 2018, 9, 462. [Google Scholar] [CrossRef] [PubMed]
- Barnes, S.J.; Robertson, J.C. Time scales and length scales in magma flow pathways and the origin of magmatic Ni-Cu-PGE ore deposits. Geosci. Front. 2018, in press. [Google Scholar]
- Carr, H.W.; Groves, D.I.; Cawthorne, R.G. The Importance of Synmagmatic Deformation in the Formation of Merensky Reef Potholes in the Bushveld Complex. Econ. Geol. 1994, 89, 1398–1410. [Google Scholar] [CrossRef]
- Carr, H.W.; Kruger, F.J.; Groves, D.I.; Cawthorn, R.G. The petrogenesis of Merenksy Reef potholes at the Western Platinum Mine, Bushveld Complex: Sr-istopic evidence for synmagmatic deformation. Minera. Depos. 1999, 34, 335–347. [Google Scholar] [CrossRef]
Figure 1.
(a) Sketch map of the Bushveld Complex, modified from Webb, et al. [13] (Published with permission of the Geological Society of South Africa); (b) Map of the Lonmin Marikana properties indicating the location of the field study area in the K3 Shaft with workings on the Merensky Unit (blue). Note: Karee Mine consists of the 1B/4B, K3 and K4 workings. Adapted from Lonmin Platinum [14] with permission from © Lonmin Platinum; (c) Schematic stratigraphic column of the Critical Zone, indicating locations of the Merensky Unit (MU) and underlying chromitites, modified from Eales and Costin [15].

Figure 2.
(a) Drill core log through the Merensky sequence from the FW 2 poikilitic anorthosite to the Bastard Unit (BU) pyroxenite, core courtesy of Lonmin Platinum; (b) Type variations of the Merensky Reef at Karee Mine, data courtesy of Lonmin Platinum; (c) Megacrystic feldspathic orthopyroxenite; (d) Feldspathic orthopyroxenite; (e) HW 1 leuconorite; (f) HW 2 poikilitic anorthosite. Abbreviations: MR = Merensky Reef, FW = footwall, HW = hanging wall.

Figure 3.
(a) Sketch of drill core through the Merensky Unit from FW1a to BU; (b) Photograph of the drill core, green lines denotes the positions of chromitites, yellow lines indicate contacts between layers and dashed lines are gradational contacts; (c–f) Closer views of contacts outlined in (a), black arrows indicate the way up. (c) Basal contact of Merensky Unit with underlying poikilitic anorthosite of FW 1a, contact is marked by the basal chromite and overlain by megacrystic feldspathic pyroxenite; (d) Merensky Reef middle chromite between underlying megacrystic feldspathic pyroxenite and overlying feldspathic pyroxenite; (e) Merensky Reef upper chromitite sandwiched between feldspathic pyroxenite; (f) Transitional contact between feldspathic pyroxenite and overlying leuconorite of HW 1.

Figure 4.
(a) Relatively planar basal contact of Merensky Unit with thin basal chromitite, note that the megacrystic feldspathic orthopyroxenite is absent; (b) Undulating basal contact of the Merensky Unit with “patchy” megacrystic feldspathic orthopyroxenite; (c) Basal chromitite thickens within “dimple”; (d) Discontinuous basal chromitite at the Merensky Unit—Footwall contact; (e) Middle chromitite at contact between megacrystic feldspathic orthopyroxenite and feldspathic orthopyroxenite; (f) Medium-grained feldspathic orthopyroxenite within the Merensky Unit; for scale, the pencil is 14 cm long.
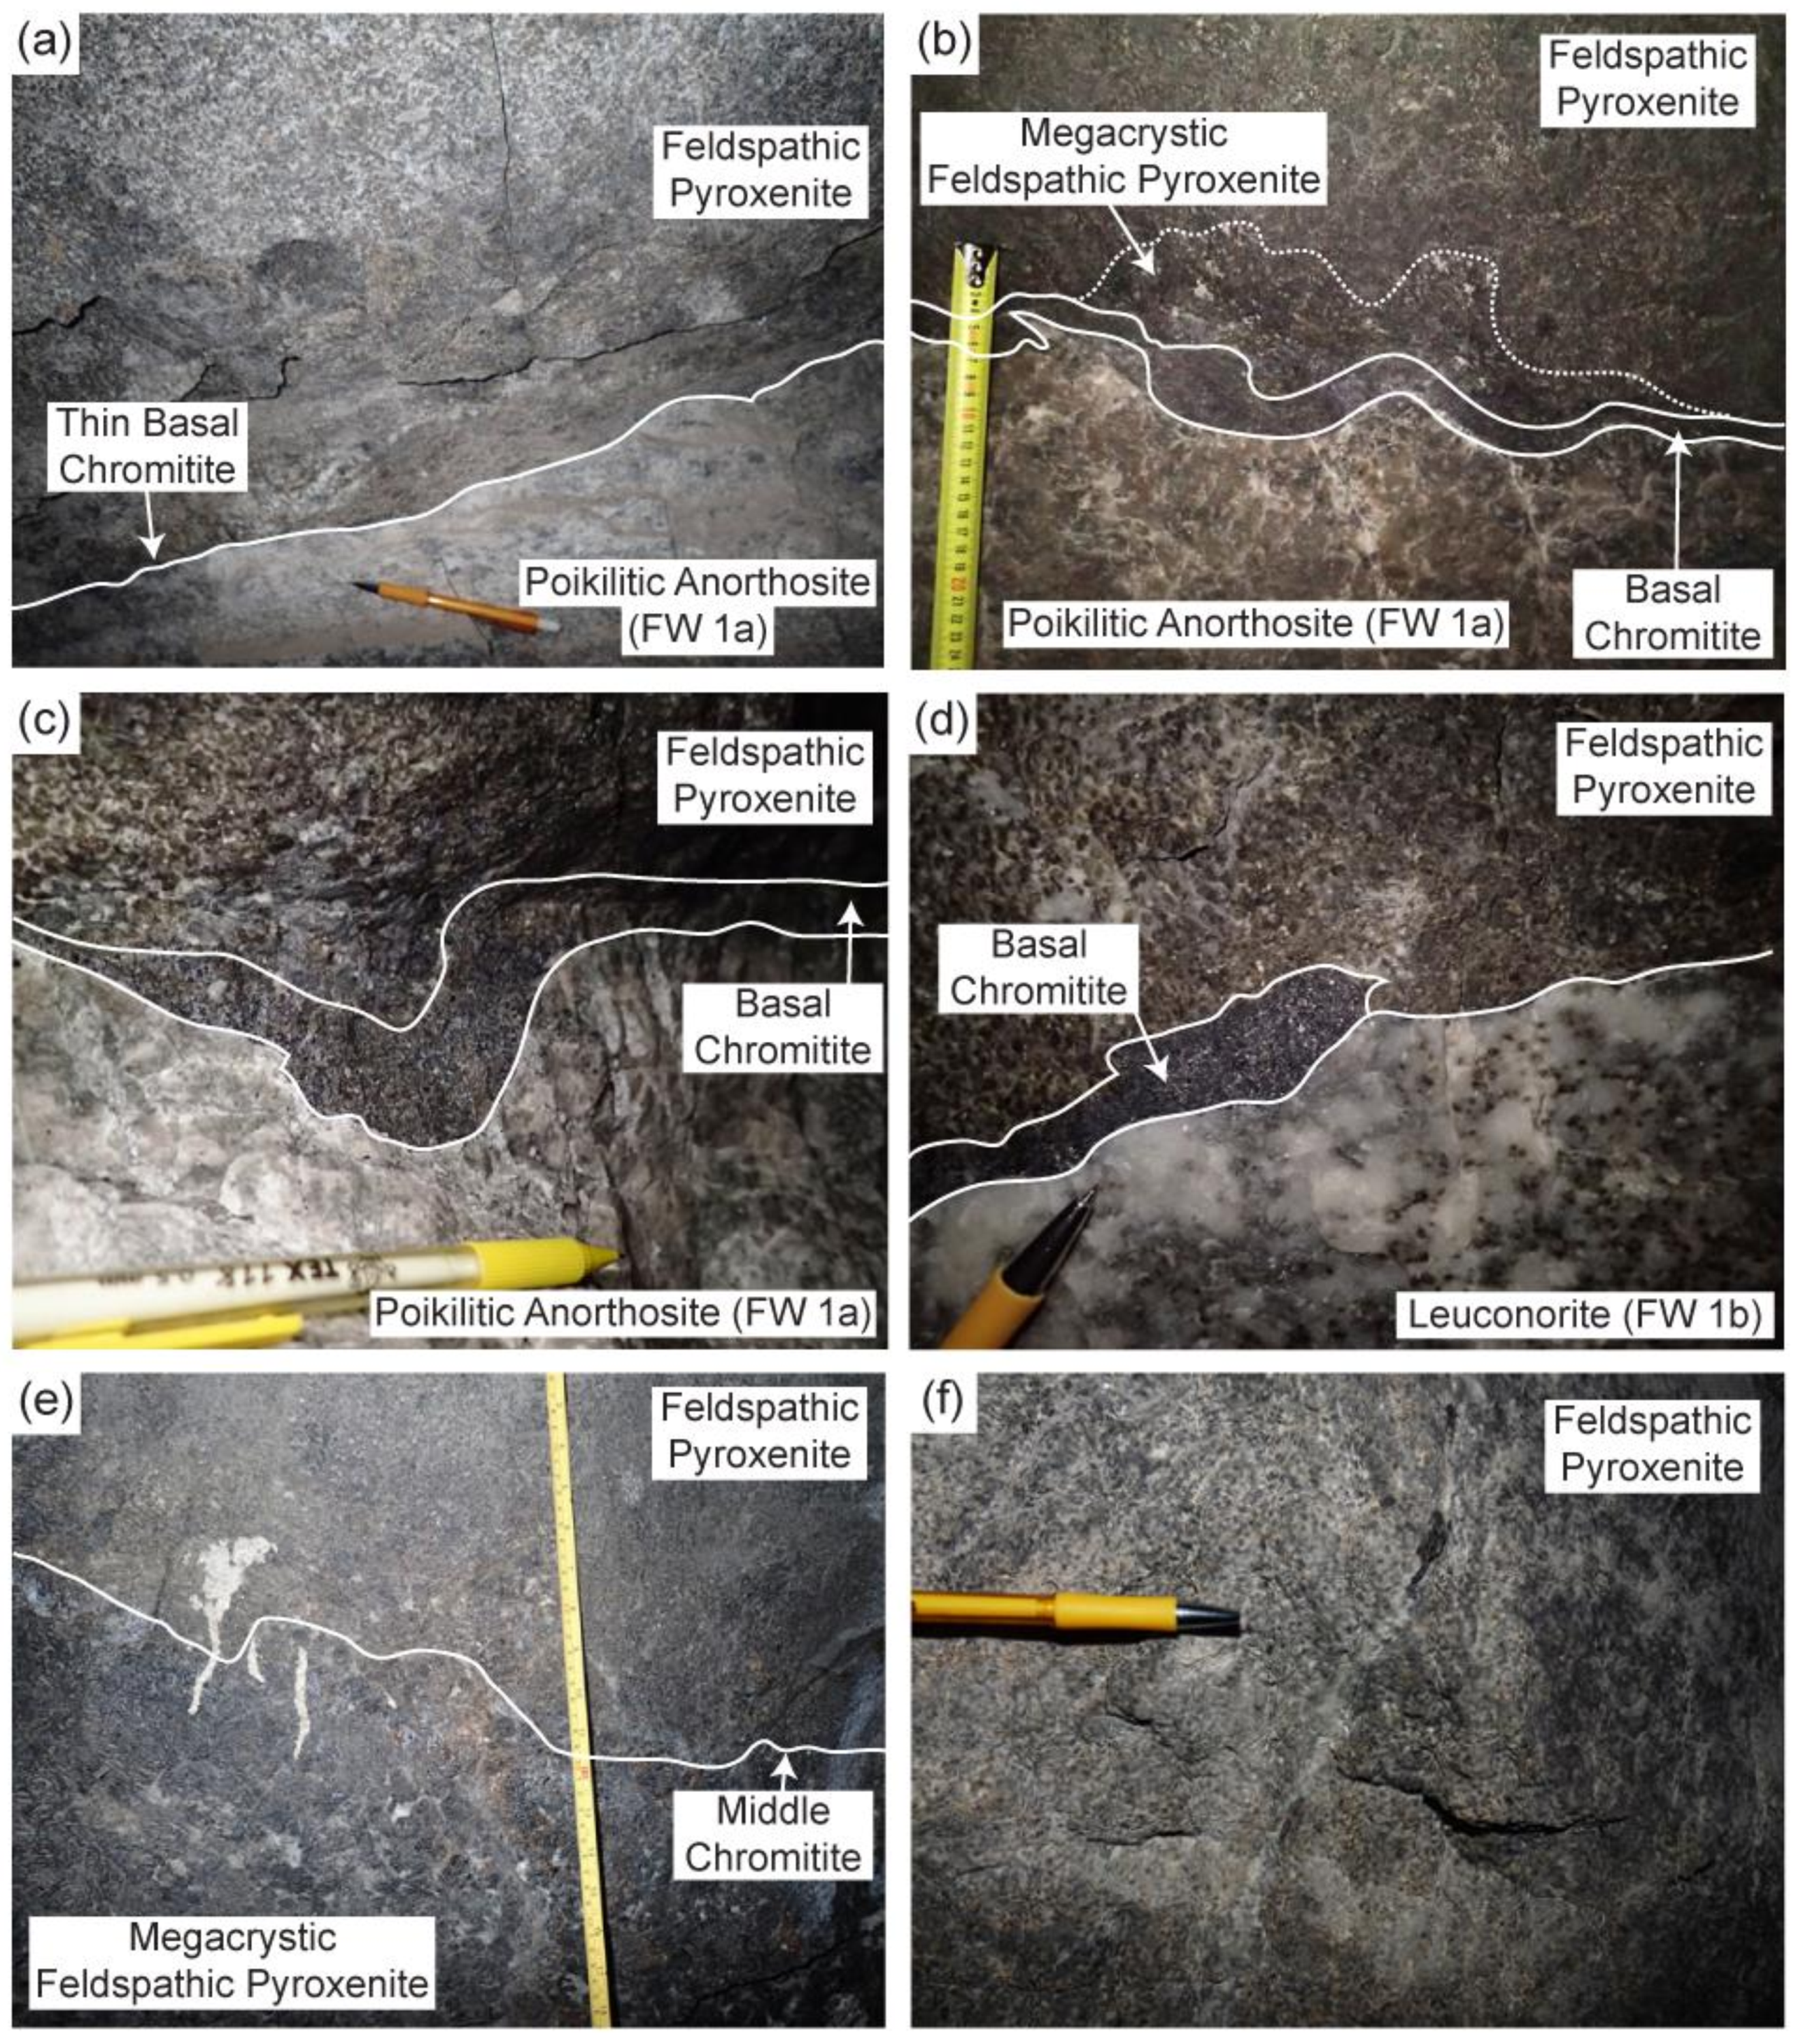
Figure 5.
(a) Upper chromitite within the feldspathic orthopyroxenite, with patches of megacrystic feldspathic orthopyroxenite; (b) Gradational contact between feldspathic orthopyroxenite, transitional norite and hanging wall leuconorite; (c) Gradational contact between feldspathic orthopyroxenite and hanging wall leuconorite; (d) HW 1, “spotted” leuconorite; (e) HW 2, “mottled” poikilitic anorthosite; (f) Sharp contact between HW 2 and the Bastard Unit pyroxenite marked by a serpentinised shear zone; for scale, the pencil is 14 cm long.

Figure 6.
Photomicrographs from the Merensky Unit, photographed under differential interference contrast (DIC) as an approximation of circularly polarised light (CPL). Way up of all photographs is to the right: (a) Basal chromitite with circular/tubular inclusions and lobate Cr-spinel grains; (b) Middle chromitite with large Cr-spinel grains at the base in contact with megacrystic feldspathic orthopyroxene; (c) Feldspathic orthopyroxenite with subhedral to euhedral Opx grains and oikocrystic Plag; (d) Feldspathic orthopyroxenite with subhedral to euhedral Opx grains and oikocrystic Plag; (e) Large oikocrystic Cpx grain hosting small, euhedral to anhedral Opx grains (dashed lines); (f) Disseminated Cr-spinel grains within feldspathic orthopyroxenite; Abbreviations: Opx = orthopyroxene; Cpx = clinopyroxene; Chr = Cr-spinel; Plag = plagioclase; Bi = biotite.

Figure 7.
Photomicrographs from the Merensky Unit, photographed under differential interference contrast (DIC) as an approximation of circularly polarised light (CPL); all photographs are the correct way up: (a) Interstitial sulphides in feldspathic orthopyroxenite; (b) Upper chromitite with mix of rounded and angular Cr-spinel grains; (c) HW 1 leuconorite Plag groundmass; (d) HW 1 leuconorite with oikocrystic Opx grains; (e) HW 2 poikilitic anorthosite Plag groundmass; (f) HW 2 poikilitic anorthosite with tabular plagioclase grains hosted in a single Opx oikocryst; Abbreviations: Opx = orthopyroxene; Cpx = clinopyroxene; Chr = Cr-spinel; Plag = plagioclase.

Figure 8.
Variation of modal % orthopyroxene (Opx) with vertical height through the Merensky Reef. Modal percentage measured at sample points marked by green circles from hand-digitised texture maps and visually estimated throughout the remainder of the Merensky sequence. Note the abrupt increases above the chromitites (dashed black lines). Megacrystic F. pyroxenite = megacrystic feldspathic orthopyroxenite, F. pyroxenite = feldspathic orthopyroxenite.

Figure 9.
Ca (centre) and Fe (right) element maps for (a–c) Merensky feldspathic orthopyroxenite; (d–f) HW 1 leuconorite plagioclase; (g–i) Orthopyroxene within HW 1 leuconorite; (j–l) HW 2 poikilitic anorthosite plagioclase; and (m–p) HW 2 orthopyroxene oikocryst with plagioclase chadacrysts. Anorthite contents are marked by #. All photomicrographs (left) were taken under differential interference contrast (DIC) as an approximation of circularly polarised light; scale is identical to element maps of the same area. Opx = orthopyroxene; Cpx = clinopyroxene; Chr = Cr-spinel; Plag = plagioclase; Bi = Biotite; Amph = amphibole. Larger versions of these maps are available in the online supplementary material (Figures S1–S5).

Figure 10.
CSD plots for the Merensky Unit, divided according to rock type and mineral phase analysed. RPM type with stratigraphic column (a) indicating the vertical location of each sample with CSD plots for (b) chromitite, (c) feldspathic orthopyroxenite, (d) leuconorite, (e) poikilitic anorthosite; Marikana type with stratigraphic column (f) indicating the vertical location of each sample with CSD plot for (g) feldspathic orthopyroxenite. Note, plot scales vary but are constant for each mineral analysed.
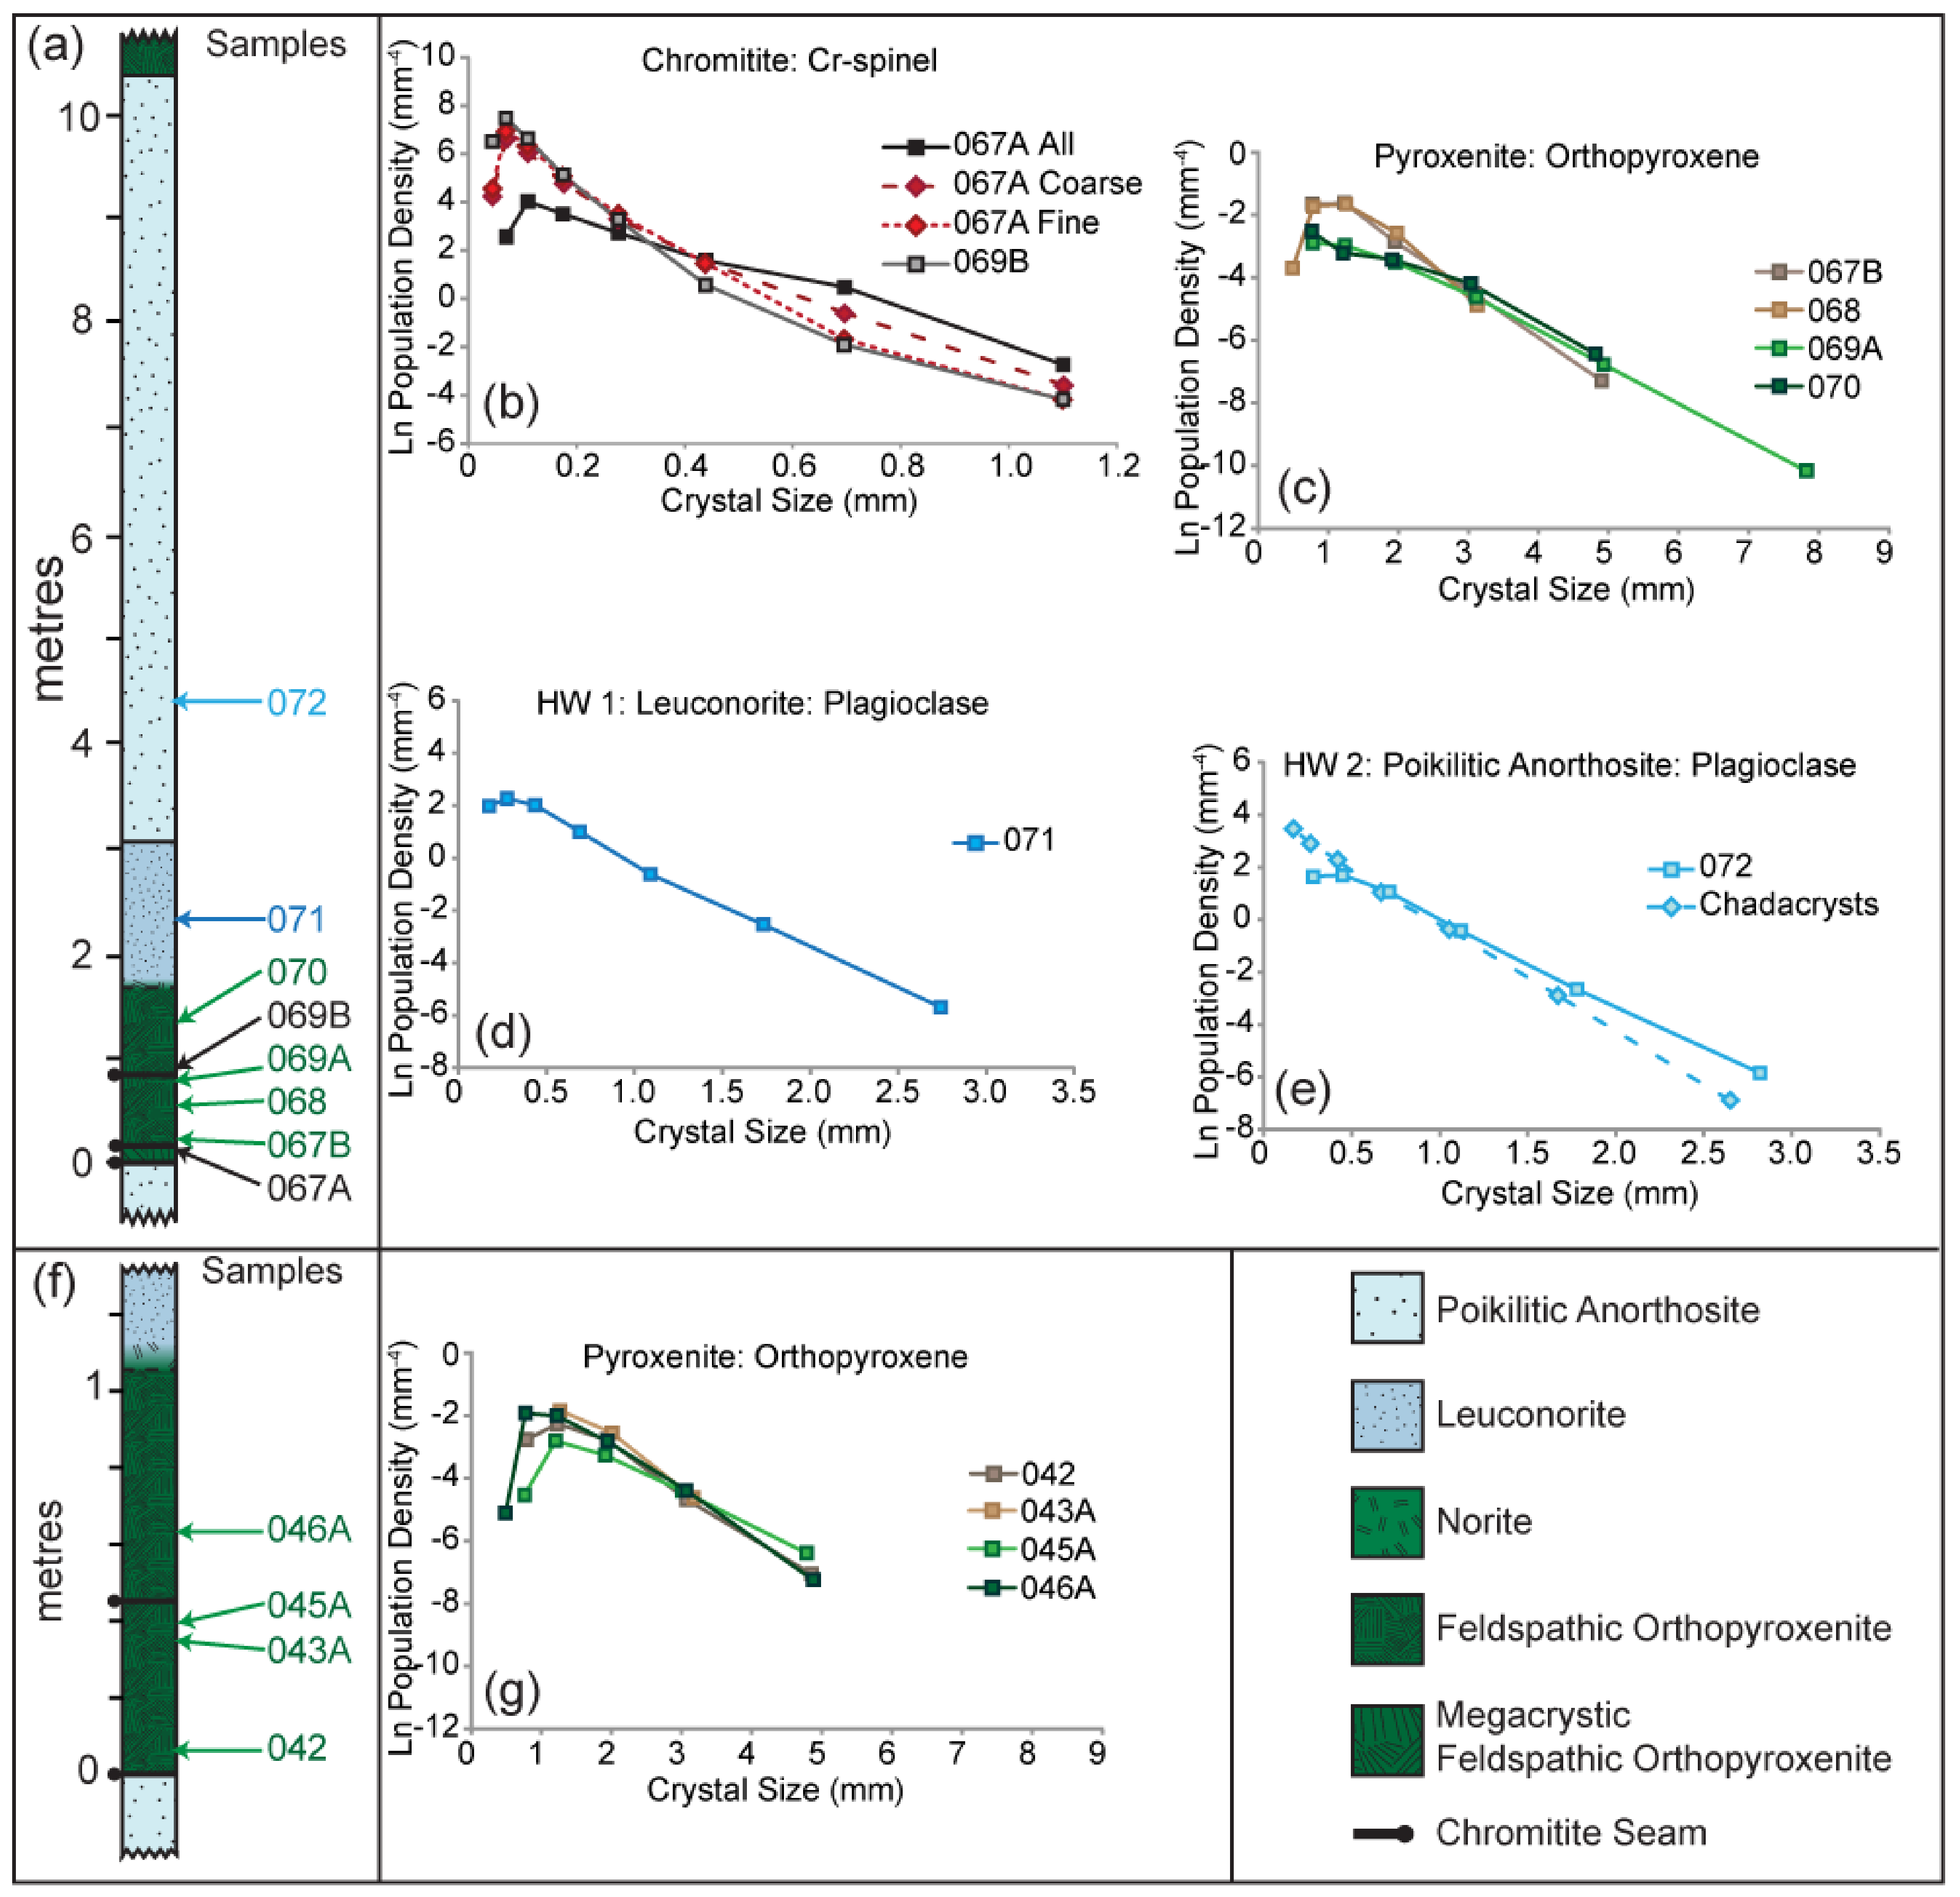
Figure 11.
Model of processes forming the Merensky Unit: (a) Replenishment by a superheated melts results in erosion of the chamber floor; (b) Cr-spinel forms in situ from chromite-saturated magma; (c) Orthopyroxene forms in situ from orthopyroxene-saturated magma; (d) Further replenishment by superheated magma results in erosion; (e) Fluid-mediated textural coarsening develops the megacrystic feldspathic orthopyroxenite and Cr-spinel forms in situ from chrome-saturated magma; (f) Multiple replenishment events with associated erosion and subsequent in situ crystallisation develop the chromite-feldspathic orthopyroxenite sequence; (g) Leuconorite develops above a gradational boundary due to mixing combined with in situ crystallisation of orthopyroxene and plagioclase from orthopyroxene- and plagioclase-saturated magma; (h) In situ crystallisation of plagioclase from plagioclase-saturated magma develops the poikilitic anorthosite; Chr = Cr-spinel; Opx = orthopyroxene, Plag = plagioclase.

Figure 12.
Simplified model indicating, on the right, the minimum number of replenishment events involved within the accumulation of the Merensky Unit and thus, the minimum number of sub-units. On the left, processes and events that modified the Merensky Unit are shown, with (1) development of reversely zoned plagioclase in the leuconorite and poikilitic anorthosite; (2) textural equilibration; and (3) compaction.


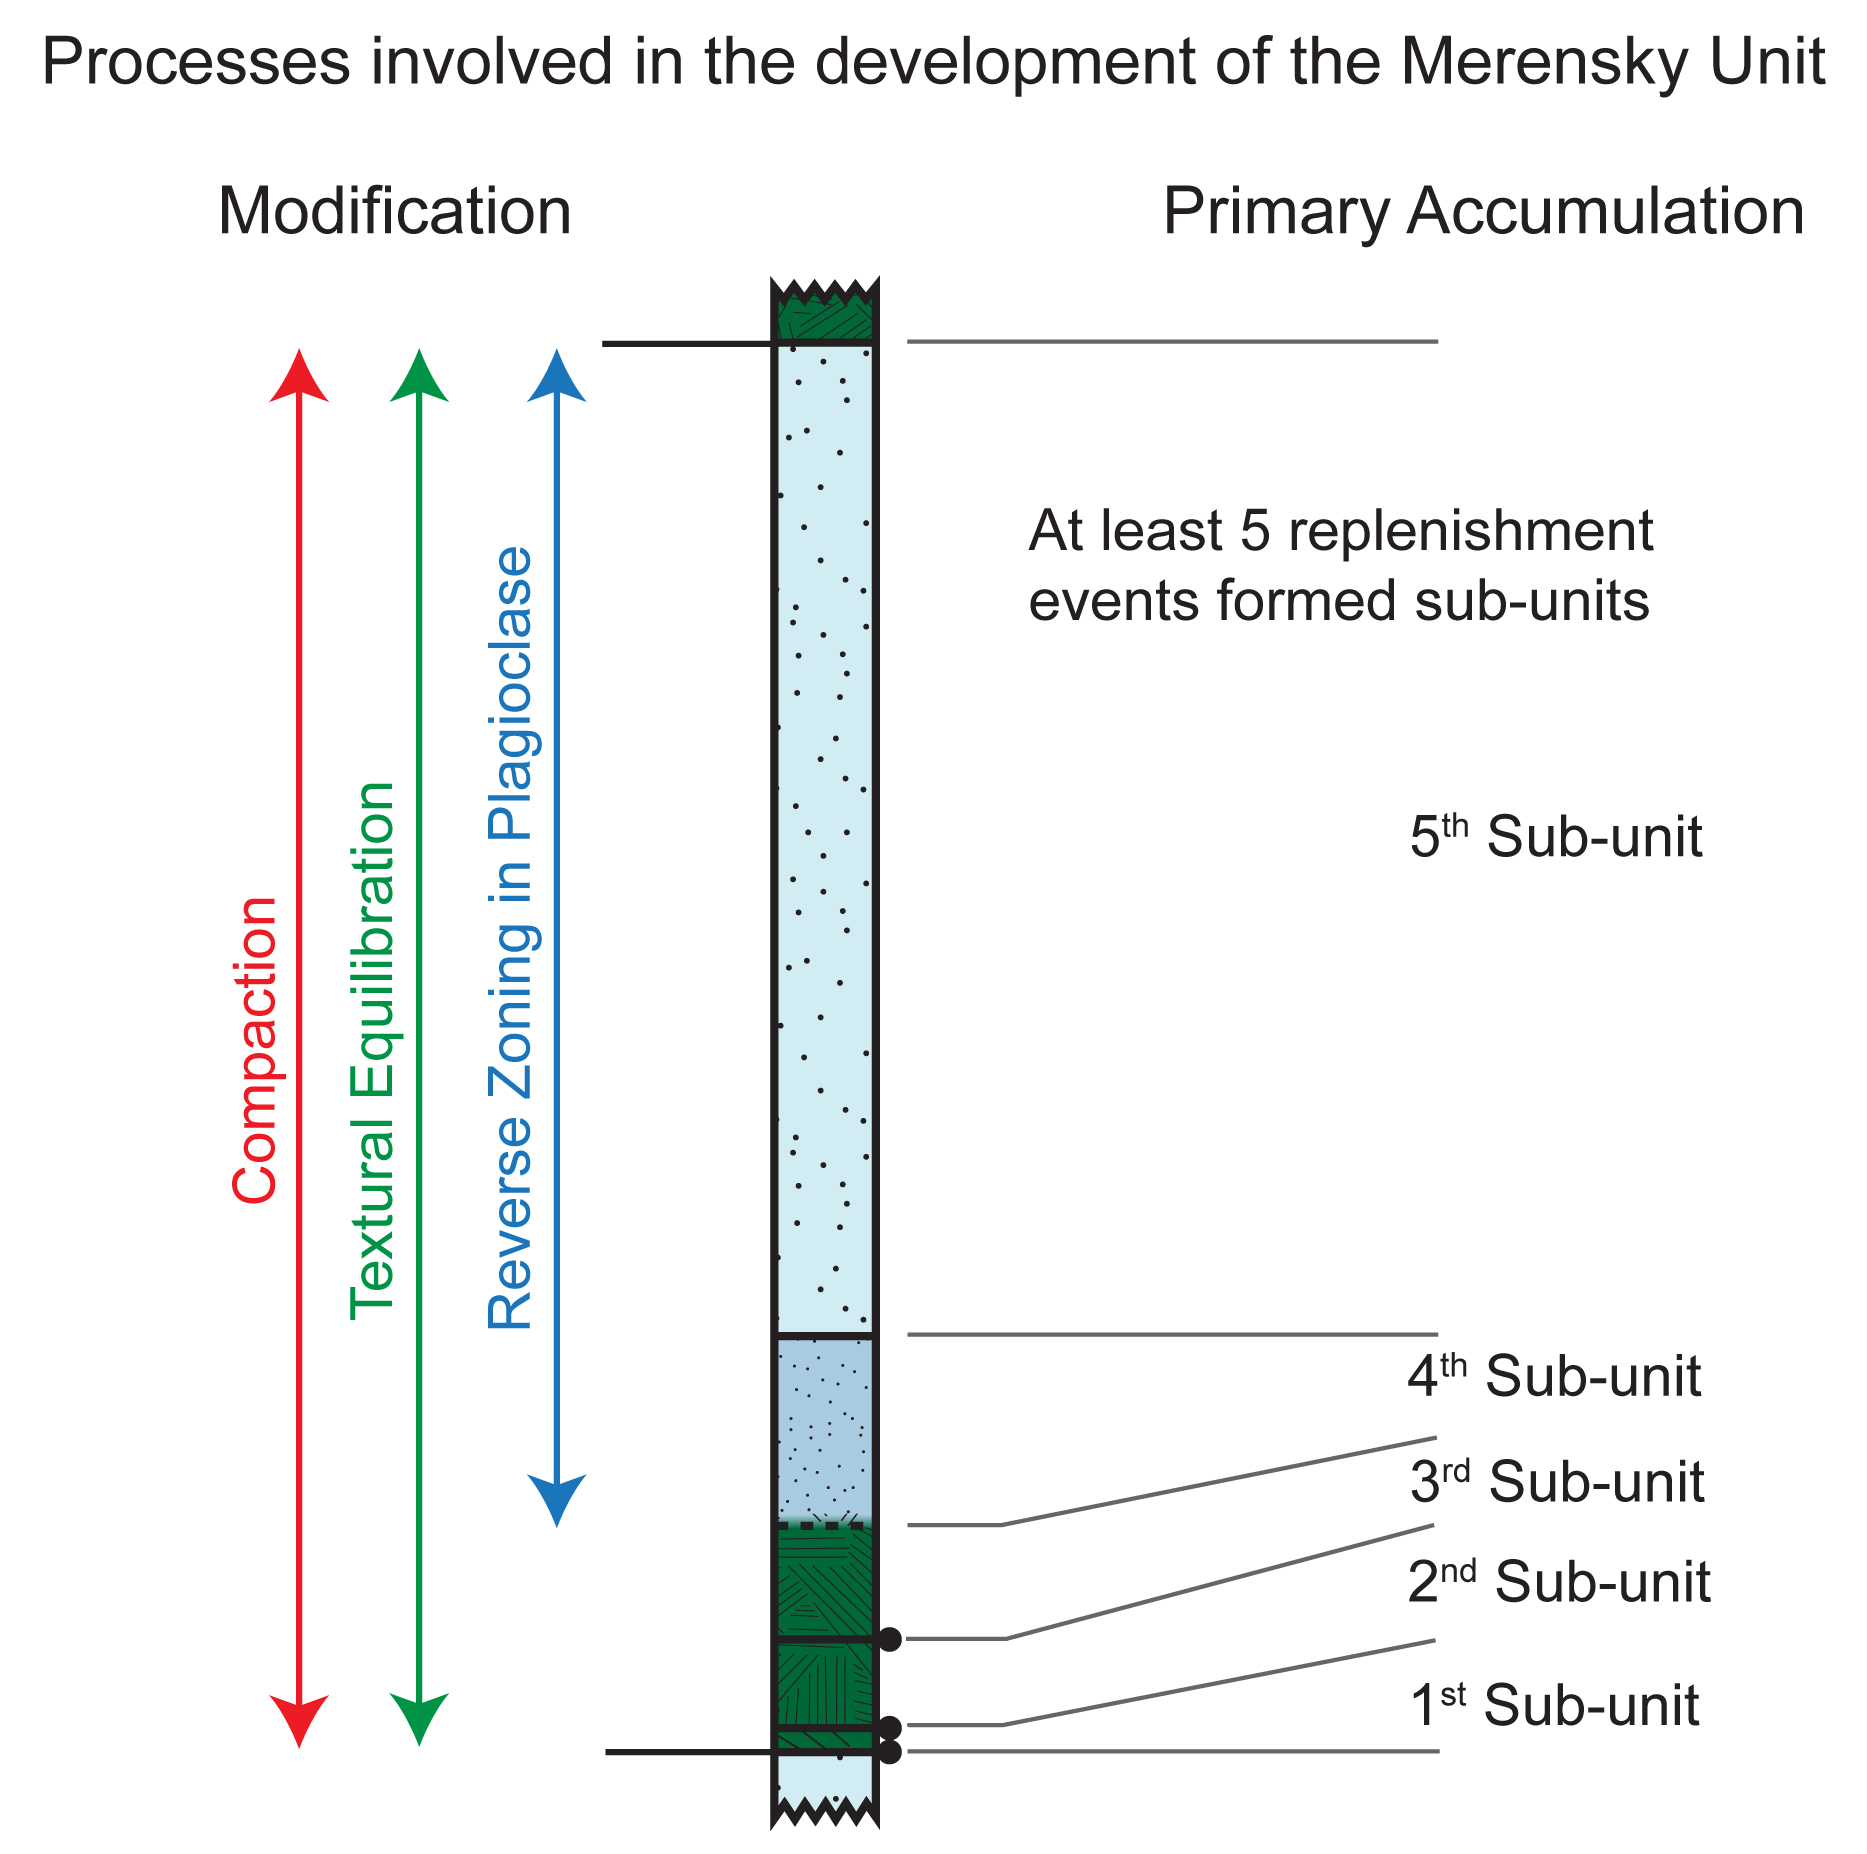
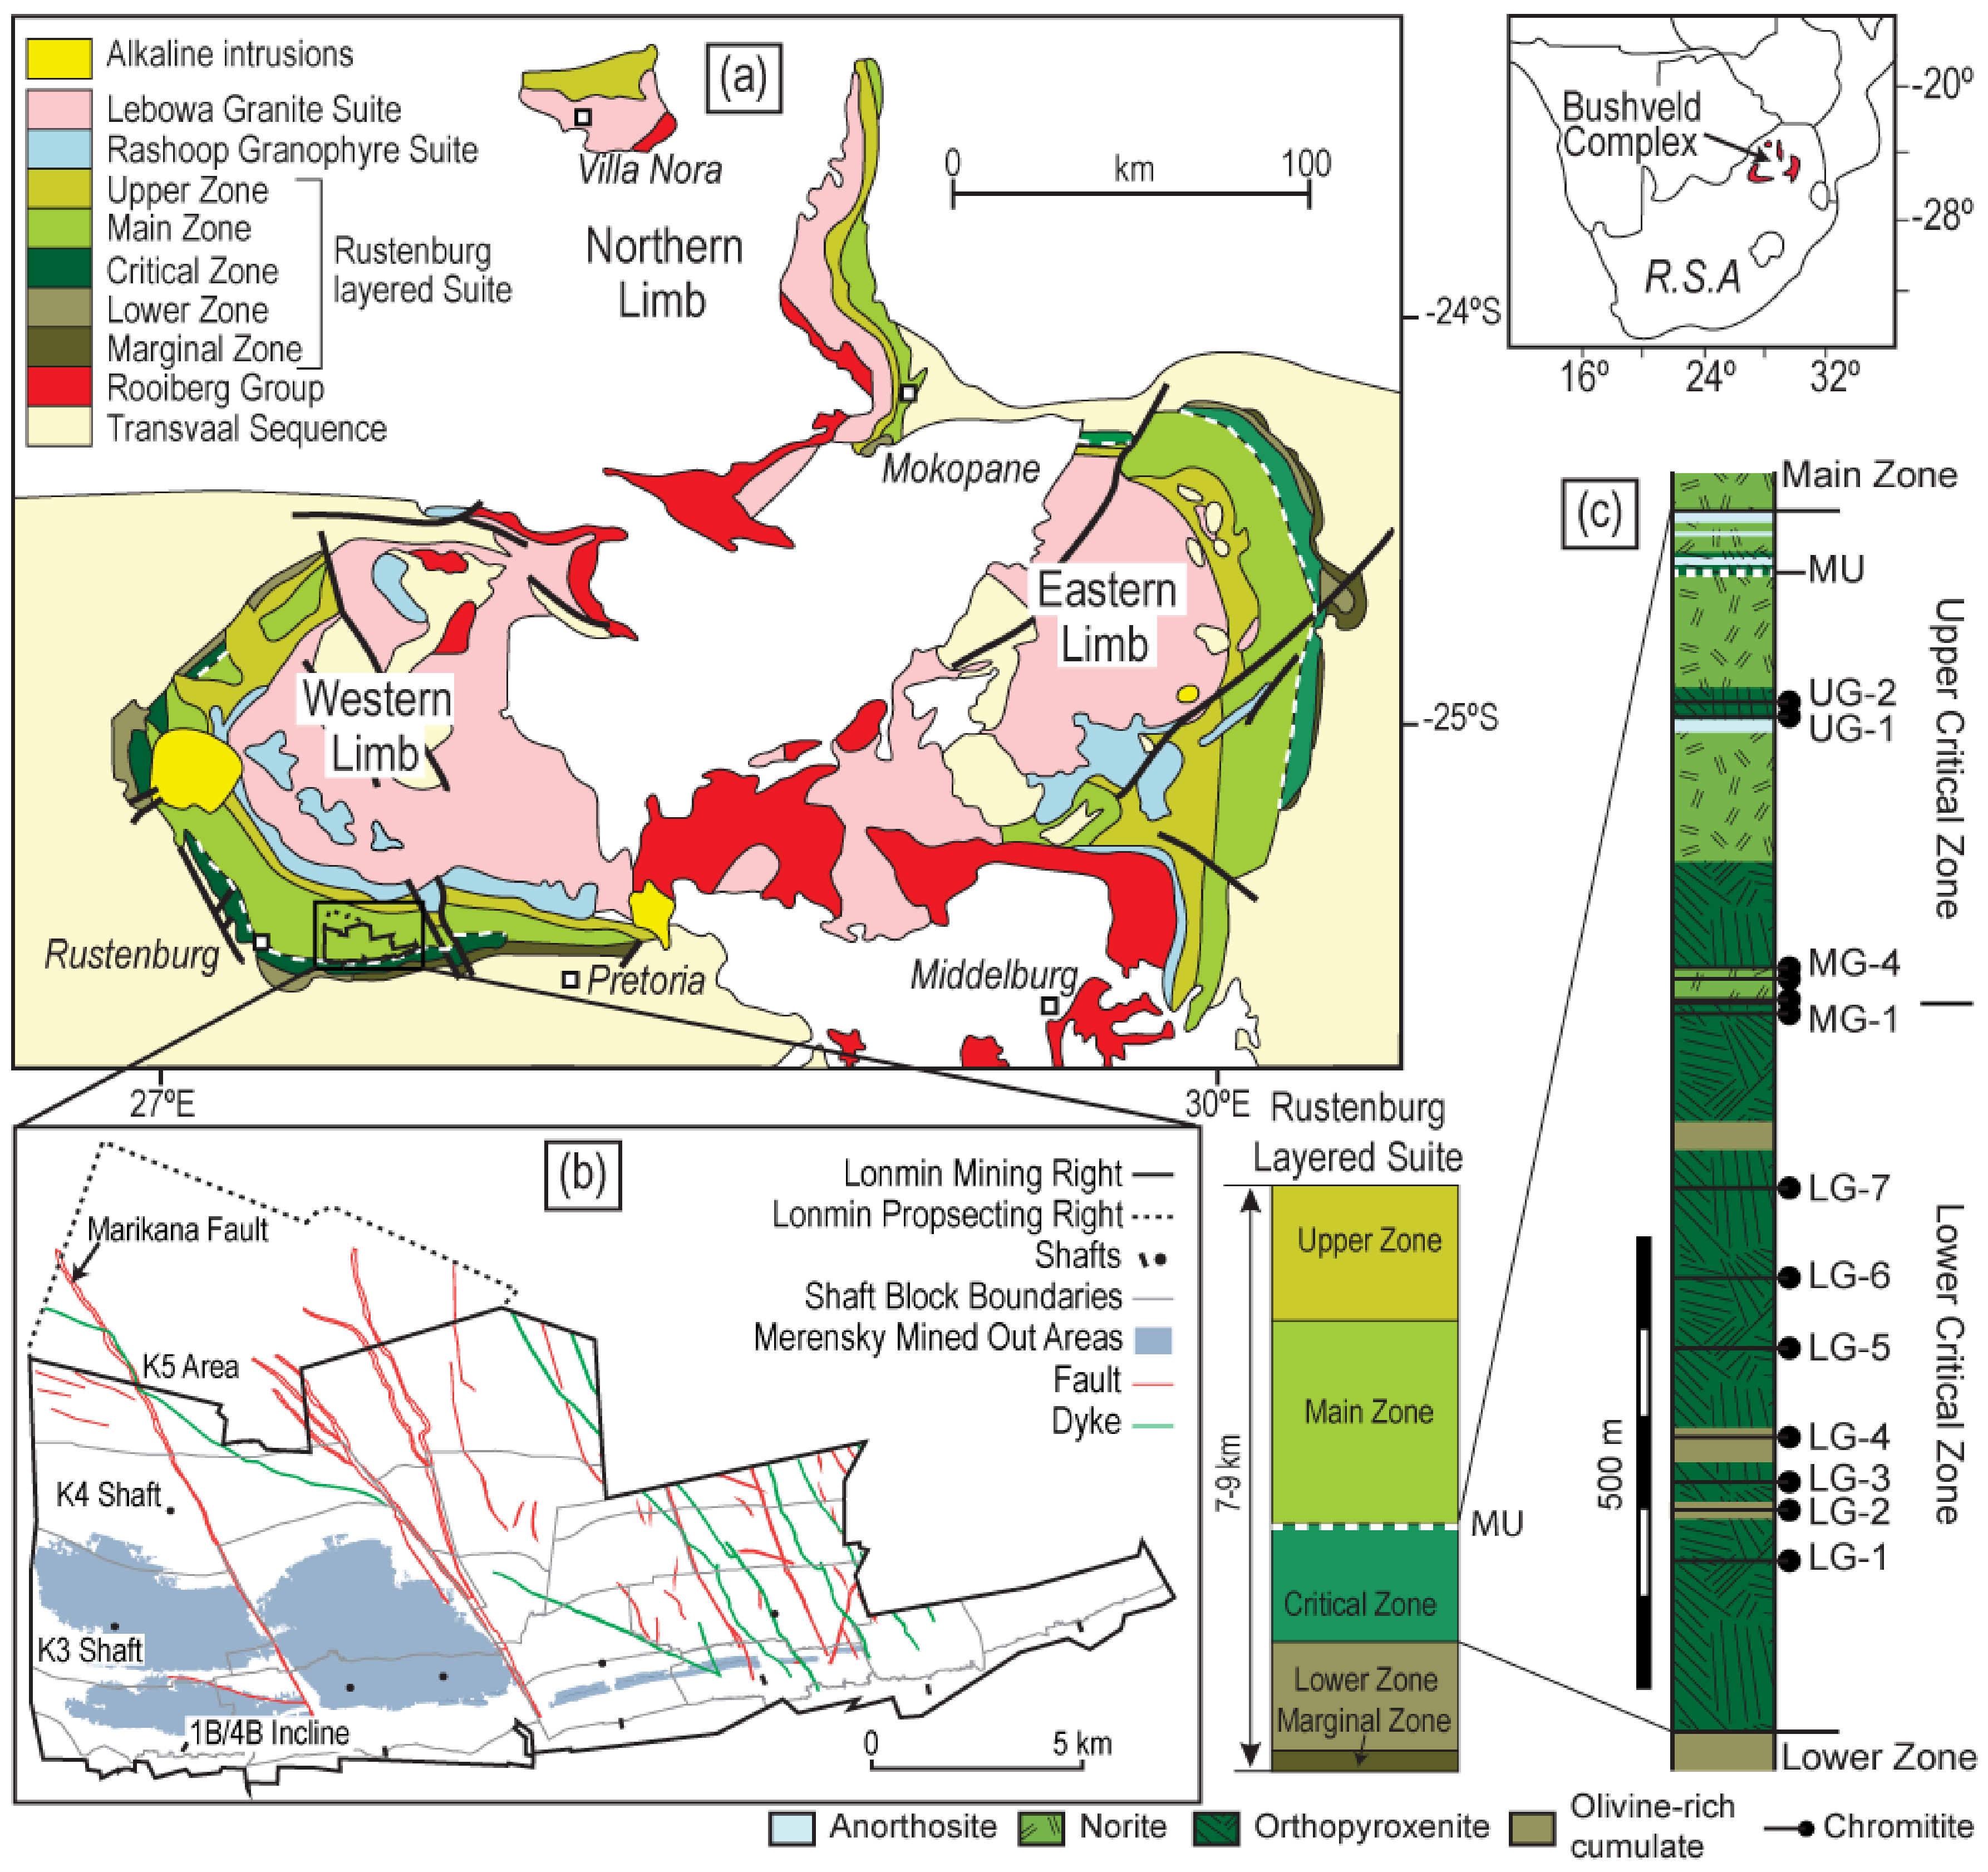
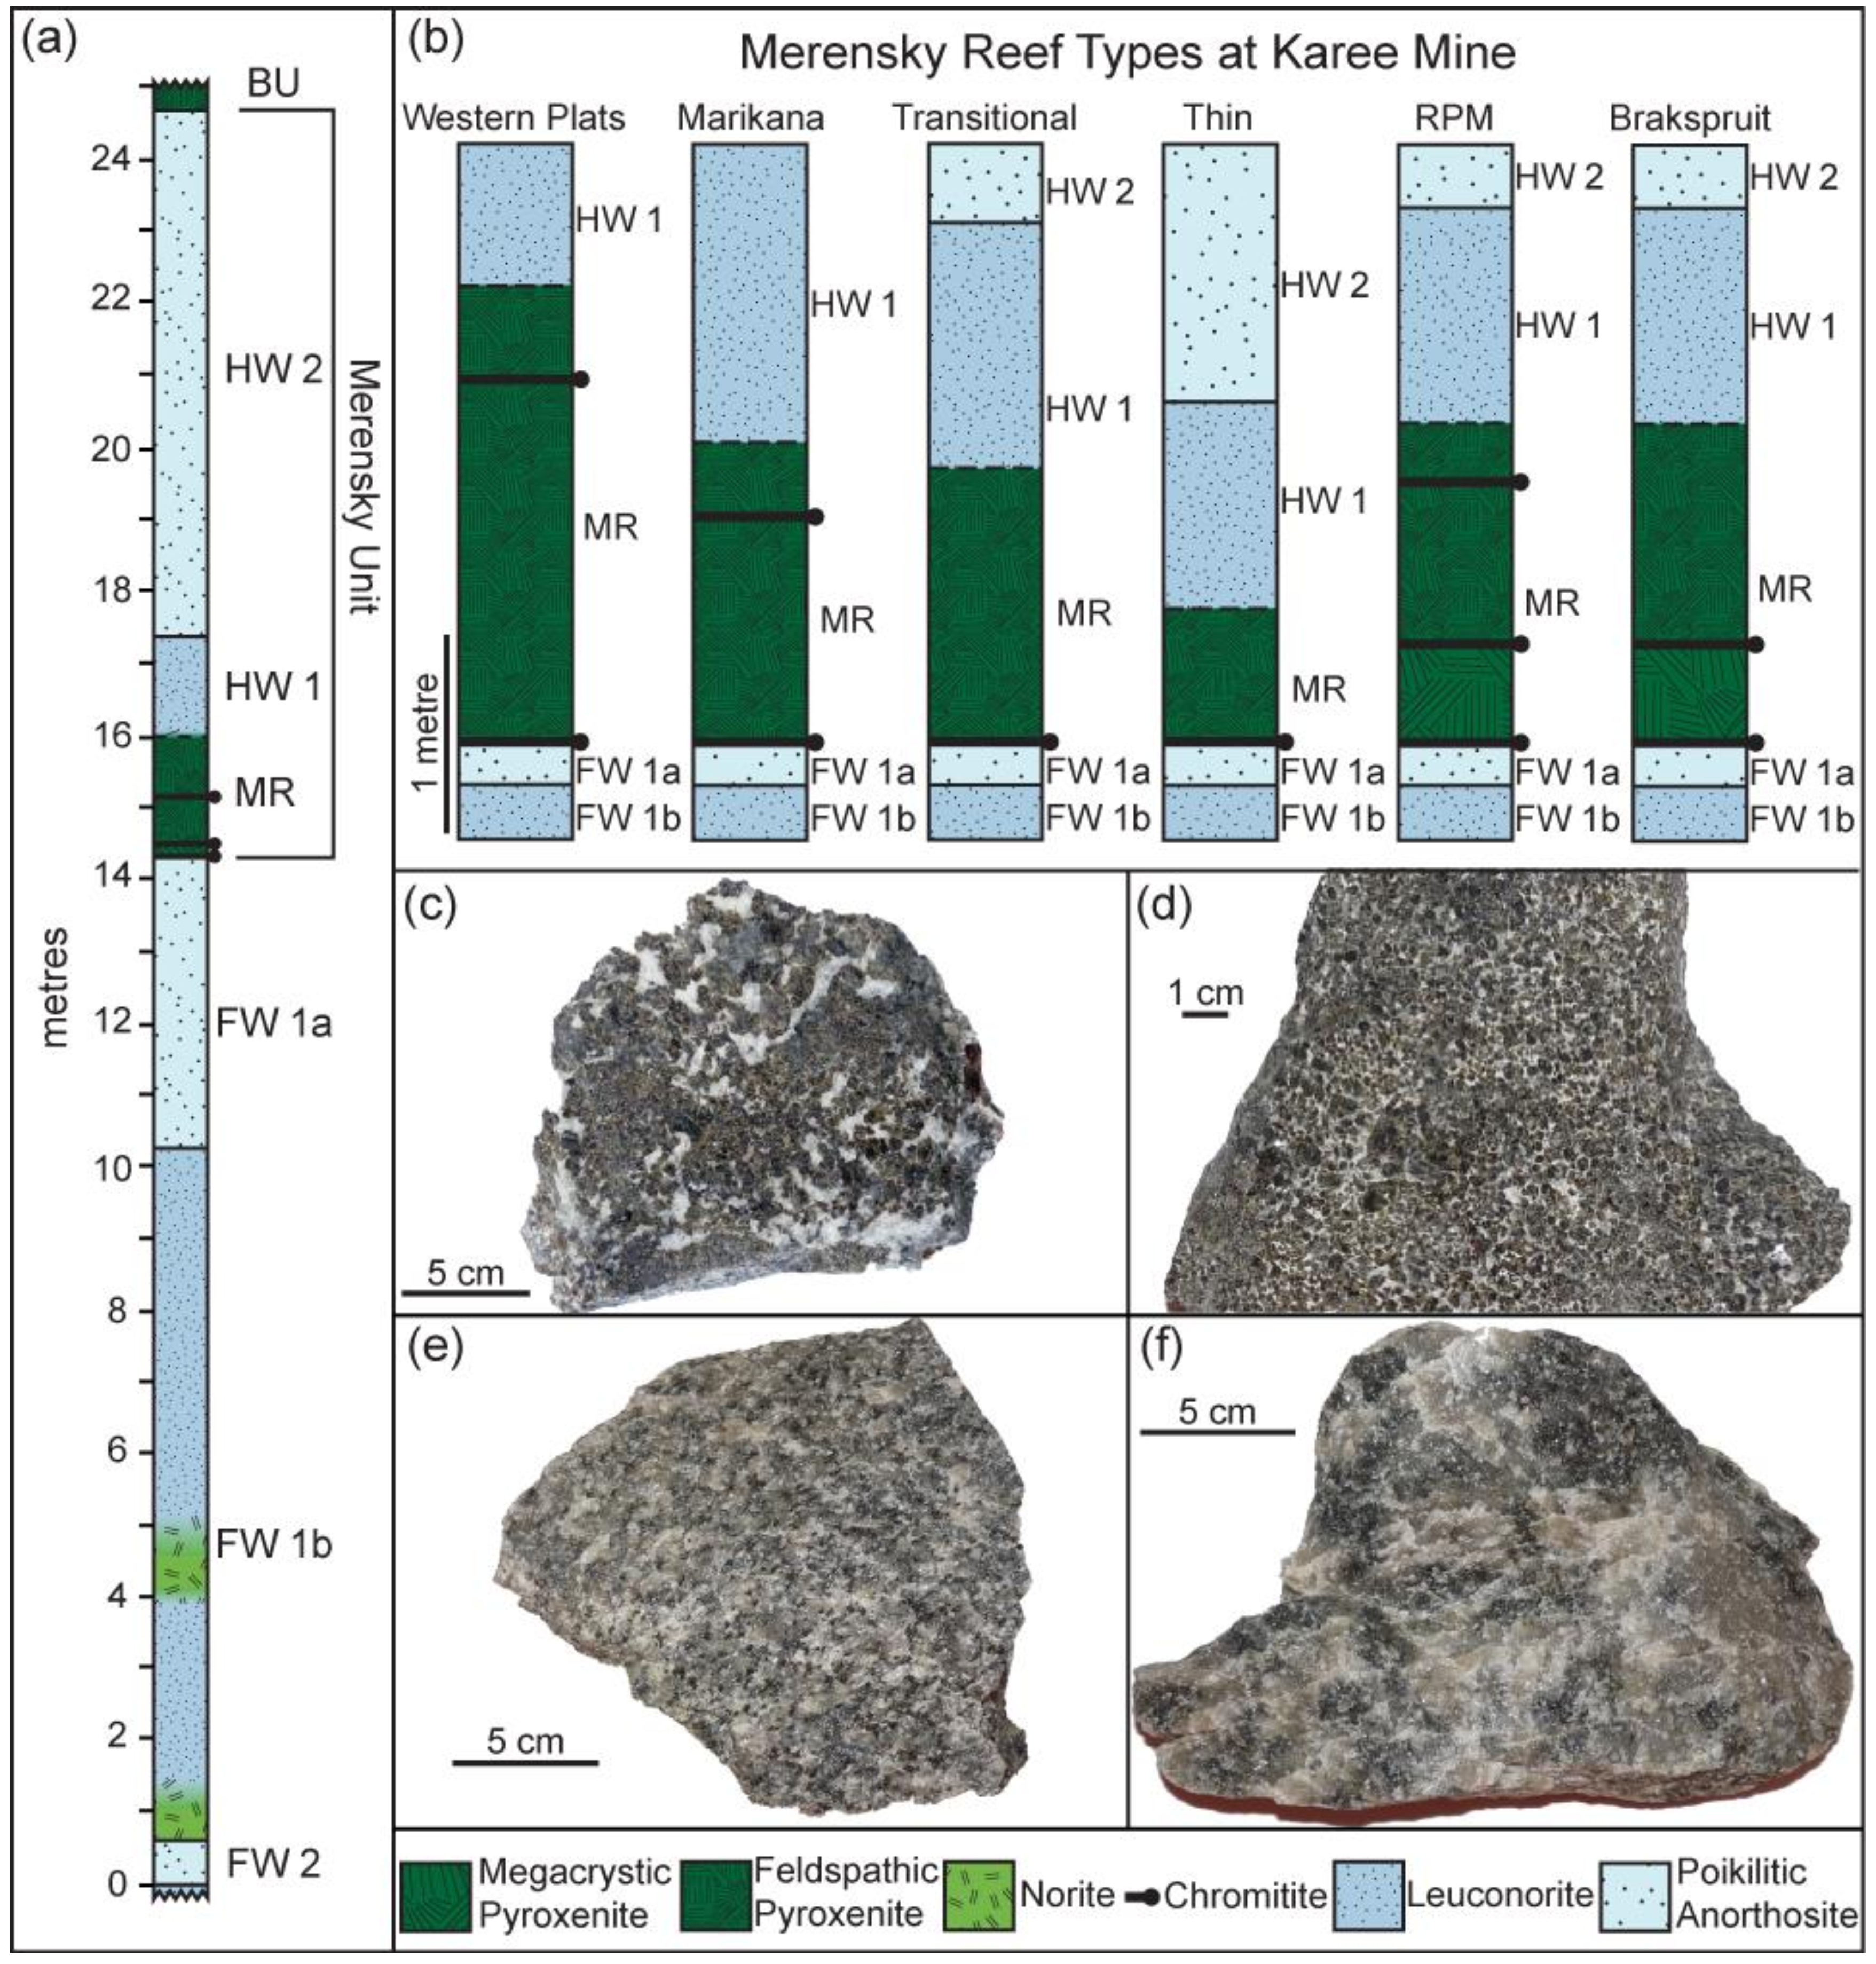
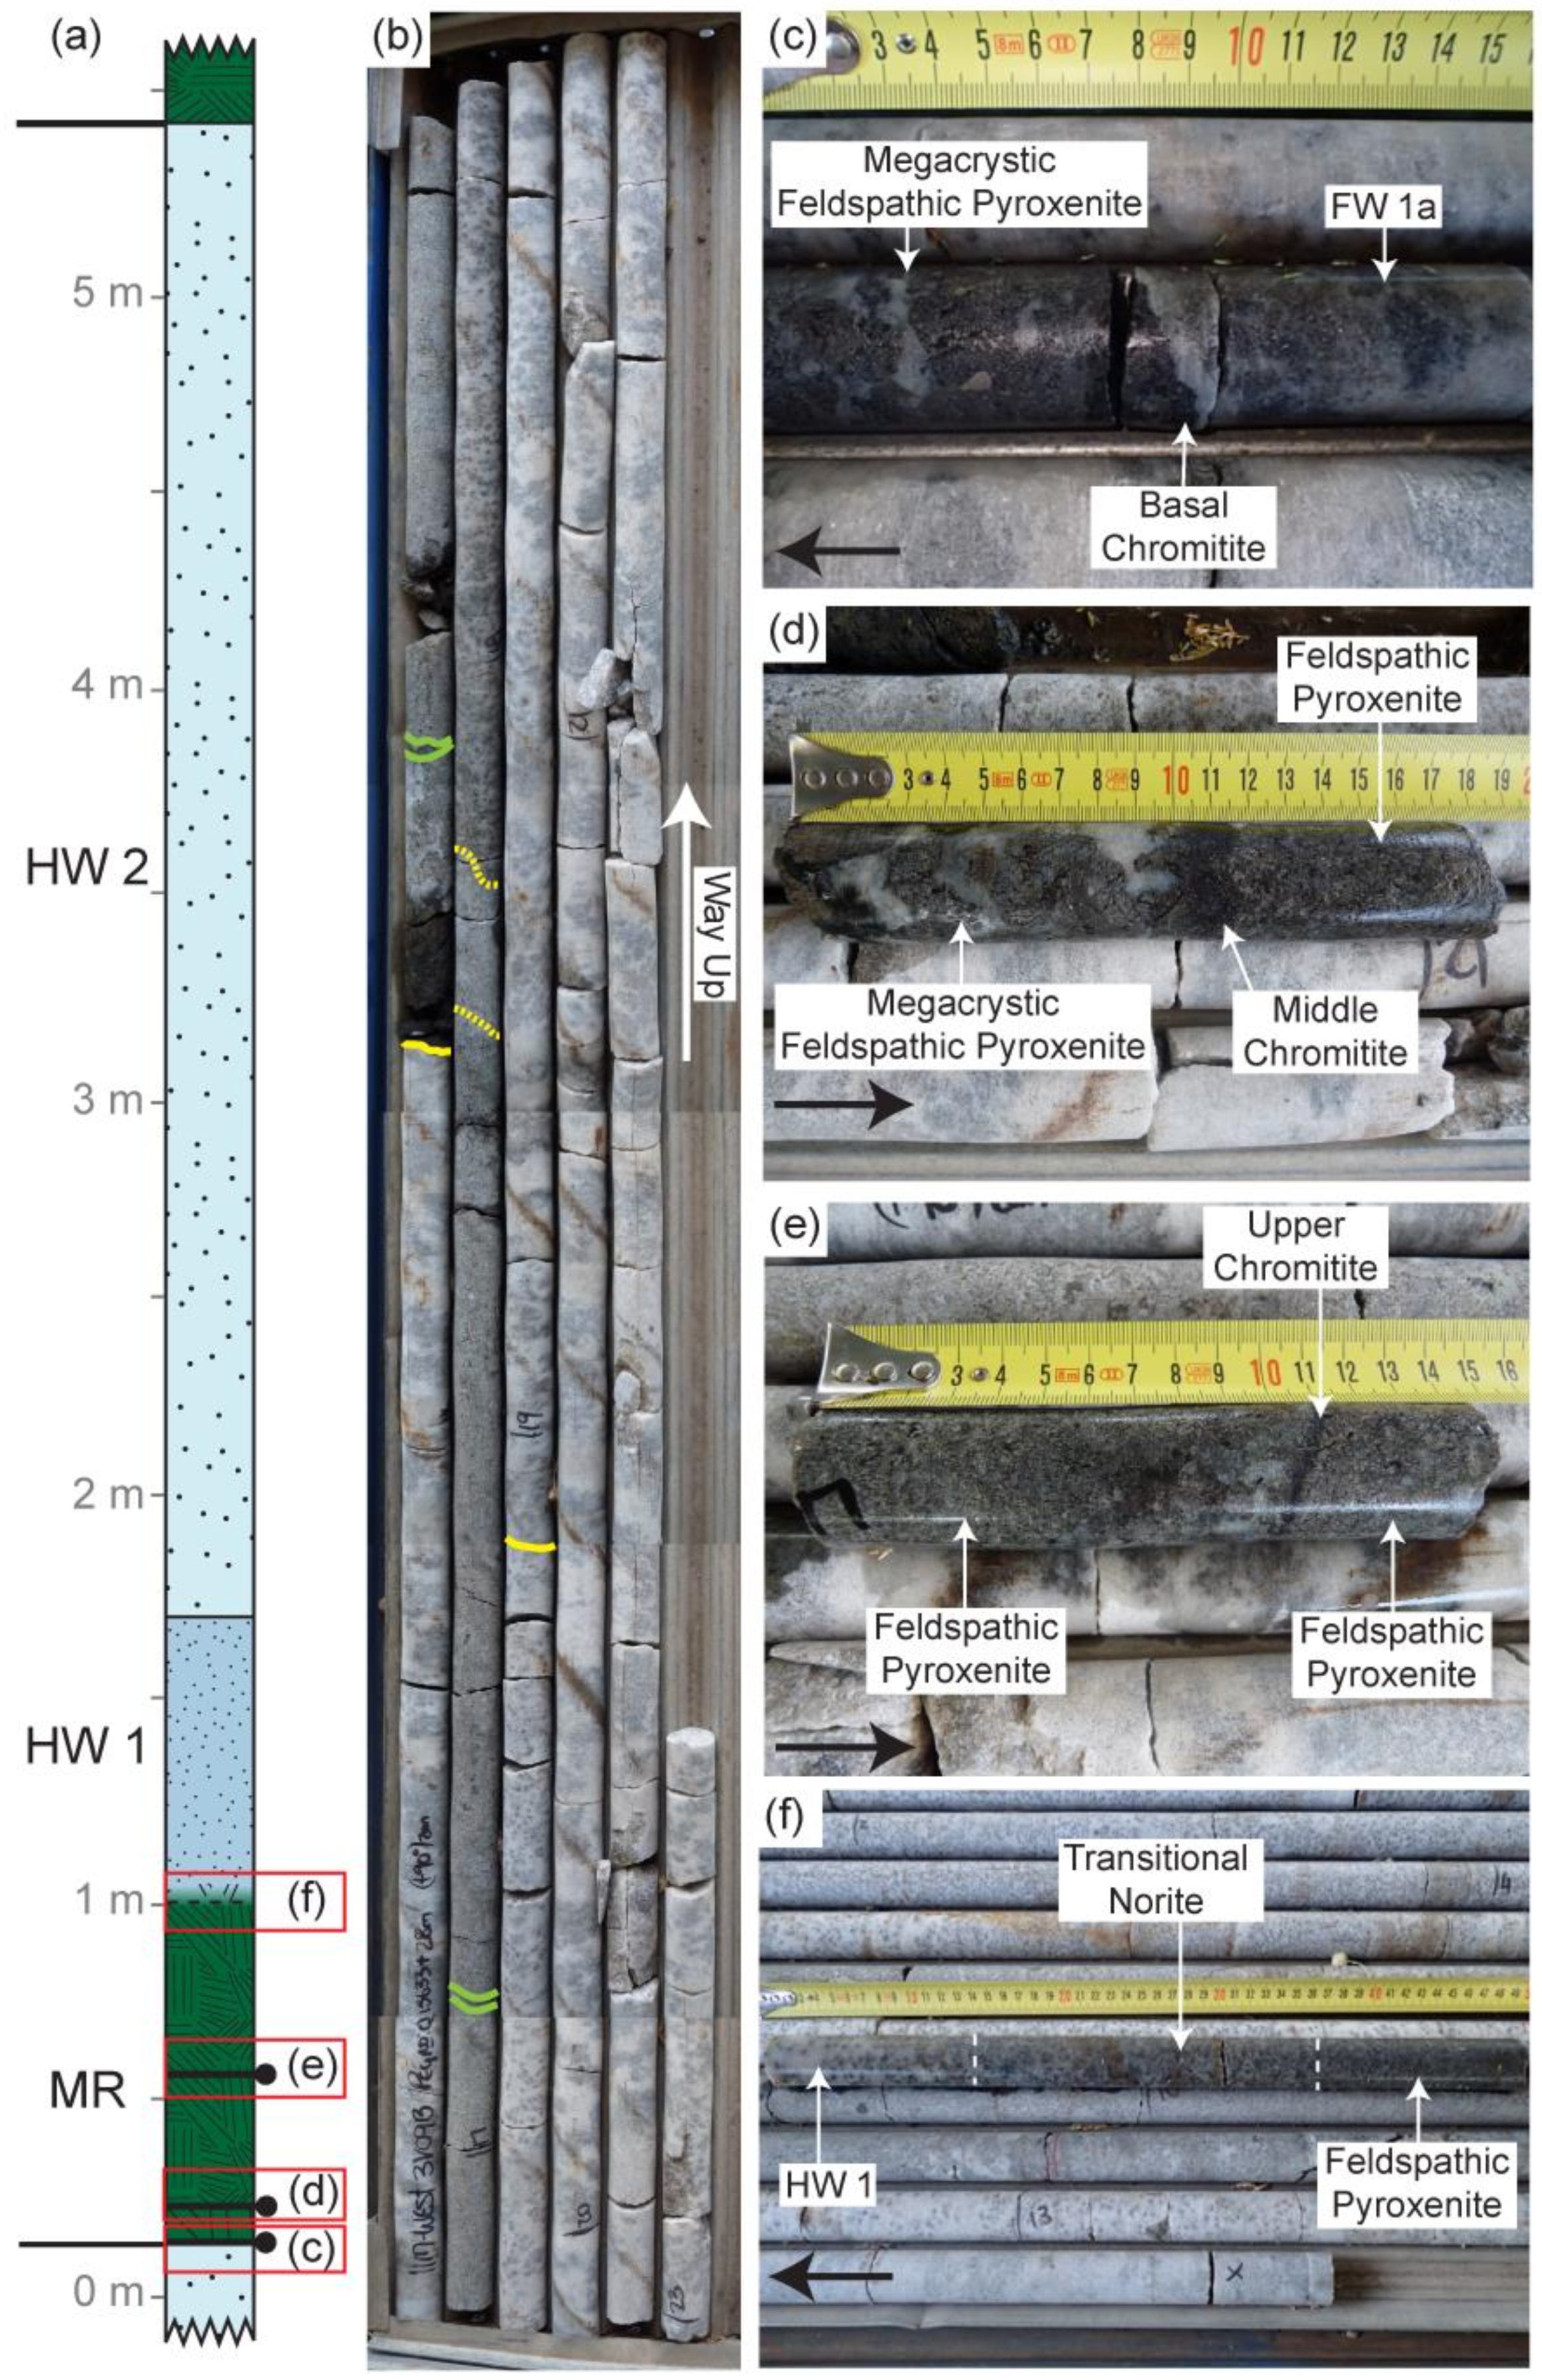
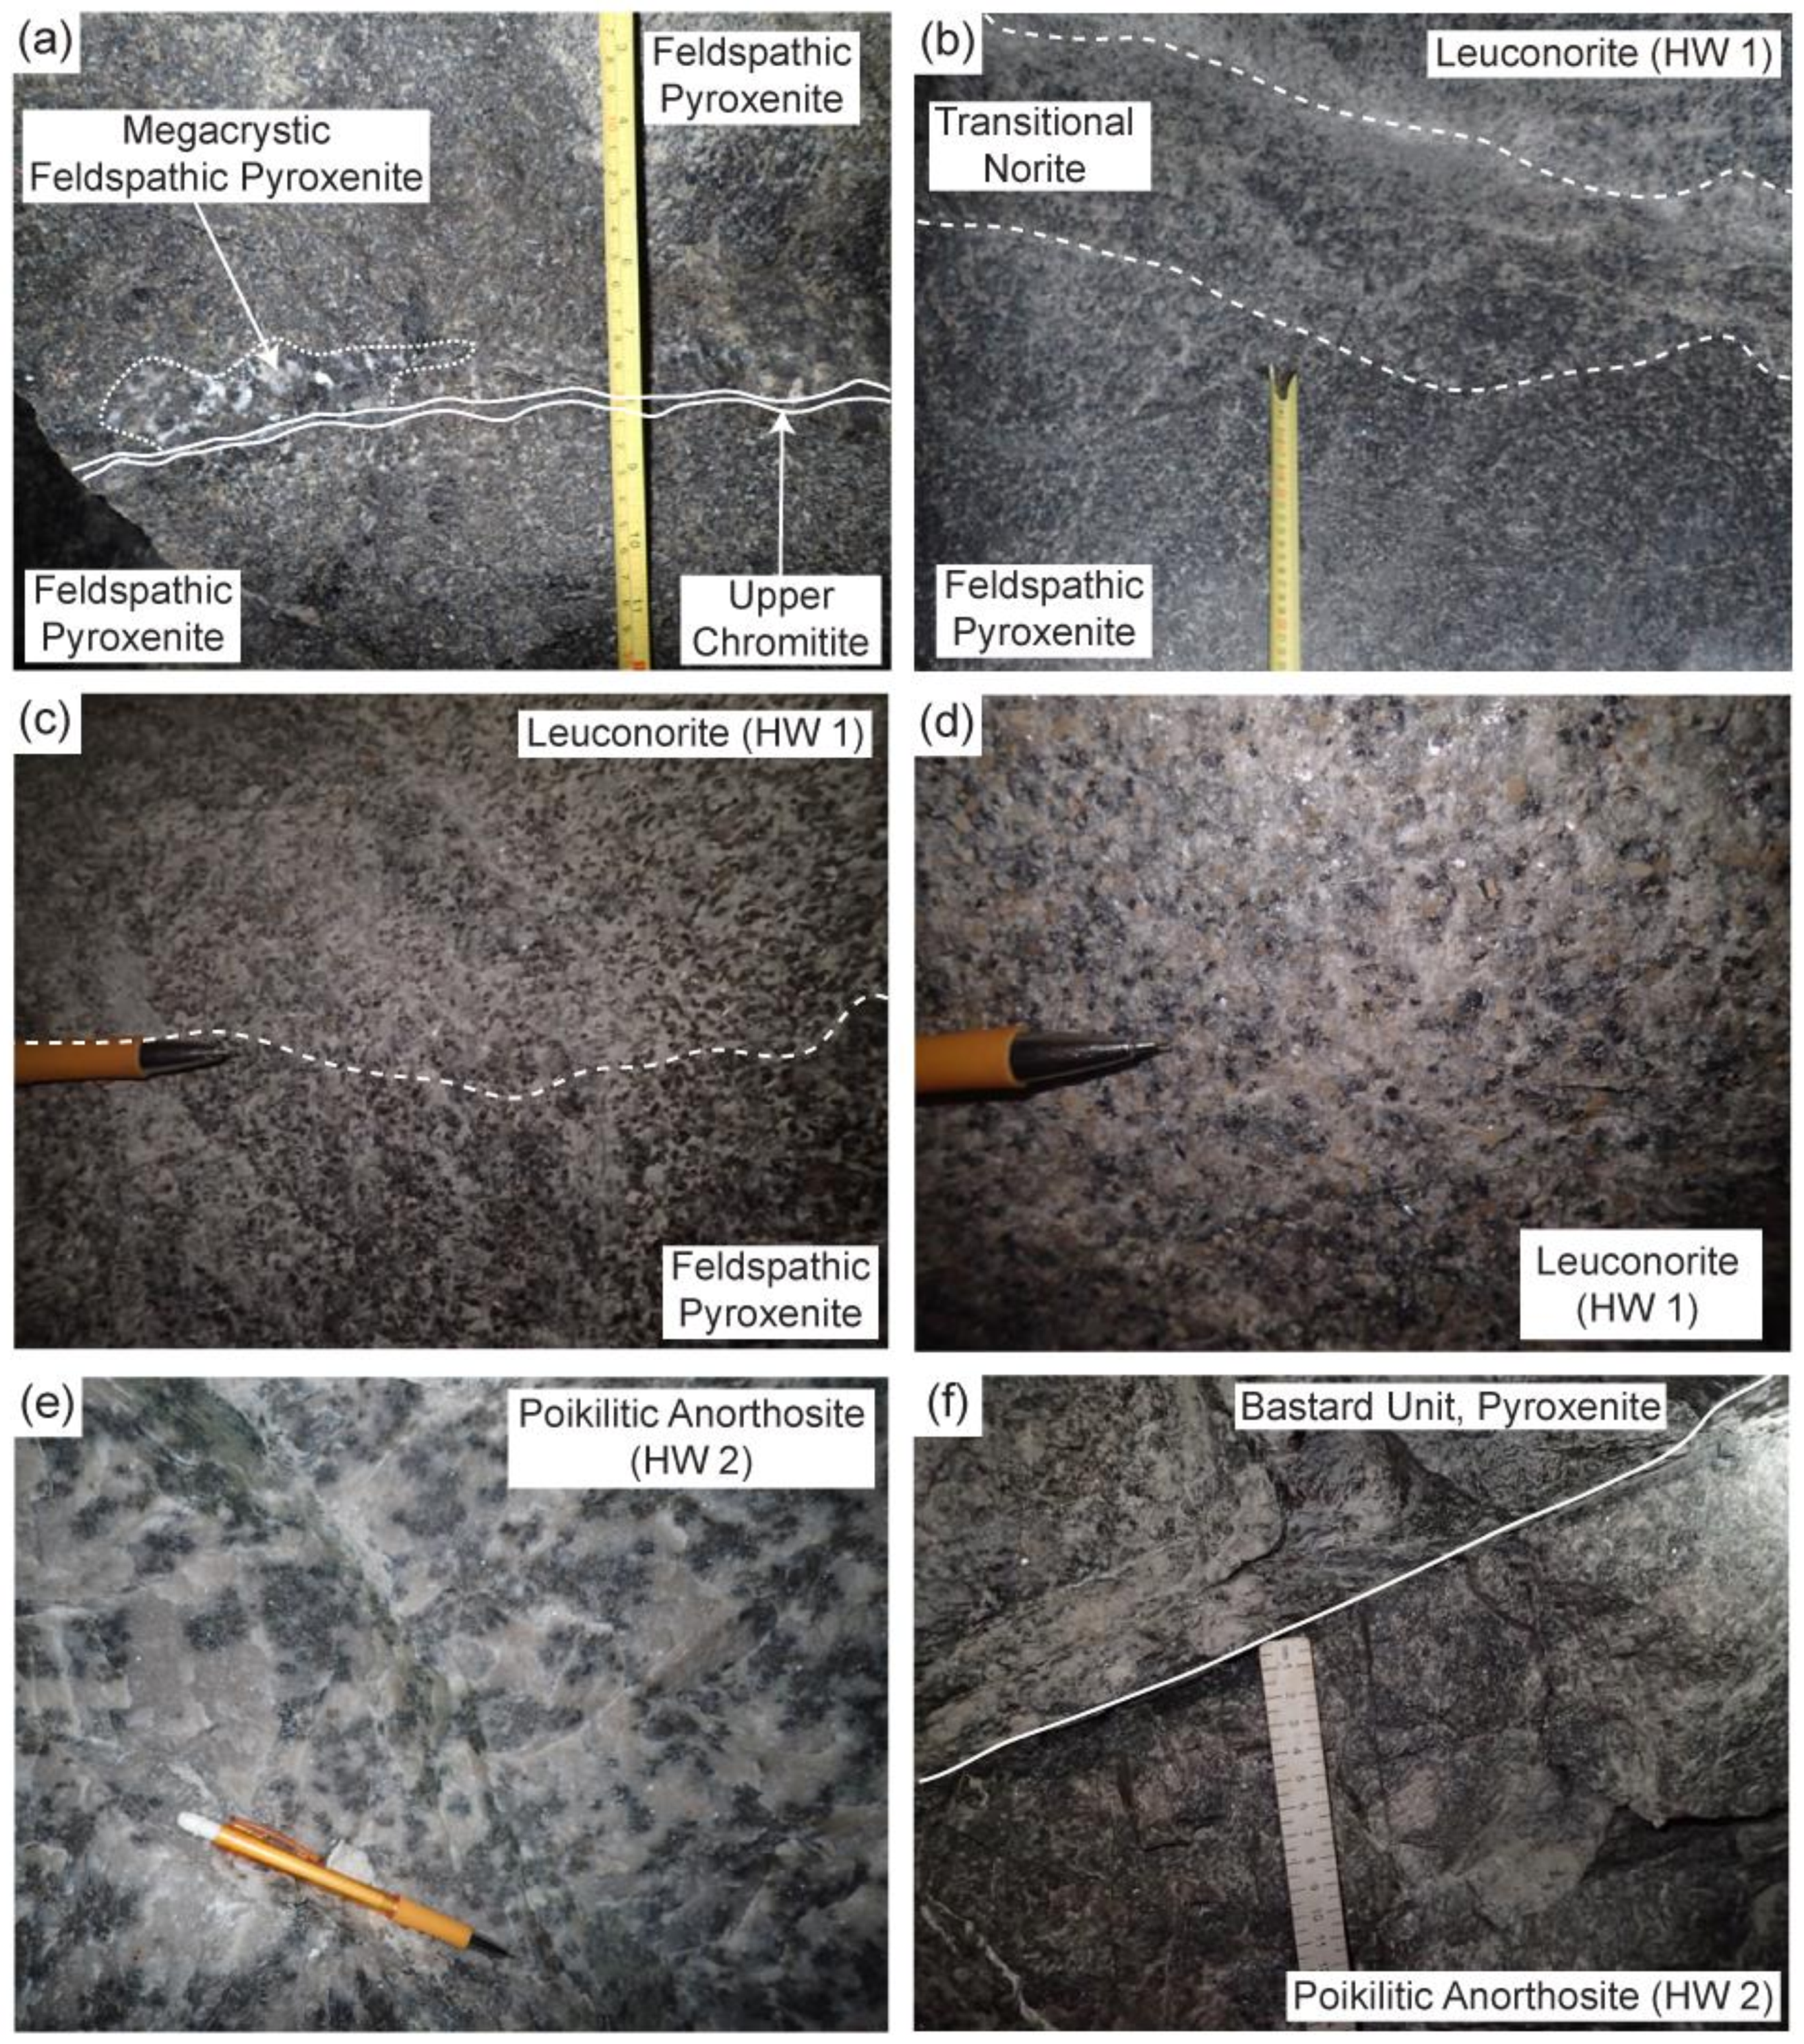
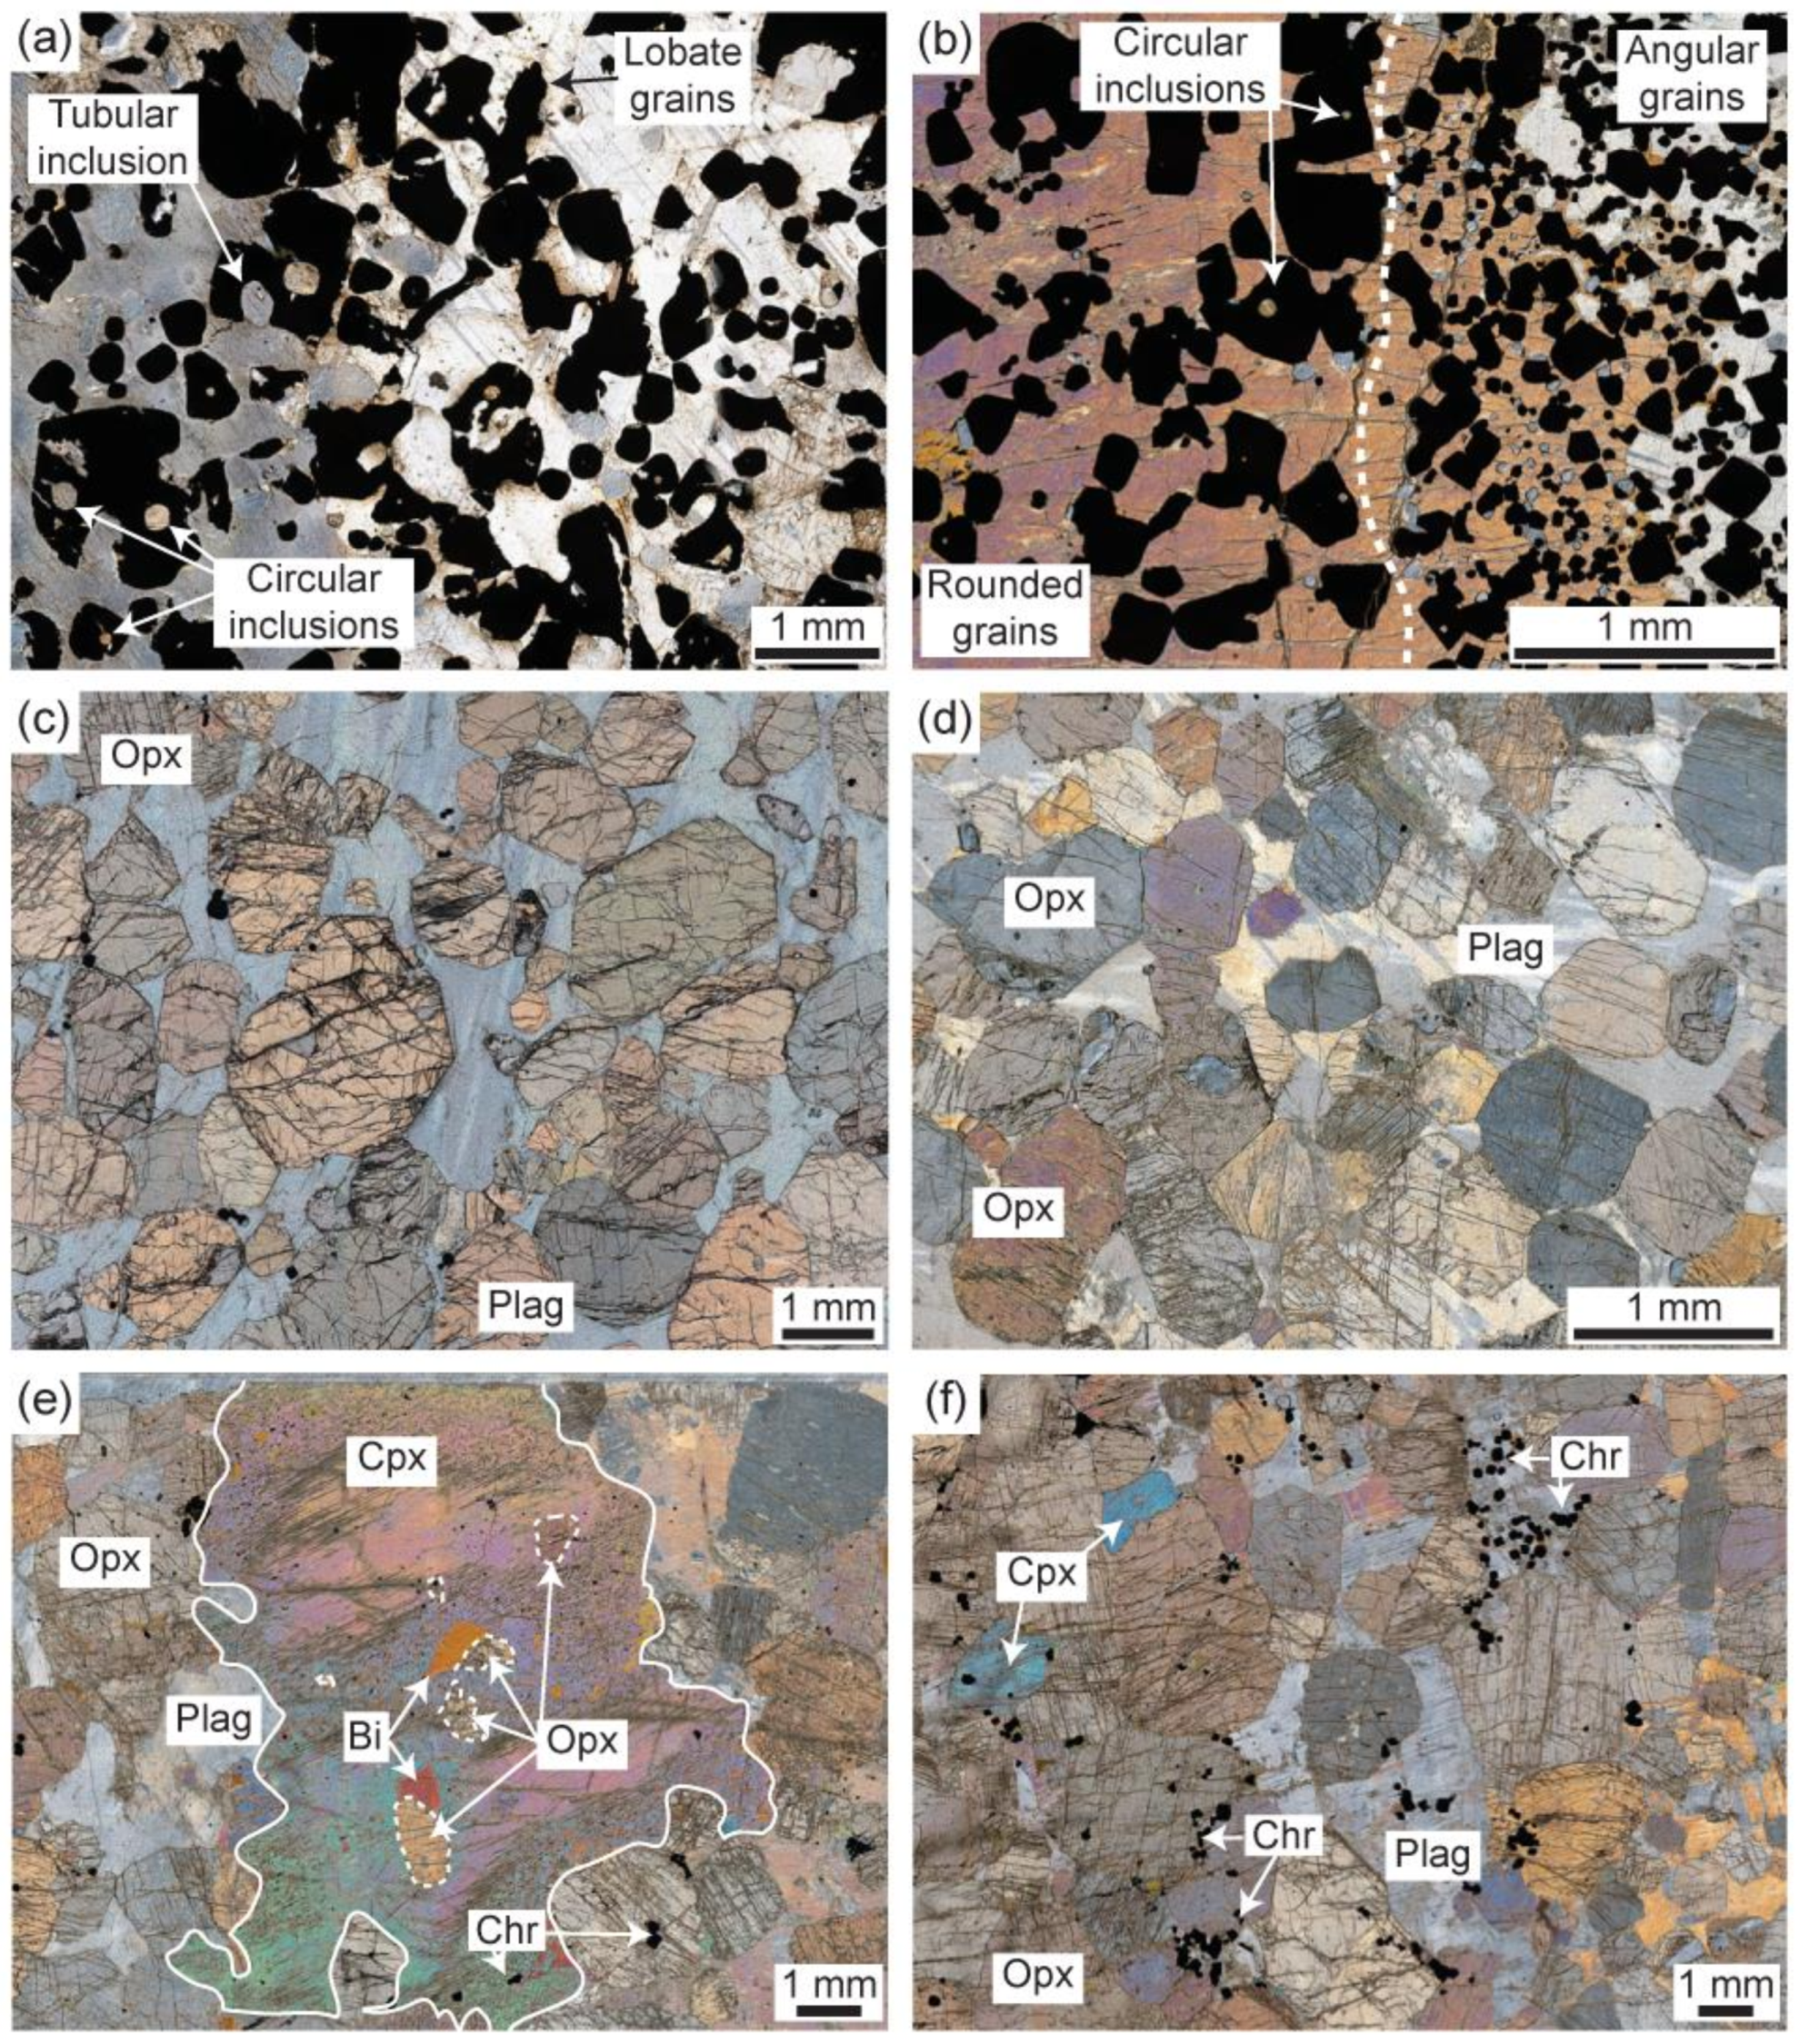
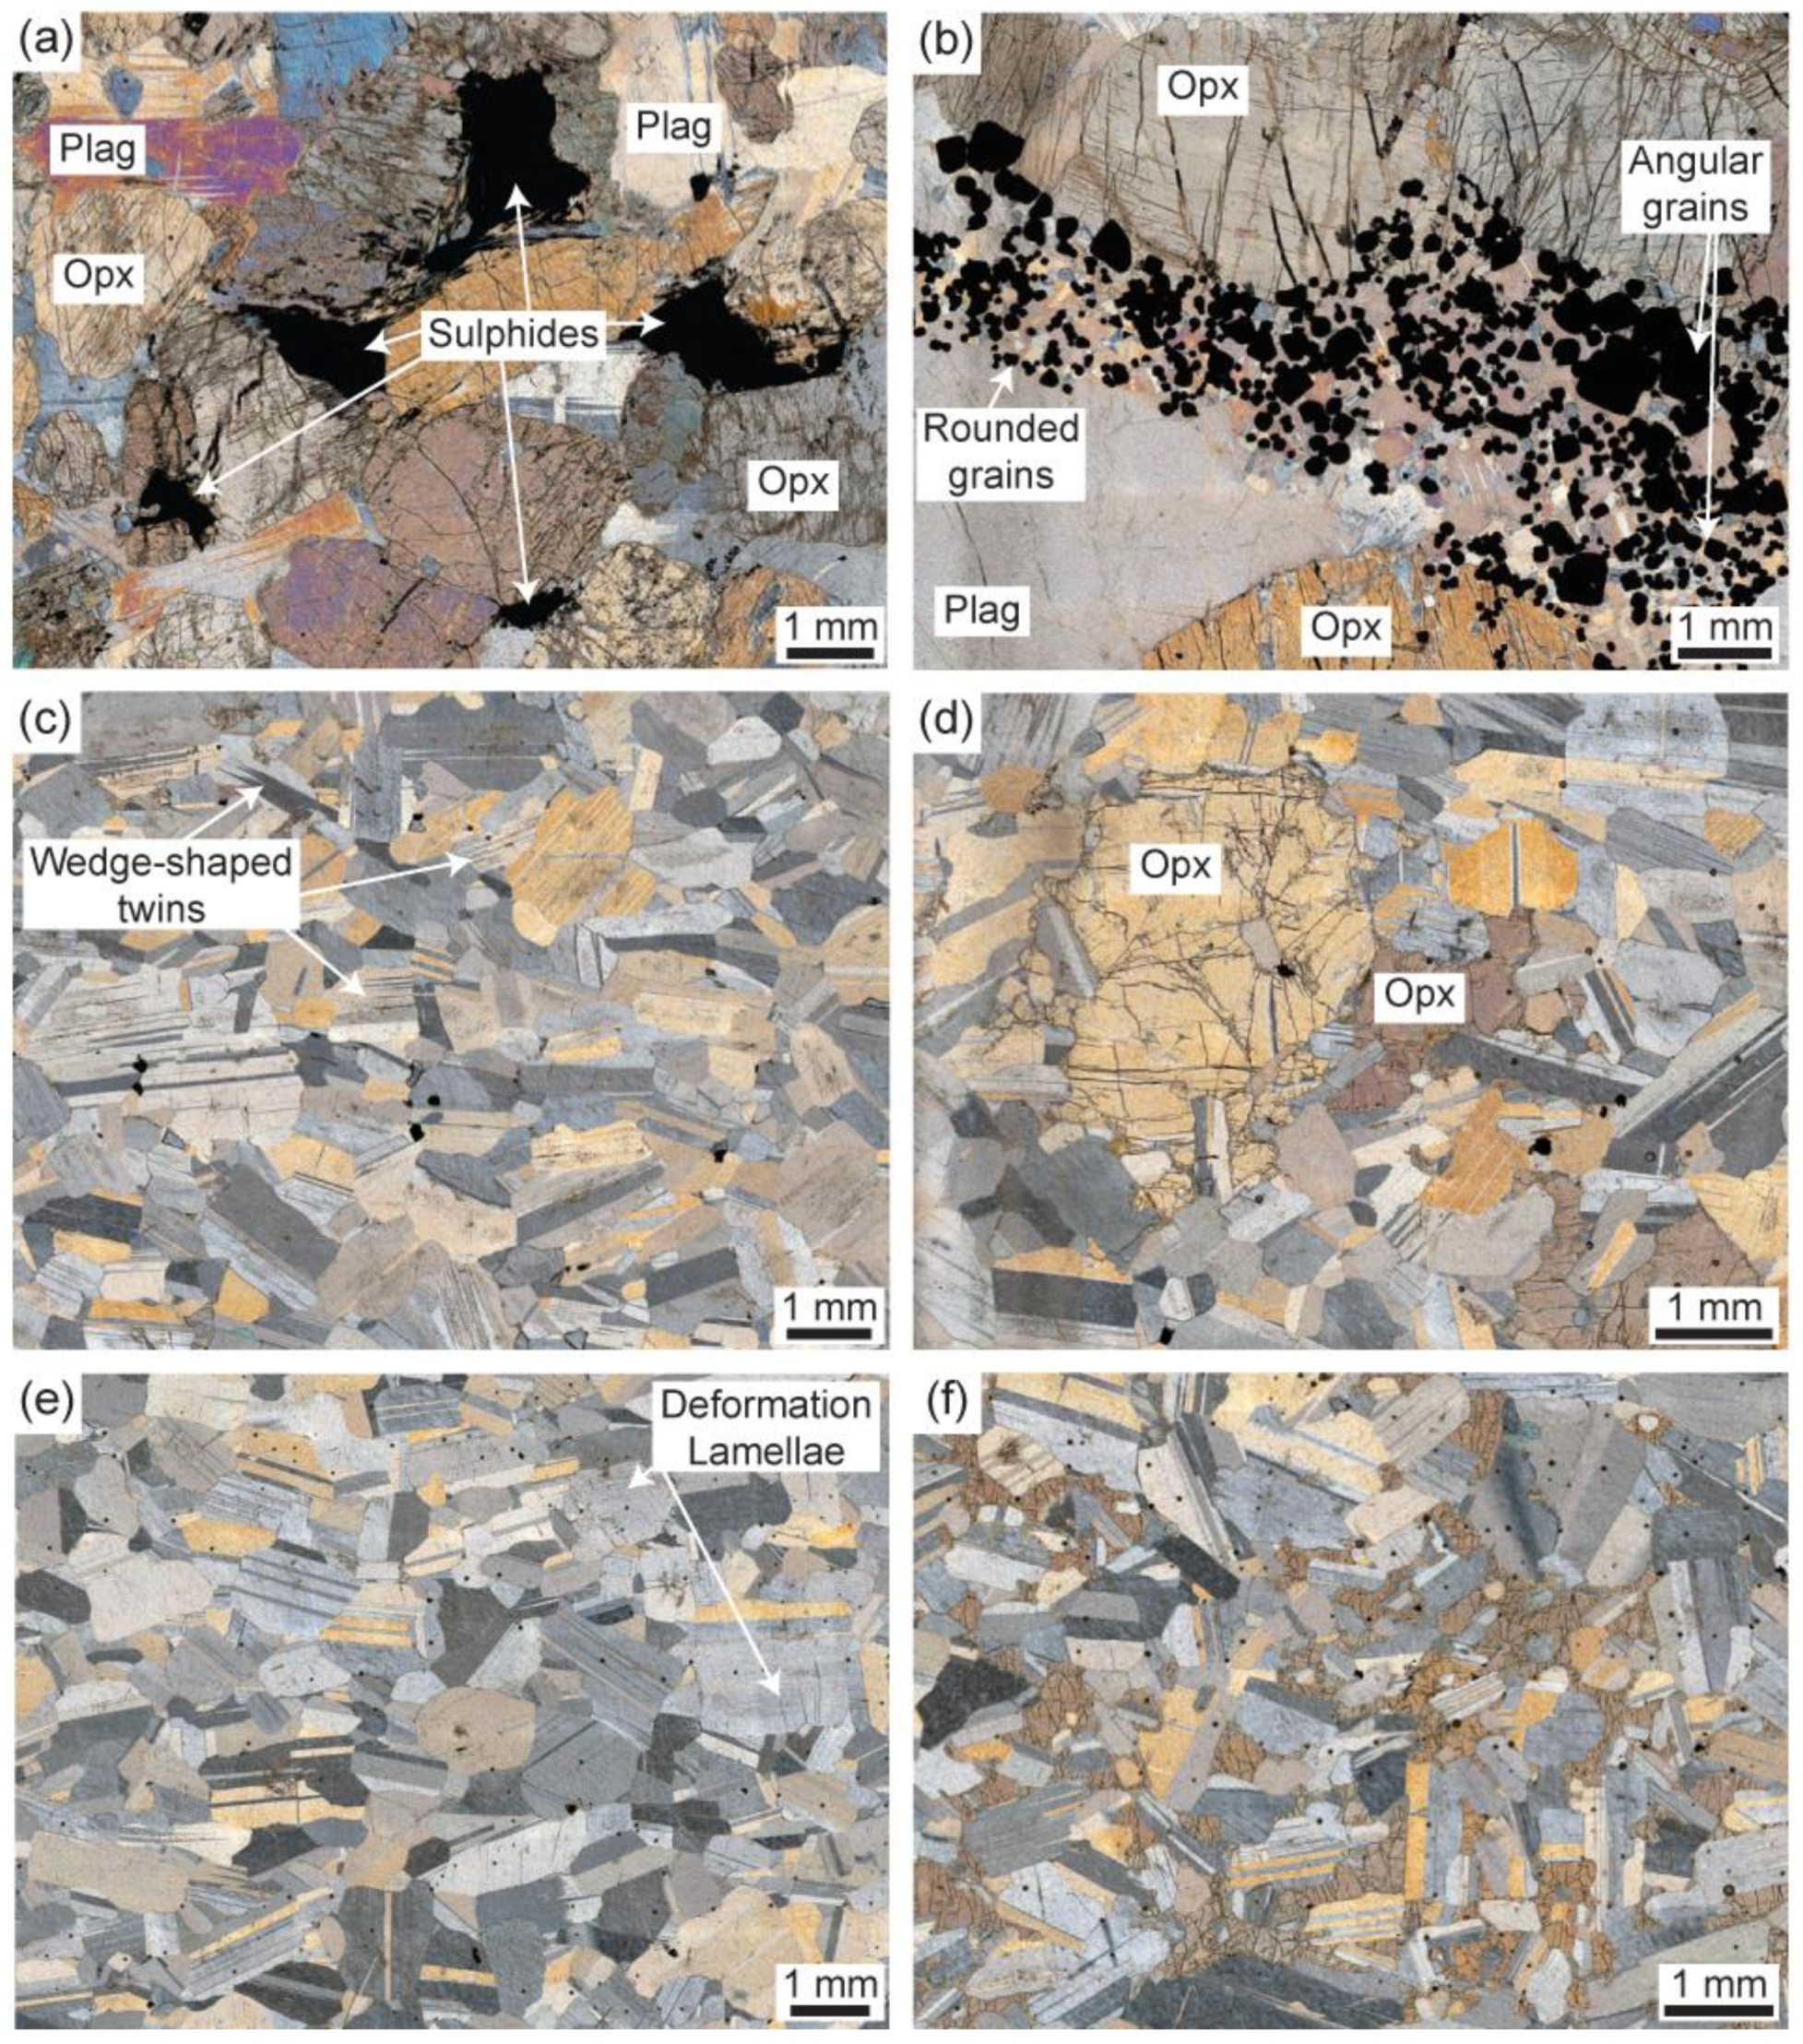
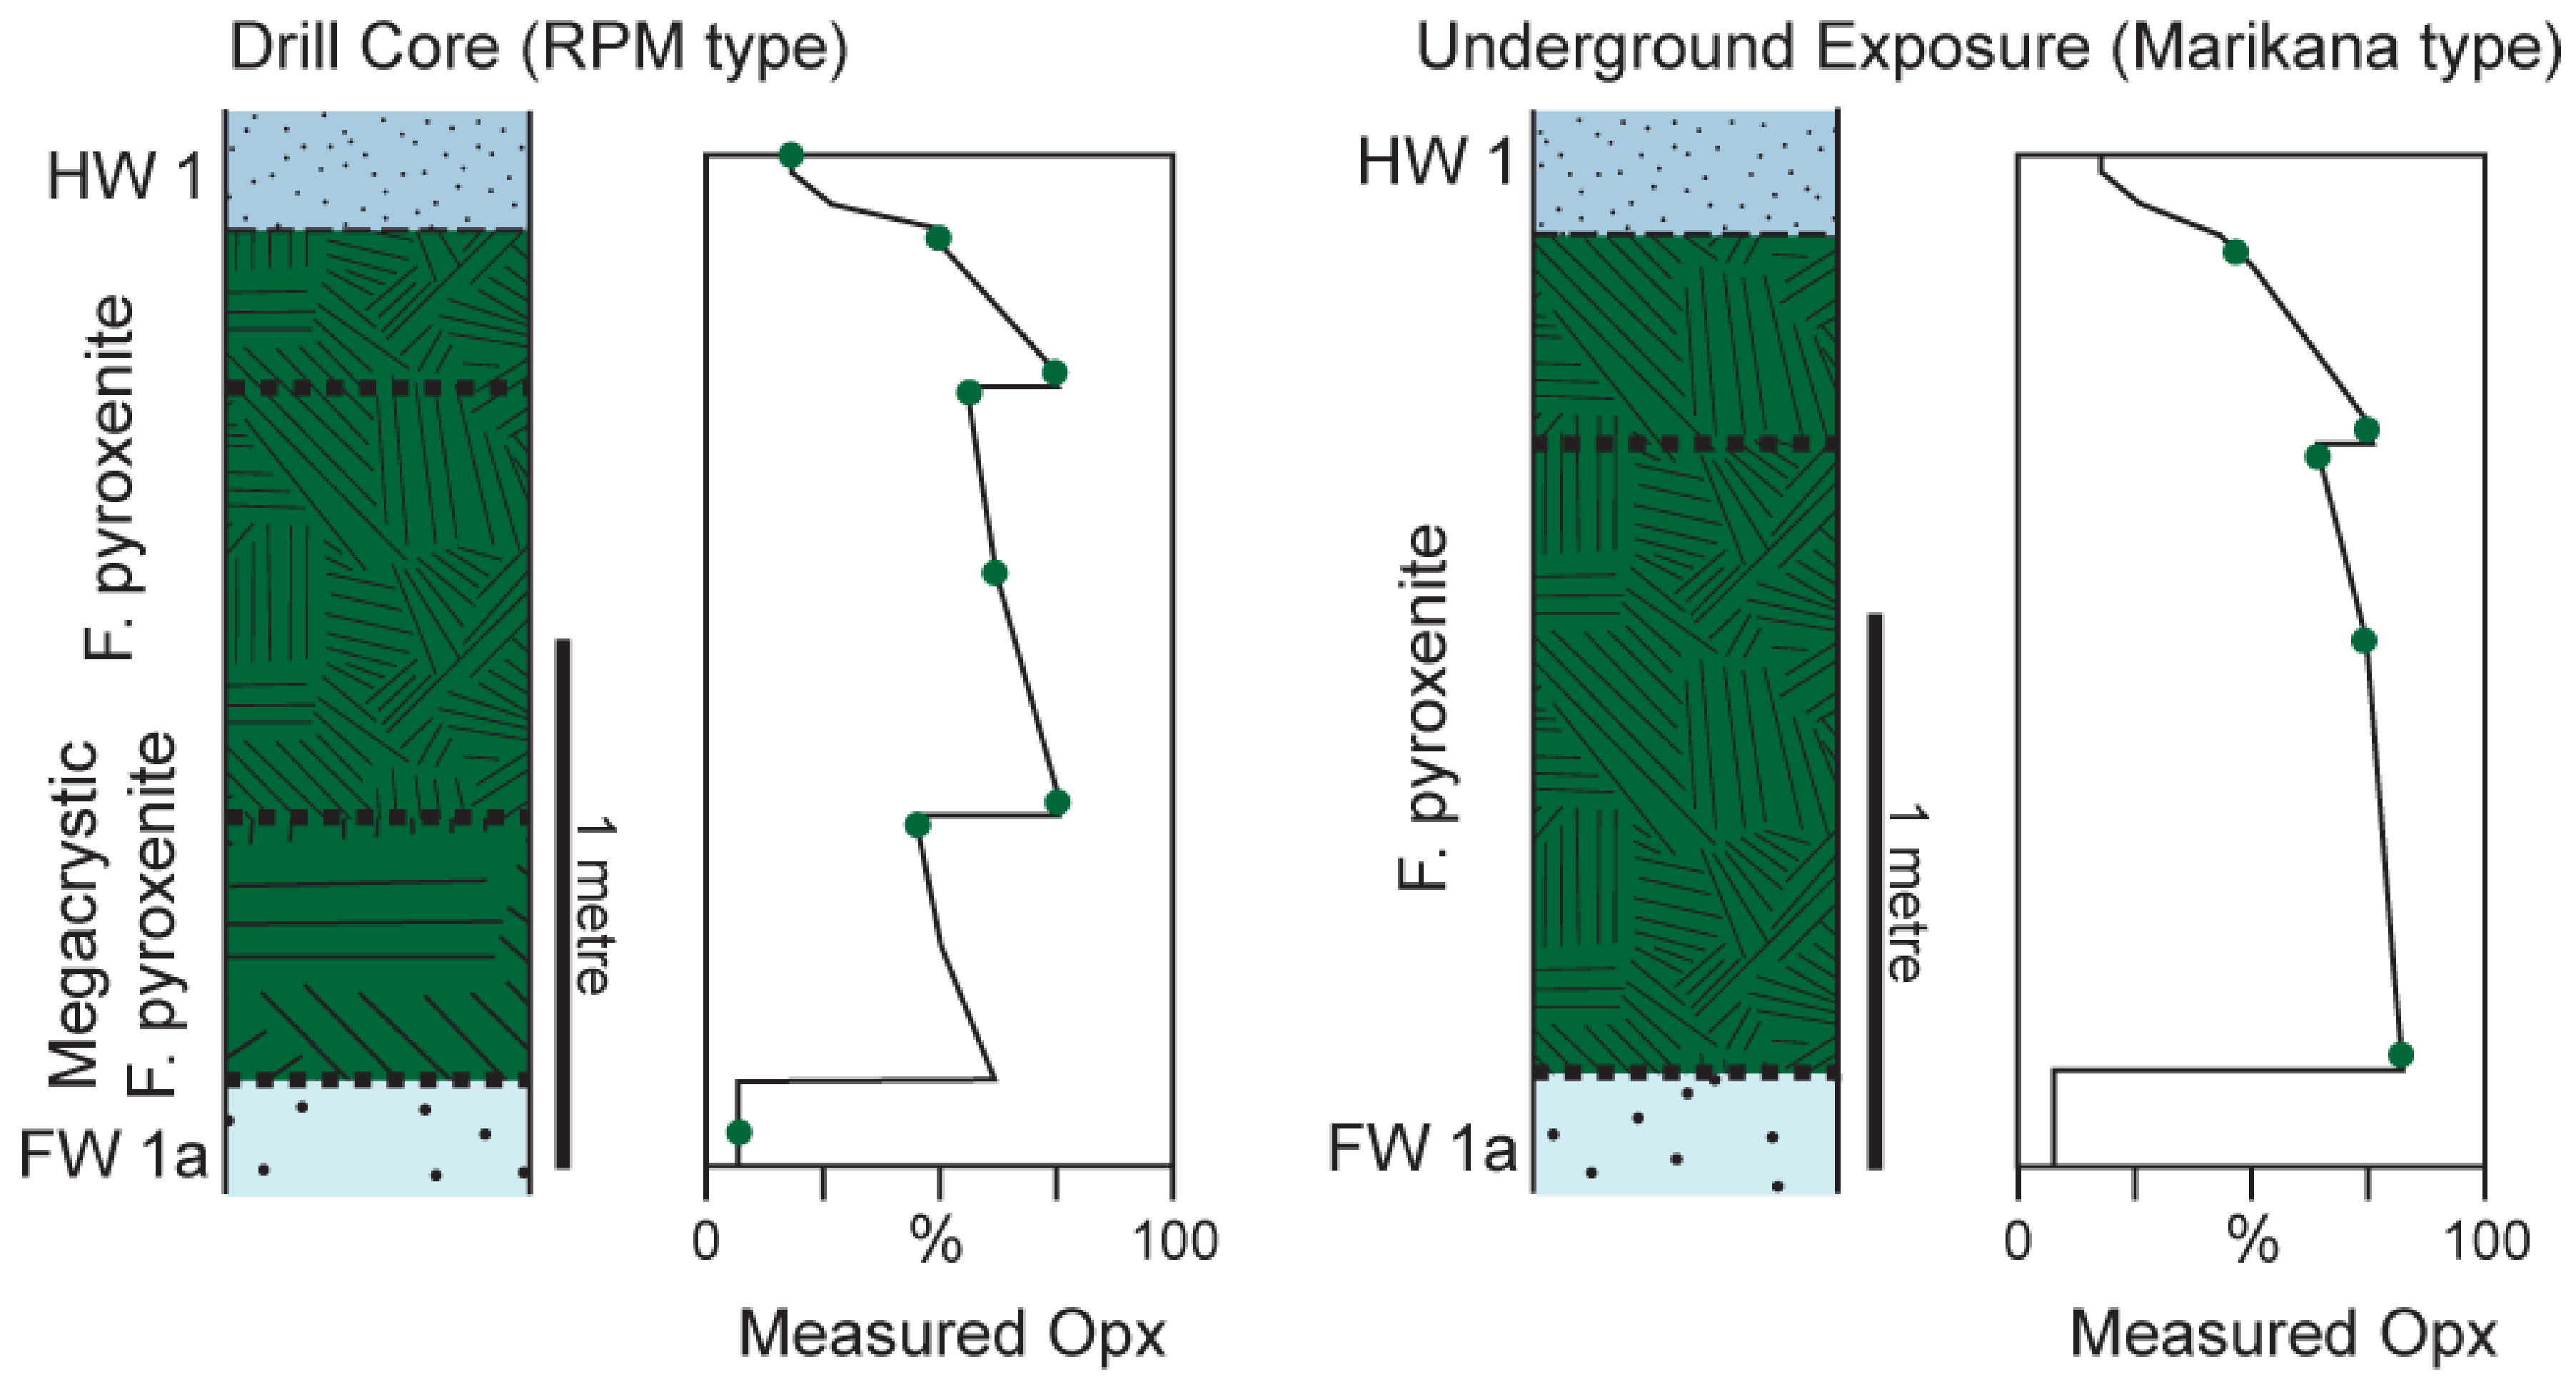
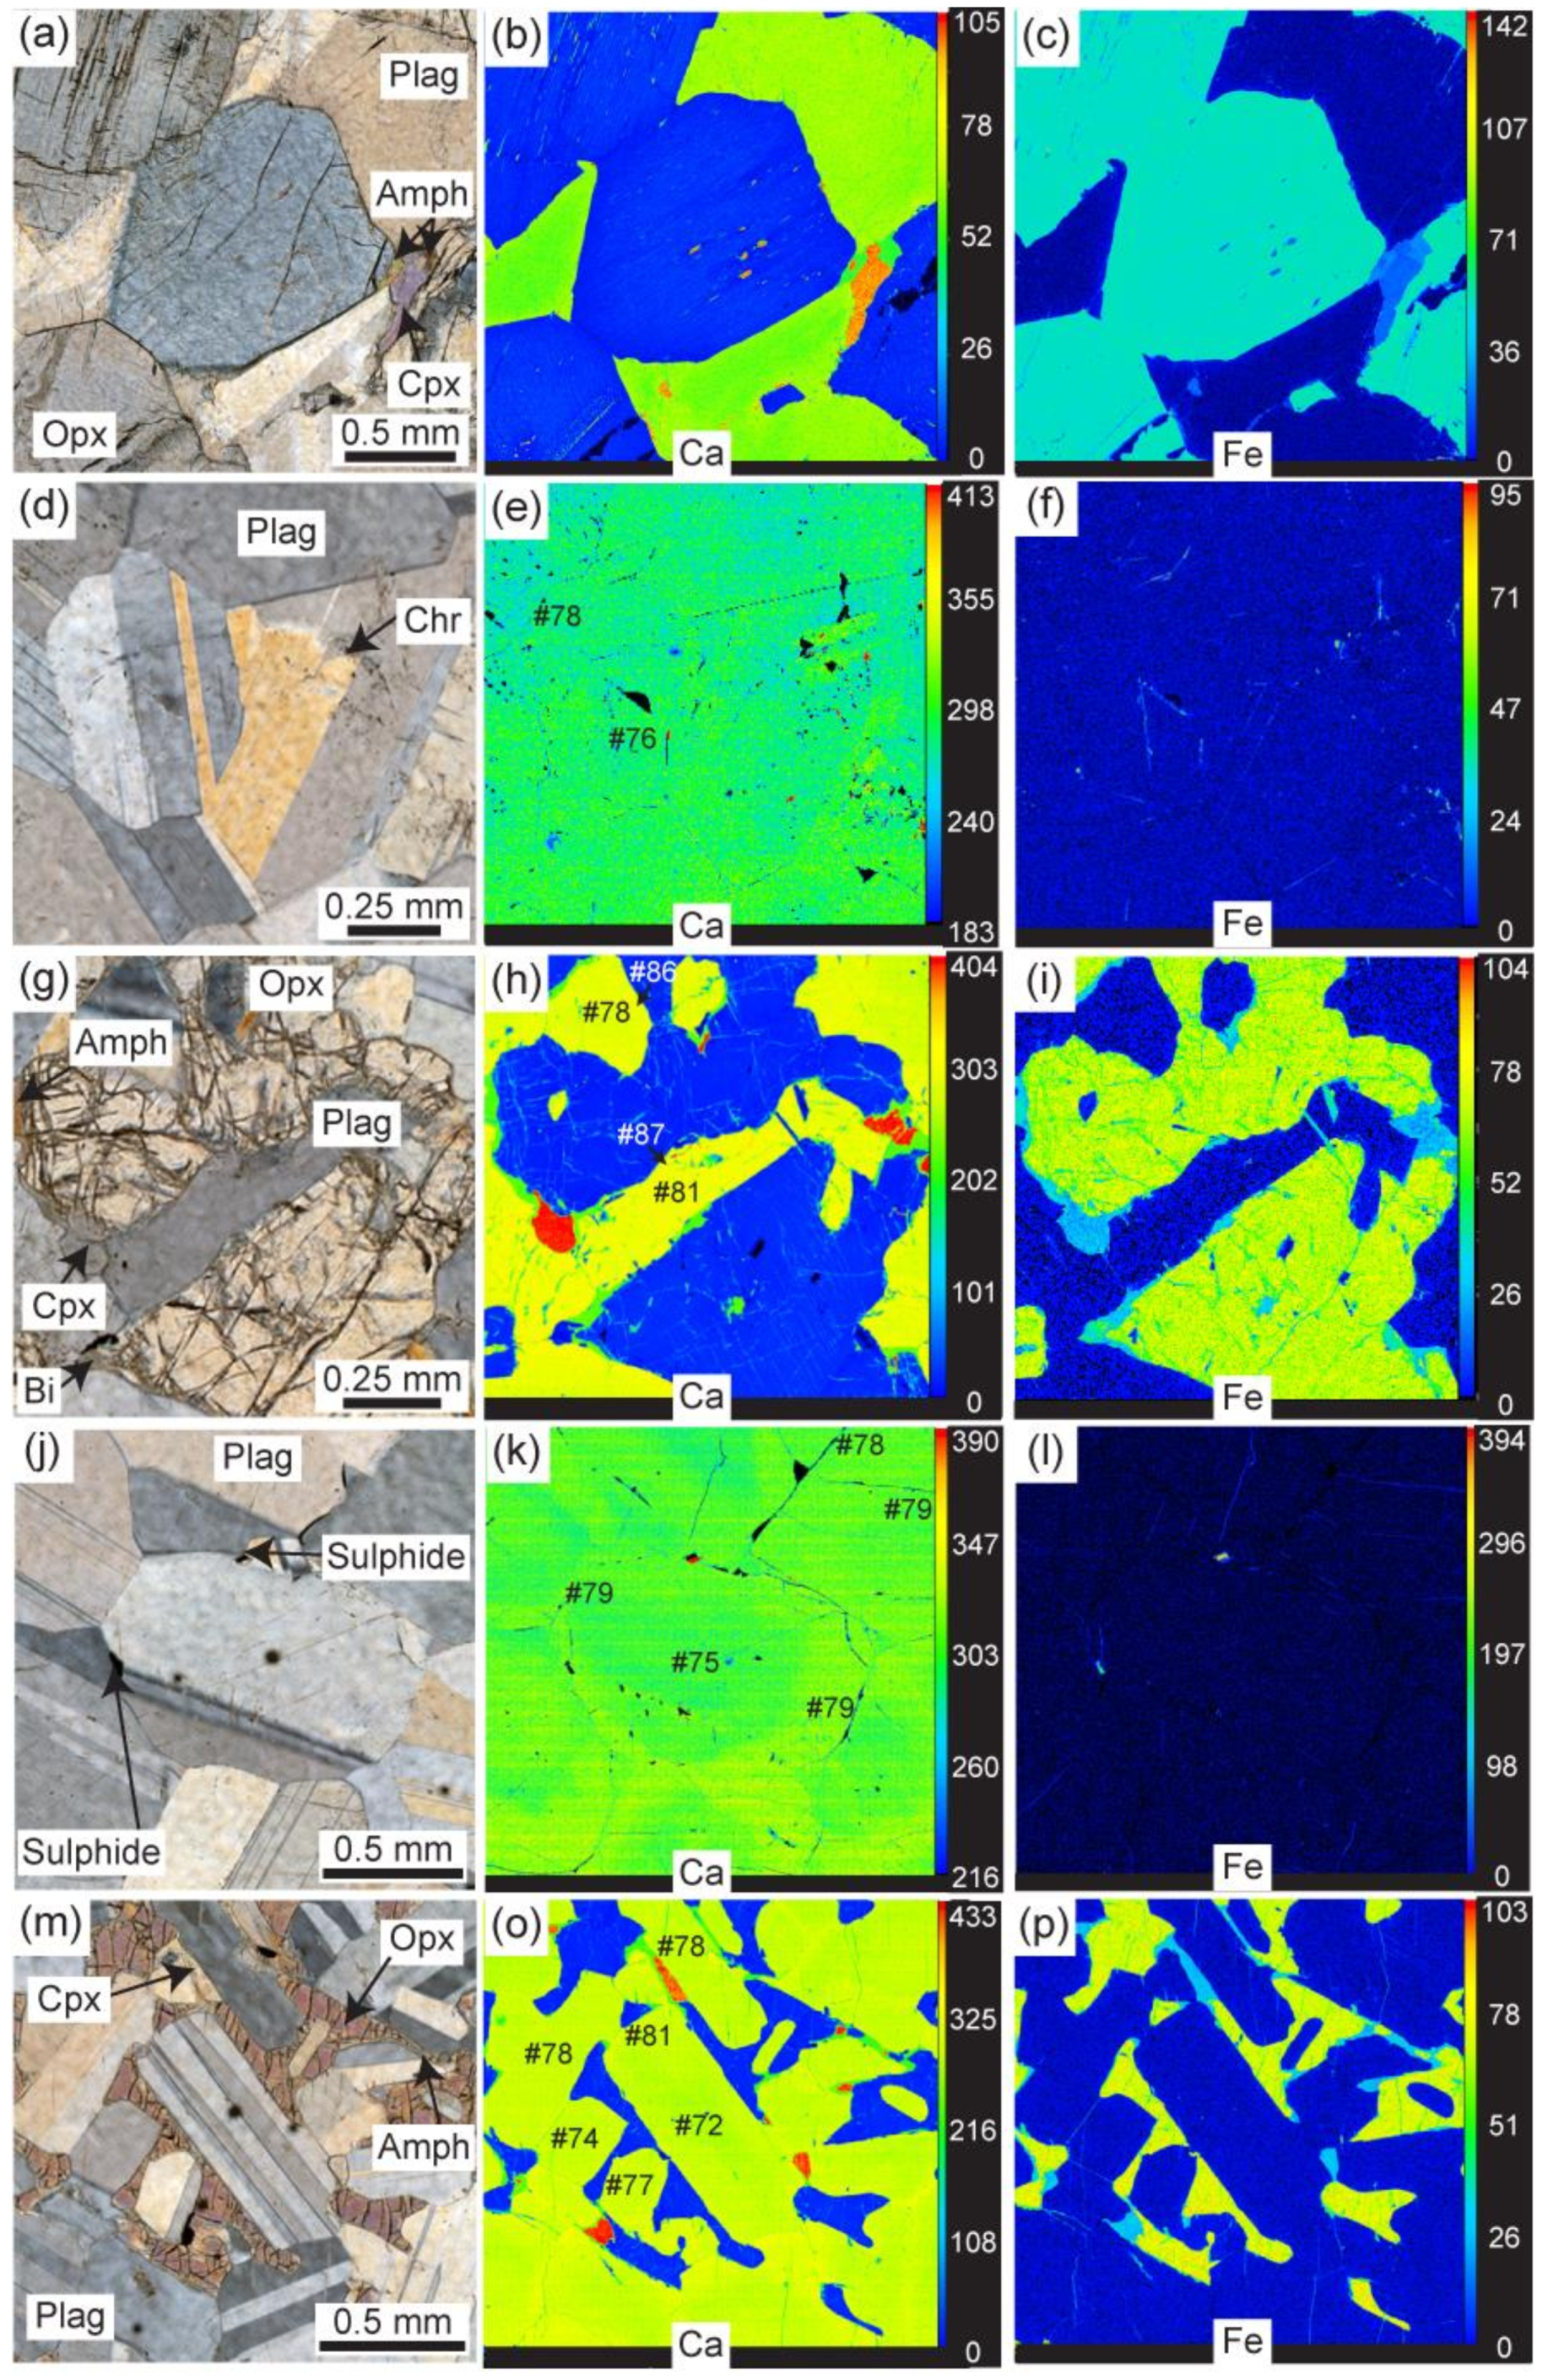
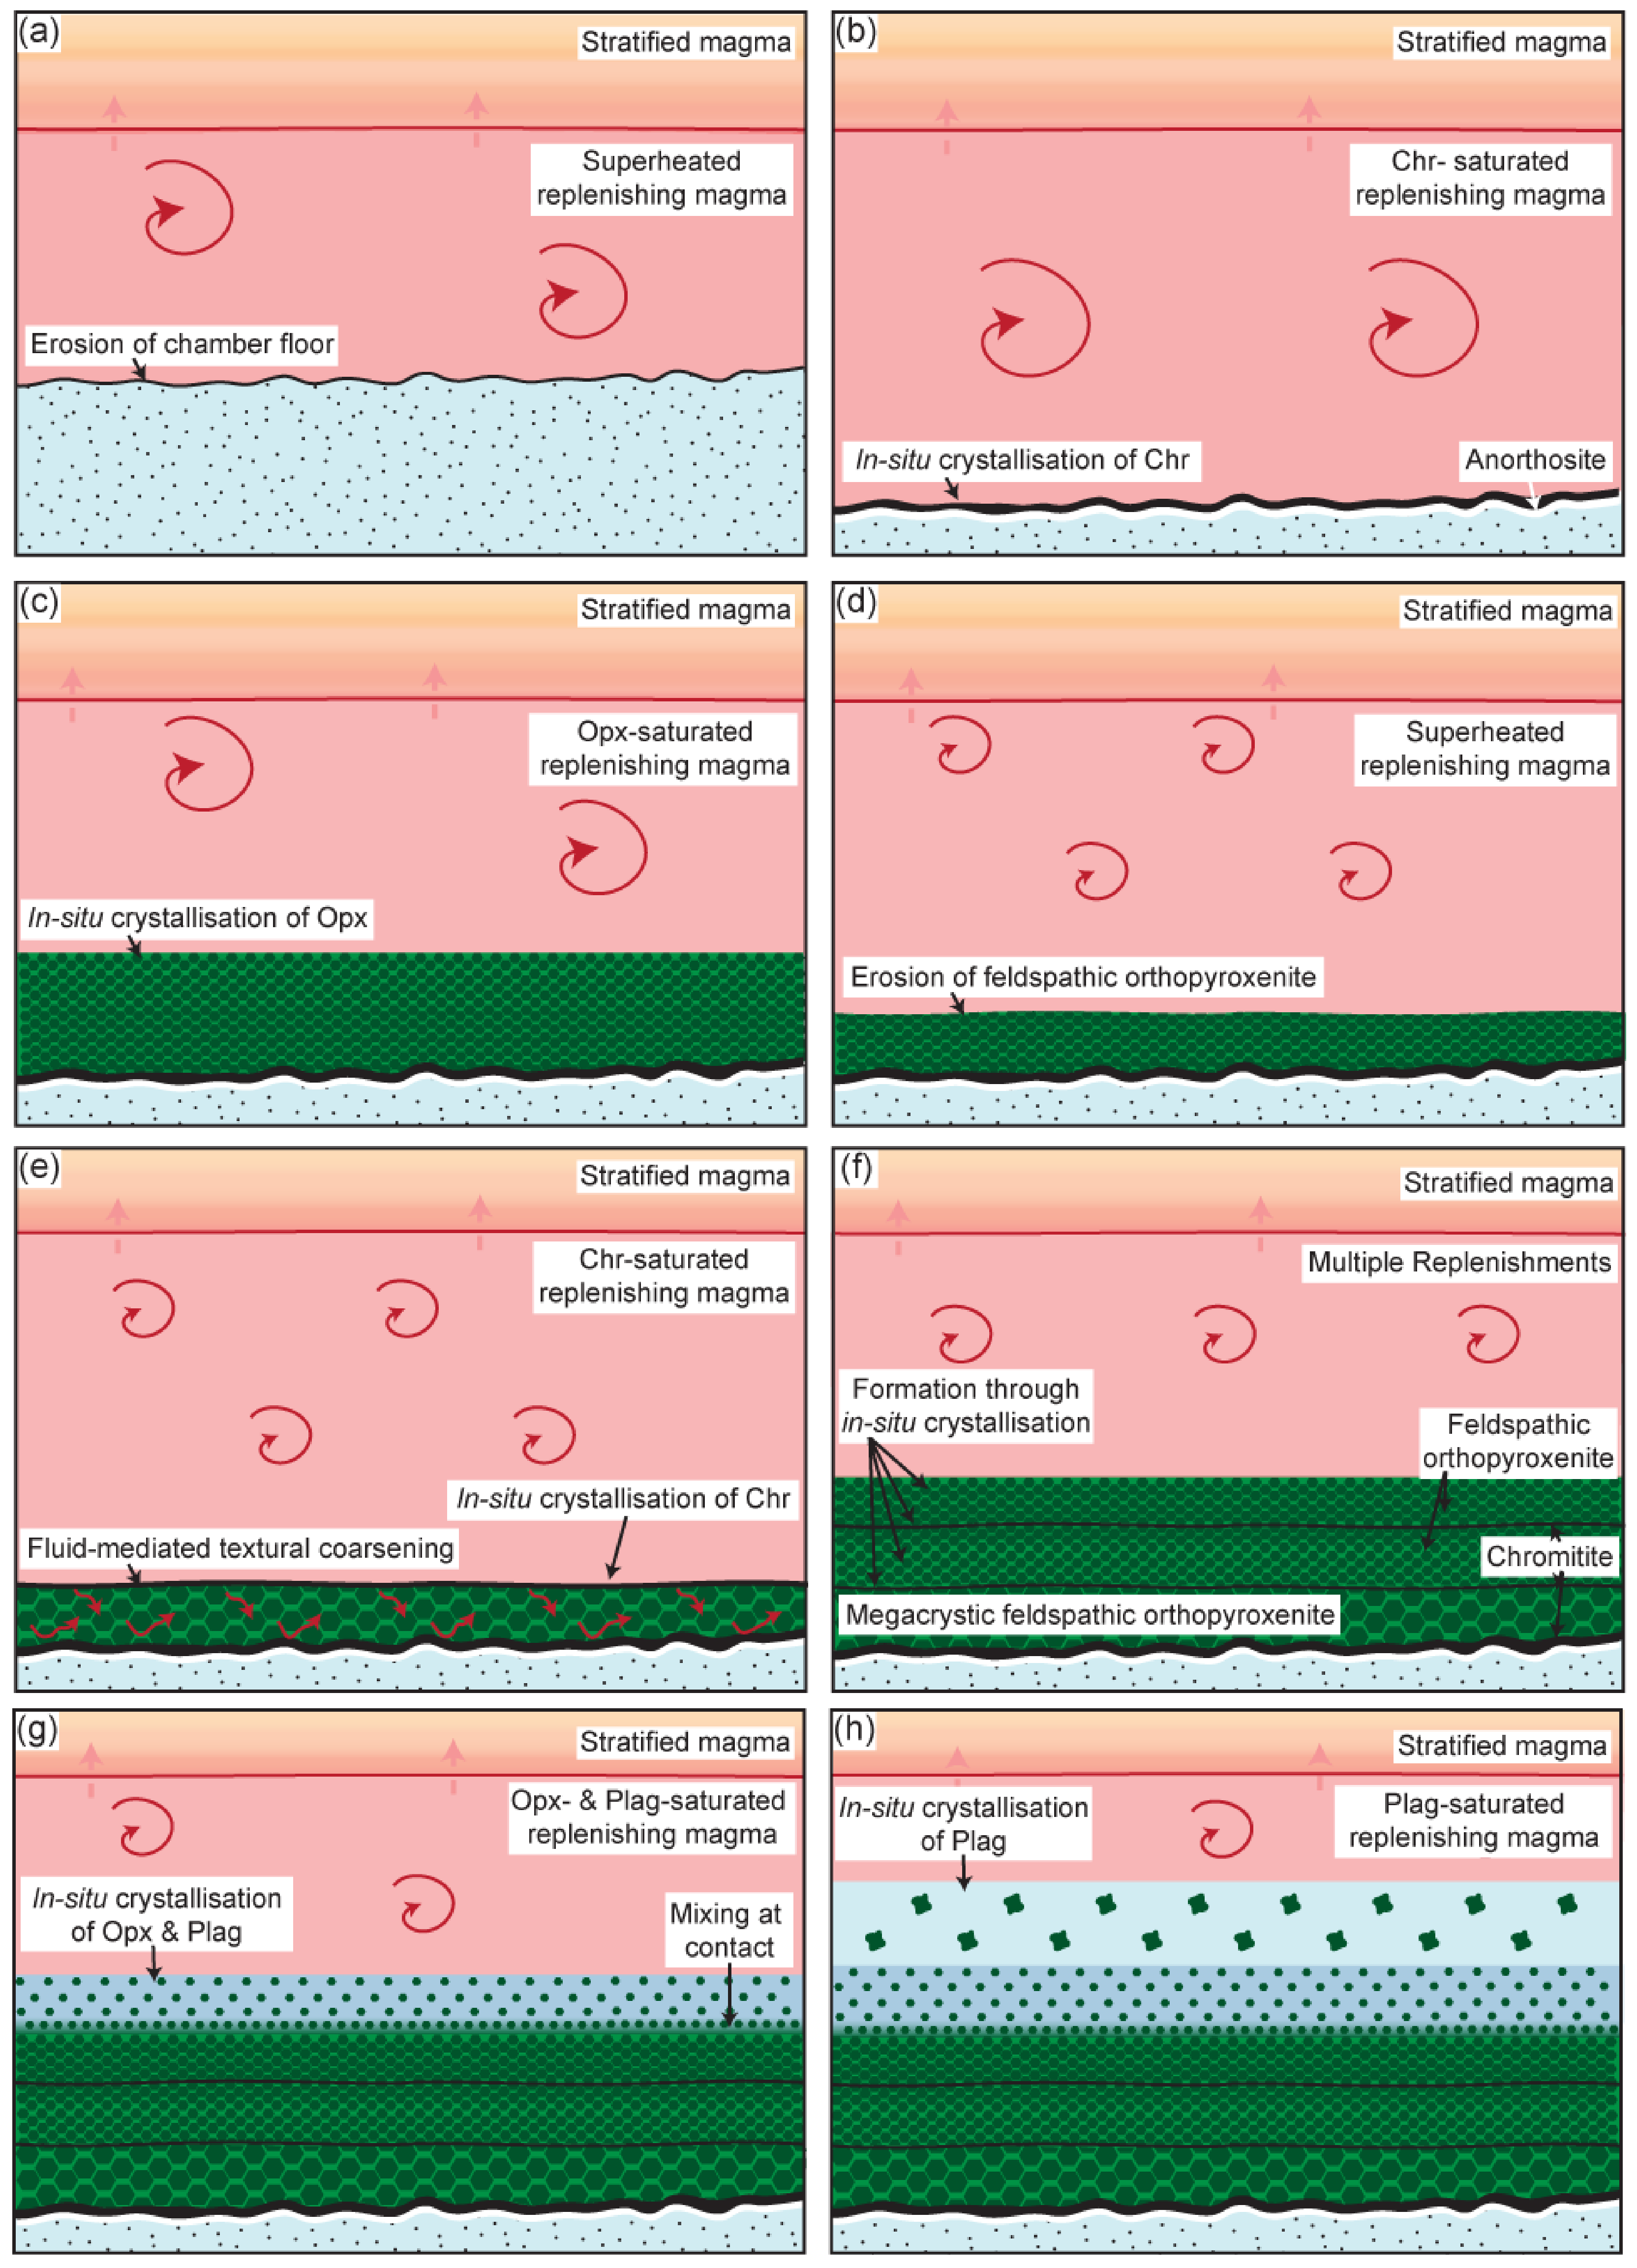
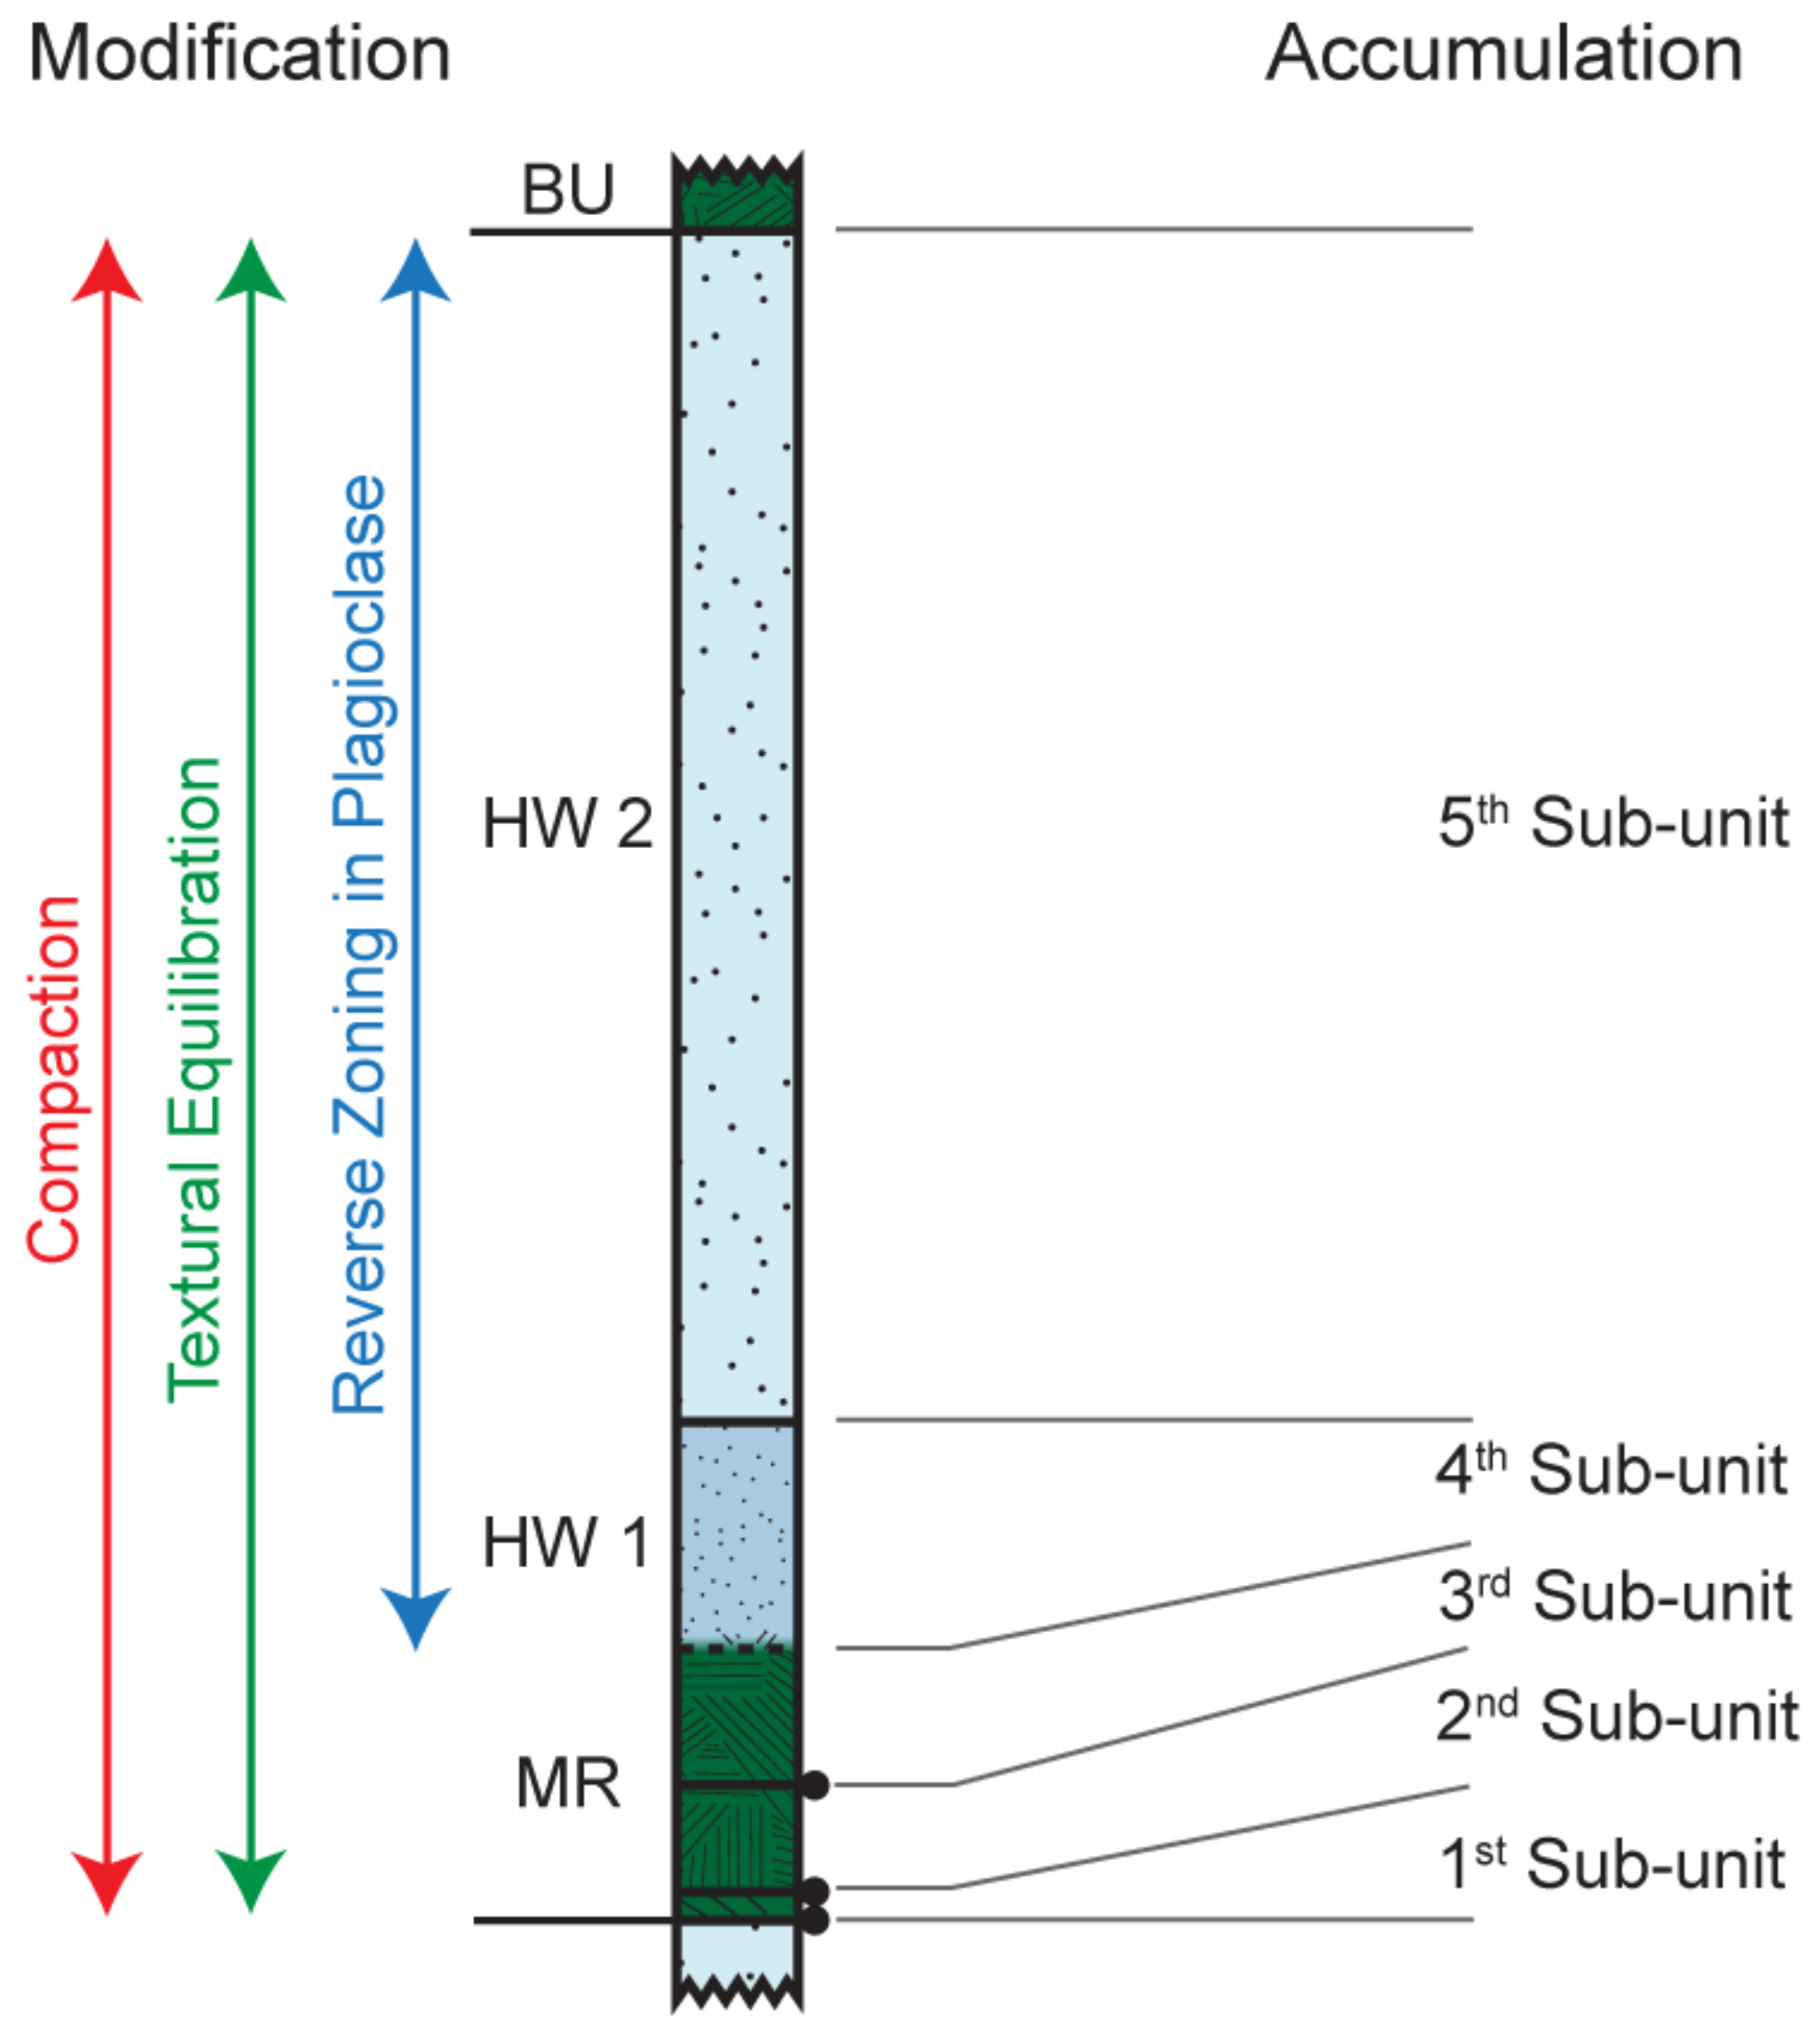
Table 1.
Crystal size distribution (CSD) input and output data. SPO = shape preferred orientation of crystal long axes from 0 (no alignment) to 1 (perfect alignment). Lmax = mean size of the four largest crystals. Y-intercept = y-axis intercept of linear regression. Ci (characteristic length) = −1/slope. Slope = gradient of linear regression.
| Sample | Rock | No. of Crystals | Measured Area (mm2) | Population Density | SPO | Lmax (mm) | Y-Intercept (mm−4) | Ci (mm) | Slope (mm−1) | R2 |
|---|---|---|---|---|---|---|---|---|---|---|
| Cr-spinel | ||||||||||
| EJH/15/067A | MR | 2958 | 238.07 | 32.27 | - | 1.14 | 6.62 | 0.10 | −9.82 | 0.973 |
| Base | 232 | 62.05 | 36.14 | - | 1.10 | 4.67 | 0.15 | −6.59 | 0.992 | |
| Top | 2746 | 175.98 | 30.92 | - | 1.02 | 6.99 | 0.09 | −11.01 | 0.968 | |
| EJH/15/069B | MR | 1843 | 87.80 | 27.04 | - | 0.87 | 7.10 | 0.09 | −11.43 | 0.936 |
| Orthopyroxene | ||||||||||
| EJH/15/042 | MR | 241 | 642.75 | 68.13 | 0.15 | 4.49 | 0.36 | 0.73 | −1.37 | 0.992 |
| EJH/15/043A | MR | 418 | 849.09 | 74.42 | 0.14 | 3.54 | 0.22 | 0.67 | −1.49 | 0.978 |
| EJH/15/045A | MR | 198 | 749.78 | 69.04 | 0.26 | 4.87 | −1.41 | 0.98 | −1.02 | 0.993 |
| EJH/15/046A | MR | 400 | 914.51 | 74.22 | 0.24 | 5.04 | 0.47 | 0.74 | −1.34 | 0.983 |
| EJH/15/067B | MR | 232 | 489.19 | 74.17 | 0.17 | 4.50 | 0.21 | 0.65 | −1.53 | 1.000 |
| EJH/15/068 | MR | 497 | 1000.37 | 64.95 | 0.16 | 3.41 | −0.17 | 0.70 | −1.42 | 0.927 |
| EJH/15/069A | MR | 197 | 851.07 | 62.47 | 0.02 | 5.67 | −1.38 | 0.90 | −1.11 | 0.997 |
| EJH/15/070 | MR | 216 | 849.64 | 72.39 | 0.27 | 5.44 | −1.80 | 1.09 | −0.92 | 0.953 |
| Plagioclase | ||||||||||
| EJH/15/071 | HW1 | 909 | 289.14 | 80.32 | 0.30 | 2.92 | 3.23 | 0.30 | −3.29 | 0.997 |
| EJH/15/072 | HW2 | 895 | 327.28 | 89.32 | 0.31 | 2.74 | 3.21 | 0.31 | −3.23 | 0.999 |
| Chadacrysts | 1088 | 251.49 | 70.05 | 0.30 | 2.44 | 3.99 | 0.24 | −4.13 | 0.999 |
© 2018 by the authors. Licensee MDPI, Basel, Switzerland. This article is an open access article distributed under the terms and conditions of the Creative Commons Attribution (CC BY) license (http://creativecommons.org/licenses/by/4.0/).
Share and Cite
MDPI and ACS Style
Hunt, E.J.; Latypov, R.; Horváth, P. The Merensky Cyclic Unit, Bushveld Complex, South Africa: Reality or Myth? Minerals 2018, 8, 144. https://doi.org/10.3390/min8040144
AMA Style
Hunt EJ, Latypov R, Horváth P. The Merensky Cyclic Unit, Bushveld Complex, South Africa: Reality or Myth? Minerals. 2018; 8(4):144. https://doi.org/10.3390/min8040144
Chicago/Turabian StyleHunt, Emma J., Rais Latypov, and Péter Horváth. 2018. "The Merensky Cyclic Unit, Bushveld Complex, South Africa: Reality or Myth?" Minerals 8, no. 4: 144. https://doi.org/10.3390/min8040144
Note that from the first issue of 2016, this journal uses article numbers instead of page numbers. See further details here.