Understanding Heterogeneity of a Slag-Derived Weathered Material: The Role of Automated SEM-EDS Analyses


1
Department of Earth Sciences and Environmental Management, Institute of Geological Sciences, University of Wrocław, pl. Borna 9, 50-204 Wrocław, Poland
2
Department of Soil Sciences and Environmental Protection, Wroclaw University of Environmental and Life Sciences, C.K. Norwida 25/27, 50-375 Wroclaw, Poland
3
Department of Economic Geology and Petrology, Institute of Mineralogy at TU Freiberg Brennhausgasse 14, D-09596 Freiberg, Germany
*
Author to whom correspondence should be addressed.
Minerals 2018, 8(11), 513; https://doi.org/10.3390/min8110513
Submission received: 15 August 2018
/
Revised: 30 October 2018
/
Accepted: 3 November 2018
/
Published: 8 November 2018
(This article belongs to the Special Issue Metallurgical Slags)
Abstract
:Slag heaps over years may evolve into complexly weathered zones, which are a challenging material for analyses as they contain phases from numerous sources and at different stages of weathering. However, the weathered zones are important parts of slag heaps, because they contain both primary and secondary phases enriched in metal(oid)s that may become soluble under specific conditions. The weathering reactions related to metal release or precipitation may be recorded in a heavy mineral fraction as the fraction contains predominately minerals with elevated toxic elements concentrations. Therefore, an automated SEM analysis on a polished section of included heavy mineral particles was applied in this paper for a rapid recognition of phases in a complex setting and their classification into detrital, primary and secondary phases. The approach was applied to a slag heap in Świętochłowice (Upper Silesia, Poland) and it consisted of analyzing magnetic and non-magnetic heavy mineral fractions from three distinct horizons noted A, B and C. Materials had been previously interpreted as being sourced from the heap itself (lowermost horizon C) and from artificially added materials used later for superficial site remediation (upper horizons A and B). Instead, automated SEM analysis demonstrated that horizon C is derived from the slag heap weathering, horizon B is derived predominately from the artificially added materials, whereas horizon A is a mixture of the B and C horizons. Additionally, when slag particles in horizons A and C are compared, the lowermost horizon C contains more slag-derived secondary phases, whereas horizon A contains more primary slag phases. Therefore, horizon A remains the most prone to releasing toxic elements because, considering its position as the uppermost horizon, it can be submitted to climatic solicitation (fast water circulation).
1. Introduction
Industrial areas affected by mining and smelting are sites exposed to extensive pollution of air, water and soil [1,2,3,4,5], and because of that, they are often treated as a priority for remediation [6,7]. The main source of pollution in such areas is the deposition of a material produced during mining and smelting (ore remnants, gangue, fly ash, and slag). Mining produces relatively simple waste material with a limited number of phases, depending on the ore used. Mineral transformation in weathered zones developed on such materials could be characterized and quantified [8,9]. On the other hand, slags form mineralogically and chemically complex materials characterized by a number of phases with strongly variable compositions [10,11]. Understanding weathering on the slag substrate can be more challenging compared to that affecting mining wastes. In this paper, Mineral Liberation Analyses (MLA) by automated scanning electron microscope (SEM) was used to constrain material inputs that form a complex weathered zone developed on a Zn-Pb slag heap in Świętochłowice in Upper Silesia (Poland). In particular, this paper evaluates if such a tool can be successfully used to provide quick screening of materials with complex phase compositions.
Automated SEM analysis techniques including MLA are widely applied to characterize textural properties of ore that are then used to design an appropriate mineral processing approach [12,13,14,15]. Specifically, the liberation of phases with high economic impact from different gangue material can be investigated [14,16]. They are also used to solve environmental problems e.g., to quantitatively estimate the Pb leaching potential of a slag [17] or to better plan and perform more demanding analyses, e.g., optically stimulated luminescence dating [18]. However, the success of automated-SEM measurements is strongly dependent on the quality of the user-defined database of energy dispersive X-ray (EDX) spectra. For relatively simple materials such as ore-bearing rocks or mineral separates for dating, the databases comprise several phases [14,16,18]. Slags are more complex [10,17] and weathered zones developed on slag heaps may contain material from several slag types and several types of smelting and post-smelting activities that is later modified by pedogenesis [5]. Our approach is to analyse the heavy mineral fraction present in such weathered zones and soils, as these minerals often record primary-secondary mineral transformations and provide information on metal(oid) mobility [2,4]. Despite general complexity in defining the complete database for characterizing phase composition of such slag-related materials, automated SEM analyses can be successfully and rapidly applied in order to: (a) Define different sources of material in weathered uppermost horizons of slag heaps and soils derived or affected by slag deposition, (b) compare the horizons, and (c) understand the processes leading to the horizons formation and define the extent of mineral transformation within each horizon. In this paper, such a technique was applied to delineate the material sources contributing to a complex weathering profile in the Świętochłowice slag heap and see if the conclusions are consistent with those based on bulk and leachate chemistry [19]. The heap was previously extensively studied and is well characterized in terms of phase composition [19,20,21,22] and, therefore, is a perfect testing site to apply SEM-automated analyses. This paper also proposes some general features of automated SEM datasets based on heavy mineral fractions that can be used for analyses of similarly complex material, in particular, to classify and estimate the proportions between primary, secondary and detrital phases in weathered zones formed on slag heaps.
2. Materials and Methods
2.1. Site Description and Sampling Strategy
The studied slag heap from a Zn-Pb smelting process was deposited during the activity of the nearby smelting factory “Silesia” that operated from the middle of the 19th century and was closed down in 1974 [21]. In recent years, large portions of the slag heap were removed during remediation of the site and the inside parts of the heap were exposed, showing a strongly weathered interior [19]. Usually, the vertical profiles through the slag heap (Figure 1) consisted from the bottom to the top, from a reddish fine-grained material containing unweathered slag fragments coated with secondary minerals, yellowish horizons containing clay, to sand material and black-greyish horizons at the top, showing signs of soil development. One such profile was analysed in this study, the distinct horizons were noted as the reddish horizon C, the yellowish horizon B and the black-grey horizon A (Figure 1). Previous studies showed that horizon C is enriched in metal(loid)s compared to upper layers and horizon B was the most impoverished [19]. Horizon C is also composed of larger sized grains with fragments over 2 mm that constitute 50% of the sample while the fraction <50 μm represents only 8%. In contrast, horizons A and B are dominated by a material with 200 μm to 2 mm grain size (45% and 43%, respectively) and have higher amounts of the finest fraction (13% and 20%, respectively [19]).
2.2. Methodology of Sample Characterization
Several kilograms of each horizon were sampled for analyses done in the Tyszka et al.’s study [19]. A quarter of each sample was taken for heavy mineral separation. The material was sieved through a 2 mm mesh. The sieved material was placed in a separatory funnel filled with heavy liquid Na2WO4, that separated all minerals with densities over 2.9 g/cm3. Subsequently, the heavy phases were divided into magnetic (dominating) and non-magnetic fractions using a magnet and then mounted as separate thin sections (6 in total), and polished. The weight proportions of the heavy mineral fraction were not estimated. However, some estimates may be based on mass balance calculations and certain assumptions. For example, assuming that all Zr is contained in mineral zircon (ZrSiO4) in the non-magnetic fraction and all Cr is contained in chromite (FeCr2O4) in the magnetic fraction, it can be estimated based on bulk composition of the whole sample and bulk composition of the heavy minerals sample that horizon A contains less than 0.5 wt % non-magnetic fraction and approximately 8 wt % magnetic fraction. A similar estimate of the weight fraction of the non-magnetic fraction was calculated for horizon B (Online Resource ESM 1-1). These are maximum estimates assuming null concentrations of these elements in the non-heavy fraction. Similar estimates are difficult for other horizons due to lack of appropriate phases and elements. A low proportion of the non-magnetic fraction is consistent with the number of mounted particles, for the non-magnetic fraction all of the separated particles were mounted and constituted approximately 16,900 particles for horizon A, 5400 particles for horizon B and 26,400 particles for horizon C. In contrast, the mounted magnetic heavy mineral fraction was just a fraction of the separated amount and constituted approximately 32,100 particles for horizon A, 28,100 particles for horizon B and 48,900 particles for horizon C.
Some of the sieved material before the heavy minerals separation was also ground and analysed using X-ray diffraction (XRD). XRD patterns were obtained using a SIEMENS D5005 diffractometer (SIEMENS, Munich, Germany) at the University of Wrocław (Co Kα radiation, 2θ range from 4° to 90°, step 1.2° 2θ min−1). The identification of minerals was based on the PDF 2 ICDD database.
Mineral Liberation Analyses (MLA) measurements were carried out at the Geometallurgy Laboratory at TU Bergakademie Freiberg with an FEI Quanta 650F SEM (FE-SEM instrument, FEI Company, Eindhoven, The, Netherlands) equipped with two Bruker Quantax X-Flash 5030 EDX detectors (Bruker, Berlin, Germany; analysis conditions: E = 25 kV at spot-size = 5.0, beam current = 10 nA). A software package for mineral liberation analysis (MLA version 3.1 by FEI Company, Eindhoven, The Netherlands) was used for the automated steerage of the electron beam for EDX identification of slag and soil grains, as well as the collection of numerous EDX spectra.
The following measurement routine was applied: The GXMAP routine produces a narrow grid of around 1600 single EDX spectra per mm2 on each heavy mineral or slag grain in the samples. Then, a list of reference EDX spectra was established by collecting spectra from the particles and grains in the samples. The reference spectra were labelled in a generic way as explained below. Finally, the GXMAP measurements were classified against the reference EDX spectra list with a high degree of probability of a match.
The most challenging part of the MLA procedure was to define the adequate database of reference EDX spectra. Due to the internal complexity of the material, only some minerals could be identified explicitly. A similar problem was discussed in the study of Morrison et al. [17], where the authors decided to classify phases in several groups with generic names, the approach was sufficient to estimate potential Pb leaching from the studied slag. Also in this study, for most of the phases and their EDX spectra, a generic labelling was applied. In many cases, the combined observation of images in Back Scattering Electron mode and EDX spectra allowed the authors to define if the mineral is of primary (such spectra were specified with the first letter P) or secondary origin (letter S). In addition, a sub group called “detrital” (letter D) was identified and it comprised typical heavy minerals found in detrital sediments e.g., zircon (ZrSiO4) or rutile TiO2. Another sub-group of secondary minerals noted letter H, included typical phases formed by hydrothermal activity. In many cases, the fine-grained secondary phases cannot be distinguished by SEM-EDX and yield mixed spectra. Such mixed spectra were marked as secondary multi-phases (spectra names included the dominating elements and the letter S). They are typical for weathered slag phases and similar analyses of secondary multi-phases were obtained in other slag occurrences, where analyses of weathering crusts were similarly a mixture of Fe, Al, and Si-rich phases [23].
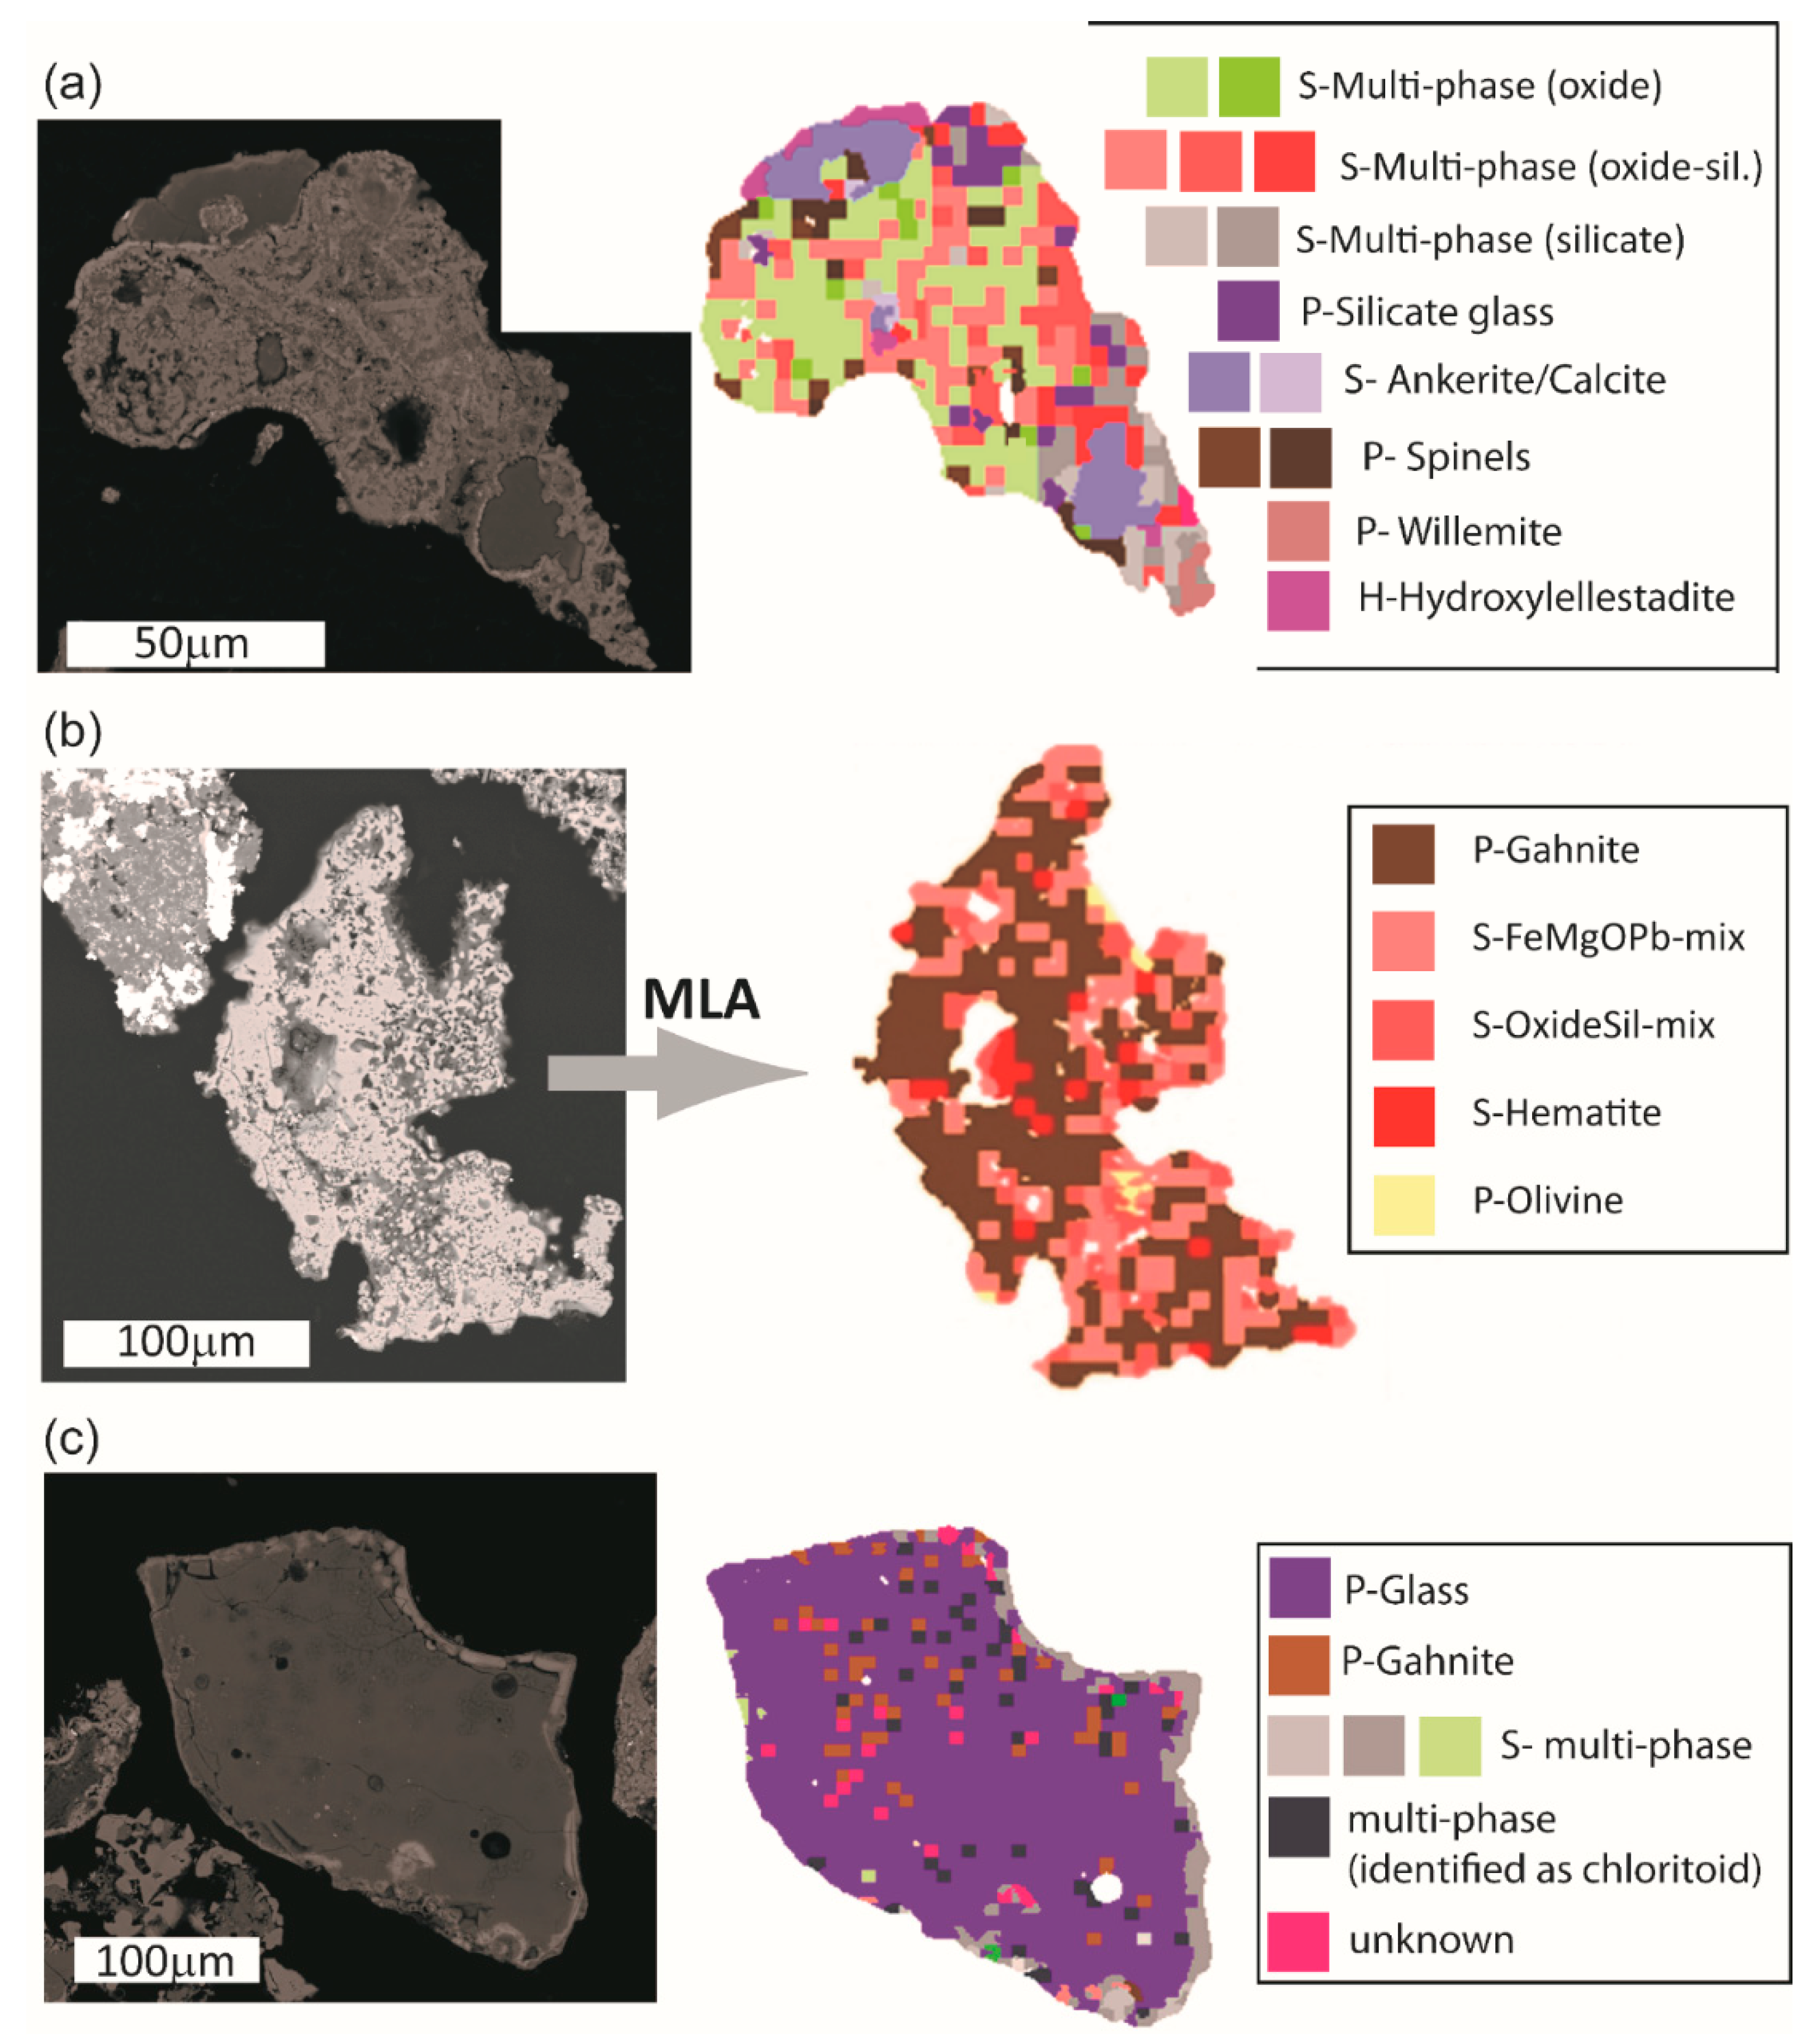
A general good correspondence between mineral identification and their appearance in a mineral grain (primary phases occur usually within the centres of the grains whereas secondary phases form crusts or fill voids as observed on Figure 2a,b—Online Resource ESM 2), supported the validity of such an approach.
An example of such an approach is shown in Figure 2, where three particles with different weathering extent are shown. The first particle in Figure 2a is composed mostly of fine-grained weathering products with small remnants of spinels, glass and willemite (Zn2SiO4). Voids in the particle are filled by precipitated secondary carbonates and hydrothermal hydroxylellestadite (Ca5(SiO4)1.5(SO4)1.5(OH)) precipitated as a crust on the particle surface (Figure 2a). The only questionable phase in this particle is gahnite (ZnAl2O4), identified in the outermost part of the particle, which is probably a Zn-rich secondary precipitate. The second particle in Figure 2b comprises a larger proportion of primary gahnite (spinel group) that occurs together with remnants of other primary (olivine) and secondary (mixed silicate–oxide spectra, hematite) multi-phases. Such phases were more easily weathered than gahnite.
The third fragment in Figure 2c represents the least weathered particle, composed mostly of silicate glass and spinels, with secondary phases that appear only in the outermost parts of the particle. Other small grains were identified by software as chloritoids ((Fe,Mg,Mn)2Al4Si2O10(OH)4) and represent mixtures of spinels and glass. Other phases that were wrongly identified are presented in Online Resource 2. They are comprised of (a) detrital garnet in horizon B that was identified finally as glass and (b) zoisite (Ca₂Al₂(SiO₄)₃) also in horizon B that was identified as secondary multi-phase (Online Resource ESM 1).
Finally, despite some inconsistencies, the generic phase classification based on MLA (as primary, secondary and detrital) is consistent with phase composition and classification described in previous studies [20,21]. Furthermore, the application of diagrams designed in this study (for example Figure 8) allowed the quick spotting of the grains, which were wrongly assigned to the phase generic group as it is discussed below.
3. Results
3.1. Phase Composition of Whole Samples Using X-ray Diffraction
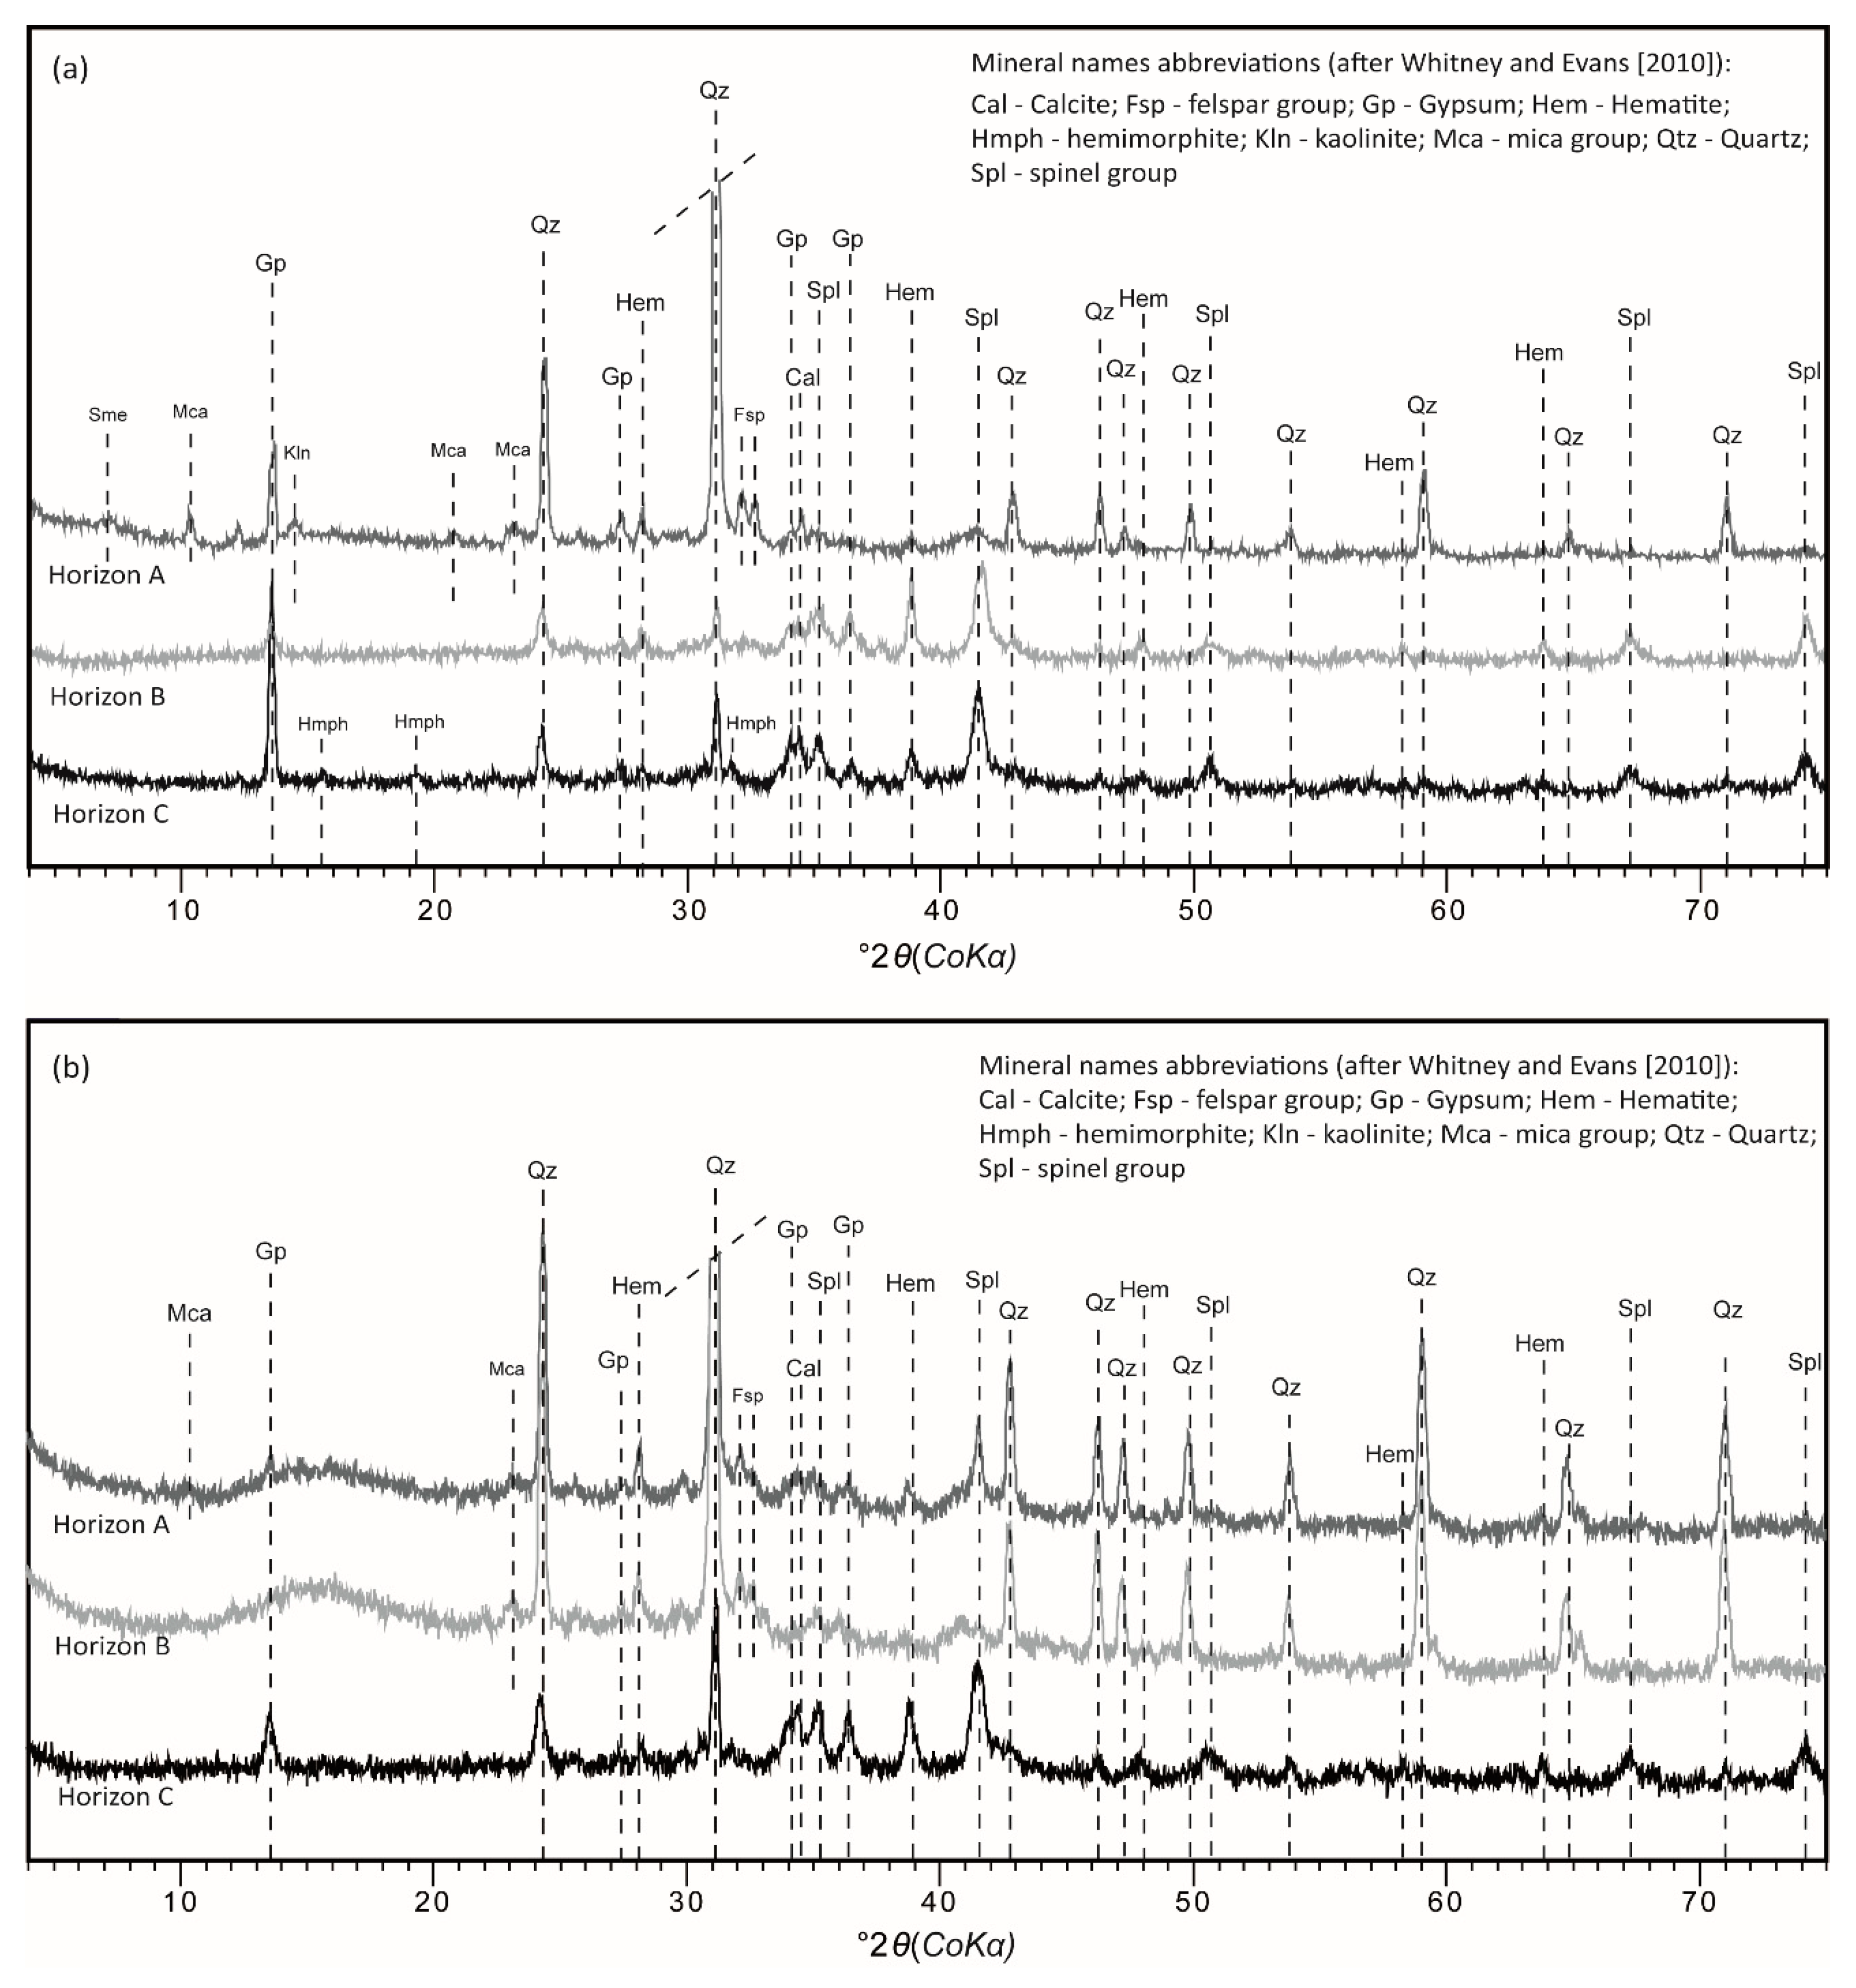
The general mineral composition of whole samples using X-ray diffraction patterns can be compared to the mineral composition of four size fractions (>2 mm, 200 μm–2 mm, 50–200 μm and <50 μm fractions). XRD patterns previously published for horizon C [15] were compared to the other two horizons. Two size fractions are presented in Figure 3: The assumption is that the fraction below 50 μm may be enriched in secondary phases, whereas the fraction from 200 μm to 2 mm should show primary minerals of the substrate. The mineral composition is generally dominated by hematite (Fe2O3) and gypsum (CaSO4·2H2O) that occur in all horizons, and in most of the fractions below 2 mm. Horizon A is also enriched in clay minerals, micas and feldspars in the fraction below 50 μm, whereas micas and feldspars occur in the coarser fraction also in horizon B. Spinel group minerals occur in all horizons, but larger peaks were observed in horizons B and C. Different spinels cannot be distinguished on XRD patterns and the major peak of diffraction probably includes magnetite (Fe₃O₄), magnesioferrite (Mg(Fe3+)2O4) and/or franklinite ((Zn,Mn2+,Fe2+) (Fe3+,Mn3+)2 O4) (see MLA data below). Hemimorphite (Zn4Si2O7(OH)2·(H2O)) occurs in the fraction below 50 μm in horizon C. Therefore, XRD patterns suggest that horizons A and B contain similar and not slag-related material.
3.2. Heavy Mineral Fraction Analysed with Mineral Liberation Analyses
3.2.1. Modal Composition
Modal composition (in this study it represents % area of each phase in heavy mineral fractions) is a perfect tool for characterizing basic differences and similarities between the phase content of each horizon. The composition was estimated based on all particles included in thin sections (5000–50,000 depending on the sample, see Section 2). MLA show complex modal composition of the heavy mineral fractions for all of the samples. Usually, more than 15 different phases occur in quantities over 1% (area) both in magnetic and non-magnetic fractions (Online Resource ESM 1-2). Due to the complexity of the phases (many spectra came from the mixtures of several phases), all of the phase proportions are given as a percentage of particle area, and not as % weight or % volume.
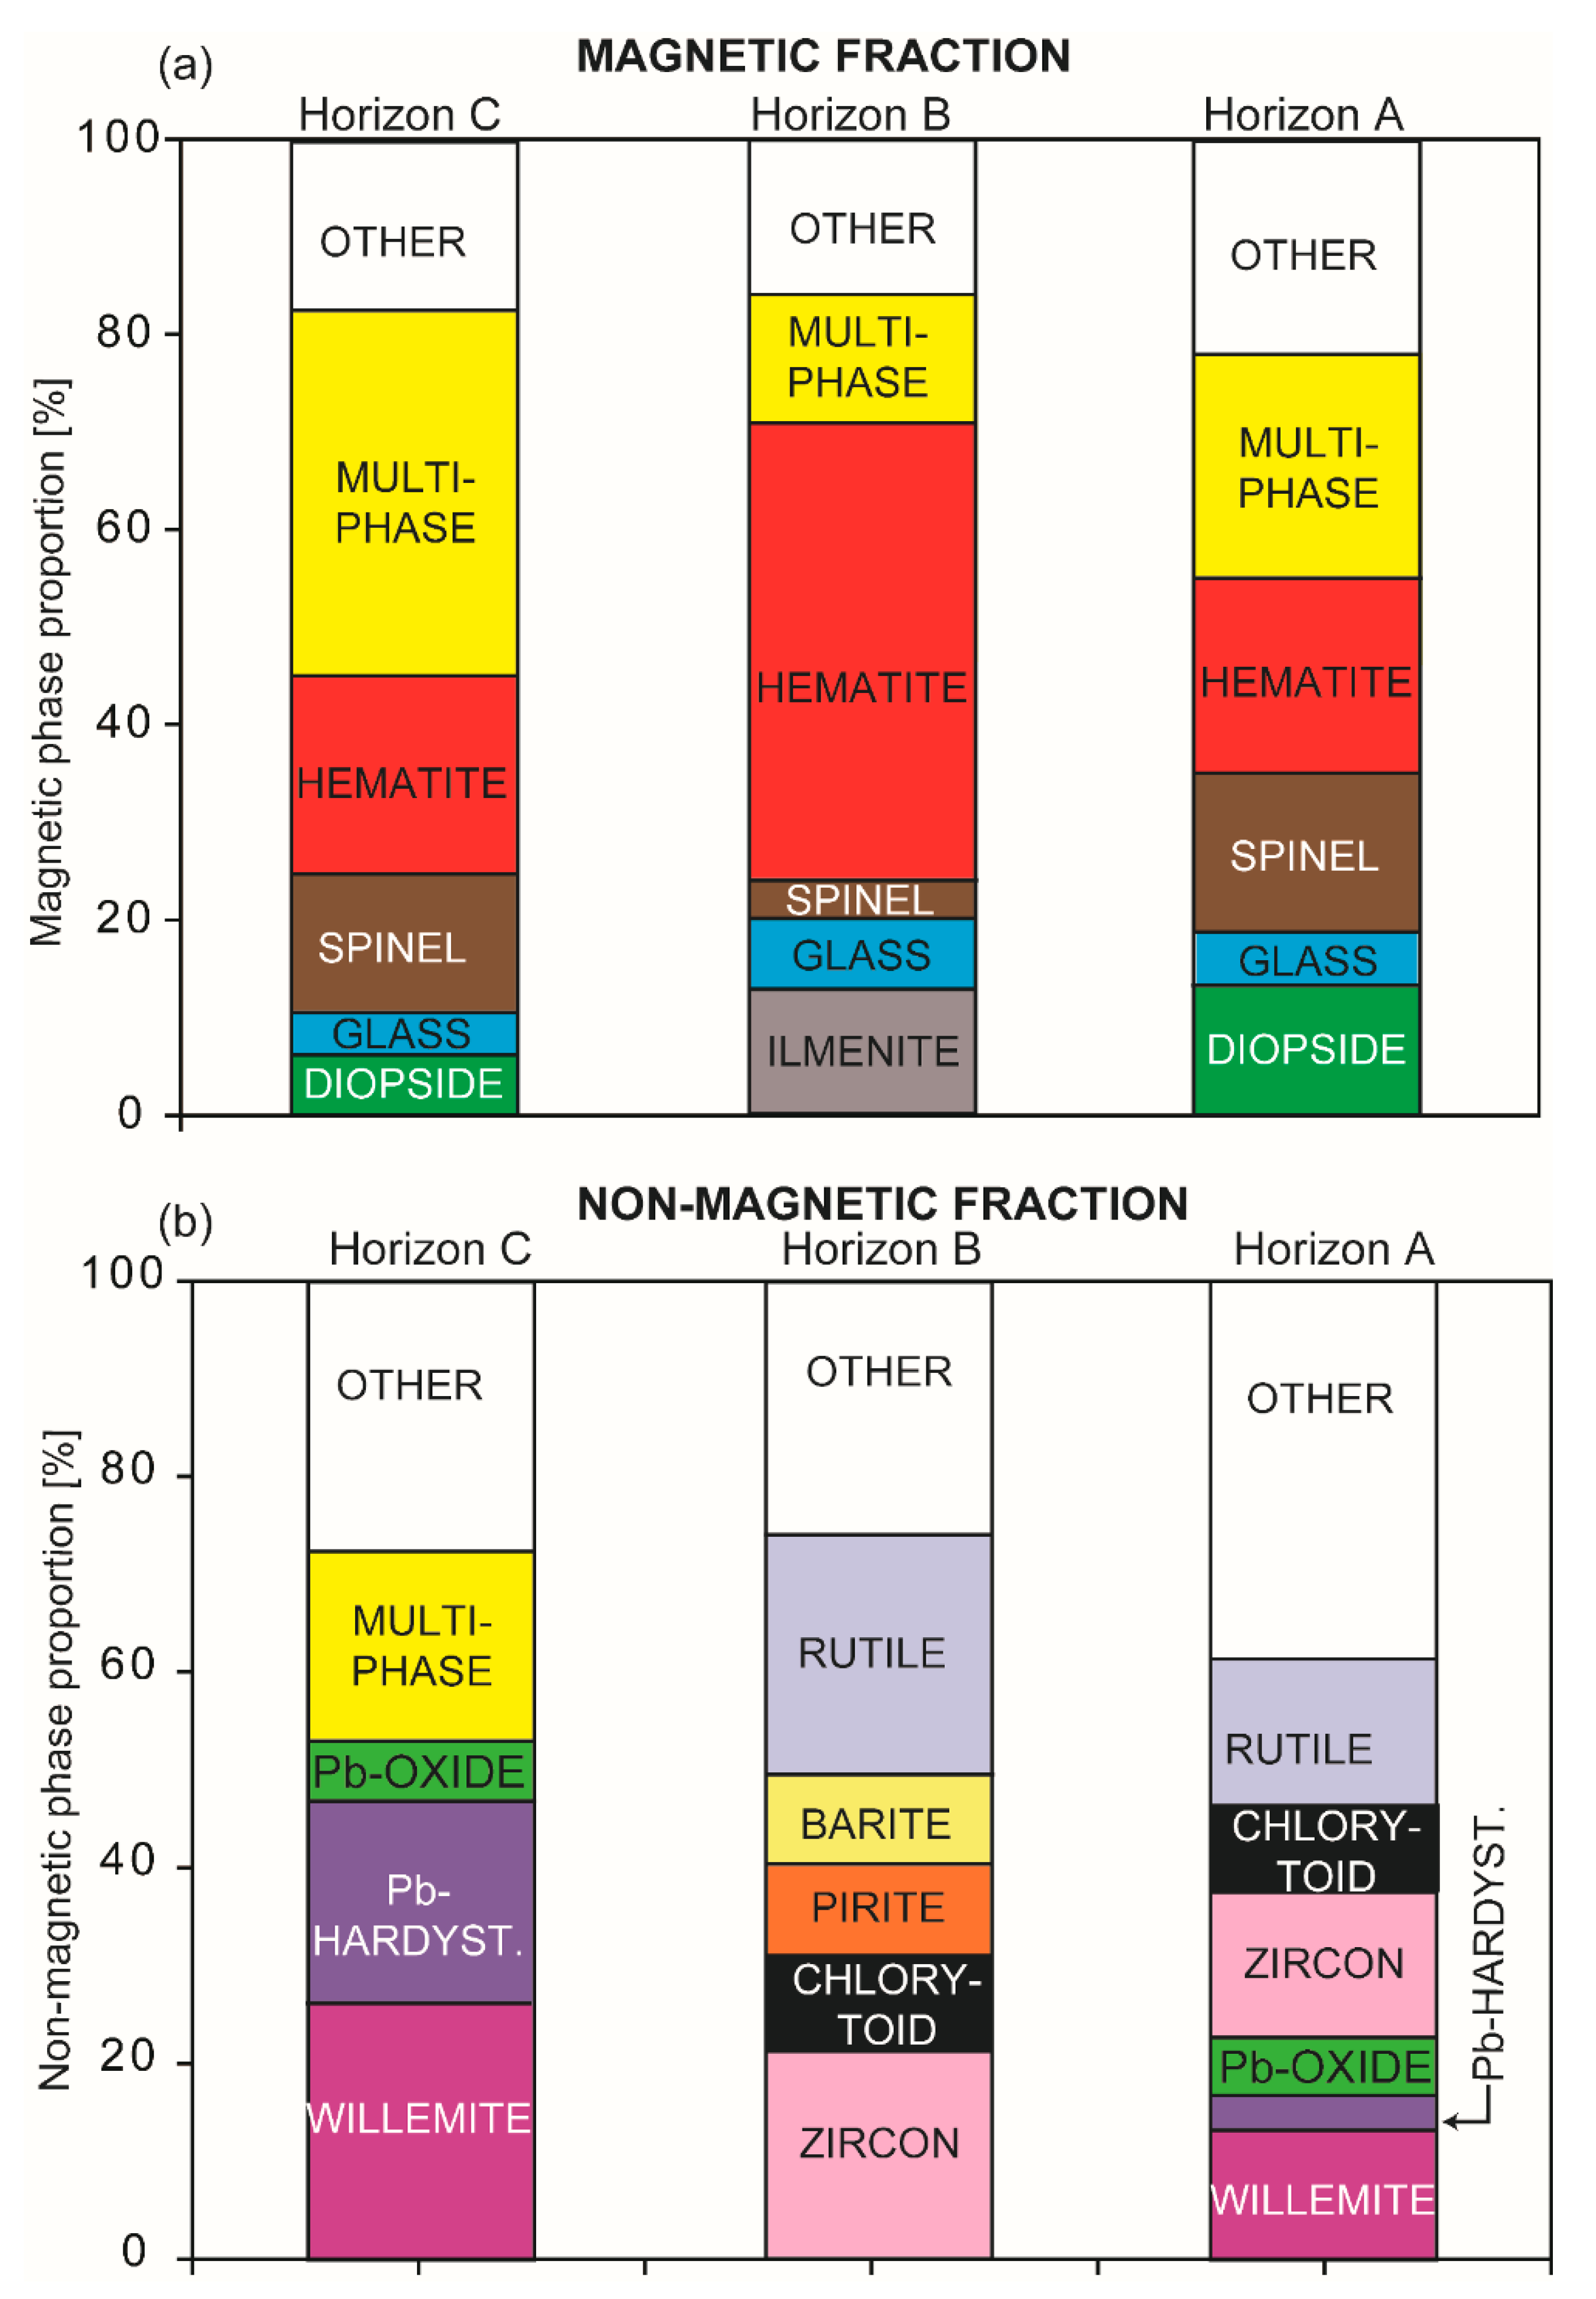
Generally, each of the studied horizons has a distinct modal composition but hematite remains in all horizons as the dominating phase. In detail, horizon A contains phases present in both horizons B and C, whereas horizons B and C only rarely share common phases. Simplified modal abundances are shown in Figure 4.
In the lowermost horizon C, secondary phases dominate over primary ones in the magnetic fraction, which is dominated by hematite (20%) and mixed silicate Fe-oxide fine-grained phases (32%). The primary minerals are represented by primary slag phases, as described by [21] and are hercynite-gahnite (9%), franklinite (6%) and diopside (6%). On the other hand, the non-magnetic fraction is dominated by primary slag phases such as willemite (26%) and hardystonite (20%). The middle horizon B is dominated by hematite in the magnetic fraction (47%) and by detrital phases such as rutile (24%) and zircon (21%) in the non-magnetic fraction. The uppermost horizon A is dominated by phases occurring in both horizons A and C. The magnetic fraction is dominated by hematite (20%), diopside (12%), hercynite-gahnite (8%) and franklinite (9%), similar to the magnetic fraction of horizon C. In the non-magnetic fraction, zircon (15%), rutile (15%) and willemite (14%) dominate. In both fractions, phases designed as secondary are less abundant than in horizon C.
3.2.2. Particle Shape
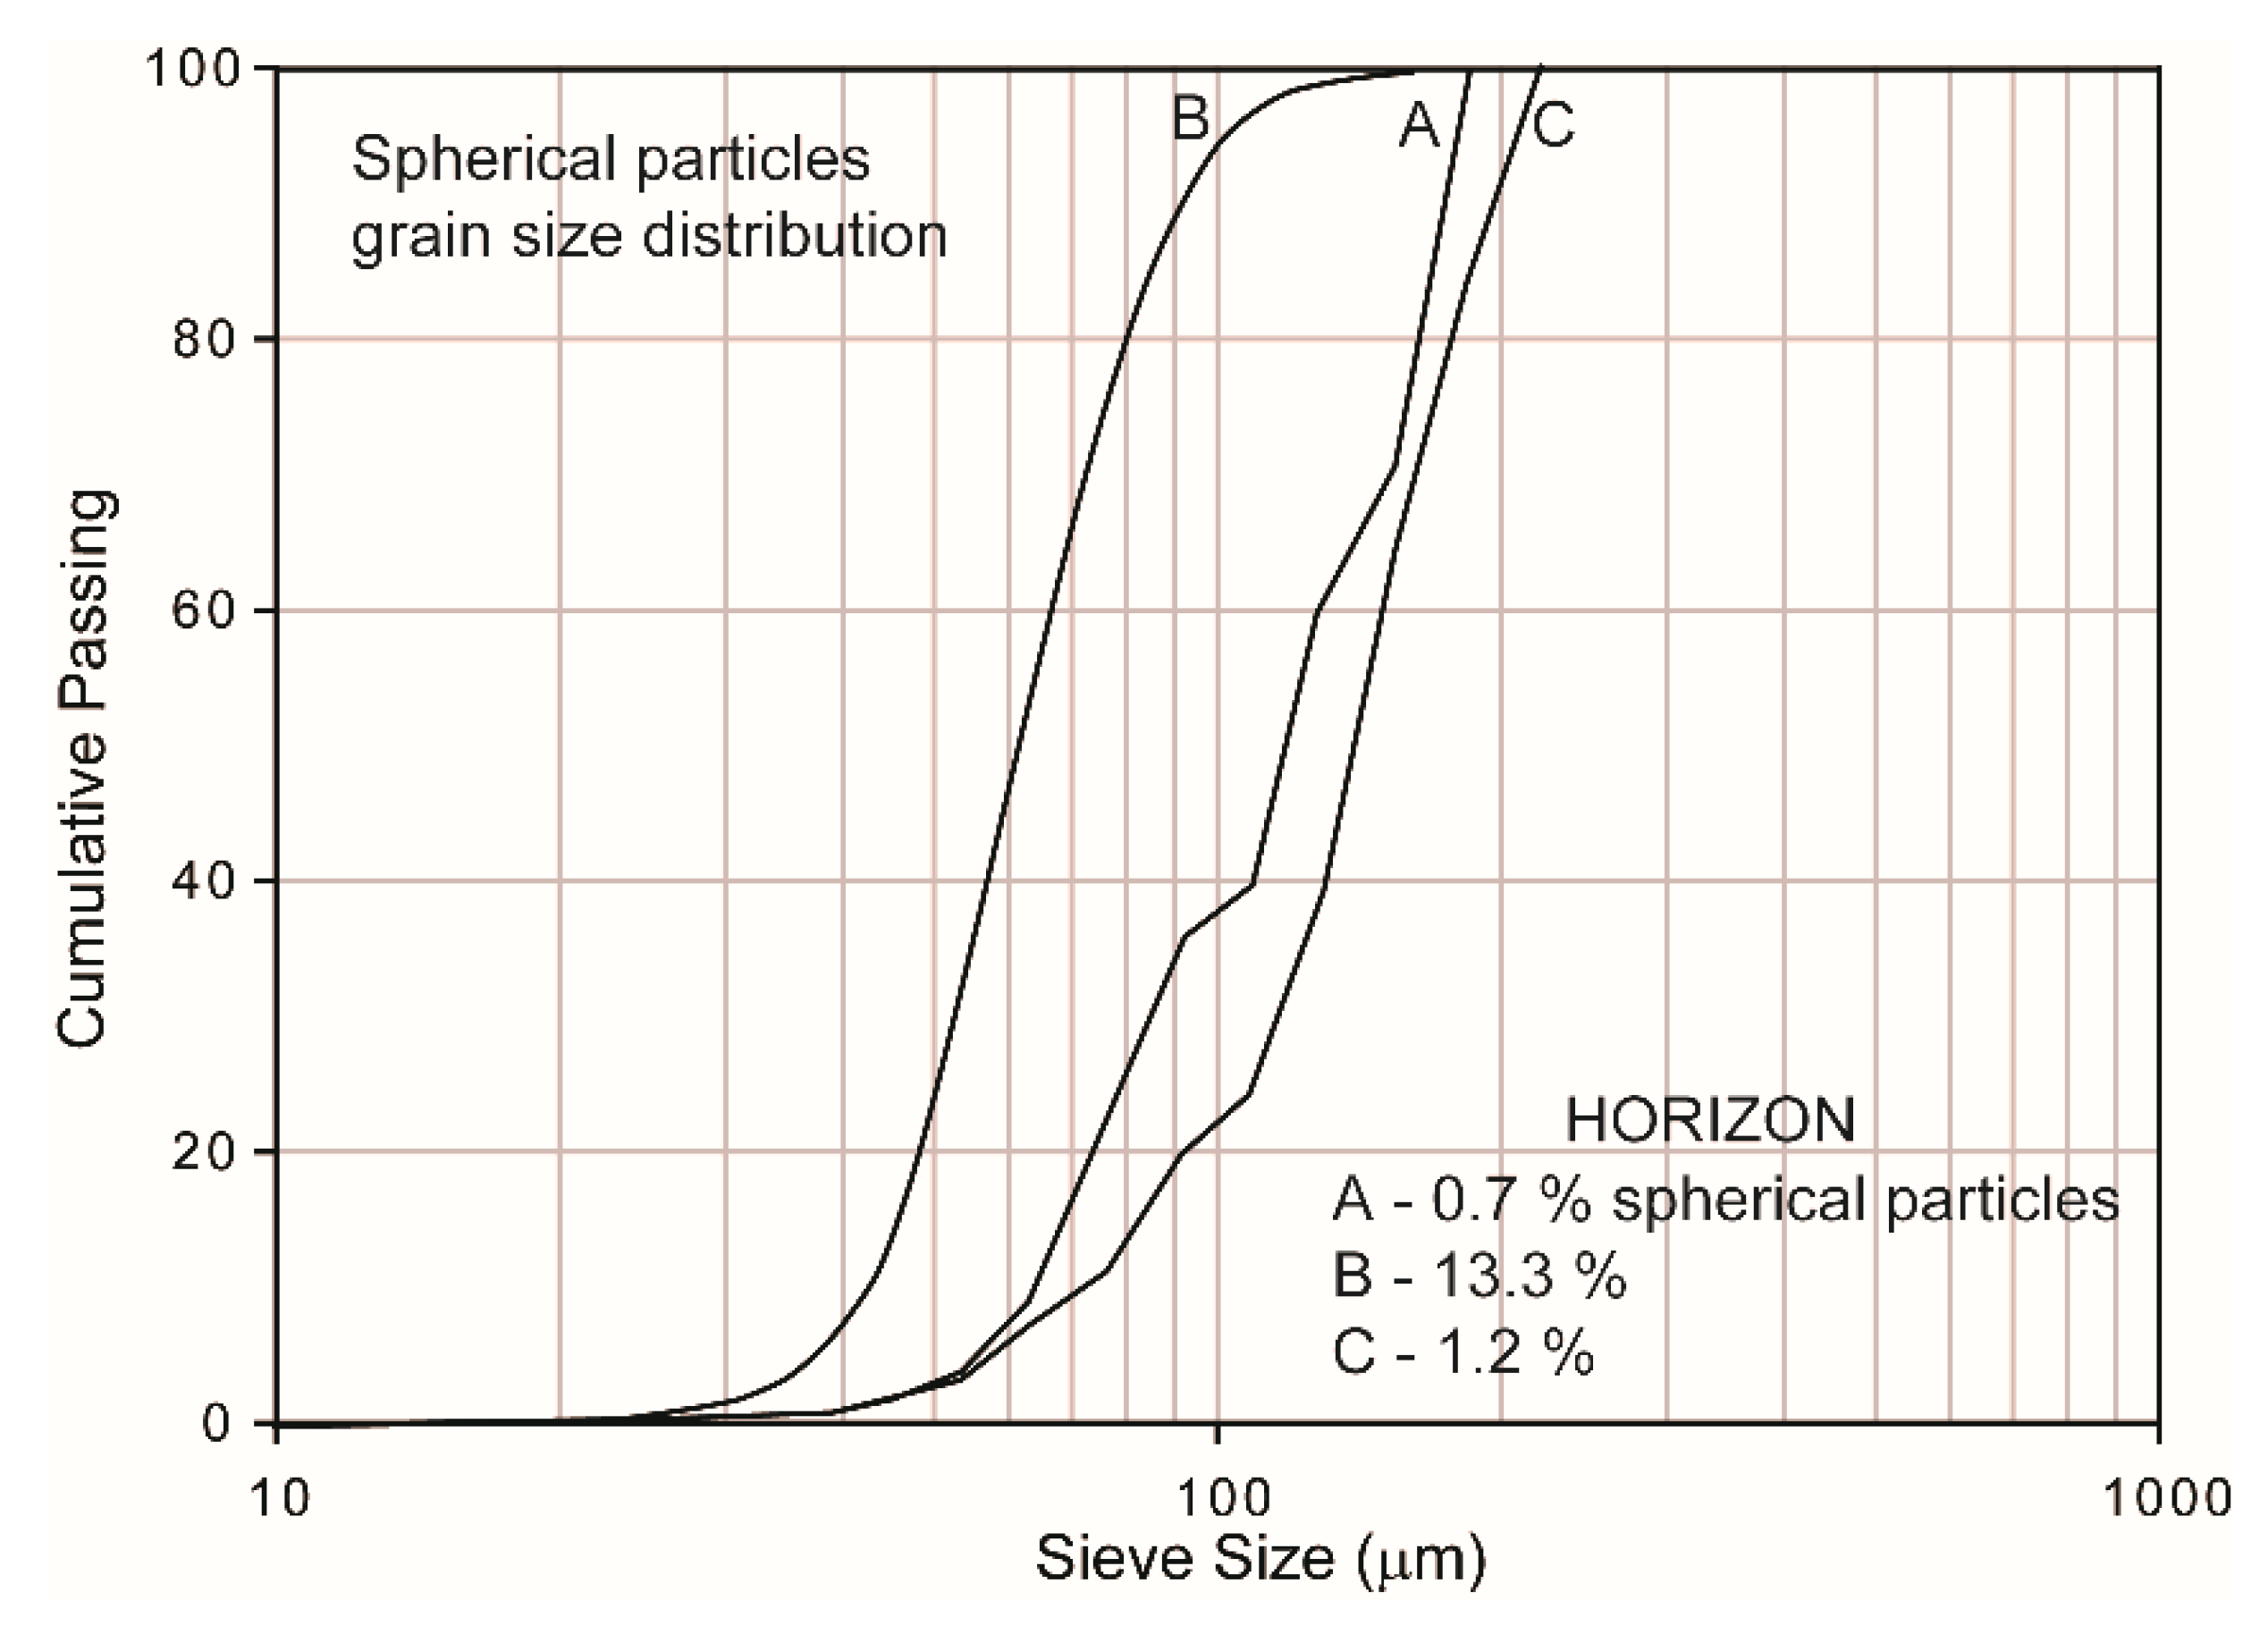
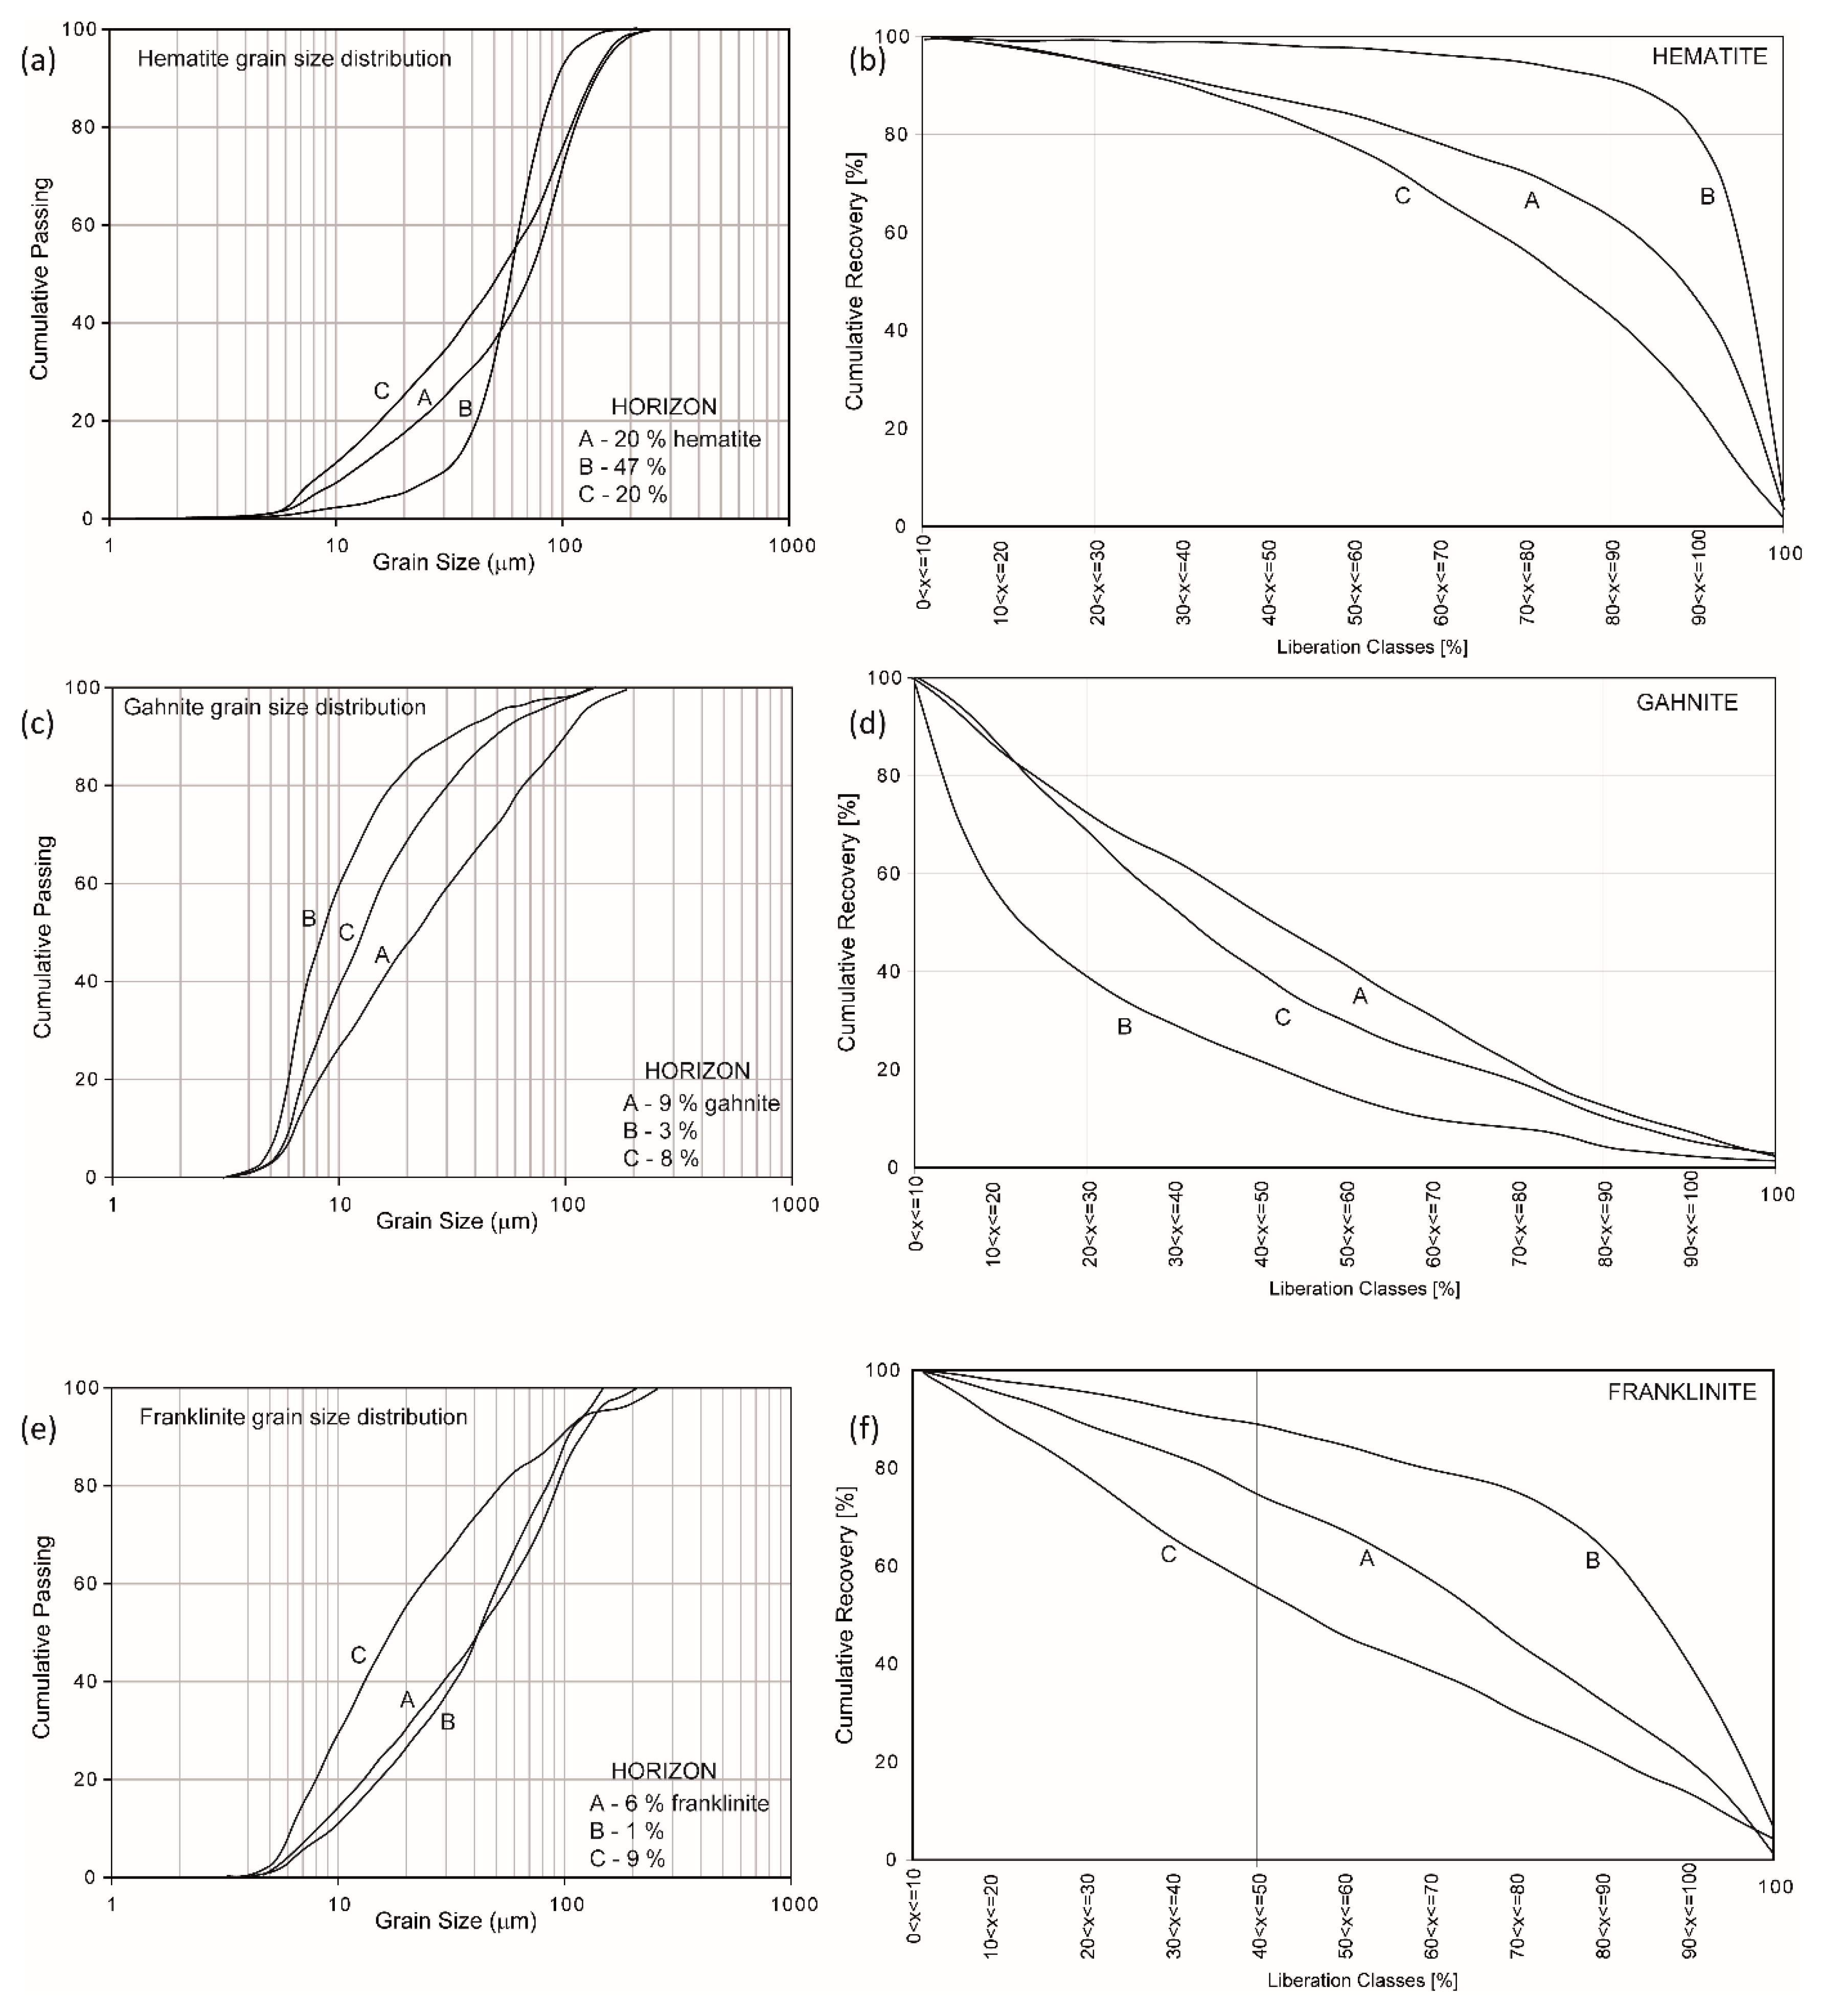
The shape of the particles is another characteristic that may be obtained by MLA and, in particular, the proportion of spherical particles in each horizon can be estimated. The spherical particles are a by-product of metal smelting and coal burning and usually, large amounts are emitted as fly ashes and are the part of the atmospheric fallout [24,25]. The proportion of spherical particles differs between horizon B and horizons A and C. Horizon B contains as much as 13% spherical particles (defined as the particles with “Angularity” <1.0 in dataview), whereas the number of such particles is much lower in the other two horizons (approximately 1%). Additionally, spheres are smaller in horizon B compared to the larger size and similar size distribution between horizons A and C (Figure 5). However, the modal composition of the spherical particles is similar between horizons A and B with hematite occurring in over 80%. In contrast, hematite comprises only 60% of the spherical particles from horizon C, and 16% is gahnite.
3.2.3. Individual Phase Characteristic and Mineral Associations
Mineral associations and grain size distributions of the most common phases occurring in all three horizons were compared in order to find out if they originated from different or similar sources.
Hematite was recognized as secondary phase typical for the Świętochłowice heap [19,20]. Hematite dominates in the heavy mineral fraction in all three horizons, but it has different grain size distribution in horizon B (middle size grains are the most abundant, Figure 6a) compared to that in horizons A and C (more uniform distribution between different grain sizes, Figure 6a). Hematite is predominately liberated in horizon B (Table 1, liberation is the measure if the phase is associated with other minerals, 100% means that the analysed phase is not associated with any other phase). On the other hand, hematite grains associated with three or more minerals (not liberated) dominate in horizons A and C. Minerals associated with hematite are predominately gahnite, glass and franklinite, but the proportions are different between the horizons, in particular, horizon A seems to be the mixture of hematite typical for both B and C horizons (Table 1). Another phase common in all the three horizons is hercynite-gahnite (Table 1). Hercynite-gahnite spinels were described as primary, early formed phases in the Świętochłowice slag (Assemblages 2 and 4 [21]). Here, they form small grains in all three horizons with the smallest ones in horizon B (Figure 6c). However, it also has to be kept in mind that some secondary Zn-rich phases were identified as gahnite (Figure 1a). Gahnite is mostly non-liberated and occurs in variable mineral associations (Figure 6d, Table 1). The next phase common in all three horizons in amounts exceeding 1% volume is franklinite, a typical mineral in Zn-rich slags from the Świętochłowice heap [21]. Grain size distribution is different between horizon C and horizons A and B, where smaller grains dominate in horizon C (Figure 6e). Franklinite is always associated with similar minerals (Table 1, Figure 6f). The final phase, which can be considered as primary phase related to Zn-Pb ore smelting is silicate glass. Glass occurs in similar proportions in all three horizons (4–7%), but it is a rare phase in Zn-Pb slags in Świętochłowice [22], which are mostly crystalline [21]. It is consistent with two different sources of glass: non-liberated slag-derived glass dominating in horizon C and liberated glass dominating in horizons A and B (Table 1). Alternatively, some of the fully liberated grains in horizons A and B could be detrital garnet as identified from BSE images (Online Resource ESM 2).
In non-magnetic phases, only sphalerite and barite occur in all three horizons, however, their modal abundances vary from 1 to 9% (Table 1). Sphalerite and barite have similar grain size distributions and are almost fully liberated in all three horizons. Horizon A seems to be comprised of major phases from both horizons B and C, i.e., willemite and hardystonite, which dominate in horizon C, and zircon and rutile, which dominate in horizon B. Willemite is smaller in horizon C than in horizon A and is less liberated, it coexists with secondary phases, whereas willemite is mostly associated with primary slag phases in horizon A. Hardystonite has similar size and liberation properties between horizons A and C (Table 1). Rutile and zircon grain size and liberation are also similar between horizons A and B (Table 1).
4. Discussion
4.1. Improving Characteristic of Weathered Slag Heap Using Automated SEM Data
Weathered material developed on slag heaps is inherently difficult to classify through standard analytical methods. Indeed, each site has its own specific and non-uniform characteristics (“fingerprint”), depending on the chemical and mineralogical composition of the material, which in turn depends on the dominating anthropogenic activity in the considered area [9,26]. Slag heaps are potential sites of extensive weathering and metal release [1,5,10,19] and they are usually comprised of numerous phases with various grain sizes, compositions, weathering potentials and composed of high abundances of potentially toxic elements [5]. Even in a single heap, phase composition of slags [21,27] and proportions of primary and secondary phases [19,20] may vary strongly. Additionally, the relationship between primary and secondary phases may be disturbed by hydrothermal crystallization from hot fluids remaining in the slag heap shortly after the slag deposition [22,28]. All these processes contribute to the complexity of the weathered zone developing on slag heaps. It is also the case for the heap studied locality. However, Mineral Liberation Analyses of the heavy mineral fraction is a relatively fast and powerful tool to distinguish different components in the weathered zone and it provides information on the origin of anthropogenic material and its long-term behaviour during slag weathering.
The profile presented in this study was previously analysed for the whole sample composition. Four separate grain size fractions from each sample were studied, similar to the XRD approach in this study. The composition of ethylenediaminetetraacetic acid EDTA leachates was also measured [19]. These previous results showed that horizon C had the highest concentrations of metal(oid)s in all fractions, whereas horizons A and B had at least twice lower concentrations of metal(oid)s and much higher Si contents. Also, the concentrations were the highest in the finest fraction of horizon C and the concentrations were not dependent on the size of the analysed fraction in horizons A and B. Pb isotope composition was similar in all of the horizons. Interestingly, proportions of extractable Pb, Zn and Cd were higher in horizons A and B than those in horizon C. Therefore, the analyses implied that horizon C had a different origin than those of horizons A and B [19]. Low metal(oid)s and high silica contents in the latter two suggested that the original material forming the layers were sourced outside the slag heap, for example, during attempts at the slag heap remediation.
In this study, the phase composition of distinct horizons was compared to see if it is consistent with conclusions based on bulk and leachate chemistry. Comparison of XRD patterns suggests that some material may be derived from similar source for all three horizons, but also supports earlier conclusions that horizons A and B contain similar and not slag-related material. The presence of clay minerals in the uppermost horizon is consistent with weathering of feldspars and micas and the progress of pedogenetic processes.
Data from Mineral Liberation Analyses of heavy mineral magnetic and non-magnetic fractions show different and more complex relationships between the horizons compared to XRD and bulk chemistry analyses. As was shown in previous studies [2,29,30,31], analysis of heavy minerals particle by particle provide the direct recognition of metal(oid)s-bearing minerals derived from the slag or atmospheric fallout. In addition, the weathering processes may be observed in primary grains and reactions of primary to secondary minerals can be established. The heavy minerals also are the perfect tool for correlations between different strata, which is widely used in studies on sediments (e.g., Reference [32]).
The MLA study of the heavy mineral fraction in the three horizons shows similarities between horizons A and C in both magnetic and non-magnetic fractions, and similarity between horizons A and B for the non-magnetic fraction. This characteristic is reflected in several features extracted from MLA, notably the phase shape and association, and partly the phase grain size (Table 1, Figure 6). As such, it implies that horizon A contains slag material from horizon C in large enough proportion that it dominated the magnetic heavy mineral fraction and, therefore, the metal(oid)s concentration. In fact, knowing that horizon A is probably a mixture of materials from horizons B and C, the proportion of both materials can be estimated based on simple mass balance calculations. The proportion of slag material in horizon A is approximately 20%, as calculated for several major elements (Fe, Mg, Ca, and S) and metal(oid)s (Zn, Pb, As, and Ag) suggesting that the slag material dominated metal(oid)s concentration for many elements (e.g., approximately 90% of Pb, As and Zn in horizon A could come from the slag heap or/and horizon C, see calculations in Online Resource ESM 1-3). As such, it is important to consider metal(oid)s-bearing phases in horizon A to be largely derived from the slag-dominated horizon C and consequently interpret the metal(oid)s mobility in this horizon in terms of slag weathering. This interpretation is different to that based solely on the chemical composition of the material and leachates, and allows for better understanding of current and future weathering, pedogenesis and metal(oid)s mobility processes within and from the slag heap.
Therefore, our study shows that horizon B is, in fact, the only horizon sourced predominately from outside the slag heap and contains only small, if any, admixtures of the slag material. Its metal(oid)s contents come in large part from different phases and some are probably related to more abundant fly ash content in the horizon. Fly ash may have been sourced from the nearby smelter during its operation, as suggested by the large and uniform size distribution of fly ash particles that could not travel over large distances (Figure 5). This in turn implies that horizon B was placed on top of the slag heap at least several decades ago, whereas horizon A, with a much lower content of fly ashes and their mixed characteristic (Figure 5), was deposited after the smelter closure in 1974 and probably at the beginning of the slag removal (after 2000). Horizon A represents, therefore, a mixture of the outside material with slag, which was mechanically emplaced on the top of the slag heap. As horizon A is now the main site of slag weathering, knowing the exact origin of the material helps in understanding later phase transformations and subsequent metal mobility within and outside of the heap.
4.2. Weathering of Slag Phases at Different Depths in a Slag Heap: Implications for Element Mobility and Weathering Potential
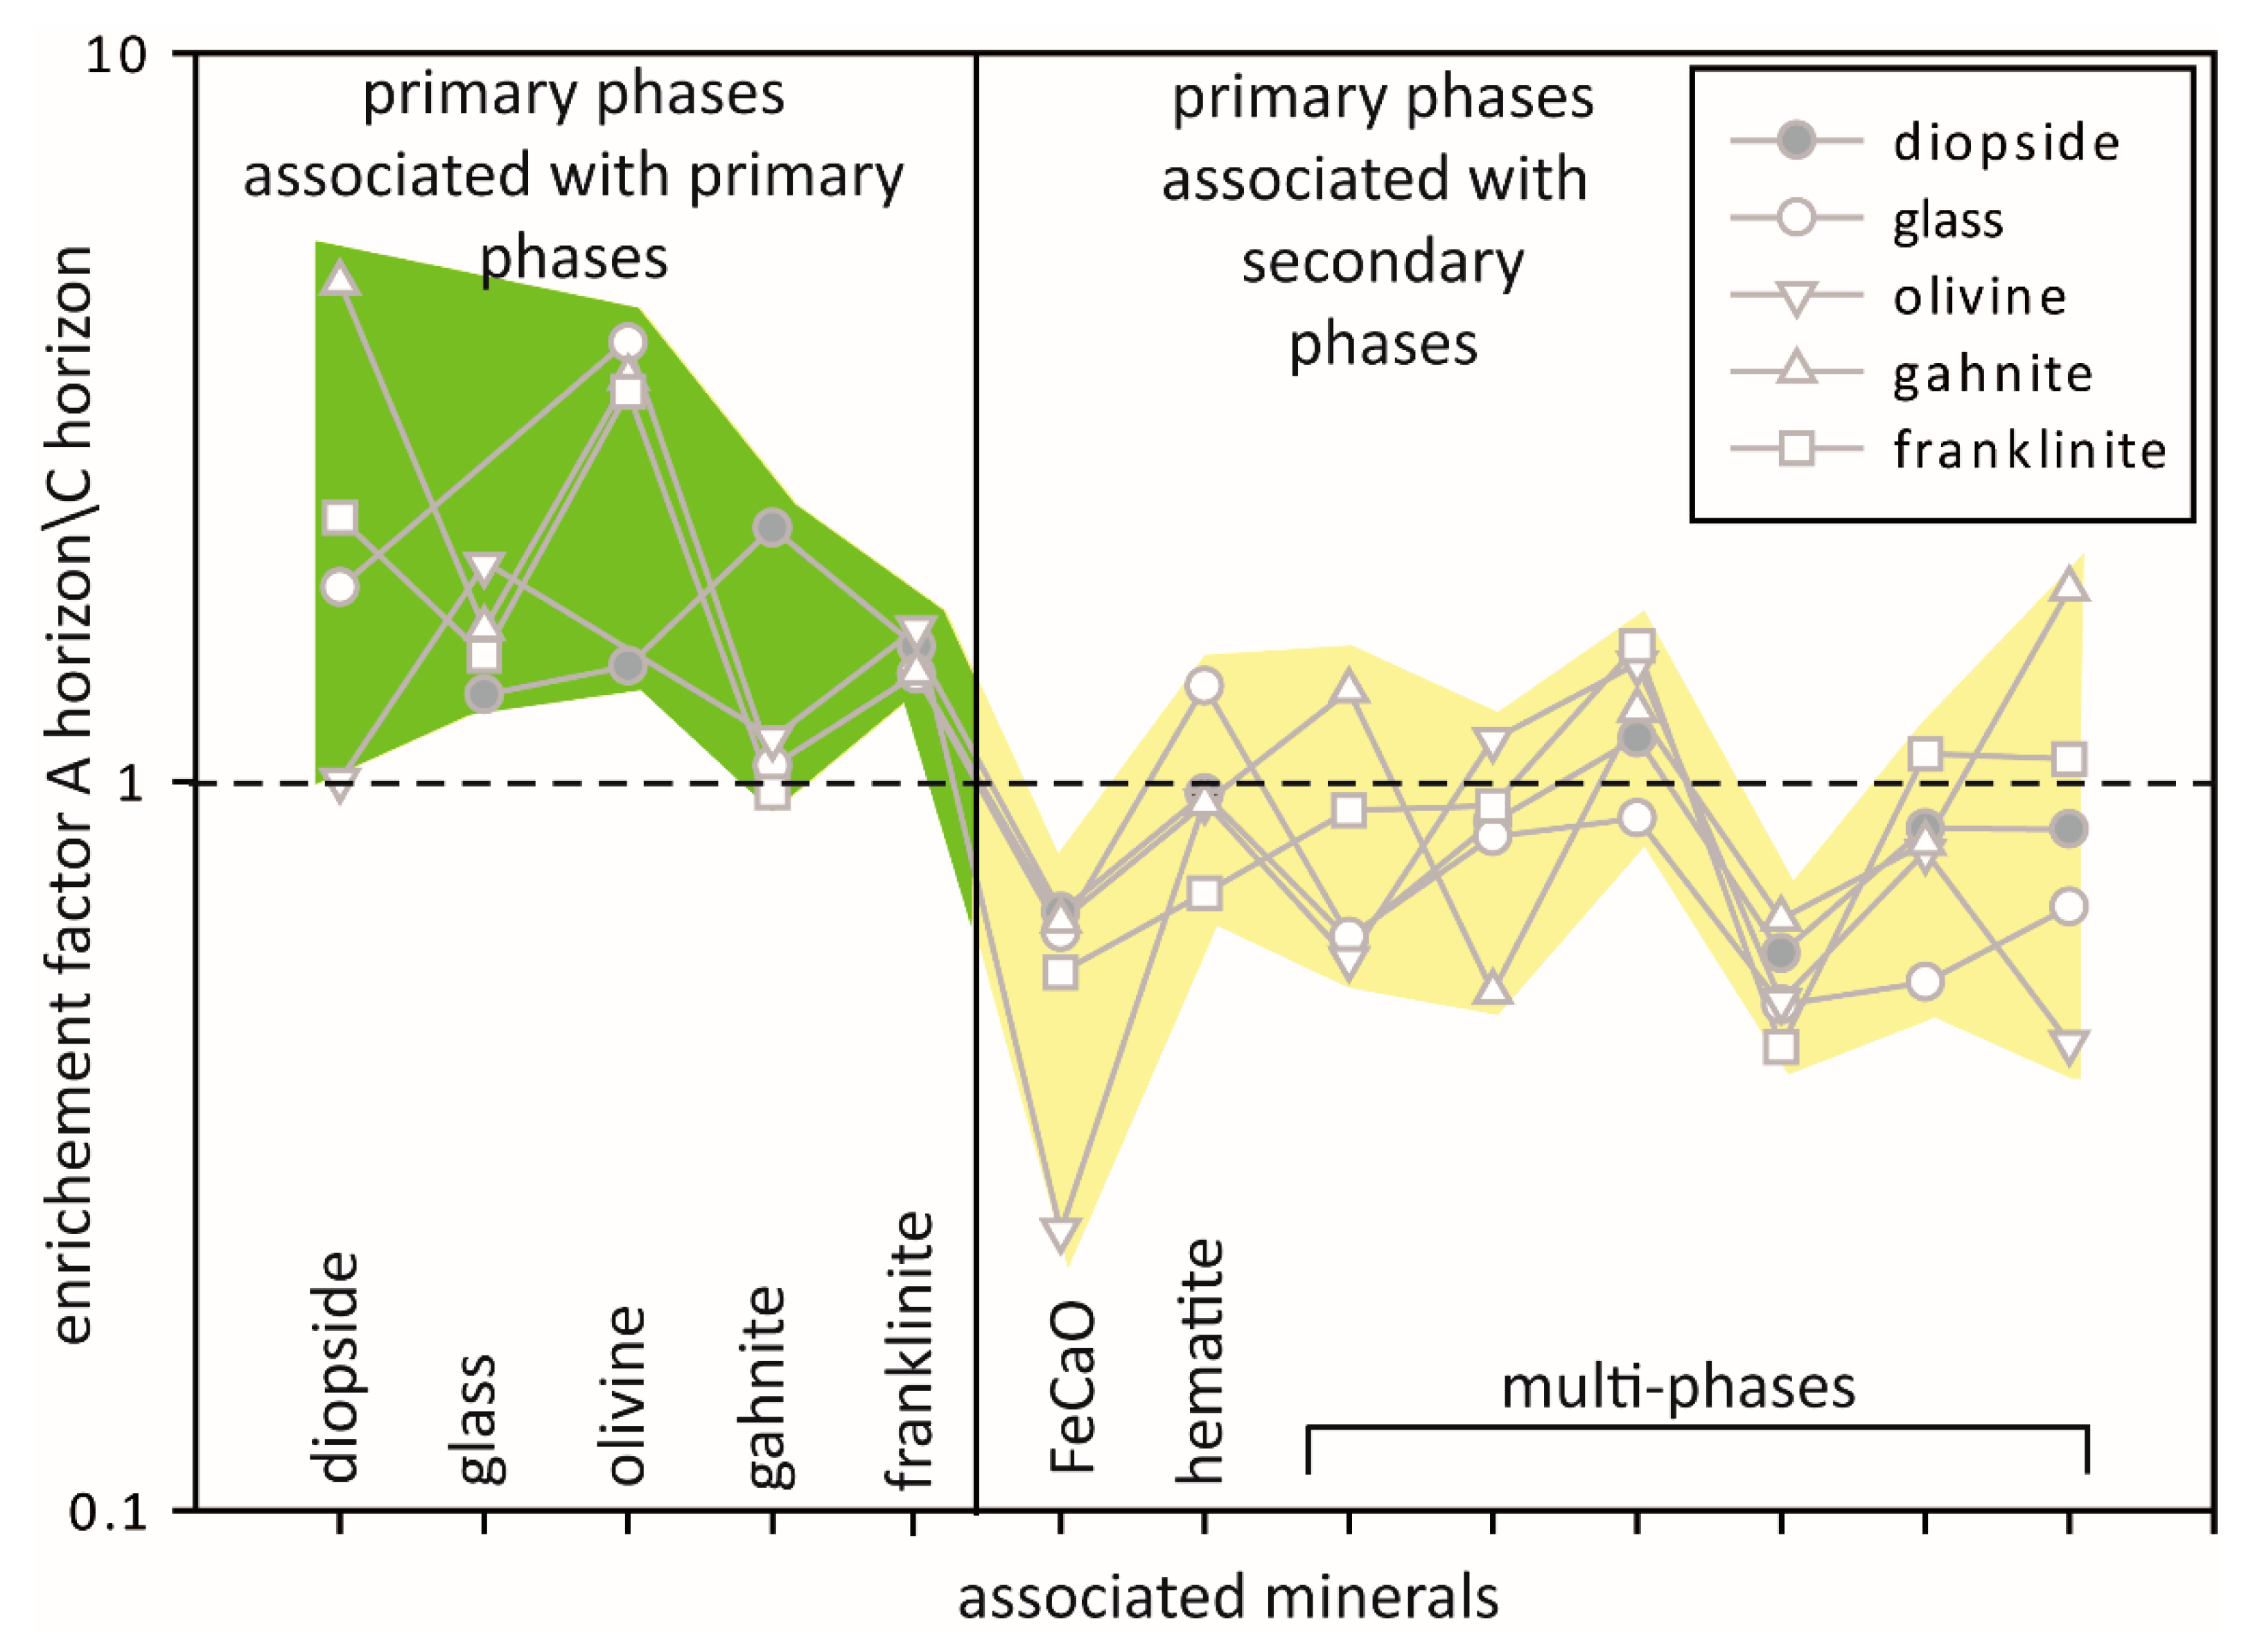
The clear similarities between the abundances of the magnetic heavy fraction in horizons A and C allow for more detailed analyses of the phases transformations in terms of possible weathering processes at the top (A horizon) and inside the slag heap (C horizon). Tyszka et al. [19] suggested that low mobility of reacting fluids in the Świętochłowice heap led to the extensive weathering of the heap interior. Direct comparison of slag phases between horizons A and C shows that, in fact, primary slag phases in horizon C are associated in larger part with secondary phases, whereas the primary phases in horizon A are more often associated with other primary slag phases (Figure 7, calculations are available in Online Resource ESM 1-4). The implication is that primary slag phases are more extensively weathered in the slag heap interior (C horizon) than at the top, probably because of their potentially longer contact with circulating fluids [19]. The conclusion is also consistent with the smaller size and lower abundance of primary slag phases in horizon C. On the other hand, similar secondary phases are more abundant in horizon C than in horizon A (e.g., FeCaO is 6% in horizon C and 3% in horizon A, Online Resource ESM 1-2). Interestingly, the ratio of the primary phase abundance in horizon C to that in horizon A is, from the lowest to the highest, olivine, diopside, glass, franklinite and gahnite. This sequence, representing phases from the least to the most susceptible for weathering, is consistent with the weathering potential of phases observed in both natural and experimental conditions [20,33,34]. In other words, horizon C contains lower abundances of primary phases susceptible to weathering compared to horizon A.
These observations have important implications on metal(oid)s mobility both within and outside from the slag heap. Despite general similarities between horizons A and C, Zn and Pb are distributed in different proportions between different phases. Generally, Pb is enriched in secondary phases in both horizons, but the enrichment is more pronounced in horizon C, which contains 63% and 24% of Pb in secondary phases in magnetic and non-magnetic fractions, respectively, as compared to 52% and 12% in horizon A (Online Resource ESM 1-5). On the other hand, Zn dominates in the primary heavy mineral fraction, but again it has higher abundances in primary phases from horizon A than those from horizon C (Online Resource ESM 1-5). Our conclusion is that horizon A has higher weathering potential that was also reflected in the higher proportion of EDTA-leachable metal(oid)s [19]. On the other hand, horizon C remains in semi-stable state after weathering progressed to a larger extent. Therefore, it is not the different source of the material that controls differences in metal mobility between horizon A and horizon C, but the different extent of weathering of primary metal(oid)s bearing phases.
4.3. Towards General MLA Applications in Technosols
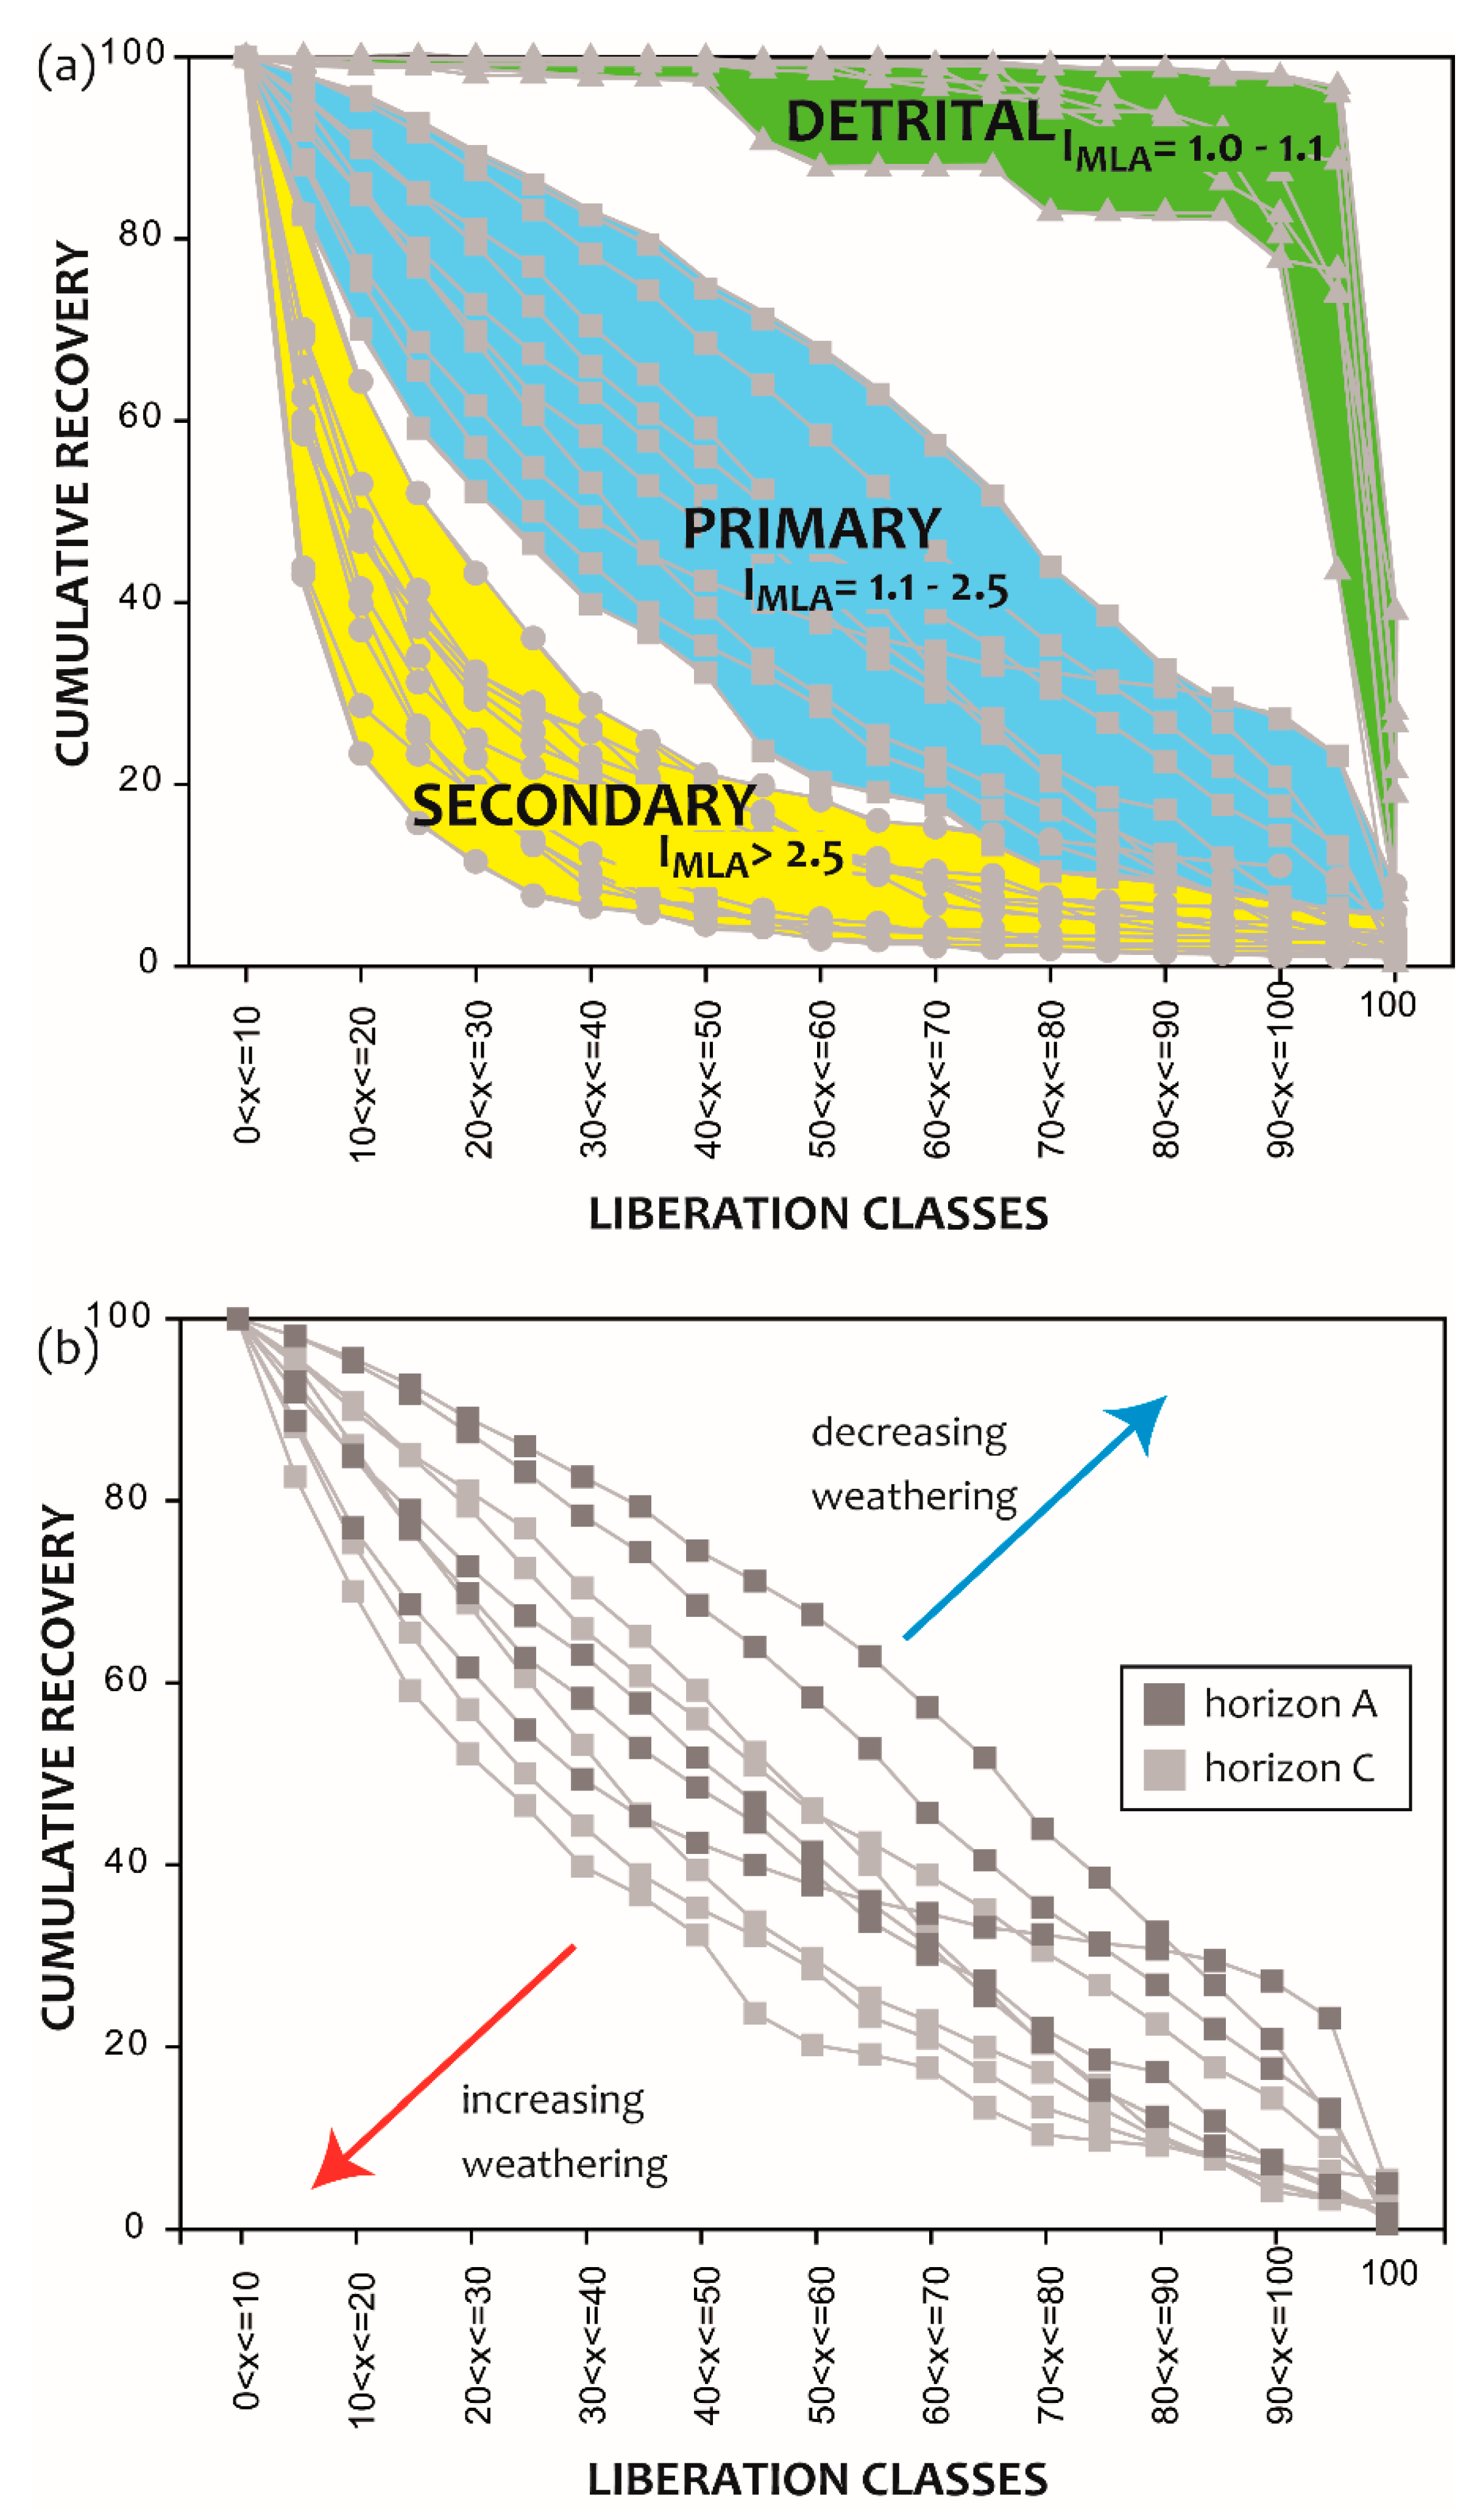
As shown for the case study of Świętochłowice slag heap, MLA is a powerful tool that could provide detailed information on complex anthropogenic materials including metal distribution, weathering processes and metal mobility. It can be used for direct comparisons of different horizons to identify similar/different sources of the material, not only in localities dominated by the anthropogenic input. Automated SEM analyses like MLA can be potentially used to quickly detect and estimate the amount of eolian material in the soil or sediment and its subsequent transformations at different depths. Furthermore, for complex anthropogenic material, MLA can be used to quickly categorize different types of parent material, as done in this study. Based on the present results, the most useful feature to classify phases with different origin is the plot showing cumulative recovery for a range of liberation classes (Figure 8). For quick estimation, the calculation of an index, with the proposed notation IMLA, can be done with the following equation:
where
- X10%—cumulative mass recovery for each mineral at the liberation class from 5 to 10%,
and
- X40%—cumulative mass recovery for each mineral at the liberation class from 35 to 40%.
Based on Świętochłowice data collected in all three horizons, previously pre-defined secondary (slag-derived), primary (slag-derived) and detrital (allochtonous) phases mostly plot in different ranges of IMLA. Detrital phases (Figure 8a) showed the lowest values from 1.0 to 1.1 (usually from 1.0 to 1.01), primary slag phases yielded medium values from 1.1 to 2.5 and secondary phases yielded the highest values from 2.5 to 20. Over 90% of the pre-defined phases agreed with the suggested IMLA values (for calculations see Online Resource ESM 1-6). The notable exception is hematite, showing values typical for primary (horizon A and horizon C) or even detrital (horizon B) phases. Detrital origin of hematite in horizon B is possible. On the other hand, the primary-like values in the remaining horizons might be a general feature of particularly stable and/or abundant secondary phases. Another exception is gahnite and multi-phase SilOxMix (in the first hand generic classification, the name represented a fine grained mixture of weathered silicates and Fe oxides) in the horizon B, with the first having IMLA = 2.8 (therefore the value typical for secondary phases) and the latter having IMLA = 2.0 (typical for primary phases). Careful investigation of the MLA images suggests that at least some of gahnite and SilOxMix were not attributed to the appropriate phases. In fact, the occurrence of gahnite in outer parts of particles favors its secondary origin (Figure 2a). We suggest that the mixture of hematite with Zn-rich phase was mistakenly labelled gahnite by the software. Additionally, the occurrence of SilOxMix in the interior of the spherical particles (Online Resource ESM 2) may suggest that in fact, it’s a primary phase typical for fly ashes. We did not analyse the particles again in order to determine the true origin of the phases as they are a minor component of horizon B sample (3% and 2% for gahnite and SilOxMix respectively). However, the detection of such phases and general agreement between classification based on IMLA and MLA and/or BSE images supports the validity of the IMLA parameter to distinguish origins of different particles in a complex setting.
5. Conclusions
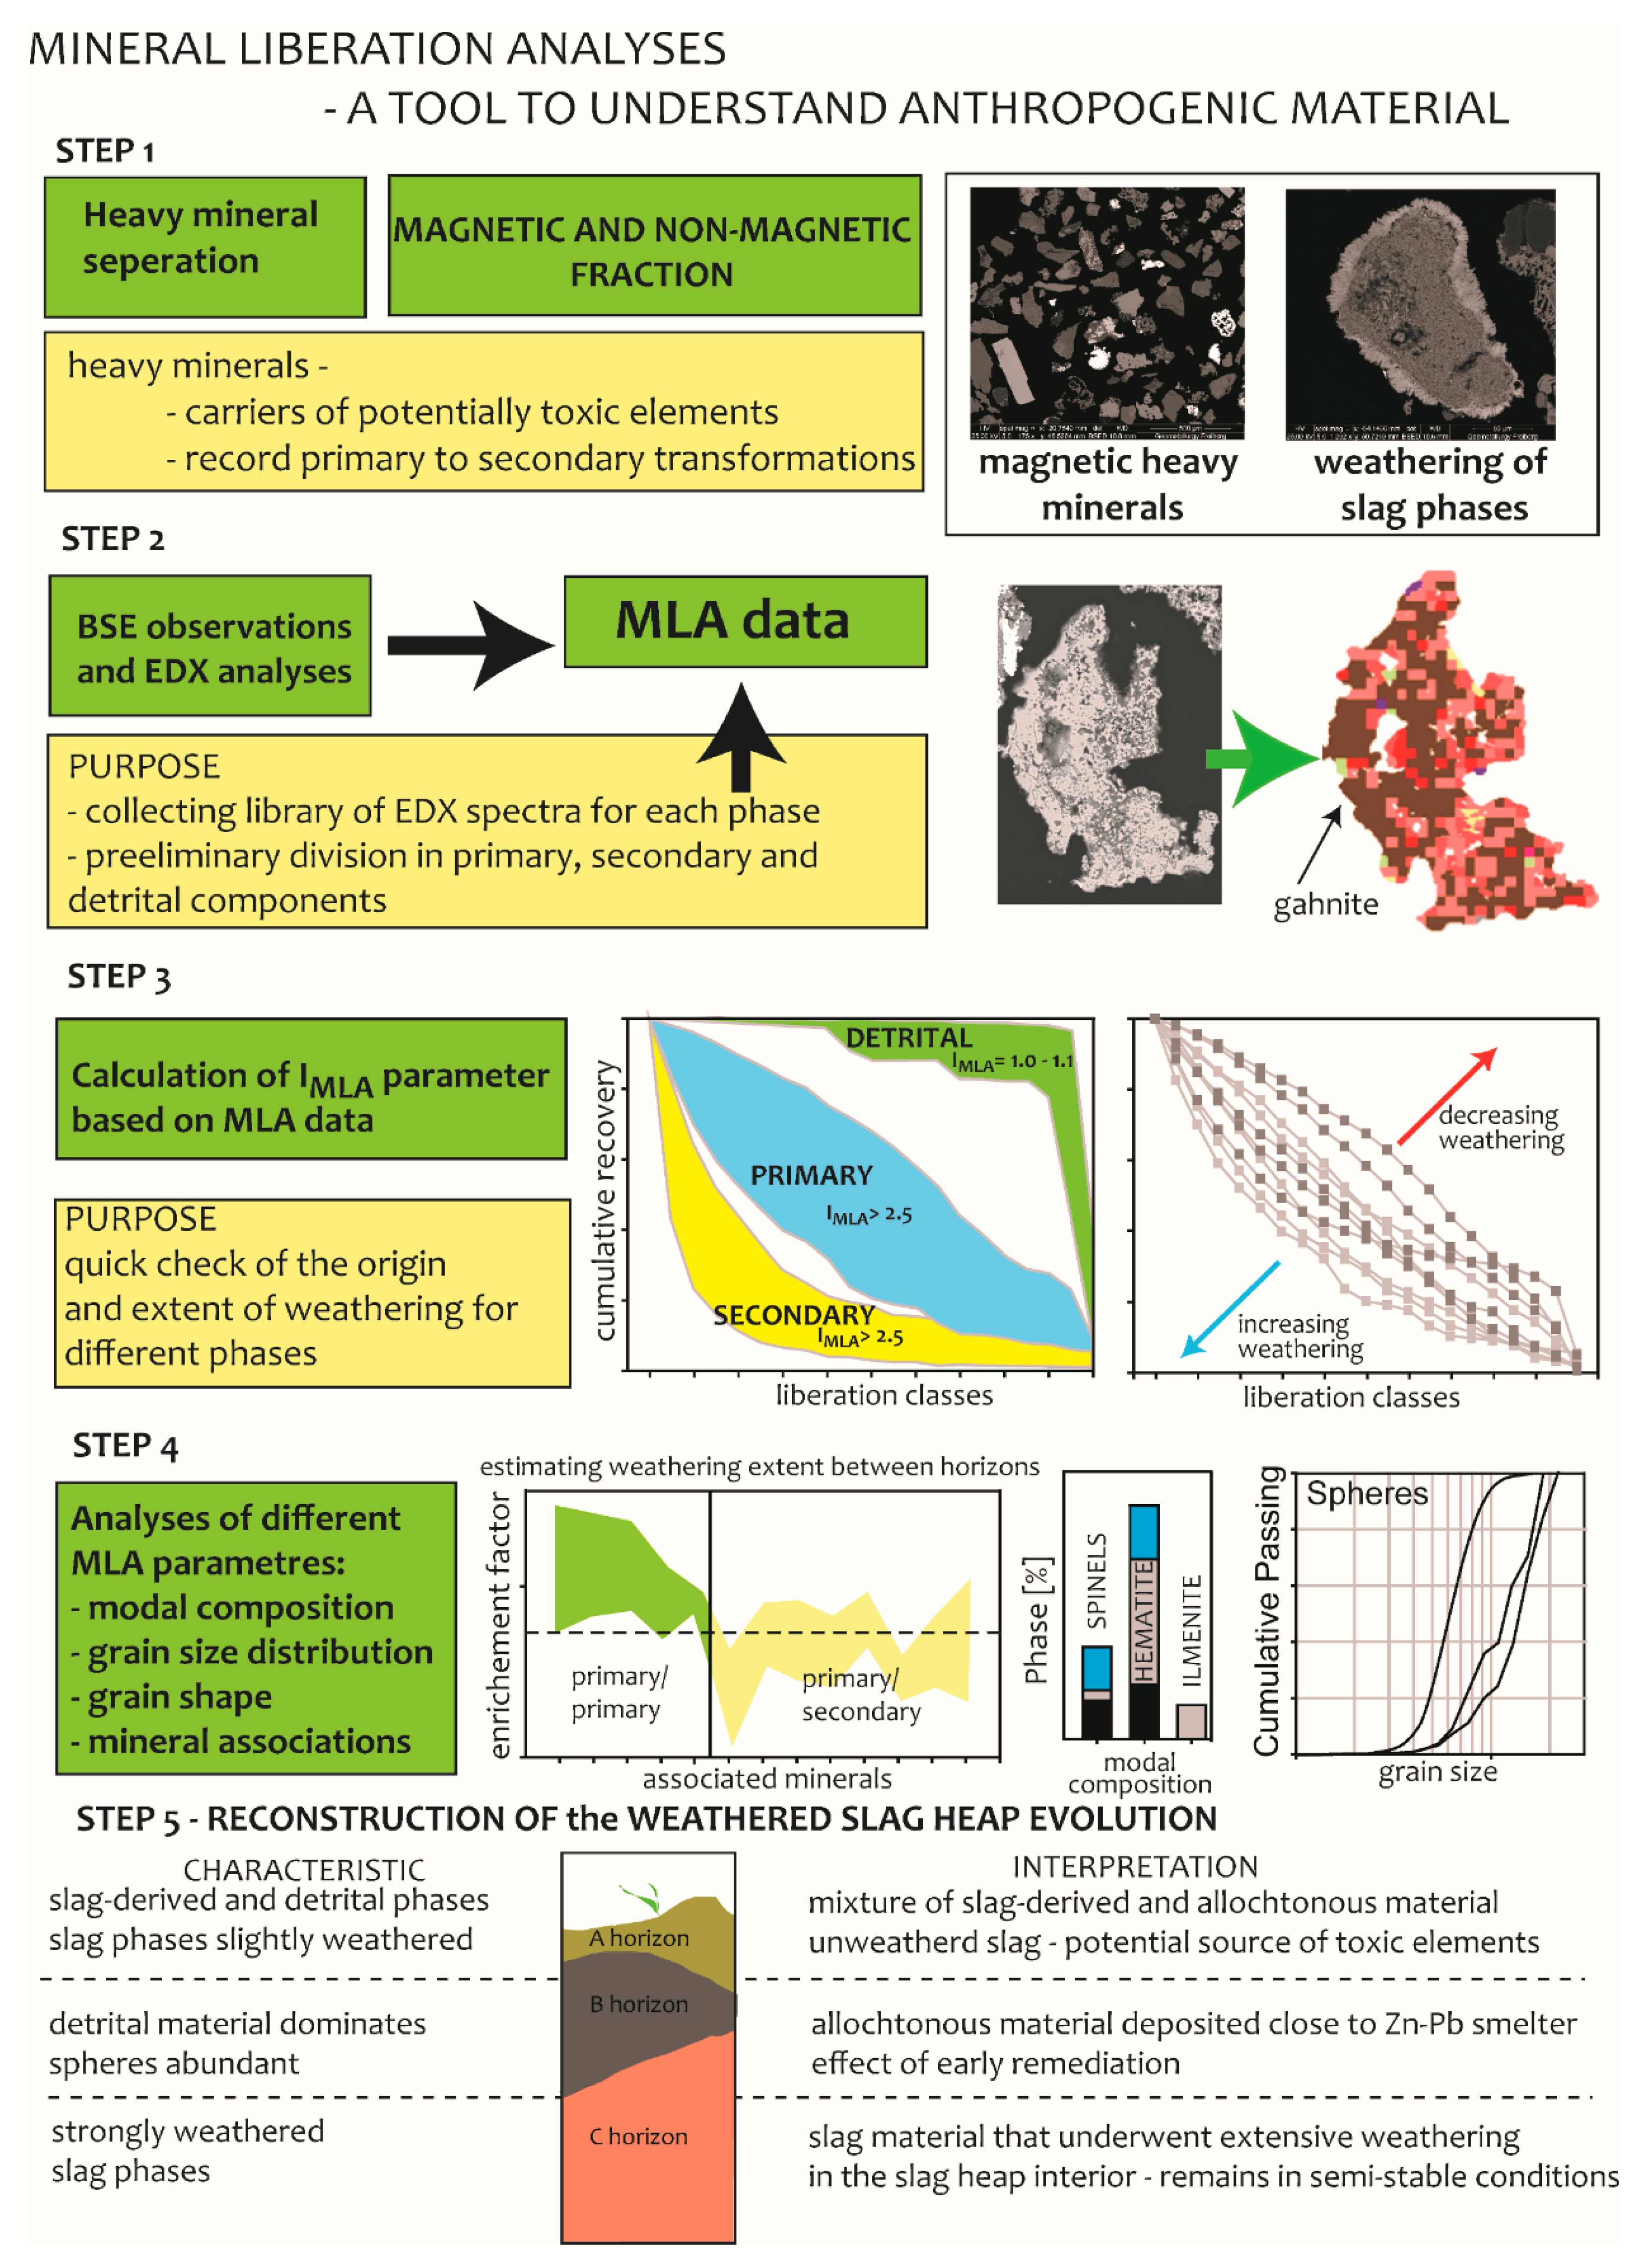
Application of automated SEM-based analyses to understand development in a complex setting of strongly weathered slag heap is a novel approach that successfully provides information on the origin of the slag-derived material and phase transformations in the material. For the studied three horizons in the strongly weathered Świętochłowice heap, MLA provided information complementary to previous analyses of bulk rock and leachate chemistry. Even in a complex setting with tens of phases identified, MLA and particularly the IMLA parameter proposed in this study can be a quick tool to estimate the presence and proportions between minerals of detrital, primary and secondary origin. The predominance of detrital phases is consistent with the outside source of the material such as is the case of horizon B in the studied Świętochłowice heap. On the other hand, the predominance of primary and secondary phases related to the slag heap itself is consistent with in-situ origin, such as is the case for horizon C. Different proportions between primary and secondary phases in the studied horizons can be used to estimate the extent of weathering in the different parts of the heap, as is the case of horizons A and C in this study. Therefore, to obtain complete dataset using MLA, the five-step approach is suggested including: (1) heavy mineral separation, (2) collection of pre-defined EDX spectra based on BSE observations, (3) calculation of the IMLA parameter to obtain general interpretation, (4) detailed analyses of MLA parameters to obtain insight into relationships between different samples and transformation processes of different phases, and (5) final reconstruction of substrate evolution (Figure 9). Several future tests can prove if the proposed IMLA index works also in other slag heap settings. However, we believe that the Świętochłowice site was perfect for such test since it was previously extensively studied in terms of primary and secondary slag composition, which could have been readily related to heavy minerals from the weathered zone.
Supplementary Materials
The following are available online at https://www.mdpi.com/2075-163X/8/11/513/s1, Online Resource: ESM 1: Detailed data for modal proportions, Pb and Zn distribution among phases and mineral associations, as well as mass balance, enrichment factor (c.f. Figure 7) and IMLA calculations; ESM 2: The back-scattered image of slag phases from the A, B and C horizons and complementary EDX spectral map (GXMAP) by the automated SEM Mineral Liberation Analysis (MLA).
Author Contributions
Conceptualization, A.P.; formal analysis, R.T. and B.S.; funding acquisition, R.T.; investigation, A.P., J.K. and R.T.; methodology, B.S.; Resources, R.T.; visualization, A.P. and R.T.; writing—original draft, A.P. and J.K.
Funding
The study was funded by the National Science Center research project number UMO-2014/13/B/ST10/01120 to Rafał Tyszka.
Acknowledgments
The initial MLA study done by Sylwia Stankowska as her master thesis was the inspiration for the present study, her problems with data interpretation allowed us to develop a better approach to both data collection and data analyses. Sabine Gilbricht helped considerably during MLA measurements at the Geometallurgy Laboratory at the Department of Economic Geology and Petrology at Freiberg/Saxony. Marta Prell’s help with XRD data is greatly acknowledged. Reviewers and editor work on the manuscript is acknowledged, in particular, the diligent work of Reviewer 1 was of great benefit for the manuscript.
Conflicts of Interest
The authors declare no conflict of interest.
References
- Souter, L.; Watmough, S.A. Geochemistry and toxicity of a large slag pile and its drainage complex in Sudbury, Ontario. Sci. Total Environ. 2017. [Google Scholar] [CrossRef] [PubMed]
- Tyszka, R.; Pietranik, A.; Kierczak, J.; Ettler, V.; Mihaljević, M.; Medyńska-Juraszek, A. Lead isotopes and heavy minerals analyzed as tools to understand the distribution of lead and other potentially toxic elements in soils contaminated by Cu smelting (Legnica, Poland). Environ. Sci. Pollut. Res. 2016, 23, 24350–24363. [Google Scholar] [CrossRef] [PubMed] [Green Version]
- Dumoulin, D.; Billon, G.; Proix, N.; Frérot, H.; Pauwels, M.; Saumitou-Laprade, P. Impact of a zinc processing factory on surrounding surficial soil contamination. J. Geochem. Explor. 2017. [Google Scholar] [CrossRef]
- Ettler, V.; Johan, Z.; Kříbek, B.; Veselovský, F.; Mihaljevič, M.; Vaněk, A.; Penížek, V.; Majer, V.; Sracek, O.; Mapani, B.; et al. Composition and fate of mine- and smelter-derived particles in soils of humid subtropical and hot semi-arid areas. Sci. Total Environ. 2016. [Google Scholar] [CrossRef] [PubMed]
- Ettler, V. Soil contamination near non-ferrous metal smelters: A review. Appl. Geochem. 2015, 64, 56–74. [Google Scholar] [CrossRef]
- Gunn, J.M.; Kielstra, B.W.; Szkokan-Emilson, E. Catchment liming creates recolonization opportunity for sensitive invertebrates in a smelter impacted landscape. J. Limnol. 2016. [Google Scholar] [CrossRef]
- Ogundiran, M.B.; Nugteren, H.W.; Witkamp, G.J. Immobilisation of lead smelting slag within spent aluminate-fly ash based geopolymers. J. Hazard. Mater. 2013. [Google Scholar] [CrossRef] [PubMed]
- Néel, C.; Bril, H.; Courtin-Nomade, A.; Dutreuil, J.P. Factors affecting natural development of soil on 35-year-old sulphide-rich mine tailings. Geoderma 2003, 111, 1–20. [Google Scholar] [CrossRef]
- Uzarowicz, L.; Skiba, S. Technogenic soils developed on mine spoils containing iron sulphides: Mineral transformations as an indicator of pedogenesis. Geoderma 2011, 163, 95–108. [Google Scholar] [CrossRef]
- Piatak, N.M.; Parsons, M.B.; Seal, R.R. Characteristics and environmental aspects of slag: A review. Appl. Geochemistry 2015, 57, 236–266. [Google Scholar] [CrossRef]
- Potysz, A.; van Hullebusch, E.D.; Kierczak, J.; Grybos, M.; Lens, P.N.L.; Guibaud, G. Copper Metallurgical Slags—Current Knowledge and Fate: A Review. Crit. Rev. Environ. Sci. Technol. 2015, 45, 2424–2488. [Google Scholar] [CrossRef]
- Fandrich, R.; Gu, Y.; Burrows, D.; Moeller, K. Modern SEM-based mineral liberation analysis. Int. J. Miner. Process. 2007, 84, 310–320. [Google Scholar] [CrossRef]
- Tungpalan, K.; Wightman, E.; Manlapig, E. Relating mineralogical and textural characteristics to flotation behaviour. Miner. Eng. 2015, 82, 136–140. [Google Scholar] [CrossRef]
- Hamid, S.; Alfonso, P.; Anticoi, H.; Guasch, E.; Oliva, J.; Dosbaba, M.; Garcia-Valles, M.; Chugunova, M. Quantitative Mineralogical Comparison between HPGR and Ball Mill Products of a Sn-Ta Ore. Minerals 2018. [Google Scholar] [CrossRef]
- Little, L.; Mainza, A.N.; Becker, M.; Wiese, J. Fine grinding: How mill type affects particle shape characteristics and mineral liberation. Miner. Eng. 2017. [Google Scholar] [CrossRef]
- Leißner, T.; Hoang, D.H.; Rudolph, M.; Heinig, T.; Bachmann, K.; Gutzmer, J.; Schubert, H.; Peuker, U.A. A mineral liberation study of grain boundary fracture based on measurements of the surface exposure after milling. Int. J. Miner. Process. 2016, 156, 3–13. [Google Scholar] [CrossRef]
- Morrison, A.L.; Swierczek, Z.; Gulson, B.L. Visualisation and quantification of heavy metal accessibility in smelter slags: The influence of morphology on availability. Environ. Pollut. 2016, 210, 271–281. [Google Scholar] [CrossRef] [PubMed]
- Meyer, M.C.; Austin, P.; Tropper, P. Quantitative evaluation of mineral grains using automated SEM-EDS analysis and its application potential in optically stimulated luminescence dating. Radiat. Meas. 2013. [Google Scholar] [CrossRef]
- Tyszka, R.; Kierczak, J.; Pietranik, A.; Ettler, V.; Mihaljevič, M. Extensive weathering of zinc smelting slag in a heap in Upper Silesia (Poland): Potential environmental risks posed by mechanical disturbance of slag deposits. Appl. Geochem. 2014, 40, 70–81. [Google Scholar] [CrossRef]
- Bril, H.; Zainoun, K.; Puziewicz, J.; Courtin-Nomade, A.; Vanaecker, M.; Bollinger, J.C. Secondary phases from the alteration of a pile of zinc-smelting slag as indicators of environmental conditions: An example from Świȩtochłowice, Upper Silesia, Poland. Can. Mineral. 2008, 46, 1235–1248. [Google Scholar] [CrossRef]
- Puziewicz, J.; Zainoun, K.; Bril, H. Primary phases in pyrometallurgical slags from a zinc-smelting waste dump, Świȩtochłowice, Upper Silesia, Poland. Can. Mineral. 2007, 45, 1189–1200. [Google Scholar] [CrossRef]
- Tyszka, R.; Pietranik, A.; Kierczak, J.; Zieliński, G.; Darling, J. Cadmium distribution in Pb-Zn slags from Upper Silesia, Poland: Implications for cadmium mobility from slag phases to the environment. J. Geochem. Explor. 2018, 186. [Google Scholar] [CrossRef]
- Kierczak, J.; Potysz, A.; Pietranik, A.; Tyszka, R.; Modelska, M.; Néel, C.; Ettler, V.; Mihaljevič, M. Environmental impact of the historical Cu smelting in the Rudawy Janowickie Mountains (south-western Poland). J. Geochem. Explor. 2013, 124, 183–194. [Google Scholar] [CrossRef]
- Zhang, C.; Qiao, Q.; Appel, E.; Huang, B. Discriminating sources of anthropogenic heavy metals in urban street dusts using magnetic and chemical methods. J. Geochem. Explor. 2012. [Google Scholar] [CrossRef]
- Muszer, A. Charakterystyka Sferul i Minerałów Akscesorycznych z Wybranych Utworów Fanerozoicznych i Antropogenicznych; Puziewicz, J., Solecki, A., Eds.; Fundacja Ostoja: Westerplatte, Poland, 2007; ISBN 978-83-924759-2-7. (In Polish) [Google Scholar]
- Hulisz, P.; Charzynski, P.; Greinert, A. Urban soil resources of medium-sized cities in Poland: A comparative case study of Toruń and Zielona Góra. J. Soils Sediments 2018, 18, 358–372. [Google Scholar] [CrossRef]
- Warchulski, R.; Gawęda, A.; Kądziołka-Gaweł, M.; Szopa, K. Composition and element mobilization in pyrometallurgical slags from the Orzeł Biały smelting plant in the Bytom–Piekary Śląskie area, Poland. Mineral. Mag. 2015, 79, 459–483. [Google Scholar] [CrossRef]
- Warchulski, R.; Gawęda, A.; Janeczek, J.; Kądziołka-Gaweł, M. Mineralogy and origin of coarse-grained segregations in the pyrometallurgical Zn-Pb slags from Katowice-Wełnowiec (Poland). Mineral. Petrol. 2016, 110, 681–692. [Google Scholar] [CrossRef] [Green Version]
- Boughriet, A.; Proix, N.; Billon, G.; Recourt, P.; Ouddane, B. Environmental impacts of heavy metal discharges from a smelter in Deûle-canal sediments (northern France): Concentration levels and chemical fractionation. Water Air Soil Pollut. 2007, 180, 83–95. [Google Scholar] [CrossRef]
- Ettler, V.; Konečný, L.; Kovářová, L.; Mihaljevič, M.; Šebek, O.; Kříbek, B.; Majer, V.; Veselovský, F.; Penížek, V.; Vaněk, A.; Nyambe, I. Surprisingly contrasting metal distribution and fractionation patterns in copper smelter-affected tropical soils in forested and grassland areas (Mufulira, Zambian Copperbelt). Sci. Total Environ. 2014, 473–474, 117–124. [Google Scholar] [CrossRef] [PubMed]
- Fernández-Caliani, J.C.; Barba-Brioso, C.; González, I.; Galán, E. Heavy metal pollution in soils around the abandoned mine sites of the iberian pyrite belt (Southwest Spain). Water. Air Soil Pollut. 2009, 200, 211–226. [Google Scholar] [CrossRef]
- Foucault, A.; Stanley, D.J. Late Quaternary palaeoclimatic oscillations in East Africa recorded by heavy minerals in the Nile delta. Nature 1989, 339, 44–46. [Google Scholar] [CrossRef]
- Ettler, V.; Mihaljevic, M.; Touray, J.C.; Piantone, P. Leaching of polished sections: An integrated approach for studying the liberation of heavy metals from lead-zinc metallurgical slags. Bull. Soc. Geol. Fr. 2002, 173, 161–169. [Google Scholar] [CrossRef]
- Potysz, A.; Grybos, M.; Kierczak, J.; Guibaud, G.; Fondaneche, P.; Lens, P.N.L.; van Hullebusch, E.D. Metal mobilization from metallurgical wastes by soil organic acids. Chemosphere 2017, 178, 197–211. [Google Scholar] [CrossRef] [PubMed]
Figure 1.
The sampling site showing three different horizons in the uppermost weathered zone of the slag heap labelled as A, B and C.
Figure 1.
The sampling site showing three different horizons in the uppermost weathered zone of the slag heap labelled as A, B and C.

Figure 2.
(a–c) Back-scattered electron (BSE) image of a slag phases from horizon C and complementary EDX spectral maps (GXMAP) supplied by the automated Mineral Liberation Analysis (MLA). P: Primary phase, S: Secondary phase (according to the classification based on BSE observations and EDS analyses).

Figure 3.
X-ray diffraction analyses for (a) fraction <50 µm, (b) fraction from 50 µm to 200 µm. Analyses for horizon C were previously presented in Tyszka et al. [19] and are shown here for comparison with data for horizons A and B.
Figure 3.
X-ray diffraction analyses for (a) fraction <50 µm, (b) fraction from 50 µm to 200 µm. Analyses for horizon C were previously presented in Tyszka et al. [19] and are shown here for comparison with data for horizons A and B.

Figure 4.
Simplified modal compositions of the heavy mineral fraction in terms of magnetic (a) and non-magnetic phases (b) from all three horizons. Gahnite and hercynite are shown as a single spinel group. All the secondary multi-phases were also grouped as a single group (multi-phases). The proportion of minerals shown is in % area of analysed particles.

Figure 5.
Grain size distribution of spherical particles in each horizon with corresponding modal proportion (% Area).
Figure 5.
Grain size distribution of spherical particles in each horizon with corresponding modal proportion (% Area).

Figure 6.
Grain size distribution and proportion of associated minerals for a range of liberation classes for (a,b) hematite, (c,d) gahnite and (e,f) franklinite. Liberation classes show how much of the particle area is composed of associated phases, i.e., 100% means that the phase is fully liberated and not associated with any other phase.

Figure 7.
Comparison of minerals associated with major primary phases between horizons A and C. The enrichment factor (EF) shows the predominance of the association in horizon A (values of EF > 1) or in horizon C (values EF < 1). For example, the first column shows values for diopside associated with different primary minerals and EF > 1 are observed for spinels and glass consistent with the predominance of these associations in horizon A. On the other hand, secondary FeCaO phase is predominately associated with primary minerals in horizon C consistent with EF < 1 for all the primary phases.

Figure 8.
Proposed classification of heavy mineral phases into detrital, primary and secondary based on IMLA parameter and the shape of the plot in liberation classes versus % cumulative recovery (a), the curvature of the plot for primary phases may also record the extent of their weathering (b).
Figure 8.
Proposed classification of heavy mineral phases into detrital, primary and secondary based on IMLA parameter and the shape of the plot in liberation classes versus % cumulative recovery (a), the curvature of the plot for primary phases may also record the extent of their weathering (b).

Figure 9.
A schematic approach to the analysis of heavy mineral assemblages in a complex Technosol site, Steps 1 to 3 provide a quick check of possible sources of phases in soil and/or soil substrate, steps 1–5 provide a detailed scenario of soil substrate evolution and predictions.
Figure 9.
A schematic approach to the analysis of heavy mineral assemblages in a complex Technosol site, Steps 1 to 3 provide a quick check of possible sources of phases in soil and/or soil substrate, steps 1–5 provide a detailed scenario of soil substrate evolution and predictions.


Table 1.
Mineral Liberation Data for major phases from magnetic and non-magnetic fractions, “% Area” is proportion of the phase in the bulk samples of either magnetic or non-magnetic fraction, “% Liberation” is the characteristic for each phase showing how much of the phase is fully liberated (i.e., not associated with other minerals), “Associated with” is the characteristic of each phase, which is not fully liberated and occurs with other phases in a single particle.
| Horizon | % Area | % Liberation | Associated with | |
|---|---|---|---|---|
| Magnetic fraction | ||||
| Hematite | A | 20 | 33 | P-Gahnite (23%), P-Glass (13%), Franklinite (8%) |
| B | 47 | 63 | P-Gahnite (17%), P-Glass (10%) | |
| C | 20 | 11 | P-Gahnite (40%), P-Franklinite (>10%) | |
| Gahnite | A | 8 | 5 | S-Hematite (35%), P-Diopside (14%) |
| B | 3 | 1 | S-Hematite (71%), P-Glass (13%) | |
| C | 9 | 3 | S-Hematite (49%), P-Franklinite (>10%) | |
| Franklinite | A | 9 | 12 | S-Hematite (20%), P-Diopside (12%), P-Gahnite (11%) |
| B | 1 | 26 | S-Hematite (30%), P-Gahnite (11%) | |
| C | 6 | 9 | S-Hematite (33%), P-Gahnite (15%), S-multiphase (8%) | |
| Glass | A | 6 | 23 | S-Hematite (22%), P-Diopside (13%), P-Gahnite (10%) |
| B | 7 | 43 | S-Hematite (22%), P-Gahnite (9%) | |
| C | 4 | 3 | S-Hematite (20%), P-Gahnite (14%), P-Diopside (10%) | |
| Non-magnetic fraction | ||||
| Sphalerite | A | 2 | 90 | - |
| B | 2 | 92 | - | |
| C | 5 | 92 | - | |
| Barite | A | 2 | 99 | - |
| B | 9 | 96 | - | |
| C | 1 | 89 | - | |
| Willemite | A | 14 | 59 | P-Zincite (10%), P-Franklinite (9%) |
| B | 0 | - | - | |
| C | 26 | 35 | P-Zincite (12%), S-multiphase (>20%) | |
| Hardystonite | A | 3 | 53 | P-Diopside (15%), Franklinite (9%) |
| B | 0 | - | - | |
| C | 21 | 46 | P-Franklinite (26%), S-multiphase (>10%) | |
| Zircon | A | 15 | 98 | - |
| B | 21 | 97 | - | |
| C | 0 | - | - | |
| Rutile | A | 15 | 74 | Quartz (13%) |
| B | 24 | 74 | Quartz (13%) | |
| C | 0 | - | - | |
© 2018 by the authors. Licensee MDPI, Basel, Switzerland. This article is an open access article distributed under the terms and conditions of the Creative Commons Attribution (CC BY) license (http://creativecommons.org/licenses/by/4.0/).
Share and Cite
MDPI and ACS Style
Pietranik, A.; Kierczak, J.; Tyszka, R.; Schulz, B. Understanding Heterogeneity of a Slag-Derived Weathered Material: The Role of Automated SEM-EDS Analyses. Minerals 2018, 8, 513. https://doi.org/10.3390/min8110513
AMA Style
Pietranik A, Kierczak J, Tyszka R, Schulz B. Understanding Heterogeneity of a Slag-Derived Weathered Material: The Role of Automated SEM-EDS Analyses. Minerals. 2018; 8(11):513. https://doi.org/10.3390/min8110513
Chicago/Turabian StylePietranik, Anna, Jakub Kierczak, Rafał Tyszka, and Bernhard Schulz. 2018. "Understanding Heterogeneity of a Slag-Derived Weathered Material: The Role of Automated SEM-EDS Analyses" Minerals 8, no. 11: 513. https://doi.org/10.3390/min8110513
Note that from the first issue of 2016, this journal uses article numbers instead of page numbers. See further details here.