The Petrography, Mineralogy and Geochemistry of Some Cu- and Pb-Enriched Coals from Jungar Coalfield, Northwestern China


1
College of Minging Engineering, Taiyuan University of Technology, Taiyuan 030024, China
2
College of Geoscience and Surveying Engineering, China University of Mining and Technology, Beijing 100083, China
3
Key Laboratory of Coal and Coal Gas Geology of Shanxi Province, Taiyuan 030024, China
*
Author to whom correspondence should be addressed.
Minerals 2018, 8(1), 5; https://doi.org/10.3390/min8010005
Submission received: 24 September 2017
/
Revised: 18 December 2017
/
Accepted: 21 December 2017
/
Published: 27 December 2017
(This article belongs to the Special Issue Mineral Resources and the Environment)
Abstract
:The petrological, geochemical, and mineralogical composition of the Carboniferous-Permian coal deposit in the Jungar coalfield of inner Mongolia, Northwestern China, were investigated using optical microscopy and field emission scanning electron microscopy in conjunction with an energy-dispersive X-ray spectrometer (SEM-EDX), as well as X-ray powder diffraction, X-ray fluorescence, and inductively coupled plasma mass spectrometry. The Jungar coal is of high volatile C/B bituminous quality with 0.58% vitrinite reflectance and has a low sulfur content of 0.70% on average. Inertinite (mineral-free basis) generally dominates in coal from the lower part of the Shanxi formation, and vitrinite is the major maceral assemblage in the coal from the Taiyuan formation, which exhibits forms suggesting variation in the sedimentary environment. The Jungar coal is characterized by higher concentrations of copper (Cu) in No. 6 coal, at 55 μg/g, and lead (Pb) in No. 4 coal at 42 μg/g. Relative to the upper continental crust, the rare earth elements (REE) in the coal are characterized by light and medium–heavy REE enrichment. The minerals in the Jungar coal are mainly kaolinite, dickite, pyrite, calcite, siderite, quartz, and, to a lesser extent, gypsum and K-feldspar. The enrichment and occurrence of the trace elements, and of the minerals in the coal, are attributed to the fragmental parent rock during diagenesis and coalification. The main elements with high enrichment factors, Cu and Pb, overall exhibit a notably inorganic sulfide affinity and a weak organic affinity. Primary and epigenetic sedimentary environment and the lithology of the terrigenous parent rock are the key factors that influence the occurrence and formation of Cu and Pb in coal. The depositional environment is more influential in the formation of Cu than Pb in coal. Lead is more easily affected by the terrigenous factors than Cu when they are under a similar depositional environment.
1. Introduction
Coal is not only a major source of nitrous oxide (NOX) and sulfuric oxide (SOX) pollutants, but is also a geological repository for many inorganic elements. Coal geochemists have focused on the distribution, occurrence, and enrichment mechanisms of some harmful trace elements and beneficial metal elements in coal, such as As, Pb, Se, and Cr, rare metals, and rare-scattered elements Ge and U, and REE elements and yttrium [1,2,3,4,5,6,7,8,9,10,11,12,13,14,15,16,17,18]. The migration characteristics in the process of washing, combustion, and pyrolysis for harmful elements have also been discussed [5,12,13,14]. Even some beneficial metal elements, including Al, Ga, Ge, and Li have being developed and applied [10]. As harmful elements in coal, Cu and Pb have not received as much attention as As regarding their occurrence and formation mechanism in coal [12,13,14,15,16,17,18,19]. According to the classification of toxic trace elements in coal determined by Swaine [17], Cu belongs to the group of IIB harmful elements, Pb is one of the most harmful trace elements, and has received much attention by the environmental protection administration [18]. The content of Cu and Pb has been thought to be relatively low in coal; however, some published literature has shown that the Cu and Pb content in coal is too high in parts of China [20,21,22,23], which in turn may be a potential threat to human health and plant growth.
Copper and Pb in coal have also attracted attention for the following reasons: (1) Gram quantities of various copper salts have been used in suicide attempts and produced acute copper toxicity in humans [24,25] and corresponding amounts of copper salts (30 μg/g) are toxic in animals [26]. Elevated copper levels have also been linked to worsening the symptoms of Alzheimer’s disease [27,28]. Lead is a radioelement, and combustion residues derived from higher-Pb coals may have adverse effects on the environment and human health [12]. Research is required to understand the enrichment mechanism and to help guide the aspects of high-efficiency washing, removal of harmful trace elements, and so on. (2) Due to the correlation between minerals and sulfur in coal, the abundance and occurrence of Cu and Pb in coal may provide an indicator of the original peat-accumulation environments and of subsequent diagenetic and epigenetic processes [9,29,30,31,32]. The concentration of Cu in coal generally varies from 0.5 to 50 μg/g and Pb from 2 to 80 μg/g [17]. The worldwide average for brown and hard coals are, for Cu, 15 and 16 μg/g, and 6.6 and 9.0 μg/g for Pb, respectively [30]. The average Cu and Pb concentrations for common Chinese and US coals are 17.5 and 16 μg/g, 15.1, and 11 μg/g, respectively [33].
Previous studies have shown that the occurrences of Cu and Pb in coal are diverse and complex. Copper occurs in sulfides [20,23,32], aluminosilicate minerals [22], carbonate minerals [32], and organics [20,23,32], and Pb occurs in aluminosilicate minerals, sulfides and selenides [9,34], and organics [2,34,35]. Ren et al. [35] studied the lignite in the Shenbei coalfield by sequential chemical extraction, finding that the proportion of Cu from different sources varied, found in a descending concentration order of organics, fulvic acid, carbonate, silicate, humic acid, then sulfide.
Scholars have different views on the origins of Cu and Pb enrichment. Copper may come from the terrigenous detrital matter [36] or igneous rock weathering products [23] during the stage of diagenesis, or from the ion exchange of the organic matter during coalification [36]; or it may originate from the alteration of low-temperature hydrothermal fluid of the post-diagenetic period [37]. Copper may also originate from the residue and enrichment from the original coal-forming plants due to the influence of seawater [20,36]. Similar to Cu, there are varying ideas about the origins of Pb enrichment in coal. Lead may occur with sulfide during the diagenesis stage [19,37], or may have been enriched in carbonate minerals, such as ferro-dolomite [23]. The alteration of the low-temperature hydrothermal fluid of the post-diagenetic period [37] or the residue and enrichment from the original coal-forming plants, due to the influence of seawater environment [20,36] may have influenced the occurrence of Pb. Essentially, the abnormal enrichment of trace elements in coal is often the result of the interaction of one or more geological processes during the distinct stages of coal formation [22]. The overall conclusion is that the syngenetic sedimentary environment, magmatic heat source, and terrigenous parent rock [9] are the main factors that influence the enrichment of Cu and Pb in coal, as well as organic complexes in low metamorphic coals.
In this study, the Huangyuchuan coal from the south part of the Jungar coalfield in inner Mongolia are characterized by higher concentrations of Cu and Pb of up to 69 μg/g and 67 μg/g, respectively. Based on the analysis of the coal seam section samples of Huangyuchuan coal, we aimed to evaluate the origin and modes by which these higher concentrations occur in the coal seams. In this study, fresh underground coal was sampled and a geochemical and mineralogical study was conducted on the two main coal beds. The results may have implications for better understanding the high levels of Cu and Pb in coal, and may help evaluate coal washing technology.
2. Geological Setting of the Jungar Coalfield
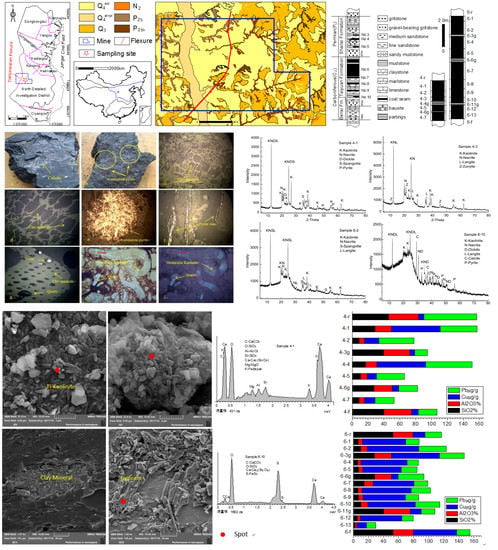
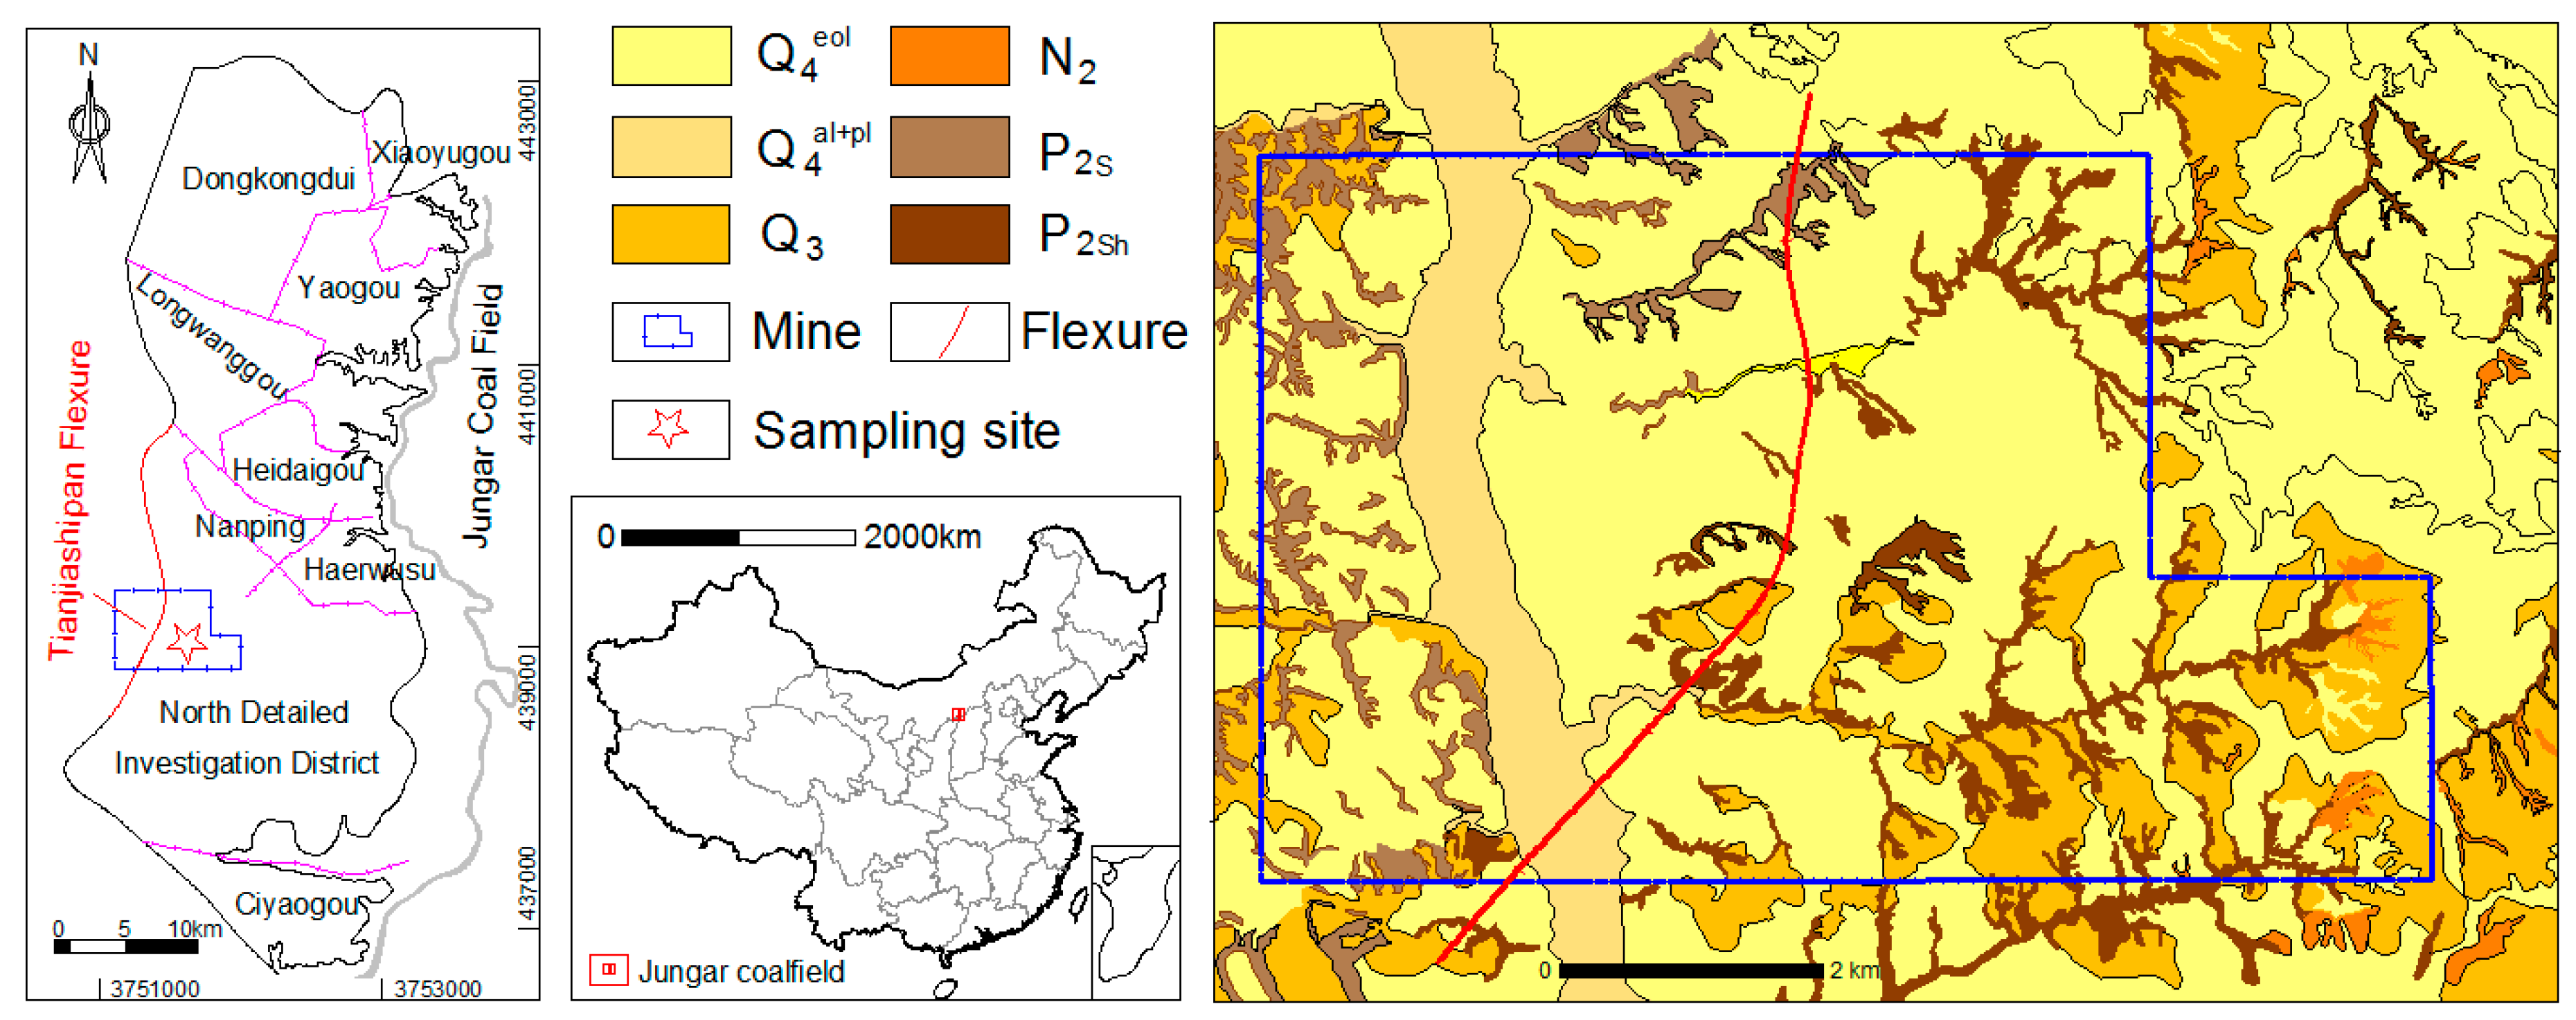
The geological aspects of the Jungar Coalfield have been described in detail by Dai et al. [38,39], Wang et al. [40], Lin et al. [41], and Sun et al. [42]. It is located on the northeast border of the Ordos plateau syncline, and belongs to a part of the huge North China coal formation basin. It is part of the energy base of western China and is located in the junction of Inner Mongolia, Shaanxi, and Shanxi province (Figure 1).
The Ordos Basin is a Late Paleozoic-Mesozoic continental basin; the Jungar coalfield sediment provenance region is located in the northern flank of the coal basin from the Yinshan archicontinent, which mainly consists of Lower Paleozoic Cambrian, Ordovician, or Proterozoic carbonatite and Proterozoic quartzite. These units formed the basement of the Jungar coalfield, which is covered by Mesozoic conglomerate, sandstone, and mudstone, and by Cenozoic clastic sediments (Figure 1). The stratigraphic sequence from bottom to top is the Middle Ordovician Majiagou Formation, Carboniferous Benxi (C2b) and Taiyuan Fm. (C2t), Lower Permian Shanxi Fm. (P1s), Xiashihezi Fm. (P1x), Mid-Permian Shangshihezi Fm. (P2s), Upper Permian Shiqianfeng Fm. (P3s), Upper Pliocene (N2), Upper Pleistocene (Q3) and the modern sedimentary of the Holocene era (Q4). The stratum lithology is mainly conglomerate, medium- to coarse-grained sandstone, siltstone, mudstone, and sub bituminous or bituminous coal. The overall tectonic plate of the coalfield has a monocline structure strike nearly north to south, with a western dip direction and a 15° dip angle, and no obvious large fracture [39].
The sample site was in the south of the Jungar coalfield with a simple structure in the mining field (Figure 1), with no fracture development, and Tianjiashipan deflection extension from southwest to northeast with 37–49° in the mining field. The formation strike is north by northeast with a gentle dip of 3–5° inclination angle. The coal-bearing strata in the Huangyuchuan mine are the Late Carboniferous Taiyuan Formation and the Shanxi Formation. The thicknesses of the Taiyuan Fm. and Shanxi Fm. range from 44.6 to 80.6 m and from 81.9 to 147.5 m, respectively [38,39]. The coal seam in the Taiyuan Formation (C2t) is 21.5 m, with three minable coal seams, including upper No. 6, No. 6, and No. 9. The coal seam in Shanxi Fm. (P1s) is 5.3-m thick, and the minable seams are No. 4 and No. 5 coal.
The minable No. 4 coal seam of the Huangyuchuan mine is in the middle of Shanxi formation with an average thickness of 5.0 m and the No. 6 coal seam in the upper part of Taiyuan formation has an average thickness of 12.9 m. The coal-bearing strata includes gravel-bearing gritstone, gritstone, fine-medium sandstone, mudstone, claystone, and coal (Figure 2).
3. Samples and Analytical Procedures
A total of 24 samples of the No. 4 and 6 coals were taken from the underground workface according to the ISO 18283-2006 standard, including 15 coal bench samples, two roof samples, two floor samples, and five partings. The coal seam column section is shown in Figure 2. All of the samples were immediately stored in black plastic bags to minimize contamination and oxidation. From top to bottom, the roof strata (with suffix r), coal benches, partings (with suffix g), and floor samples (with suffix f) were identified by coal seam number, with the coal seams numbered in increasing order from top to bottom.
Proximate analysis was conducted following ASTM Standard D3173-11, D3175-11, and D3174-11 (2011). Total sulfur was determined following ASTM Standard D3177-02 (2002). Macerals were identified using white-light reflectance microscopy under oil immersion and more than 500 counts were measured for each polished pellet, observed with an Olympus BX51 microscope equipped with a Y-3 spectrophotometer. The maceral classification and terminology applied in the current study are based on ISO 7404-5:2009 [43] and the ICCP System 1994 [44,45].
A field emission-scanning electron microscope (SEM) (TESCAN MIRA3 XMU), in conjunction with an EDAX energy-dispersive X-ray spectrometer (Oxford 51_XMX1010), was used to study the morphology of the minerals, and to determine the distribution of the common elements. The working distance of the SEM-EDS was 15 mm, and beam voltage was 20.0 kV. The images were captured with a retractable solid-state backscattered electron detector.
Samples were crushed and ground to less 200 mesh (75 μm) for major and trace element analyses. The mineralogy of the powdered samples was determined by X-ray powder diffraction (XRD), supplemented by SEM and optical microscope observation. XRD analysis was performed on German Bruker D8 Advance, Cu-Kα target, Ni filtering, 40 kV tube voltage, tube current 50 mA, and the 2θ interval for scanning diffraction range was 5–80° with a step size of 0.01°. X-ray diffractograms of the coal samples were subjected to quantitative mineralogical analysis using Jade 6.5 software.
X-ray fluorescence (XRF) spectrometry was used to determine the major oxides, including silicon oxide (SiO2), aluminum oxide (Al2O3), calcium oxide (CaO), potassium oxide (K2O), sodium oxide (Na2O), iron oxide (Fe2O3), magnesium oxide (MgO), manganese oxide (MnO), titanium oxide (TiO2), and phosphoric oxide (P2O5), in the coal ash (815 °C) and in the powdered non-coal samples. According to DZ/T0223-2001, the inductively coupled plasma mass spectrometry (X series II ICP-MS), in pulse counting mode with three points per peak, was used to determine trace elements in the coal samples with a test temperature of 20 °C and relative humidity of 30%. The sample dissolution process was as follows: Firstly, a coal sample m = (0.1000 ± 0.0001) g was taken in a Poly Tetra Fluoro Ethylene sealing melting pot, 1 mL HNO3 (1:1) and 3 mL of HF were added and sealed closed in a microwave oven after 1000 W preheating 1.0 min. After being cooled, the sample was transferred to the automatic control electric hot plate for digestion for 48 hr at 160 °C. The ICP-MS analysis and microwave digestion procedures are more fully outlined by Dai et al. [46].
The sample proximate, XRD, and SEM analyses were completed at the Shanxi Coal Chemistry Institute of Chinese Sciences Academy. The element content test was completed in the Nuclear Industry Geological Analysis and Testing Center in Beijing. The results of the major elements, trace elements, and proximate analysis of coal samples are shown in Table 1 and Table 2.
4. Results
4.1. Coal Petrology and Vitrinite Reflectance
The No. 4 coal from the Shanxi Formation was matt luster. It is generally dull and banded dull lithotypes dominated by low clarain and vitrain-band coal with a small amount of fusain. The endogeny fracture developed well in the vitrain band and the exogenesis fracture was also well-developed. The upper and lower parts of the No. 6 coal was matt luster and the middle part was sub-vitreous luster. It is generally banded and banded bright lithotype dominated by vitrain-band coal, clarain coal and low durain with a small portion of fusain. The exogenesis fracture was well developed.
Microscope petrographic analyses of the coal samples are presented in Table 1 (mineral-free basis). The inertinite is dominant in the No. 4 coal and vitrinite is more than 50% of the No. 6 coal. In general, the vitrinite in the No. 4 coal samples is low, which is as low as 25% on a mineral-free basis, in sample 4-1, and no more than 50% in all the samples. Vitrinite reflectance was not measured for all coal samples. The values, where measurements are available, were 0.58–0.59% Rr (Table 1), indicating that the coal is subbituminous or bituminous coal.
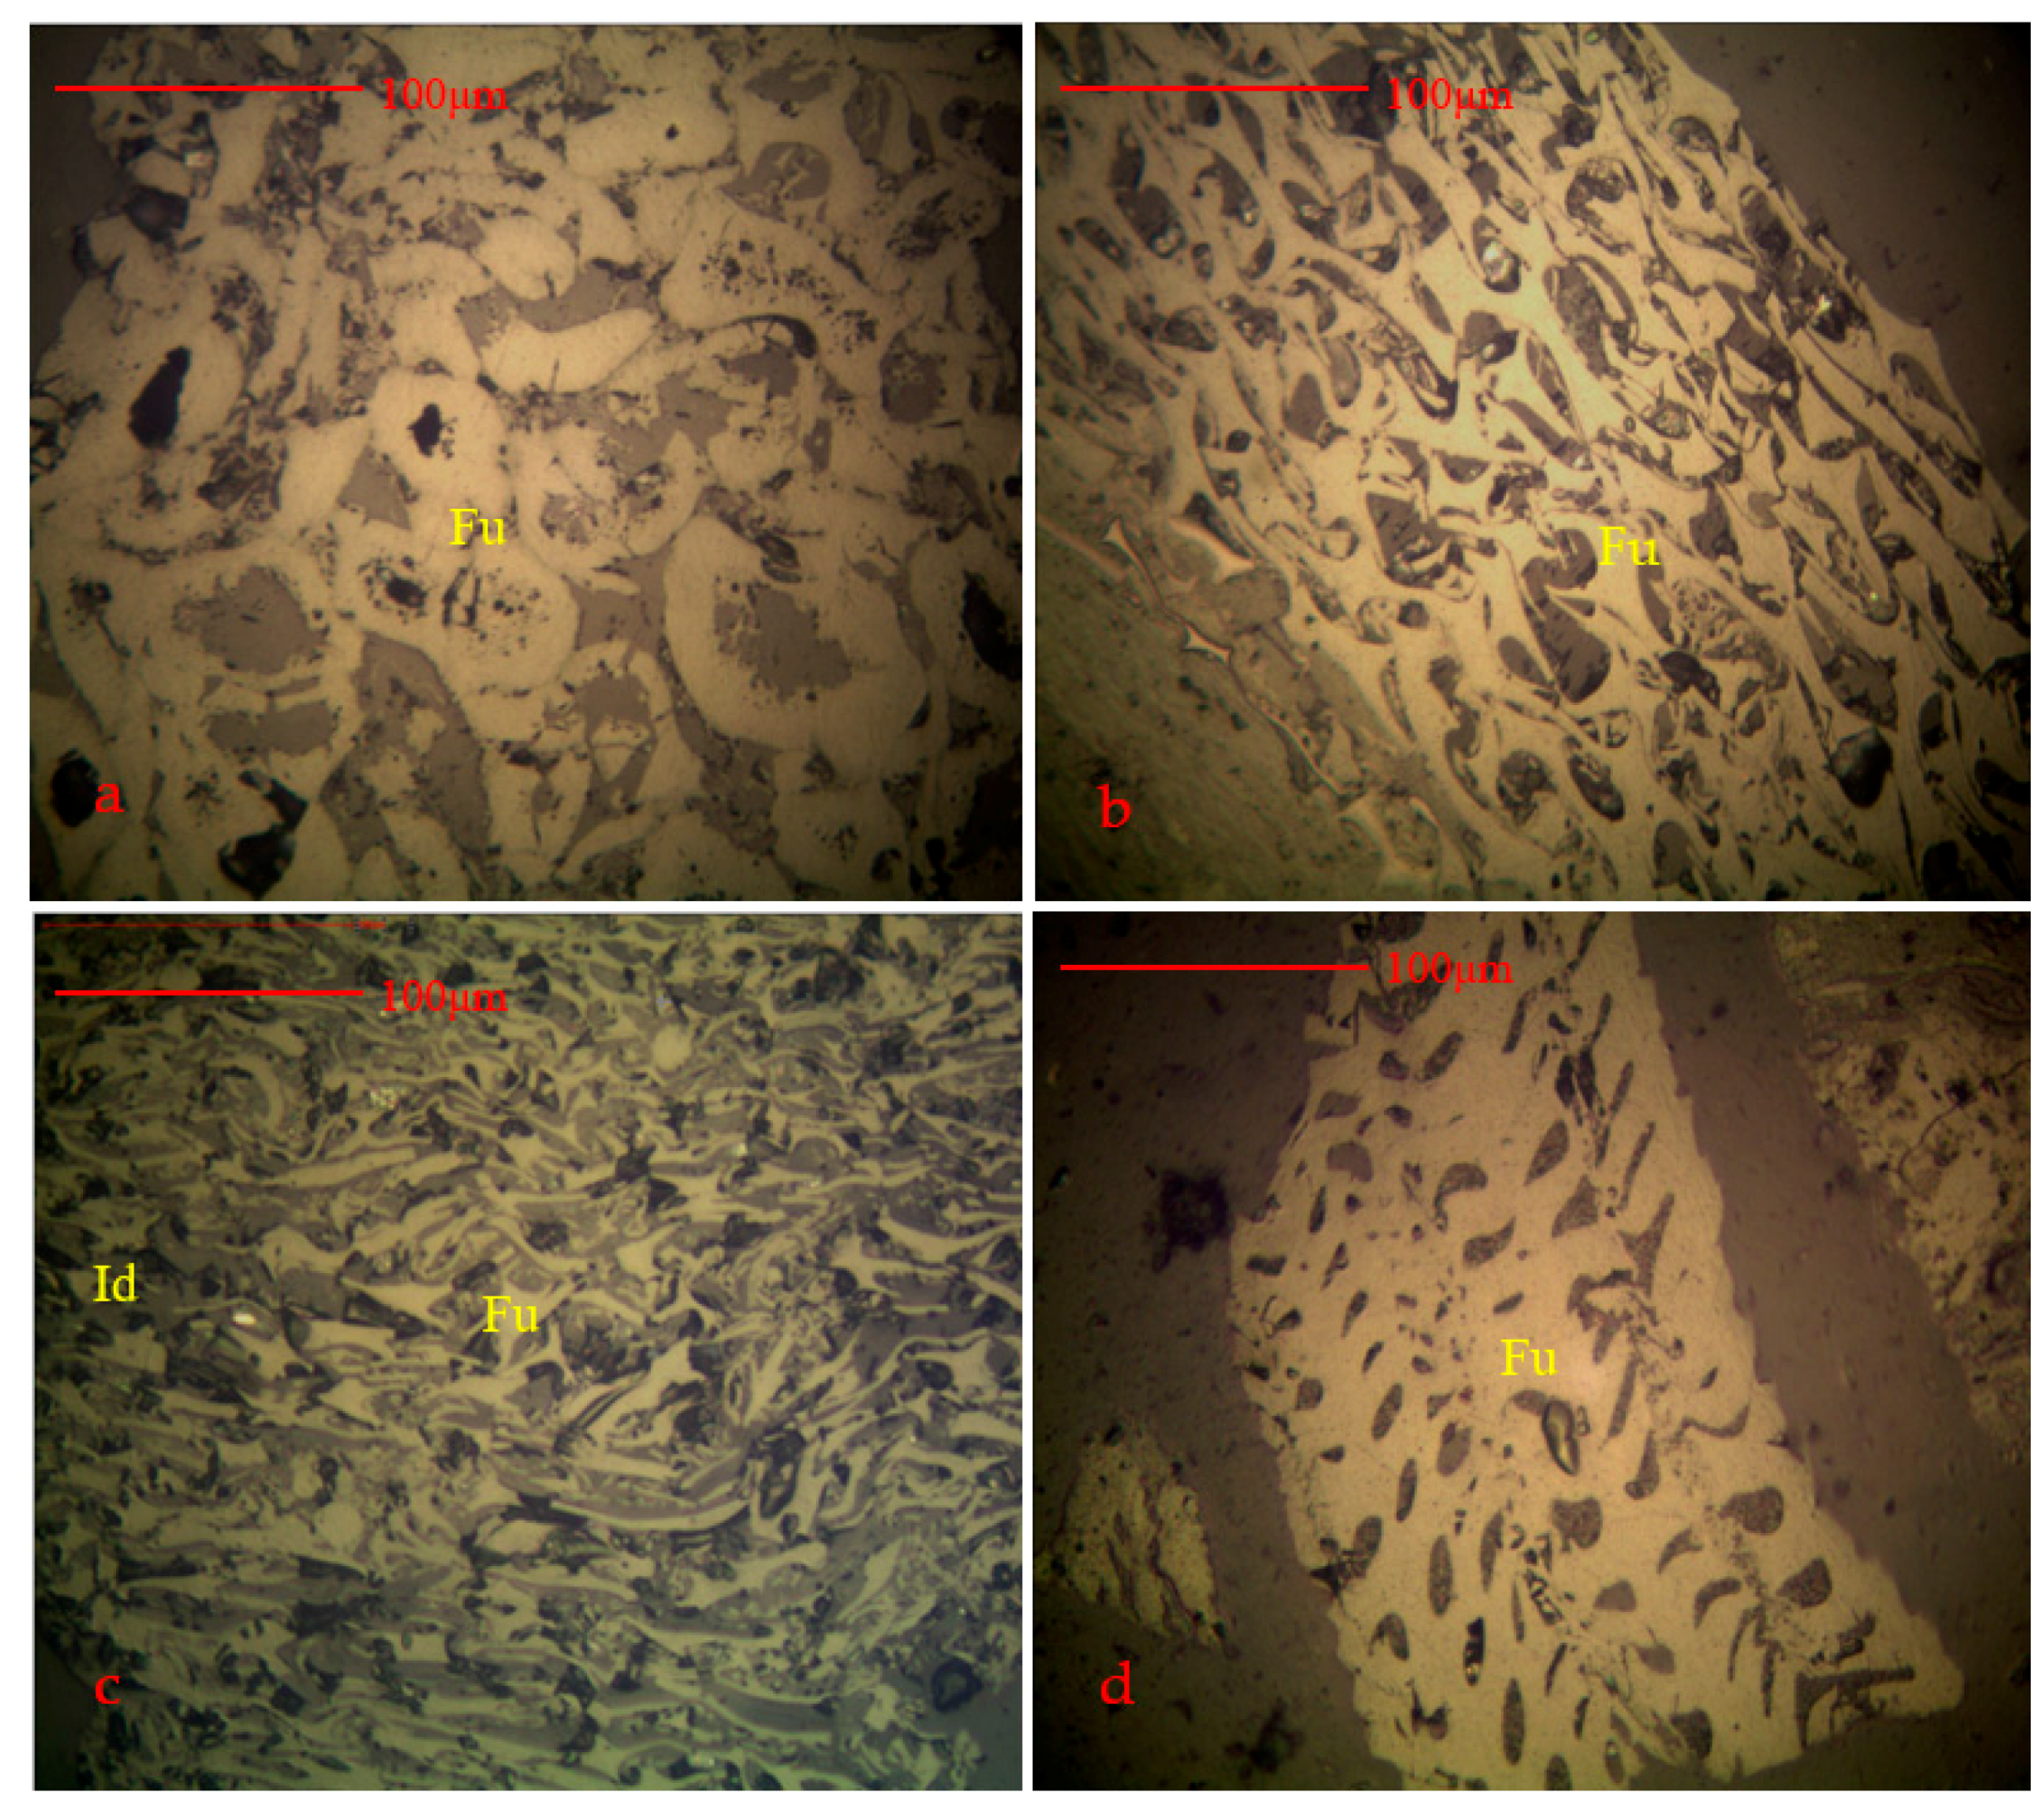
Fusinite and semi-fusinite exhibit forms (Figure 3a–d) typically associated with oxidation (Figure 3a) and some cell deformation (Figure 3d). The macerals illustrated in Figure 3b,c, just like the fragmental texture, which indicate the peat swamp and epigenetic sedimentary environment was turbulent and unstable.
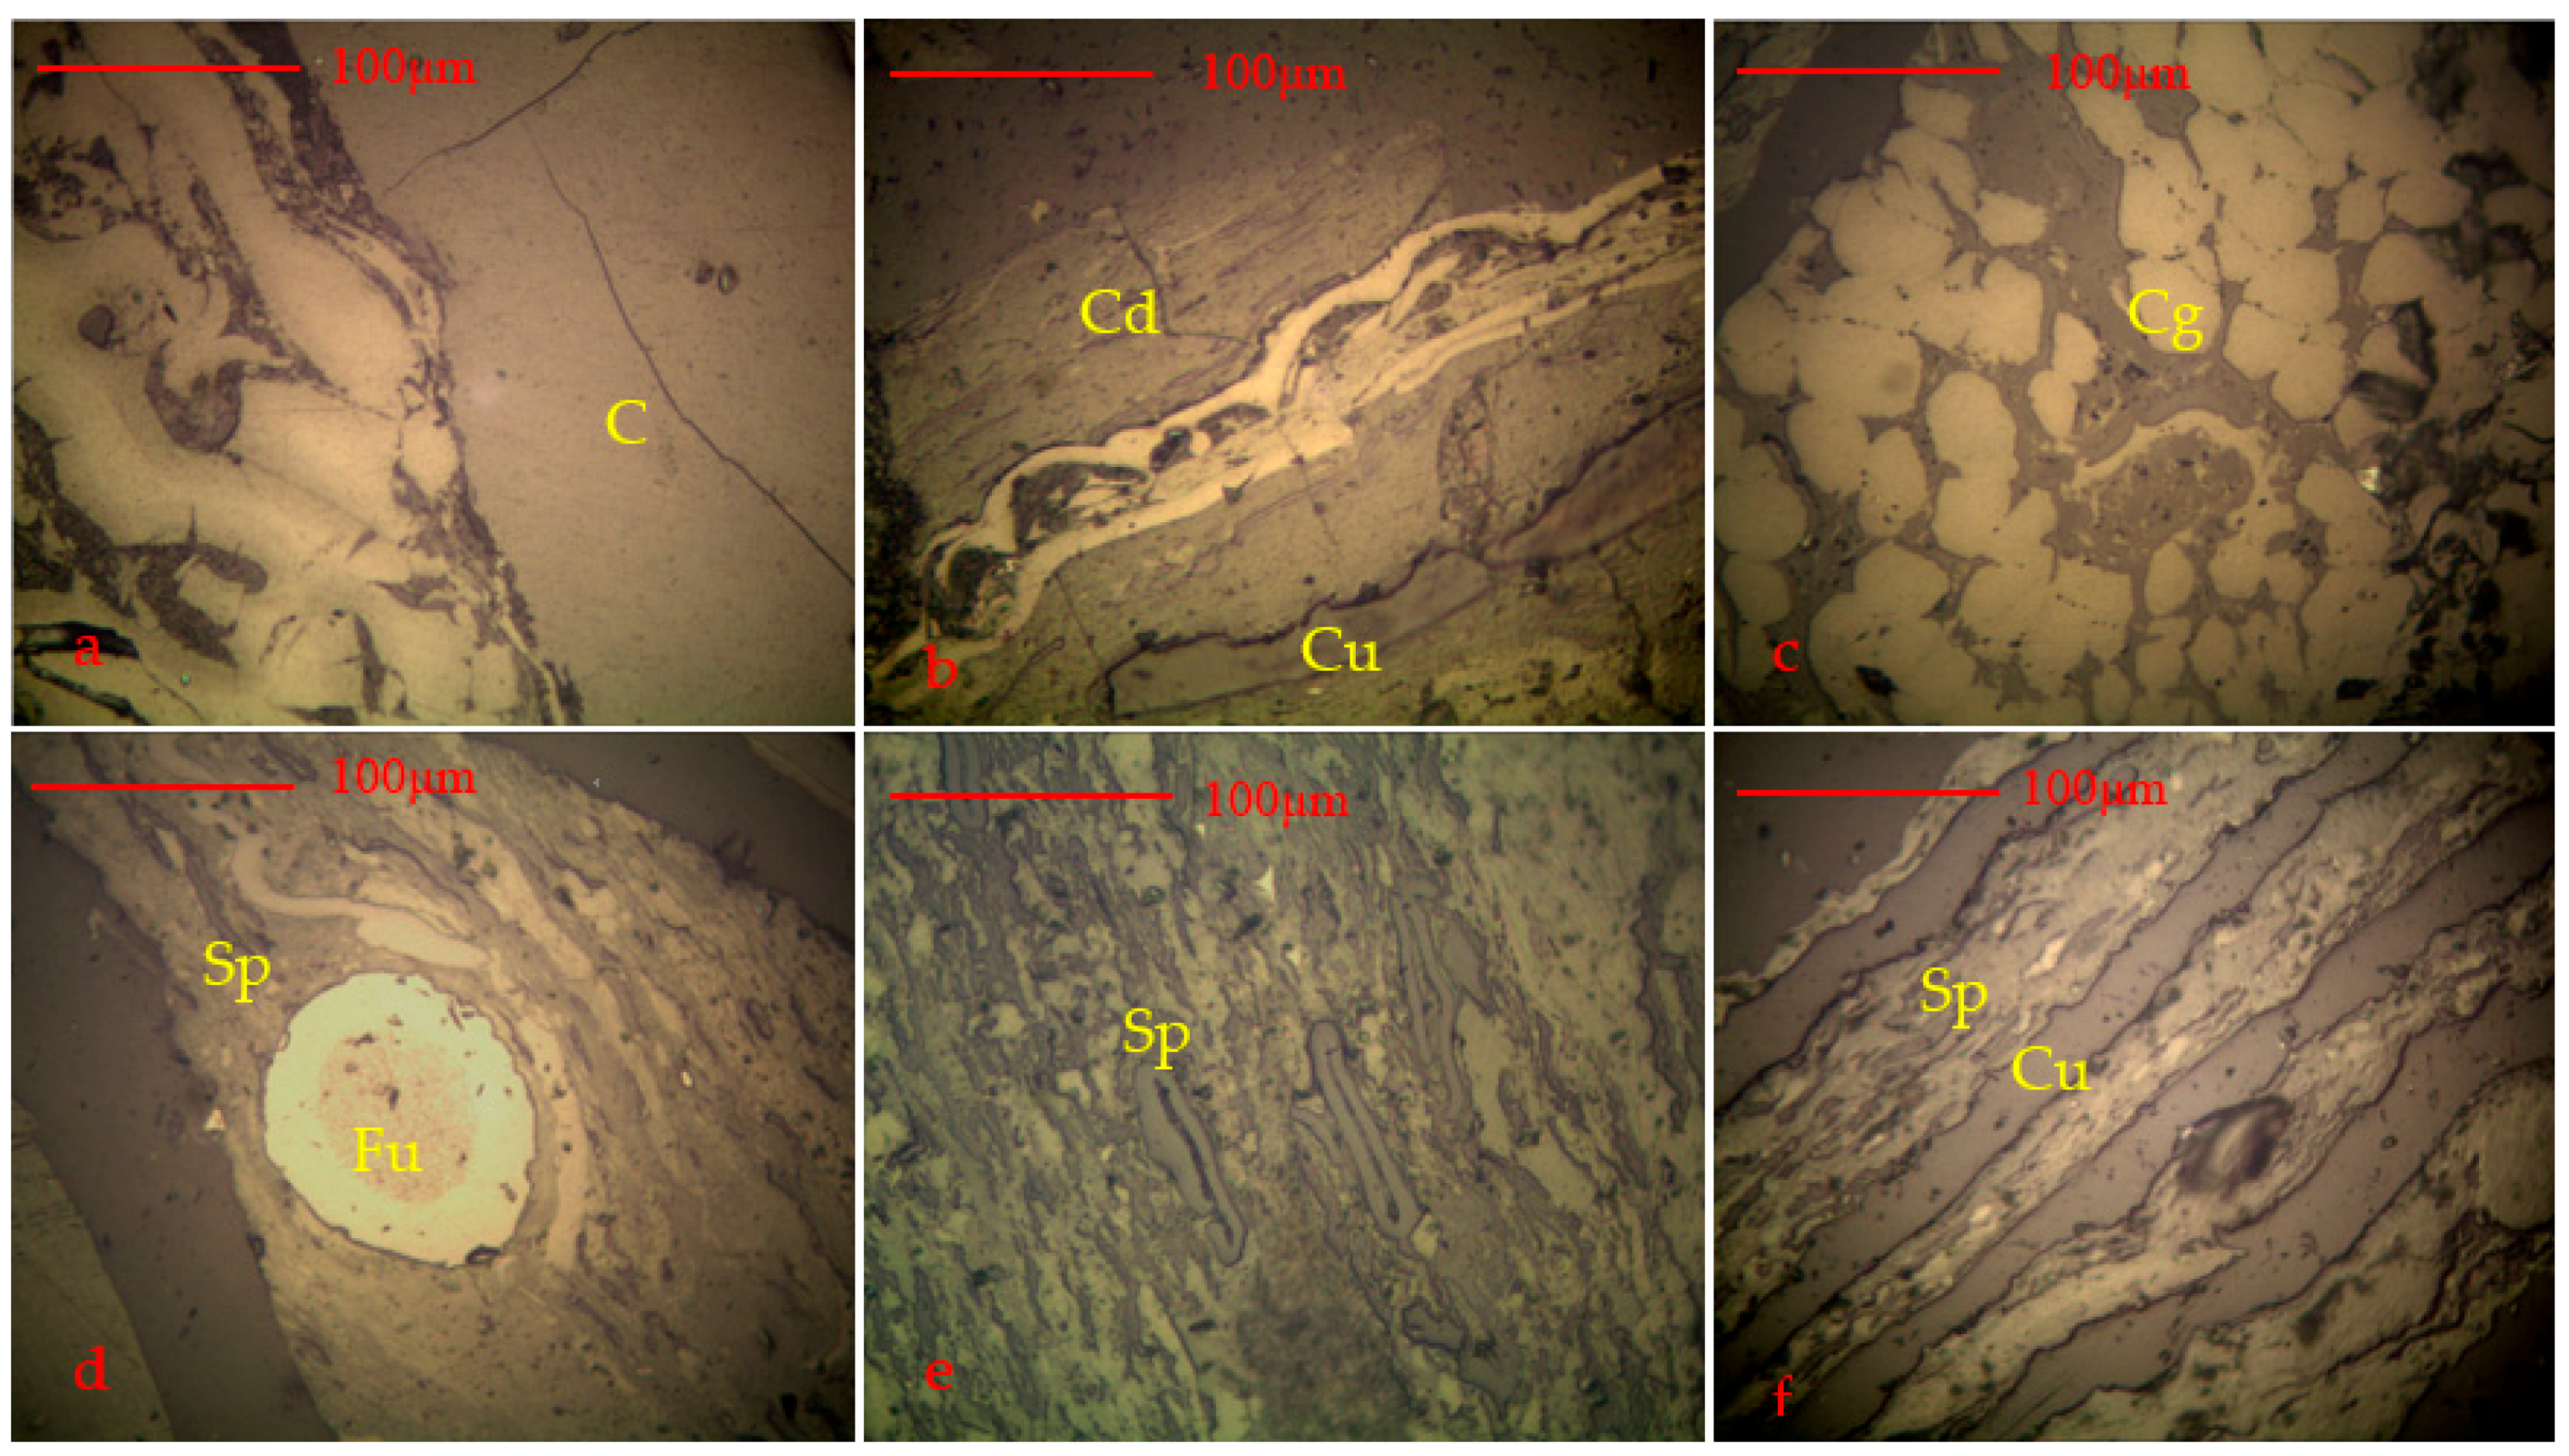
The vitrinite ranged from telovitrinite (Figure 4a), telinite, collodetrinite (Figure 4b), and corpogelinite (Figure 4c), which seem to be oxidized with a gray-white color and a weak relief. Liptinite macerals in the coal included sporinite (Figure 4d, sporinite in a macrinite matrix), suberinite (Figure 4b), cutinite (Figure 4f), and oxidized resinite (Figure 4f).
4.2. Coal Chemistry
The results of the proximate analysis of the coal seam samples are presented in Table 1. It shows that the No. 4 coal is a low-moisture, medium-ash, high-volatile, low-medium-sulfur coal, with an average 4.0% Mad, 28% Ad, 38.2% Vdaf, 44.9% FCd, and 0.7% St,d. The total sulfur content in the No. 4 coal varied greatly from 0.3% to 1.3%, characterized by a high content in the top and bottom coal layers of 1.1% and 1.3%, respectively, where Sp,d was the main component, and low content with So,d as the main component in the middle coal layers (0.3–0.4%). Although sample 4-1 had higher total sulfur, this was due to its higher organic sulfur and not from sulfide.
No. 6 coal was a low- moisture, low-ash, high-volatile, low-medium-sulfur coal, with an average 3.9% Mad, 15.8% Ad, 37.9% Vdaf, 52.3% FCd, and 0.7% St,d. Total sulfur content in No. 6 coal was low and stable, ranging from 0.3% to 0.9%, and So,d was the main component, with the exception of sample 6-13 (>1%, with Sp,d as the main component). The contents of Sp,d and So,d were higher in the No. 6 coal than the No. 4 coal, indicating that the original coal-forming environment had changed greatly and the No. 6 coal was more affected by the seawater [36]. However, the roof, floor, and parting sample seams were characterized by having lower St,d content than the coal seam, with a range of 0.1% to 0.2% in the No. 4 coal, and 0.1% to 0.9% in the No. 6 coal.
4.3. Coal Geochemistry
4.3.1. Major Elements
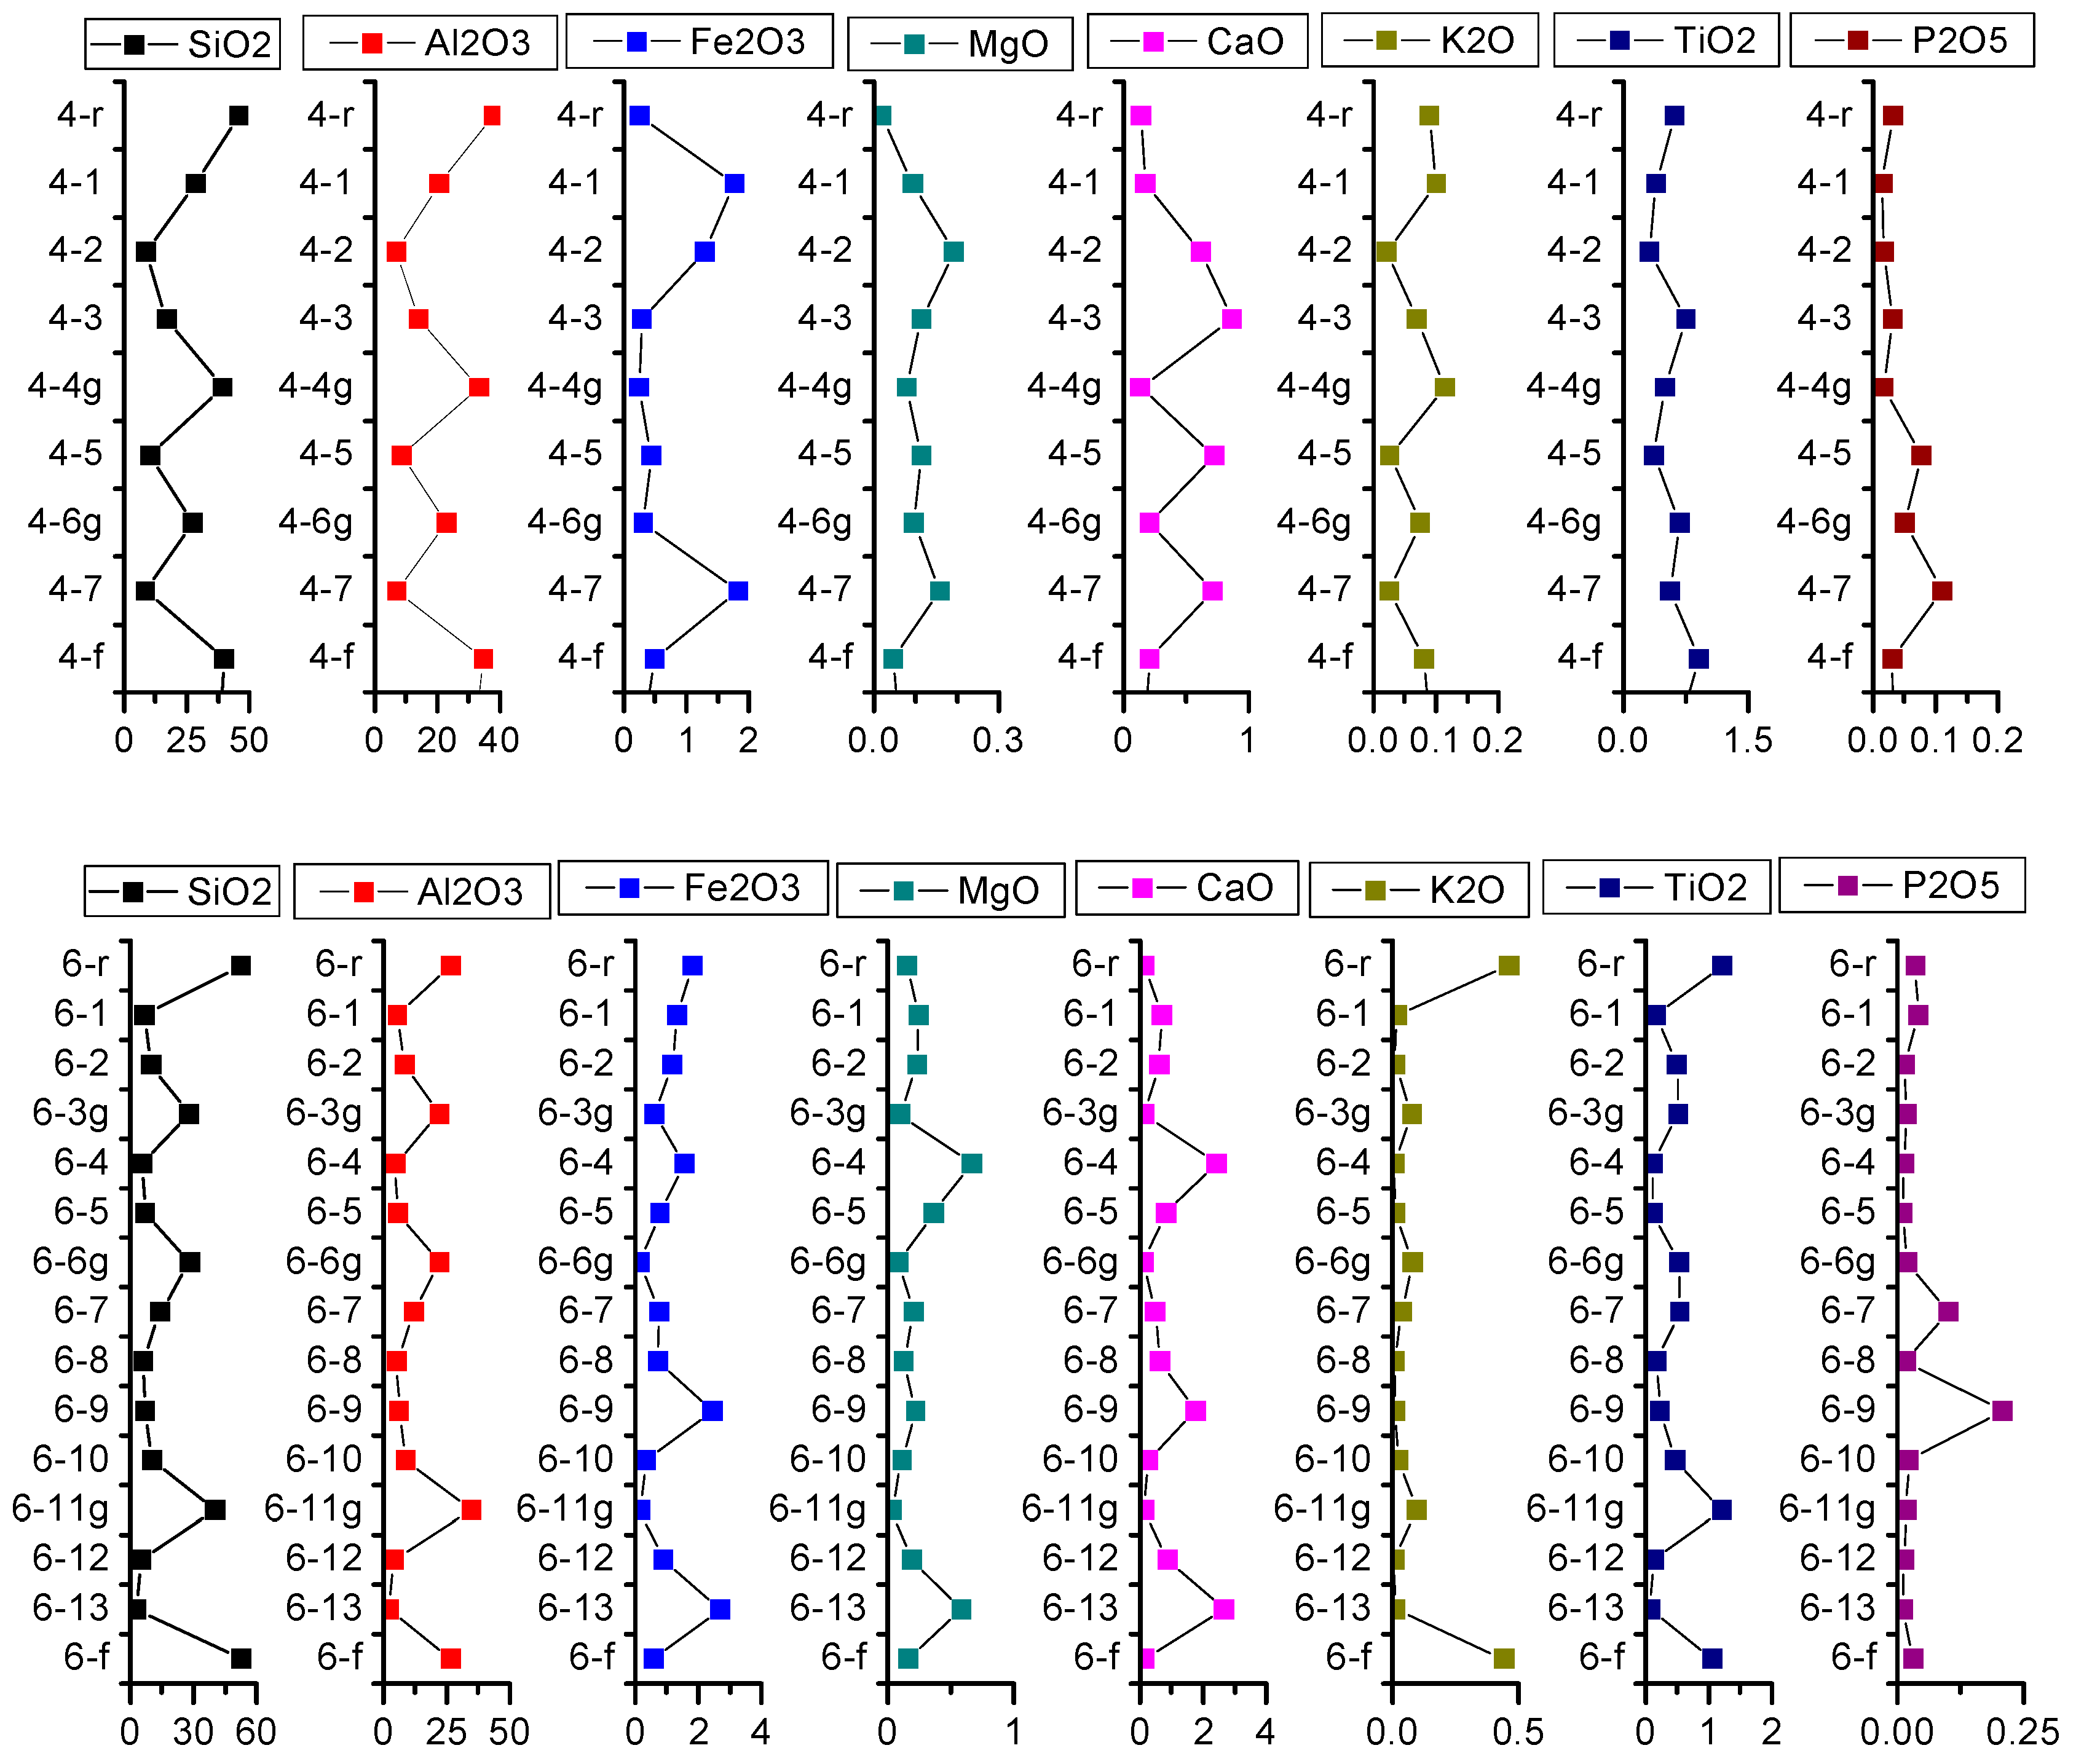
When considered on a whole-coal basis (Table 2), the No. 4 coal contained higher proportions of SiO2, Al2O3, and TiO2, and lower proportions of Fe2O3, CaO, MgO, K2O, MnO, and P2O5 than the average values for Chinese coals reported by Dai et al. [33]. In contrast, the No. 6 coal contained higher proportions of Al2O3, MnO, and MgO, and lower proportions of SiO2, CaO, TiO2, Fe2O3, K2O, and P2O5 than that in average Chinese coal. This may be due to the existence of more high-Al silicate minerals in the No. 4 coal than in the No. 6 coal. When comparing the roof, floor, and parting samples, the coal seams were characterized by having higher Fe2O3, CaO, MgO, and P2O5, and lower SiO2, Al2O3, K2O, and Ti2O contents than the non-coal lithologies.
The SiO2 and Al2O3 content in the roof, parting, and floor always higher, than in bench samples for the No. 4 and No. 6 coals (Figure 5). However, lower Fe2O3, CaO, MgO, and P2O5 were found in the roof, parting, and floor samples. The SiO2/Al2O3 ratios for the roof, floor, and parting samples were equal to the theoretical SiO2/Al2O3 molar ratio of kaolinite (2.0) in the No. 4 coal and much higher in the No. 6 coal seams, consistent with the relatively high proportions of other silicate minerals, such as quartz in the mineral matter.
The ratio results of (Fe2O3 + CaO + MgO)/(SiO2 + Al2O3) (see C in Table 2) and Si/Al show that the differences in the supply quantity of terrigenous matters and a slight change in sedimentary environment during the formation of the upper, middle, and lower coal seams.
4.3.2. Trace Elements
Grouping of Coal Bench Samples Based on the Coal Forming Environment
We divided all the samples into two groups based on original coal-bearing sedimentary system and discussed the geochemistry characteristics of No. 4 and No. 6. Based on the comparison of the Cu and Pb concentrations in the coal benches in this study with the average for worldwide low-rank coals reported by Ketris and Yudovich [30], four groups of coal bench samples were identified in the Huangyuchuan coal. These are described as Groups 1, 2, 3, and 4, in which Groups 1 and 2 were from the No. 4 coal, based on the Pb concentration of more or less than 36 μg/g, which is four times that of the worldwide low-rank coals (9 μg/g). Groups 3 and 4 were from the No. 6 coal and were based on a Cu concentration of more or less than 48 μg/g, which is three times that of the worldwide low-rank coals (Figure 5).
The Group 1 coal benches were significantly enriched in Pb. They were also enriched in Mo, Th, Ga, U, and Li (Figure 6), with an average CC [7] (CC: concentrations of trace elements in the Huangyuchan coals vs. the world low-rank coals) of 15.1, 5.6, 4.0, 3.1, and 2.8, respectively. Bench sample 4-3 had the highest Pb concentration of 58 μg/g and a CC value of 6.5 (Table 2 and Figure 6), and it was enriched with elements Cu (62 μg/g, CC = 3.9), Ga (CC = 3.5), Li (CC = 3.5), and Th (CC = 6.6). Besides, Pb was enriched in the roof sample 4-r with 67 μg/g.
In Group 2, Pb was enriched to a lesser extent in the coal bench samples with a concentration of 24 μg/g, and the elements slightly enriched were Mo (9 μg/g, CC = 4.5); weakly enriched were Th (10 μg/g, CC = 3.1) and Li (30 μg/g, CC = 2.1).
In Group 3, these coal benches were enriched in Cu. They were also enriched in Li, Th, and Pb (Figure 6), with an average CC of 3.9, 3.3, and 2.5, respectively. The bench sample 6-2 had the highest Cu concentration with 69 μg/g and a CC value of 4.3 (Figure 6). Other enriched elements included Li (72 μg/g, CC = 5.2), Th (19 μg/g, CC = 5.9), and Pb (36 μg/g, CC = 4.0). Sample 6-4 had the highest Ba concentration at 3233 μg/g and a CC value of 21.6. Elements Zn (112 μg/g, CC = 4) and Cu (61 μg/g, CC = 3.8) were also enriched in this sample. Gypsum was also found in the sample by SEM. Cu was also enriched in parting sample 6-3 g and floor sample 6-f with 64 μg/g and 58 μg/g, respectively.
In Group 4, the concentration of Cu in the coal, at 13 μg/g (Figure 6), was lower than the worldwide average for low-rank coal, as reported by Ketris and Yudovich [30], and no other elements were enriched except Pb, with a content of 13 μg/g (Figure 6).
Overall, the concentration of Pb in all of samples was always higher than the 9 μg/g world average, and the Li was also always weakly enriched in all the samples, however the content of Cu was either much higher or much lower.
Variations in Trace Elements through Vertical Coal Seam Sections
Figure 7 show the variations of selected trace element concentrations in the coal (Cu, U, Th, Pb, and Ga), as well as the ash yield and total sulfur content, through the vertical sections of the coal beds. Particular points of significance include: (1) Copper was more enriched in the No. 6 coal and the content was higher in coal benches than in the roof and parting sandstones, except in the bench 6-13 and floor 6-f samples (Figure 7). (2) Lead was more enriched in the No. 4 coal and the content was higher in the roof and parting samples than in coal the benches, for example, 4-r, 4-6 g, and 6-6 g. In addition, it was less enriched in the overlayered parting coal in the No. 4 coal, such as Pb in 4-5 was less than in 4-6 g and 4-7 to 4-f. However, this was opposite of the observation in the No. 6 coal, where Pb was more enriched in the coal benches than in the partings. For example, Pb was higher in 6-2 than in 6-3 g, and 6-5 to 6-6 g, and 6-10 to 6-11 g (Figure 7). (3) U, Th, and Ga were more enriched in roof, partings, and floor samples than in coal benches, except in the bench sample 6-13 and floor sample 6-f, and were generally lower in No. 6 coal compared to No. 4 coal.
Distribution Pattern of Rare Earth Elements and Yttrium
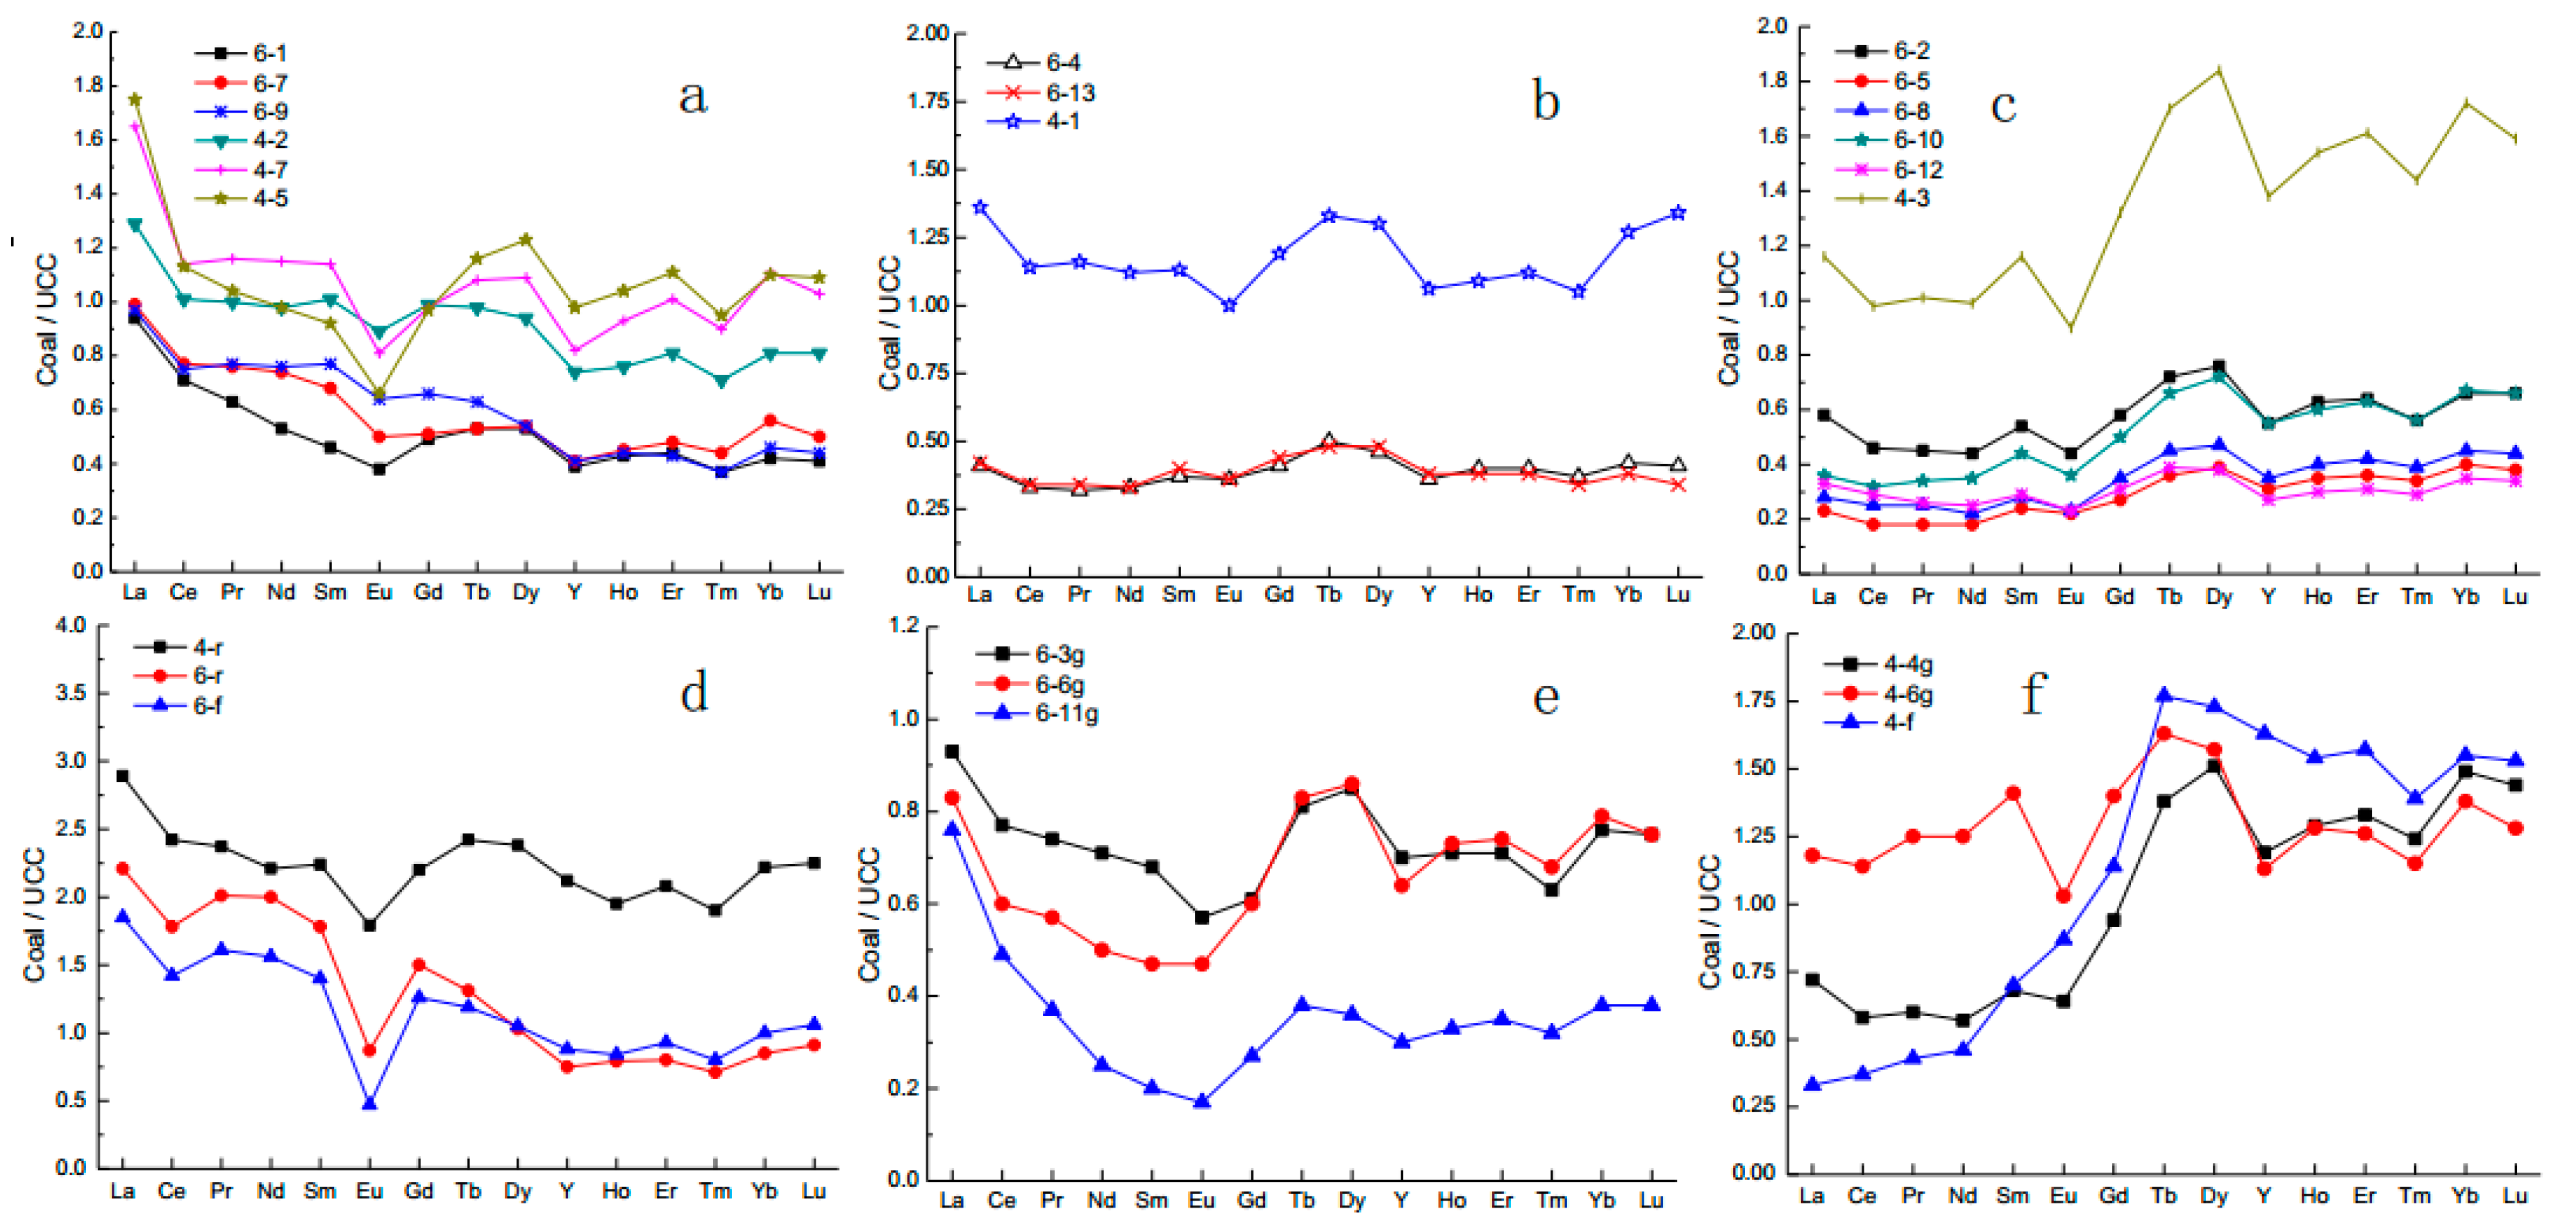
Rare earth elements and yttrium (REY) have been used for many years as geochemical indicators of the sedimentary environment and the post-sedimentary history of coal deposits because of their coherent behavior during different geochemical processes and their predictable pattern of fractionation [7]. A three-fold classification of REY was used for this study: light REY (LREY) for La, Ce, Pr, Nd, and Sm; medium REY (MREY) for Eu, Gd, Tb, Dy, and Y; and heavy REY (HREY) for Ho, Er, Tm, Yb, and Lu [47]. In comparison with the upper continental crust (UCC), three enrichment types were identified [47]: L-type (light-REY; LaN/LuN > 1, N-normalized by average element concentrations in upper continental crust [48]), M-type (medium-REY; LaN/SmN < 1, GdN/LuN > 1), and H-type (heavy-REY; LaN/LuN < 1) [7,47].
The concentrations of REY in the No. 4 coal were higher than the worldwide average values for low-rank coals (68 μg/g) reported by Ketris and Yudovich [30], but were equal to or less than the world average value for low-rank coals in the No. 6 coal (Figure 6). So, the REY had a higher content in the No. 4 coal than that in No. 6 coal (Figure 6 and Figure 8a–c)
With the exceptions of samples 4-3 (highest Pb, H-type), the REY enrichment patterns in the coal benches were dominated by L-type and M–H-type, all with negative Eu and weak negative Ce anomalies (Figure 8b,c), except for the L-type samples (Figure 8a) that had distinct negative Ce and Eu anomalies. Relative to the UCC, the light REY was more distinctly fractionated than the medium and heavy REY in the coal samples (Figure 8a).
The roof and floor samples for the No. 6 coal were L-type with distinctly negative Eu and Ce anomalies (Figure 8d). The light, medium, and heavy REY in the No. 4 partings and floor samples were the classic H-type with negative Eu and weakly negative Ce anomalies (Figure 8f). The No. 6 partings samples were the M-H types with just the weak negative Ce anomaly, and the fractionation of LREY is higher. (Figure 8e).
4.4. Minerals in Coals and Host Rocks
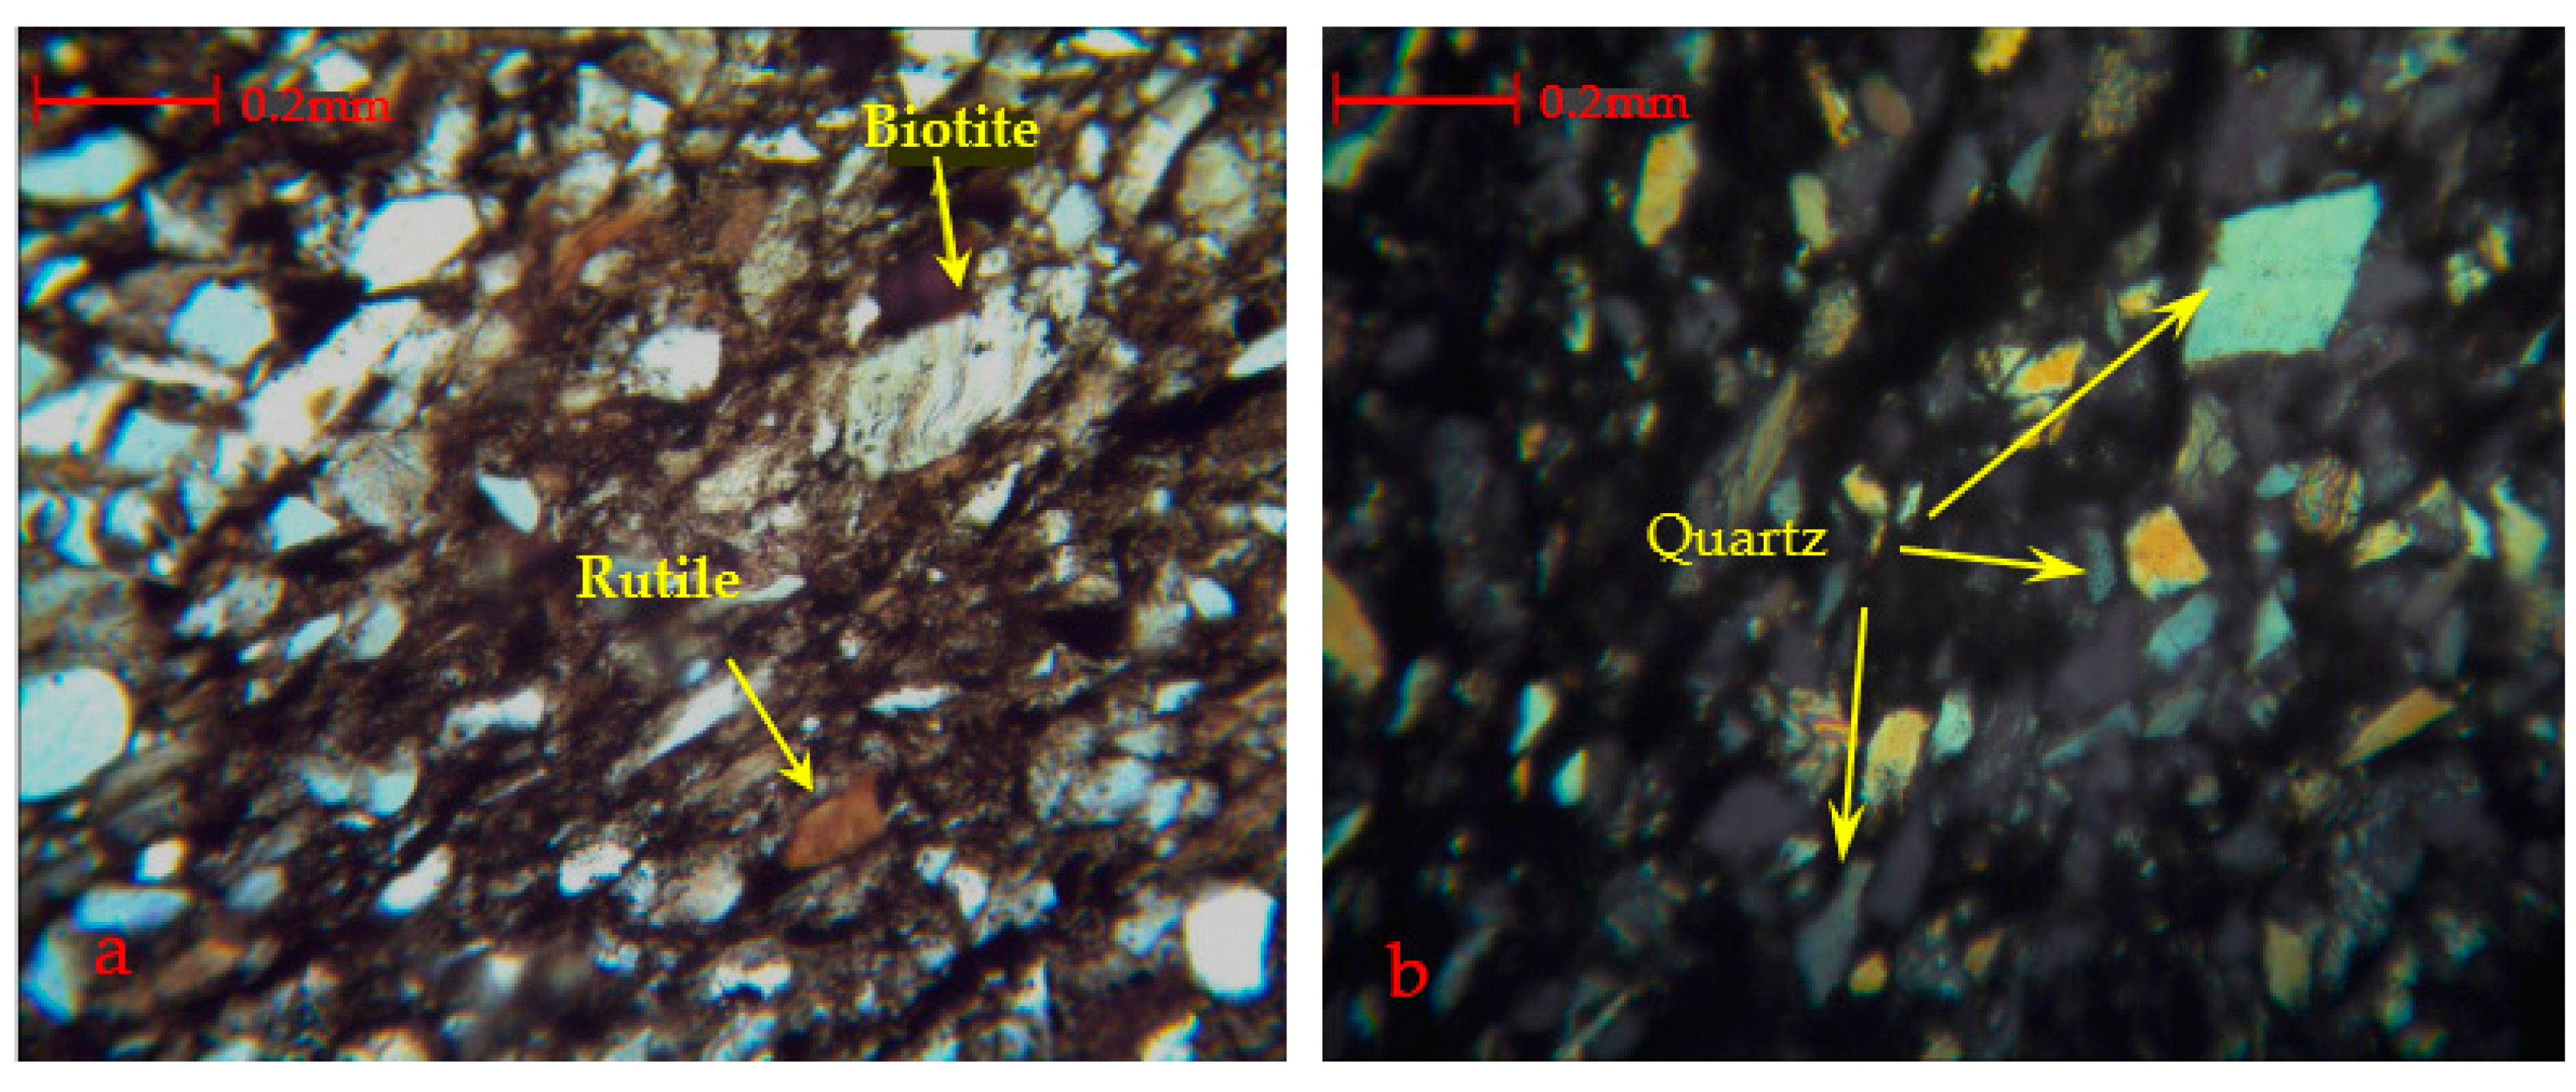
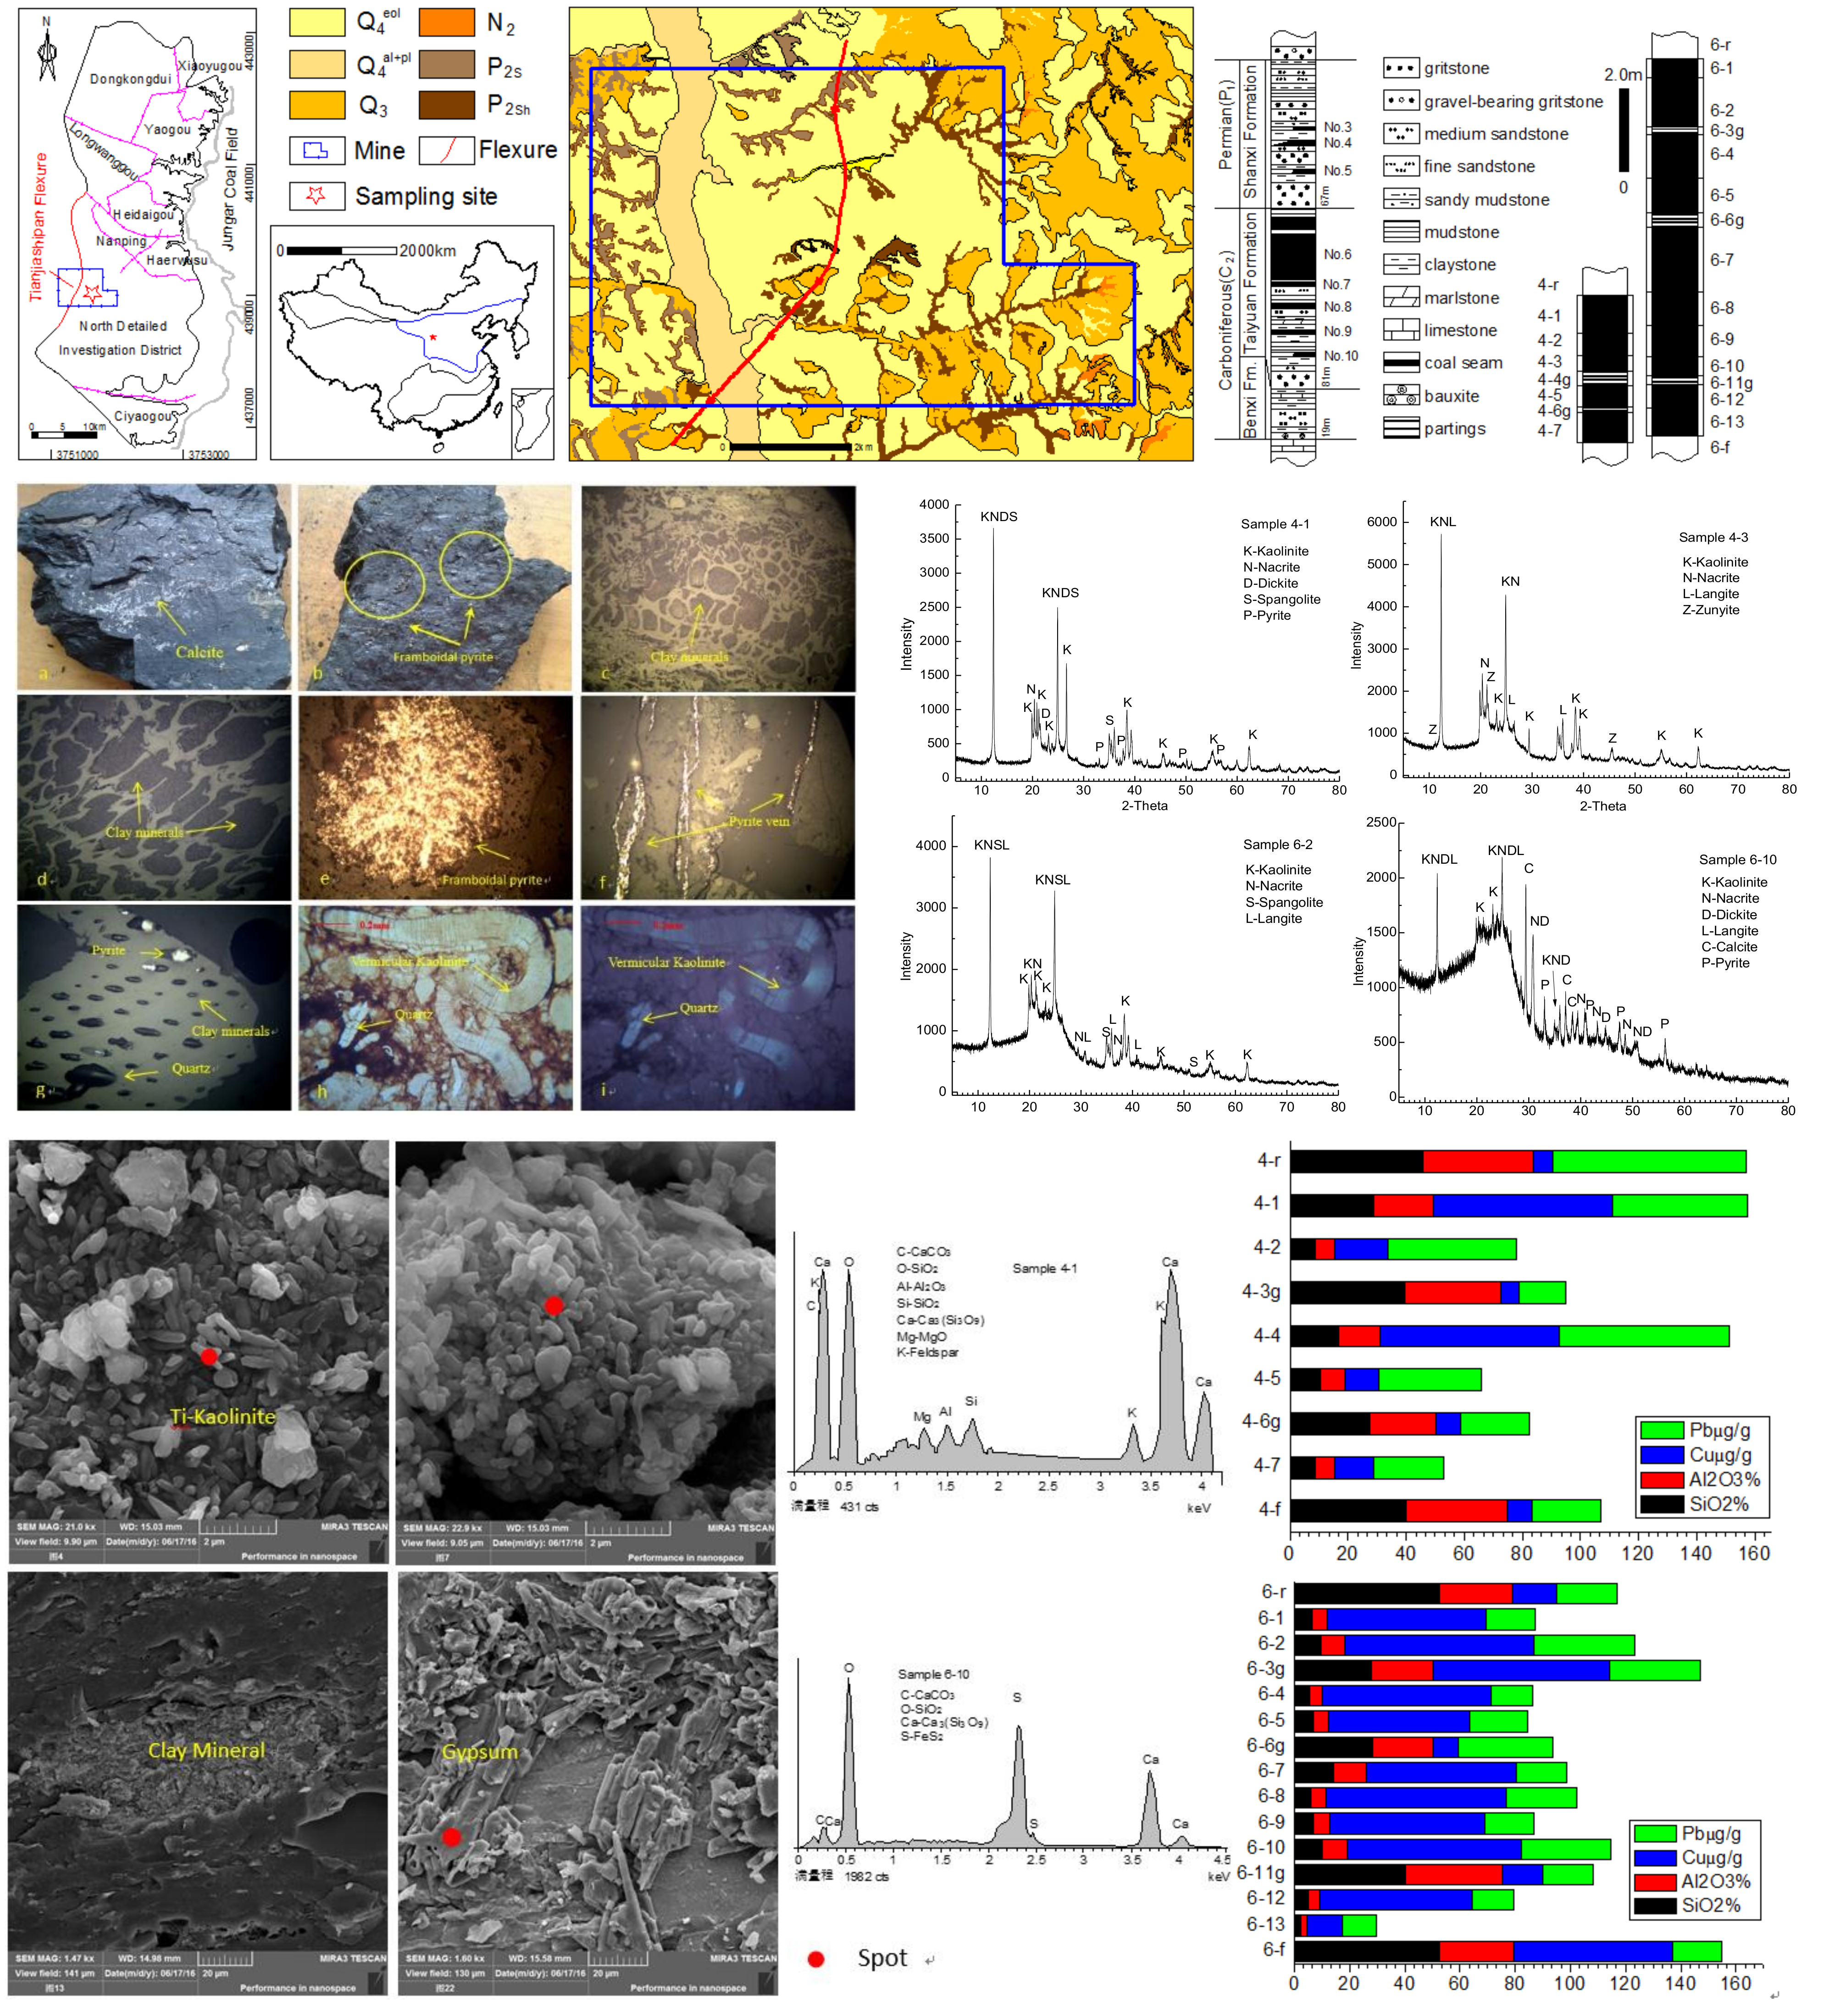
The minerals in the coal samples were mainly kaolinite, and to a lesser extent, calcite and pyrite. Traces of quartz, siderite, K-feldspar, and gypsum were also visible with SEM. The mineral composition of the partings, roof, and floor strata were kaolinite, quartz, biotite (sample 6-r), and rutile (Figure 9, Figure 10, Figure 11 and Figure 12).
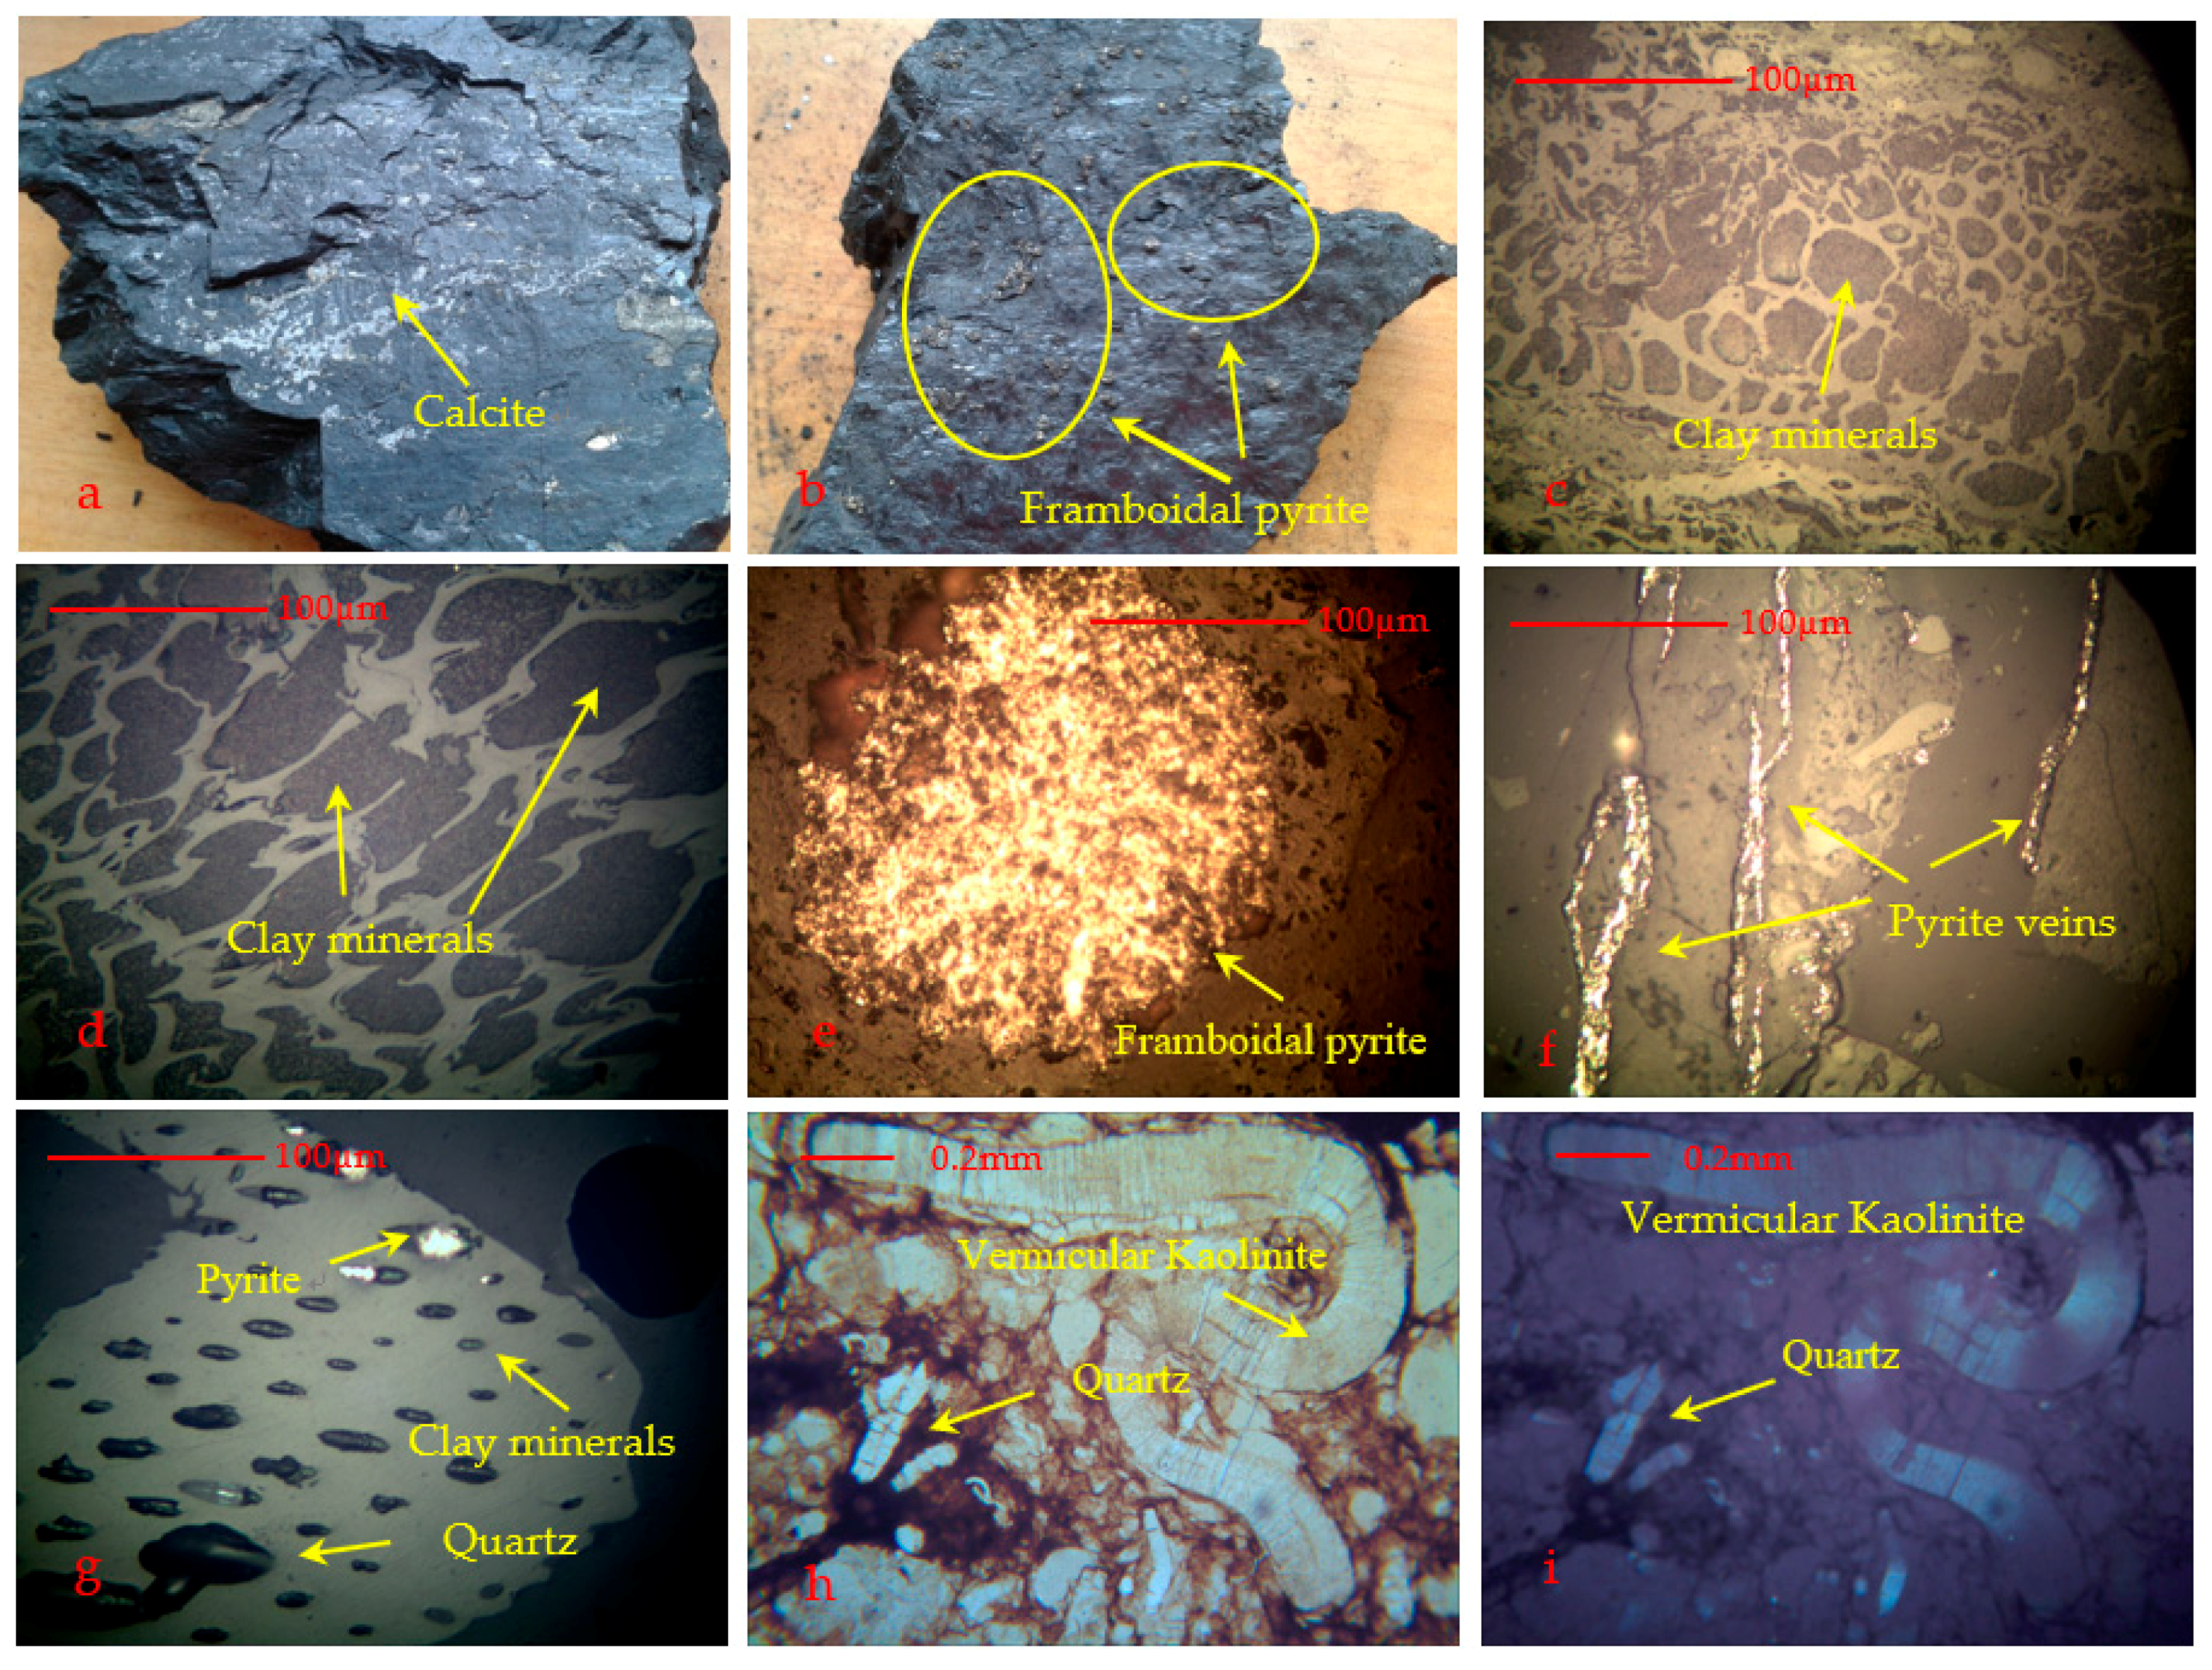
In the macroscopic view of the No. 4 coal, thin-film calcite and pyrite in exogenous fracture were visible (Figure 9a,b), and the microscopic minerals were mainly clay minerals, with an average of 74.9% of the total mineral content (Figure 9c,h), followed by calcite (21.2%), pyrite (2.5%, epigenetic thin-film, fusinite mineralization, and syngenetic-vein), siderite (0.1%), and tiny amounts of quartz (1.4%). Furthermore, a red-orange unknown mineral was found in the No. 4 coal, filling the cell cavity of the vitrinite. In the macroscopic view of the No. 6 coal, there was thin-film calcite in exogenous fracture and framboidal pyrite in sample 6-3 (Figure 9b). Microscopic minerals in the No. 6 coal were mainly granular, globular, lenticular, thin-layered, and cell-filling clay minerals (Figure 9d), accounting for an average of 86.5% of the total mineral content, framboidal (Figure 9e), disseminated, cleat-filling (Figure 9f) and cell-filling (Figure 9g) pyrite (average 10.9%), vein calcite (average 1.7%, filling fissure together with clay minerals or pyrite), and cell-filling quartz (0.9%) (Figure 9g).
The mineral composition of the partings, roof, and floor strata were kaolinite, quartz (Figure 9h,i), biotite (sample 6-r), and rutile.
Kaolinite and pyrite were found in the No. 4 coal samples through XRD analysis s, and dickite, kaolinite, calcite, and pyrite were found by the XRD analysis in the No. 6 coal (Figure 10). Because of poor crystallinity and/or insufficient content amount, minerals such as quartz and siderite, observed by microscope, were not detected by XRD. Dickite is an acidic hydrothermal alteration mineral, which is often associated with quartz, pyrophyllite, epidote, pyrite, and diaspore. However, obvious hydrothermal mineralization was not found in the coal seam, surrounding rocks, or surrounding areas of the Huangyuchuan mine, indicating that the formation of dickite was related to terrigenous materials and later low-temperature alteration.
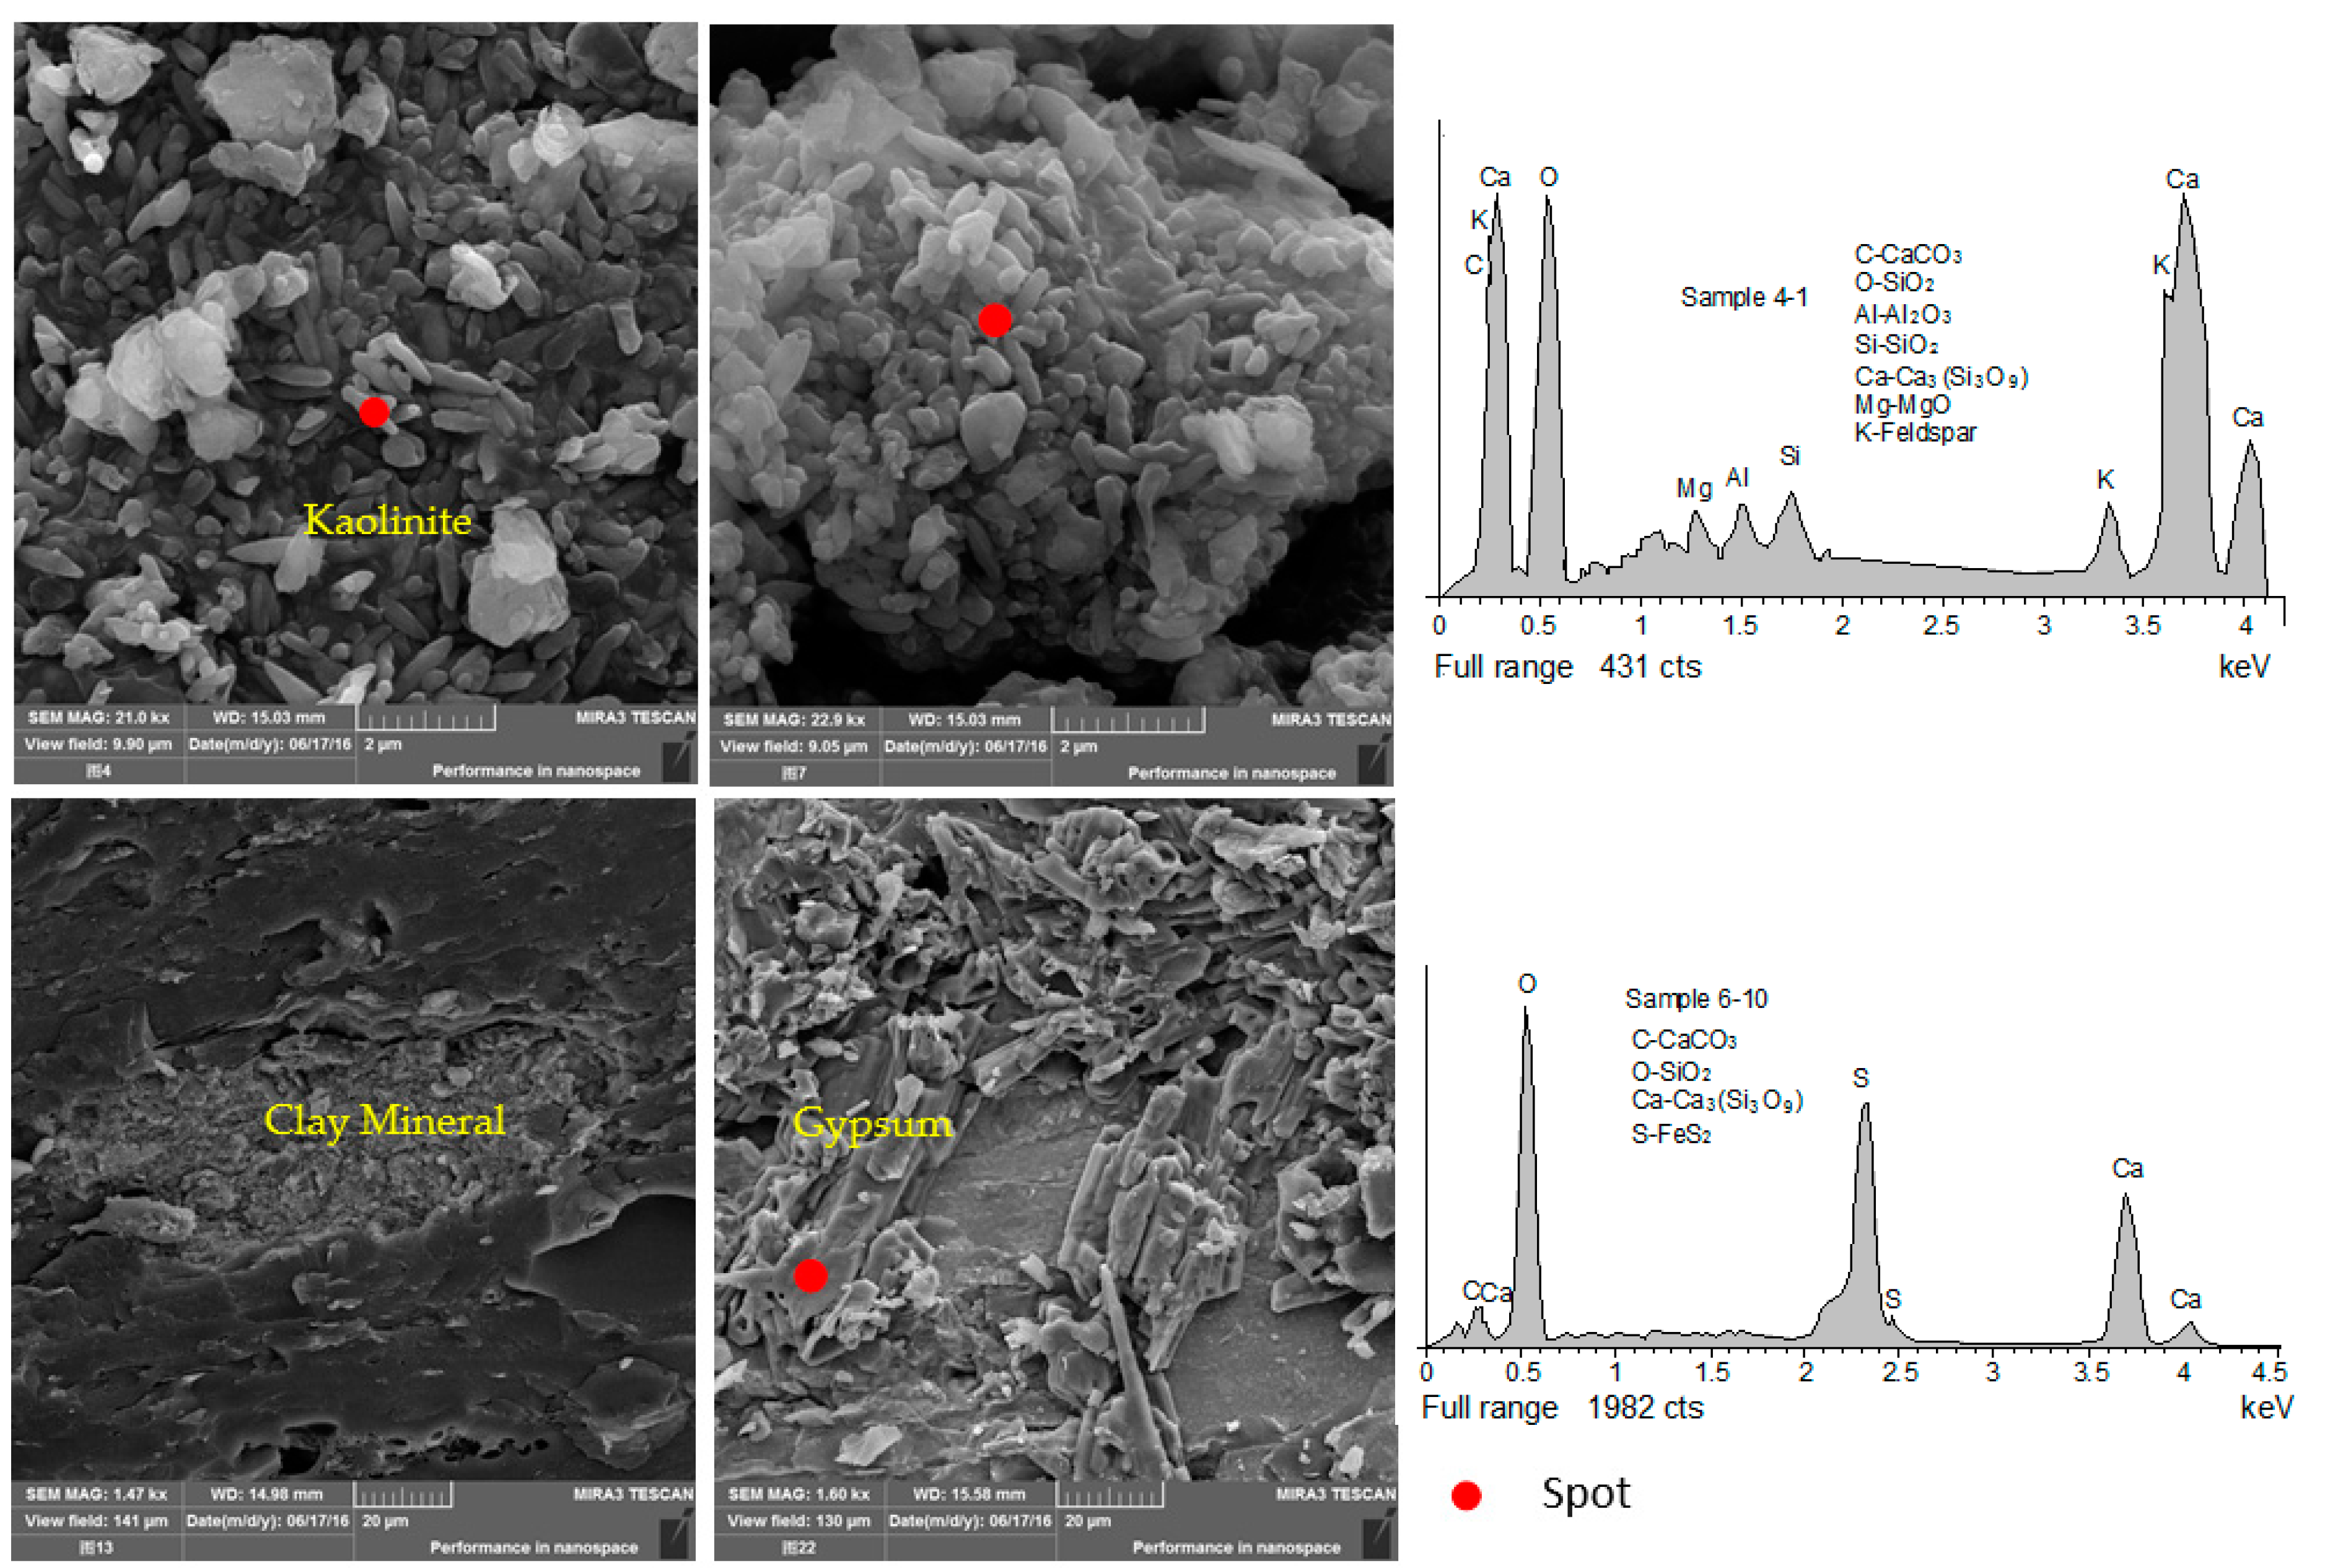
As shown by SEM-EDX, clay minerals, carbonate minerals, feldspar, and quartz were found in the No. 4 coal (Figure 11). Clay minerals, calcite, pyrite, siderite, quartz, and a small amount of gypsum were found in the No. 6 coal.
In brief, using the methods of microscopic observation, XRD, and SEM-EDX methods, we found that the minerals in coal were composed of aluminosilicate minerals (kaolinite, dickite, and K-feldspar), carbonate minerals (calcite and siderite), sulfide minerals (pyrite), oxide minerals (quartz), and sulfate minerals (gypsum) in the Huangyuchuan mine. In which, clay minerals, carbonate, and sulfide minerals were quite common in coal, while other minerals were rare.
5. Discussion
5.1. Cu and Pb in Jungar Coal
Based on the available published data, the contents and occurrence of Cu and Pb in coal in some parts of China were statistically analyzed. From a nationwide perspective, the Cu content in coal seams was high in Southwest and Northeast China, but low in the middle and Northwest. For instance, the Cu content was higher than the crustal value (60 μg/g) in Chongqing [22], Guizhou Province of Southwest China [20,23,34,49], and the Shenbei coalfield in Northeast China [35], which content was between 39–53 μg/g in Northern Shaanxi [50,51,52]. In addition, Inner Mongolia [53,54] and Xinjiang Province coals [49] of Northwest China were characterized by low Cu content (14–24 μg/g). In contrast to other coals in China, Table 2 shows that Cu (33 μg/g) and Pb (42 μg/g) in the No. 4 coal were both higher than the world hard coal, which have an average of 16 μg/g and 9 μg/g, respectively [30,33] (Figure 12), in which the Cu content is much lower than in the crust (60 μg/g) and Pb content is much higher than in the crust (13 μg/g).
In the No. 4 coal, Cu content was lower in samples 4-2, 4-5, and 4-7, but higher in samples 4-1 and 4-3, with an average of 62 μg/g, and Pb content was highest in sample 4-5 with 58 μg/g, followed by samples 4-1 and 4-2 with 45 and 47 μg/g, respectively. The Cu content in the No. 6 coal, at 55 μg/g was more than three times that of the world average (Table 2), but was lower than that of the crust (60 μg/g). In samples 6-2, 6-3, 6-6, and 6-8 of the No. 6 coal, the Cu content were all above 60 μg/g and relatively enriched. The Pb content in the No. 6 coal, at 20 μg/g, was two times that in CC and higher than 33 μg/g in samples 4-2 and 4-8, which are enriched elements in coals.
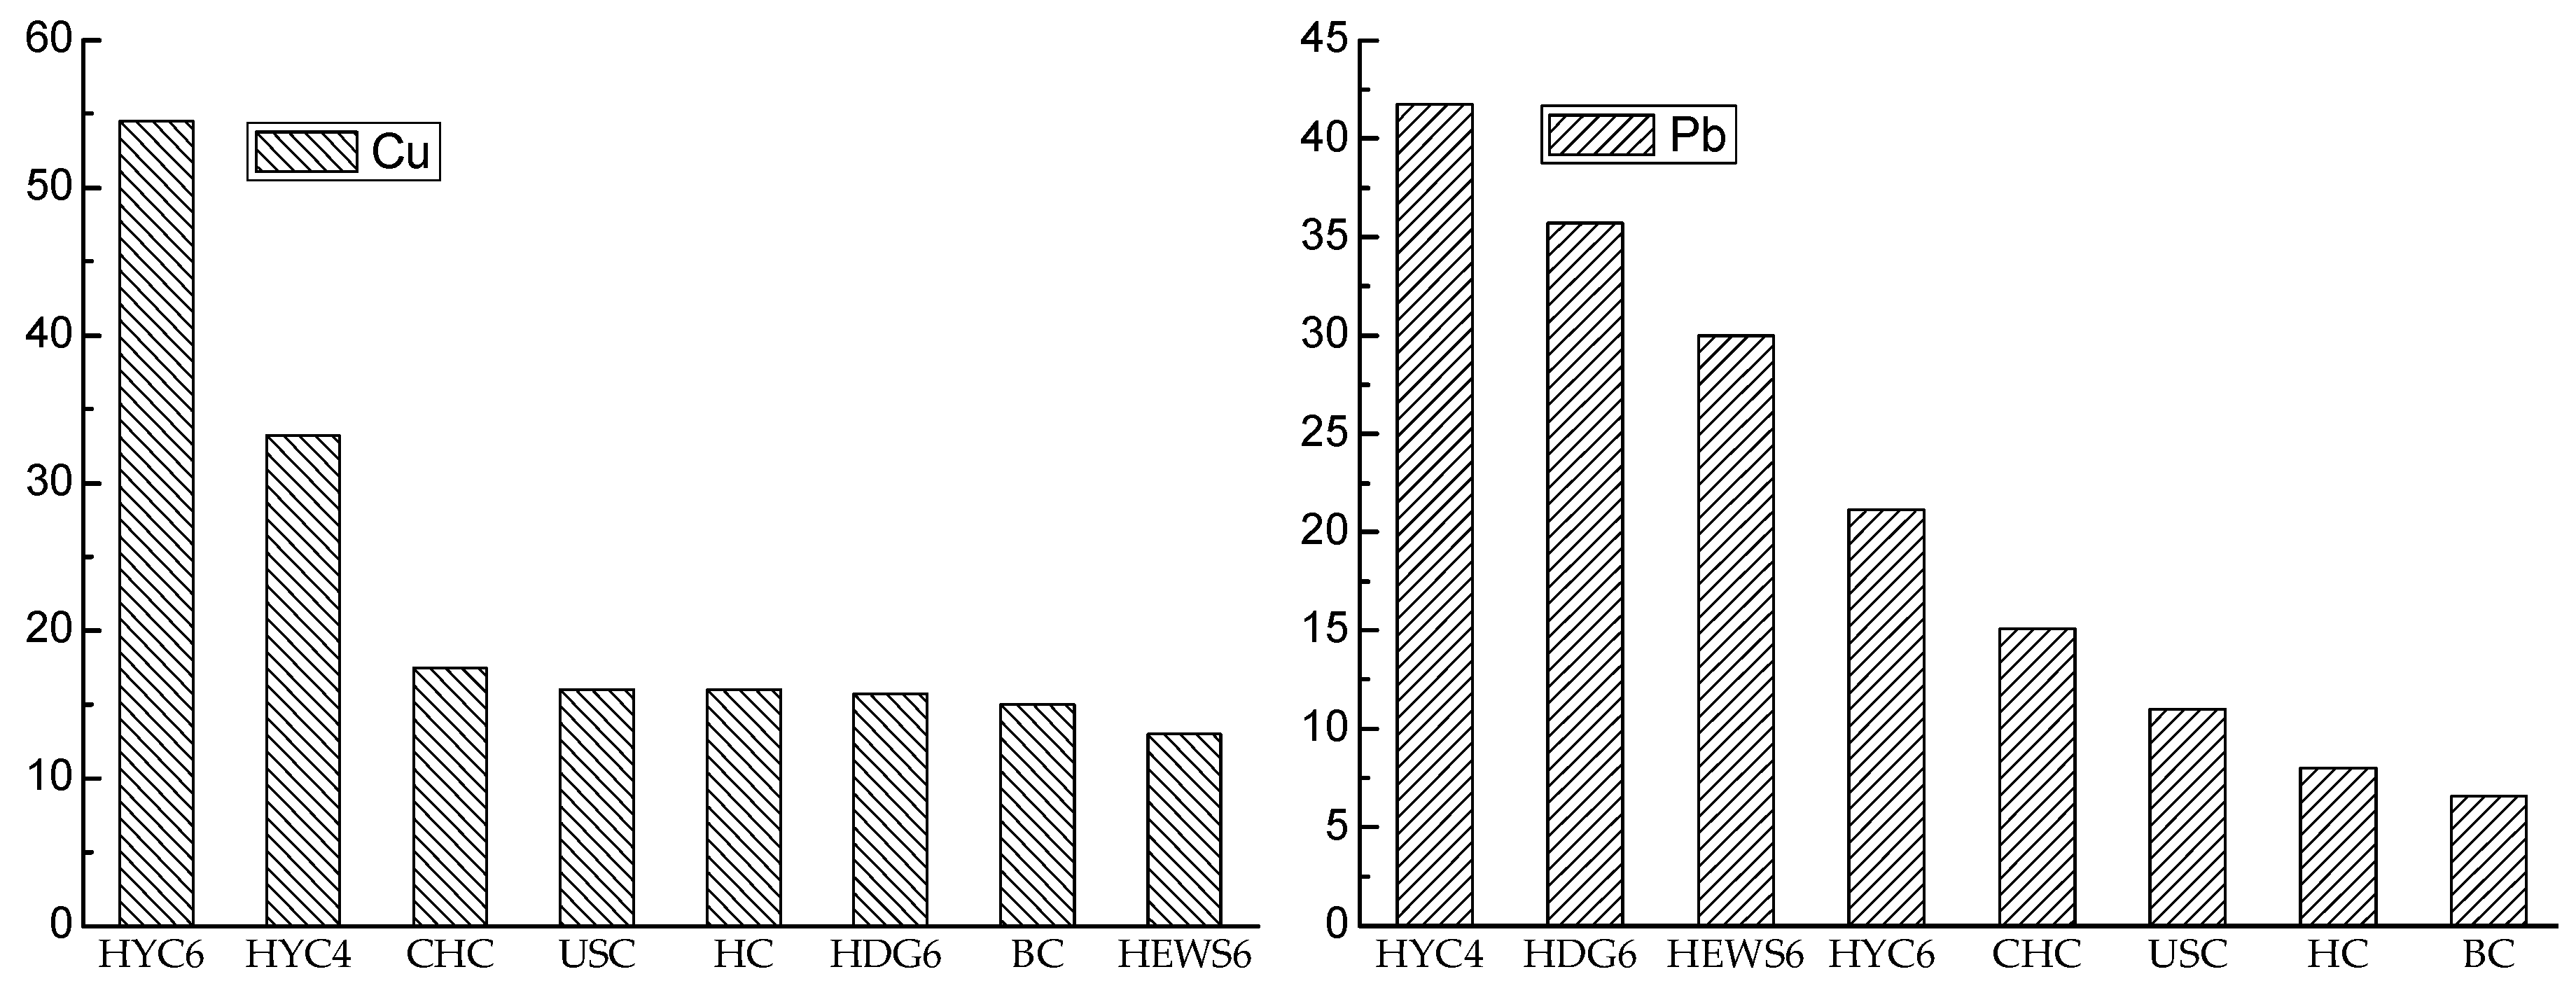
The Cu content for No. 6 coal is higher in Huangyuchuan mine than that in Heidaigou [39] and Haerwusu mine [38], which located in the of north central of Jungar coalfield (Figure 1) [40], at 55 μg/g, 16 μg/g, and 13 μg/g respectively, and it also higher in the No. 4 coal with 33 μg/g Cu from the Huangyuchuan mine. However, No. 4 coal had a higher Pb content (42 μg/g) than all the No. 6 coal of Huangyuchan (21 μg/g), Heidaigou (36 μg/g) and Haerwusu mine (30 μg/g) from the Jungar coalfield (Figure 12).
In conclude, in some parts of the Jungar coalfield, the Cu content is generally higher in No. 6 coal than in No. 4 coal, and horizontally, the Cu content also higher in southern than in northern of the Jungar coalfield. In contrast, Pb content in No. 6 coal from other mine of Jungar coalfield is higher than that from the Huangyuchuan mine in the southern coalfield, but lower than in No. 4 coal, indicating that the Pb content is unstable horizontally in the Jungar coalfield.
5.2. Causes of Enrichment
As the Jungar coalfield is on the northeast border of the Ordos plateau syncline, the detrital provenance of No. 6 coal is situated the north (i.e., moyite from the Yinshan ancient land (Figure 13), and/or the northeast (i.e., Late Palaeozoic Benxi Formation) [38,39,40], while the Proterozoic and Lower Paleozoic granites and sedimentary rocks in the Yinshan area; and probably add some basic volcanic rocks, are terrigenous detrital materials of the No. 4 coal [42]. As for the source and quantity of terrigenous rocks, compared to the Huangyuchuan mine, the Heidaigou mine accepted more continental weathered detritus with a richer variety of minerals from the Yinshan area, which means that larger amounts of terrigenous materials may be responsible for the higher content of Pb, and the basic pyroclastic found in No. 4 coal [42], e.g., different lithology of source rocks, is another reason for that finding. On the other hand, Cu may be more enriched in coal seams formed in transitional facies which were more easily affected by seawater and crystallized more sulfide [36]. Therefore, we can conclude that coal-forming environments and clastic parent rocks affected the occurrence of Cu and Pb, and the enrichment of Cu in coal was more likely caused by transgression influence; while Pb, influenced by continental facies detritus to a certain extent, which could have supplied abundant terrigenous materials.
Granite debris migration from the provenance area can provided biotite that contained adequate Cu ion. Furthermore, some hydrous aluminosilicate minerals decompose into other minerals during migration also could lead Cu ion occur in detrital minerals.
Cu in No. 4 coal was more enriched in the under layer of the roof and parting samples than in the roof, floor, and parting. For example, Cu had a higher content in sample 4-7 at 13 μg/g, than that in sample 4-6 g and the floor, based on the microscopic observation of thin section, the roof, floor and partings had high sandstone content and clay occurred as the matrix, even the dominant minerals in No. 4 coal. Then the Cu in the adsorbed form of aluminosilicate minerals from the roof, floor, and partings would leach into the coal seam, and occurred in copper-bearing minerals, sulfides, and organic complexes under the effect of diagenesis. As shown in Figure 7, the Cu content was always lower in the roof, floor and partings. In addition, the Pb enrichment factor was the same as that of Cu, and the leaching process of the roof minerals led to low organic sulfur content and high Pb content in 4-1 (Table 1 and Figure 7). The stable existence of organic sulfides is the basic reason that its content in the lower coal layer is low but changed less, such as in sample 4-5 to sample 4-f, and because of the unclear occurrence of organic sulfur in No. 4 coal, why and how Pb could be ionic bonding with organic sulfur needs to be further researched.
The distribution of Cu in No. 6 and No. 4 coal had some similarities, but the fluctuation of Cu content in No. 6 coal was obviously controlled by the cyclic change with the sedimentary environment due to the high relevance with Si, Al and Ad (Figure 7 and Table 3). There, no distinct variation in the content of the samples occurred between sample 6-1 to 6-5 (including 6-3 g), but Cu is lower in the samples of 6-r, 6-6 g and 6-11 g, because without leaching effect, the Cu is higher in sample 6-f. However, the samples 6-3 g had identical higher Cu content with the other coal benches. Perhaps weathering and leaching of fragments matter from the roof and partings to coal layers is dominate origin of Cu ion in coal, but we also cannot explain the reason of the higher Cu in sample 6-3 g. It may be due to the import and export for the Cu ion is equal in 6-3 g and more content of Fe ion (Table 2). The higher content of Fe, Mg, Ca, and sulphate gypsum minerals detected by SEM indicates that an element exchange occurred between sample 6-13, 6-f, and the sedimentary waters, which resulted in extremely low Cu content in sample 6-13. Certainly, we have no reason to rule out the fact that the massive Cu ions could migrate to the lower layer and then lead to higher Cu content in sample 6-f. However, this situation did not appear in No. 4 coal, so it is obvious that the epigenetic sedimentary environment has a profound influence on the Cu content. Compared to the No. 4 coal, the low Pb content (reduced rate of 49%) is obviously related to the low Si and Al content (reduced rate of 49% and 45%, respectively) in No. 6 coal (Table 2), so the Pb content in No. 6 coal depends on the terrigenous clastic matter supply amount, which is probably the main reason for the lower Pb content in the Huangyuchuan mine compared to the Heidaigou mine.
5.3. Occurrence
The Cu contents in the No. 6 coal from Huangyuchuan mine were all higher than 50 μg/g, except for sample 6-13 (13 μg/g), and the sulfur mainly occurred as organic sulfur in No. 6 coal except for in sample 6-13, that mainly occurred as sulfide sulfur (Table 1). Apparently, having a similar content trend, the Cu in No. 6 coal was closely related to the occurrence of organic matter (Table 3) and organic sulfur. In addition, the ratio of organic sulfur to total sulfur in sample 6-13 was very low, but the content of organic sulfur was the same as in the upper layer. Moreover, the Cu content in 6-13 was much lower than the upper layer, which means it is possible that partial Cu exists in the form of stable organic complexes which did not migrate easily, and the occurrence in sample 6-13 must be different from sample 6-12. Table 2 shows that the Fe and Ca contents in sample 6-13 were extremely high, and the results of XRD and SEM (Figure 5) show that No. 6 coal is characterized by many sulfide and carbonate minerals, and a small amount of gypsum. In conclusion, sample 6-13, close to the floor, was affected by an epigenetic deposition environment; some of the metal ions dissolved and migrated to other layers, leaving stable Cu ions or organic Cu during the weathering oxidation and crystallization of Fe-bearing minerals and carbonate minerals. Besides, Table 3 shows that there is a positive correlation coefficient between Cu, Al, Si, and Ti in No. 6 coal, indicating that most Cu ions occur in the adsorbed form of aluminosilicate minerals. Furthermore, the parent rock debris and Cu-bearing minerals such as biotite, were observed by microscope (Figure 14), are the carriers of Cu in coal, may be another kind of the occurrences for Cu in coal.
Except for samples 6-2 and 6-10, the Pb content was lower than 25 μg/g in No. 6 coal, and only 13 μg/g in sample 6-13. The correlation coefficient between Cu and Pb was 0.6, indicating that partial Pb probably has the same occurrence as Cu, e.g., organic state, aluminosilicate adsorption state and heavy metal compounds. In samples 6-2 and 6-10, Fe and Ca contents were slightly lower, Al and Si contents were higher, and the Pb content was also distinctly higher, meaning that Pb in No. 6 coal mainly occurs in the form of aluminosilicate adsorption, followed by metal compounds, and organic complexes.
Compared to No. 6 coal, No. 4 coal was not enriched in Cu, with an average of 33 μg/g, but was enriched in Pb with an average of 42 μg/g, and its content was much lower than most parts of Southwest China and the Leping coalfield of Jiangxi [20,21,22,23], and by contrast, much higher than some other parts of China (Table 2). Cu and Pb contents were high in 4-1 and 4-4. As shown in Table 2, only Si and Al contents were higher and had a similar change tendency with Cu content in the section, and Cu was distinctly related to Ad% and Kalium (Table 3). The results show that the Cu in No. 4 coal probably mainly occurs in the form of aluminosilicate adsorption. In addition, Cu-bearing minerals, observed by microscope, and sulfide, which had a slight positive correlation with Cu, were the carriers of Cu, but the organic Cu content was limited. Different from Cu, Pb had the highest content in sample 4-r, but the content variation and correlation characteristics of the Pb, Al, Si, K elements and Ad% (Table 3) in all the lower layers were the same as Cu, indicating that Pb mainly occurs in the form of aluminosilicate adsorption. Pyrite was observed in the top and bottom layers of coal, and the test results also showed that Pb content in 4-1 was higher than the other layers (Table 2), confirming that Pb tends to occur in sulfide. However, the analysis of sulfur in No. 4 coal showed that sulfide content was not stable, and the organic sulfur content in the samples 4-2 to 4-7 layer was, conversely, more stable (Table 1). To summarize, Pb in No. 4 coal could have a higher correlation coefficient with organic sulfur, meaning the likelihood of occurrence in organic complexes is greater, and these results could be used to explain the high sulfide sulfur content but and lowest Pb content in 4-7.
6. Conclusions
The Cu content in each coal layer in the south of the Jungar coalfield is between 12 and 69 μg/g. The No. 6 coal from the Taiyuan formation is characterized by relatively enriched Cu, 55 μg/g on average, which is distributed uniformly in a vertical direction, compared with depleted Cu, at 33 μg/g on average, in the No. 4 coal from the Shanxi formation. The Pb content in each coal seam is between 13 and 58 μg/g, which are both enriched in the No. 6 and No. 4 coal, at 20 μg/g and 42 μg/g, respectively, on average, but are vertically unevenly distributed.
In the No. 6 coal, Cu mainly exists in the form of organic complexes, adsorption state of aluminosilicate minerals, and copper-bearing minerals, and Pb in No. 6 coal mainly exists in the form of the adsorption state of aluminosilicate minerals, sulfides, and organic complexes. In No. 4 coal, Cu mainly occurs in the form of the adsorption state of aluminosilicate minerals, copper-bearing minerals, sulfides, and a small number of organic complexes. Pb mainly occurs in the form of the adsorption state of aluminosilicate minerals, organic complexes, and sulfides.
Primary and epigenetic sedimentary environments and the supply and lithology of terrigenous rocks are the main influencing factors of the occurrence forms and enrichment causes of Cu and Pb in coal. Under the same terrigenous rock conditions, the influence of the depositional environment on Cu was more obvious than on Pb. On the contrary, terrigenous rock has a greater influence on Pb than Cu under a similar depositional environment.
Acknowledgments
This research was supported by the National Basic Research Program of China (No.2014CB238901); National Natural Science Foundation of China (NSFC, No. 41372164); National Key Research and Development Program of China (No. 2017YFB0603101); Natural Science Foundation of Shanxi Province, China (No. 201601D0211138).
Author Contributions
Anchao Zhou and Dongna Liu collected the samples and data; Dongna Liu conceived and designed the experiments; Yu Zou performed the experiments; Dongna Liu analyzed the data and prepared the draft with Yu Zou. Fenghua Zhao and Fangui Zeng revised the paper and provided some contributions to the data interpretation, and funding for this work.
Conflicts of Interest
The authors declare no conflict of interest.
References
- Wang, T.H.; Huang, W.H.; Yan, D.Y.; Tang, X.Y. Progress of research on mineralization mode of large coal-Ge deposits in China: Coal-Ge deposit in Wulantuga of Inner Mongolia and Lincang of Yunan. Earth Sci. Front. 2016, 23, 113–123. (In Chinese) [Google Scholar]
- Dai, S.F.; Chekryzhov, I.Y.; Seredin, V.V.; Nechaev, V.P.; Graham, I.T.; Hower, J.C.; Ward, C.R.; Ren, D.Y.; Wang, X.B. Metalliferous coal deposits in East Asia (Primorye of Russia and South China): A review of geodynamic controls and styles of mineralization. Gondwana Res. 2016, 29, 60–82. [Google Scholar] [CrossRef]
- Dai, S.F.; Liu, J.J.; Ward, C.R.; Hower, J.C.; Xie, P.P.; Jiang, Y.F.; Hood, M.M.; O’Keefe, J.M.K.; Song, H.J. Petrological, geochemical, and mineralogical compositions of the low-Ge coals from the Shengli coalfield, China: A comparative study with Ge-rich coals and a formation model for coal-hosted Ge ore deposit. Ore Geol. Rev. 2015, 71, 318–349. [Google Scholar] [CrossRef]
- Dai, S.F.; Liu, J.J.; Ward, C.R.; Hower, J.C.; French, D.; Jia, S.H.; Hood, M.M.; Garrison, T.M. Mineralogical and geochemical compositions of Late Permian coals and host rocks from the Guxu coalfield, Sichuan Province, China, with emphasis on enrichment of rare metals. Int. J. Coal Geol. 2016, 166, 71–95. [Google Scholar] [CrossRef]
- Hower, J.C.; Groppo, J.; Henke, K.; Hood, M.; Eble, C.; Honaker, R.; Qian, D. Notes on the potential for the concentration of rare earth elements and Yttrium in coal combustion fly ash. Minerals 2015, 5, 356–366. [Google Scholar] [CrossRef]
- Marshall, C.; Large, D.J.; Meredith, W.; Snape, C.E.; Uguna, C.; Spiro, B.F.; Orheim, A.; Jochmann, M.; Mokogwu, I.; Wang, Y.; et al. Geochemistry and petrology of Palaeocene coals from Spitsbergen—Part 1: Oil potential and depositional environment. Int. J. Coal Geol. 2015, 143, 22–33. [Google Scholar] [CrossRef]
- Dai, S.F.; Yang, J.Y.; Ward, C.R.; Hower, J.C.; Liu, H.D.; Garrison, T.M.; French, D.; O’Keefe, J.M.K. Geochemical and mineralogical evidence for a coal-hosted uranium deposit in the Yili Basin, Xinjiang, northwestern China. Ore Geol. Rev. 2015, 70, 1–30. [Google Scholar] [CrossRef]
- Dai, S.F.; Hower, J.C.; Ward, C.R.; Guo, W.; Song, H.J.; O’Keefe, J.M.K.; Xie, P.P.; Hood, M.M.; Yan, X.Y. Elements and phosphorus minerals in the middle Jurassic inertinite-rich coals of the Muli coalfield on the Tibetan Plateau. Int. J. Coal Geol. 2015, 144–145, 23–47. [Google Scholar] [CrossRef]
- Dai, S.; Seredin, V.; Ward, C.R.; Hower, J.C.; Xing, R.; Zhang, J.; Wang, Y. Enrichment of U–Se–Mo–Re–V in coals preserved within marine carbonate successions: Geochemical and mineralogical data from the Late Permian Guiding coalfield, Guizhou, China. Miner. Depos. 2015, 50, 159–186. [Google Scholar] [CrossRef]
- Sun, Y.Z.; Zhao, C.L.; Li, Y.H.; Wang, J.X. Minimum mining grade of the selected trace elements in Chinese coal. J. China Coal Soc. 2014, 39, 744–748. (In Chinese) [Google Scholar] [CrossRef]
- Dai, S.F.; Wang, X.B.; Seredin, V.V.; Hower, J.C.; Ward, C.R.; O’Keefe, J.M.K.; Huang, W.H.; Li, T.; Li, X.; Liu, H.D.; et al. Petrology, mineralogy, and geochemistry of the Ge-rich coal from the Wulantuga Ge ore deposit, Inner Mongolia, China: New data and genetic implications. Int. J. Coal Geol. 2012, 90–91, 72–99. [Google Scholar] [CrossRef]
- Tang, Y.G.; Chang, C.X.; Zhang, Y.Z. Migration and distribution of fifteen toxic trace elements during the coal washing of the Kailuan Coalfield, Hebei Province. Geochemical 2005, 4, 366–372. (In Chinese) [Google Scholar] [CrossRef]
- Song, D.Y.; Zhang, X.K.; Zhang, J.Y.; Zheng, C.G. Migration characteristics of hazardous trace elements in coal in the process of floatation. J. China Coal Soc. 2010, 7, 1170–1176. (In Chinese) [Google Scholar]
- Wang, W.F.; Qin, Y.; Song, D.Y. Study on the mobility and release of trace elements in coal-fired power plant. Acta Sci. Circumst. 2003, 23, 748–752. (In Chinese) [Google Scholar]
- Huang, J.M.; Zhang, J.Y.; Tian, C.; Zhang, S.B.; Zhao, Y.C.; Zheng, Y.C. Investigation on the transfer-transformation behavior of beryllium during coal combustion. J. Fuel Chem. Technol. 2016, 44, 648–653. (In Chinese) [Google Scholar]
- Yang, J.Y. Re-exploration on the law of trace elements migration during the pyrolysis of coal. J. China Coal Soc. 2013, 38, 2227–2233. (In Chinese) [Google Scholar]
- Swaine, D.J.; Fari, G. Environmental Aspects of Trace Elements in Coal, 1st ed.; Springer: Dordrecht, The Netherlands, 1995; pp. 5–23. ISBN 90-481-4606-2. [Google Scholar]
- Zhao, F.H.; Ren, D.Y.; Zhang, J.Y.; Dai, S.F. Recent advance of study on hazards in coal and significance for environment protection. Coalmine Environ. Prot. 1998, 2, 20–23. (In Chinese) [Google Scholar]
- Tang, Y.G.; Zhang, H.Y.; Dai, S.F.; Yang, X.H.; Chen, D.Y. Geochemical characteristics of lead in coal. Coal Geol. Explor. 2001, 2, 7–10. (In Chinese) [Google Scholar]
- Wu, Y.Y.; Qin, Y.; Yi, T.S.; Xia, X.H. Enrichment and geochemical origin of some trace elements in high-sulfur coal from Kaili, eastern Guizhou Province. Geochemica 2008, 37, 615–622. (In Chinese) [Google Scholar]
- Yang, X.Y.; Liu, X.Z.; Du, X.; Wang, Y.H. Distribution of heavy metal element of coal powder in Jiangxi. Environ. Sci. Technol. 2009, 32, 115–117. (In Chinese) [Google Scholar]
- Zhu, C.S.; Li, D.H. Occurrences of trace elements in the No. 2 coal of the Changhebian coal mine, Chongqing, China. Bull. Miner. Petrol. Chem. 2009, 28, 259–263. (In Chinese) [Google Scholar]
- Cheng, W.; Yang, R.D.; Zhang, Q.; Cui, Y.C.; Gao, J.B. Distribution characteristics, occurrence modes and controlling factors of trace elements in Late Permian coal from Bijie City, Guizhou Province. J. China Coal Soc. 2013, 38, 103–113. (In Chinese) [Google Scholar] [CrossRef]
- Li, Y.B.; Trush, M.; Yager, J. DNA damage caused by reactive oxygen species originating from a copper-dependent oxidation of the 2-hydroxy catechol of estradiol. Carcinogenesis 1994, 15, 1421–1427. [Google Scholar] [CrossRef] [PubMed]
- Gordon, S.; John, M.H. Endothelial cell injury due to copper-catalyzed hydrogen peroxide generation from homocysteine. J. Clin. Investig. 1986, 77, 1370–1376. [Google Scholar] [CrossRef]
- Cornell University, Pesticide Information Profile for Copper Sulfate (May 1994). Available online: http://pmep.cce.cornell.edu/profiles/extoxnet/carbaryl-dicrotophos/copper-sulfate-ext.html (accessed on 10 July 2008).
- Brewer, G.J. Copper excess, zinc deficiency, and cognition loss in Alzheimer’s disease. Biofactors (Oxf. Engl.) 2012, 38, 107–113. [Google Scholar] [CrossRef] [PubMed] [Green Version]
- Marx, J. Possible Role for Environmental Copper in Alzheimer’s Disease. Science 2003, 301, 905. [Google Scholar] [CrossRef] [PubMed]
- Swaine, D.J. Why trace elements are important. Fuel Process. Technol. 2000, 65–66, 21–33. [Google Scholar] [CrossRef]
- Ketris, M.P.; Yudovich, Y.E. Estimations of Clarkes for carbonaceous biolithes: World average for trace element contents in black shales and coals. Int. J. Coal Geol. 2009, 78, 135–148. [Google Scholar] [CrossRef]
- Gayer, R.A.; Rose, M.; Dehmer, J.; Shao, L.-Y. Impact of sulphur and trace elements geochemistry on the utilization of a marine-influenced coal-case study from the South Wales Variscan foreland basin. Int. J. Coal Geol. 1999, 40, 151–174. [Google Scholar] [CrossRef]
- Dai, S.F.; Ren, D.Y.; Liu, J.R.; Li, S.S. Occurrence and distribution of minor toxic elements in coals of Fengfeng coalfield, Heibei Province, North China. J. China Univ. Min. Technol. 2003, 4, 20–24. (In Chinese) [Google Scholar]
- Dai, S.F.; Ren, D.Y.; Chou, C.L.; Finkelman, R.B.; Seredin, V.V.; Zhou, Y. Geochemistry of trace elements in Chinese coals: A review of abundances, genetic types, impacts on human health, and industrial utilization. Int. J. Coal Geol. 2012, 94, 3–21. [Google Scholar] [CrossRef]
- Zhuang, X.G.; Gong, J.Q.; Wang, Z.Q.; Zeng, R.S.; Xu, W.D. Trace elements of the Late Permian coal in the Shuicheng and Liuzhi coal fields, Guizhou. Geol. Sci. Technol. Inf. 2001, 20, 53–58. (In Chinese) [Google Scholar]
- Ren, D.Y.; Xu, D.W.; Zhang, J.Y.; Zhao, F.H. Distribution of associated elements in coals from Shenbei coalfield. J. China Univ. Min. Technol. 1999, 28, 12–15. (In Chinese) [Google Scholar]
- Spears, D.A. Role of seawater on the trace element geochemistry of some UK coals and a tribute to Goldschmidt. Minerals 2017, 7, 300–314. [Google Scholar] [CrossRef]
- Dai, S.F.; Ren, D.Y.; Shao, L.Y.; Zhao, M.J. Variation of coal geochemistry and special textures of late Permian coals in the western Guizhou province and their volcanic origin. Geochemica 2003, 3, 239–247. (In Chinese) [Google Scholar]
- Dai, S.F.; Li, D.; Chou, C.L.; Zhao, L.; Zhang, Y.; Ren, D.Y.; Ma, Y.W.; Sun, Y.Y. Mineralogy and geochemistry of boehmite-rich coals: New insights from the Haerwusu Surface Mine, Jungar Coalfield, Inner Mongolia, China. Int. J. Coal Geol. 2008, 74, 185–202. [Google Scholar] [CrossRef]
- Dai, S.F.; Ren, D.Y.; Chou, C.L.; Li, S.S.; Jiang, Y.F. Mineralogy and geochemistry of the No. 6 coal (Pennsylvanian) in the Jungar coalfield, Ordos Basin, China. Int. J. Coal Geol. 2006, 66, 253–270. [Google Scholar] [CrossRef]
- Wang, W.F.; Qin, Y.; Liu, X.H.; Zhao, J.L.; Wang, J.Y.; Wu, G.D.; Liu, J.T. Distribution, occurrence and enrichment causes of gallium in coals from the Jungar coalfield, Inner Mongolia. Sci. China Earth Sci. 2011, 41, 181–196. (In Chinese) [Google Scholar] [CrossRef]
- Lin, M.Y.; Chu, G.C.; Zhao, B.; Zhao, S.S.; Zhou, J.F.; Liu, B.J.; Shi, J. The coal petrology and trace element character for the No. 6 coal of Haerwusu coal mine. J. Jilin Univ. (Earth Sci. Ed.) 2015, 45, 1008. (In Chinese) [Google Scholar]
- Zhang, Y.H.; Wang, X.M.; Liu, D.N. Geochemical characteristics and geological significance of coal seam parting, roof and floor rare earth element in Southwestern Jungar Coalfield. China Coal Geol. 2014, 25, 13–16, 32. (In Chinese) [Google Scholar] [CrossRef]
- International Organization for Standardization. Methods for the Petrographic Analysis of Coals. Method of Determining Microscopically the Reflectance of Vitrinite; International Organization for Standardization: Geneva, Switzerland, 2009; ISBN 978-0-580-56505-2. [Google Scholar]
- International Committee for Coal and Organic Petrology (ICCP). The new vitrinite classification (ICCP System 1994). Fuel 1998, 77, 349–358. [Google Scholar]
- International Committee for Coal and Organic Petrology (ICCP). The new inertinite classification (ICCP System 1994). Fuel 2001, 80, 459–471. [Google Scholar]
- Dai, S.F.; Wang, X.B.; Zhou, Y.P.; Hower, J.C.; Li, D.H.; Chen, W.M.; Zhu, X.W.; Zou, J.H. Chemical and mineralogical compositions of silicic, mafic, and alkali tonsteins in the late Permian coals from the Songzao Coalfield, Chongqing, Southwest China. Chem. Geol. 2011, 282, 29–44. [Google Scholar] [CrossRef]
- Seredin, V.V.; Dai, S.F. Coal deposits as potential alternative sources for lanthanides and yttrium. Int. J. Coal Geol. 2012, 94, 67–93. [Google Scholar] [CrossRef]
- Taylor, S.R.; McLennan, S.M. The Continental Crust: Its Composition and Evolution, 1st ed.; Blackwell: London, UK, 1985; p. 312. ISBN 90-481-4606-2. [Google Scholar]
- Li, H.; Chen, Y.Q.; Gui, G.F. Study of some environmental signification trace elements in coals from Bijie. J. Bijie Univ. 2009, 27, 77–79. (In Chinese) [Google Scholar]
- Wang, D.L.; Zhang, Y.H. Jurassic Tariqik Formation coal geochemical characteristics in Kuqa-Bay coalfield, Xinjiang. Coal Geol. China 2012, 24, 6–9. (In Chinese) [Google Scholar]
- Yang, L.; Liu, C.Y.; Li, H.Y. Geochemistry of trace elements and rare earth elements of coal in Chenjiashan coal mine. Coal Geology and Exploration 2008, 36, 10–14. (In Chinese) [Google Scholar]
- Lu, X.W.; Ge, K.L.; Wang, L.Z.; Wang, W.Y. The content of trace elements of coals in Weibei area, Shaanxi Province. J. Jilin Univ. (Earth Sci. Ed.) 2003, 2, 178–182. (In Chinese) [Google Scholar] [CrossRef]
- Pang, Q.F.; Zhuang, X.G.; Li, J.F.; Fu, L.M.; Gang, T.M.E.; Xu, Y. Petrographical, chemical and geochemical characteristics of Jurassic coal in Western Chaoshui basin, Inner Mongolia. Geol. Sci. Technol. Inf. 2012, 31, 27–32. (In Chinese) [Google Scholar]
- Zou, J.H.; Liu, D.; Tian, H.M.; Liu, F.; Li, T.; Yang, H.Y. Geochemistry of trace and rare earth elements in the Late Paleozoic coal from Adaohai mine, Inner Mongolia. J. China Coal Soc. 2013, 38, 1012–1018. (In Chinese) [Google Scholar] [CrossRef]
- Yang, M.D. Coal Mine Geology, 1st ed.; Coal Industry Press: Beijing, China, 2000; p. 159. ISBN 75-02-0191-03. (In Chinese) [Google Scholar]
Figure 1.
The Jungar coalfield mine distribution map and the Huangyuchuan mine geology map.

Figure 2.
The coal seam column section. The left column map reproduced with permission from Wang et al. [40], published by Springer International Publishing AG, 2011.
Figure 2.
The coal seam column section. The left column map reproduced with permission from Wang et al. [40], published by Springer International Publishing AG, 2011.
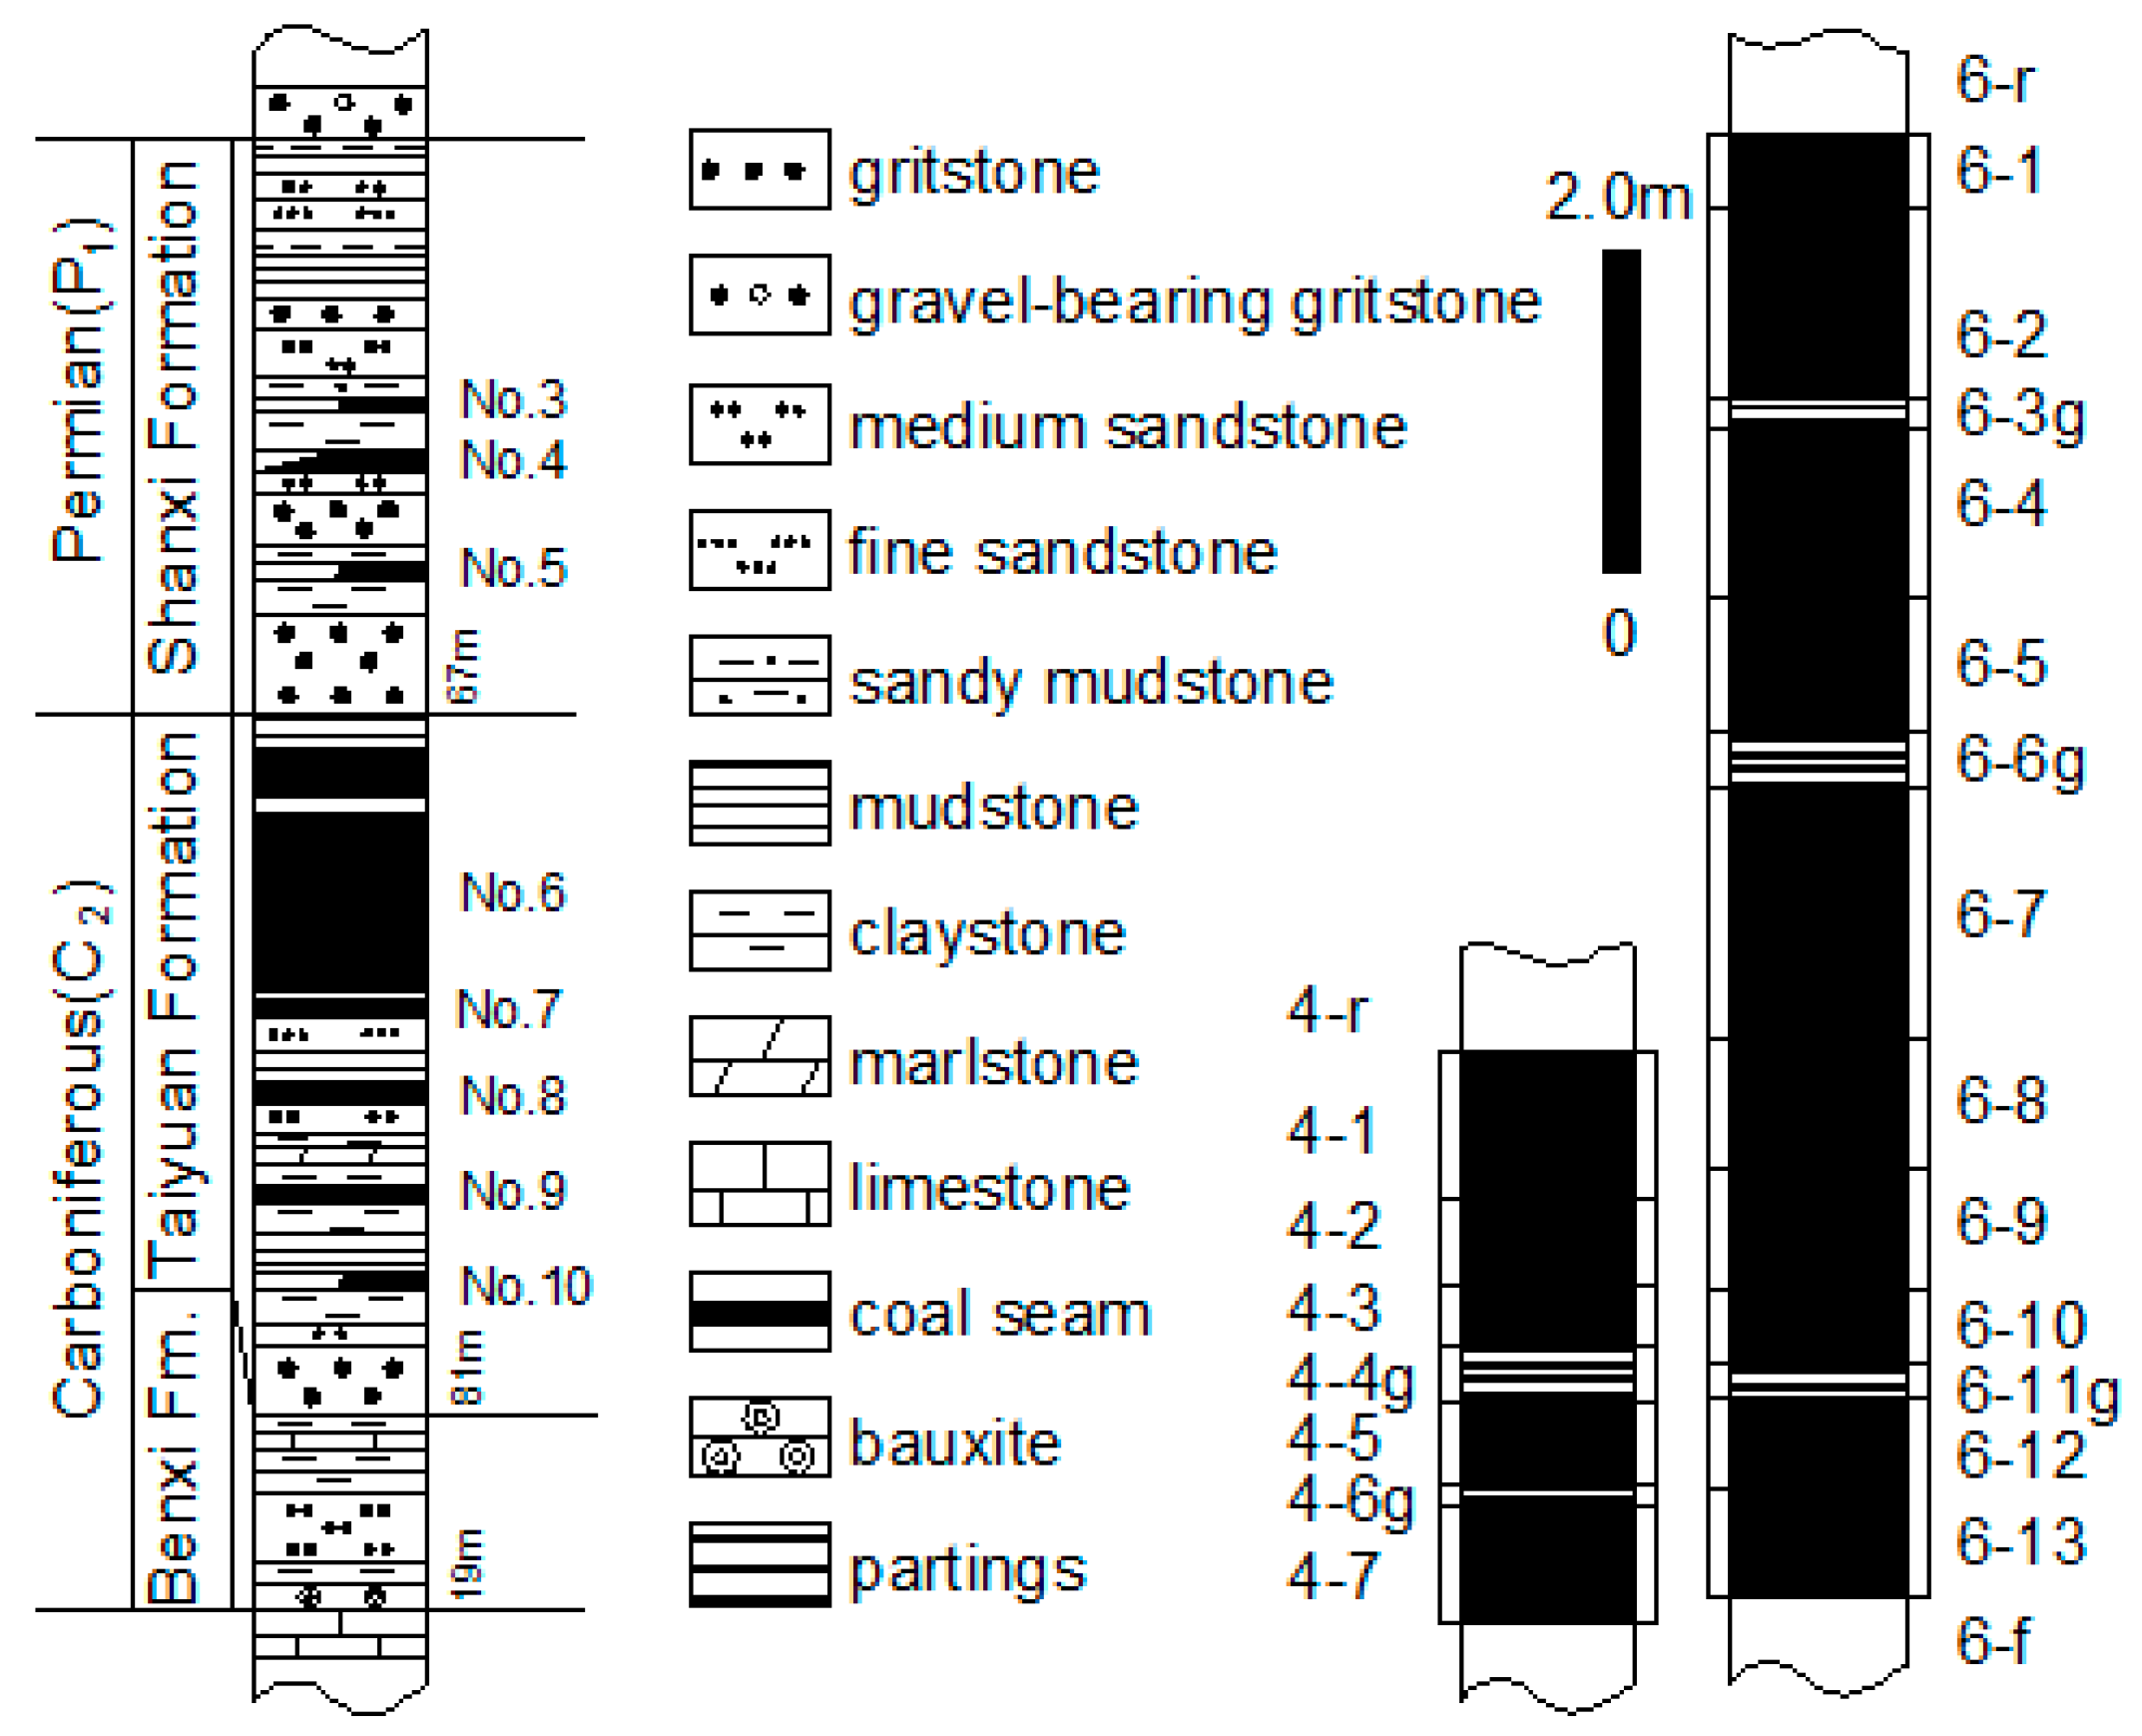
Figure 3.
Inertinite macerals in coal under optical microscope with reflected white light and immersed in oil: (a) fuginite (Fu), sample 6-8, (b) fusinite, sample 4-2, (c) fusinite and inertodetrinite (Id), sample 4-1, and (d) fusinite with cell structure, sample 6-10.
Figure 3.
Inertinite macerals in coal under optical microscope with reflected white light and immersed in oil: (a) fuginite (Fu), sample 6-8, (b) fusinite, sample 4-2, (c) fusinite and inertodetrinite (Id), sample 4-1, and (d) fusinite with cell structure, sample 6-10.

Figure 4.
Vitrinite and liptinite in the Jungar coal under an optical microscope with reflected white light and immersed in oil immersion: (a) collotelinite (C), sample 4-2, (b) collodetrinite (Cd), sample 6-2, (c) corpogelinite (Cg), sample 6-10, (d) funginite (Fu), and sporinite (Sp), sample 4-3, (e) sporinite (Sp), sample 6-3, (f) cutinite (Cu) and some liptinite macerals in sample 6-10.

Figure 5.
The content variation in major elements in the section column for No. 4 and No. 6 coal.
Figure 6.
Concentration coefficients of trace elements in the Jungar coals vs. world low-rank coal. Data for trace elements in world low-rank coal were obtained from Ketris and Yudovich [30].
Figure 6.
Concentration coefficients of trace elements in the Jungar coals vs. world low-rank coal. Data for trace elements in world low-rank coal were obtained from Ketris and Yudovich [30].
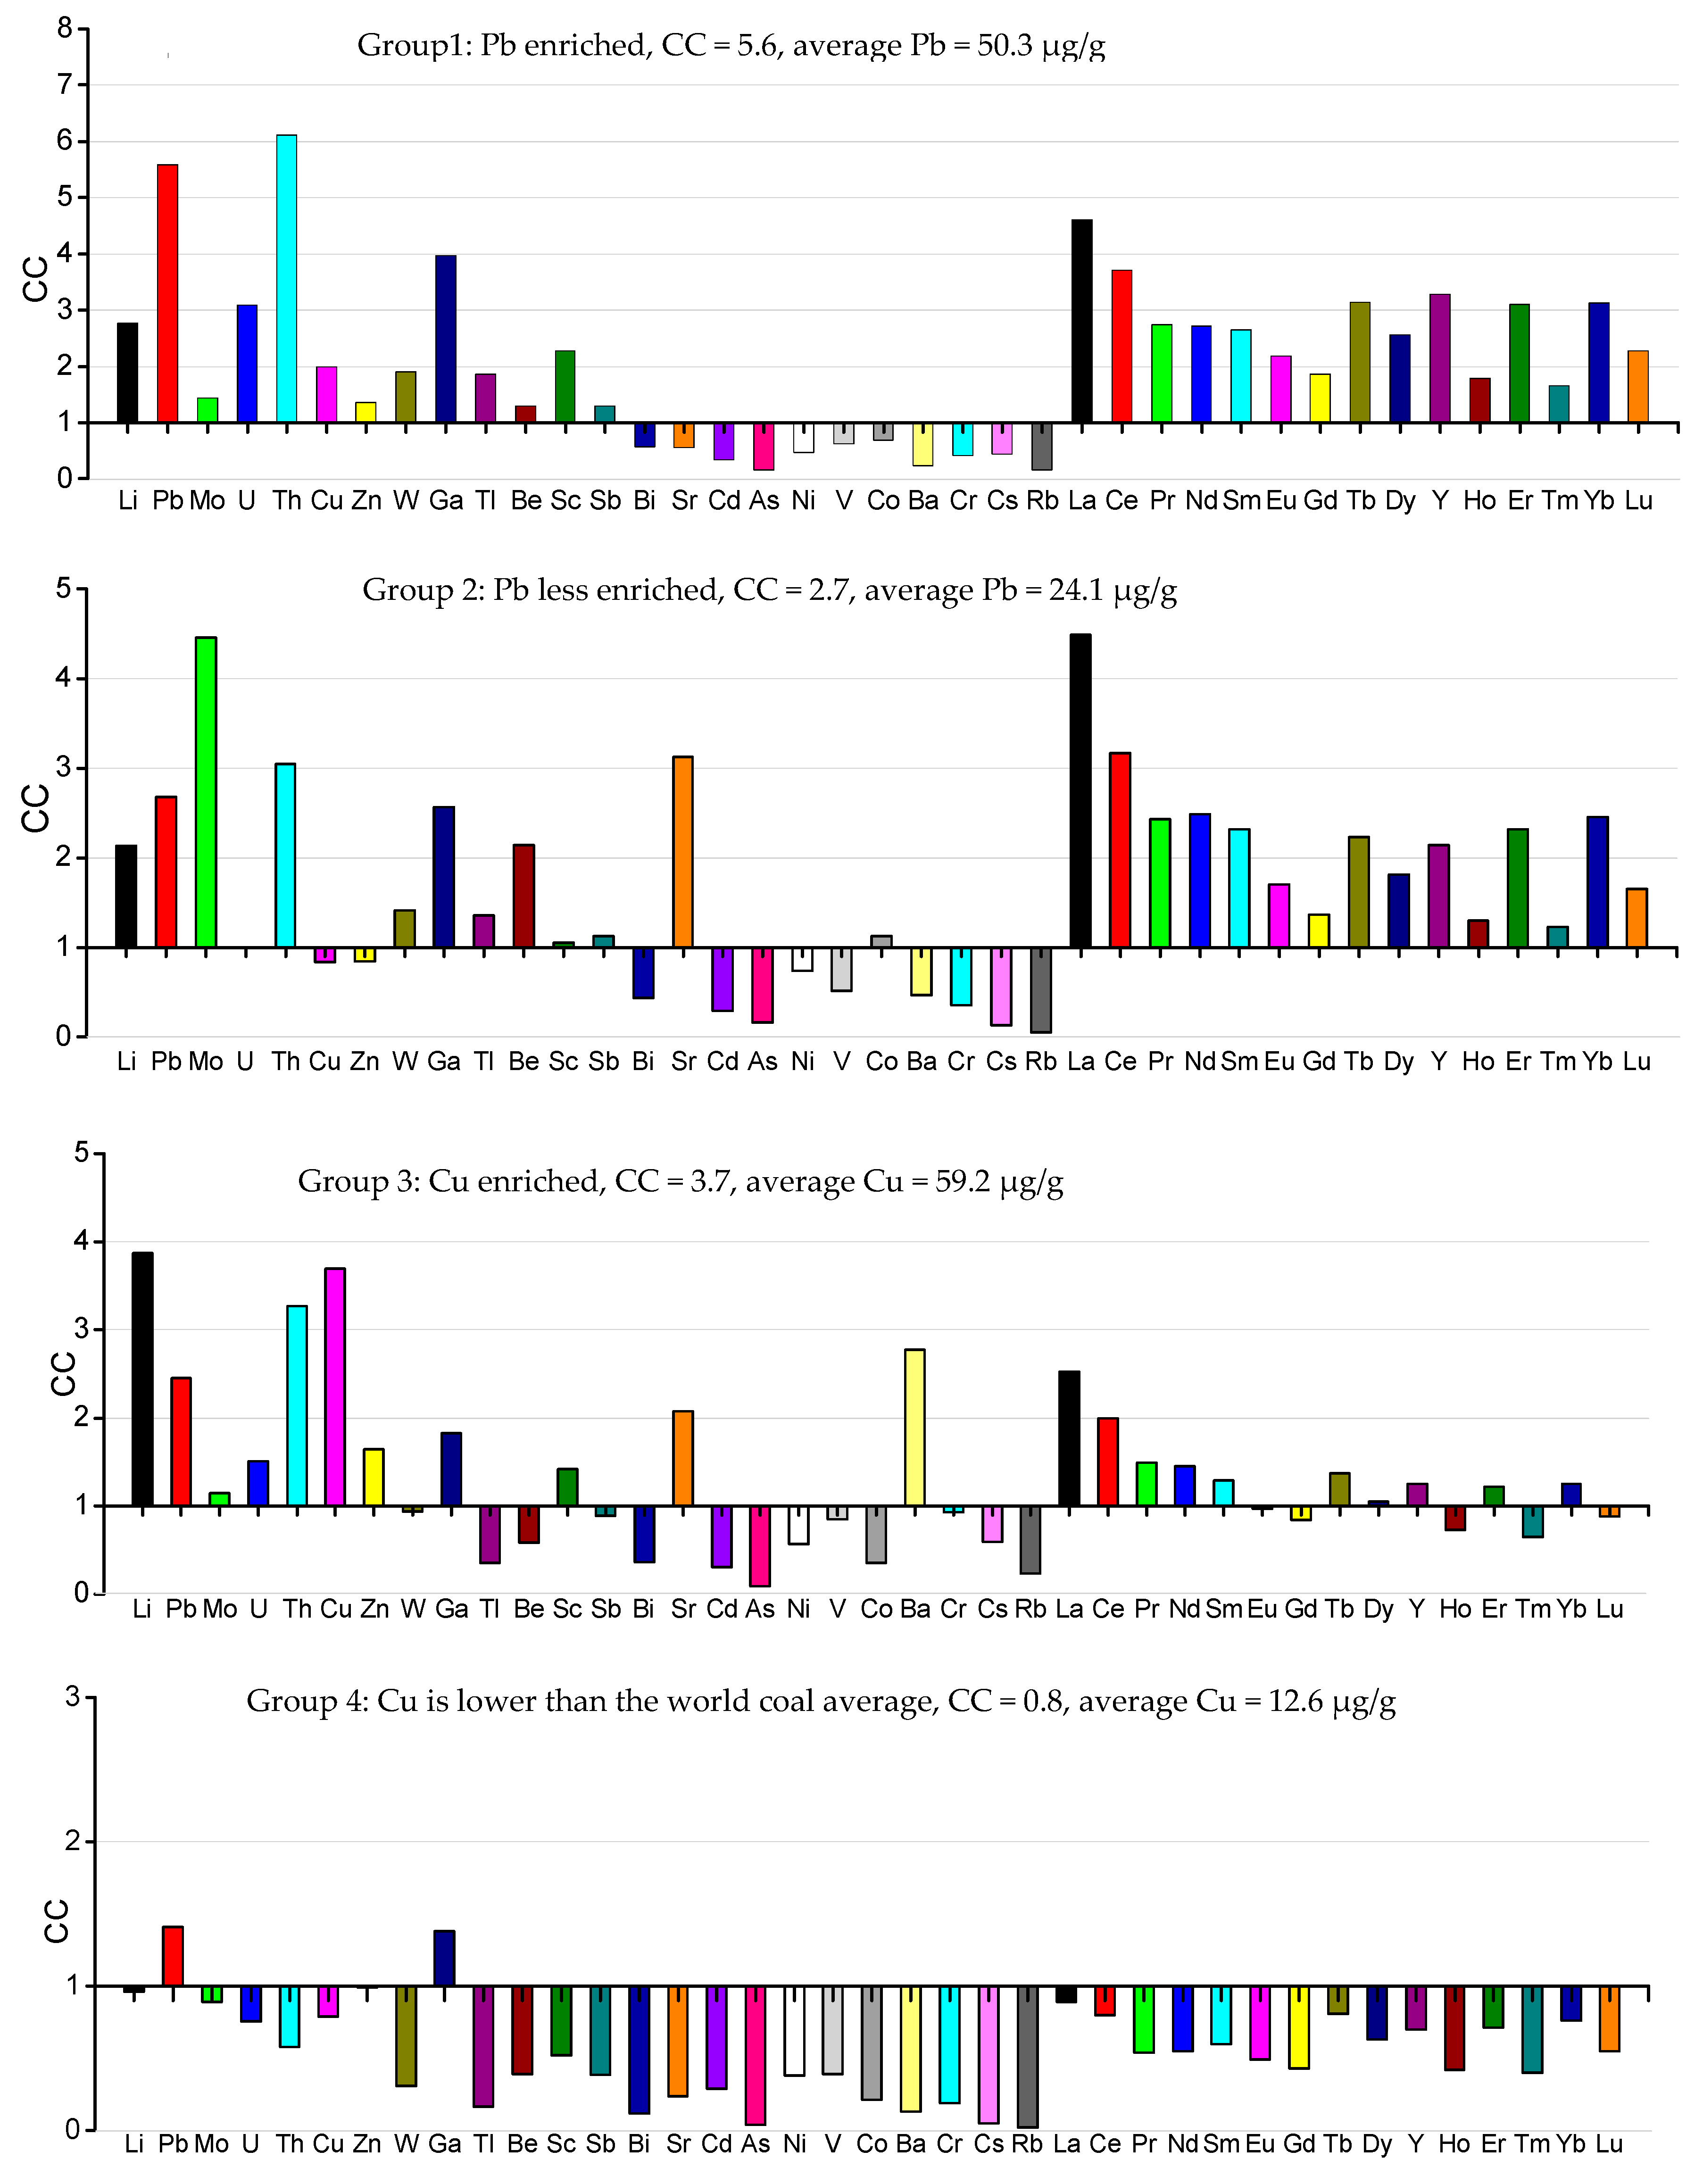
Figure 7.
Variations of ash yield, total sulfur, Cu, U, Th, Pb, Ga in the coal beds of No. 4 and No. 6 coal.
Figure 7.
Variations of ash yield, total sulfur, Cu, U, Th, Pb, Ga in the coal beds of No. 4 and No. 6 coal.
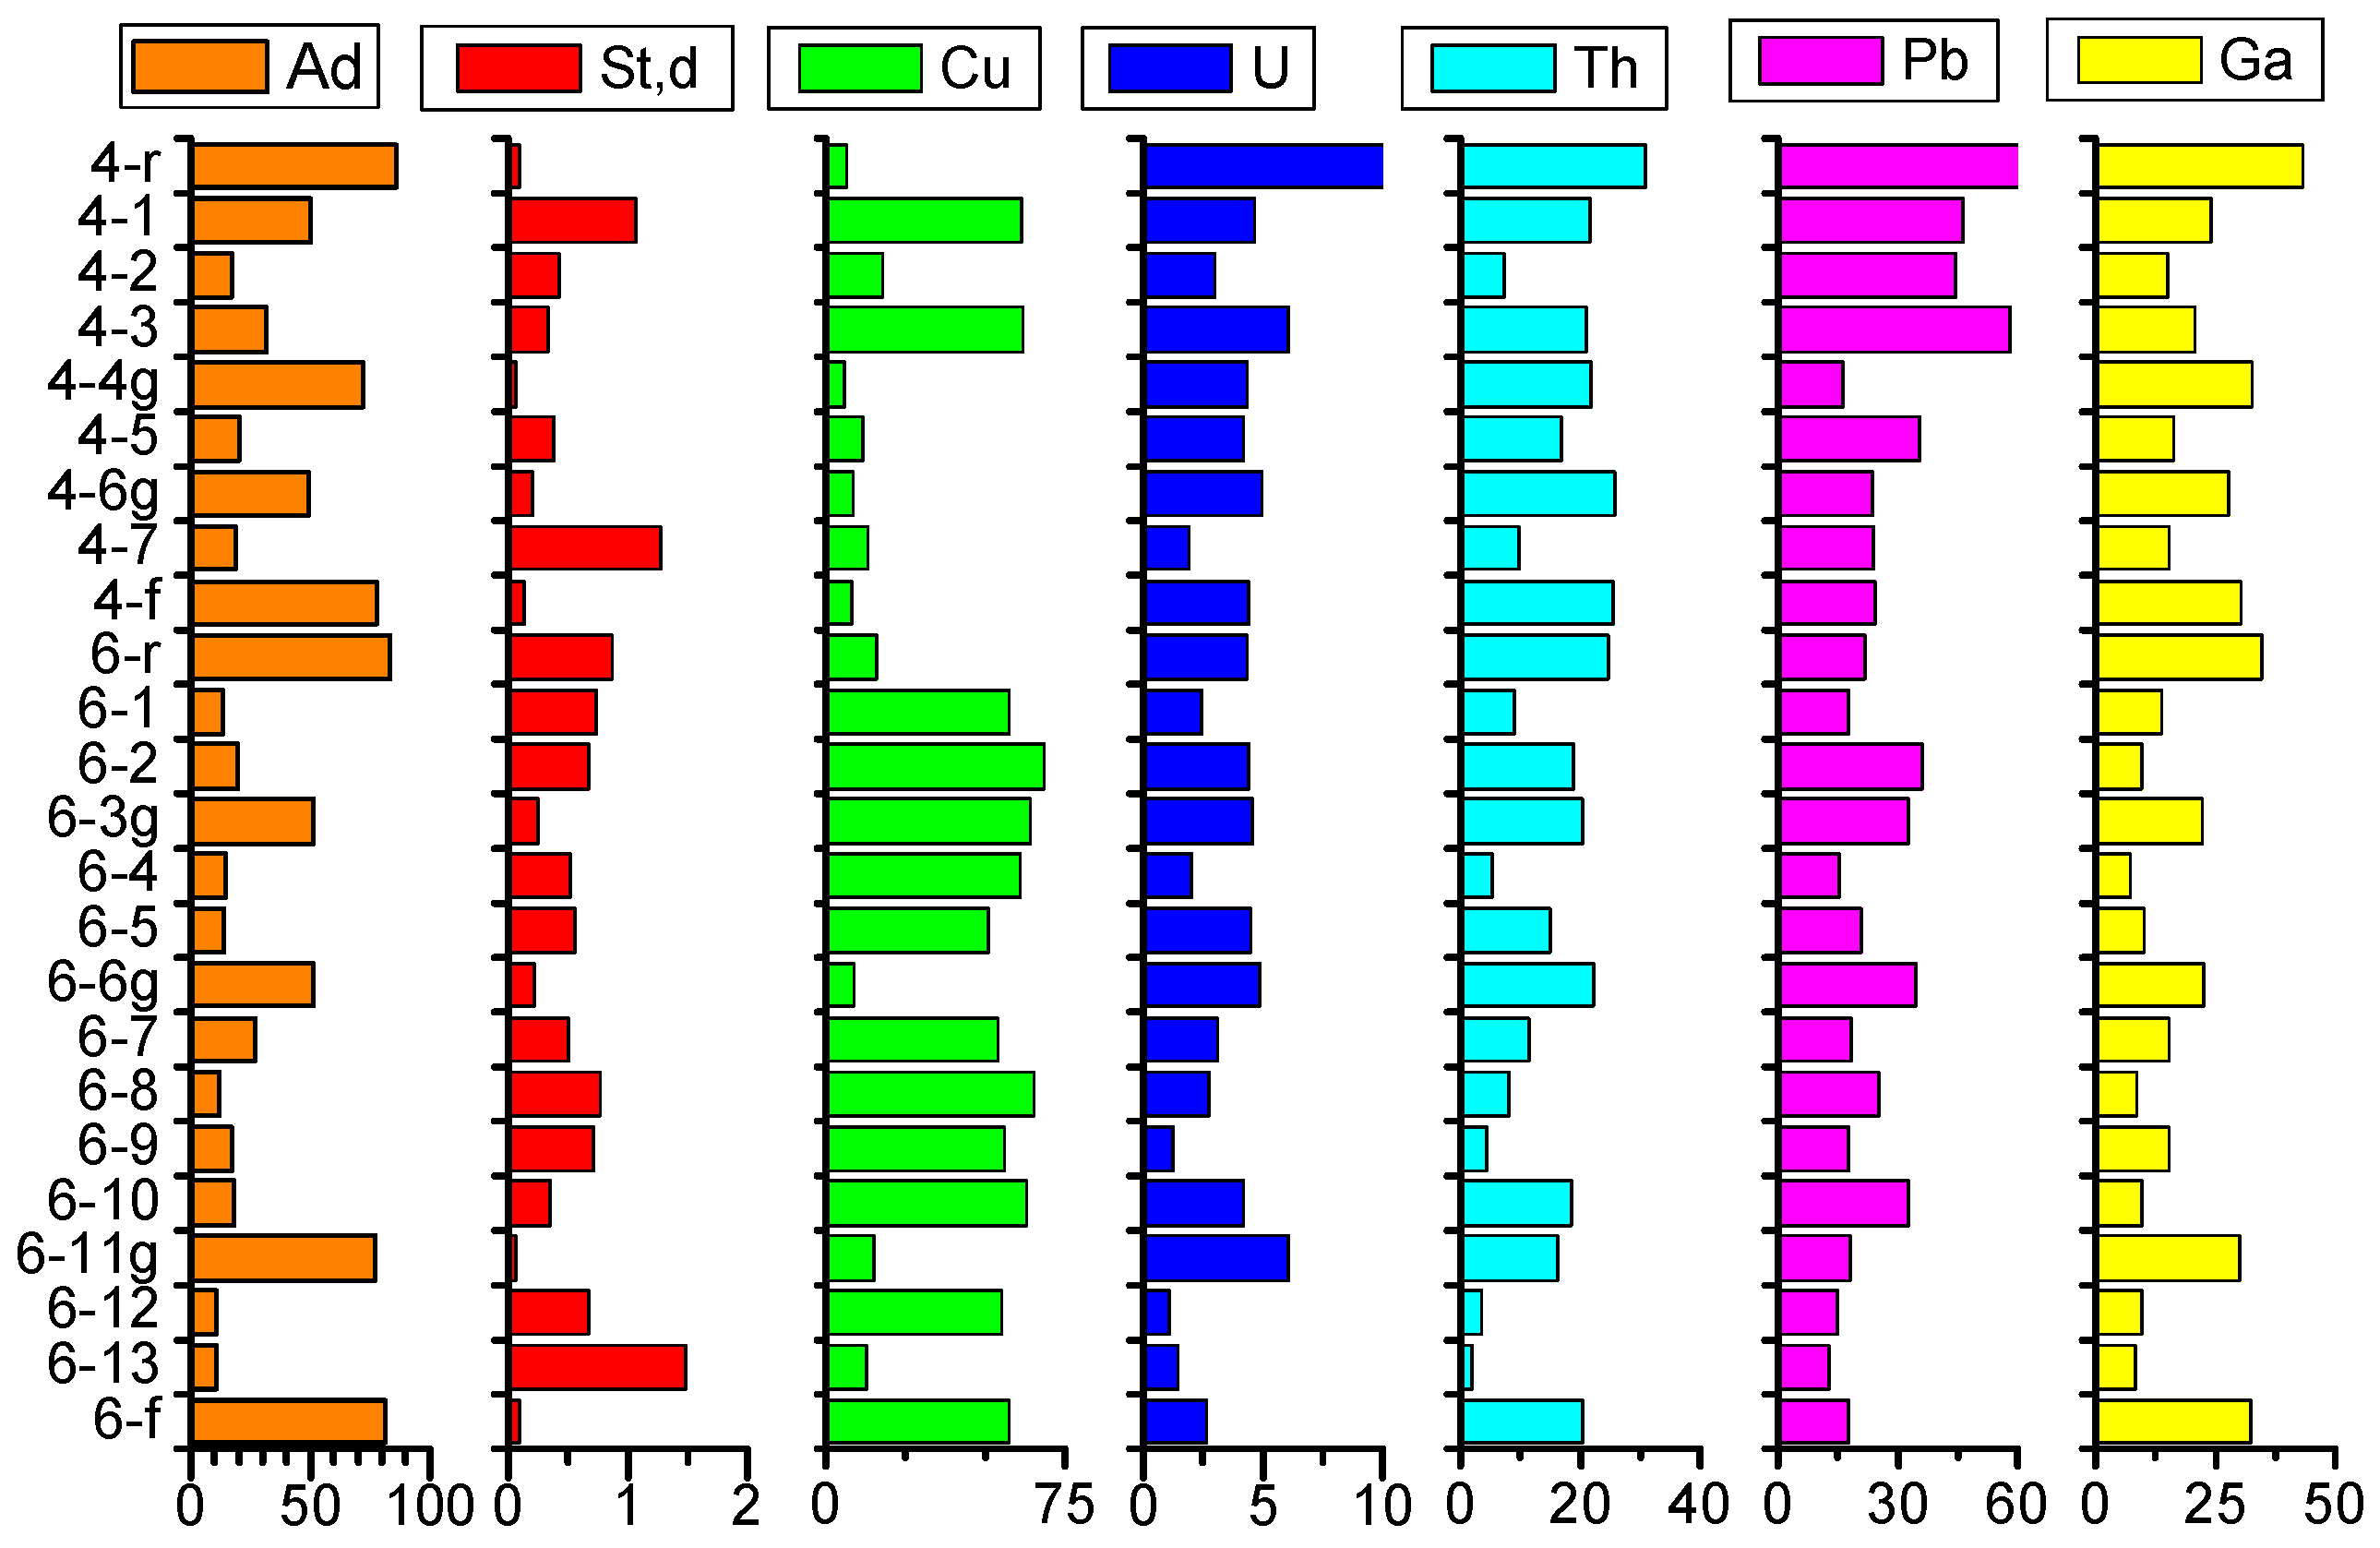
Figure 8.
Rare earth and yttrium (REY) distribution patterns in the coal benches and the roof, floor, and parting strata of coal beds. REY plots were normalized by Upper Continental Crust (UCC) [48]. For coal bench samples: (a) L-type; (b) M-type; (c) H-type; For roof, floor and parting samples; (d) L-type; (e) M-type; (f) H-type.

Figure 9.
The coal petrography characteristics for No. 4 and No. 6 coal: (a) thin-film calcite; (b) framboidal pyrite in 6-3; (c) cell-filling clay minerals in 4-2, reflected light 10 × 50; (d) cell-filling clay minerals in 6-3, reflected light 10 × 50; (e) framboidal pyrite in 6-3, reflected light 10 × 50; (f) vein pyrite in 6-10, reflected light 10 × 50; (g) cell-filling pyrite, quartz, and clay minerals in 6-2, reflected light 10 × 50; (h) vermicular clay minerals and quartz in 4-6 g, plane-polarized light 10 × 10; and (i) vermicular clay minerals and quartz in 4-6 g, crossed-polarized light 10 × 10.

Figure 10.
The X-ray diffraction (XRD) map for No. 4 and No. 6 coal samples.
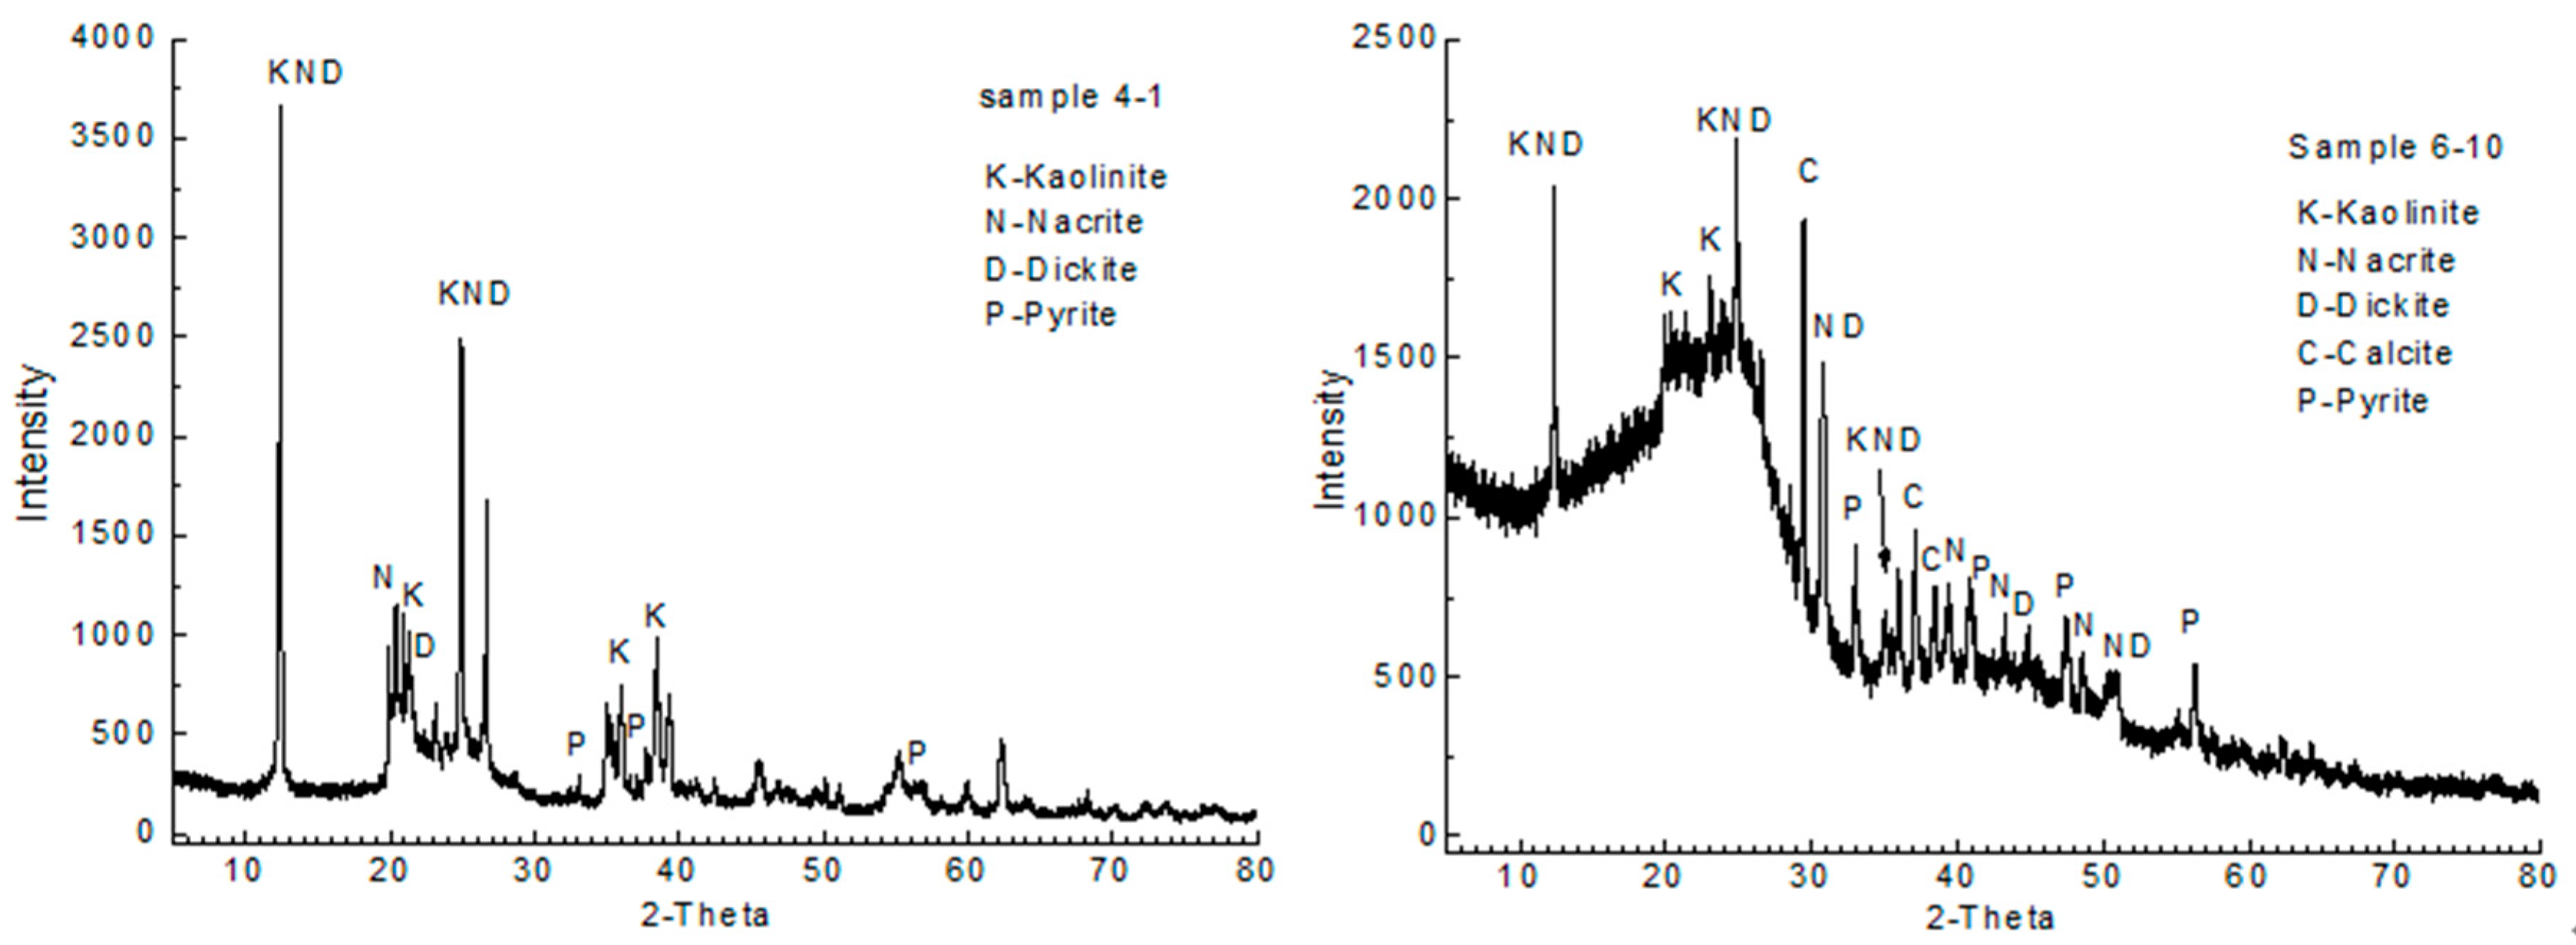
Figure 11.
The SEM-EDX analysis for No. 4 and No. 6 coal samples.

Figure 12.
The content contrast for Cu and Pb form different mine of Jungar coalfield, and other coals. HYC4/6—Huangyuchuan No. 4/6 coal, HDG6—Heidaigou No. 6 coal, HEWS6—Haerwusu No. 6 coal, CHC—Chinese coal [33], USC—Unit States Coal [33], HC—Hard coal [30], BC—Brown coal [30].

Figure 13.
The Permo-Carboniferous coalfield map in northern China. Reproduced with permission from Yang et al. [55], published by Coal Industry Press, 2000.
Figure 13.
The Permo-Carboniferous coalfield map in northern China. Reproduced with permission from Yang et al. [55], published by Coal Industry Press, 2000.
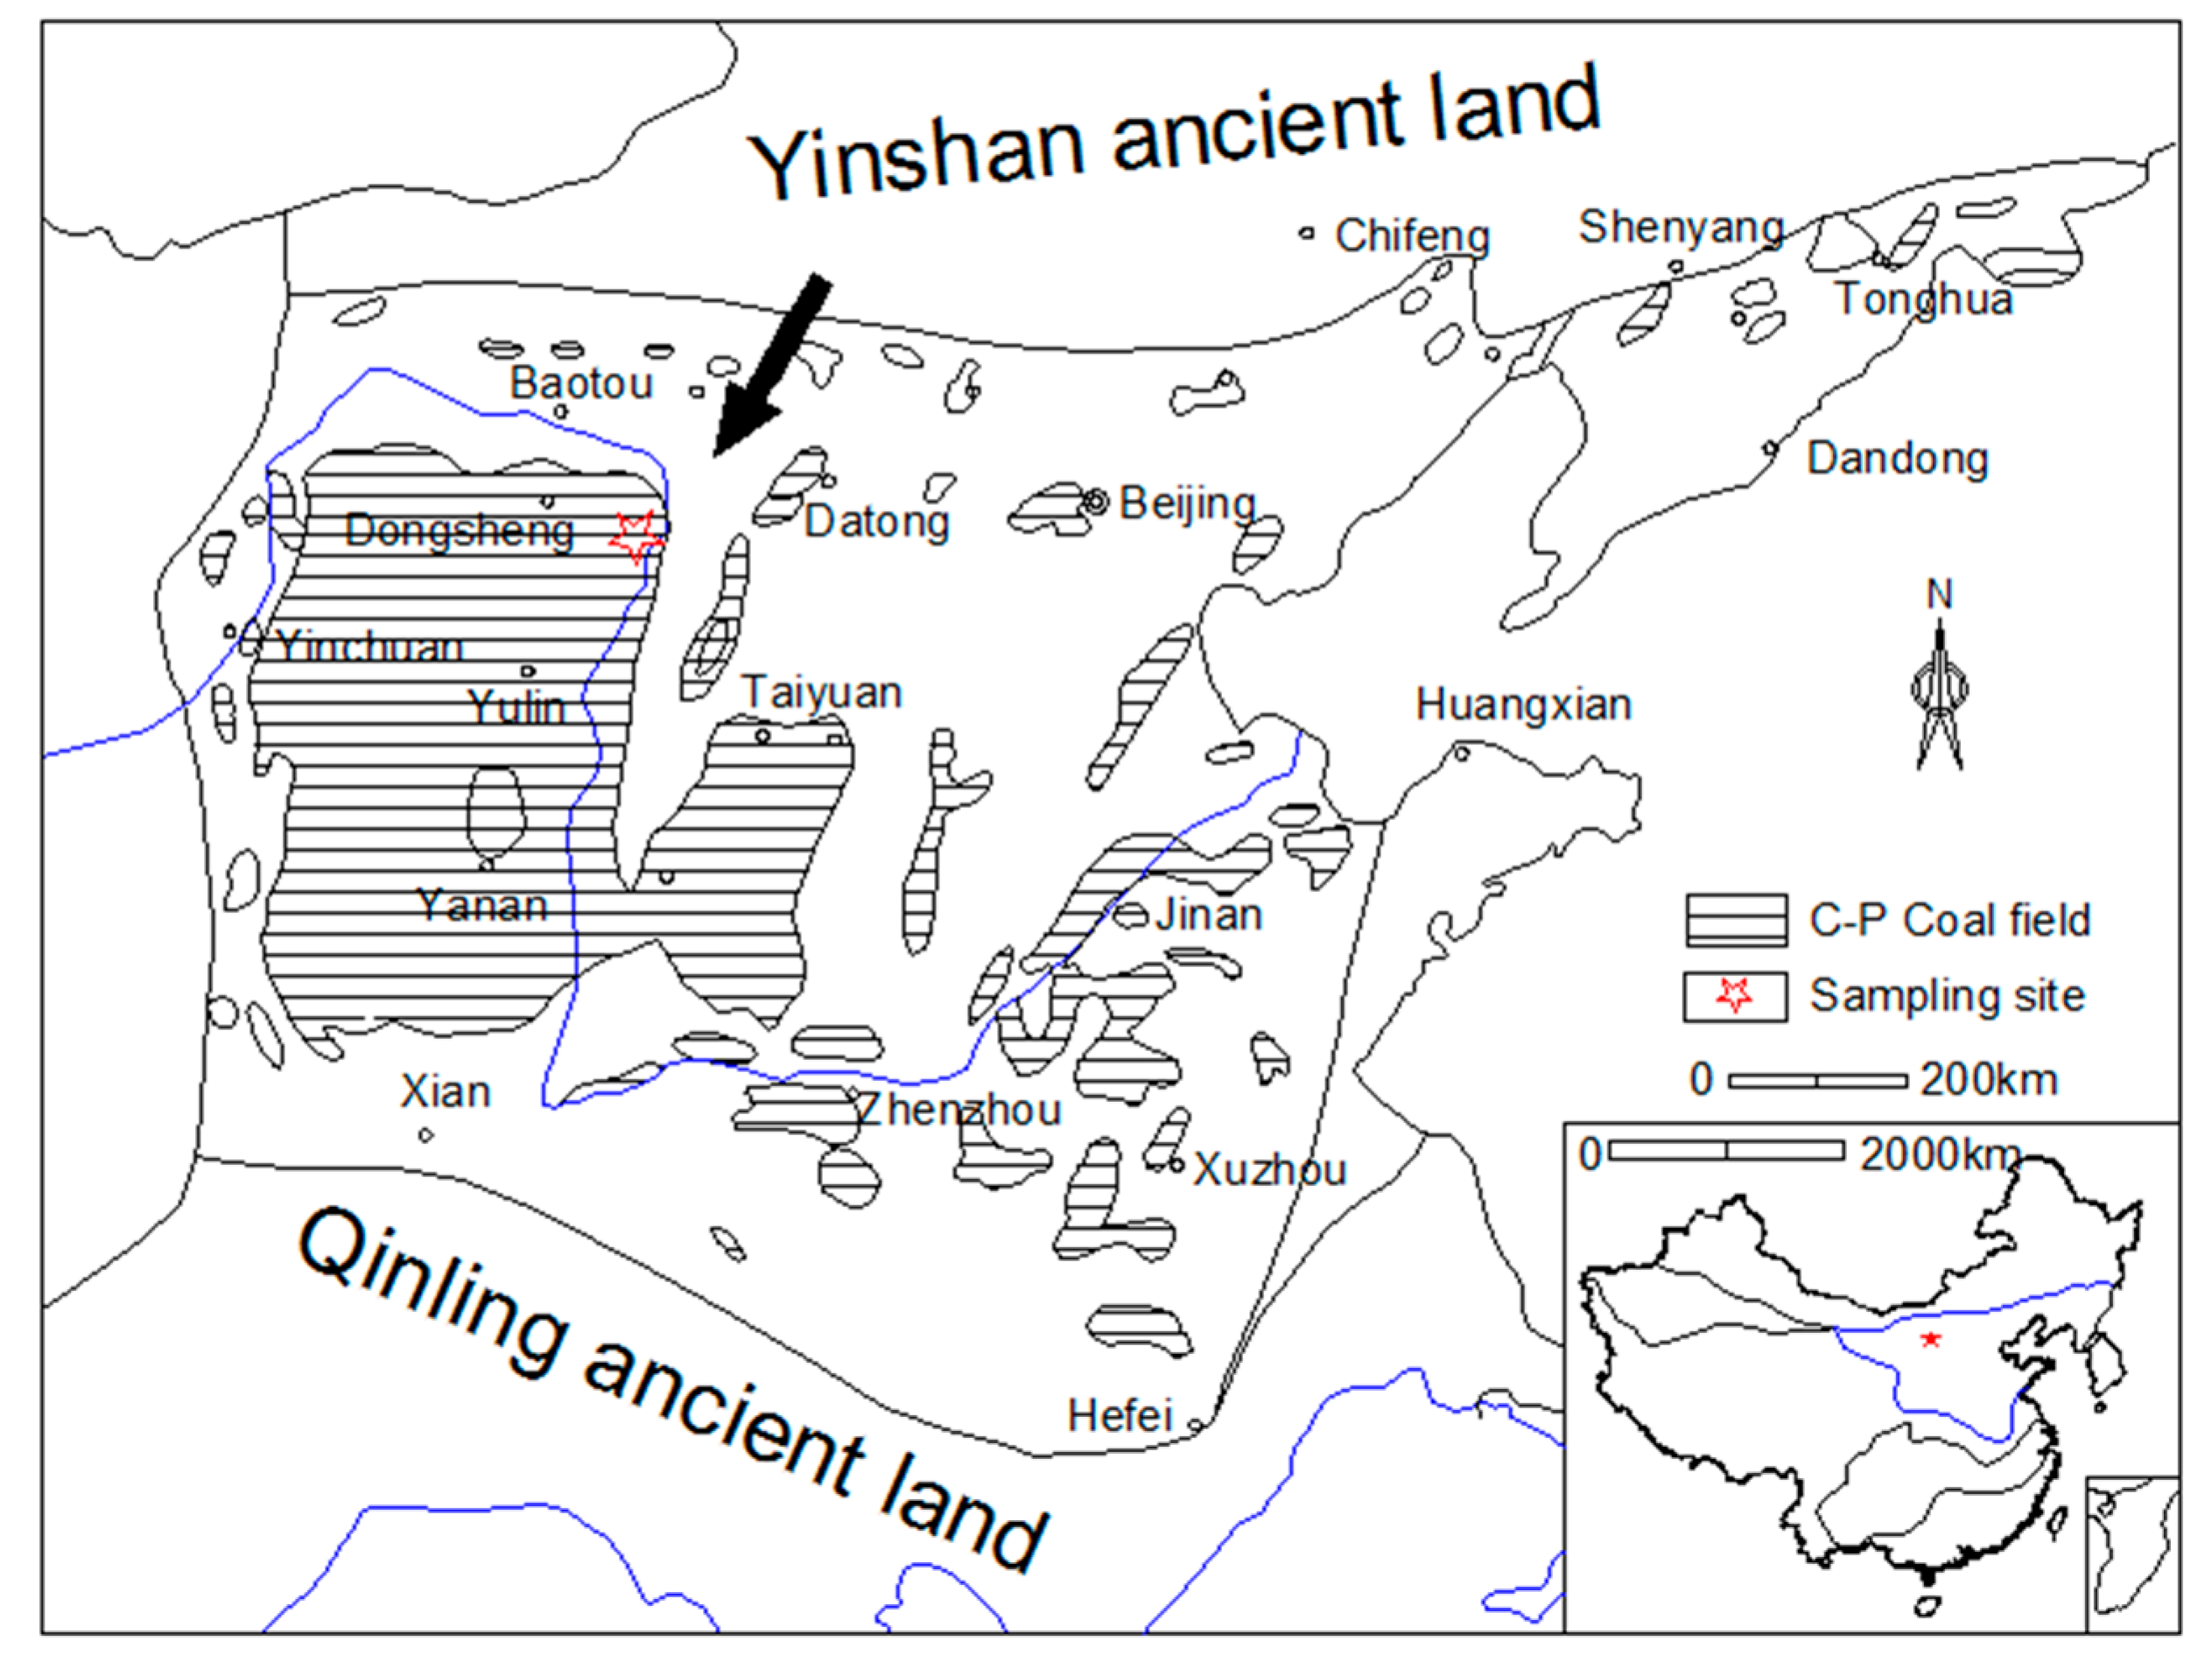
Figure 14.
The mineral for rock slice of the roof of the No. 6 coal seam by polarizing microscope (10 × 10).
Figure 14.
The mineral for rock slice of the roof of the No. 6 coal seam by polarizing microscope (10 × 10).

Table 1.
Proximate and ultimate analysis (%) and maceral contents and random reflectance determined under optical microscope for coal from the Jungar Basin (vol %; on mineral-free basis).
Table 1.
Proximate and ultimate analysis (%) and maceral contents and random reflectance determined under optical microscope for coal from the Jungar Basin (vol %; on mineral-free basis).
| Sample | Mad | Ad | Vdaf | Fc,d | St,d | Sp,d | So,d | Ss,d | Vitrinite | Inertinite | Liptinite | Rr |
|---|---|---|---|---|---|---|---|---|---|---|---|---|
| 4-r | 0.92 | 86.14 | 13.81 | 0.05 | 0.1 | nd | nd | nd | nd | nd | nd | nd |
| 4-1 | 2.42 | 50.41 | 40.83 | 29.34 | 1.07 | 0.94 | 0.13 | 0 | 25.00 | 71.81 | 3.19 | nd |
| 4-2 | 4.18 | 17.47 | 38.37 | 50.87 | 0.42 | 0.14 | 0.28 | 0 | 50.00 | 47.09 | 2.91 | 0.58 |
| 4-3 | 4.45 | 31.92 | 38.88 | 41.61 | 0.33 | 0.07 | 0.26 | 0 | 29.03 | 68.71 | 2.26 | nd |
| 4-4 g | 1.94 | 72.36 | 15.89 | 11.75 | 0.06 | nd | nd | nd | nd | nd | nd | nd |
| 4-5 | 4.82 | 20.17 | 37.8 | 49.65 | 0.38 | 0.06 | 0.32 | 0 | 49.83 | 49.49 | 0.68 | nd |
| 4-6 g | 3.32 | 49.13 | 20.89 | 29.98 | 0.21 | nd | nd | nd | nd | nd | nd | nd |
| 4-7 | 4.32 | 18.79 | 34.92 | 52.85 | 1.28 | 0.97 | 0.30 | 0.01 | 46.80 | 52.10 | 1.10 | nd |
| 4-f | 1.71 | 77.82 | 16.27 | 5.91 | 0.14 | nd | nd | nd | nd | nd | nd | nd |
| Avg. Coal | 4.04 | 27.75 | 38.2 | 44.87 | 0.70 | 0.44 | 0.26 | 0 | 40.11 | 57.83 | 2.06 | nd |
| 6-r | 0.94 | 83.71 | 12.17 | 4.12 | 0.87 | nd | nd | nd | nd | nd | nd | nd |
| 6-1 | 3.86 | 13.52 | 36.9 | 54.57 | 0.74 | 0.28 | 0.46 | 0 | 65.14 | 24.77 | 10.09 | nd |
| 6-2 | 3.38 | 19.71 | 36.79 | 50.76 | 0.67 | 0.31 | 0.35 | 0 | 69.01 | 22.26 | 8.73 | nd |
| 6-3 g | 2.88 | 51.44 | 21.99 | 26.57 | 0.25 | nd | nd | nd | nd | nd | nd | nd |
| 6-4 | 4.16 | 14.38 | 39.36 | 51.92 | 0.52 | 0.13 | 0.39 | 0 | 61.41 | 30.43 | 8.16 | nd |
| 6-5 | 4.38 | 14.08 | 41.35 | 50.4 | 0.56 | 0.1 | 0.46 | 0 | 58.98 | 29.16 | 11.86 | nd |
| 6-6 g | 2.38 | 51.28 | 21.61 | 27.11 | 0.22 | nd | nd | nd | nd | nd | nd | nd |
| 6-7 | 3.28 | 26.84 | 38.68 | 44.86 | 0.51 | 0.12 | 0.39 | 0 | 53.13 | 33.75 | 13.13 | nd |
| 6-8 | 4.28 | 12.1 | 36.65 | 55.68 | 0.77 | 0.29 | 0.47 | 0.01 | 60.36 | 27.25 | 12.39 | nd |
| 6-9 | 3.83 | 17.06 | 40.4 | 49.43 | 0.71 | 0.21 | 0.5 | 0 | 64.58 | 24.67 | 10.75 | nd |
| 6-10 | 3.55 | 18.06 | 32.24 | 54.91 | 0.35 | 0.02 | 0.33 | 0 | 64.24 | 23.02 | 12.74 | 0.59 |
| 6-11 g | 1.56 | 77.45 | 15.62 | 6.93 | 0.06 | nd | nd | nd | nd | nd | nd | nd |
| 6-12 | 4.69 | 10.79 | 38.46 | 54.87 | 0.67 | 0.2 | 0.47 | 0 | 75.08 | 17.25 | 7.68 | nd |
| 6-13 | 3.96 | 11.22 | 38.19 | 52.29 | 1.48 | 1.02 | 0.44 | 0.02 | 68.94 | 20.08 | 10.97 | nd |
| 6-f | 1.14 | 81.21 | 13.29 | 5.5 | 0.09 | nd | nd | nd | nd | nd | nd | nd |
| Avg. Coal | 3.94 | 15.78 | 37.90 | 51.97 | 0.70 | 0.27 | 0.43 | 0.00 | 64.13 | 25.22 | 10.65 | nd |
Notes: Mad—moisture (ash dry basis), Ad—ash (dry basis), Vdaf—volatile (dry ash free), St,d—sulfur (total, dry), Sp,d—sulfur (pyrite, dry), So,d—sulfur (organic, dry), Ss,d—sulfur (sulfate, dry).
Table 2.
The major and trace element contents in the No. 4 and No. 6 coal samples.
| Sample | SiO2 | Al2O3 | Fe2O3 | MgO | CaO | K2O | MnO | TiO2 | P2O5 | LOI | C | Si/Al | Sb | Li | Bi | Pb | Mo | U | Th | Cu | Zn | W | Ga | Sr | Cd | |
| 4-r | 45.86 | 38.06 | 0.253 | 0.019 | 0.139 | 0.089 | <0.004 | 0.616 | 0.032 | 14.84 | 0.005 | 2.05 | 0.381 | 35.7 | 0.959 | 66.6 | 0.613 | 11.4 | 31 | 6.46 | 69.8 | 3.21 | 43.2 | 17 | 0.186 | |
| 4-1 | 28.71 | 20.59 | 1.77 | 0.093 | 0.172 | 0.1 | <0.004 | 0.395 | 0.014 | 48.05 | 0.041 | 1.21 | 56.6 | 0.441 | 46.6 | 9.04 | 4.66 | 21.6 | 61.6 | 32.7 | 2.15 | 24.1 | 30.4 | 0.06 | ||
| 4-2 | 8.73 | 6.93 | 1.29 | 0.192 | 0.616 | 0.021 | 0.015 | 0.311 | 0.017 | 81.76 | 0.134 | 0.677 | 13 | 0.397 | 44.5 | 1.89 | 3.01 | 7.2 | 17.8 | 22.1 | 0.721 | 15 | 20.8 | 0.021 | ||
| 4-3 | 16.8 | 13.99 | 0.288 | 0.115 | 0.867 | 0.069 | 0.005 | 0.755 | 0.031 | 67.03 | 0.041 | 1.05 | 48.7 | 0.887 | 58.2 | 1.62 | 6.09 | 21.1 | 62 | 38.1 | 1.96 | 20.7 | 31.4 | 0.05 | ||
| 4-4g | 39.35 | 33.39 | 0.241 | 0.078 | 0.133 | 0.115 | <0.004 | 0.499 | 0.016 | 25.96 | 0.006 | 2.00 | 0.198 | 192 | 0.389 | 16.2 | 0.646 | 4.36 | 21.7 | 5.88 | 19.5 | 1.74 | 32.7 | 21.1 | 0.014 | |
| 4-5 | 10.26 | 8.55 | 0.435 | 0.115 | 0.723 | 0.026 | 0.007 | 0.367 | 0.077 | 79.37 | 0.068 | 3.13 | 39.2 | 0.481 | 35.4 | 1.93 | 4.17 | 16.9 | 11.6 | 28.3 | 1.37 | 16.2 | 179 | 0.021 | ||
| 4-6g | 27.37 | 22.96 | 0.315 | 0.096 | 0.209 | 0.075 | <0.004 | 0.677 | 0.051 | 47.82 | 0.012 | 2.02 | 0.576 | 115 | 0.907 | 23.7 | 1.03 | 4.98 | 25.7 | 8.45 | 16.2 | 2.86 | 27.6 | 26.4 | 0.016 | |
| 4-7 | 8.5 | 7.1 | 1.83 | 0.158 | 0.713 | 0.025 | 0.011 | 0.561 | 0.11 | 80.65 | 0.173 | 1.12 | 29.8 | 0.474 | 24.1 | 9.37 | 1.9 | 9.75 | 13.3 | 23.7 | 1.4 | 15.4 | 313 | 0.058 | ||
| 4-f | 40.11 | 34.86 | 0.487 | 0.046 | 0.207 | 0.081 | <0.004 | 0.906 | 0.03 | 23.25 | 0.010 | 1.95 | 0.235 | 237 | 0.353 | 24.2 | 0.652 | 4.42 | 25.6 | 8.07 | 30.8 | 1.64 | 30.2 | 23.7 | <0.002 | |
| Average | 14.60 | 11.43 | 1.123 | 0.135 | 0.618 | 0.048 | 0.0095 | 0.478 | 0.049 | 71.37 | 0.072 | 1.4374 | 37.46 | 0.536 | 41.76 | 4.77 | 3.966 | 15.31 | 33.26 | 28.98 | 1.5202 | 18.28 | 114.92 | 0.042 | ||
| 6-r | 52.42 | 26.69 | 1.82 | 0.149 | 0.118 | 0.462 | <0.004 | 1.22 | 0.035 | 16.96 | 0.026 | 3.33 | 0.27 | 101 | 0.156 | 21.8 | 2.08 | 4.36 | 24.6 | 16 | 65.9 | 1.81 | 34.7 | 42 | 0.078 | |
| 6-1 | 6.55 | 5.53 | 1.34 | 0.245 | 0.699 | 0.016 | 0.015 | 0.171 | 0.041 | 85.15 | 0.189 | 0.415 | 46.4 | 0.341 | 17.6 | 2.06 | 2.44 | 8.94 | 57.5 | 37.1 | 0.403 | 13.6 | 101 | 0.076 | ||
| 6-2 | 9.86 | 8.44 | 1.18 | 0.237 | 0.602 | 0.009 | 0.011 | 0.494 | 0.014 | 79.14 | 0.110 | 0.458 | 72.2 | 0.695 | 36.2 | 2.51 | 4.41 | 19 | 68.6 | 52.2 | 1.85 | 9.43 | 29.7 | 0.056 | ||
| 6-3g | 28.1 | 22.22 | 0.597 | 0.099 | 0.139 | 0.077 | 0.011 | 0.515 | 0.018 | 48.18 | 0.017 | 2.15 | 0.622 | 65 | 0.475 | 32.7 | 1.57 | 4.56 | 20.4 | 64.1 | 44.4 | 1.89 | 22.3 | 32.1 | 0.06 | |
| 6-4 | 5.54 | 4.58 | 1.56 | 0.667 | 2.41 | 0.006 | 0.025 | 0.117 | 0.013 | 84.79 | 0.458 | 0.268 | 40.1 | 0.192 | 15.1 | 2.85 | 2.01 | 5.07 | 61.3 | 112 | 0.687 | 7.29 | 26.4 | 0.087 | ||
| 6-5 | 6.84 | 5.7 | 0.779 | 0.365 | 0.824 | 0.009 | 0.012 | 0.11 | 0.01 | 85.06 | 0.157 | 0.326 | 34.3 | 0.18 | 20.8 | 2.8 | 4.54 | 14.9 | 51.1 | 36.9 | 0.496 | 10.2 | 26.7 | 0.054 | ||
| 6-6g | 28.14 | 22.33 | 0.15 | 0.087 | 0.114 | 0.081 | <0.004 | 0.53 | 0.02 | 48.52 | 0.007 | 2.14 | 0.481 | 65 | 0.465 | 34.4 | 1.43 | 4.87 | 22.2 | 8.78 | 19.2 | 2.05 | 22.6 | 27.8 | 0.021 | |
| 6-7 | 14.12 | 12.07 | 0.758 | 0.205 | 0.486 | 0.036 | 0.01 | 0.544 | 0.101 | 71.63 | 0.055 | 0.342 | 71.8 | 0.481 | 18.3 | 2.71 | 3.1 | 11.5 | 54.3 | 33.2 | 1.71 | 15.2 | 483 | 0.046 | ||
| 6-8 | 6.14 | 5.23 | 0.712 | 0.131 | 0.636 | 0.006 | 0.005 | 0.179 | 0.017 | 86.93 | 0.130 | 0.526 | 50.9 | 0.405 | 25.4 | 1.9 | 2.74 | 8.15 | 65.4 | 33 | 0.513 | 8.49 | 26.1 | 0.036 | ||
| 6-9 | 6.86 | 6.14 | 2.46 | 0.224 | 1.76 | 0.011 | 0.041 | 0.226 | 0.208 | 82 | 0.342 | 4.18 | 56.1 | 0.225 | 17.6 | 2.36 | 1.24 | 4.44 | 56.1 | 41.4 | 0.578 | 15.4 | 1111 | 0.093 | ||
| 6-10 | 10.31 | 8.8 | 0.36 | 0.116 | 0.251 | 0.022 | 0.008 | 0.472 | 0.022 | 79.5 | 0.038 | 0.389 | 77.5 | 0.842 | 32.6 | 1.77 | 4.2 | 18.5 | 63 | 32.9 | 1.6 | 9.59 | 30.7 | 0.043 | ||
| 6-11g | 40.36 | 34.83 | 0.156 | 0.03 | 0.132 | 0.096 | <0.004 | 1.21 | 0.018 | 22.91 | 0.004 | 1.97 | 0.357 | 196 | 1.06 | 18 | 3.41 | 6.09 | 16.2 | 15 | 21.2 | 7.09 | 30.1 | 43.9 | 0.004 | |
| 6-12 | 5.01 | 4.27 | 0.897 | 0.193 | 0.87 | 0.006 | 0.012 | 0.129 | 0.013 | 88.16 | 0.211 | 1.08 | 38.3 | 0.254 | 14.9 | 2.63 | 1.08 | 3.6 | 55.4 | 36.2 | 0.562 | 9.51 | 28.7 | 0.06 | ||
| 6-13 | 2.56 | 2.06 | 2.68 | 0.583 | 2.66 | 0.009 | 0.018 | 0.069 | 0.011 | 89.21 | 1.282 | 0.387 | 13.5 | 0.131 | 12.7 | 1.87 | 1.44 | 1.85 | 12.6 | 27.8 | 0.304 | 8.3 | 23.8 | 0.058 | ||
| 6-f | 52.8 | 26.59 | 0.592 | 0.164 | 0.123 | 0.443 | 0.01 | 1.06 | 0.031 | 18.14 | 0.011 | 3.37 | 0.87 | 109 | 0.169 | 17.8 | 1.49 | 2.68 | 20.3 | 57.7 | 75.3 | 1.74 | 32.3 | 46.8 | 0.146 | |
| Average | 7.38 | 6.28 | 1.273 | 0.297 | 1.120 | 0.013 | 0.0157 | 0.251 | 0.045 | 83.16 | 0.197 | 0.837 | 50.11 | 0.375 | 21.12 | 2.346 | 2.72 | 9.595 | 54.53 | 44.27 | 0.87 | 10.7 | 188.7 | 0.061 | ||
| World [31,32] | 8.47 | 5.98 | 4.85 | 0.22 | 1.23 | 0.19 | 0.015 | 0.33 | 0.092 | nd | nd | 1 | 14 | 1.1 | 9 | 2.1 | 1.9 | 3.2 | 16 | 28 | 0.99 | 6 | 100 | 0.2 | ||
| Sample | Be | As | Tl | Sc | Ni | V | Co | Ba | Cr | Cs | Rb | La | Ce | Pr | Nd | Sm | Eu | Gd | Tb | Dy | Y | Ho | Er | Tm | Yb | Lu |
| 4-r | 1.36 | 0.216 | 0.054 | 11.3 | 2.51 | 15 | 2.23 | 27.7 | 1.63 | 0.247 | 3.58 | 86.7 | 155 | 16.8 | 57.4 | 10.1 | 1.61 | 8.37 | 1.55 | 8.32 | 46.6 | 1.56 | 4.79 | 0.78 | 4.88 | 0.72 |
| 4-1 | 4.56 | 5.22 | 4.54 | 8.47 | 8.36 | 20.3 | 3.48 | 36.7 | 9.95 | 1.22 | 5.5 | 40.9 | 73 | 8.22 | 29.1 | 5.1 | 0.9 | 4.51 | 0.85 | 4.56 | 23.4 | 0.87 | 2.57 | 0.43 | 2.79 | 0.43 |
| 4-2 | 1.87 | 0.348 | 0.325 | 5.15 | 9.72 | 12.3 | 5.75 | 21.5 | 8.6 | 0.118 | 0.946 | 38.6 | 64.5 | 7.13 | 25.4 | 4.53 | 0.8 | 3.75 | 0.63 | 3.3 | 16.3 | 0.61 | 1.86 | 0.29 | 1.79 | 0.26 |
| 4-3 | 2.47 | 0.411 | 0.196 | 11 | 9.05 | 27.3 | 2.76 | 32.6 | 9.69 | 0.661 | 3.28 | 34.8 | 62.4 | 7.18 | 25.7 | 5.24 | 0.81 | 5.01 | 1.09 | 6.43 | 30.4 | 1.23 | 3.71 | 0.59 | 3.78 | 0.51 |
| 4-4g | 1.72 | 0.224 | 0.042 | 10.3 | 5.74 | 22.3 | 1.19 | 27.4 | 9.39 | 0.826 | 5.45 | 21.6 | 36.9 | 4.24 | 14.8 | 3.08 | 0.58 | 3.56 | 0.88 | 5.27 | 26.1 | 1.03 | 3.07 | 0.51 | 3.27 | 0.46 |
| 4-5 | 2.78 | 0.445 | 0.271 | 6.07 | 10.2 | 13.4 | 6.41 | 61.1 | 5.43 | 0.208 | 1.42 | 52.4 | 72.2 | 7.41 | 25.4 | 4.16 | 0.59 | 3.67 | 0.74 | 4.32 | 21.5 | 0.83 | 2.56 | 0.39 | 2.42 | 0.35 |
| 4-6g | 3.05 | 0.259 | 0.158 | 10.3 | 6.23 | 21.2 | 1.42 | 33.2 | 8.93 | 0.753 | 3.98 | 35.3 | 72.9 | 8.86 | 32.4 | 6.34 | 0.93 | 5.31 | 1.04 | 5.49 | 24.8 | 1.02 | 2.9 | 0.47 | 3.03 | 0.41 |
| 4-7 | 4.28 | 1.33 | 0.787 | 3.89 | 12.6 | 14.5 | 6.71 | 70 | 6.2 | 0.147 | 0.929 | 49.4 | 73 | 8.26 | 29.9 | 5.11 | 0.73 | 3.71 | 0.69 | 3.8 | 18 | 0.74 | 2.32 | 0.37 | 2.45 | 0.33 |
| 4-f | 2.82 | 0.475 | 0.211 | 14.4 | 7.91 | 19.2 | 1.57 | 35.3 | 5.09 | 0.795 | 3.83 | 9.91 | 23.8 | 3.08 | 11.9 | 3.14 | 0.78 | 4.32 | 1.13 | 6.07 | 35.8 | 1.23 | 3.61 | 0.57 | 3.42 | 0.49 |
| Average | 3.192 | 1.5508 | 1.2238 | 6.916 | 9.986 | 17.56 | 5.022 | 44.38 | 7.974 | 0.4708 | 2.415 | 43.22 | 69.02 | 7.64 | 27.1 | 4.828 | 0.766 | 4.13 | 0.8 | 4.482 | 21.92 | 0.856 | 2.604 | 0.414 | 2.646 | 0.376 |
| 6-r | 1.29 | 1.32 | 0.787 | 9.85 | 18.1 | 65.9 | 4.72 | 87.5 | 91.9 | 3.28 | 20.3 | 66.2 | 114 | 14.3 | 51.9 | 8.01 | 0.78 | 5.7 | 0.84 | 3.62 | 16.4 | 0.63 | 1.84 | 0.29 | 1.88 | 0.29 |
| 6-1 | 1.14 | 1.736 | 0.199 | 3.68 | 4.08 | 12 | 1.33 | 25.5 | 4.65 | 0.074 | 0.786 | 28.3 | 45.4 | 4.49 | 13.8 | 2.05 | 0.34 | 1.85 | 0.34 | 1.87 | 8.56 | 0.34 | 1.01 | 0.15 | 0.93 | 0.13 |
| 6-2 | 1.24 | 0.799 | 0.132 | 5.7 | 7.57 | 19.5 | 1.08 | 21.2 | 7.38 | 0.044 | 0.673 | 17.5 | 29.6 | 3.21 | 11.4 | 2.43 | 0.4 | 2.19 | 0.46 | 2.66 | 12 | 0.5 | 1.48 | 0.23 | 1.46 | 0.21 |
| 6-3g | 1.65 | 0.489 | 0.091 | 7.19 | 13.9 | 25.8 | 2.42 | 3233 | 10.6 | 0.575 | 3.92 | 28 | 49 | 5.22 | 18.5 | 3.05 | 0.51 | 2.3 | 0.52 | 2.99 | 15.3 | 0.57 | 1.64 | 0.26 | 1.68 | 0.24 |
| 6-4 | 1.34 | 0.399 | 0.059 | 2.12 | 20.3 | 8.29 | 3.42 | 15.5 | 3.8 | 0.038 | 0.66 | 12.4 | 21.1 | 2.28 | 8.53 | 1.68 | 0.32 | 1.56 | 0.32 | 1.62 | 7.94 | 0.32 | 0.91 | 0.15 | 0.92 | 0.13 |
| 6-5 | 0.997 | 0.816 | 0.127 | 2.76 | 15.7 | 9.75 | 2.76 | 18.7 | 3.5 | 0.051 | 0.418 | 7.02 | 11.7 | 1.31 | 4.71 | 1.06 | 0.2 | 1.04 | 0.23 | 1.37 | 6.88 | 0.28 | 0.82 | 0.14 | 0.88 | 0.12 |
| 6-6g | 1.7 | 0.296 | 0.049 | 7.45 | 12 | 24.8 | 2.26 | 92.3 | 10.4 | 0.59 | 3.98 | 24.9 | 38.4 | 4.02 | 12.9 | 2.12 | 0.42 | 2.27 | 0.53 | 3.02 | 14.1 | 0.58 | 1.71 | 0.28 | 1.74 | 0.24 |
| 6-7 | 0.935 | 0.5 | 0.086 | 4.48 | 5.54 | 22.1 | 1.51 | 49.7 | 8.16 | 0.204 | 1.46 | 29.7 | 49.4 | 5.38 | 19.2 | 3.06 | 0.45 | 1.95 | 0.34 | 1.89 | 8.92 | 0.36 | 1.1 | 0.18 | 1.24 | 0.16 |
| 6-8 | 1.04 | 0.555 | 0.247 | 3.42 | 8.08 | 13.2 | 1.19 | 16.9 | 4.18 | 0.032 | 0.326 | 8.32 | 16.1 | 1.75 | 5.83 | 1.27 | 0.21 | 1.33 | 0.29 | 1.65 | 7.8 | 0.32 | 0.97 | 0.16 | 1 | 0.14 |
| 6-9 | 0.662 | 0.724 | 0.243 | 2.79 | 3.5 | 11.2 | 1.8 | 118 | 3.56 | 0.101 | 1.07 | 29.1 | 48 | 5.49 | 19.8 | 3.45 | 0.58 | 2.52 | 0.4 | 1.9 | 8.97 | 0.35 | 0.98 | 0.15 | 1.01 | 0.14 |
| 6-10 | 1.28 | 0.305 | 0.059 | 5.1 | 3.32 | 19.7 | 0.529 | 29.9 | 6.62 | 0.089 | 0.831 | 10.7 | 20.2 | 2.39 | 9.12 | 1.98 | 0.32 | 1.9 | 0.42 | 2.52 | 12 | 0.48 | 1.44 | 0.23 | 1.47 | 0.21 |
| 6-11g | 0.639 | 0.195 | 0.071 | 6.24 | 1.57 | 30.2 | 0.42 | 102 | 5.22 | 0.994 | 5.74 | 22.7 | 31.6 | 2.6 | 6.46 | 0.89 | 0.15 | 1.01 | 0.24 | 1.27 | 6.61 | 0.26 | 0.8 | 0.13 | 0.83 | 0.12 |
| 6-12 | 0.782 | 0.356 | 0.096 | 1.94 | 6.46 | 10.8 | 1.27 | 19.8 | 3.19 | 0.053 | 0.399 | 9.83 | 18.3 | 1.84 | 6.62 | 1.32 | 0.21 | 1.16 | 0.25 | 1.33 | 5.88 | 0.24 | 0.71 | 0.12 | 0.76 | 0.11 |
| 6-13 | 1.39 | 1.57 | 0.25 | 2.32 | 17.1 | 6.77 | 5.55 | 15.8 | 4.75 | 0.067 | 0.581 | 12.7 | 21.9 | 2.41 | 8.69 | 1.81 | 0.32 | 1.68 | 0.31 | 1.69 | 8.36 | 0.3 | 0.87 | 0.14 | 0.84 | 0.11 |
| 6-f | 1.48 | 0.259 | 0.136 | 9.54 | 20.1 | 64.5 | 4.29 | 69.28 | 85.2 | 3.39 | 21.4 | 55.4 | 90.6 | 11.4 | 40.6 | 6.29 | 0.42 | 4.77 | 0.76 | 3.68 | 19.3 | 0.67 | 2.15 | 0.33 | 2.21 | 0.34 |
| Average | 1.081 | 0.676 | 0.15 | 3.431 | 9.165 | 13.33 | 2.044 | 33.1 | 4.979 | 0.075 | 0.72 | 16.56 | 28.17 | 3.055 | 10.77 | 2.011 | 0.335 | 1.718 | 0.336 | 1.85 | 8.731 | 0.349 | 1.029 | 0.165 | 1.051 | 0.146 |
| World [31,32] | 2 | 8.3 | 0.58 | 3.7 | 17 | 28 | 6 | 150 | 17 | 1.1 | 18 | 11 | 23 | 3.4 | 12 | 2.2 | 0.43 | 2.7 | 0.31 | 2.1 | 8.4 | 0.57 | 1 | 0.3 | 1 | 0.2 |
Table 3.
The correlation coefficient between Cu, Pb, and some geochemistry parameters in coal.
| Coal | Elements | Vtrinite | Inertinite | Liptinite | Ad | Fe2O3 | U | Th | Cu | Ga | SiO2 | Al2O3 | CaO | K2O | TiO2 | Pb |
|---|---|---|---|---|---|---|---|---|---|---|---|---|---|---|---|---|
| No. 4 | Cu | −0.98 | 0.97 | 0.64 | 0.87 | −0.10 | 0.79 | 0.80 | 1.00 | 0.93 | 0.86 | 0.90 | −0.35 | 0.94 | 0.47 | 0.79 |
| Pb | −0.66 | 0.63 | 0.65 | 0.50 | −0.49 | 0.87 | 0.57 | 0.79 | 0.61 | 0.51 | 0.56 | −0.03 | 0.60 | 0.32 | 1.00 | |
| No. 6 | Cu | −0.49 | 0.44 | 0.40 | 0.31 | −0.63 | 0.40 | 0.52 | 1.00 | 0.10 | 0.50 | 0.51 | −0.11 | 0.12 | 0.21 | 0.58 |
| Pb | −0.05 | −0.04 | 0.25 | 0.35 | −0.52 | 0.78 | 0.87 | 0.58 | −0.16 | 0.51 | 0.51 | 0.37 | −0.25 | −0.36 | 1.00 |
© 2017 by the authors. Licensee MDPI, Basel, Switzerland. This article is an open access article distributed under the terms and conditions of the Creative Commons Attribution (CC BY) license (http://creativecommons.org/licenses/by/4.0/).
Share and Cite
MDPI and ACS Style
Liu, D.; Zhou, A.; Zeng, F.; Zhao, F.; Zou, Y. The Petrography, Mineralogy and Geochemistry of Some Cu- and Pb-Enriched Coals from Jungar Coalfield, Northwestern China. Minerals 2018, 8, 5. https://doi.org/10.3390/min8010005
AMA Style
Liu D, Zhou A, Zeng F, Zhao F, Zou Y. The Petrography, Mineralogy and Geochemistry of Some Cu- and Pb-Enriched Coals from Jungar Coalfield, Northwestern China. Minerals. 2018; 8(1):5. https://doi.org/10.3390/min8010005
Chicago/Turabian StyleLiu, Dongna, Anchao Zhou, Fangui Zeng, Fenghua Zhao, and Yu Zou. 2018. "The Petrography, Mineralogy and Geochemistry of Some Cu- and Pb-Enriched Coals from Jungar Coalfield, Northwestern China" Minerals 8, no. 1: 5. https://doi.org/10.3390/min8010005
Note that from the first issue of 2016, this journal uses article numbers instead of page numbers. See further details here.