Density Functional Theory and Atomic Force Microscopy Study of Oleate Functioned on Siderite Surface

College of Civil and Resources Engineering, Northeastern University, Shenyang 110819, China
*
Author to whom correspondence should be addressed.
Minerals 2018, 8(1), 33; https://doi.org/10.3390/min8010033
Submission received: 2 November 2017
/
Revised: 18 January 2018
/
Accepted: 18 January 2018
/
Published: 21 January 2018
Abstract
:Efficiently discovering the interaction of the collector oleate and siderite is of great significance for understanding the inherent function of siderite weakening hematite reverse flotation. For this purpose, investigation of the adsorption behavior of oleate on siderite surface was performed by density functional theory (DFT) calculations associating with atomic force microscopy (AFM) imaging. The siderite crystal geometry was computationally optimized via convergence tests. Calculated results of the interaction energy and the Mulliken population verified that the collector oleate adsorbed on siderite surface and the covalent bond was established as a result of electrons transferring from O1 atoms (in oleate molecule) to Fe1 atoms (in siderite lattice). Therefore, valence-electrons’ configurations of Fe1 and O1 changed into 3d6.514s0.37 and 2s1.832p4.73 from 3d6.214s0.31 and 2s1.83p4.88 correspondingly. Siderite surfaces with or without oleate functioned were examined with the aid of AFM imaging in PeakForce Tapping mode, and the functioned siderite surface was found to be covered by vesicular membrane matters with the average roughness of 16.4 nm assuring the oleate adsorption. These results contributed to comprehending the interaction of oleate and siderite.
1. Introduction
It is well established that flotation is a surface-chemistry based process taking advantage of the differences in wettability on mineral particle surfaces [1]. Flotation of mineral particles depends not only on hydrodynamic aspects, but also on the appropriate selection of reagent combinations such as collectors, depressants, dispersants, and frothers. Among them, the collector is considered to play a major role in that it can adsorb on the target mineral selectively to enhance its hydrophobicity and floatability [2]. As for the flotation methods, reverse cationic/anionic flotation is qualified as one of the most effective beneficiating methods to upgrade the oxide minerals [3,4], especially iron-bearing minerals [5]. However, a traditional reverse anionic froth flotation process, which teats hematite ores with quartz as the predominant gangue mineral and employs fatty acid as the collector, faced a challenge that the flotation criteria are depressed by the entrainment of siderite [6,7]. Our previous studies have indicated that the increase of siderite percentage resulted in the decrease of iron (Fe) grade of non-floated concentrate and even led to an unclear separation between the concentrate and the tailing. Additionally, it has been revealed by the results of micro-flotation tests along with the analysis of flotation products’ surfaces characterizing by Scanning Electron Microscope (SEM) and Energy Dispersive Spectrometer (EDS), that the interaction of the collector and quartz was partially obstructed by siderite [8].
To the best of our knowledge, the investigation of flotation behaviors of siderite has been shaded by those of hematite [9], magnetite [10], and goethite [11], which have attracted most attention among iron-bearing minerals alongside their physicochemical properties, crystal structures, and surface electrical properties, etc. As a ferrous mineral, siderite is different from hematite, magnetite, and goethite in properties, structures and moreover in responses to flotation reagents. As well known that the material structural difference takes a major part in acting with chemical reagent where iron values are attempted to be enriched by means of the flotation process. To this end, illustrating siderite crystal structure and detecting the adsorption of collector oleate on siderite, are of importance in understanding their underlying response during flotation process, also the characterization by more quantitative and imaging methodologies is desired.
With respect to the formation and the properties of siderite, siderite (FeCO3) is known as a ferrous mineral, widespread on earth and forming in anoxic environments [12], and the retention properties of pure siderite in aqueous solution are experimentally difficult to study because its surface tends to quickly oxidize under atmospheric conditions [13]. However, compared with traditional methods, there are two reliable methodologies, i.e., the density functional theory (DFT) and the atomic force microscopy (AFM), have advantages of detecting atomic-scale phenomena which cannot be fulfilled by current lab tests.
The first reliable DFT is widely used in molecular modeling process which has become an important tool in fundamental chemistry research to predict structures, energies and other properties of molecules [1]. Based on the molecular properties and the interaction energies modeled or calculated, it is now possible to get a deep insight into physical and chemical phenomena involved in separation process and to provide a better understanding of the mechanism even without detailed experimental studies [14]. Thanks to the molecular modeling method, some geological researchers have attempted to illustrate the crystal structure, electronic structure, magnetic property of siderite at lower mantle conditions [15,16]. Badaut et al. [13] investigated the structural, electronic, and elastic properties of FeCO3 at ambient conditions by DFT calculations. With the help of first-principles calculations with GGA, Shi et al. [15] described the pressure-induced magnetic phase transition, electronic structure of FeCO3, as well as geometrical structure. Employing molecular dynamic simulation, our previous studies have calculated the adsorption quantity and interaction capability of oleate on siderite [17].
The second reliable atomic force microscopy (AFM) is nowadays one of the major microscopic techniques used to characterize nano-scale surface structures and has become an indispensable characterization tool in the field of nano-science and nano-technology, being utilized routinely in different research fields [18]. AFM is practical for measuring the surface properties such as morphology and the mechanical properties of many materials at the nanoscale level [19,20,21], and the technique has become viable to study soft matter especially polymers [22,23,24,25]. Height imaging is a widely used application of AFM in the scientific area, which can be utilized to analyze the morphologies of characterized nano-materials, such as nano-particles [26], nano-tubes [27], and nano-sheets [28]. Over the past three decades, several publications were reported to employ AFM method in siderite formation research. Tang et al. [29] examined the dissolution behavior of siderite in the presence of oxidant chromate with the aid of AFM. While R.M. weaver et al. [30] detected the reactivity of siderite under the ambient atmosphere and acidic aerosols using an atomic force microscope.
Although there are important discoveries revealed by these researchers, there are also limitations, and several aspects relating to siderite molecular simulation have not been carried out or taken into consideration in publications. Firstly, there are few investigations on convergence tests of stimulation parameters, which are indispensable for an optimum siderite crystal geometry. Also, the convergence tests of siderite surface layer and vacuum thickness in terms of surface energy were rarely performed for an optimal siderite surface slab, in consideration of computational limitation and simulation accuracy. More important, from the view of mineral processing, few published literature was related to the interaction of siderite surface and collector such as oleate at the molecular scale.
In this review, this present study offered an insight into the adsorption of oleate on siderite surface at the molecular level by Density Functional Theory (DFT) accompanied with Atomic Force Microscopy (AFM). At the first place, the crystal optimization convergence tests were conducted to determine an optimum siderite crystal geometry. Secondly, an accurate siderite (101) slab surface for adsorption calculations was cleaved and optimized from the modelled siderite bulk. Subsequently, in mineral-reagent complex, the interaction energy and the Mulliken population were calculated to clarify the adsorption of oleate on the siderite (101) slab surface, electrons transfer as well as bond type at the molecular level. Finally, the visualization of siderite surface with and without oleate functioned was implemented using PeakForce Tapping AFM mode which focused on characterizing particle surface and its roughness, to verify the former DFT results.
2. Materials and Methods
2.1. Computational Details
All the calculations included in the present study were performed using the software package CASTEP which employs periodic boundary conditions, supercells, and special point integration over the Brillouin zone, based on density functional theory (DFT) with a plane-wave expansion of the wave functions and ultra-soft pseudopotentials.
To get an optimum crystal geometry, convergence tests of stimulation parameters were conducted. First of all, exchange/correlation potentials of GGA-PBE, GGA-RPBE, GGA-PW91, GGA-WC, and GGA-PBESOL were identified respectively to gain the optimal stability structural parameters of bulk siderite with the kinetic cutoff energy of 340 eV and the Brillouin zone k-point of 4 × 4 × 2. Secondly, the suitable k-point and kinetic cutoff energy were determined. In the optimization convergence, a self-consistent iteration method was employed using ultrasoft pseudo potentials in reciprocal space, where the energy was converged to within 2.0 × 10⁻⁵ eV/atom and the geometry was optimized until the forces on all the atoms were less than 0.05 eV/Å. Finally, the optimized lattice parameters of siderite were compared to the literatured experimental values [31] to validate the rationality of the setting parameters.
2.2. Models for Siderite Surface
Surface energy is an index for measuring the thermodynamic stability of a given surface. A lower value infers a more stable surface which can be used to represent the accurate surface structure [32].The surface energy (Esurf) in a slab model can be calculated by Equation (1) [33].
where Eslab is the total energy of the surface slab and Ebulk is the energy of the bulk unit cell; Nslab and Nbulk are the numbers of atoms contained in the slab and the bulk unit cells respectively; A represents the unit area of the surface; two denotes two surfaces along the z-axis in the surface slab.
In this study, all surfaces of the surface slab obtained from the bulk siderite with the optimum unit cell volume were modeled by a super cell. To obtain an accurate slab surface of siderite, slab depth and vacuum thickness were selected as 19.13 Å to 34.76 Å and 20 Å to 28 Å separately with the cutoff energy of 360 eV for the plane wave basic set and Monkhorst-pack mesh of 3 × 4 × 1. The wave functions were converged to within 2.0 eV/atom and the geometry was optimized until the forces on all the atoms were less than 0.05 eV/Å.
2.3. Mineral-Reagent Complex
In this study, the oleate acts as the adsorbate, while the siderite surface is the adsorbent. Prior to adsorption modelling, optimization calculation of oleate molecule was carried out using the CASTEP module, paving the way for calculating the interaction energies between the adsorbate and the adsorbent.
The relative interaction affinity of the optimized siderite surface and oleate can be quantified in terms of the total adsorption energy (△Eads) [34], which is displayed as the following Equation (2) and is calculated with the CASTEP module.
where Ecomplex refers to the calculated energy of the optimized siderite-oleate complex, whereas Eadsorbate and Emineral separately designate as the total energy of the oleate and siderite surface. The more negative the △Eads is, the more exothermic the adsorption is, which is favorable for a stronger interaction of reagent and mineral surface.
2.4. AFM Measurement
Atomic force microscopy (AFM) images were captured with a MultiMode8 microscope (Bruker Corporation, Karlsruhe, Germany) operating in PeakForce Tapping mode, where the probe oscillated at a typical frequency of 2 kHz (far below the resonance of the cantilever) with typical peak-to-peak amplitudes of 300 nm in the air, which led the probe periodically to contact with the sample for a short period of time (<100 μs) and resulted that a periodically oscillating force was exerted onto the sample surface [35] PeakForce Tapping enables to precisely control probe-to-sample interaction, providing the available lowest force for imaging. This superior force control facilitates the imaging process performed at the most consistent force and is beneficial for an AFM image with the highest resolution.
2.5. Materials and Sampling
Siderite minerals were collected from Anshan Iron and Steel Group Corporation in China. Before AFM imaging, the pulverized siderite particles (<5 μm) were firstly dispersed in an ultrasonic dispersion machine at room temperature. Next, the dispersed siderite particles were functioned in an oleate solution (50 mg/L) and then was washed with deionized water. After that, the siderite particles were directly moved onto a mica substrate which was just cleaved with adhesive tape at a very short time before, avoiding contamination on the mica superficies. Normally, 5–10 individual siderite particles were randomly selected to examine. In the ambient environment, siderite particles with or without oleate functioned were detected with SNL-10 probes (Bruker) (nominal tip radius of 2 nm, spring constant of 0.35 N/m) at 512 lines and scanned at a scan rate of 0.8 to 0.9 Hz to secure images with higher resolution and reliable mappings of mechanical properties. At the end, the obtained AFM images were processed in the Nanoscope Analysis v1.8 software (Bruker).
3. Results and Discussion
3.1. Geometry Optimization of Siderite
Five correlation-exchange potentials, GGA-PBE, GGA-RPBE, GGA-PW91, GGA-WC, and GGA-PBESOL were evaluated independently to gain optimal structural parameters of bulk siderite with the kinetic cutoff energy of 340 eV and Brillouin zone k-point of 4 × 4 × 2. The compiled structural parameters, V (unit-cell volume), a (lattice constant) and α (cell angle) are summarized in Table 1, compared with the documented experimental structural parameters [30]. The difference, which is defined as the biggest difference of the calculated a, V, and α to their corresponding documented values, is also presented in Table 1.
As shown in Table 1, compared with the parameter differences obtained with GGA-PBE, GGA-RPBE, GGA-PW91, and GGA-PBESOL, difference of 0.2% with GGA-WC was regarded as the minimum, and the calculated V (unit-cell volume), a (lattice constant) and α (cell angle) were 5.783 Å, 96.71 Å3 and 47.64Å respectively. While the maximum difference of 6.2% was achieved in GGA-RPBE set. Therefore, GGA-WC was determined as a suitable correlation-exchange potential for the following structural optimization of siderite. With the kinetic cutoff energy of 340 eV and the GGA-WC potential mode, modelings were performed in the k-point sets of 2 × 2 × 2, 3 × 3 × 2, 4 × 4 × 2, 5 × 5 × 2, 6 × 6 × 2, and 8 × 8 × 2, targeting for obtaining a suitable k-point set value. Total energies and lattice parameter differences, versus applied k-point sets are illustrated in Figure 1.
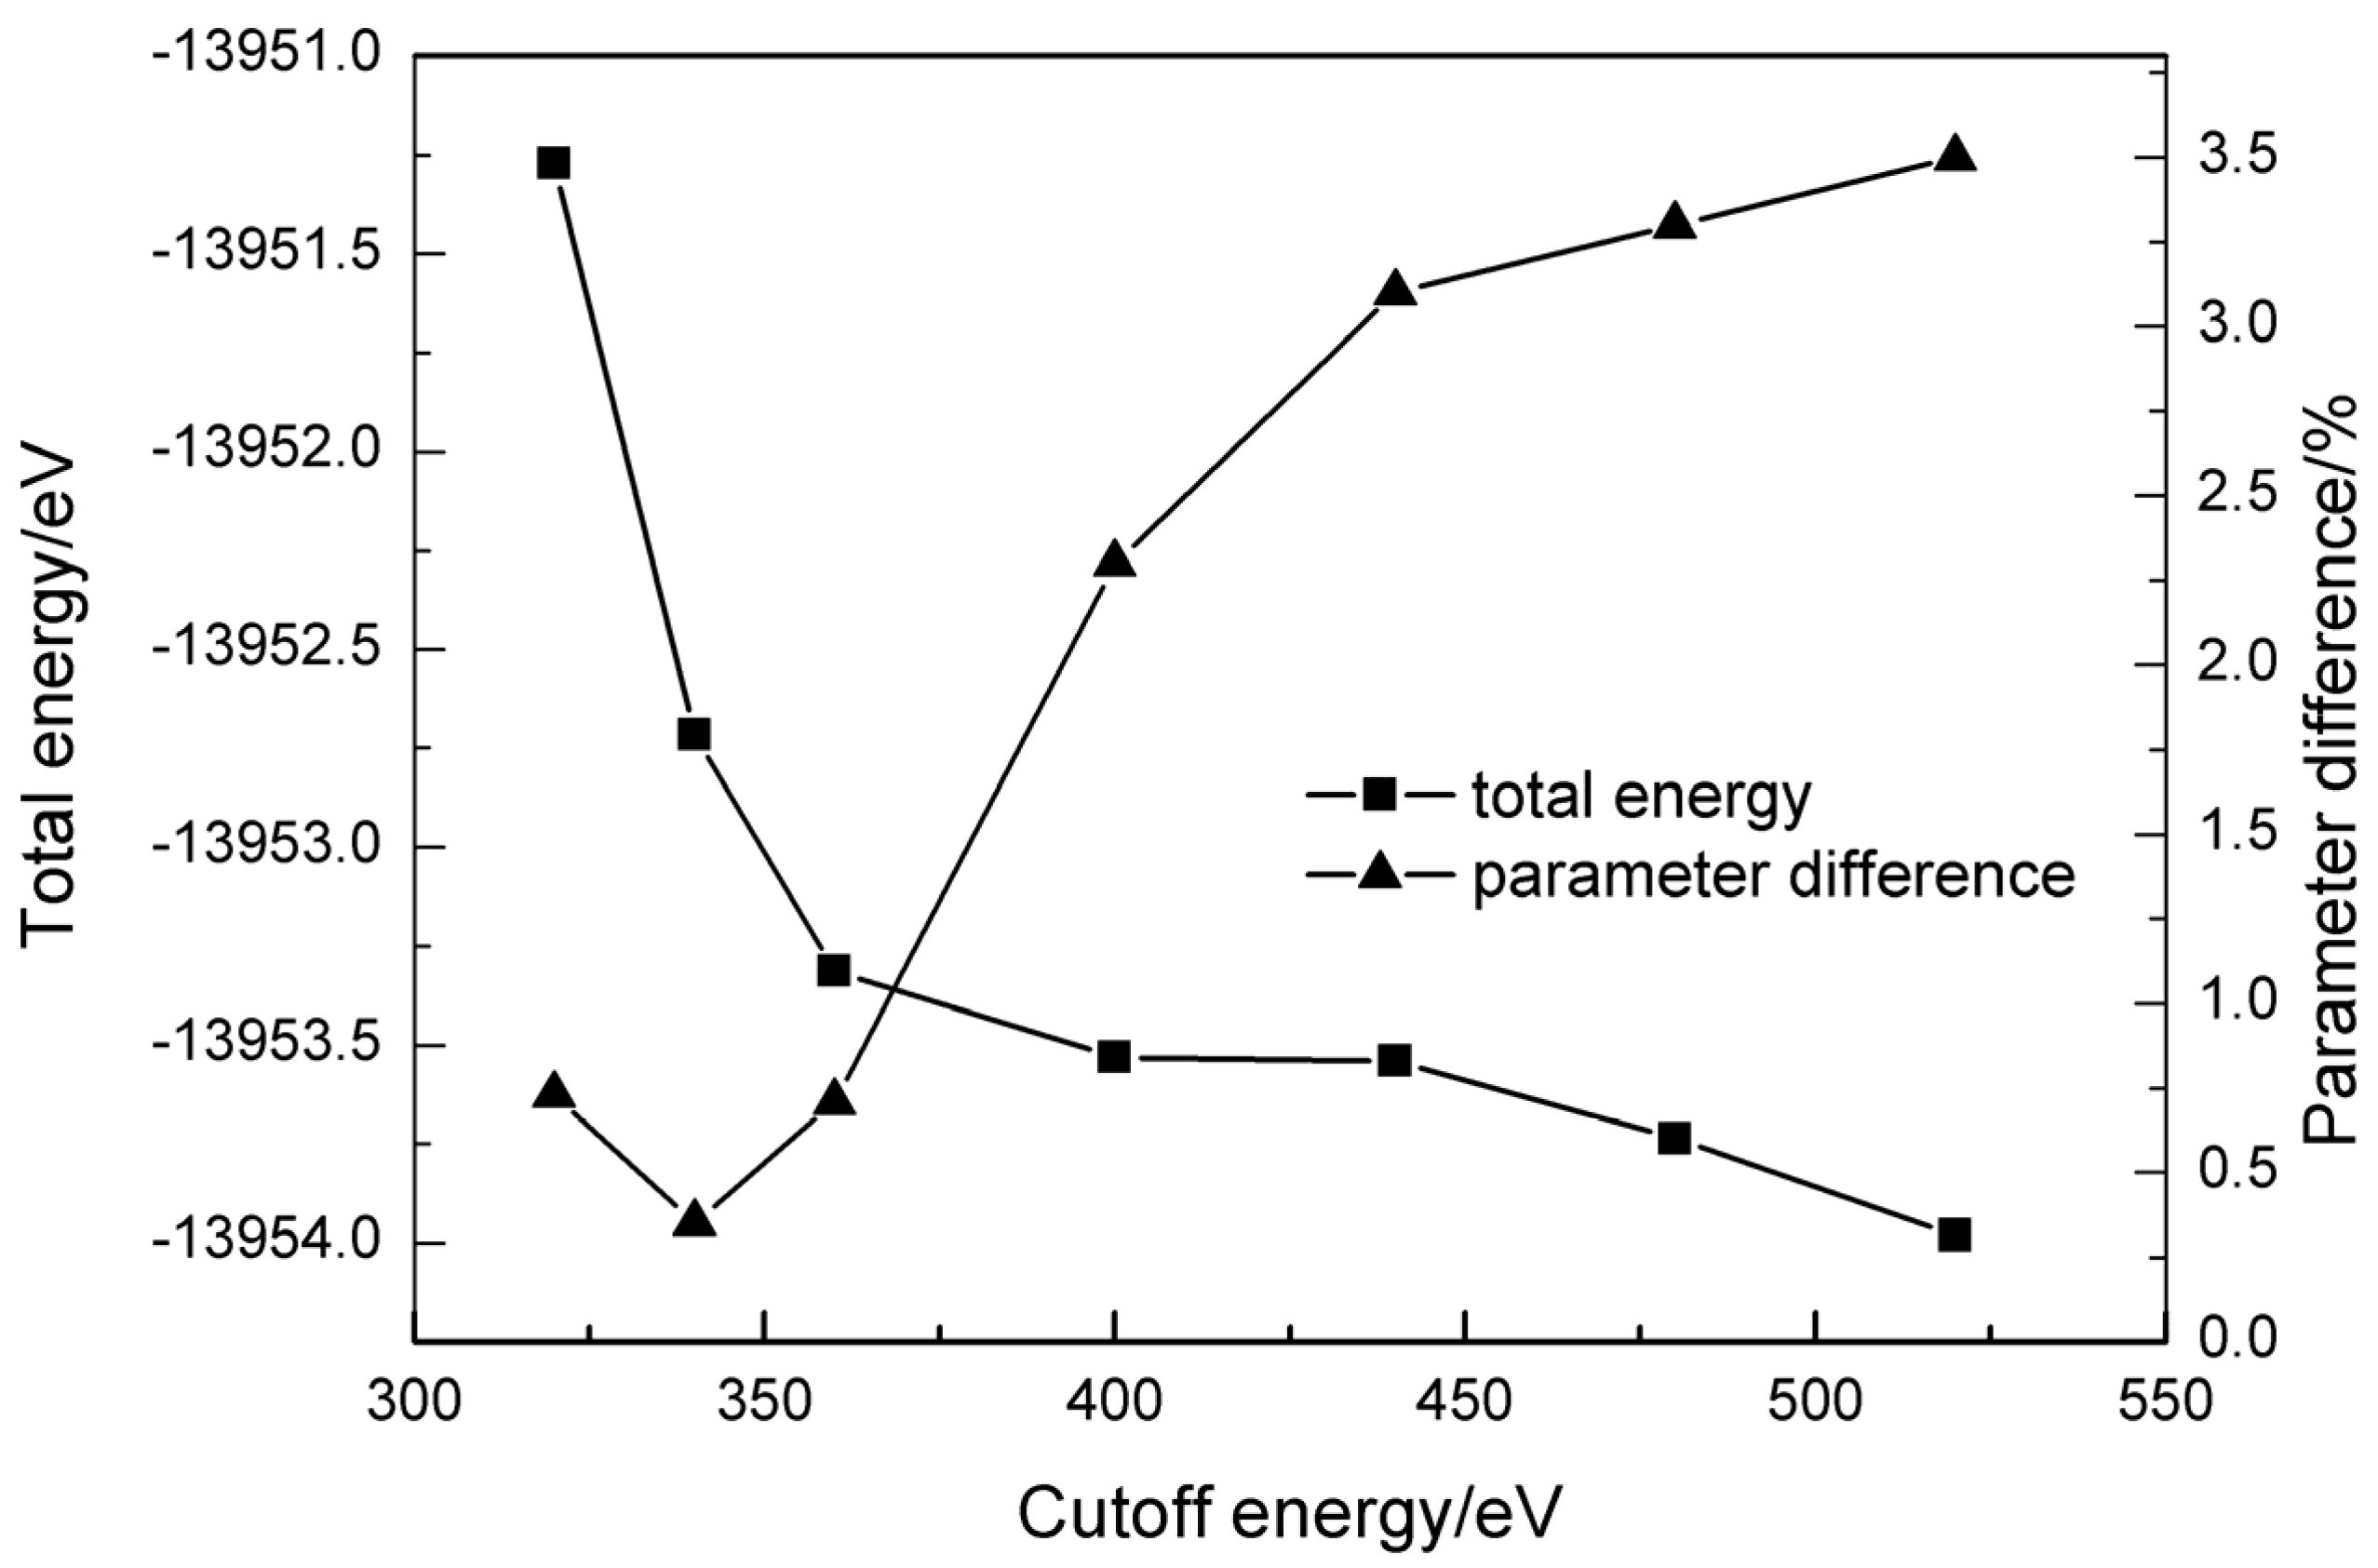
As can be seen, with the kinetic cutoff energy of 340 eV, the lowest convergent total energy, and the smallest parameters’ difference are obtained at the k-point set mesh of 4 × 4 × 2, and the curves of total energy and parameter difference seem to be steady as the k-point set mesh beyond 4 × 4 × 2. Therefore, the suitable k-point set mesh in the study was determined as 4 × 4 × 2. With seven optional cutoff energy levels from 320 eV to 550 eV, the tendencies of total energy and parameter difference are plotted as functions of kinetic cutoff energy, shown in Figure 2.
It is demonstrated that as kinetic cutoff energy increases from 320 eV to 360 eV, negative total energy decreases from −13,951.2705 eV to −13,953.3135 eV. The total energy tends to be stable as the cutoff energy is bigger than 360 eV. The minimum parameter difference of 0.35 was obtained at the cutoff energy of 340 eV. Results made clear that the cutoff energy of 340 eV and the k-point mesh of 4 × 4 × 2 were sufficient to obtain convergent geometrical parameters. In consideration of the calculation accuracy, the cutoff energy of 360 eV and the k-point mesh of 4 × 4 × 2 were chosen as calculating parameters.
Consequently, the bulk unit cell parameters of siderite were optimized with the exchange-correlation potential of GGA-WC, the Brillouin-zone k-point of 4 × 4 × 2, and the kinetic cutoff energy of 360 eV. The optimized results are compared in Table 2, and it is shown that the calculated lattice parameters are in good agreement with the experimental values reported in the previous literature [31], which confirmed the calculation accuracy.
3.2. Siderite Surface Slab Optimization
According to the energy theory of crystal growth, the surface with a higher surface energy has a faster-growing rate, and the as-grown crystal morphology is dominated by the slow-growing surfaces while the fast-growing faces may disappear [36]. Therefore, the (101) siderite surfaces [17] were modeled from one to five layer slabs. The chosen layers’ numbers enabled each slab to have the thickness of 3.907 Å. The surface energies of slab surface (101) of siderite as functions of slab depth or vacuum thickness were calculated and exhibited in Table 3.
As shown in Table 3, the increase of the slab thickness by three layers in each case results in the fluctuation of surface energy by less than 0.05 J·m−2. It was thus indicated that two more layers within the slab were adequate to make the surface energy convergent within 0.05 J·m−2, and vacuum thickness more than 20 Å could provide enough vacuum between material layers. Regarding the oleate length and computational efficiency, a slab with the depth of 26.964 Å and the vacuum thickness of 26 Å was used to simulate the siderite surface in periodic boundary conditions. The cleaved (101) siderite surfaces before and after geometry optimization are shown in Figure 3. By comparison, it was detected that the geometry optimization resulted in the movement of Fe atoms along the X-axis.
3.3. Oleate Interaction with Siderite (101) Surface
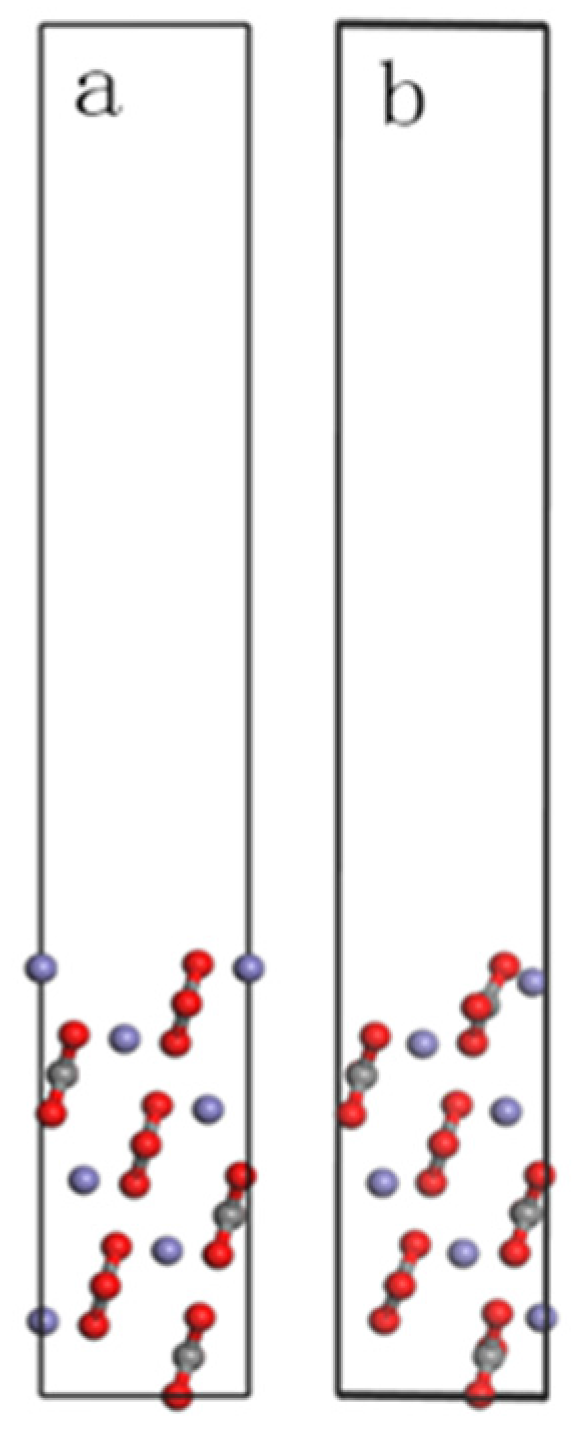
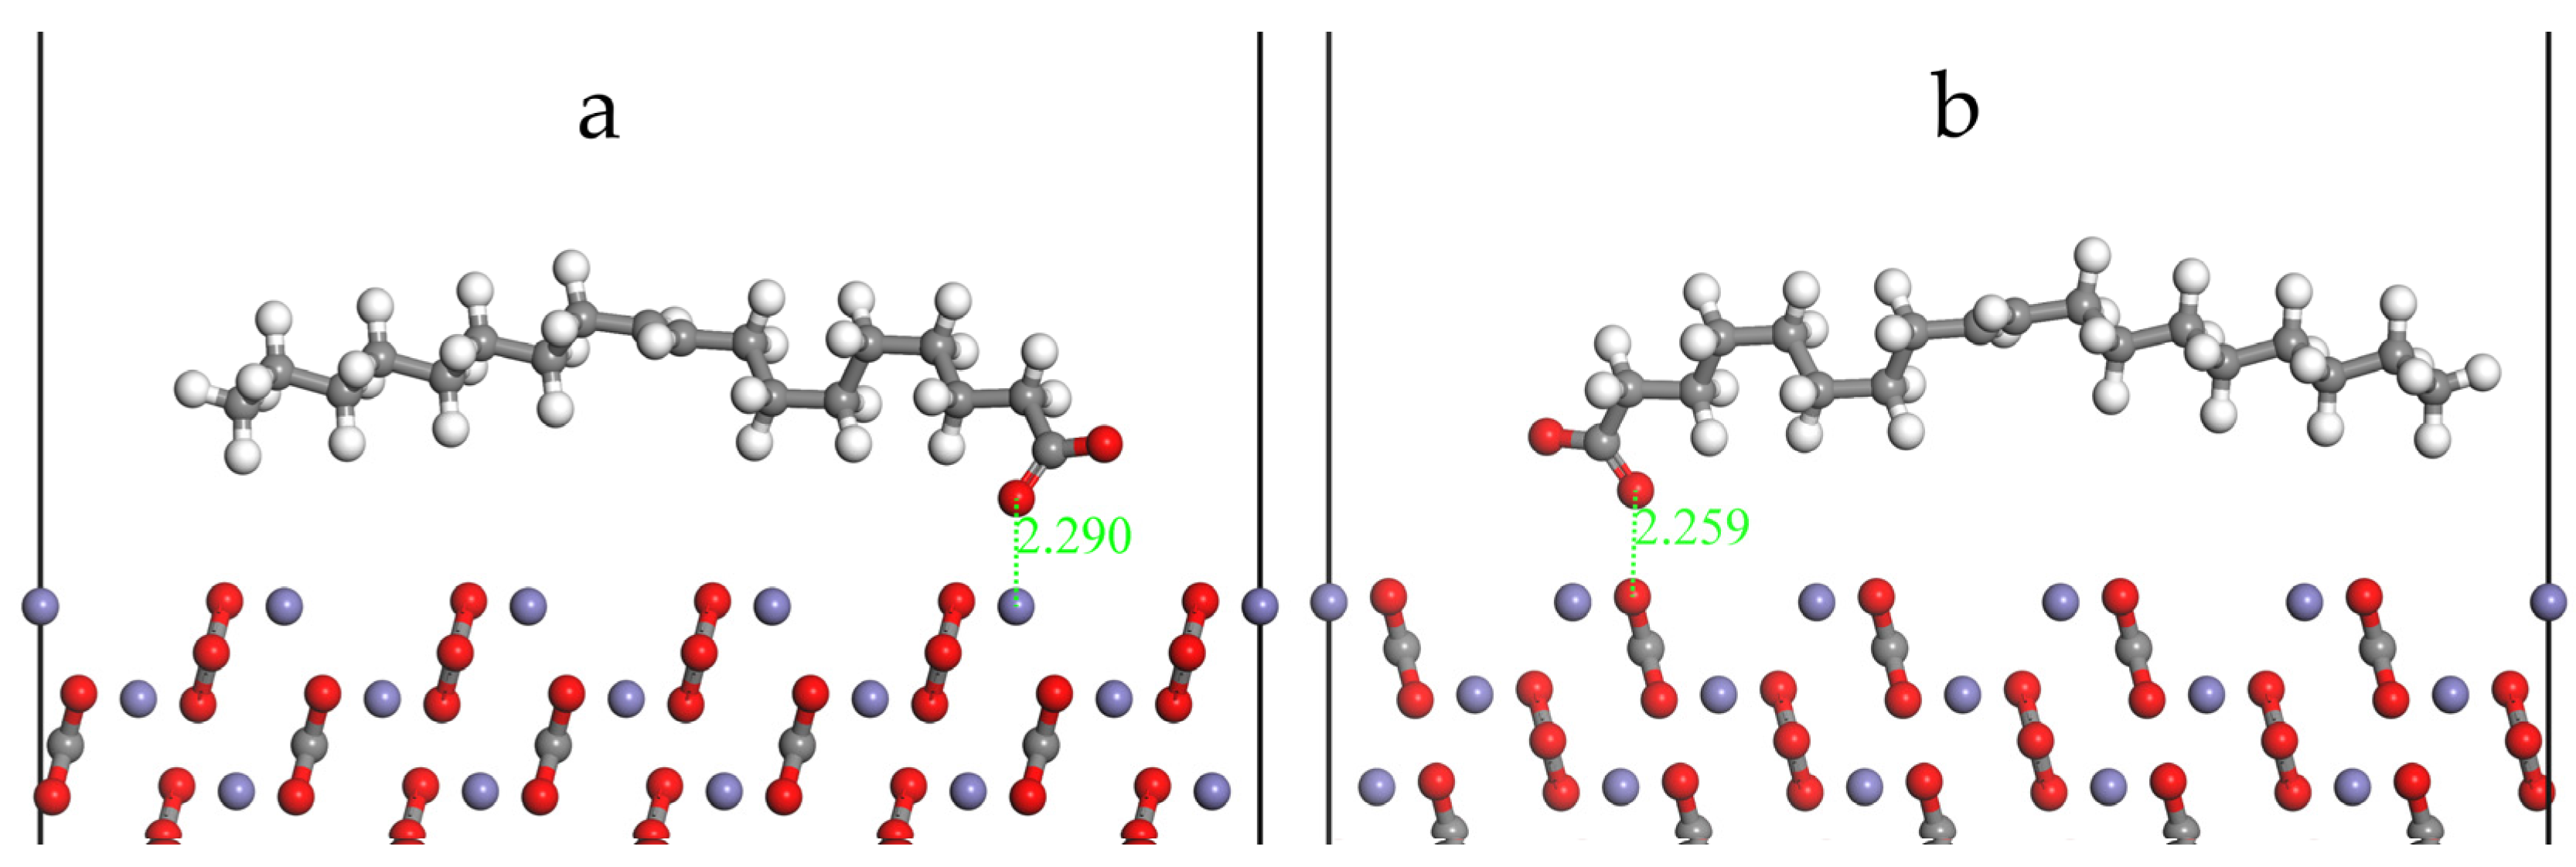
Prywer and Cryst (2001) stated [37] the adsorption of oleate on siderite based on the results of micro flotation tests and the characterization of Fourier transform infrared spectroscopy. Thanks to the preceding findings, the adsorption behaviors of oleate on siderite surface were attempted to be investigated at the atomic level, and the electrons’ transfer between the interacting atoms were estimated in terms of the Mulliken population. Since the determination of adsorption position of reagent molecular on minerals’ liberated surface was crucial to the quantum chemistry calculation, it was necessary at the first place to specify the interaction status of oleate molecule on siderite surface. The adsorption of oleate molecule on siderite (101) surface could be possible in the forms of interacting with the head Fe atom (Figure 4a) or O atom (Figure 4b) in CO3 group, which are illustrated in Figure 4.
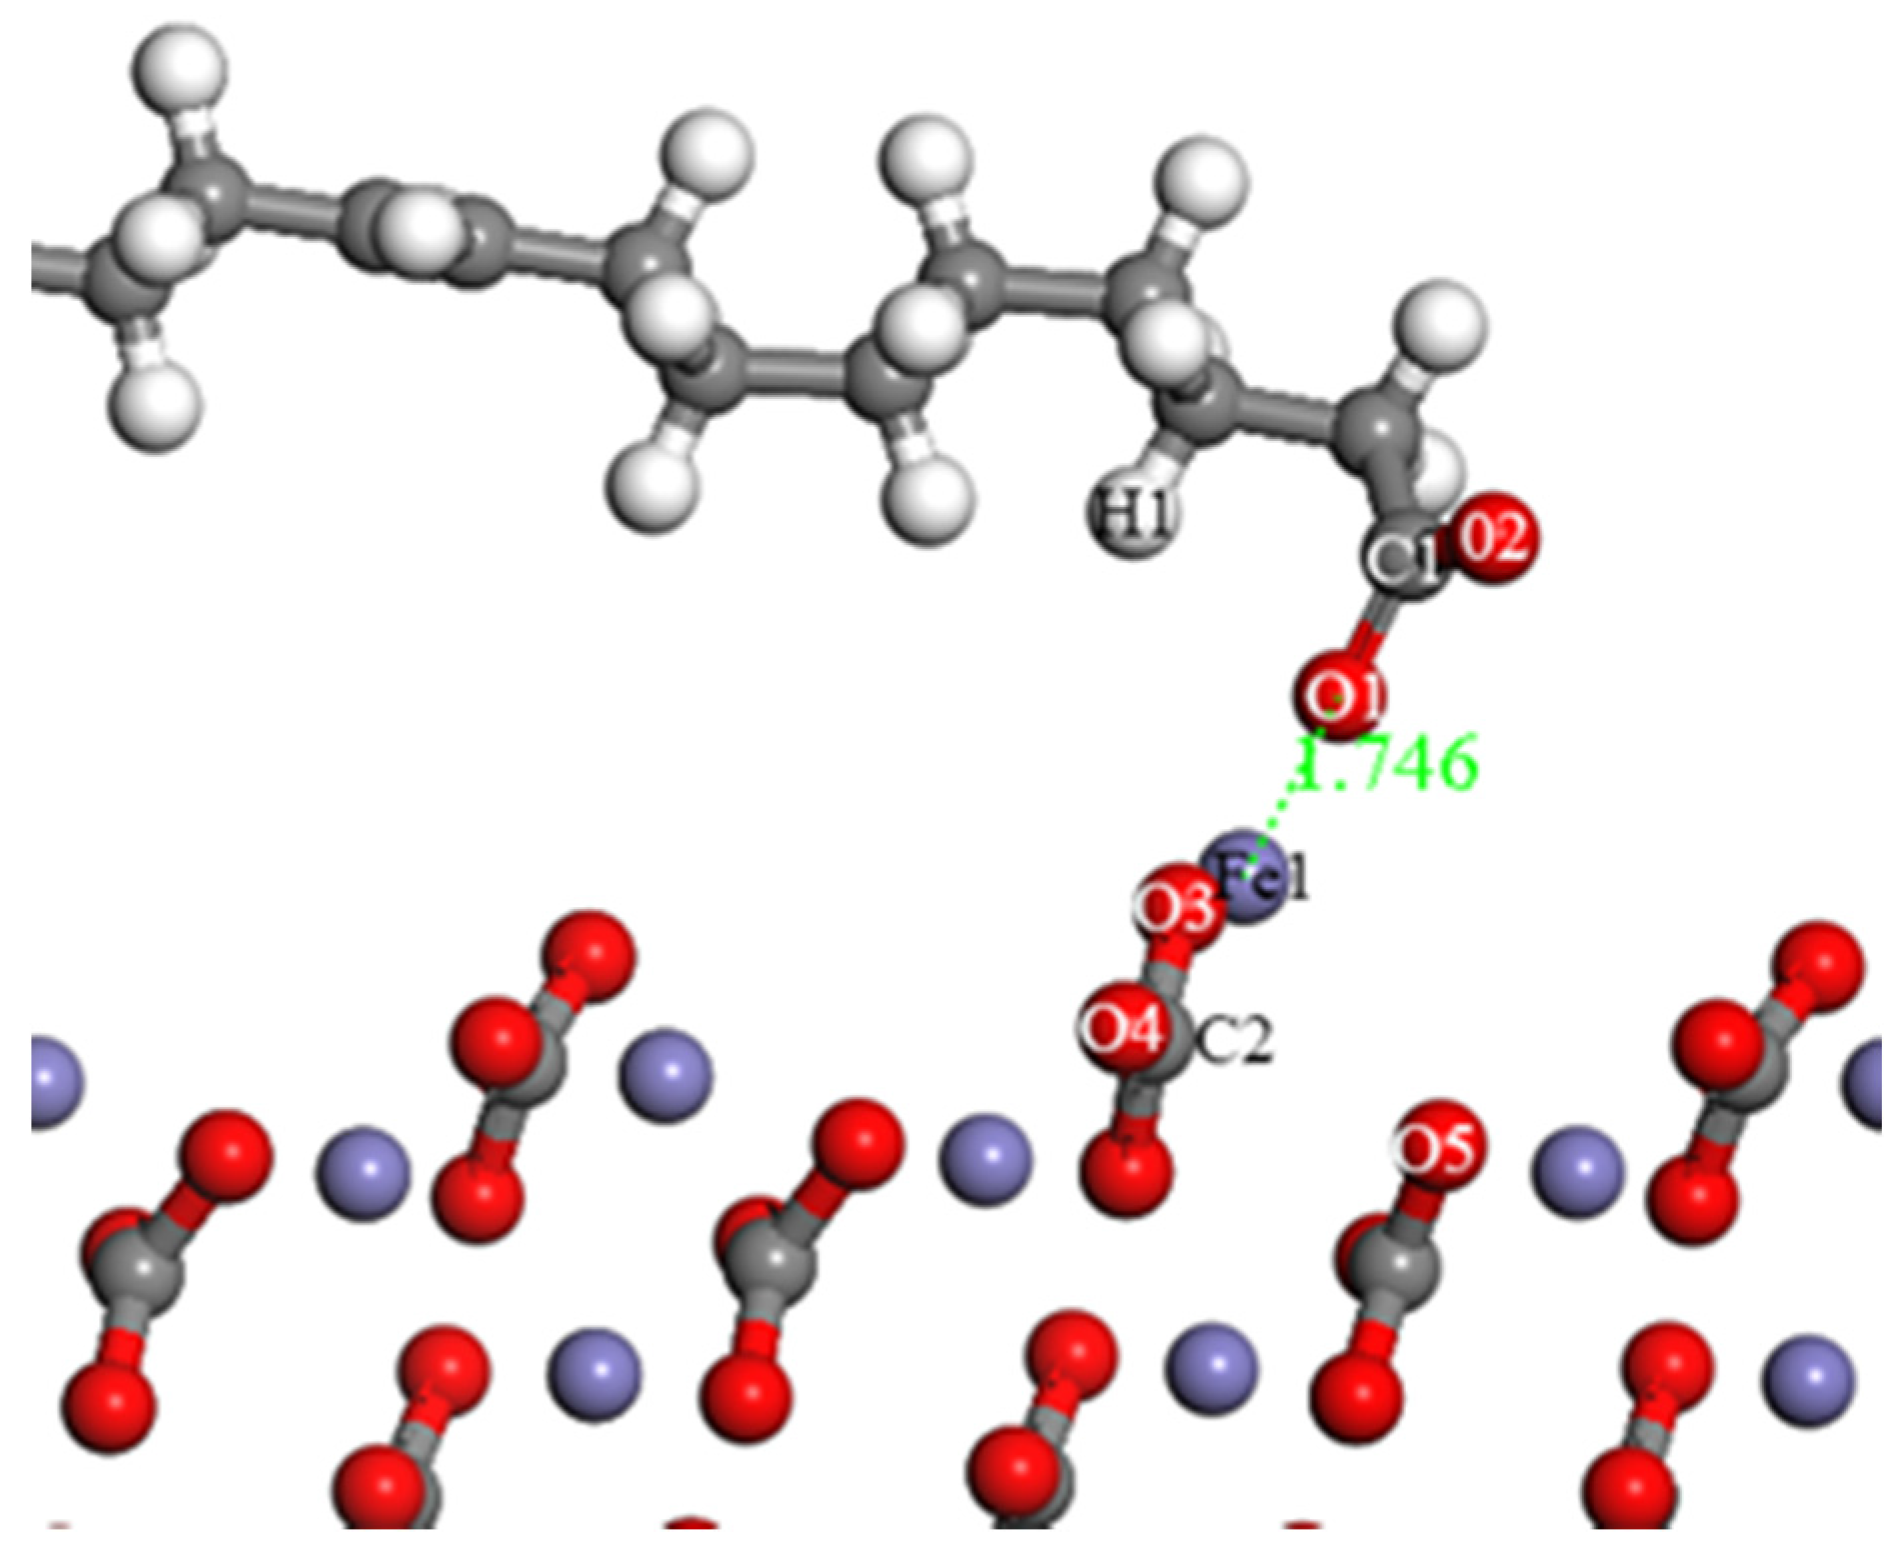
With the cutoff energy of 360 eV for the plane wave basic set and the k-point of 3 × 4 × 1, the geometric adsorption configurations of oleate on siderite surface were computed and optimized The energy was converged to within 2.0 × 10⁻⁵ eV/atom and the geometry optimization was fulfilled until the forces on all the atoms were less than 0.05 eV/Å. The optimized reagent-mineral complex is shown in Figure 5. Processing results implied that the oleate molecule interacted with siderite (101) surface by means of binding with the top Fe atom (Figure 4a), and the calculated adsorption energy was −360.006 kJ/mol, which revealed that the oleate molecule could adsorb on siderite surface. When oleate molecules were about to arrive at siderite surface, the combination of O atoms and Fe atoms caused the adsorption of oleate on siderite surface, and the corresponding O–Fe distance was 1.746 Å.
Mulliken bond population can be used to specify the bond types of electrovalent bond and covalent bond. A positive value of superimposed Mulliken bond population between two atoms indicates the presence of covalent, and the more the Mulliken population is, the stronger the covalent bond is. When the number of Mulliken population is small, and the number of charged atoms has a tendency to gradually increase, then the bond represents the ionic. While a negative Mulliken bond population value means the atom in an antibonding state. The optimized adsorption configuration of oleate on siderite (101) surface after adsorption, as well as the atomic structures, are illustrated in Figure 5, and the calculated Mulliken bond populations of Fe1–O1, Fe1–O4, Fe1–O5 and Fe1–C2, and those of O1–C1, O1–H1, and O1–O3 are summarized in Table 4.
As can be seen from Table 4, the Mulliken bond populations between Fe1 and O1, O4, or O5 are all positive, which means Fe1 interacted with these O atoms in the forms of covalent bond. The bond population of Fe1–O1 is 0.50, which suggests the covalent bond was established between siderite surface and oleate. Whereas the interactions of Fe1–O4 and Fe1–O5 in siderite may trigger the stabilization of siderite structure with Mulliken populations of 0.27 and 0.04 separately. Additionally, the bond of C1–O1 in oleate was manifested as a stronger covalent bond by the calculated positive Mulliken population of 0.66. However, the bond population of O1 (in oleate) and O3 (in siderite) was −0.01 and the corresponding O1–O3 distance was 2.931 Å, which reveals that there was scarce effect between O1 and O3. In conclusion, the greater covalent bond formed between siderite surface and the collector oleate led to the adsorption of oleate on siderite surface. The Mulliken populations of Fe1 and O1 before and after oleate functioned on siderite surface are presented in Table 5.
As can be known from Table 5, prior to adsorption the valence electron configurations of Fe1 and O1 were 3d6.214s0.31 and 2s1.83p4.88, and those of Fe1 and O1 after adsorption turned to be 3d6.514s0.37 and 2s1.832p4.73 correspondingly. In addition, the populations of 3d and 4s orbital in the Fe1 atom increased from 6.21 to 6.51 and from 0.31 to 0.37 respectively, and the located electron number of Fe1 atom is 7.01e. In contrast to 6.83e before adsorption, 0.18e was received by Fe1 atom, and it was the electron receptor during this adsorption process. Another important finding was related to O1 atom that the population of 2p orbital decreased from 4.88e to 4.73e and the located electron number decreased by 0.17e in total. Hence it can be seen that the electron numbers received by Fe1 atom almost equaled to those donated by O1 atom, which was indicative of electrons’ transfer from O1 to Fe1. It was concluded that the electrons donated by the donor O atom transferred to the receptor Fe atom, giving rise to the formation of covalent bond between siderite surface and oleate. In addition, the predominant active orbitals of Fe atom and O atom during interaction were 3d orbital and 2p orbital separately.
3.4. PeakForce Tapping Imaging of Siderite
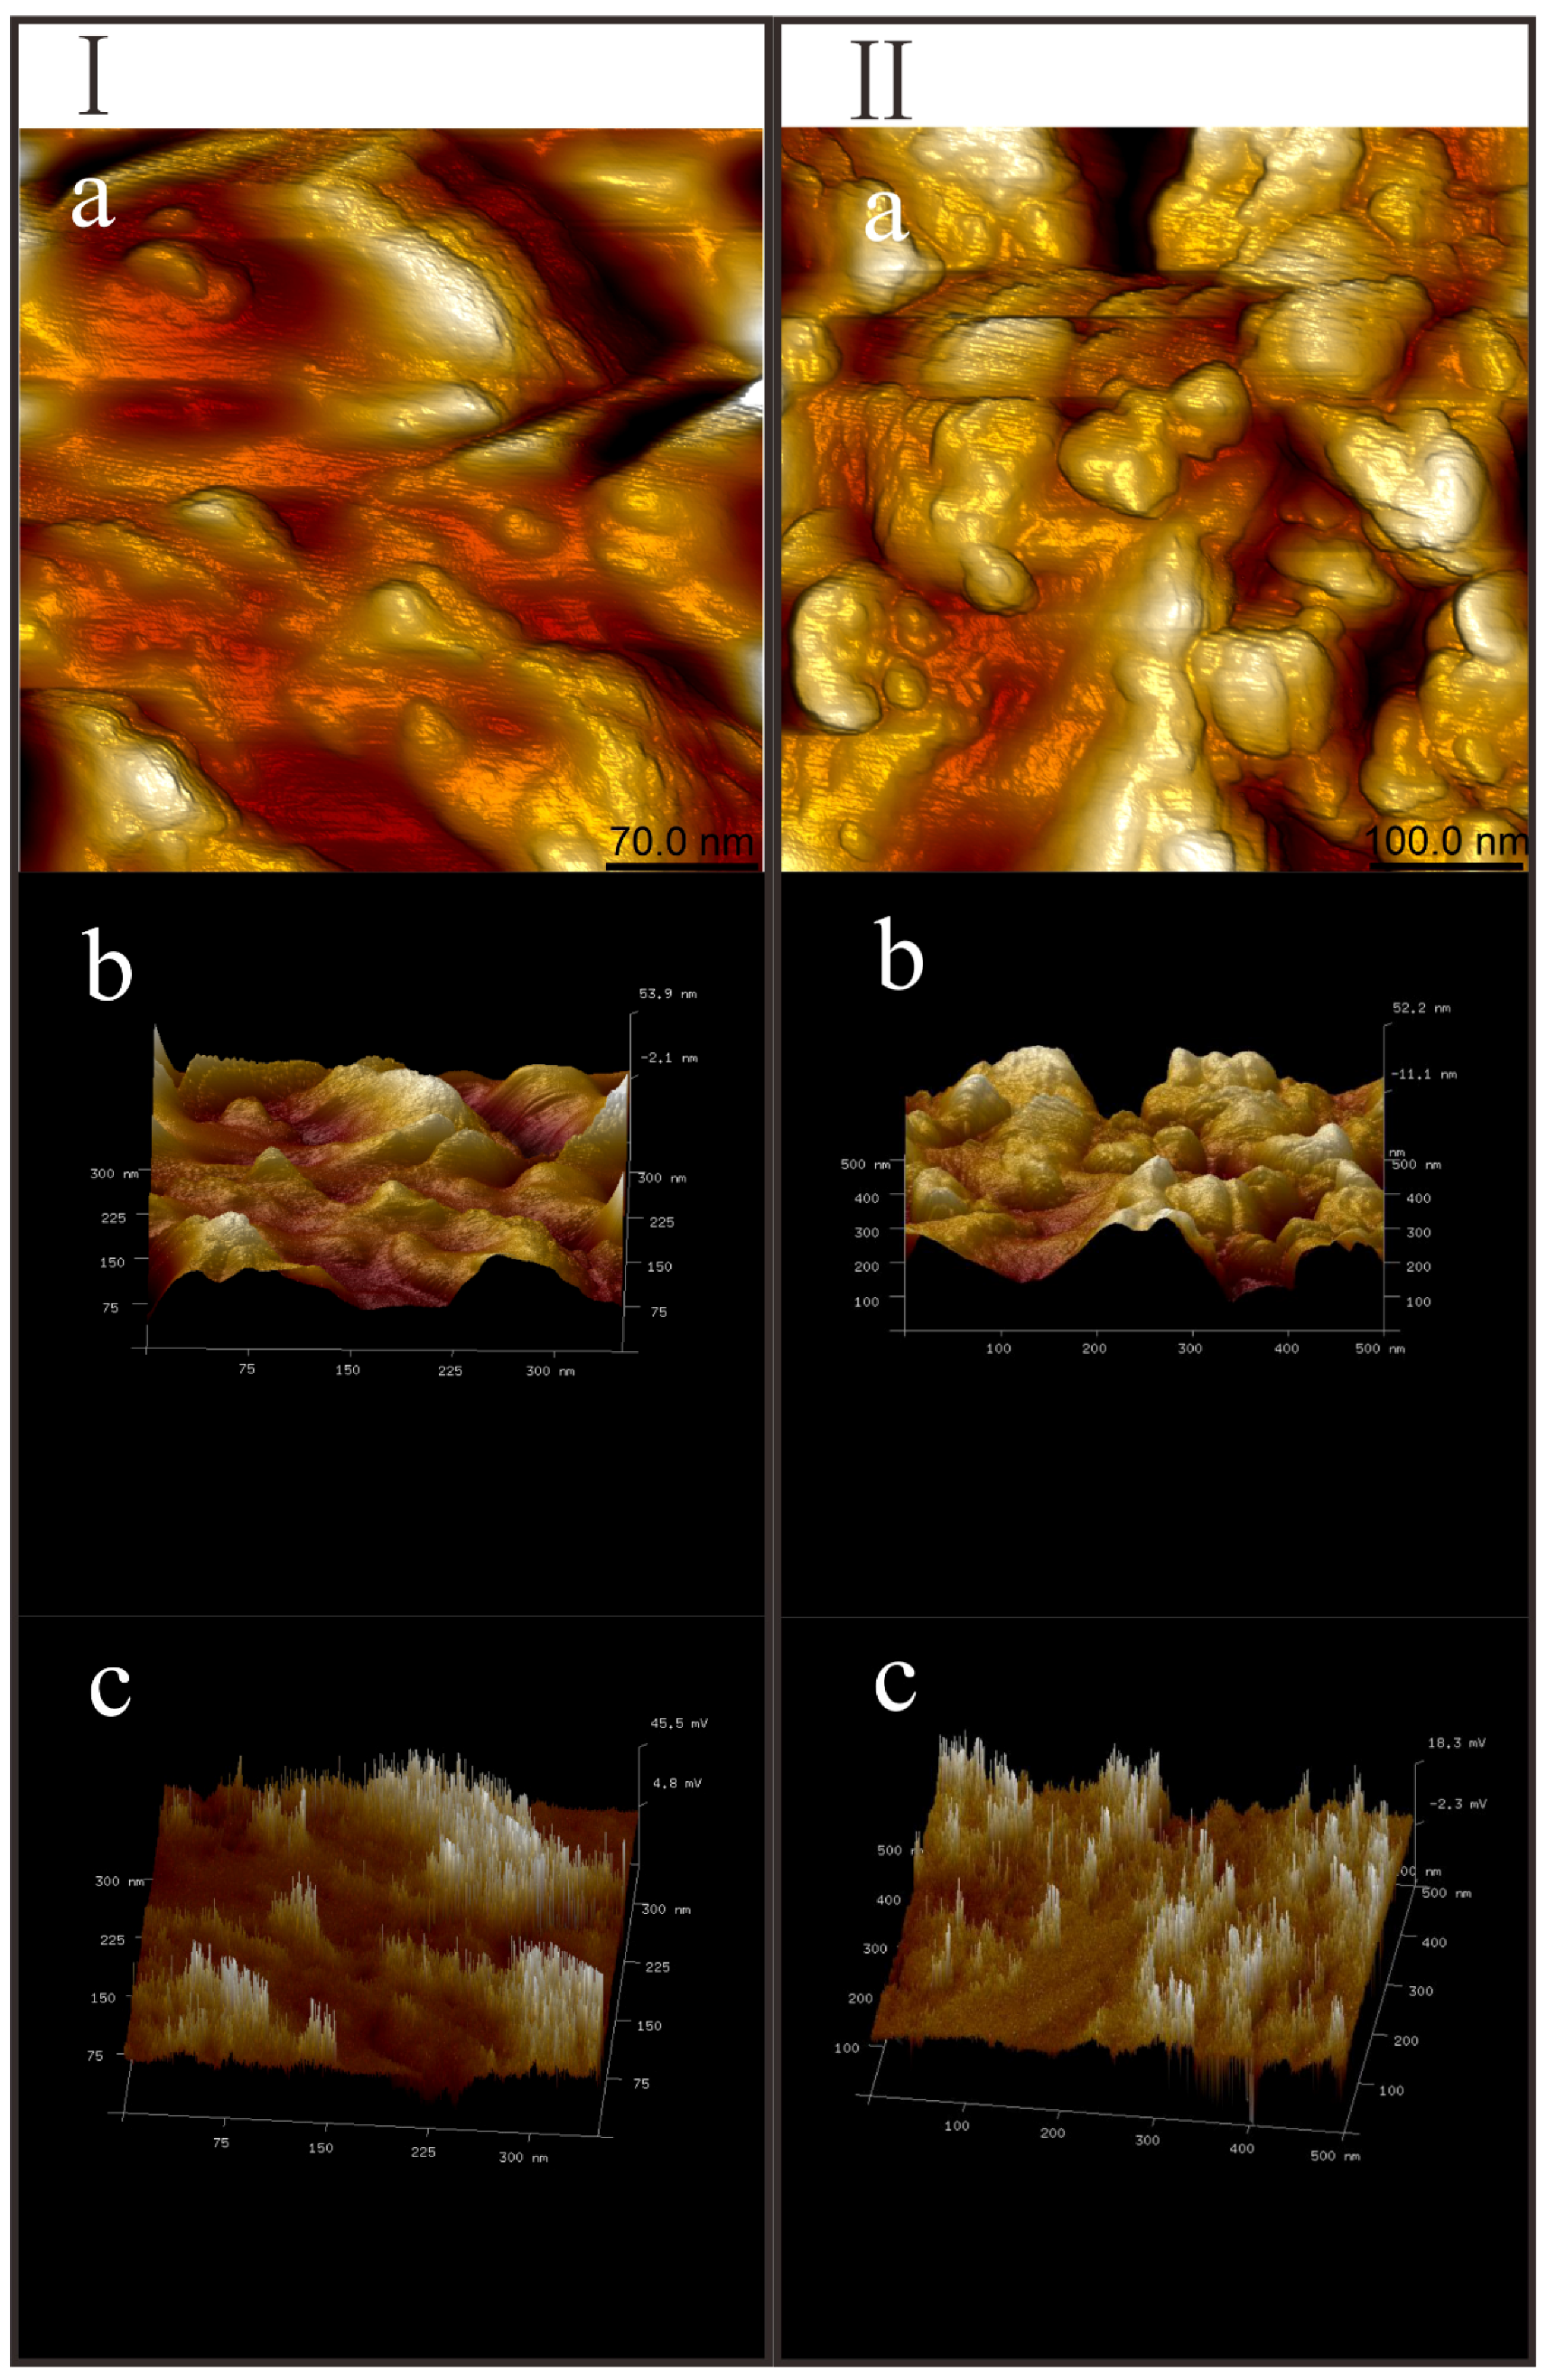
Height imaging of AFM is popular in three dimensional (3D) measurement of nano-materials and is also widely reported to characterize different materials by analyzing their surface roughnesses (as the average surface heights). Two specimens, one was siderite and the other was siderite functioned by oleate, were examined by AFM at the ambient environment to evaluate the potential of PeakForce Tapping mode to visualize the relatively large particles. In Figure 6-I and 6-II, the AFM height images of the siderite and the siderite with oleate functioned on were demonstrated independently.
The images of (a), (b), and (c) in Figure 6-I and 6-II are height images of two-dimension (2D), height images of three-dimension (3D) and PeakForce error images separately. PeakForce tapping error image is the characteristic feature of PeakForce tapping AFM mode, where the maximum value of the tip-surface interaction force is used as a constant set point for each pixel of the area scanned. Due to the surface topography in homogeneity, a non-zero difference exists between the measured PeakForce value and the set point. Therefore, PeakForce error imaging is sensitive to topography deviations. [38].
As can be observed in Figure 6-I and 6-II, the surfaces of siderite specimens with oleate functioned on were obviously rougher than those of pure siderite surfaces. Results inferred that these vesicular in Figure 6(II-a) were oleate and the most important characteristic of this surface was the uniformity of the roughness because of closely spaced valleys and peaks [39]. Among the images in Figure 6, the bottom two ones are PeakForce Tapping error images, which clearly exhibit the topography deviations of surfaces. By comparison of Figure 6(I-c) with Figure 6(II-c), it could be identified that in Figure 6(I-c) the surface of the pure siderite looks like a non-uniform film with peaks and valleys appearing on the edge of siderite particle and the smoothness area is bigger than that in Figure 6(II-c), while on the surface of siderite functioned by oleate in Figure 6(II-c), the peaks and valleys distribute throughout the whole surface. This phenomenon meant that the surface of siderite with oleate functioned was rougher, and also indicated the vesiculars in Figure 6(II-a) were oleate. In contrast to the images of pure siderite surface and roughness (as the average surface height) in Figure 6-I, the corresponding images of siderite functioned by oleate revealed the functioned surface was covered by vesicular membrane matters and the average roughness was 16.4 nm, while the pure siderite surface in Figure 6-I presented a smoother surface and the most common values for height/width centralized around 14.2 nm.
4. Conclusions
DFT calculations coupled with AFM imaging of PeakForce Tapping mode were undertaken to study the interaction between oleate and siderite surface. The geometrical siderite crystal structures were optimized by carrying out convergence tests of exchange-correlation potential, kinetic cutoff energy, and k-point. Possible adsorption configurations of oleate on the siderite (101) surface were evaluated in terms of total adsorption energy of the substrate-adsorbate system. Afterwards, the interaction status of oleate on siderite and the bond type were identified by Mulliken population calculation. Moreover, the height imaging and the PeakForce error imaging of AFM were performed to visually observe the adsorption of oleate on siderite surface.
It was identified that a siderite slab surface with the slab depth of 26.964 Å and the vacuum thickness of 26 Å as a rational surface structure, with the exchange/correlation potential of GGA-WC, the kinetic cutoff energy of 360 eV, and the Brillouin zone k-point of 4 × 4 × 2.
The calculated interaction energy of −360.006 kJ/mol revealed that oleate could adsorb on siderite (101) surface and the corresponding O-Fe distance was evaluated as 1.746 Å. Results of the Mulliken population calculations inferred that the covalent bond formed between oleate and siderite surface by means of electrons transferring from O1 (in oleate molecule) to Fe1 (in siderite lattice). As a result, valence-electrons’ configurations of Fe1 and O1 changed into 3d6.514s0.37 and 2s1.832p4.73 from 3d6.214s0.31 and 2s1.83p4.88 correspondingly.
By comparison of AFM images of siderite surface with or without oleate functioned, the surface of the pure siderite was found to be a non-uniform film with peaks and valleys appearing on the edge. Alternatively, siderite surface with oleate functioned exhibited many peaks and valleys distributing throughout the whole surface. Results of DFT calculation paired with AFM imaging testified that the functioning of oleate on siderite surface was performed by forming covalent bond between Fe1 (in siderite surface) and O1 (in oleate molecule).
Findings in this paper further demonstrated that siderite deteriorates hematite reverse flotation by the means of interacting with the collector oleate which acts as the collector in general hematite reverse flotation.
Acknowledgments
This work was carried out with the funding provided by the National Natural Science Foundation of China (51574061) and financial support by the China Scholarship Council (201606085037).
Author Contributions
Lixia Li was responsible for DFT calculation and writing this paper; Chen Zhang conducted AFM tests and was the correspondent author; Zhitao Yuan, Haiqing Hao and Chenyang Zhao carried out supporting experiments, and also gave some advice on the manuscript writing.
Conflicts of Interest
The authors declare no conflict of interest.
References
- Pradip; Rai, B.A.; Rao, T.K.; Krishnamurthy, S.; Vetrivel, R.; Mielczarski, J.; Cases, J.M. Molecular modeling of Interactions of diphosphonic acid based surfactants with calcium minerals. Langmuir 2002, 18, 932–940. [Google Scholar] [CrossRef]
- Dzade, N.; Roldam, A.; Leeuw, N. A density functional theory study of the adsorption of benzene on hematite (α-Fe2O3) surfaces. Minerals 2014, 4, 89–115. [Google Scholar] [CrossRef]
- Filippov, L.O.; Severov, V.V.; Filippova, I.V. The use of collectors mixture in the reverse cationic flotation of magnetite ore: The role of Fe-bearing silicates. Miner. Eng. 2010, 23, 91–98. [Google Scholar] [CrossRef]
- Wang, Y.; Ren, J. The flotation of quartz from iron minerals with a combined quaternary ammonium salt. Int. J. Miner. Process. 2005, 77, 116–122. [Google Scholar] [CrossRef]
- Turrer, H.D.G.; Peres, A.E.C. Investigation on alternative depressants for iron ore flotation. Miner. Eng. 2010, 23, 1066–1069. [Google Scholar] [CrossRef]
- Birinci, M.; Miller, J.D.; Sarıkaya, M.; Wang, X. The effect of an external magnetic field on cationic flotation of quartz from magnetite. Miner. Eng. 2010, 23, 813–818. [Google Scholar] [CrossRef]
- Montes-Sotomayor, S.; Houot, R.; Kongolo, M. Flotation of silicated gangue iron ores: mechanism and effect of starch. Miner. Eng. 1998, 11, 71–76. [Google Scholar] [CrossRef]
- Li, L.; Yin, W.; Wang, Y.; Tao, S.J. Effect of siderite on flotation separation of martite and quartz. J. Northeast. Univer. (Nat. Sci.) 2012, 33, 431–434. [Google Scholar]
- Rustad, J.R.; Felmy, A.R.; Bylaska, E.J. Molecular simulation of the magnetite-water interface. Geochim. Cosmochim. Acta 2003, 67, 1001–1016. [Google Scholar] [CrossRef]
- Kundu, T.K.; Rao, K.H.; Parker, S.C. Atomistic simulation studies of magnetite surface structures and adsorption behavior in the presence of molecular and dissociated water and formic acid. J. Colloid Interface Sci. 2006, 295, 364–373. [Google Scholar] [CrossRef] [PubMed]
- GMartin, J.; Cutting, R.S.; Vaughan, D.J.; Warren, M.C. Bulk and key surface structures of hematite, magnetite, and goethite: A density functional theory study. Am. Mineral. 2009, 94, 1341–1350. [Google Scholar] [CrossRef]
- Blengino, J.M.; Keddam, M.; Labbe, J.P.; Robbiola, L. Physico-chemical characterization of corrosion layers formed on iron in a sodium carbonate-bicarbonate containing environment. Corros. Sci. 1995, 37, 621–643. [Google Scholar] [CrossRef]
- Badaut, V.; Zeller, P.; Dorado, B.; Schlegel, M.L. Influence of Exchange Correlation on the Symmetry and Properties of Siderite According to Density-Functional Theory. Phys. Rev. B 2010, 82, 82. [Google Scholar] [CrossRef]
- Rath, S.S.; Sinhab, N.; Sahoo, H.; Das, B.; Mishra, B.K. Molecular modeling studies of oleate adsorption on iron oxides. Appl. Surf. Sci. 2014, 295, 115–122. [Google Scholar] [CrossRef]
- Shi, H.; Luo, W.; Johansson, B.; Ahuja, R. First-principles calculations of the electronic structure and pressure-induced magnetic transition in siderite FeCO3. Phys. Rev. B 2008, 78, 155119. [Google Scholar] [CrossRef]
- Blanchard, M.; Poitrasson, F.; Méheut, M.; Lazzeri, M.; Mauri, F.; Balan, E. Iron isotope fractionation between pyrite (FeS2), hematite (Fe2O3) and siderite (FeCO3): A first-principles density functional theory study. Geochim. Cosmochim. Acta 2009, 73, 6565–6578. [Google Scholar] [CrossRef]
- Li, L.; Hao, H.; Yuan, Z.; Liu, J. Molecular dynamics simulation of siderite-hematite-quartz flotation with sodium oleate. Appl. Surf. Sci. 2017, 419, 557–563. [Google Scholar] [CrossRef]
- Banerjee, S.; Gayathri, N.; Dash, S.; Tyagi, A.K.; Raj, B. Imaging distribution of local stiffness over surfaces using atomic force acoustic microscopy. J. Phys. D Appl. Phys. 2007, 40, 2539–2547. [Google Scholar] [CrossRef]
- Kajiyama, K.; Tanaka, K.; Ge, S.R.; Takahara, A. Morphology and mechanical properties of polymer surfaces via scanning force microscopy. Prog. Surf. Sci. 1996, 52, 1–52. [Google Scholar] [CrossRef]
- Zhong, J.; Yan, J. Seeing is believing: Atomic force microscopy imaging for nanomaterial research. RSC Adv. 2015, 6, 1103–1121. [Google Scholar] [CrossRef]
- Renard, F.; Putnis, C.V.; Montes-Hernandez, G.; King, H.E. Interactions of arsenic with calcite surfaces revealed by in situ nanoscale imaging. Geochim. Cosmochim. Acta 2015, 159, 61–79. [Google Scholar] [CrossRef]
- Zhong, Q.; Inniss, D.; Kjoller, K.; Elings, V.B. Fractured polymer/silica fiber surface studied by tapping mode atomic force microscopy. Surf. Sci. Lett. 1993, 290, L688–L692. [Google Scholar] [CrossRef]
- Megevand, B.; Pruvost, S.; Lins, L.C.; Livi, S.; Gerard, J.; Duchet-Rumeau, J. Probing nanomechanical properties with AFM to understand the structure and behavior of polymer blends compatibilized with ionic liquids. RSC Adv. 2016, 6, 96421–96430. [Google Scholar] [CrossRef]
- Mou, J.; Czajkowsky, D.M.; Sheng, S.J.; Ho, R.; Shao, Z. High resolution surface structure of E. coli GroES oligomer by atomic force microscopy. FEBS Lett. 1996, 381, 161–164. [Google Scholar] [CrossRef]
- Li, Q.; Qian, H.; Guo, D.; Liu, Y. Complexation of p-sulfonatocalixarenes with local anaesthetics guests: binding structures, stabilities, and thermodynamic origins. Eur. J. Org. Chemi. 2012, 2012, 3962–3971. [Google Scholar] [CrossRef]
- Bag, M.; Renna, L.A.; Adhikari, R.Y.; Karak, S.; Liu, F.; Lahti, P.M.; Russell, T.P.; Tuominen, M.T.; Venkataraman, D. Kinetics of ion transport in perovskite active layers and its implications for active layer stability. J. Am. Chem. Soc. 2015, 137, 13130–13137. [Google Scholar] [CrossRef] [PubMed]
- Kemnade, N.; Shearer, C.J.; Dieterle, D.J.; Cherevan, A.S.; Gebhardt, P.; Wilde, G.; Eder, D. Non-destructive functionalisation for atomic layer deposition of metal oxides on carbon nanotubes: Effect of linking agents and defects. Nanoscale 2015, 7, 3028–3034. [Google Scholar] [CrossRef] [PubMed]
- Zhang, Z.; Zhang, L.; Li, W.; Yu, A.; Wu, P. Carbon-coated mesoporous tio2 nanocrystals grown on graphene for lithium-ion batteries. ACS Appl. Mater. Interfaces 2015, 7, 10395. [Google Scholar] [CrossRef] [PubMed]
- Tang, Y.; Martin, S.T. Siderite dissolution in the presence of chromate. Geochim. Cosmochim. Acta 2011, 75, 4951–4962. [Google Scholar] [CrossRef]
- Weaver, R.M.; Grandstaff, D.E.; Myer, G.H. Surface stability of siderite under acidic atmosphere: An atomic force microscopy study. Mater. Res. Soc. 1996, 453, 727–732. [Google Scholar] [CrossRef]
- Lavina, B.; Dera, P.; Downs, R.T.; Yang, W.; Sinogeikin, S.; Meng, Y.; Shen, G.; Schiferl, D. Siderite at lower mantle conditions and the effects of the pressure-induced spin-pairing transition. Geophys. Res. Lett. 2009, 36, L23306. [Google Scholar] [CrossRef]
- Dong, W.; Wang, Y.; Chen, Z.; Yang, K. A homochiral metal-organic framework membrane for enantioselective separation. Chem. Commun. 2012, 48, 7022. [Google Scholar] [CrossRef]
- Hu, Y.; Gao, Z.; Sun, W.; Liu, X. Anisotropic surface energies and adsorption behaviors of scheelite crystal. Colloid Surf. Physicochem. Eng. Asp. 2012, 415, 439–448. [Google Scholar] [CrossRef]
- Xua, L.; Hu, Y.; Dong, F.; Gao, Z.; Wu, H.; Wang, Z. Anisotropic adsorption of oleate on diaspore and kaolinite crystals: Implications for their flotation separation. Appl. Surf. Sci. 2014, 321, 331–338. [Google Scholar] [CrossRef]
- Pavel, T.; Josef, K.; Udo, V. On the use of peak-force tapping atomic force microscopy for quantification of the local elastic modulus in hardened cement paste. Cem. Concr. Res. 2012, 42, 215–221. [Google Scholar] [CrossRef]
- Prywer, J.; Cryst, J. Effect of crystal geometry on disappearance of slow-growing faces. J. Cryst. Growth 2001, 224, 134–144. [Google Scholar] [CrossRef]
- Yin, W.; Li, D.; Luo, X.; Yao, J.; Sun, Q. Effect and mechanism of siderite on reverse flotation of hematite. Int. J. Miner. Metall. Mater. 2016, 23, 373–379. [Google Scholar] [CrossRef]
- Fakhrullina, G.; Akhatova, F.; Kibardina, M.; Fokin, D.; Fakhrullin, R. Nanoscale imaging and characterisation of Caenorhabditis elegans epicuticle using atomic force microscopy. Nanomed. Nanotechnol. Biol. Med. 2016, 13, 483–491. [Google Scholar] [CrossRef] [PubMed]
- Seiedi, O.; Rahbar, M.; Nabipour, M.; Emadi, M.A.; Ghatee, M.H.; Ayatollahi, S. Atomic force microscopy (afm) investigation on the surfactant wettability alteration mechanism of aged mica mineral surfaces. Energy Fuels 2011, 25, 183–188. [Google Scholar] [CrossRef]
Figure 1.
Total energies and lattice parameter differences versus k-points sets.
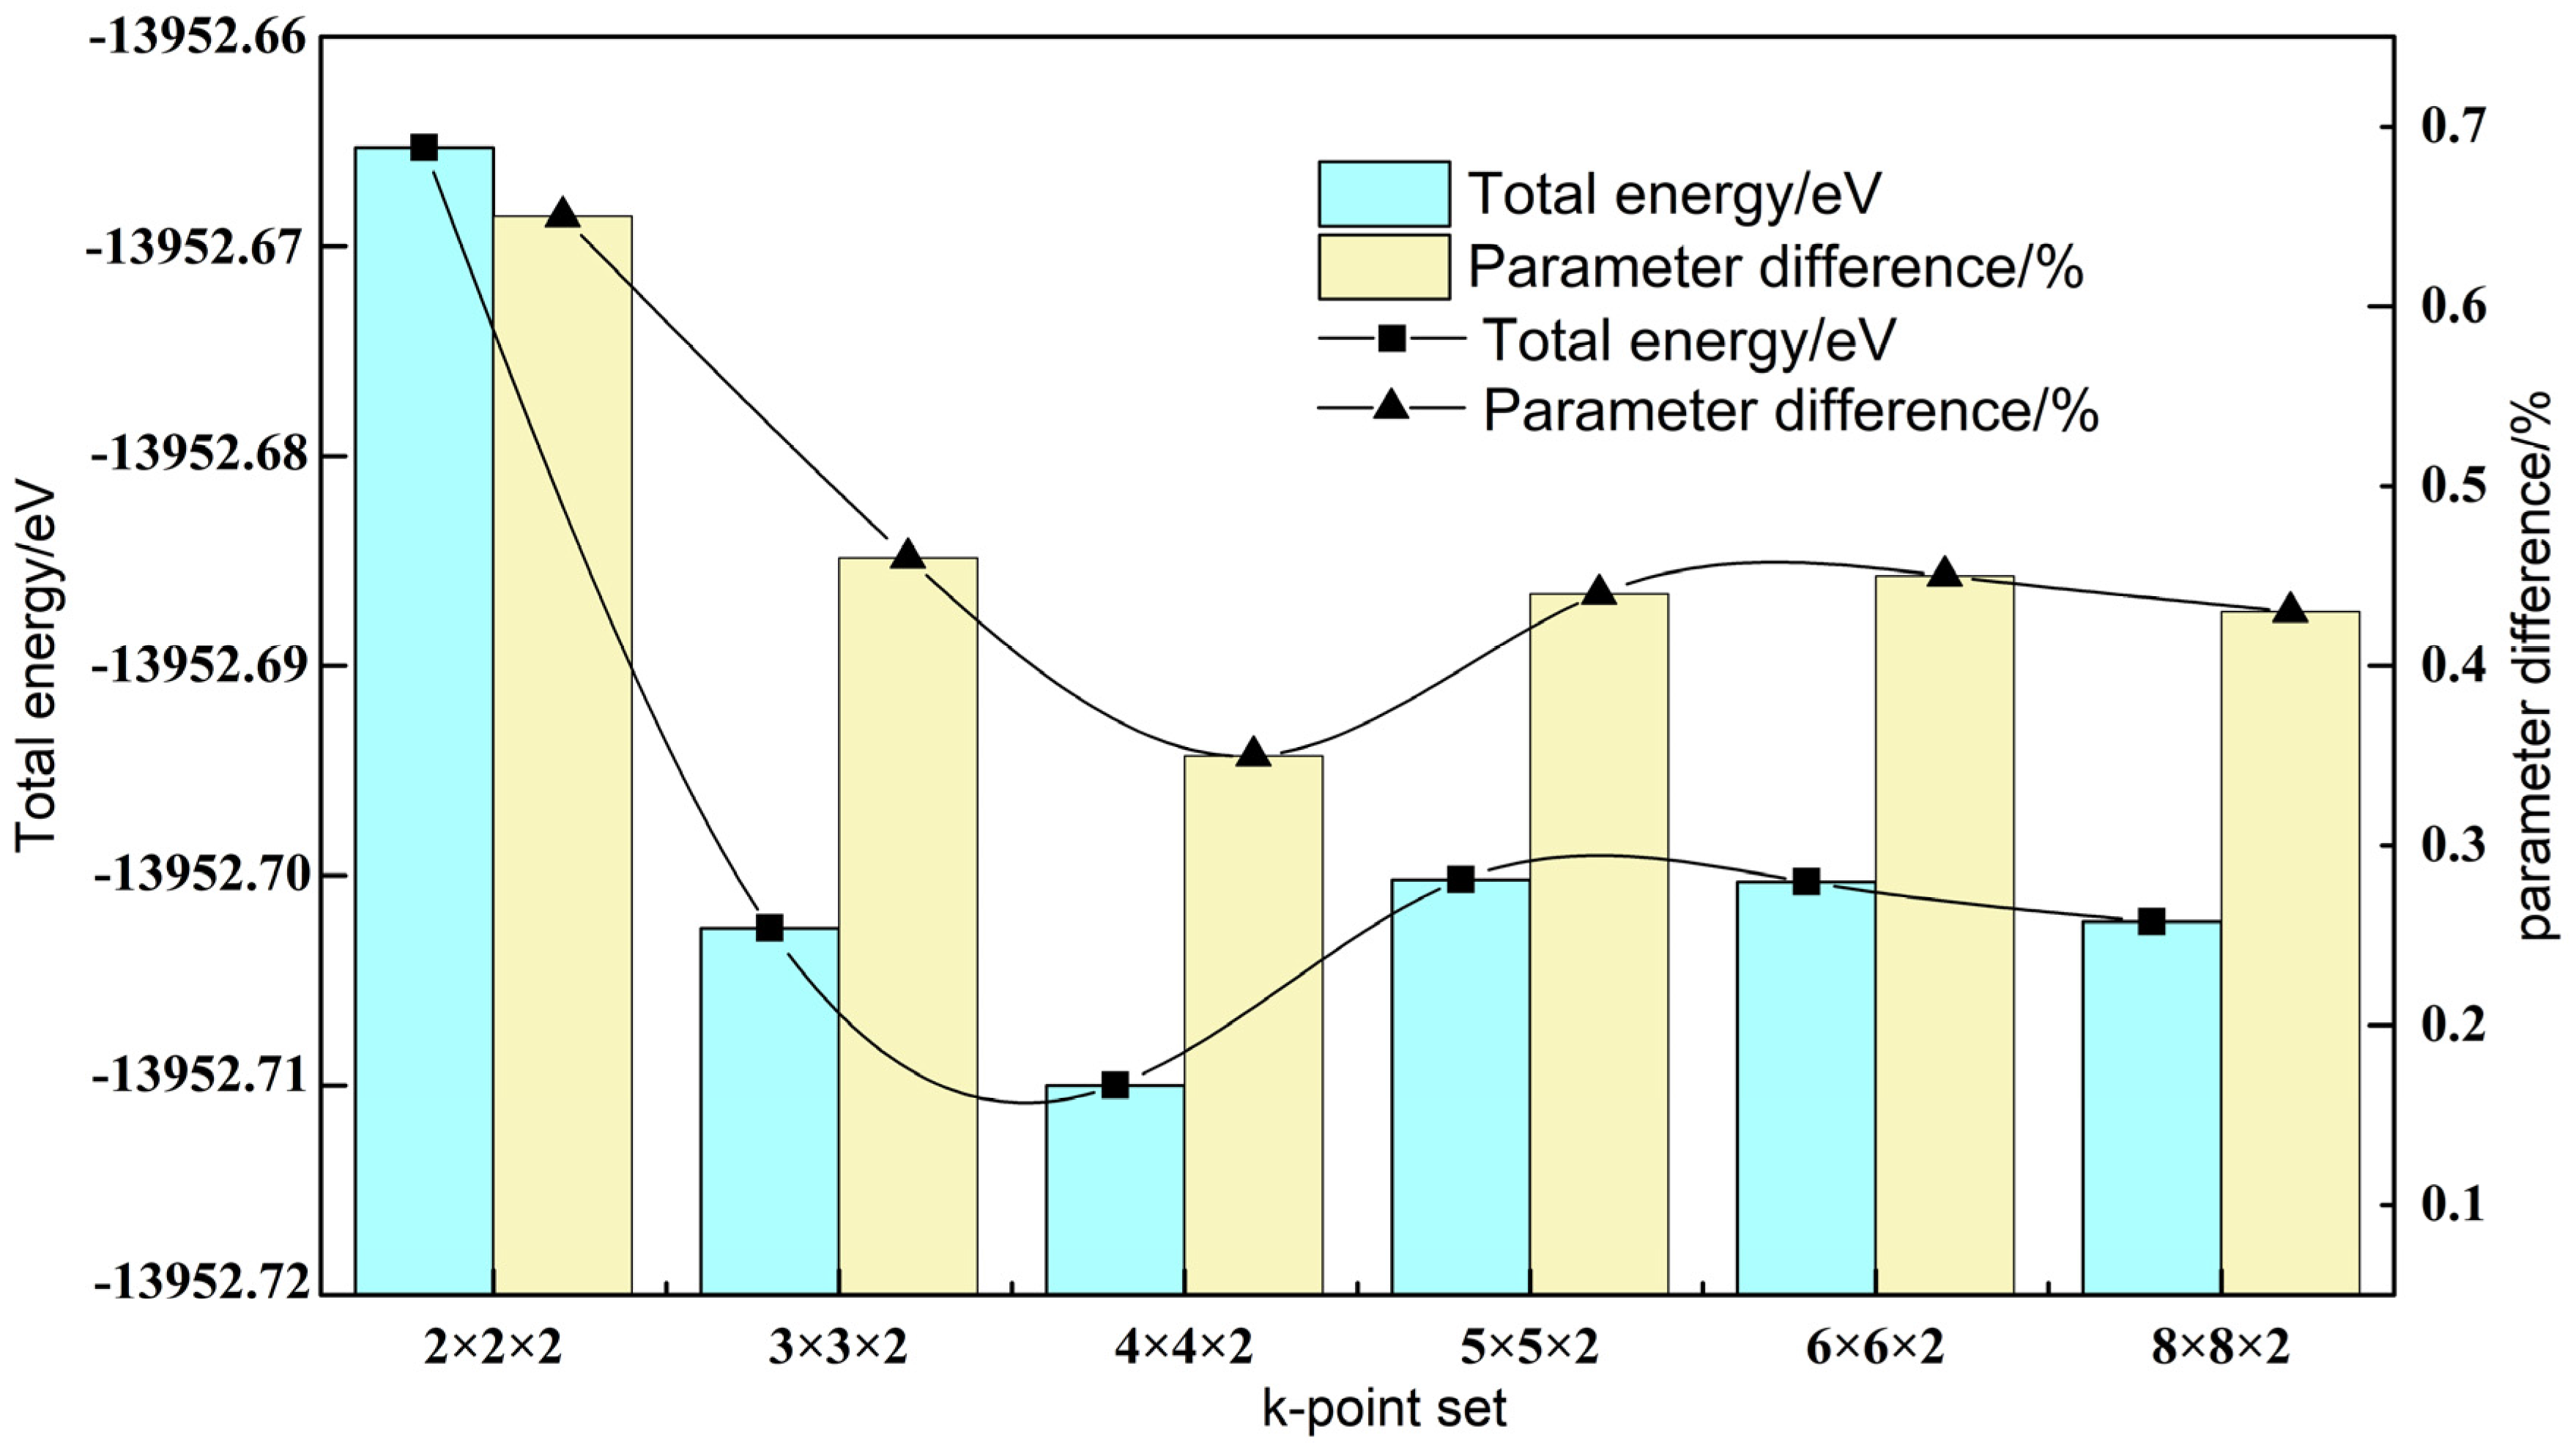
Figure 2.
Total energies and parameter differences as functions of kinetic cutoff energy.

Figure 3.
The cleaved siderite (101) surface before (a) and after (b) geometry optimization.

Figure 4.
The two possible models of oleate on siderite (101) surface before adsorption.

Figure 5.
Optimized adsorption configuration of oleate on siderite (101) surface after adsorption.

Figure 6.
PeakForce Tapping images of siderite (I) and siderite with oleate (II); Height images of 2D (a); Height images of 3D (b); PeakForce error images (c).
Figure 6.
PeakForce Tapping images of siderite (I) and siderite with oleate (II); Height images of 2D (a); Height images of 3D (b); PeakForce error images (c).


Table 1.
Compiled structural parameters of siderite.
| Category | Correlation-Exchange Potential | a/Å | V/(Å3) | α/° | Difference 1/% |
|---|---|---|---|---|---|
| Experimental | 5.797 | 98.14 | 47.73 | - | |
| Simulation | GGA-PBE | 5.962 | 102.60 | 46.72 | 2.8 |
| GGA-RPBE | 6.157 | 109.07 | 45.71 | 6.2 | |
| GGA-PW91 | 5.907 | 101.29 | 47.13 | 1.8 | |
| GGA-WC | 5.783 | 96.71 | 47.64 | 0.2 | |
| GGA-PBESOL | 5.734 | 95.90 | 48.15 | 1.1 |
1 The calculated parameters were acceptable if the biggest difference was smaller than 2%.
Table 2.
Calculated and experimental lattice parameters of siderite.
| Parameter | Experiment | Simulation | Difference/% |
|---|---|---|---|
| V/Å3 | 98.14 | 96.36 | 1.8 |
| a/Å | 75.797 | 75.758 | 0.6 |
| α/° | 47.73 | 47.73 | 0.1 |
Table 3.
Surface energies of siderite (101) slab surfaces as functions of slab depth or vacuum thickness.
Table 3.
Surface energies of siderite (101) slab surfaces as functions of slab depth or vacuum thickness.
| Conditions | Slab Depth/Å | Vacuum Thickness/Å | ||||||||
|---|---|---|---|---|---|---|---|---|---|---|
| 19.132 | 23.039 | 26.946 | 30.852 | 34.758 | 20 | 22 | 24 | 26 | 28 | |
| Surface energy/J·m−2 | 0.212 | 0.326 | 0.328 | 0.294 | 0.284 | 0.303 | 0.309 | 0.357 | 0.327 | 0.330 |
Table 4.
Mulliken bond populations of oleate on siderite.
| Atom | Bond | Population | Length/Å |
|---|---|---|---|
| Fe1 | Fe1-O1 | 0.50 | 1.746 |
| Fe1-O4 | 0.27 | 1.901 | |
| Fe1-O5 | 0.04 | 2.937 | |
| Fe1-C2 | −0.32 | 2.794 | |
| O1 | O1-C1 | 0.66 | 1.364 |
| O1-H1 | −0.01 | 2.496 | |
| O1-O3 | −0.01 | 2.931 |
Table 5.
Mulliken populations of Fe1 and O1 before and after oleate functioned on siderite surface.
| Atom | Status | s | d | p | Total/e | Charge/e |
|---|---|---|---|---|---|---|
| Fe1 | Before adsorption | 0.31 | 6.21 | 0.31 | 6.83 | 1.17 |
| After adsorption | 0.37 | 6.51 | 0.13 | 7.01 | 0.99 | |
| O1 | Before adsorption | 1.83 | 0 | 4.88 | 6.71 | −0.71 |
| After adsorption | 1.81 | 0 | 4.73 | 6.54 | −0.54 |
© 2018 by the authors. Licensee MDPI, Basel, Switzerland. This article is an open access article distributed under the terms and conditions of the Creative Commons Attribution (CC BY) license (http://creativecommons.org/licenses/by/4.0/).
Share and Cite
MDPI and ACS Style
Li, L.; Zhang, C.; Yuan, Z.; Hao, H.; Zhao, C. Density Functional Theory and Atomic Force Microscopy Study of Oleate Functioned on Siderite Surface. Minerals 2018, 8, 33. https://doi.org/10.3390/min8010033
AMA Style
Li L, Zhang C, Yuan Z, Hao H, Zhao C. Density Functional Theory and Atomic Force Microscopy Study of Oleate Functioned on Siderite Surface. Minerals. 2018; 8(1):33. https://doi.org/10.3390/min8010033
Chicago/Turabian StyleLi, Lixia, Chen Zhang, Zhitao Yuan, Haiqing Hao, and Chenyang Zhao. 2018. "Density Functional Theory and Atomic Force Microscopy Study of Oleate Functioned on Siderite Surface" Minerals 8, no. 1: 33. https://doi.org/10.3390/min8010033
Note that from the first issue of 2016, this journal uses article numbers instead of page numbers. See further details here.