CFD Simulation of Pipeline Transport Properties of Mine Tailings Three-Phase Foam Slurry Backfill


School of Resources and Safety Engineering, Central South University, Changsha 410083, China
*
Authors to whom correspondence should be addressed.
Minerals 2017, 7(8), 149; https://doi.org/10.3390/min7080149
Submission received: 12 July 2017
/
Revised: 10 August 2017
/
Accepted: 13 August 2017
/
Published: 17 August 2017
(This article belongs to the Special Issue Minerals in Mine Wastes: Contributions to the Circular Economy)
Abstract
:A three-dimensional backfill pipeline transport model is developed using the computational fluid dynamics (CFD) technique, which is applied to study the pipeline transport properties of three-phase foam slurry backfill (TFSB). Based on rheological property tests and CFD simulations, the foam phase, pressure, and velocity in the pipeline system are investigated using the CFD mixture method for different bubble volume fractions and bubble diameters. The simulation results indicate that TFSB can maintain a steady state during pipeline transport, experience a markedly reduced pipeline transport resistance, and exhibit better liquidity than conventional cement slurry. Furthermore, as the bubble volume fraction increases, the resistance of the pipeline decreases and the fluidity improves. By contrast, the bubble diameter has little effect on the transport properties of TFSB. The combined results of CFD simulations, slump tests, and strength tests indicate that, when the bubble volume fraction is 15–20 vol %, TFSB can satisfy the necessary strength requirements and exhibit self-flowing transport. The CFD technique provides an intuitive and accurate basis for pipeline transport research and has the potential for wider application in studies of mine backfill.
1. Introduction
Paste backfill technology represents an important direction for the development of mine backfill techniques [1,2,3,4,5]. After many years of continuous exploration and practice, paste backfill technology has been accepted and applied in numerous countries throughout the world by virtue of its advantages in terms of environmental protection, emission reduction, safety, and other aspects [6,7,8]. Backfill pipeline systems have been established in many mines as transportation systems to transport backfill material from the surface to the goaf [9]. As mining depth increased, these backfill pipelines have become much longer and deeper than before, and it has become difficult to achieve self-flowing transport of conventional cement slurry because of its poor fluidity. Although paste pumping technology can solve this problem, the purchase and maintenance of the necessary backfill pump equipment represents an enormous expenditure for a mine. Therefore, an increasing amount of attention has been paid to improve the transport properties of paste slurry while satisfying the transportation and strength requirements of the backfill [10].
Foam concrete is a new type of lightweight concrete material, which is composed of standard foam and cement and possesses a large number of closed pores. With high fluidity and low cement and aggregate usage, foam concrete is applied in sandwich structures, earth-retaining walls, and running tracks or playgrounds [11]. Based on successful experiences with applying foam concrete, Zhang et al. [12] and Chen et al. [13] have studied the application of foam slurry in mine backfill and have concluded that the backfill can meet the requirements.
For the continuous improvement of foam slurry backfill technology, research on the pipeline transport properties of solid-liquid-gas three-phase foam slurry backfill (TFSB) is necessary. In the past, research on pipeline transportation technology has been performed mostly based on analogy, experience-based formulas, and laboratory experiments to determine the optimal slurry backfill parameters [14,15]. However, such methods cannot be used to investigate the effects of foam factors (bubble volume fraction, bubble diameter, and so on) on the motion characteristics, pipe pressure loss, and changes in velocity of slurry backfill. With the development of computer technology, computational fluid dynamics (CFD) [16,17], which is based on classical fluid mechanics and numerical methods, has begun to be used to study the properties of slurry pipelines for backfill. Eesa and Barigou [18] published a CFD analysis of viscous non-Newtonian flow under the influence of a superimposed rotational vibration.
In this paper, the CFD technique is used to build a 3D pipeline transport model, which is applied to simulate the transport properties of TFSB. These simulations are combined with laboratory tests to study the effect of foam on the rheological properties of backfill slurry.
2. Materials and Methods
2.1. Foam Slurry Materials
2.1.1. Constituent Materials
TFSB refers to a backfill material that is synthesized from an admixture foam, cement, water, and necessary additives, which are mixed according to certain proportions and hardened by physical and chemical effects. In the case of a high slurry concentration and a low water-to-cement ratio, it also maintains good fluidity [19]. Foam was produced by a high-performance soil foaming agent of the SR-FL-001 [20] (dilution ratio 1:20 by weight). The basic properties of the standard foam are as follows: a density of 40–60 kg/m3, a foam diameter of 30–100 μm, and segregation-free foam when the temperature is above 0 °C. Cement was P.O 42.5R [21]. The water used in this research was tap water. In this study, mine tailings from a lead–zinc mine in China were used as additives, whose particles are less than 0.074 mm and about 80 wt %, and their mean grain size (d50) is 24.2 μm.
2.1.2. Manufacturing Process
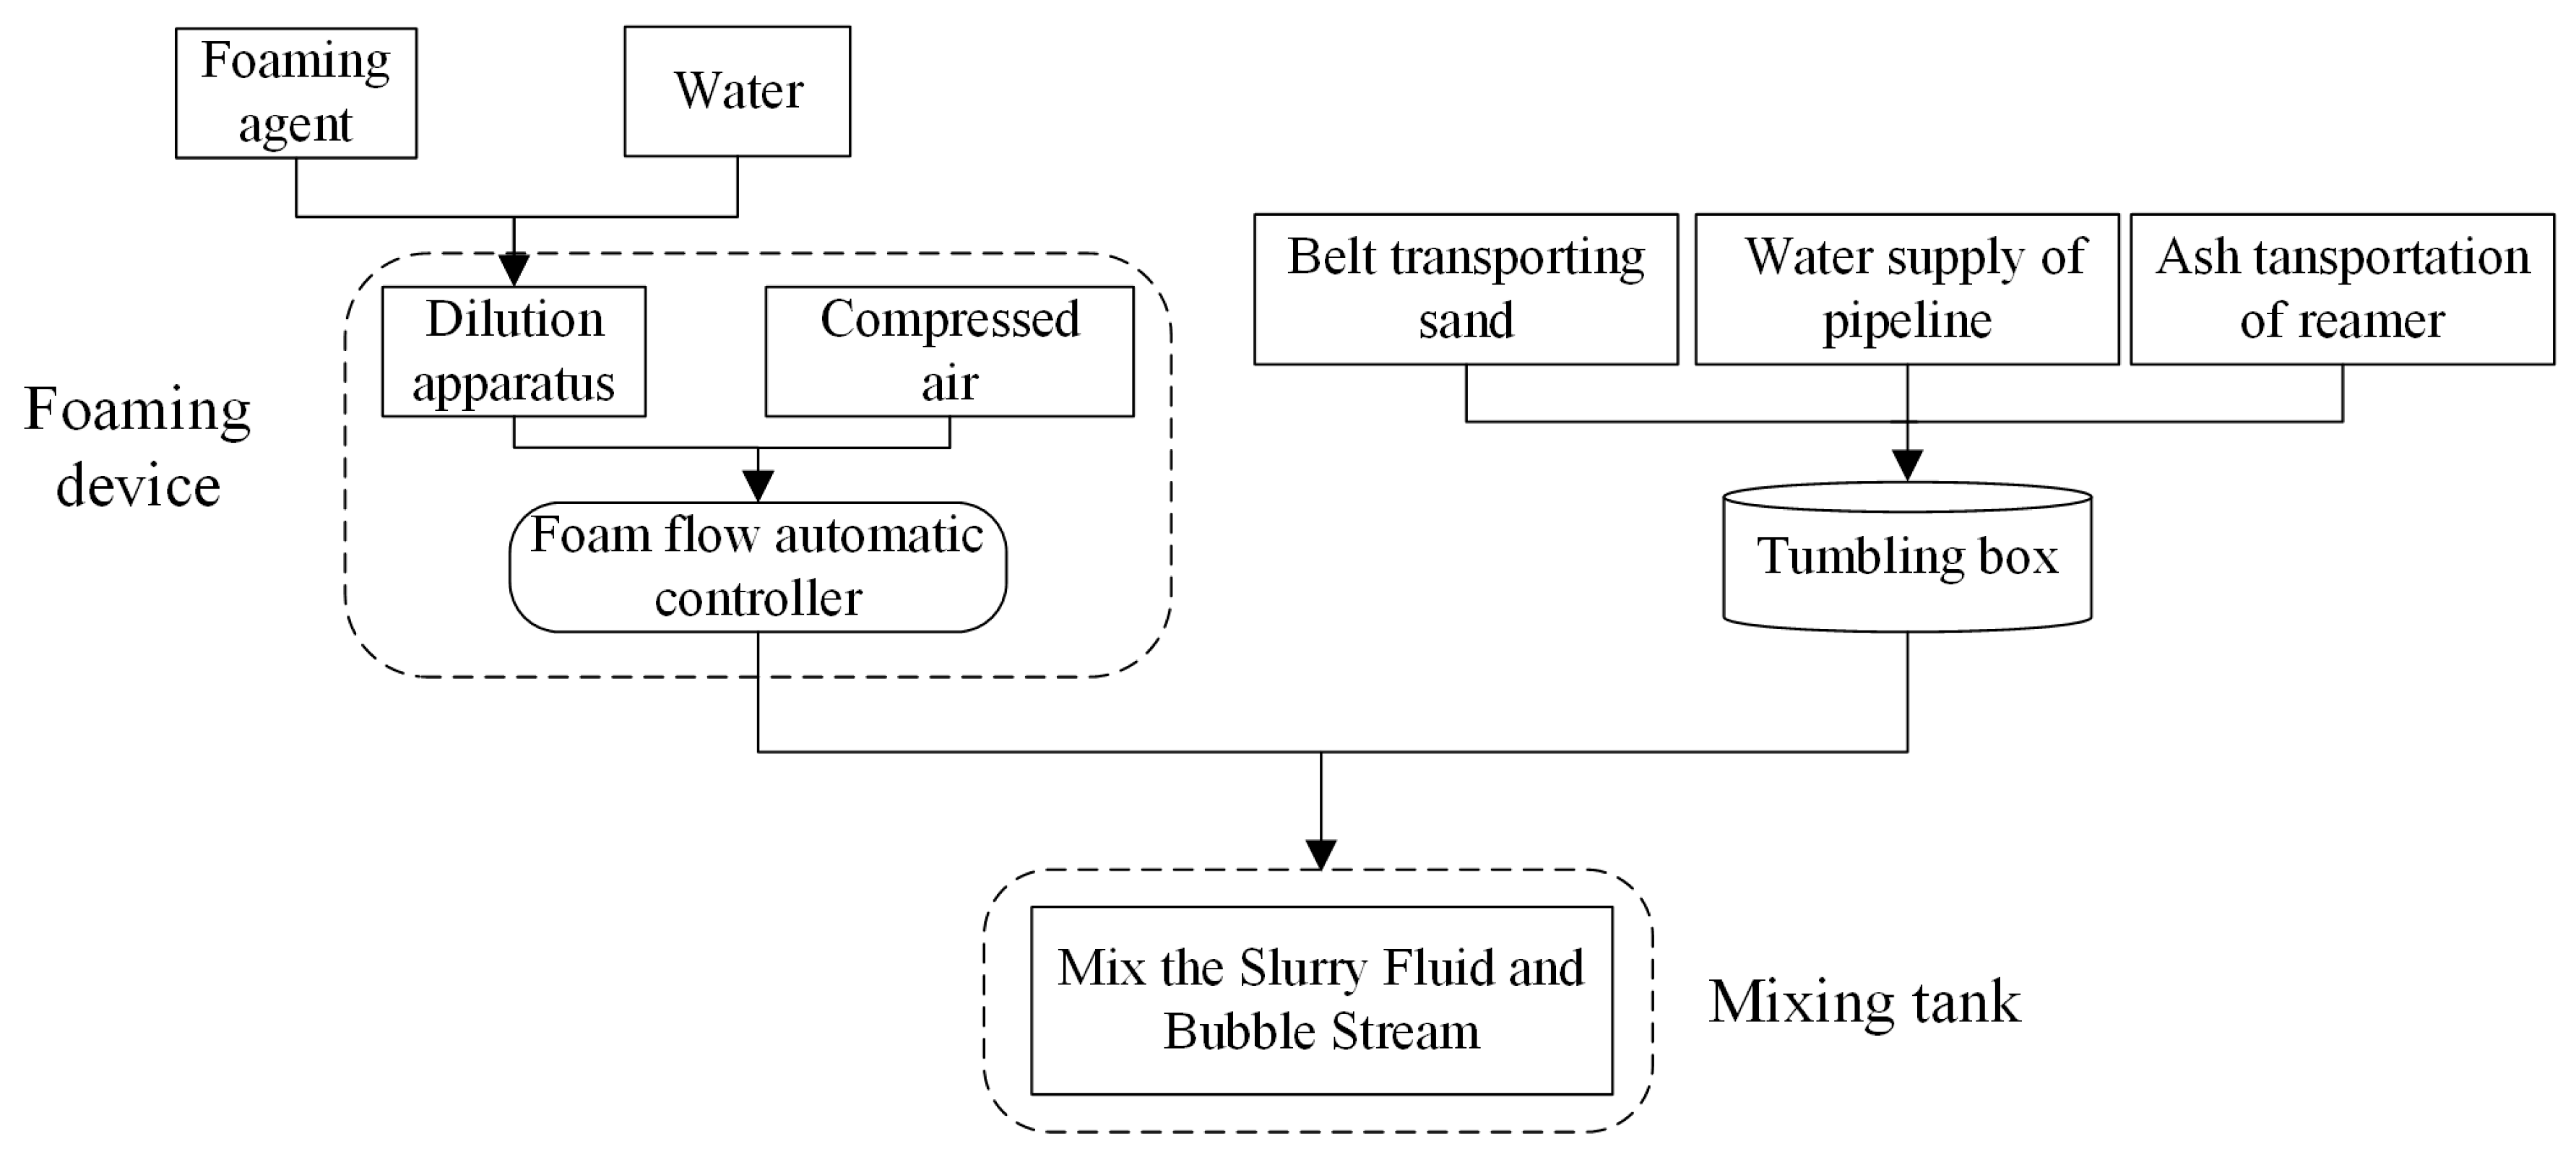
The preparation of foam slurry is divided into three steps. Figure 1 summarizes the manufacturing process.
- Foam preparation: A special foaming agent is fully mixed with water according to a given dilution ratio to generate foam. Then, the diluted liquid is loaded into a foaming gun along with compressed air at a certain pressure to prepare a standard-density foam.
- Cement slurry preparation: Cement, tailings, and water are mixed according to given proportions to prepare the cement slurry.
- TFSB preparation: The premade cement slurry and standard-density foam are mixed in a given proportion to prepare the TFSB.
2.2. Test Methods
2.2.1. Rheological Test
Rheological properties of TFSB were measured using a rheometer (R/S Plus) from Brookfield Engineering Laboratories, Inc (Middleboro, MA, USA). According to the proportion ratio, the slurry was mixed as uniformly as possible for 5 min and subsequently placed in the rheometer. The rotor speed of rheometer increased gradually from zero and ran for 120 s. Record shear stress and plastic viscosity per second.
2.2.2. Slump Tests
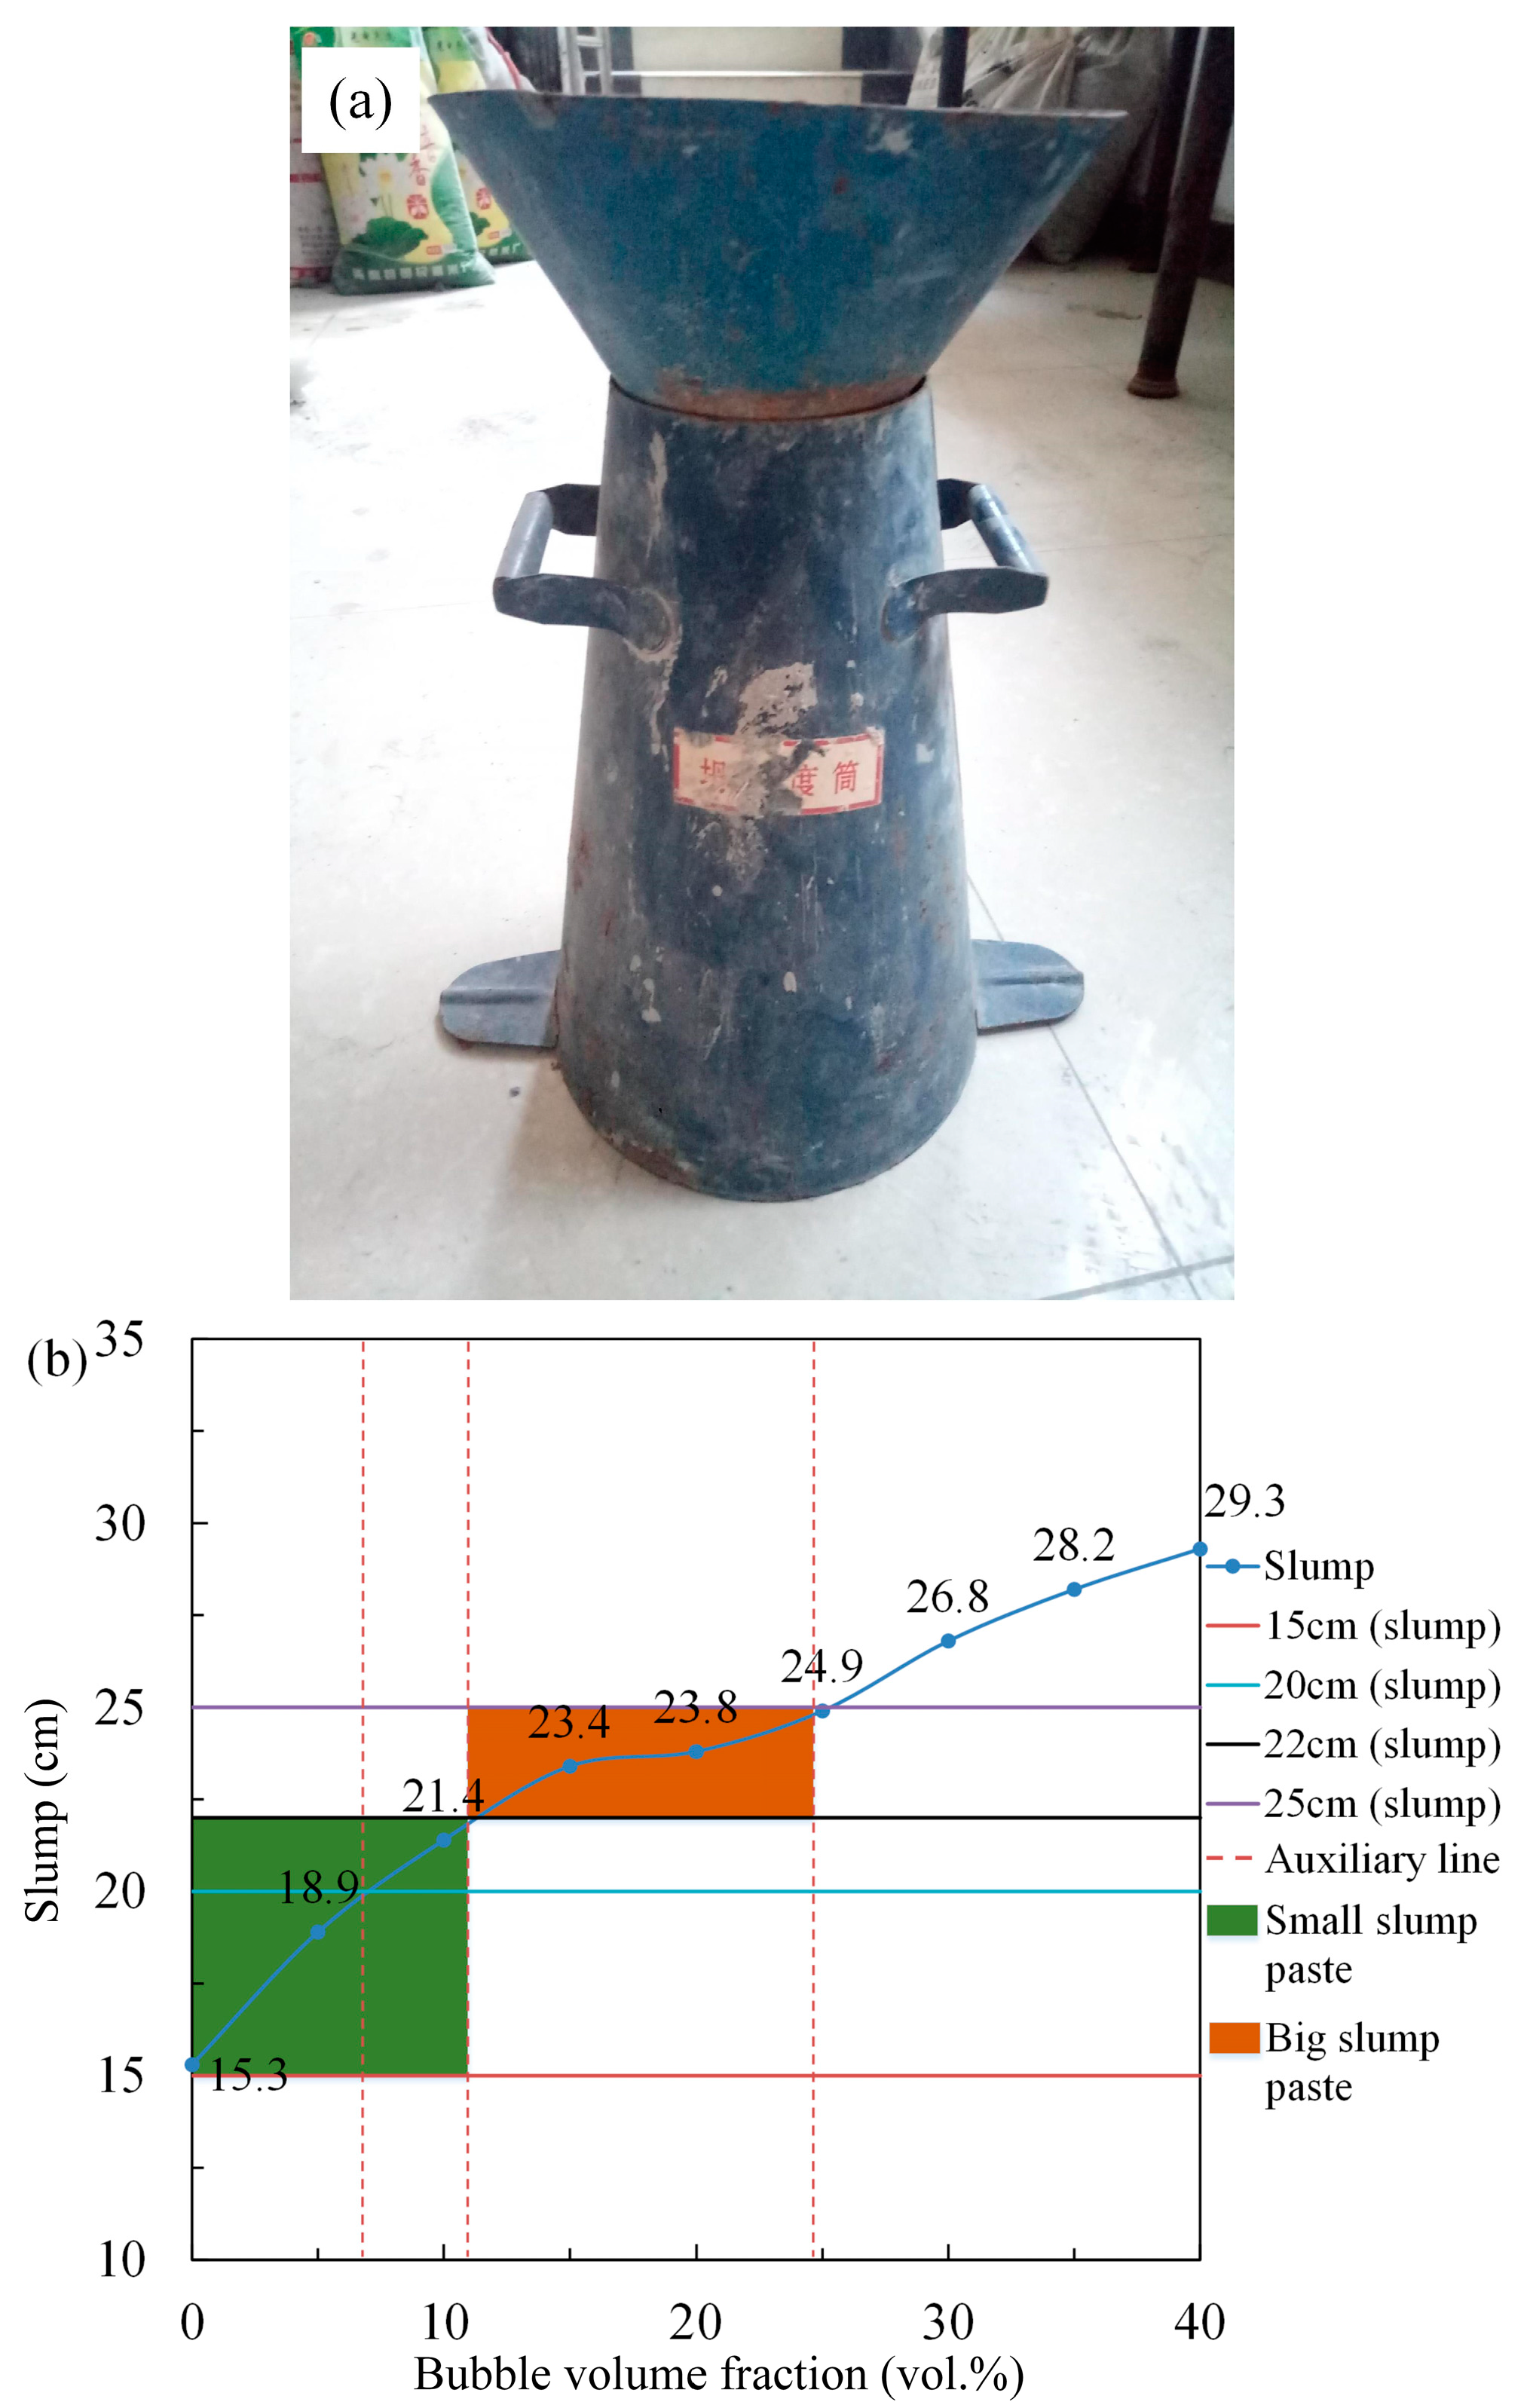
The slump test was originally developed to determine the “workability” or “consistency” of fresh concrete, and the standard slump instrument is a tapered cylinder with a height of 30 cm, an upper diameter of 10 cm, and a bottom diameter of 20 cm [22]. The slurry was poured into the slump instrument and tamped. Then picked up the slump instrument quickly, and the slurry flowed freely. The distance from the top of the slurry to the top of the slump instrument was measured after the slurry shape is stable; the distance is the slump value.
2.2.3. Strength Tests
The slurry was molded in dimensions of 70.7 mm × 70.7 mm × 70.7 mm, and the specimens were maintained by a TH10D laboratory humidifier (Texingda, Beijing, China), which was kept working to ensure that the temperature was controlled within a range of 23–26 °C and that the humidity was controlled within a range of 83%–87%. The compressive strength was tested respectively after 7 and 28 days by a WDW-2000 rigid hydraulic pressure servo machine (Ruite, Guilin, China).
2.3. CFD Simulation
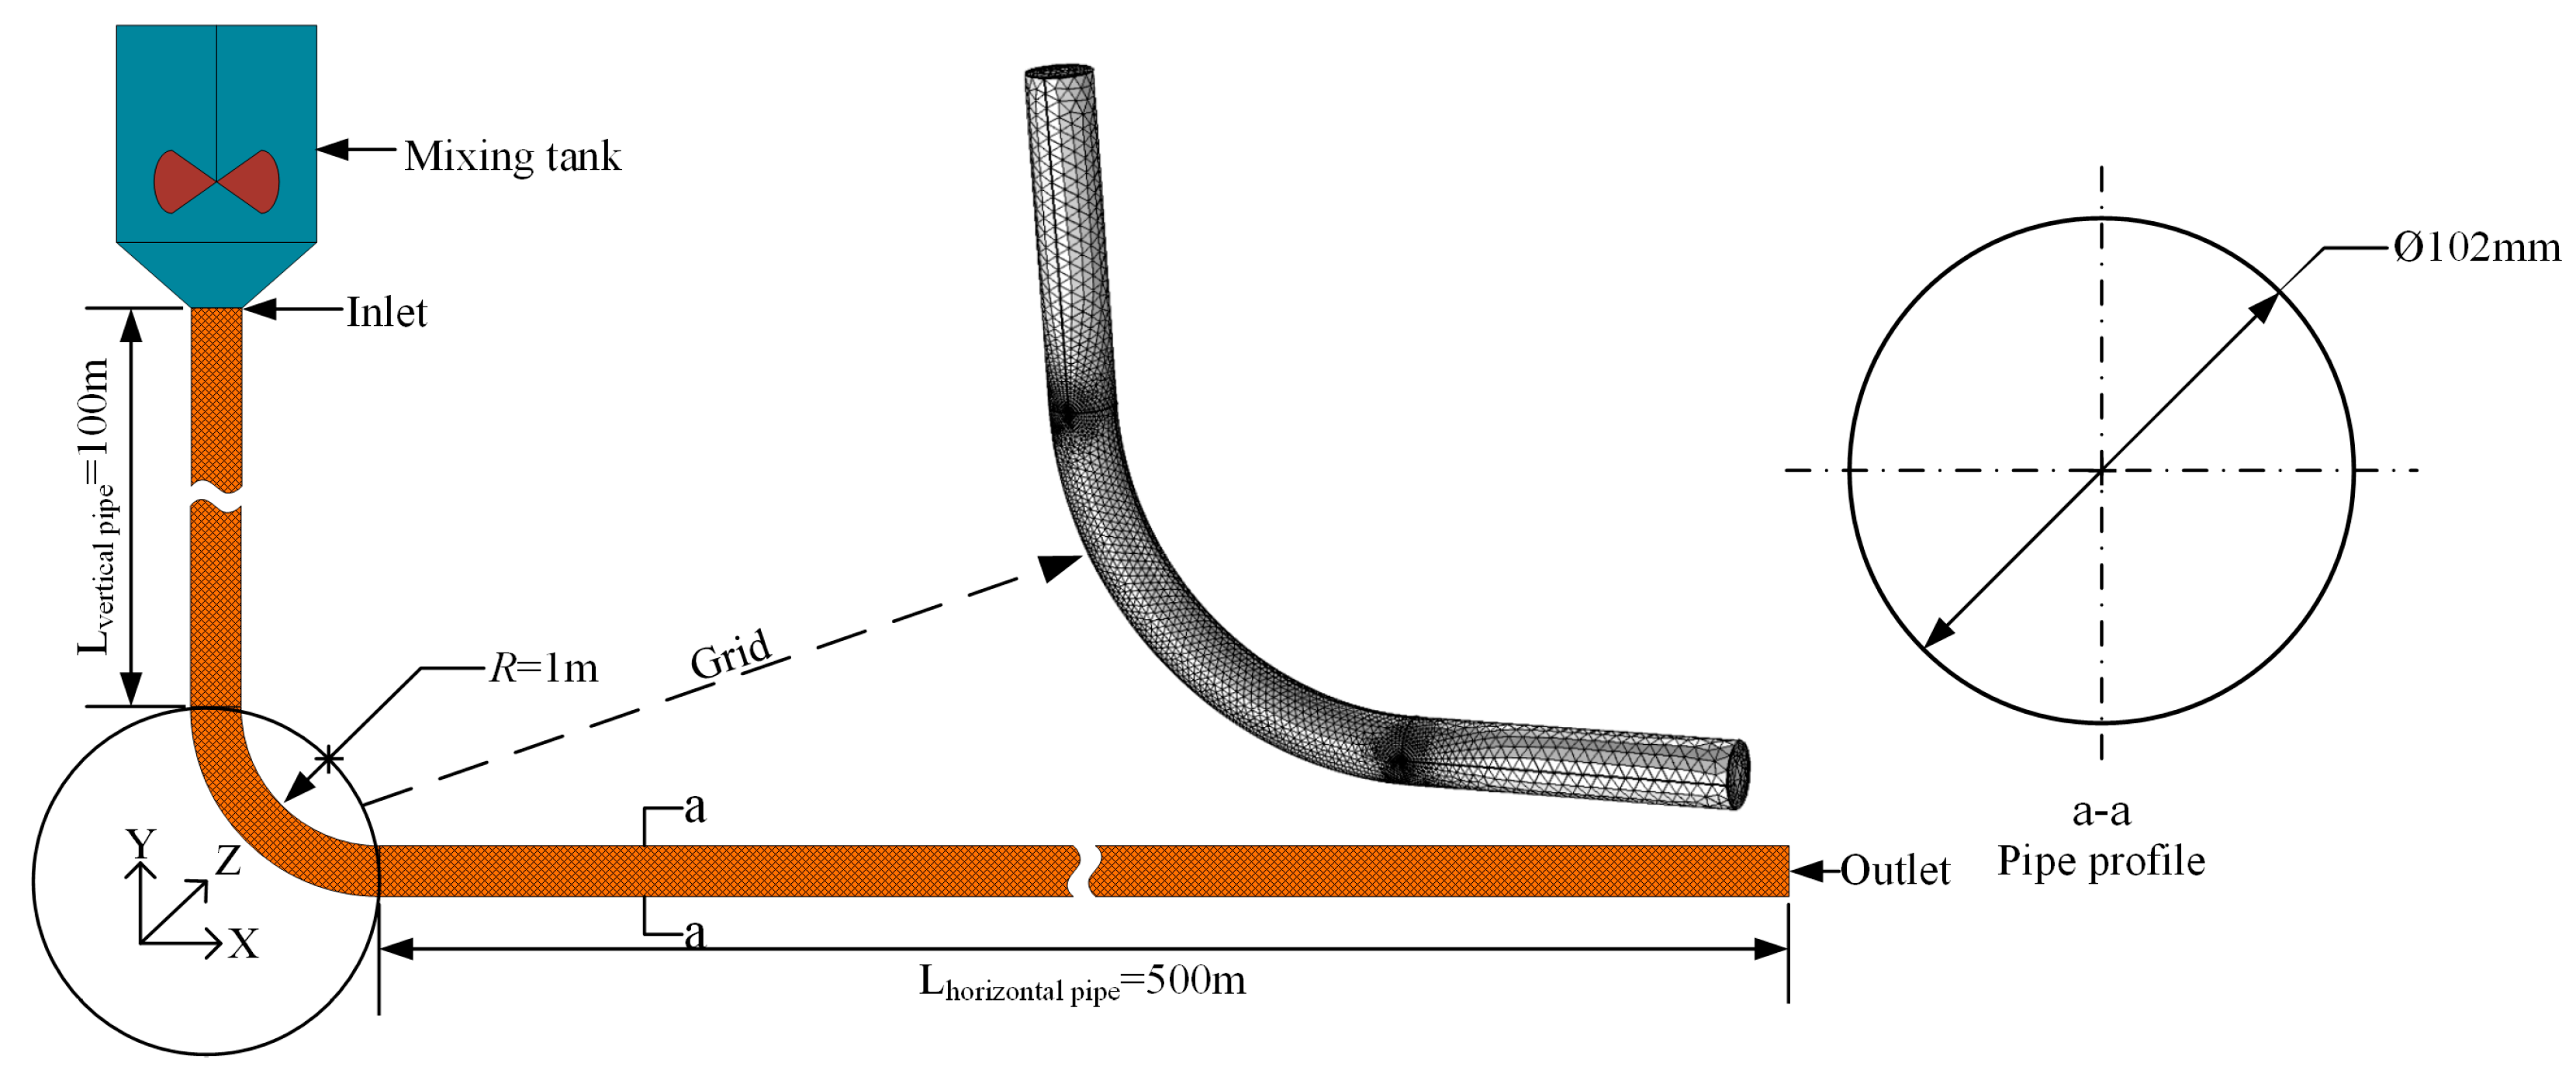
As shown in Figure 2, a three-dimensional model was developed for a typical L-shaped backfill pipeline for long-distance transport, which was used here to study the transport properties of TFSB. The pipe is made of seamless steel, and its detailed geometrical parameters are a vertical height of 100 m, a horizontal length of 500 m, a diameter of 102 mm, an elbow angle of 90°, and an elbow radius of 1 m. The model can be used to analyze the velocity and pressure distribution of the slurry. The model was established and meshed in Gambit, and the calculation accuracy was confirmed by the mesh number. Six groups of different mesh numbers are tested on the model and compared in terms of pressure, velocities, and volume fraction to ensure a mesh-independent solution. The results show that, when the mesh number exceeds 2.08 × 10⁶, the variations of pressure, velocity and volume fraction are so little that these can be negligible generally. We found that the mesh number of 1.28 × 10⁶ gives about a 1% deviation compared to the mesh number of 2.08 × 10⁶; the mesh number of 3.24 × 10⁶ gives about a 9% deviation compared to the mesh number of 2.08 × 10⁶. Therefore, the mesh number of 2.08 × 10⁶ was found to be sufficient for the numerical simulation. As an index of the computational cost, the model takes approximately 2 h of computing time on a workstation with two quad-core processors (2.57 GHz) and 16GB of RAM (Random-Access Memory).
2.3.1. Governing Conservation Equations
TFSB is composed of a gaseous foam, solid aggregates and cement, and liquid water. In this work, to fully represent the effect of the foam on the transport properties of the backfill slurry, simplified CFD simulations of a two-phase flow are considered, in which the cement slurry is treated as the first phase and the foam is treated as the second phase. The Fluent CFD tool was used to perform the simulations, and the interfaces between the slurry and foam were tracked using the mixture method (MIX). When using MIX for interface tracking, it is customary to use a two-phase model, i.e., a model with a mixture pressure field, a mixture velocity field, mixture density, and a second phase volume fraction [23]. In MIX, the finite volume discretized forms of the equations that govern the conservation of mass, momentum and volume fraction (Equations (1)–(3)) are solved over a collocated grid arrangement using a segregated solver approach (the PISO algorithm) for the pressure–velocity calculations. MIX allows phases to pass through each other; thus, the volume fraction of each phase can take arbitrary values between 0 and 1. At the same time, the characteristics of the mixed fluid in the control region are determined by each phase [23]. The formulas for the viscosity can be written as shown in Equation (4).
where is the mixture mass, is the mixture density (kg/m3), is the density of phase k (kg/m3), is the mixture average velocity (m/s), is the velocity of phase k (m/s), is the volume fraction of phase k (%), n is the number of phases, is the difference in pressure (Pa), is the viscosity of the mixture (Pa·s), is the acceleration of gravity (i.e., 9.8 m/s2), and is the volume force (Pa).
2.3.2. Flow State
The flow state of the fluid can be determined based on the Reynolds number. The three-phase flow of foam slurry is non-Newtonian, and the equation for the Reynolds number based on the plastic viscosity can be written as follows [24]:
where is the Reynolds number, is the density of the slurry (kg/m3), is the velocity of the slurry (m/s), and is the viscosity (Pa·s).
When the Reynolds number is less than 2300, the flow state of the fluid in the pipeline is laminar; when the Reynolds number is more than 2300 but less than 4000, the flow is in a transition state between laminar and turbulent flow; when the Reynolds number is greater than 4000, the flow state is turbulent [25,26]. Generally, when the bubble volume fraction is 0–40 vol %, calculated by Equations (2) and (3), their corresponding mixture viscosity is 0.4100–0.2780 Pa·s, and the mixture density is 1750–1070 kg/m3. Assuming the backfilling ability is 60 m3/h, the velocity is 2.24 m/s. Therefore, the Reynolds value is 975–879. The maximum Reynolds is 975 when the bubble volume fraction is 0 vol % and less than 2300, the slurry flow state is laminar.
2.3.3. Boundary Conditions
The effects of heat exchange, vibration, stress waves, and compression are not considered in the simulations [27]. The applicable boundary conditions are assumed as follows:
- (1)
- At the walls: the wall is stationary and no-slip.
- (2)
- At the pipe inlet, the velocity (v) function given below is used at the inlet face [28]:where is the slurry flow backfilling ability (m3/h), is the diameter of the backfill pipe (m), the value of which is 0.102 m, is a constant, and the value is 1.1. Thus, when the backfilling ability is 60 m3/h, the slurry velocity is 2.24 m/s.
- (3)
- At the pipe outlet, the outflow function is used at the outlet face.
- (4)
- In the calculation domain, a gravity field is applied, and the standard atmospheric pressure (1 bar) is used as the reference to atmospheric pressure.
3. Results and Discussion
3.1. Foam Formation Characteristics
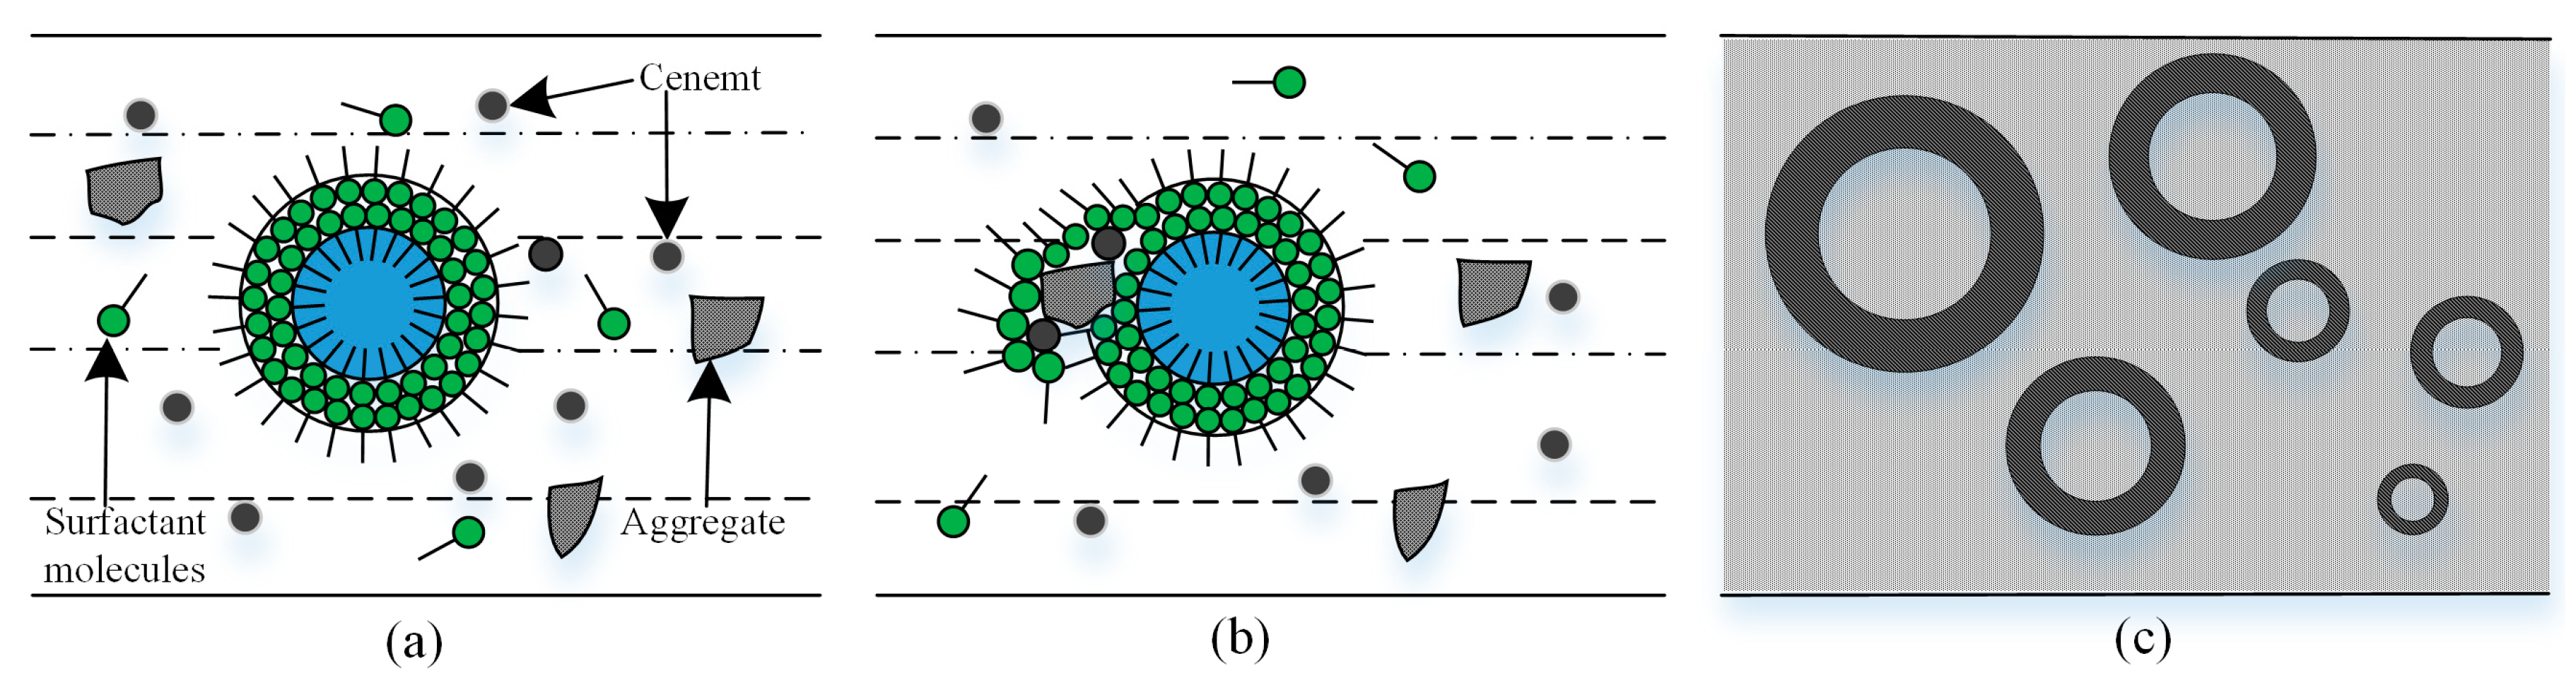
Foam is a porous membrane dispersion system formed of a mixture of liquid and gas, in which the liquid is in a continuous phase and the gas is in a dispersed phase, and a standard foam flow is the necessary condition and foundation for foam slurry preparation. During the foaming process, surfactant molecules adhere to and orient on the gas–liquid interfaces to form a monolayer [29]. The foam formation process is illustrated in Figure 3. Figure 3a shows the formation of a bubble in the water and the adsorption of a large number of surfactant molecules on its surface. The hydrophilic groups are oriented toward the water, and the hydrophobic groups are oriented toward the air. Figure 3b depicts the bubble rising in the water and the formation of two monolayer films, an inner and an outer layer. Figure 3c shows the surfacing of the bubble, when it finally becomes a free bubble. The surfactant molecules effectively overcome the surface tension of the bubble.
As shown in Figure 4, when the slurry is mixed with the foam in a mixing tank, under the action of external forces, the solid particles and bubbles collide with and adhere to each other at a certain speed and angle, ultimately forming TFSB.
The stability of the foam is the key to the preparation of TFSB [30]. A greater viscosity leads to better stability but poorer foamability. In addition, the bubble size is also an important factor affecting the stability of the foam; under normal circumstances, when the bubble size is uniform, the stability of the bubbles is good.
3.2. Test Results Analyses
3.2.1. Rheological Properties
TFSB is similar to a paste slurry material because of its high mass fraction, low water content, and good integrity. In the present work, the flow of slurry is modeled as a Bingham fluid [31]. A fluid that behaves as a solid until a minimum yield stress is exceeded, and that exhibits a linear relation between the shear stress and the share rate of deformation, is referred to as a Bingham plastic. The shear stress model for a Bingham fluid is [32]
where is the shear stress (Pa), is the yield stress (Pa), is the plastic viscosity (Pa·s), and is the share rate (1/s).
Figure 5a,b show the evolutions of the shear stress and the plastic viscosity with the share rate for the cement slurry and the standard foam. Figure 5a shows that the relationship between the shear stress and the shear rate is linearly increasing. The yield stresses of the cement slurry and the standard foam are 68.23 and 15.54 Pa, respectively. Figure 5b shows that the relationship between the plastic viscosity and the shear rate is exponentially decreasing. The plastic viscosity tends to reach a stable value for shear rates higher than 60 r/s, and these stable values of the plastic viscosity for the cement slurry and the standard foam are 0.41 and 0.08 Pa·s, respectively. In the present CFD simulations, these values are used as the average values for the rheological properties of the materials. However, in reality, slurry is not a homogeneous fluid. Therefore, in the simulations, each phase is treated as a homogeneous body, and all phases are mixed in motion; the rheological properties of the cement slurry and standard foam are as shown in Table 1.
3.2.2. Slump
The method used to perform the laboratory experiments conducted in this study is depicted in Figure 6a. Using this device, the slump behaviors of TFSB materials with different bubble volume fractions were detected, and the results are shown in Figure 6b. As shown in Figure 6b, the slump increases with the increasing of bubble volume fraction, which shows that the lubrication of bubbles is helpful to improve the fluidity of slurry. Generally, the slump of paste is from 15 to 25 cm. When the slump is between 15 and 22 cm, the slurry is a small slump paste; in such a case, the dehydration equipment and pumping equipment is necessary. Especially when the slump is less than 20 cm, industrial applications are not easily made. Thus, the paste where the slump was between 22 and 25 cm was widely used and was called the “big slump paste” [33]. Figure 6b shows that, when the bubble volume fraction is 15, 20, and 25 vol %, the slump is 23.4, 23.8, and 24.9 cm, respectively. The slurry has good fluidity and meets the requirements of the big slump paste.
3.2.3. Strength
The strength of specimens was tested with bubble volume fractions from 0 to 40 vol %, and the results after 7 and 28 days are shown in Figure 7. As shown in this figure, the strength decreases with the increase of the bubble volume fraction, which shows that the bubbles are of no advantage in terms of improving the strength. The trend lines of strength with the bubble volume fraction are illustrated in Figure 7, and there is a linear relationship between the strength of 7 days and the bubble volume fraction. However, for the strength of 28 days, there is a rapid decrease when the bubble volume fraction exceeds 20 vol %. The strength of backfill is an important factor to ensure the safety of stopes [34].
The foam can improve the fluidity of slurry, but the excessive foam is harmful to ensure the strength of backfill. Therefore, the bubble volume fraction from 15 to 20 vol % is a better choice.
3.3. Effect of Bubble Volume Fraction
During the process of preparing TFSB, the quantity of the standard foam is measured based on the bubble volume fraction, which indicates the volume fraction of the standard foam. In this work, the influences of different bubble volume fractions and different average bubble diameters on the pipeline performance of foam slurry are simulated and studied. The basic properties of the cement slurry and the standard foam are shown in Table 2.
3.3.1. Foam Phase
To study the effects of different amounts of foam addition on the slurry properties, nine simulated cases are considered in this work, with bubble volume fractions of 0, 5, 10, 15, 20, 25, 30, 35, and 40 vol %. Let us assume that the cement slurry and standard foam maintain a constant viscosity before mixing. The values of the plastic viscosity obtained via theoretical calculation (Equation (4)) and simulation are shown in Table 3. Analysis shows that the simulated viscosity values are close to the theoretically calculated values, with a relative error between them of no more than 0.4%. Thus, the mixture is evenly mixed during pipeline transport.
The foam phase in TFSB exists in the form of bubbles. The simulations show that the bubbles maintain a uniform distribution in the pipeline. In the vertical section of the pipe, the TFSB is mainly affected by gravity and the wall viscosity. Because of the low air density, the bubbles are easily pushed toward the wall of the pipe, which causes the bubble volume fraction to be small in the center of the pipe. At the elbow, the foam slurry is influenced by centrifugal force; consequently, the bubble volume fraction distribution presents an overall decreasing trend from the inside to the outside of the elbow, and the bubble volume fraction distribution is not stable with variations in the slurry flow. In the horizontal section of the pipe, the TFSB is mainly affected by buoyancy. After long-distance transport, the slurry maintains a stable flow, and the bubble volume fraction distribution shows a decreasing trend from the top to the bottom of the pipe, but the difference is too small. Hence, the bubble volume fraction is almost constant, and the pipeline transport of the foam slurry is feasible. The bubble volume fraction distribution for a bubble volume fraction of 15 vol %, which follows the identified bubble volume fraction distribution law, is shown in Figure 8.
3.3.2. Pressure
To realize self-flowing transport of a backfill material through a pipeline, the gravitational potential energy must be greater than the resistance loss of the pipeline, which is defined as the total pressure difference between the inlet and outlet of the pipeline. The equations for the gravitational potential energy and resistance loss are as follows [35]:
where is the gravitational potential energy (Pa), is the acceleration of gravity (i.e., 9.8 m/s2), is the height difference (m), is the resistance loss (Pa), is the total pressure difference (Pa), is the total pressure at the inlet (Pa), and is the total pressure at the outlet (Pa).
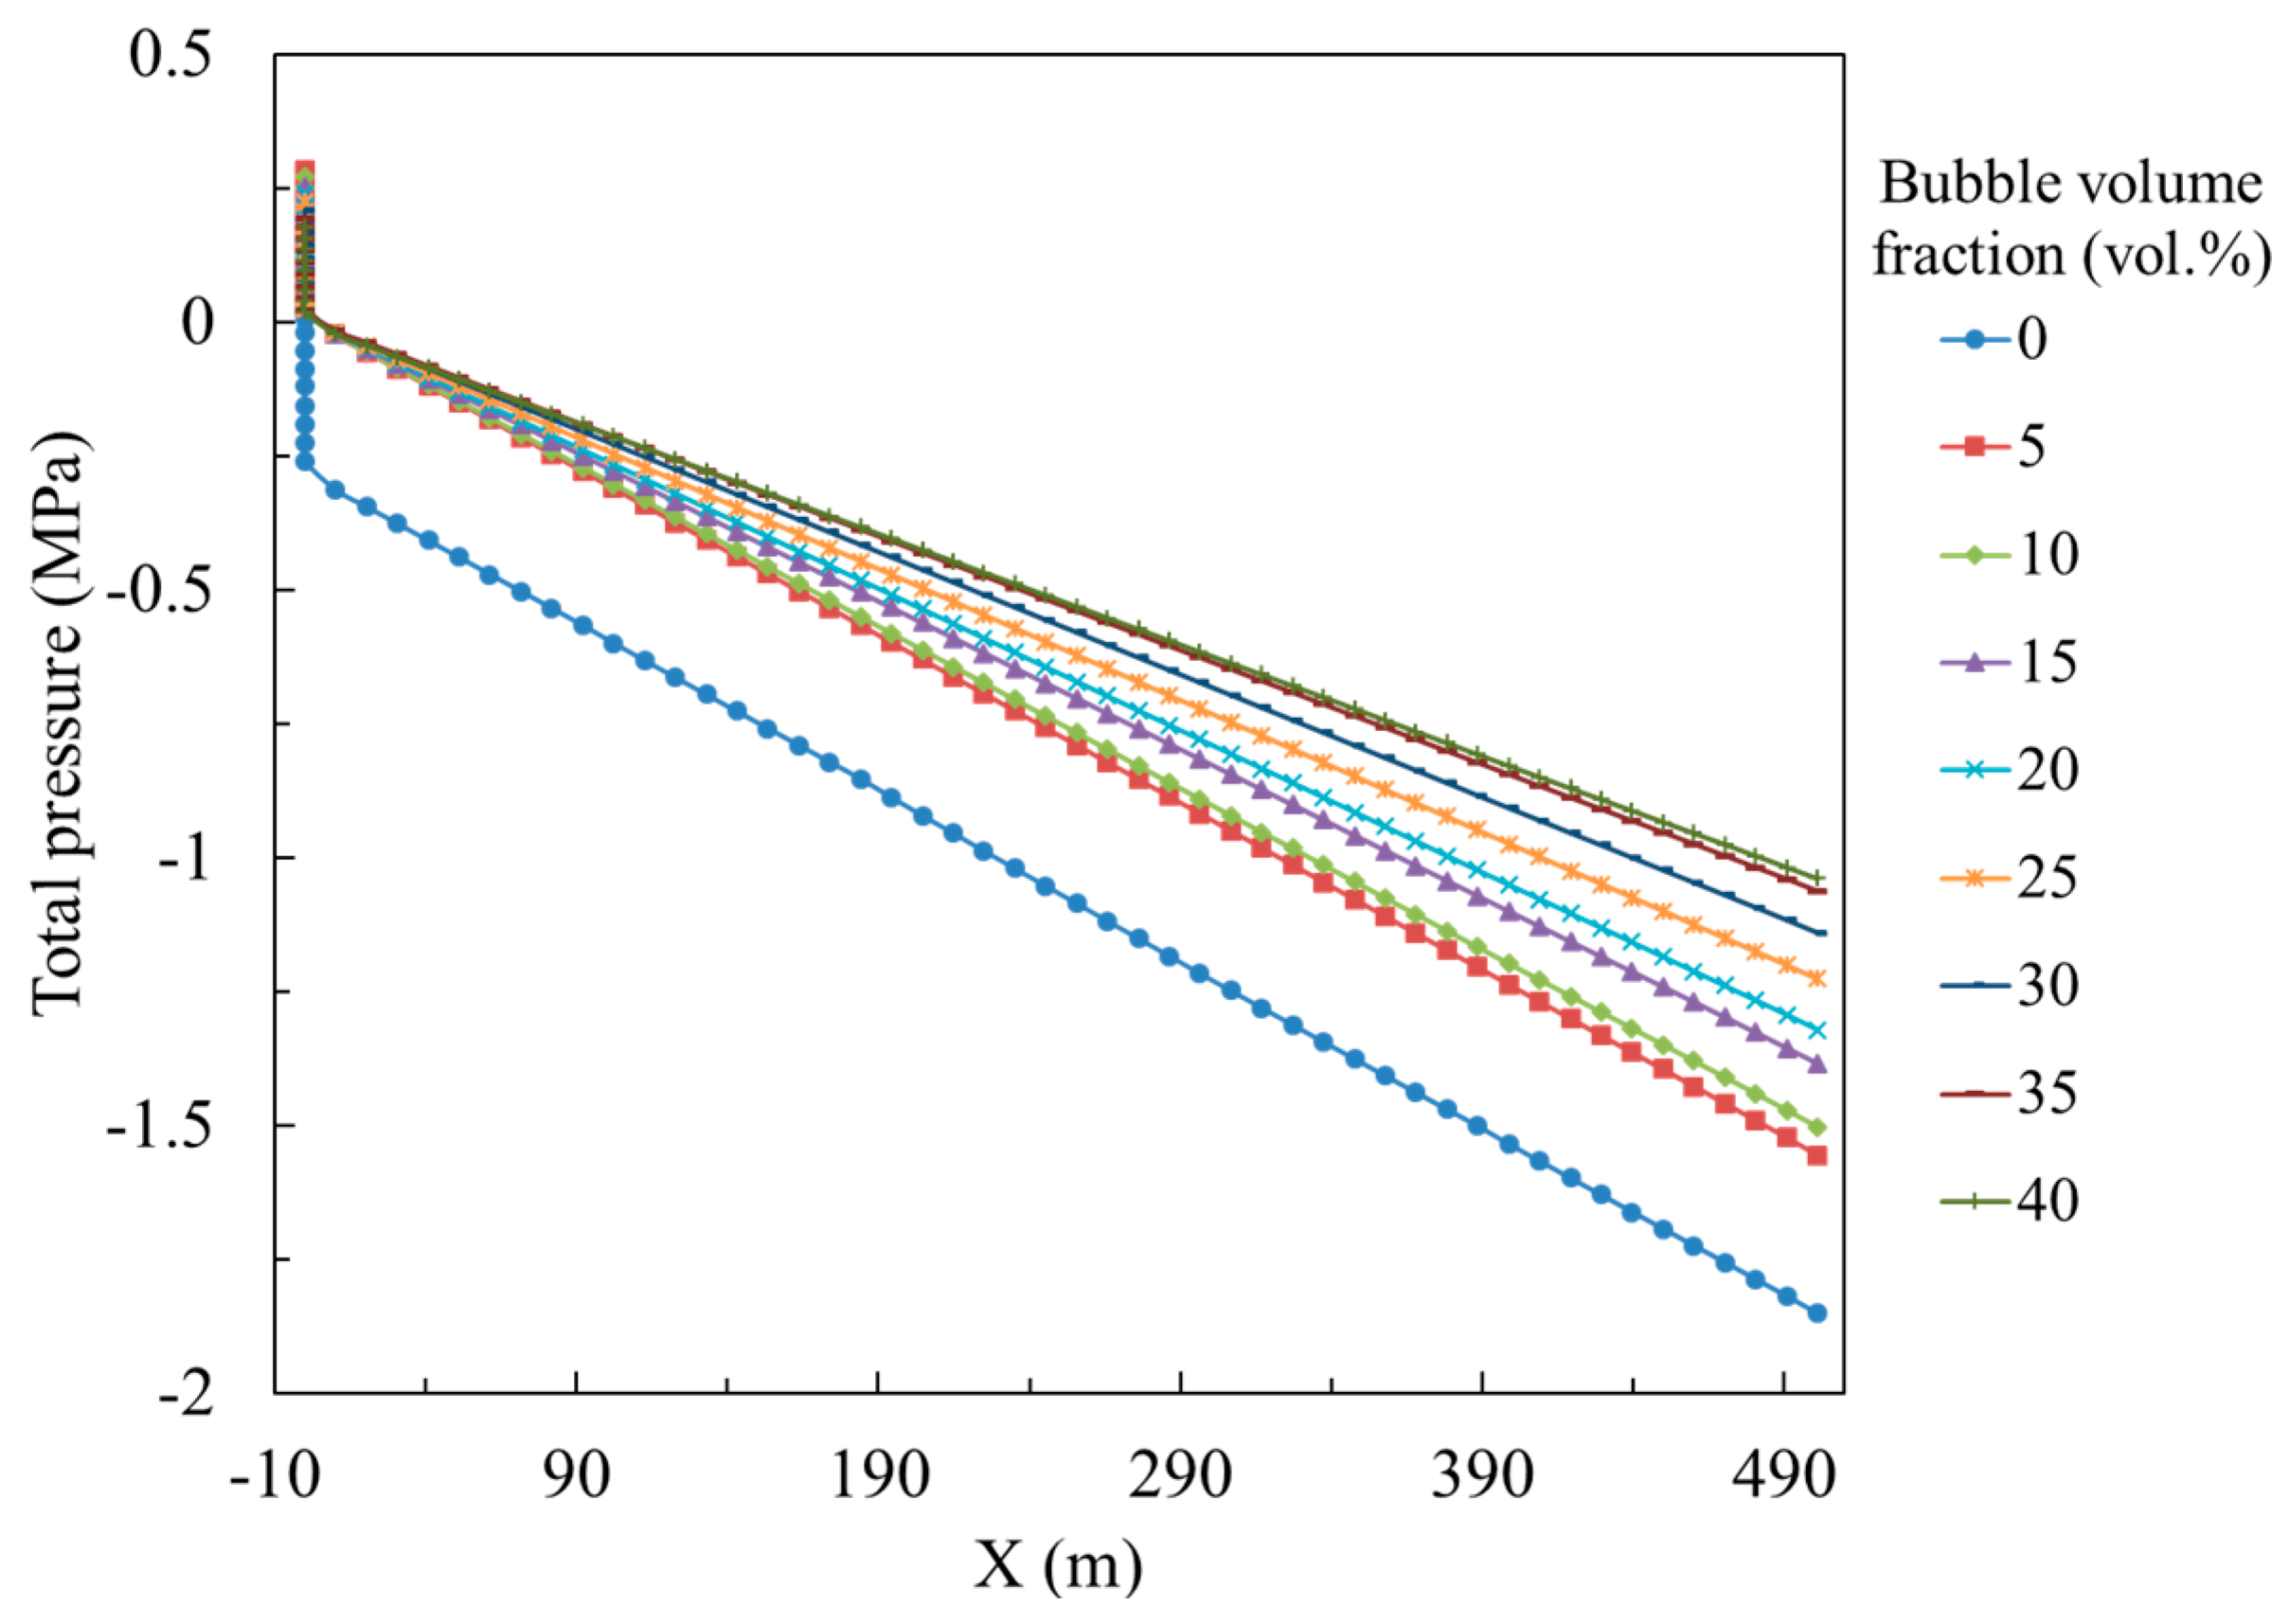
Sixty points along the middle line of the pipe were chosen to investigate the evolution of the total pressure. As shown in Figure 9, the total pressure in the pipeline decreases from the inlet to the outlet, and the total pressure value at a given point increases with an increase in the bubble volume fraction. In simulations, the inlet is supposed to be connected to the atmosphere, and an atmospheric pressure at the inlet is set as the reference pressure. Thus, with the decrease of pressure, there is a negative pressure at the latter part and the outlet of the pipeline. Table 4 lists the inlet and outlet pressures in the pipeline for different bubble volume fractions and shows that the total resistance and average resistance of the pipe decrease as the bubble volume fraction increases. When the bubble volume fraction is greater than 15 vol %, the total reduction in resistance compared with the cement slurry alone exceeds 0.22 MPa, which corresponds to a proportional reduction of more than 12%. In addition, the reduction in the average resistance exceeds 0.36 kPa/m, also corresponding to a proportional reduction of more than 12%. The results thus indicate that the addition of foam can reduce the resistance during slurry transport and improve the fluidity of the slurry. Moreover, when the bubble volume fraction exceeds 15 vol %, the total resistance of the pipeline is less than the gravitational potential energy of 1.72 MPa, allowing the realization of self-flowing transport. As shown in Figure 10, there is a non-linear relationship between the total resistance and the bubble volume fraction, according to the polynomial, the critical bubble volume fraction is 12 vol %.
Table 5 compares the pressures in the pipeline and the elbow for the various bubble volume fractions. As shown in Table 5, the total and average resistances of the elbow also decrease as the bubble volume fraction increases. Moreover, when the bubble volume fraction is greater than 15 vol %, the total resistance reduction at the elbow compared with the cement slurry alone exceeds 0.0012 MPa, corresponding to a proportional reduction of more than 14%, whereas the reduction in the average resistance exceeds 0.72 kPa/m, corresponding to a proportional reduction of more than 13%. The results indicate that, although the total resistance of the pipe elbow is less than 1% of that of the pipeline, the average resistance of the elbow is 2 to 3 times that of the pipeline as a whole. This leads to a rapid increase in the local resistance, resulting in increased resistance at the elbow.
3.3.3. Velocity
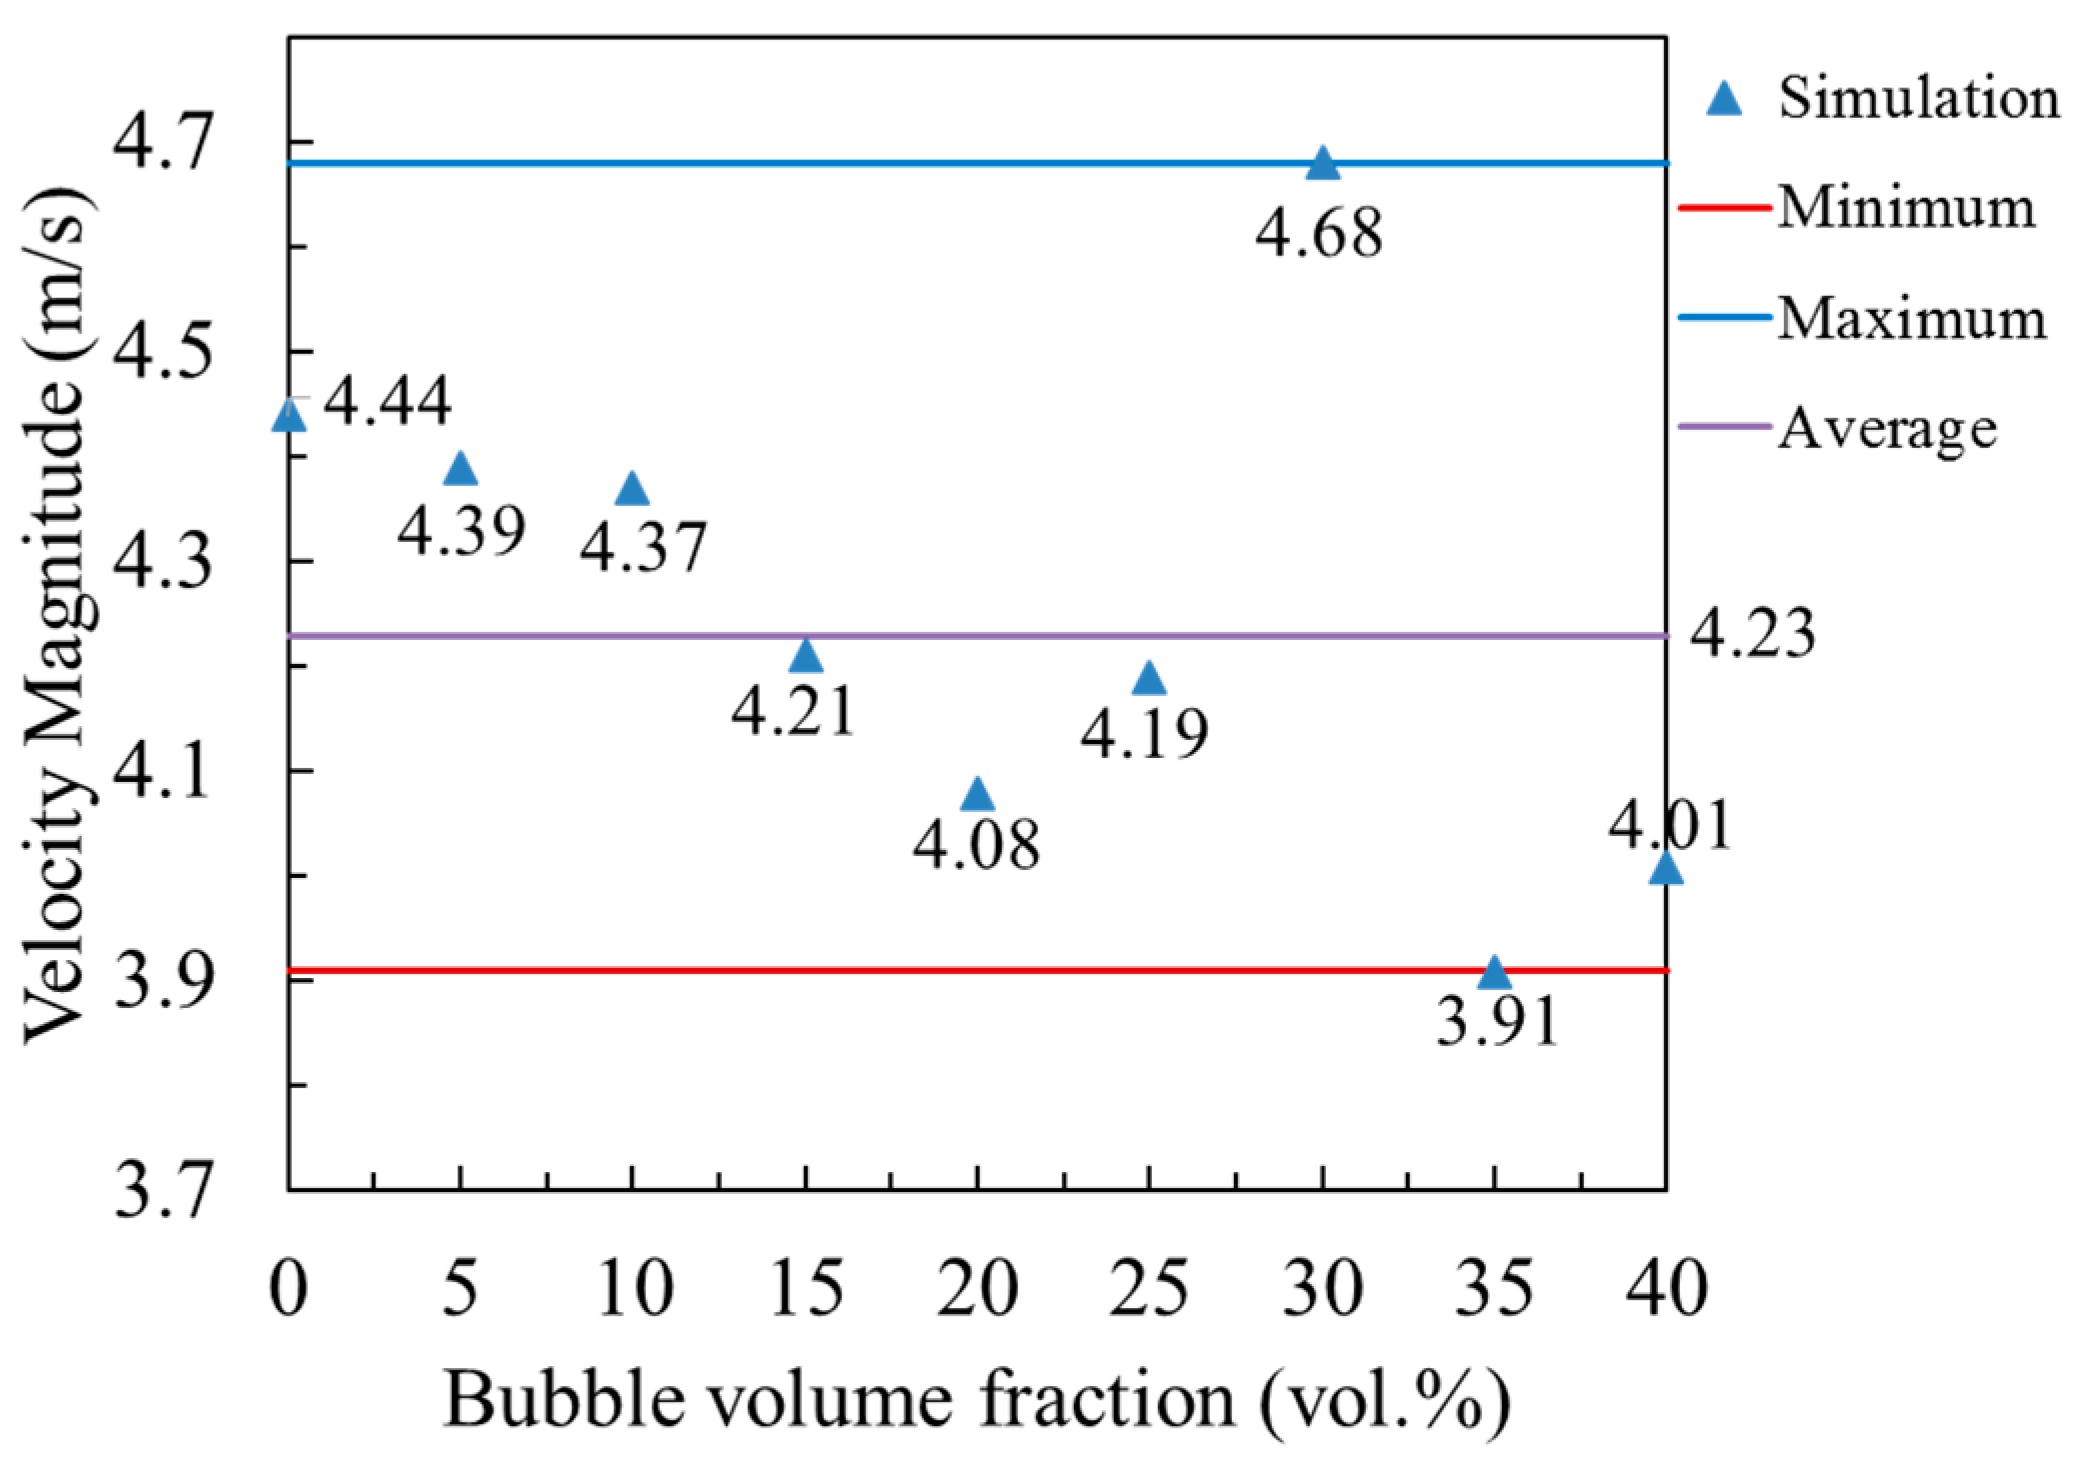
Control of the transport velocity of the slurry is also an important factor in pipeline transport [36]. When the velocity is too low, settlement of the solid particles will occur. By contrast, when the velocity is too high, the stress induced by the slurry on the pipe wall is enhanced, and the frequency with which the solid particles impinge on the pipe wall increases, which can easily to cause the wall of the pipe to wear and even deform. The velocities of the slurry for various bubble volume fractions are shown in Figure 11. As shown in this figure, the maximum velocity among all considered cases is 4.68 m/s for a bubble volume fraction of 30 vol %, and the minimum velocity is 3.91 m/s for a bubble volume fraction of 35 vol %. These velocities do not vary monotonically with the bubble volume fraction but satisfy the requirements for pipeline transport.
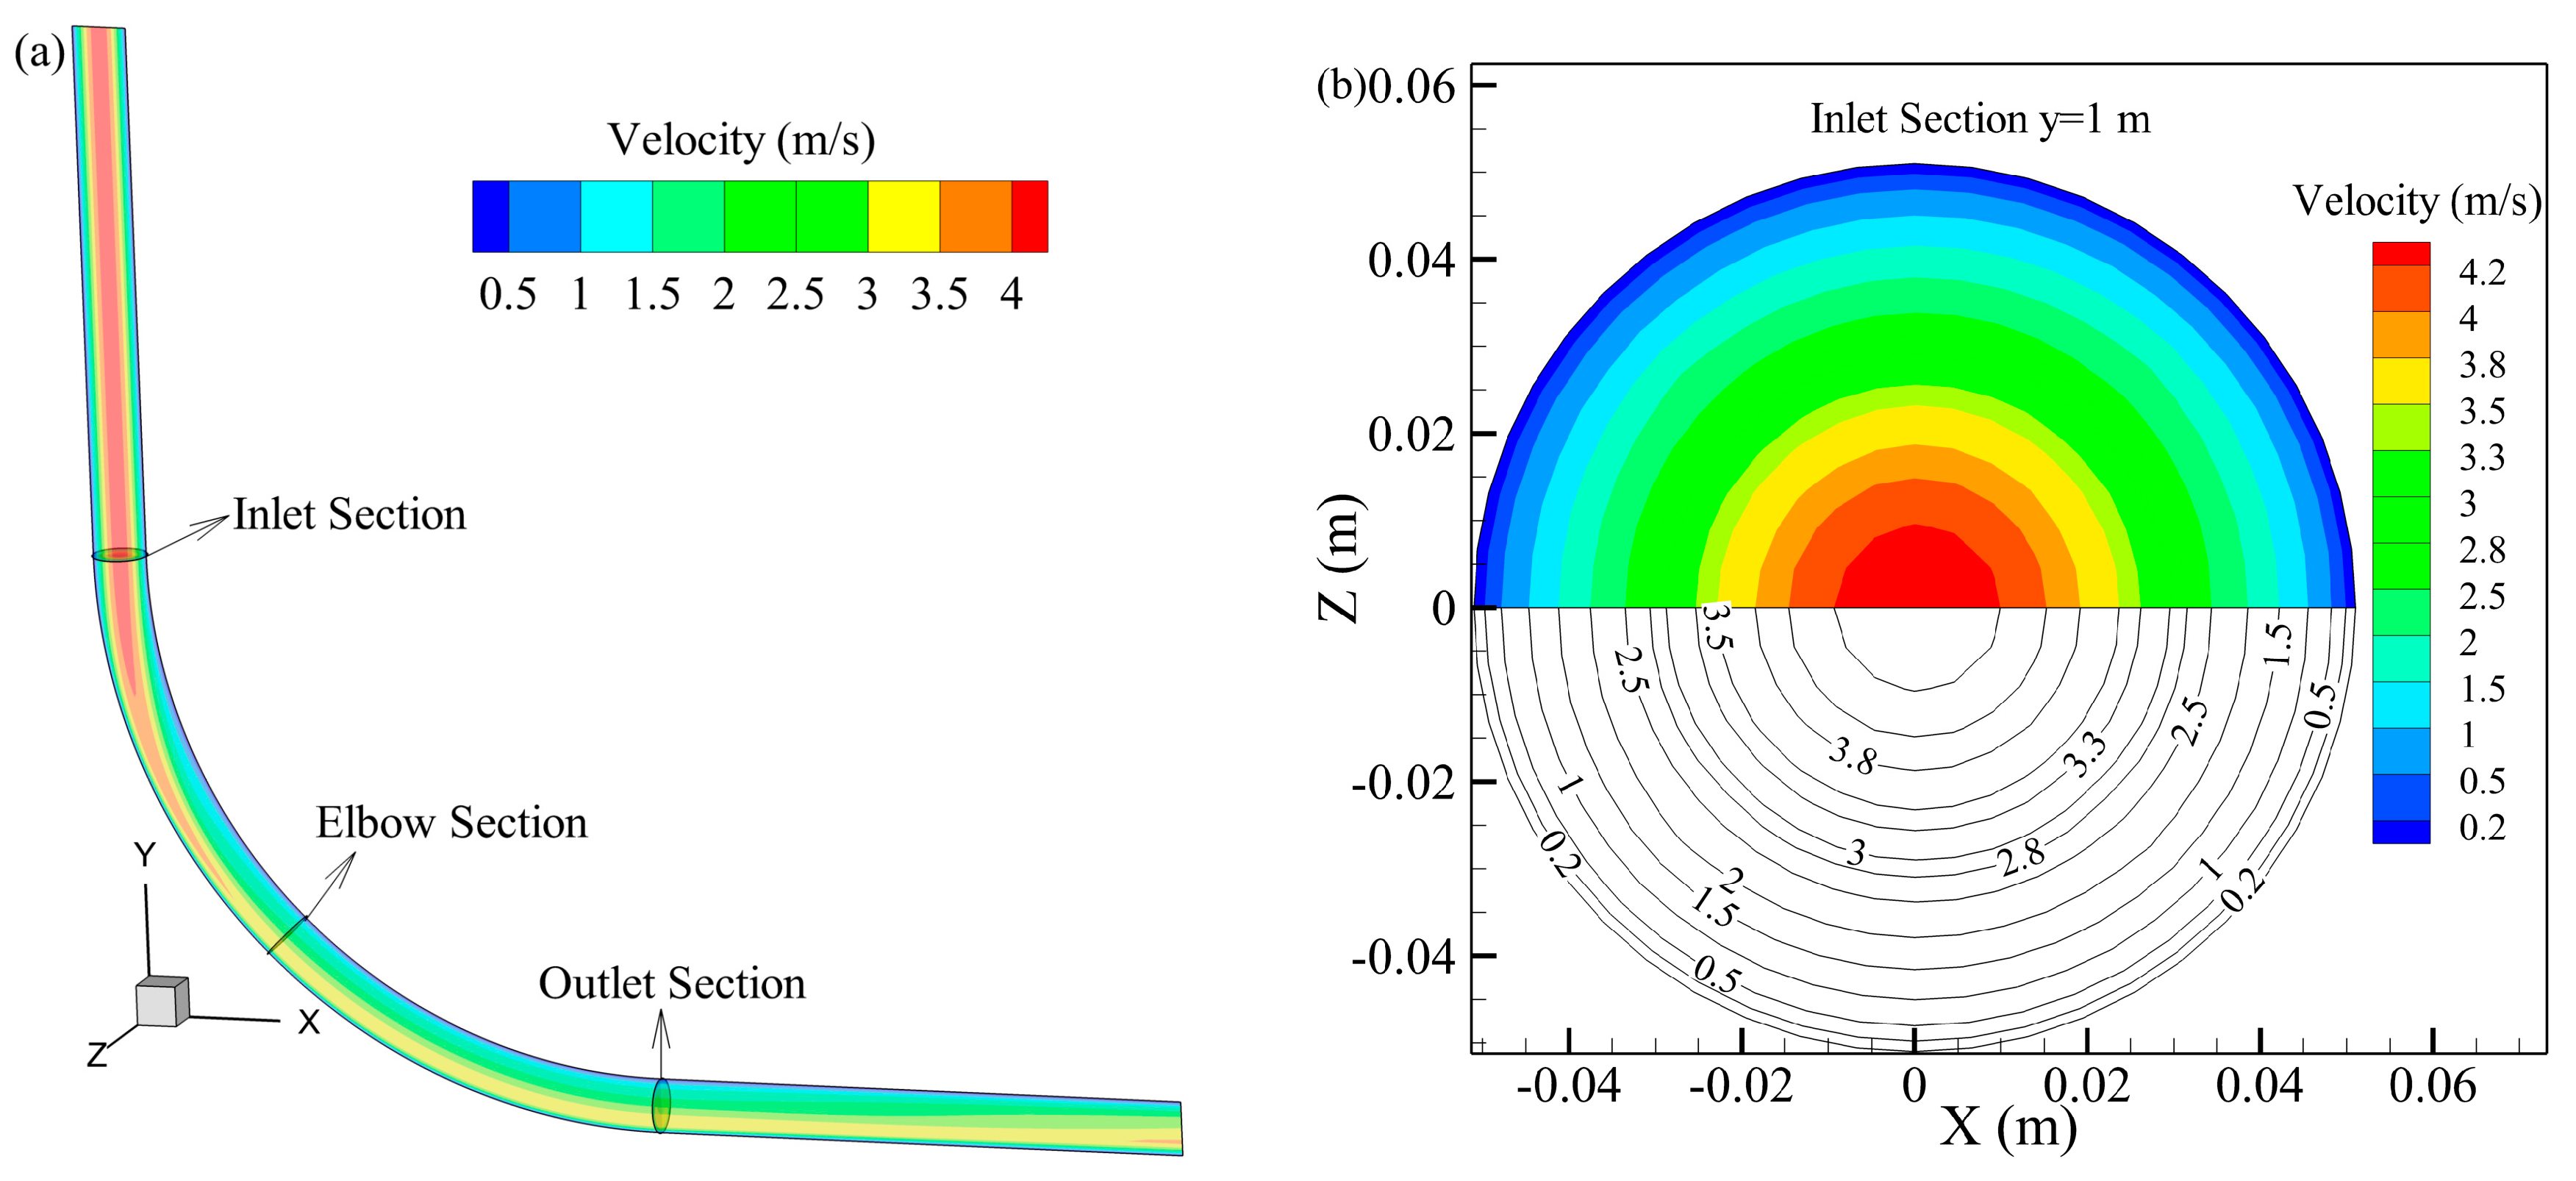
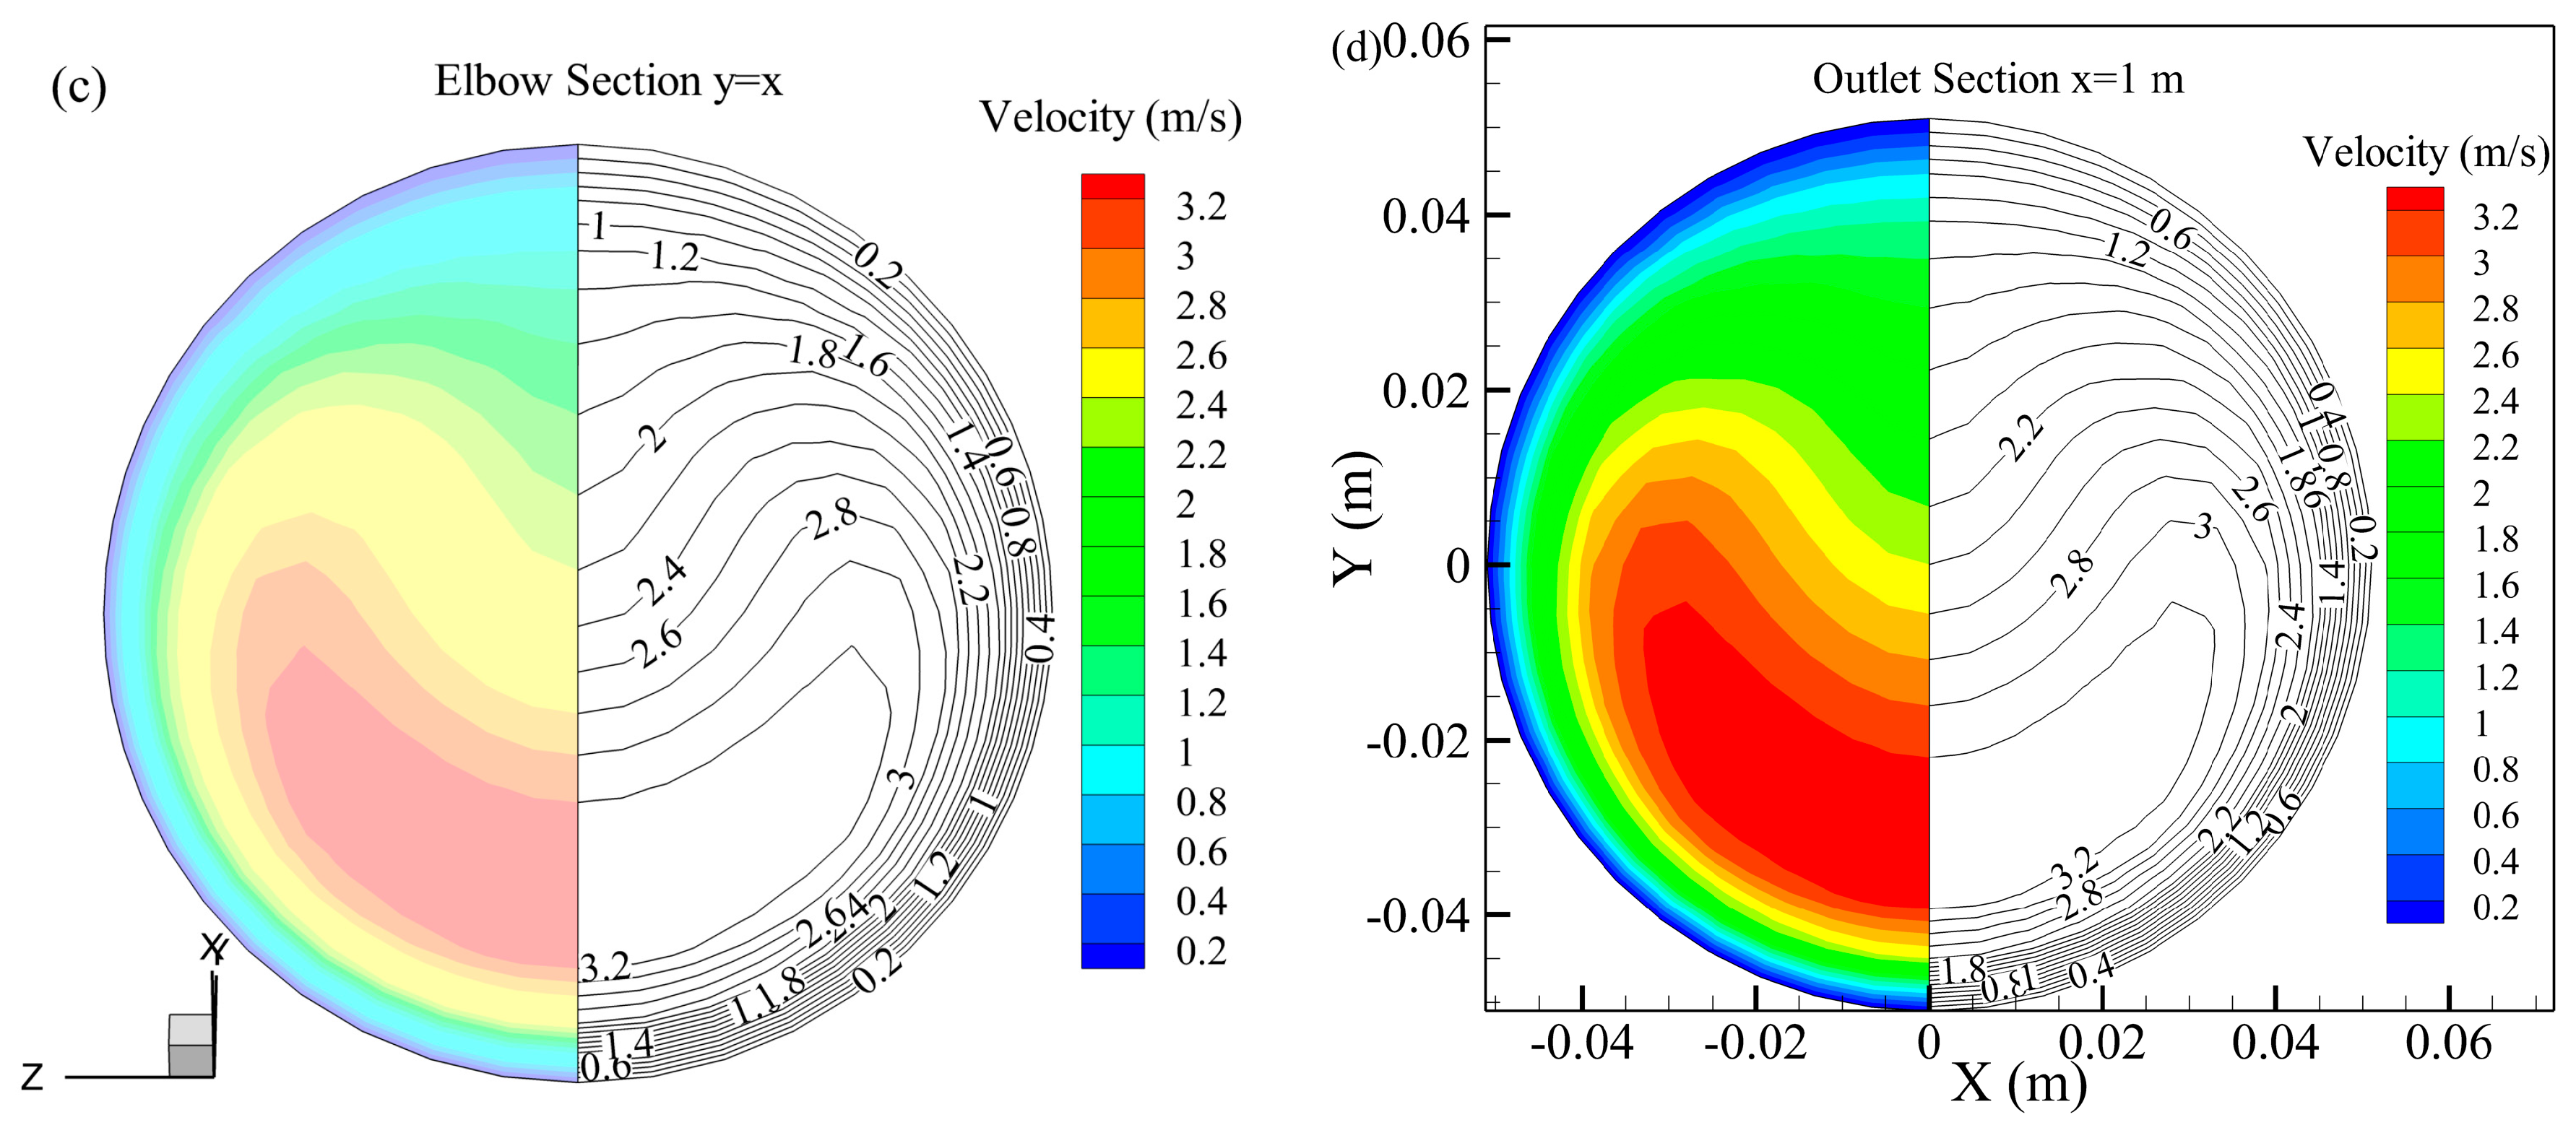
The velocity distribution for a bubble volume fraction of 15 vol % is shown in Figure 12, which shows an obvious flow core zone in the vertical and horizontal sections of the pipe. In the elbow, however, the flow core zone gradually becomes smaller and moves from the center of the pipe to the outside of the elbow. Let us consider the inlet section (y = 1 m), the elbow section (y = x), and the outlet section (x = 1 m) separately to study the change in the velocity on the vertical surface at the elbow in Case 4. As shown in Figure 13, the flow core zone is shifted toward the outside of the elbow, and the shape of the flow core zone changes from an “O” shape to a “U” shape. Moreover, there is a high-velocity area concentrated at the outside of the elbow, and the shear stress on the wall increases, which can easily cause wear.
3.4. Effect of Bubble Diameter
The bubble diameter is an important parameter affecting the performance of a foam [37]. When the diameter is too small, the bubbles cannot effectively adsorb solid particles. By contrast, when the diameter is too large, a defoaming phenomenon can easily occur. Therefore, it is necessary to simulate the performance of foam slurry pipeline transport for various bubble diameters. The diameter of foam is 30–100 μm; thus, five different levels were selected for the simulations: 30, 47.5, 65, 82.5, and 100 μm.
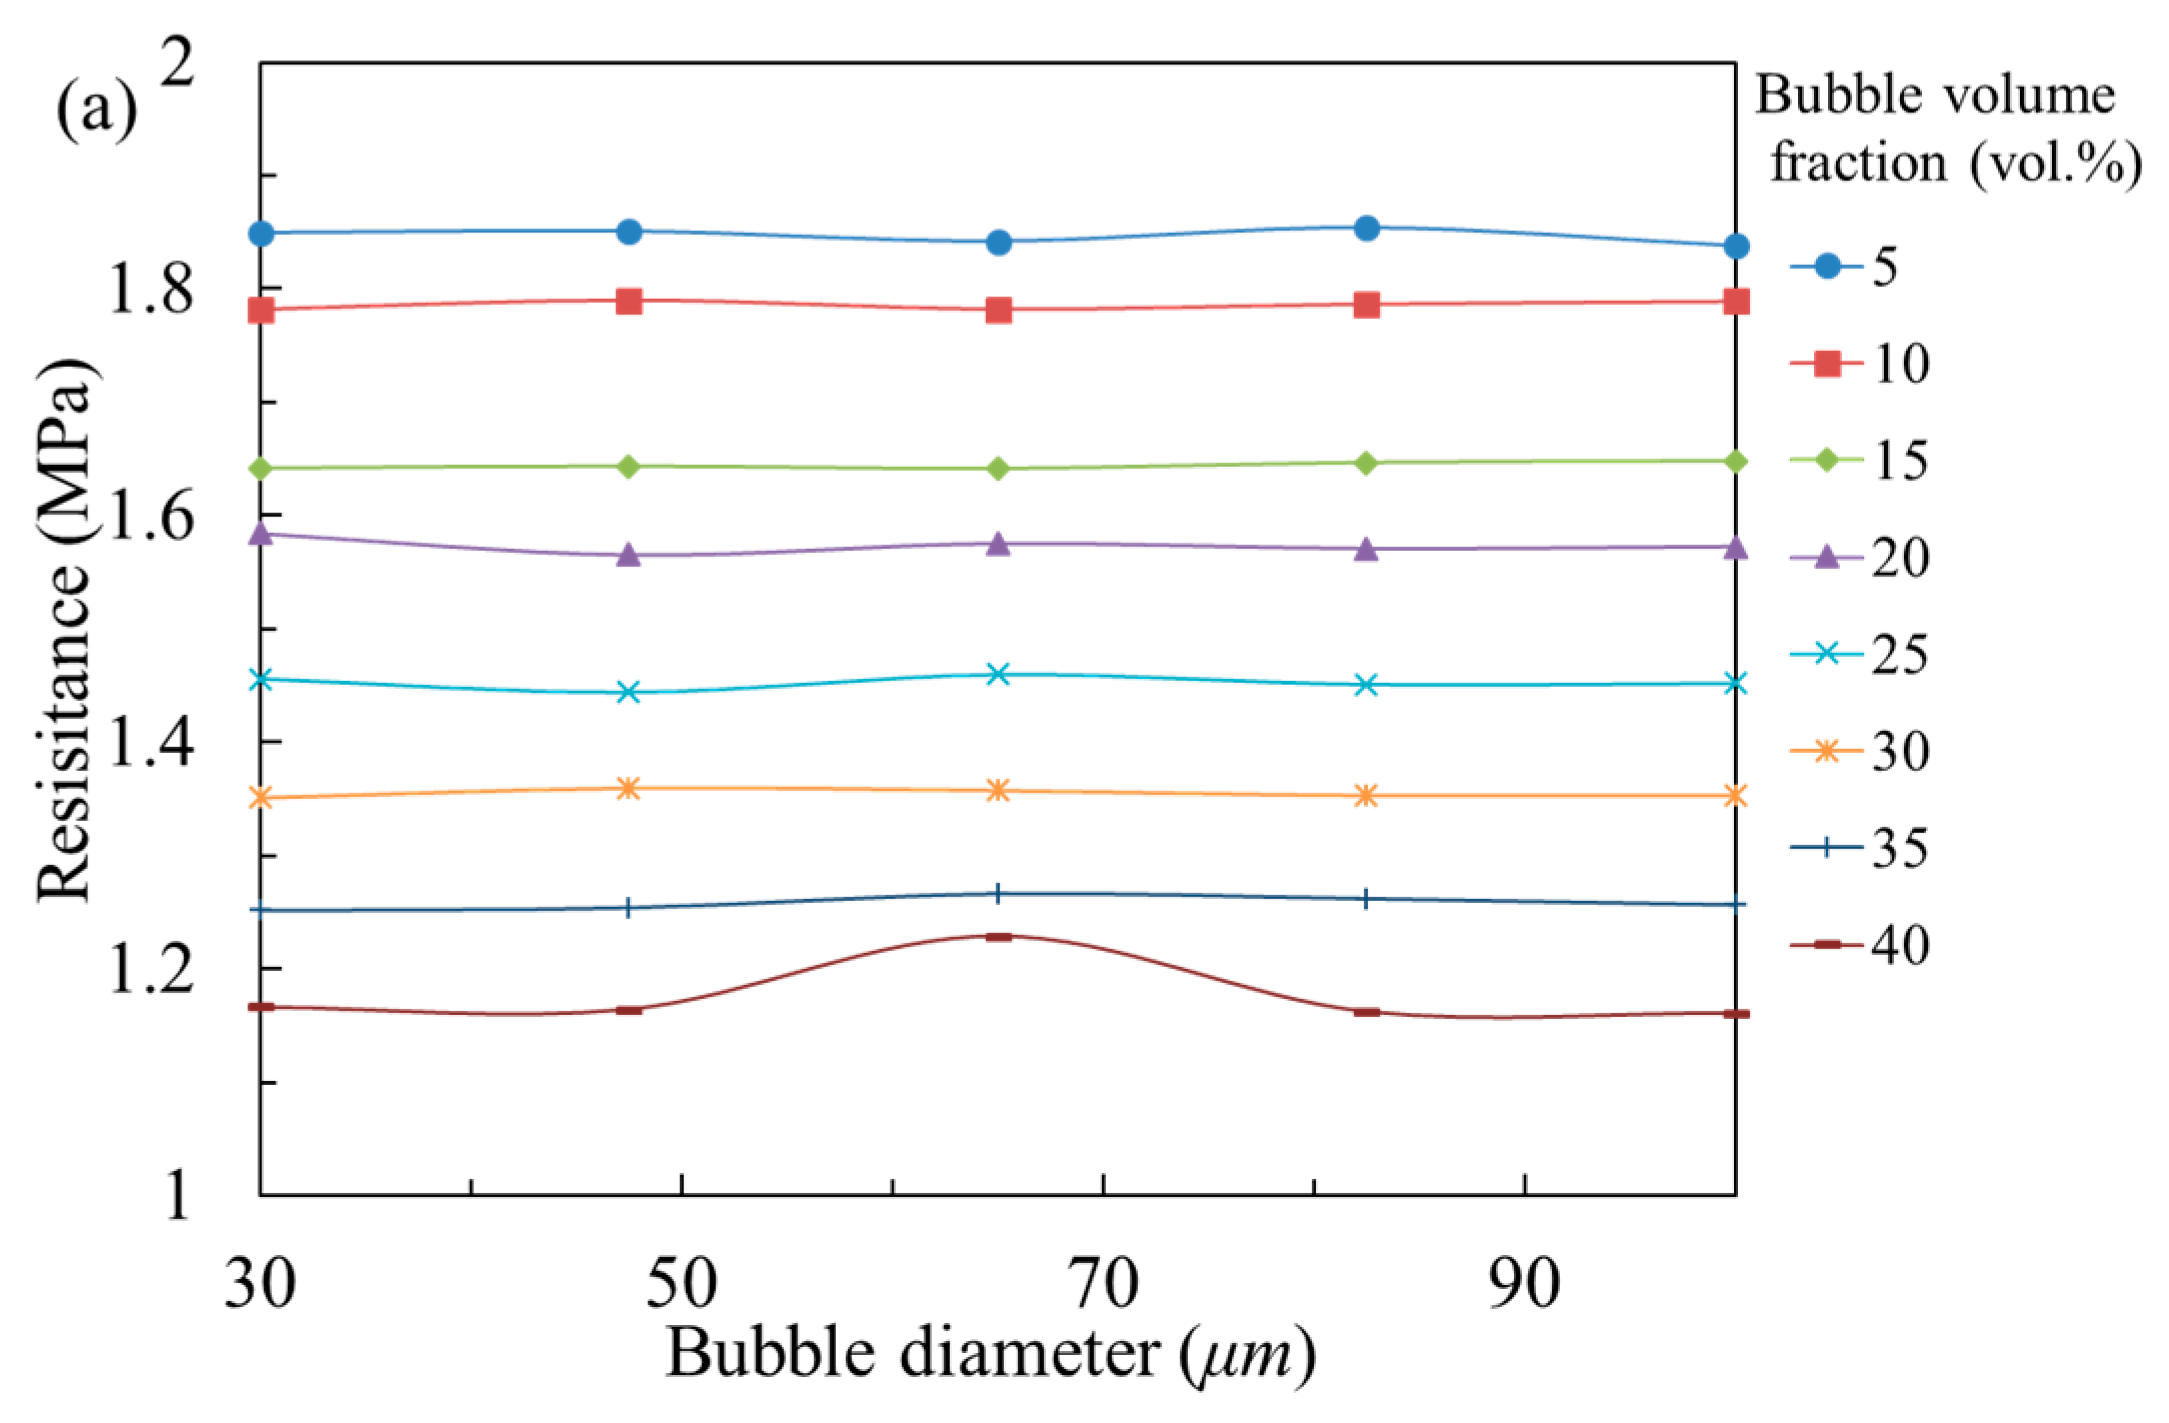
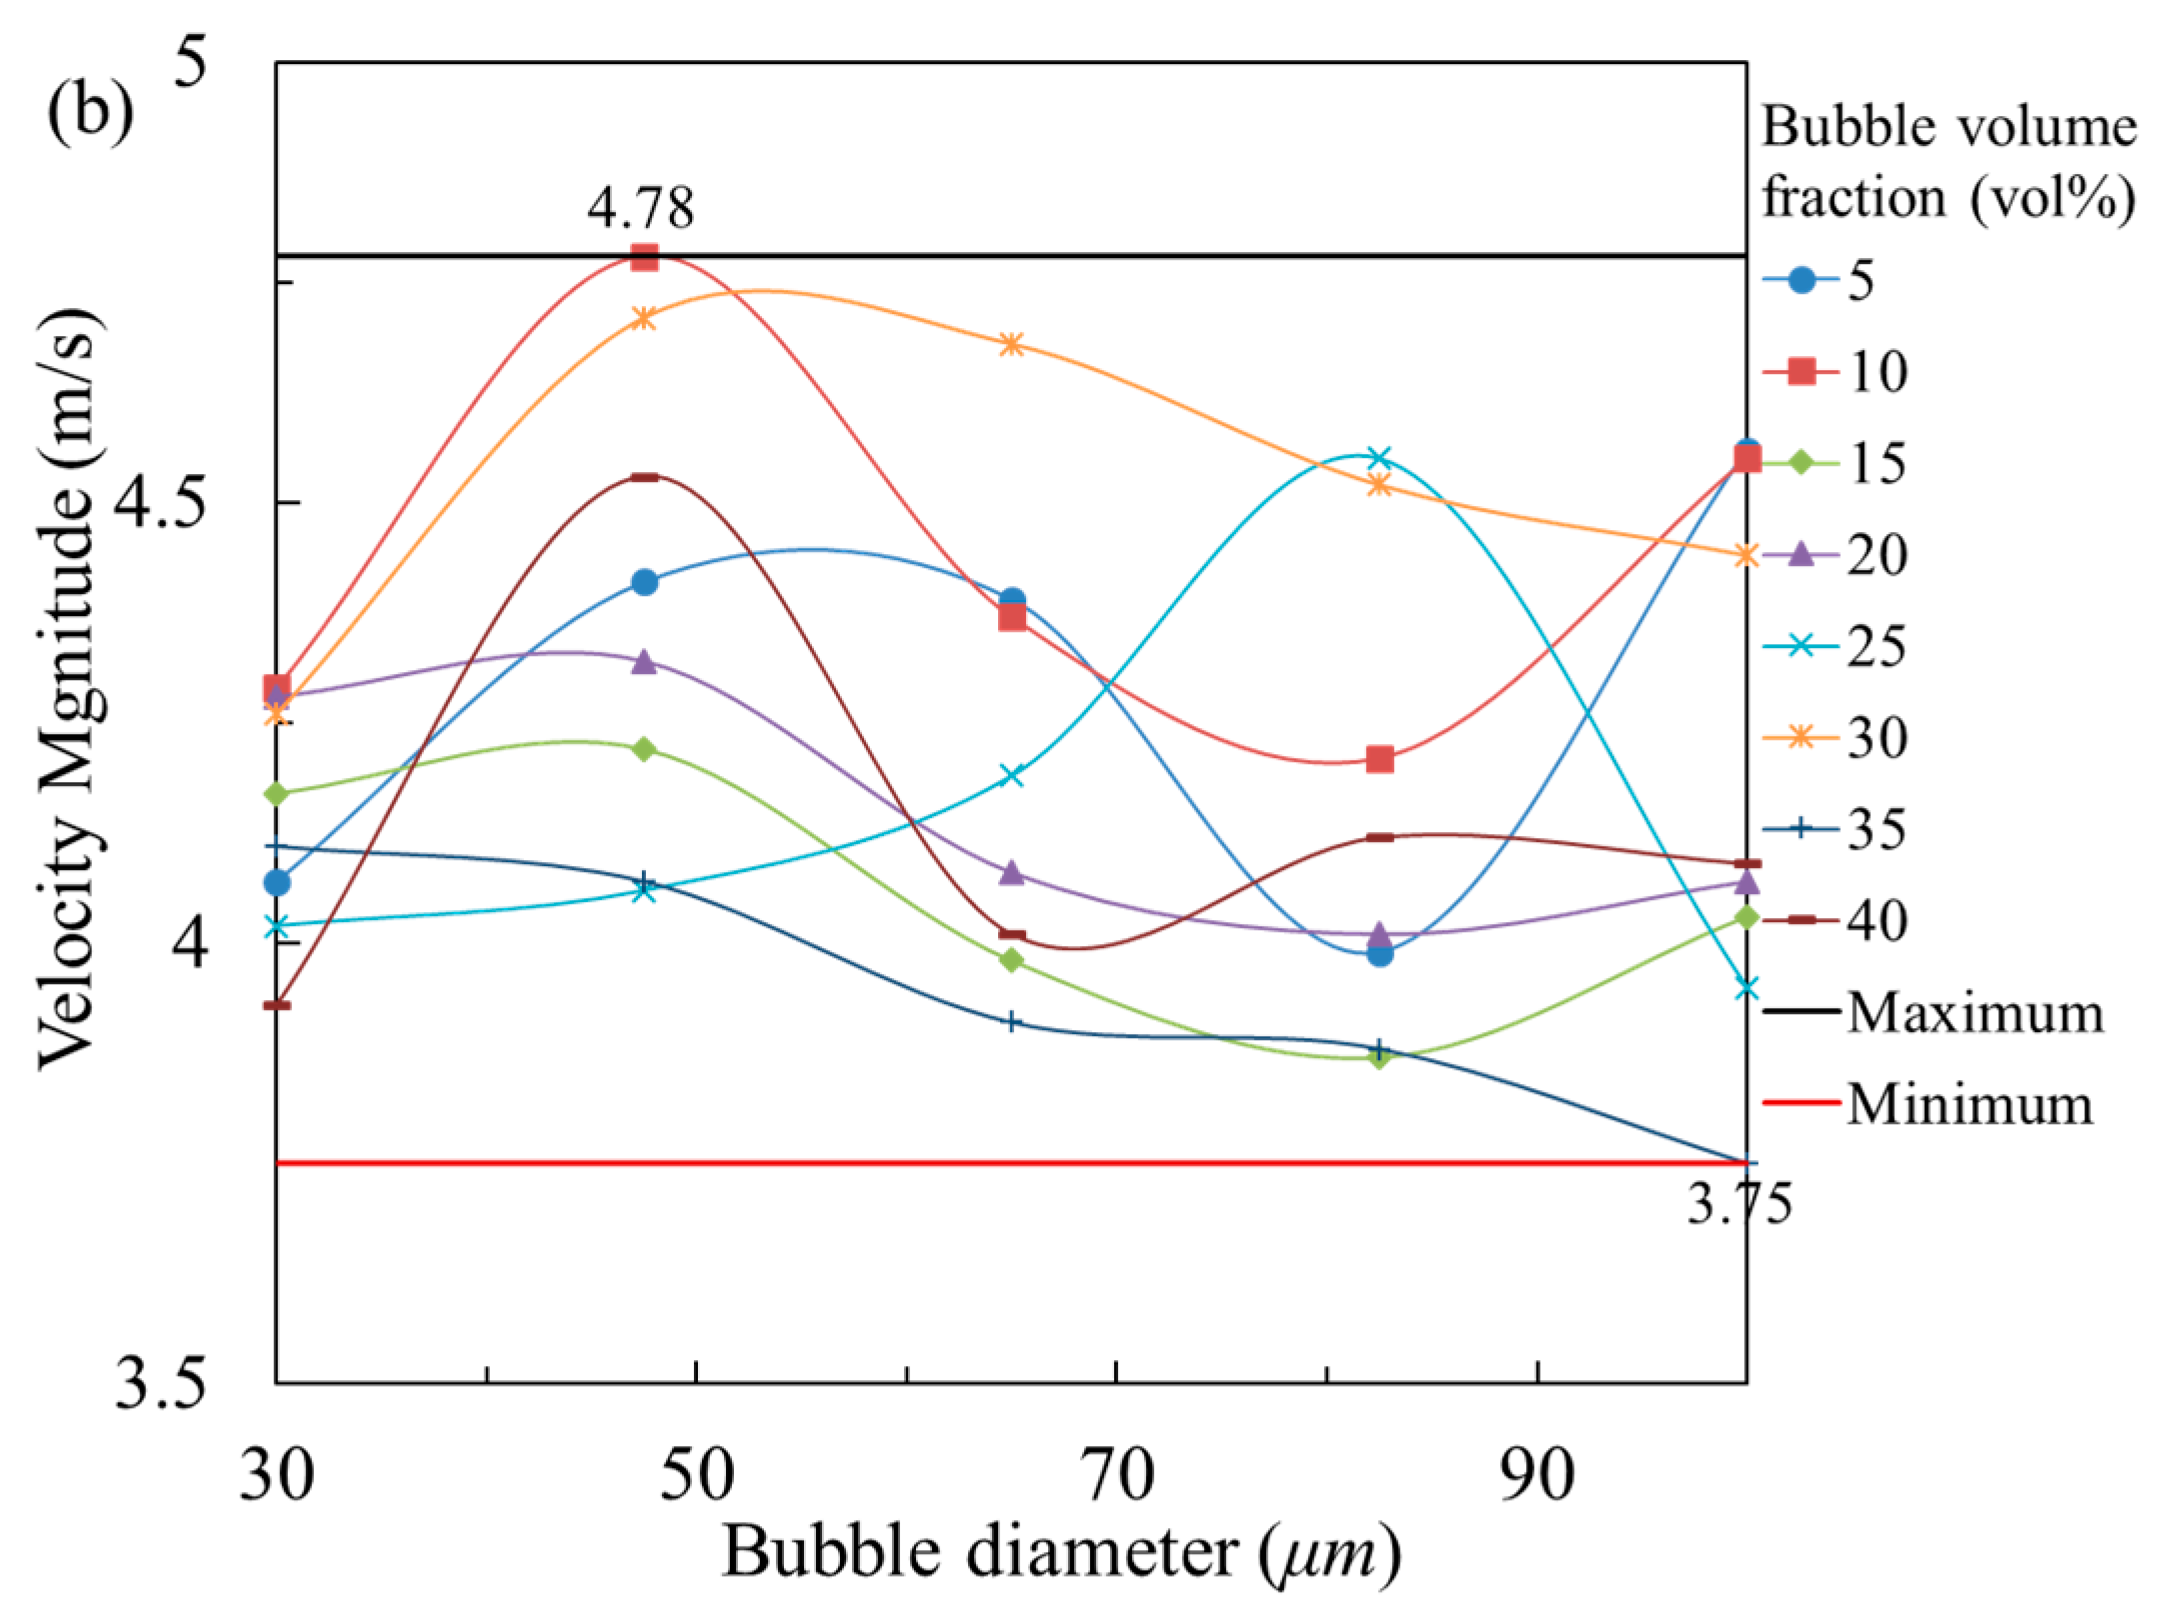
The resistance and velocity results are shown in Figure 14. As shown in this figure, the diameter has little influence on the resistance in the pipe. The impact on the velocity is slightly larger, but the velocity still generally remains between 4 and 5 m/s, which is within the acceptable range. Thus, the bubble diameter has little effect on the transport properties of TFSB.
3.5. Industrial Applications
According to the analysis of the CFD simulations, the rheological properties of TFSB are predominantly affected by the bubble volume fraction. Using TFSB can effectively reduce the resistance during slurry pipeline transport and the wear on the pipe, and self-flowing transport can be realized when the bubble volume fraction is higher than 15 vol %.
Based on the CFD simulations and the laboratory tests, the optimal material parameters can finally be determined as follows: a cement-to-sand ratio of 1:5, a bubble volume fraction of 15–20 vol %, a foam flow rate of 8–12 m3/h, and a backfill ability of 50–60 m3/h. The number S01, N02, and S05 goafs at the 0 m level in mine were chosen as the industrial tests area. After the backfill of the goaf and the achievement of condensation stability, the rate of pit roof support was larger than 90%. The test results in Table 6 show that the 7 and 28-day strengths greater than 1.2 and 2.3 MPa, respectively. Thus, the TFSB showed a good backfill effect.
A comparative analysis of the economic indicators for the conventional cement slurry and TFSB shows that, although the use of TFSB incurs an additional cost for the foaming agent, it simultaneously reduces the amount of cement consumed. As shown in Table 7, for a cement unit price of 0.05 $/kg and a foaming agent unit price of 6 $/kg, the use of TFSB saves $1.56 per cubic meter of the backfill. For mine “A”, which mines 1 million 800 thousand tons of stone annually and has an annual backfill volume of 600 thousand cubic meters, under the assumption of a direct savings in material cost of 1.56 $/m3, the mine would save 220 thousand tons of cement per year and would consequently reduce the annual backfill cost by 936 thousand dollars, which represents an enormous economic benefit.
4. Conclusions
This paper develops a three-dimensional CFD transport model of a backfill pipeline, which is used to study the pipeline transport properties of TFSB. Simulated results indicate that TFSB can maintain a steady state during pipeline transport, experiences a markedly reduced pipeline transport resistance and exhibits better liquidity than conventional cement slurry.
Furthermore, a multiphase flow model is established using the mixture method in FLUENT to study the evolutions of the foam phase, pressure, and velocity in the pipeline system for different bubble volume fractions and bubble diameters. The results show that, as the bubble volume fraction increases, the resistance of the pipeline decreases and the fluidity improves. By contrast, the bubble diameter has little effect on the transport properties of TFSB.
The combined results of the CFD simulations, slump tests, and strength tests indicate that, when the bubble volume fraction is 15–20 vol %, TFSB can satisfy the necessary strength requirements, good fluidity, and exhibit self-flowing transport. Furthermore, TFSB represents an enormous economic benefit.
Finally, although the CFD technique provides an intuitive and accurate basis for pipeline transport research with regard to TFSB, several factors were not addressed in the design of this study, including temperature, free fall, and the solid particle phase. Therefore, a more comprehensive study of the problem will be conducted in future work.
Acknowledgments
The authors would like to acknowledge the financial support from the National Key R & D Program of China (Grant No. 2017YFC0602902), the Innovation-Driven Plan of Central South University of China (Grant No. 2015CX005), and the Fundamental Research Funds for the Central Universities of Central South University (No. 2016zztx096) for their financial support.
Author Contributions
X.C., Q.C. and X.S. conceived and designed the experiments; X.C. and Y.G. performed the experiments; X.C. and J.Z. performed the simulations; X.C., J.Z. and Q.C. analyzed the data; X.C. and X.S. contributed reagents/materials/analysis tools; X.C. wrote the paper.
Conflicts of Interest
The authors declare no conflict of interest.
References
- Li, S.; Wang, X.M. Fly-ash-based magnetic coagulant for rapid sedimentation of electronegative slimes and ultrafine tailings. Powder Technol. 2016, 303, 20–26. [Google Scholar] [CrossRef]
- Liang, C.; Fall, M. Multiphysics modeling of arching effects in fill mass. Comput Geotech. 2017, 83, 114–131. [Google Scholar]
- Wu, D.; Yang, B.G.; Liu, Y.C. Transportability and pressure drop of fresh cemented coal gangue-fly ash backfill (CGFB) slurry in pipe loop. Powder Technol. 2015, 284, 218–224. [Google Scholar] [CrossRef]
- Chen, Q.S.; Zhang, Q.L.; Wang, X.M.; Xiao, C.C.; Hu, Q. A hydraulic gradient model of paste-like crude tailings backfill slurry transported by a pipeline system. Environ. Earth Sci. 2016, 75. [Google Scholar] [CrossRef]
- Zhang, Q.L.; Chen, Q.S.; Wang, X.M. Cemented Backfilling Technology of Paste-Like Based on Aeolian Sand and Tailings. Minerals 2016, 6, 132. [Google Scholar] [CrossRef]
- Belem, T.; Fourie, A.B.; Fahey, M. Time-dependent failure criterion for cemented paste backfills. Richard Jewell and Andy Fourie. In Proceedings of the 13th International Seminar on Paste and Thickened Tailings, Perth: Australian Centre for Geomechanics, Australian, 3–6 May 2010; pp. 147–162. [Google Scholar]
- Grabinsky, M.W. In situ monitoring for ground trothing paste backfill design. In Proceedings of the 13th International Seminar on Paste and Thickened Tailings, Toronto, ON, Canada, 3–6 May 2010; pp. 85–98. [Google Scholar]
- Zhou, J.; Li, X.B.; Mitri, H.S. Classification of rockburst in undergroud projects: Comparison of ten supervised learning methods. J. Comput. Civ. Eng. 2016, 30, 04016003. [Google Scholar] [CrossRef]
- Ju, F.; Zhang, J.X.; Zhang, Q. Vertical transportation system of solid material for backfilling coal mining technology. Int. J. Min. Sci. Technol. 2012, 22, 41–45. [Google Scholar] [CrossRef]
- Wu, D.; Sun, G.H.; Liu, Y.C. Modeling the thermo-hydro-chemical behavior of cemented coal gangue-fly ash backfill. Constr. Build. Mater. 2016, 111, 658–662. [Google Scholar] [CrossRef]
- Marradi, A.; Pinori, U.; Betti, G. The use of lightweight materials in road embankment construction. Proc. Soc. Behav. Sci. 2012, 53, 1000–1009. [Google Scholar] [CrossRef]
- Zhang, Y.P.; Su, X.P.; Tan, W.; Yang, S.Y.; Guo, W.J. The application value of foam mortar filling body. Met. Mine 2013, 10, 40–42. (In Chinese) [Google Scholar]
- Chen, Z.P.; Zhai, S.H.; Gao, X.; Dong, L. Research on the mechanical prosperities of foam mortar backfill and its application. Met. Mine 2010, 8, 7–10. (In Chinese) [Google Scholar]
- Zhang, W. Evaluation of effect of viscosity changes on bubble size in a mechanical flotation cell. Trans. Nonferrous Met. Soc. China 2014, 24, 2964–2968. [Google Scholar] [CrossRef]
- Yan, K.L.; Sun, C.Y.; Chen, J.; Chen, L.T.; Shen, D.J.; Liu, B.; Jia, M.L.; Niu, M.; Lv, Y.N.; Li, N.; et al. Flow characteristics and rheological properties of natural gas hydrate slurry in the presence of anti-agglomerant in a flow loop apparatus. Chem. Eng. Sci. 2014, 106, 99–108. [Google Scholar] [CrossRef]
- Bakshi, A.; Altantzis, C.; Bates, R.B.; Ghoniem, A.F. Study of the effect of reactor scale on fluidization hydrodynamics using fine-grid CFD simulations based on the two-fluid model. Powder Technol. 2016, 299, 185–198. [Google Scholar] [CrossRef]
- Bisognin, P.C.; Fusco, J.M.; Soares, C. Heat transfer in fluidized beds with immersed surface: Effect of geometric parameters of surface. Powder Technol. 2016, 297, 401–408. [Google Scholar] [CrossRef]
- Eesa, M.; Barigou, M. CFD analysis of viscous non-Newtonian flow under the influence of a superimposed rotational vibration. Comput. Fluids 2008, 37, 24–34. [Google Scholar] [CrossRef]
- Shannag, M.J. Characteristics of lightweight concrete containing mineral admixtures. Constr. Build. Mater. 2011, 25, 658–662. [Google Scholar] [CrossRef]
- Chen, Z.P. A New Type of High Efficient Foaming AGENT for Geotechnical Engineering. Chinese Patent ZL 200610033825.9, 27 February 2006. [Google Scholar]
- GB/T18046-2008 (MOD, ASTM C989M). In Ground Granulated Blast Furnace Slag Used for Cement and Concrete; General Administration of Quality Supervision, Inspection and Quarantine of PR China: Beijing, China, 2008.
- Gao, J.; Fourie, A. Spread is better: An investigation of the mini-slump test. Miner. Eng. 2015, 71, 120–132. [Google Scholar] [CrossRef]
- B.F Inc. Fluent User’s Guide; Fluent Incorporated: Lebanon, NH, USA, 2010. [Google Scholar]
- Hata, K.; Masuzaki, S. Critical heat fluxes of sub cooled water flow boiling in a short vertical tube at high liquid Reynolds number. Nucl. Eng. Des. 2010, 240, 3145–3157. [Google Scholar] [CrossRef]
- Chen, X.; Shi, X.Z.; Zhou, J.; Chen, Q.S.; Yang, C. Feasibility of Recycling Ultrafine Leaching Residue by Backfill: Experimental and CFD Approaches. Minerals 2017, 7, 54. [Google Scholar] [CrossRef]
- Zhao, G.H. Simulating and Experiment Research of Resistance Characteristics of coal-Water-Slurry. Master’s Thesis, Southeast University, Nanjing, China, 2007. (In Chinese). [Google Scholar]
- Kurnia, J.C.; Sasmito, A.P.; Mujumdar, A.S. CFD simulation of methane dispersion and innovative methane management in underground mining faces. Appl. Math. Model. 2014, 38, 3467–3484. [Google Scholar] [CrossRef]
- Yang, J.; Wang, X.M.; Zhang, Q.L.; Ke, Y.X. Pipeline transportation properties of high viscosity sulfur-content filling slurry in three-phase flow. Chin. J. Nonferrous Met. 2015, 25, 1049–1055. (In Chinese) [Google Scholar]
- Zhang, J.S.; Wang, C.Z.; Huang, L.X.; Qang, B.Q. Foam Concrete, 1st ed.; Harbin Institute of Technology Press: Harbin, China, 2016. [Google Scholar]
- Nambiar, E.K.K.; Ramamurthy, K. Sorption characteristics of foam concrete. Cem. Concr. Res. 2007, 37, 1341–1347. [Google Scholar] [CrossRef]
- Bingham, E.C. Fluidity and Plasticity; McGraw-Hill: New York, NY, USA, 1922. [Google Scholar]
- Gopala, V.R.; Nijeholt, J.A.L.À.; Bakker, P.; Haverkate, B. Development and validation of a CFD model predicting the backfill process of a nuclear waste gallery. Nucl. Eng. Des. 2011, 241, 2508–2518. [Google Scholar] [CrossRef]
- Slottee, J.S. Update on the application of paste thickeners for tailings disposal-mine paste backfill. In Proceedings of the International Seminar on Paste and Thickened Tailings, Cape Town, South Africa, 31 March–2 April 2004. [Google Scholar]
- Liu, G.S.; Li, L.; Yang, X.C.; Guo, L.J. A numerical analysis of the stress distribution in backfilled stopes considering interfaces between backfill and rock walls. Int. J. Geomech. 2017, 17, 06016014-1–06016014-9. [Google Scholar] [CrossRef]
- Chen, X.; Shi, X.Z.; Zhou, J.; Qiu, X.Y.; Lin, X.F. CFD simulation of transportation properties of W type and long distance pipeline for foam slurry backfilling. Chin. J. Nonferrous Met. 2016, 26, 1782–1793. (In Chinese) [Google Scholar]
- Beltrán, J.P.; Ceci, P.; Miguez, P.; Casali, P. Construction of slurry pipelines. Proc. Eng. 2016, 138, 27–130. [Google Scholar] [CrossRef]
- Xiao, H.L. Study on the Performance of Foaming Agents Applied to the Foamed Concrete. Master’s Thesis, Zhejiang University, Zhejiang, China, 2011. (In Chinese). [Google Scholar]
Figure 1.
Manufacturing processes for foam slurry.

Figure 2.
Pipeline transport system for backfill in an underground mine.

Figure 3.
Foam formation process: (a) bubble formation, (b) adhesion and rise, and (c) foam formation.
Figure 3.
Foam formation process: (a) bubble formation, (b) adhesion and rise, and (c) foam formation.
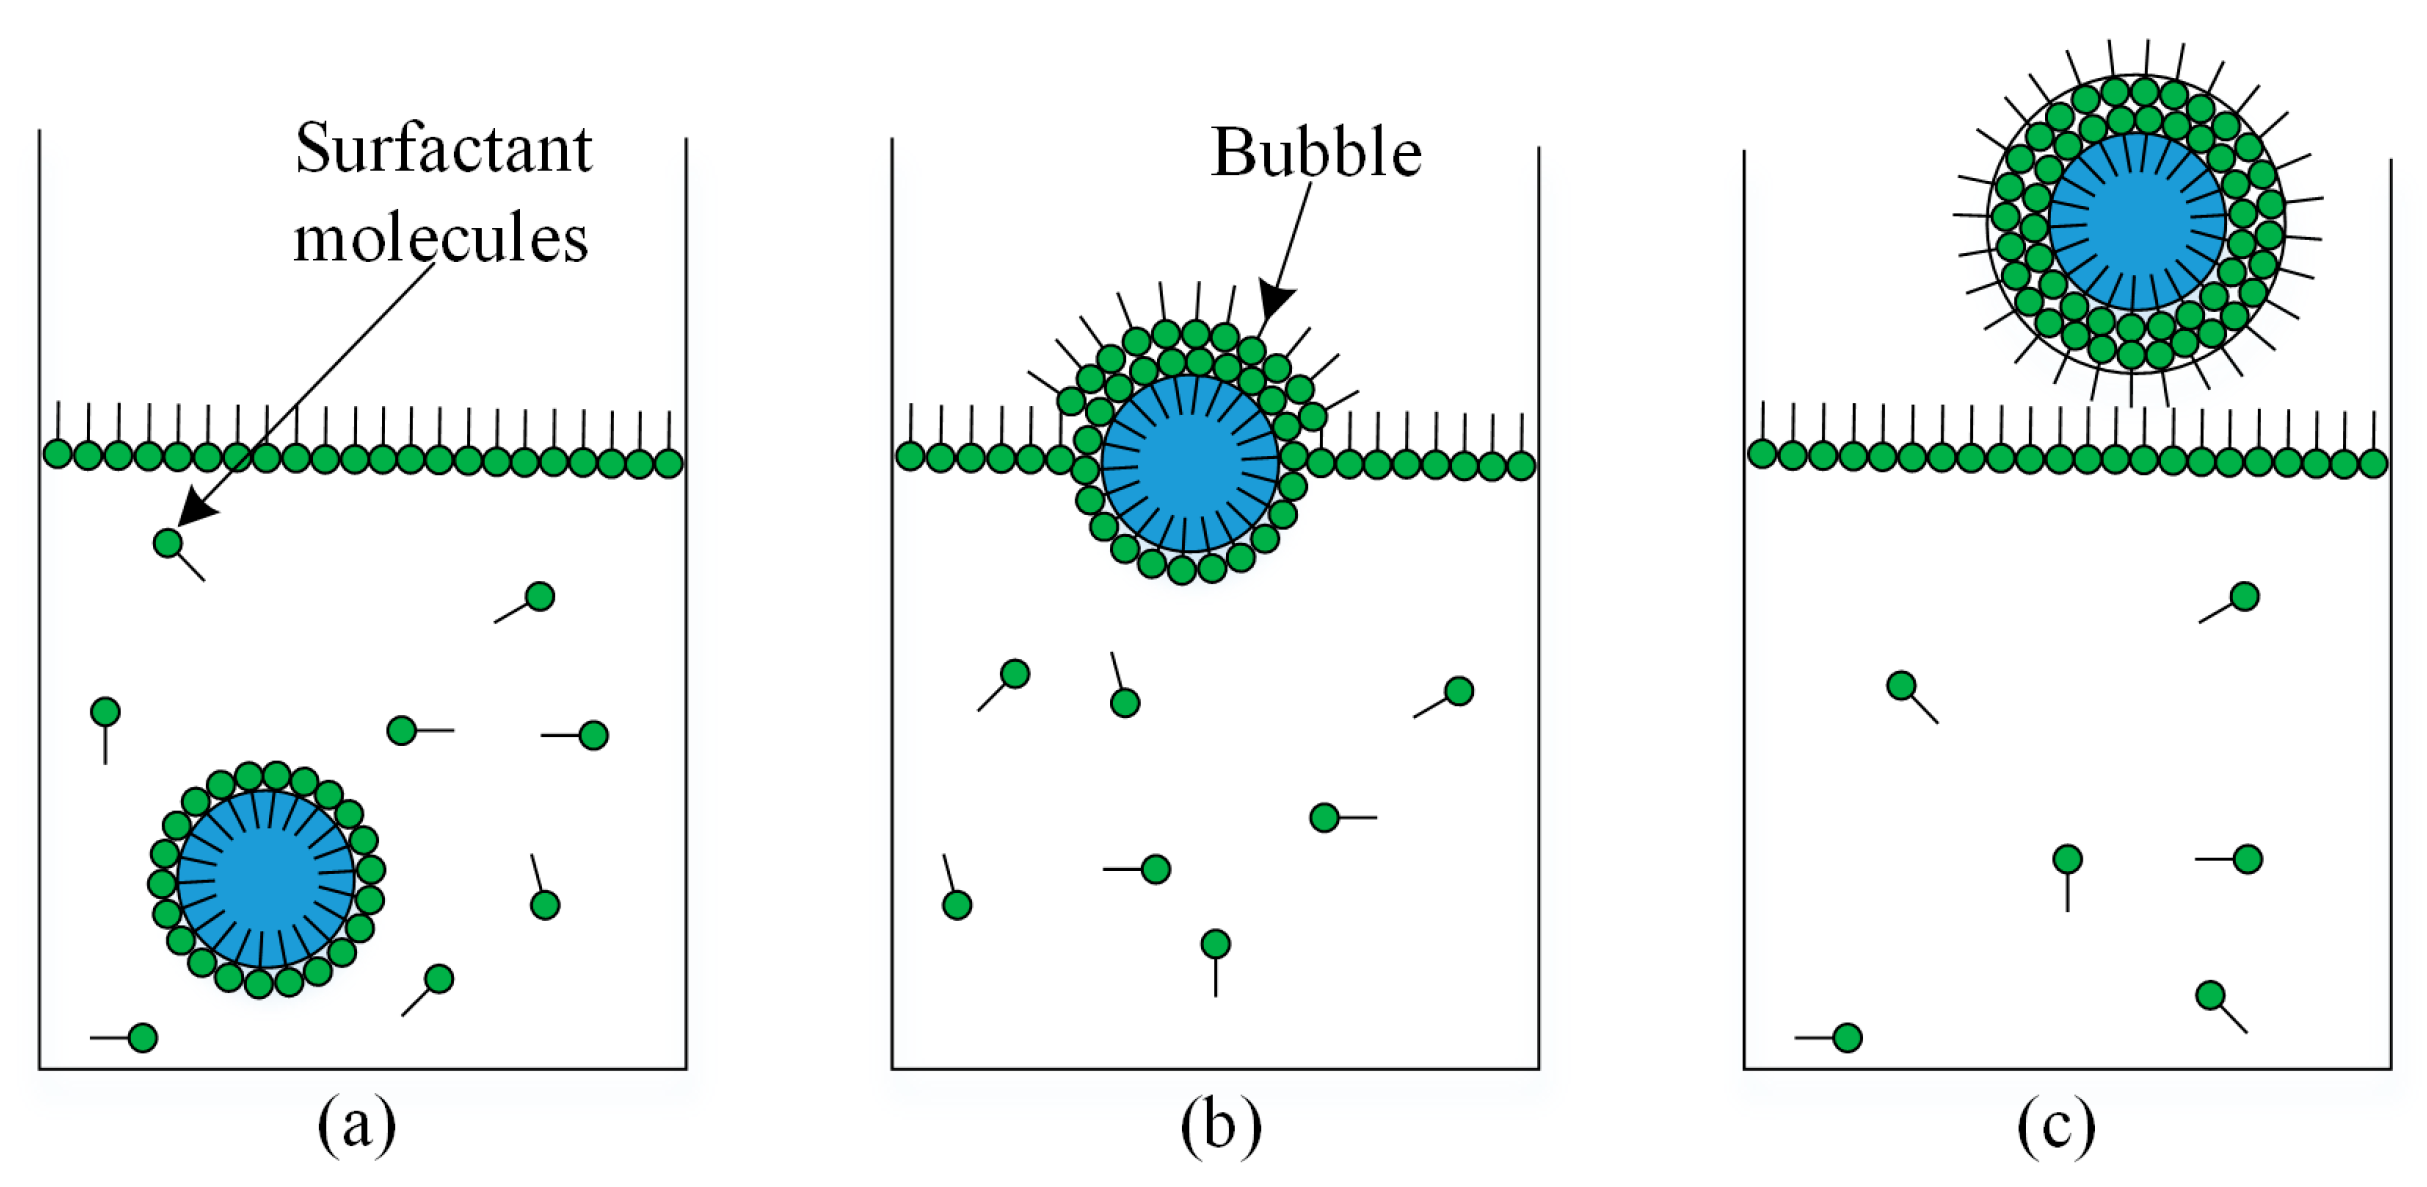
Figure 4.
Formation process of foam slurry: (a) mixture, (b) stirring and adhesion and (c) foam slurry formation.
Figure 4.
Formation process of foam slurry: (a) mixture, (b) stirring and adhesion and (c) foam slurry formation.

Figure 5.
Rheological properties of the cement slurry and standard foam: (a) evolution of shear stress with share rate and (b) evolution of plastic viscosity with share rate.
Figure 5.
Rheological properties of the cement slurry and standard foam: (a) evolution of shear stress with share rate and (b) evolution of plastic viscosity with share rate.
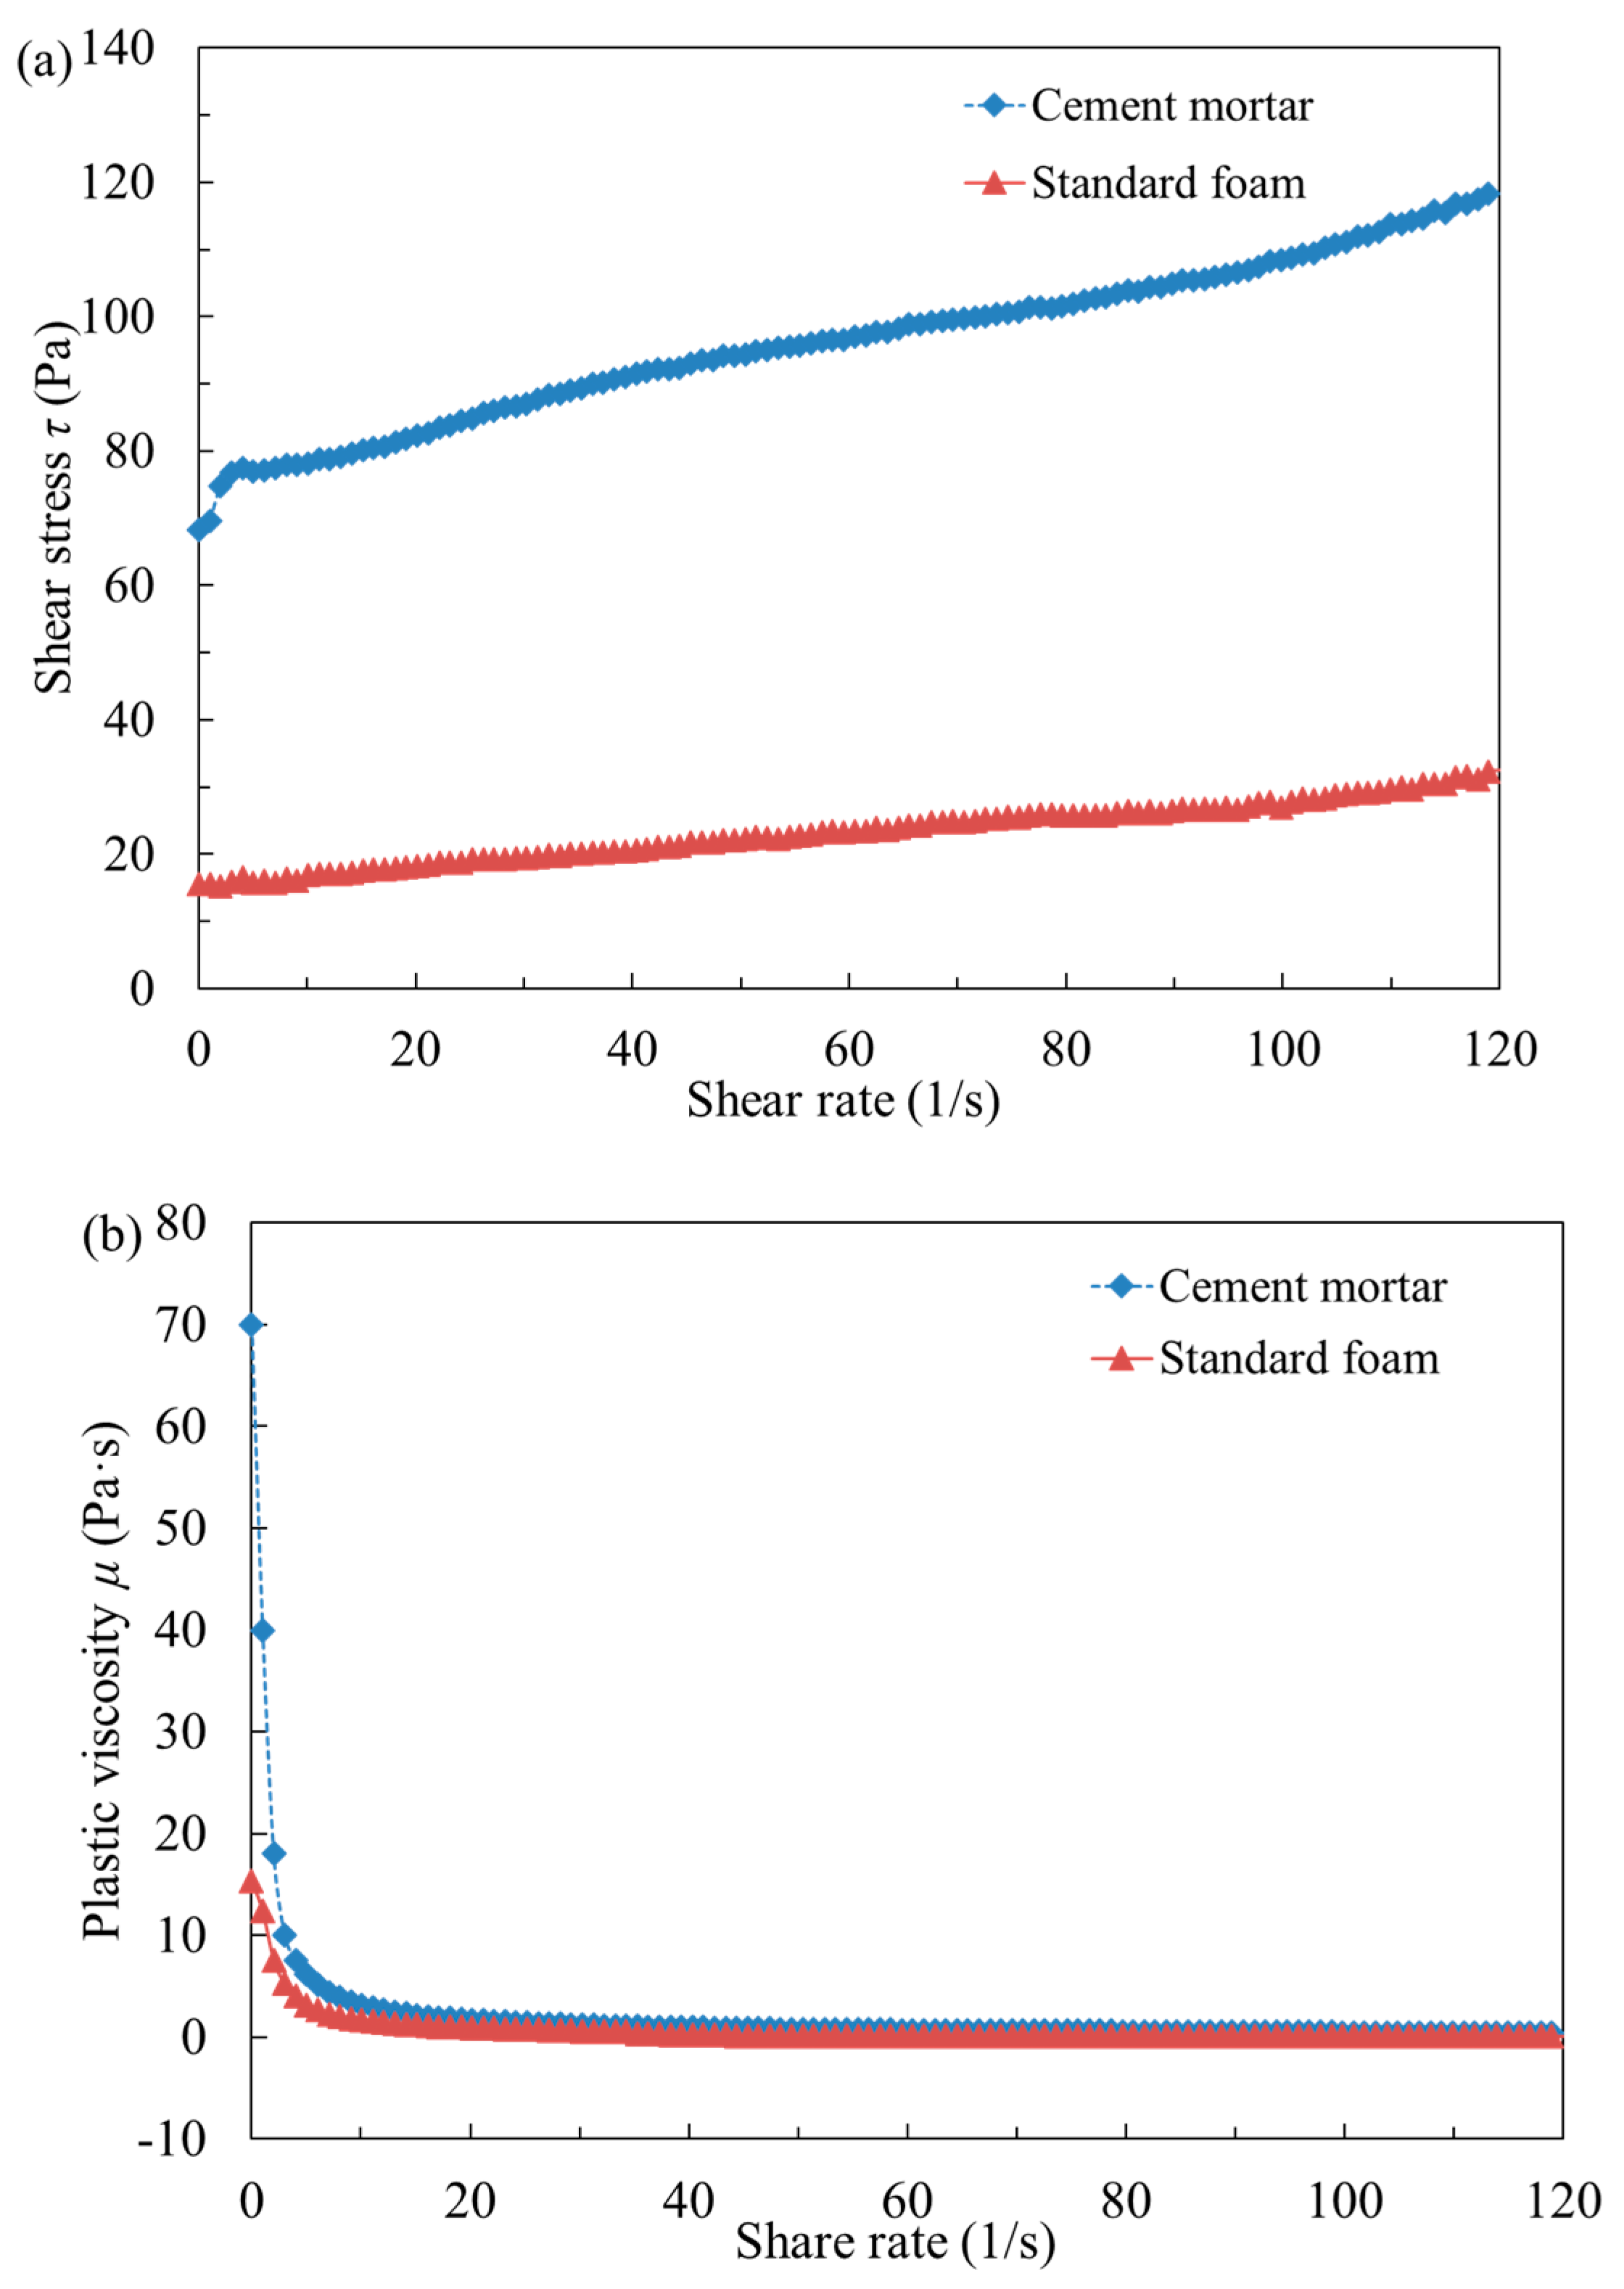
Figure 6.
Slump tests: (a) method and (b) results.

Figure 7.
Results of strength tests: (a) method and (b) results.
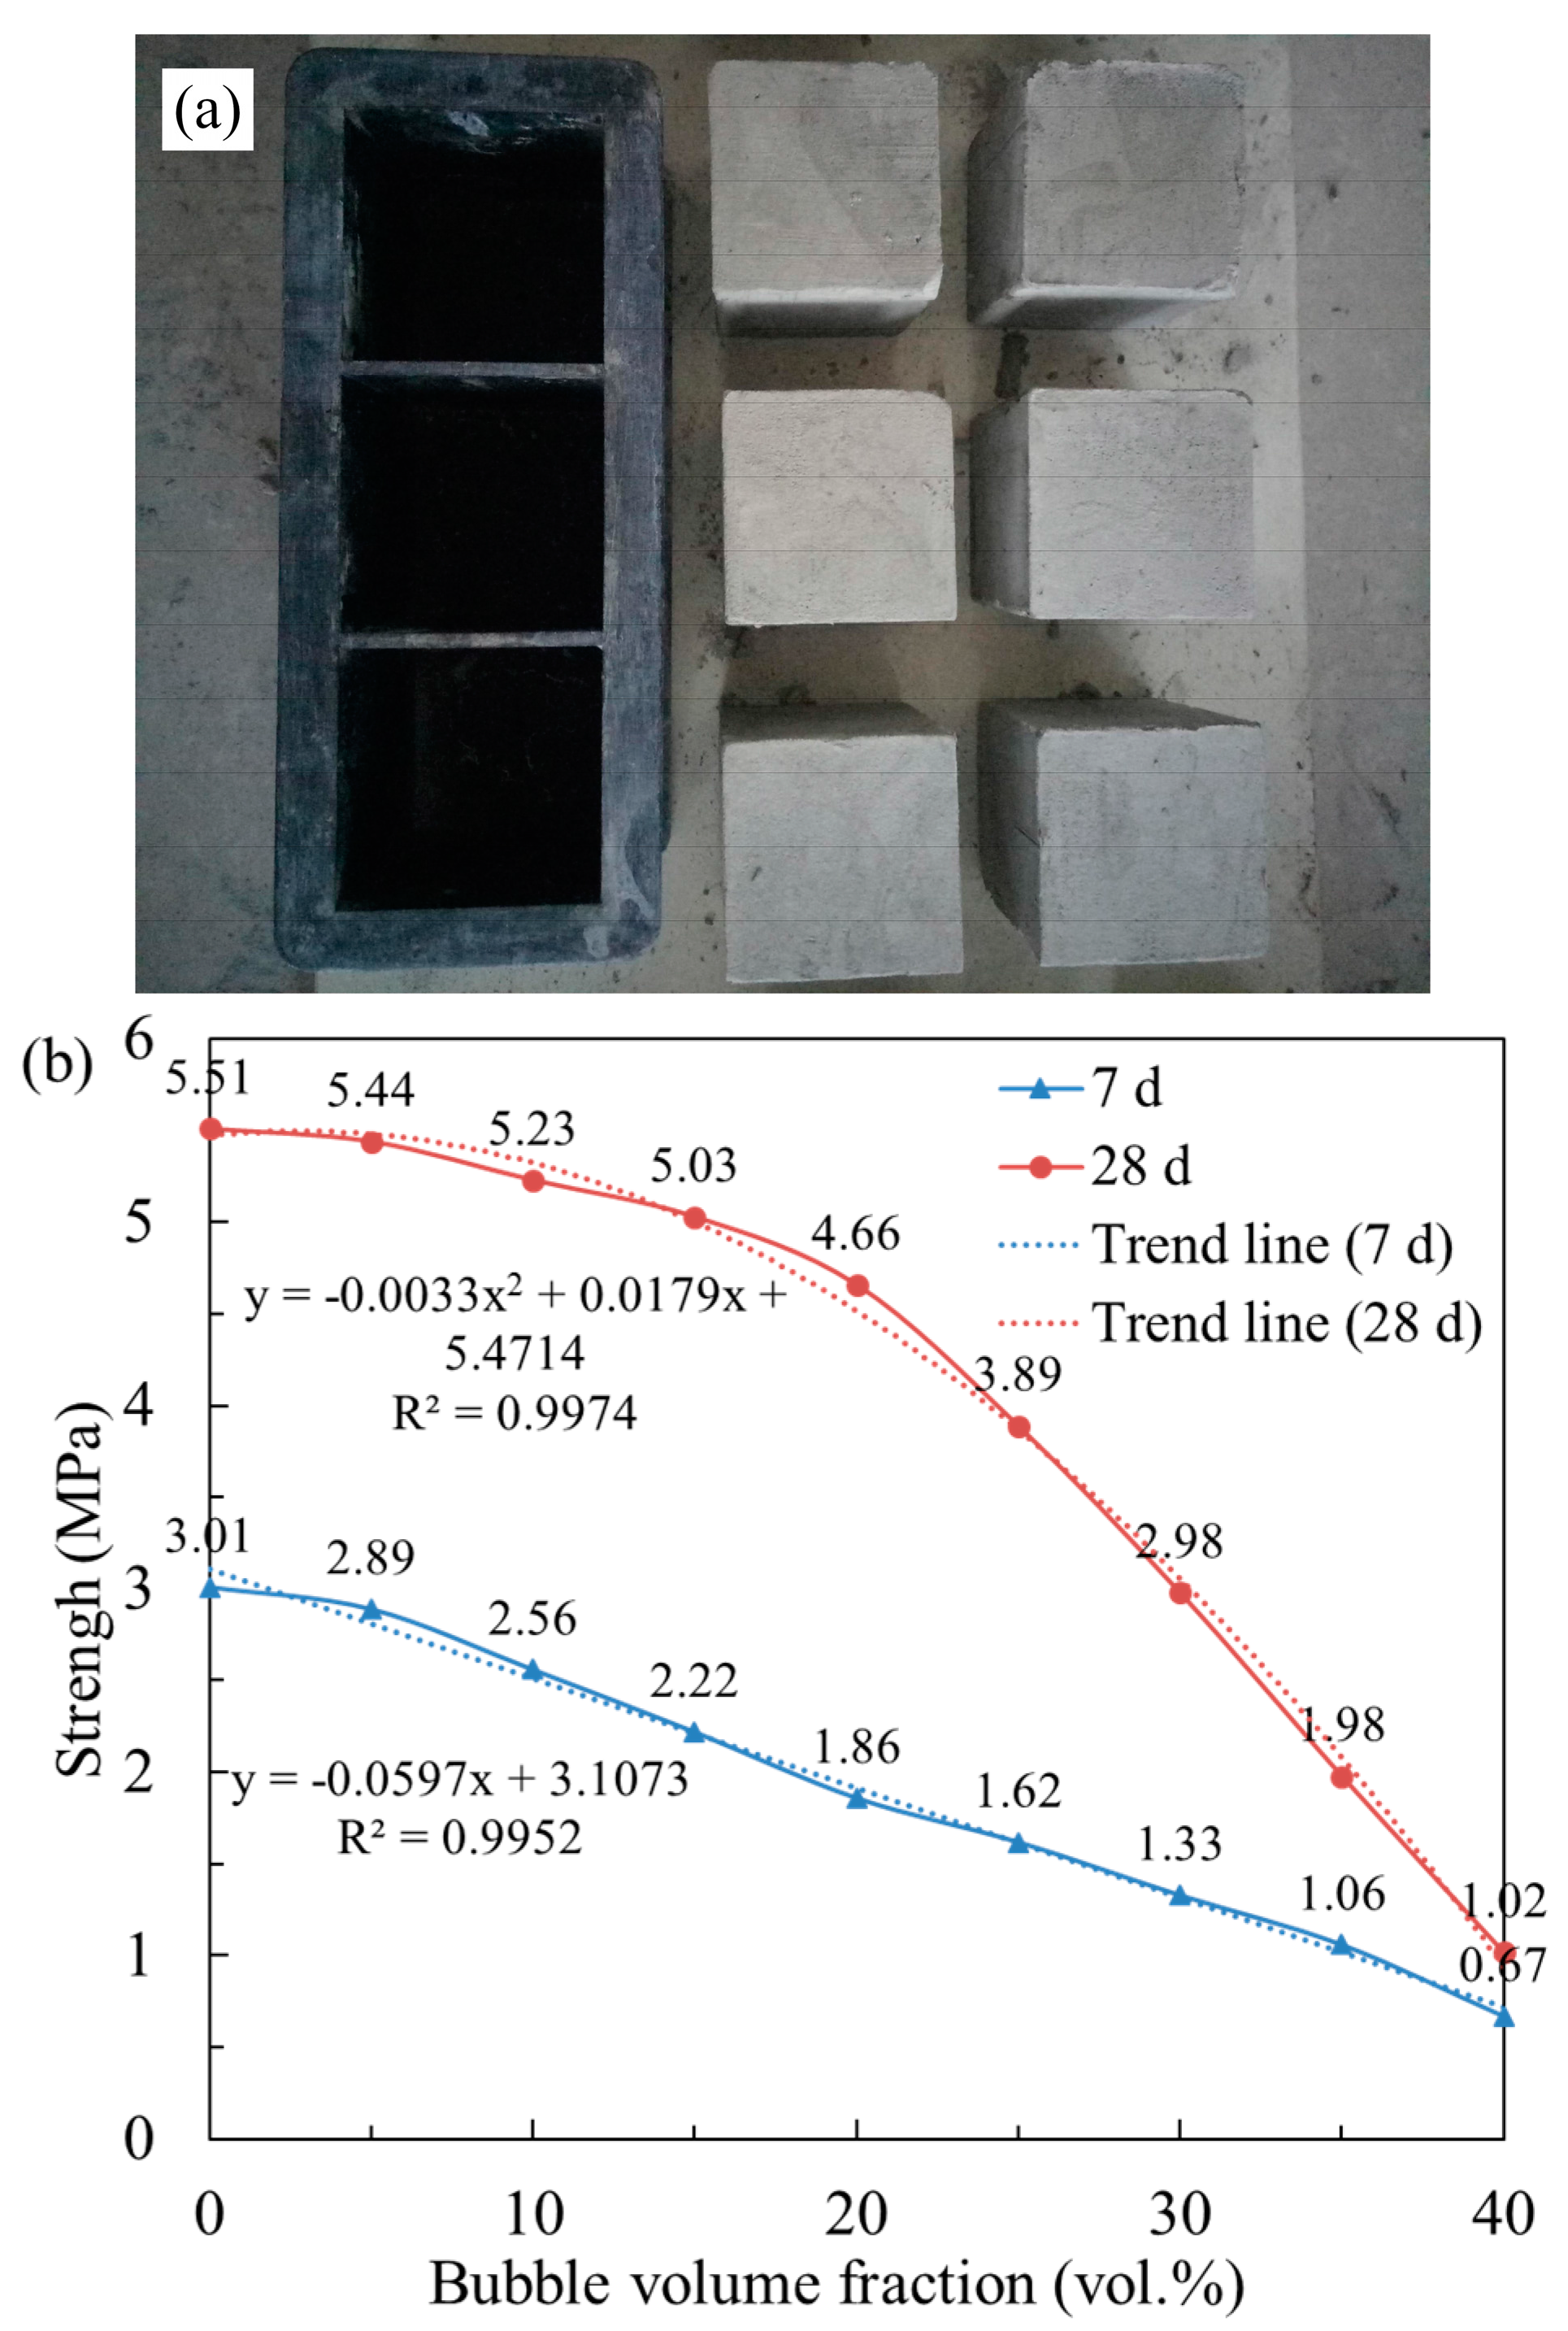
Figure 8.
Bubble volume fraction (unit in vol %) distribution in the pipe for a bubble volume fraction of 15 vol %: (a) inlet, (b) elbow, and (c) outlet.
Figure 8.
Bubble volume fraction (unit in vol %) distribution in the pipe for a bubble volume fraction of 15 vol %: (a) inlet, (b) elbow, and (c) outlet.
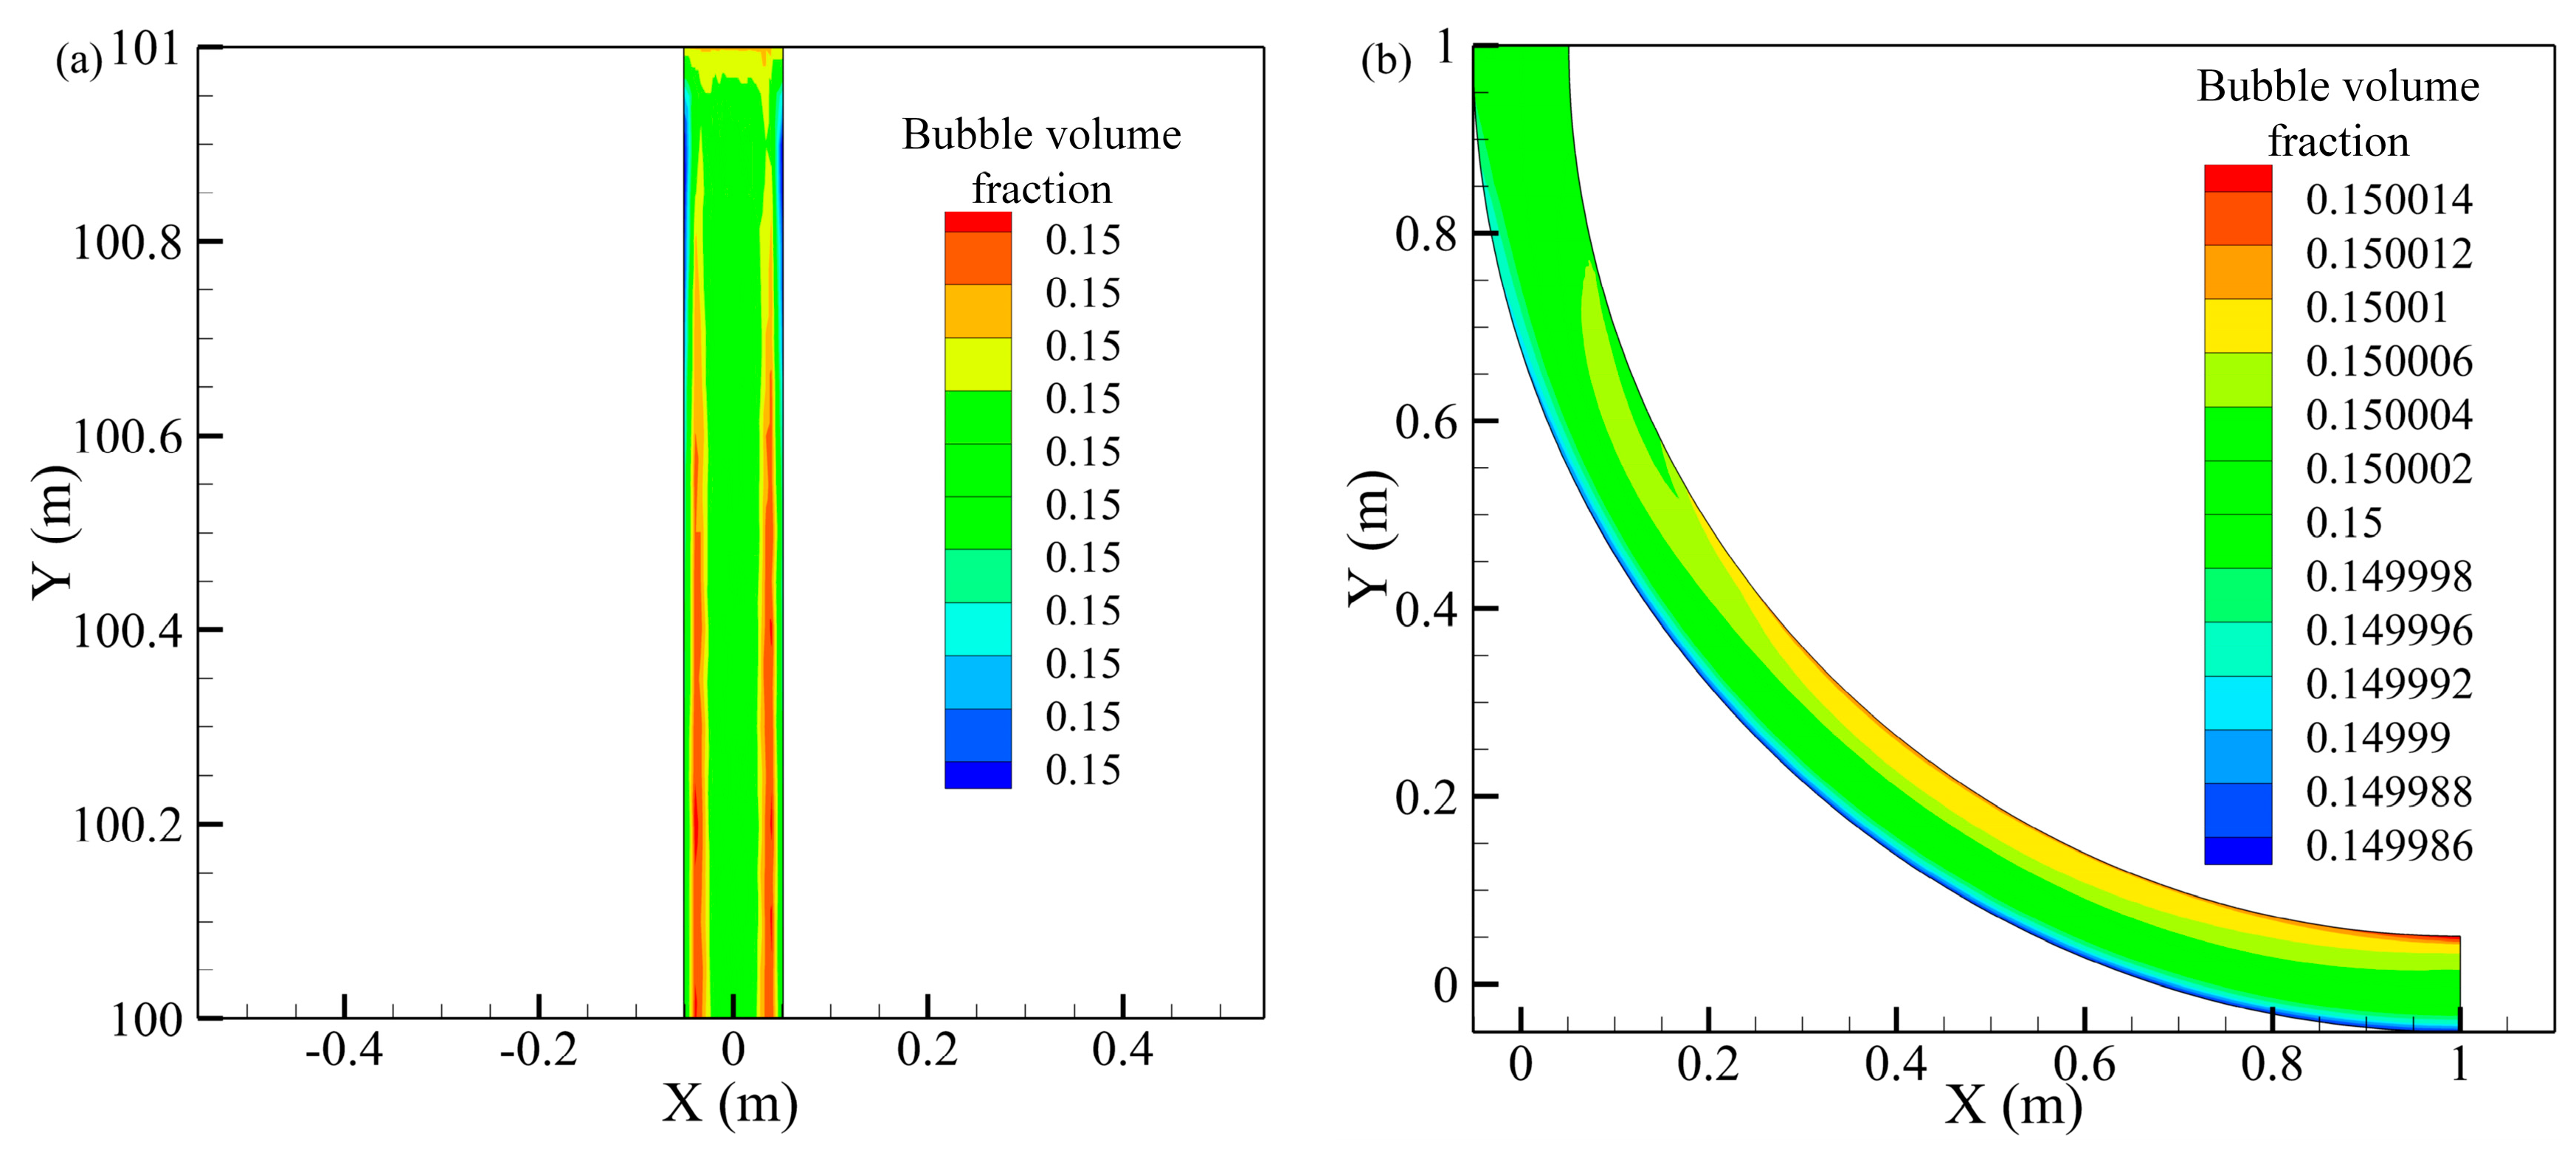
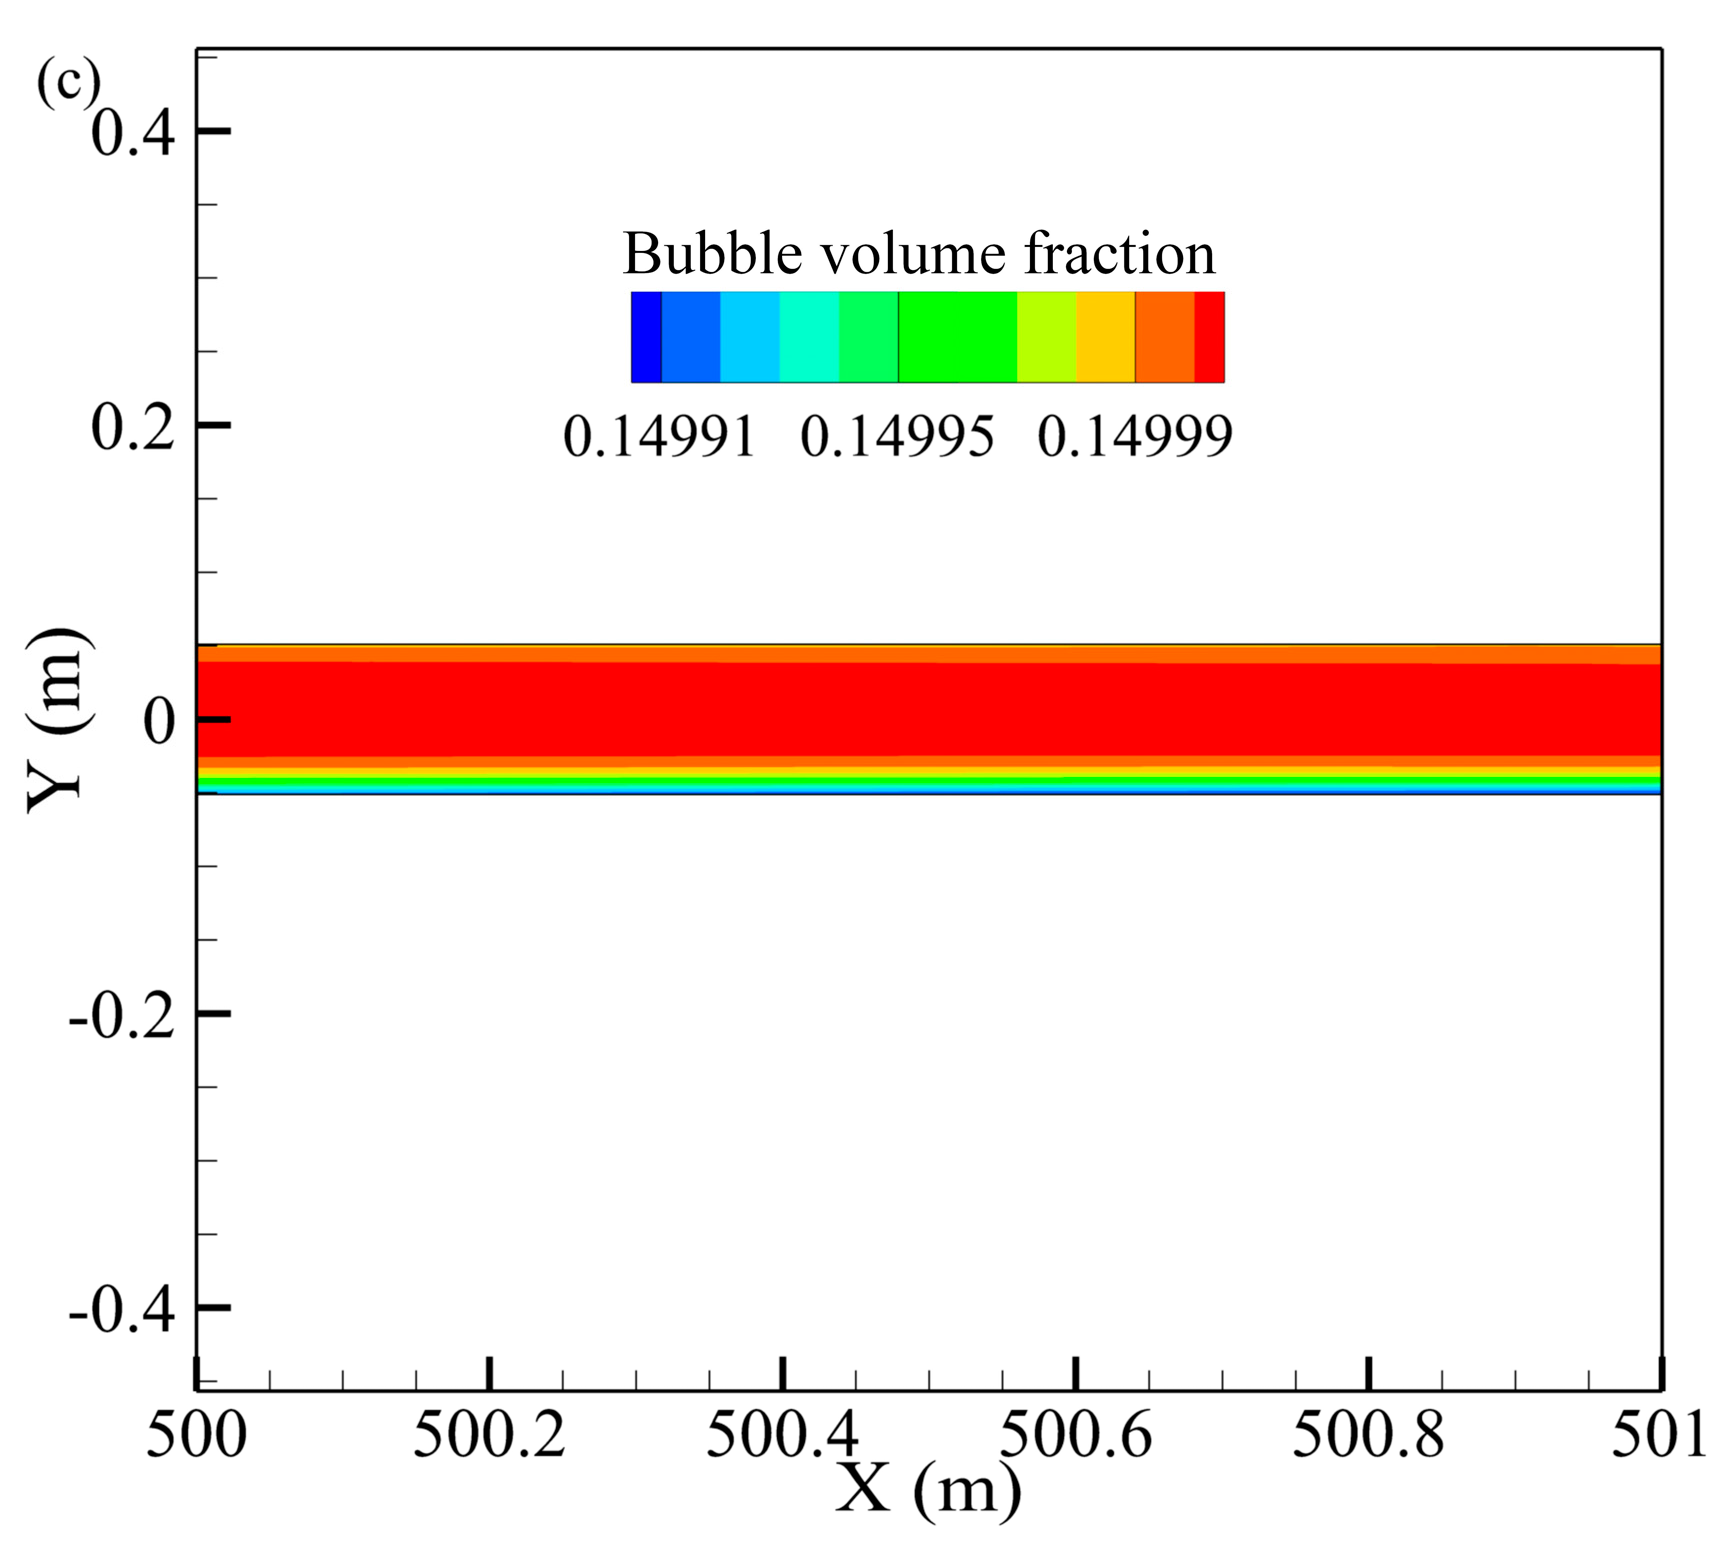
Figure 9.
Total pressure profiles for various bubble volume fractions.
Figure 10.
Relationship between total resistance and bubble volume fraction.
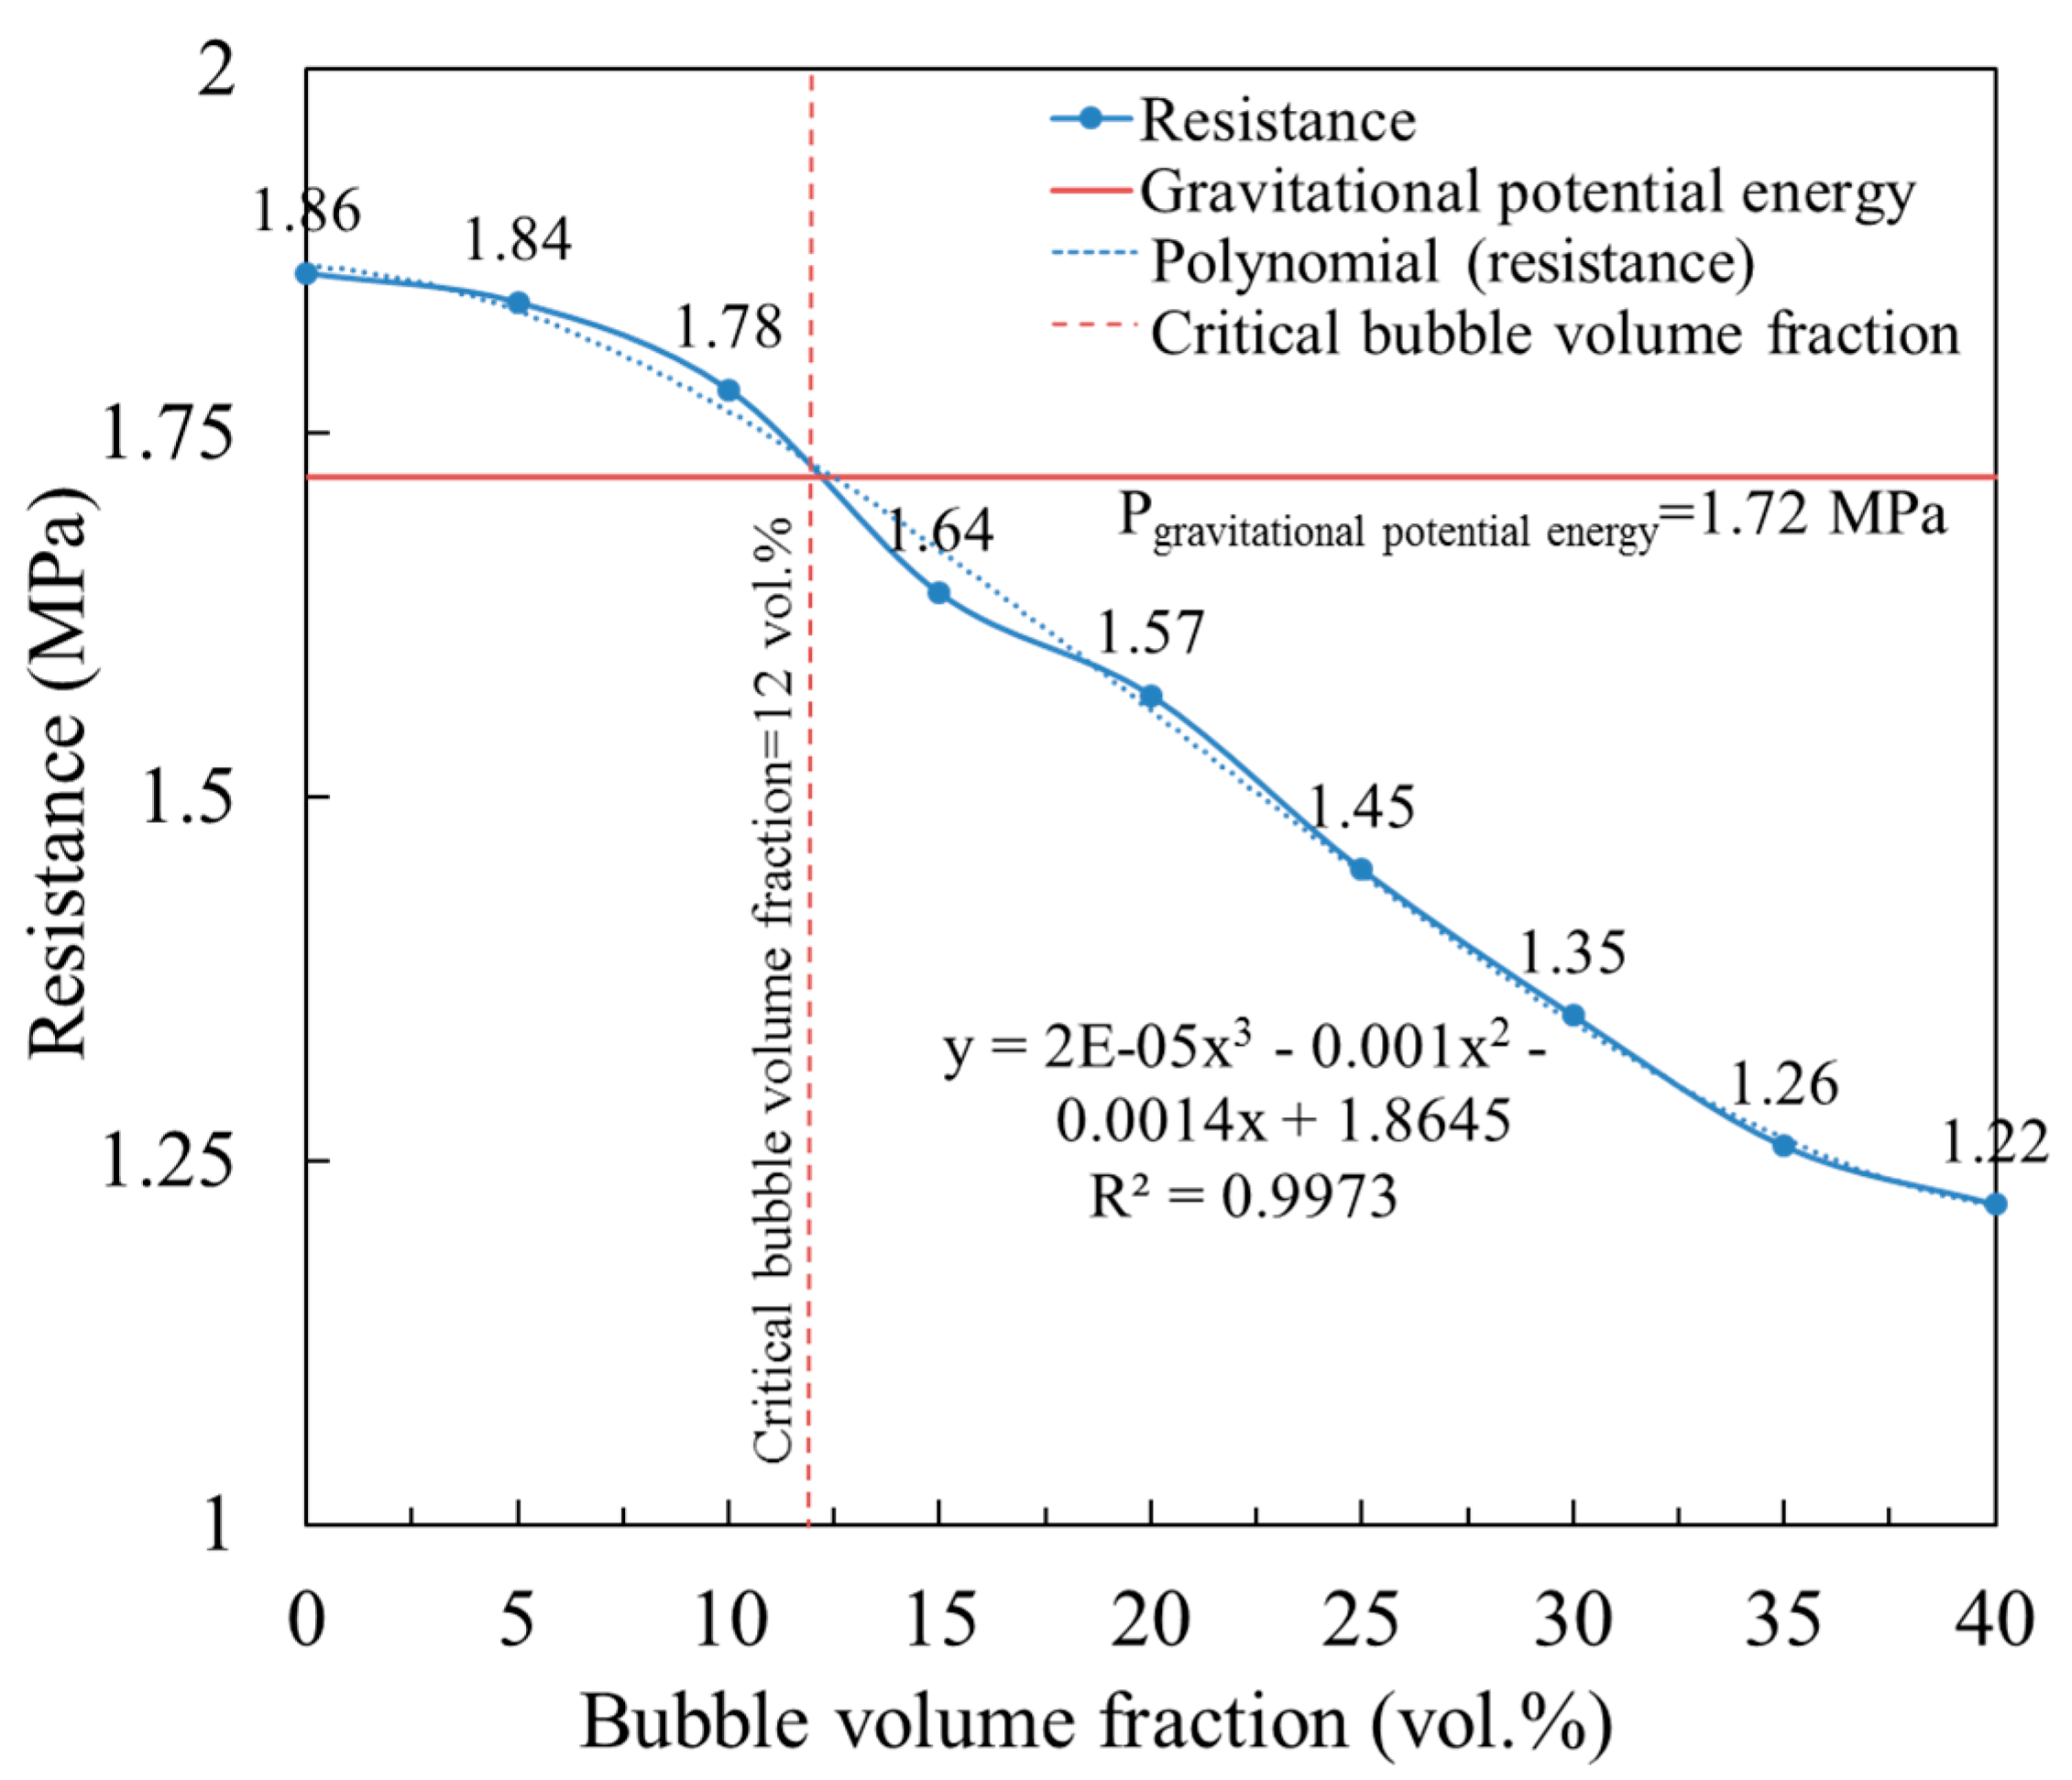
Figure 11.
Maximum velocities in the simulations.

Figure 12.
Velocity distributions in the pipe for a bubble volume fraction of 15 vol %: (a) inlet, (b) elbow, and (c) outlet.
Figure 12.
Velocity distributions in the pipe for a bubble volume fraction of 15 vol %: (a) inlet, (b) elbow, and (c) outlet.
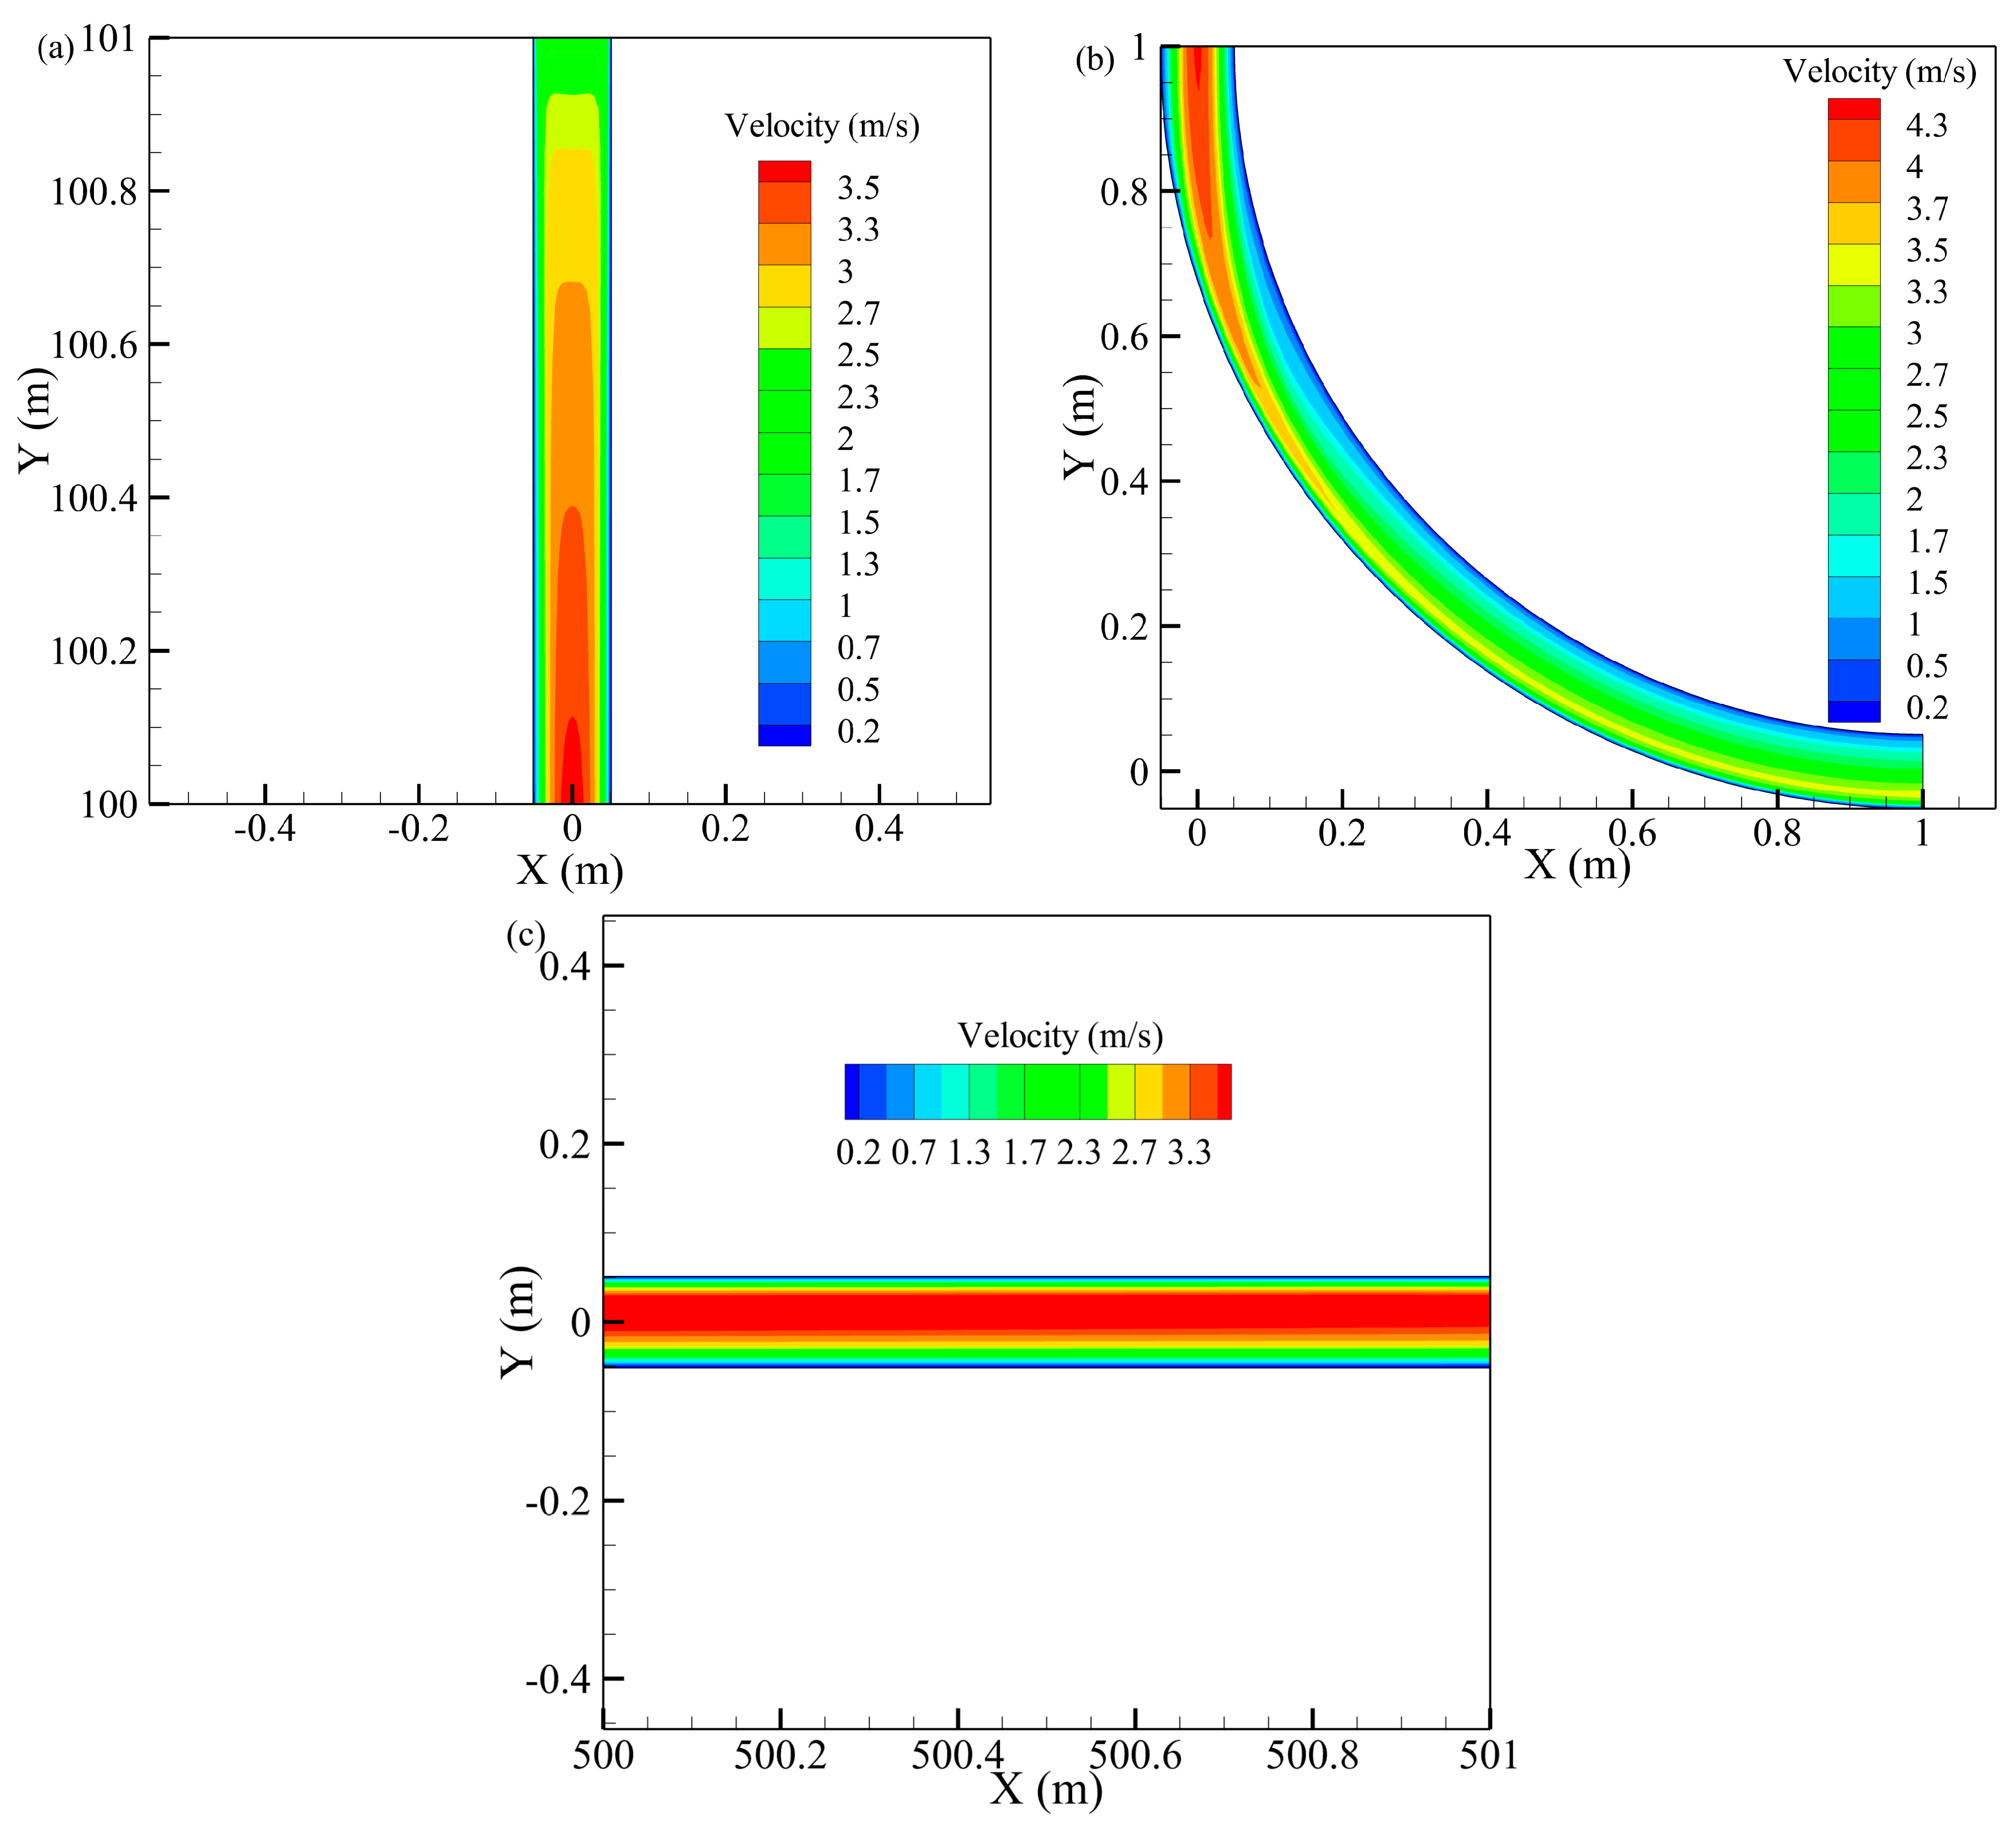
Figure 13.
Velocity contours at the elbow for a bubble volume fraction of 15 vol %: (a) the 3D total pressure contours at the elbow, (b) the inlet section (y = 1 m), (c) the elbow section (y = x), and (d) the outlet section (x = 1 m).
Figure 13.
Velocity contours at the elbow for a bubble volume fraction of 15 vol %: (a) the 3D total pressure contours at the elbow, (b) the inlet section (y = 1 m), (c) the elbow section (y = x), and (d) the outlet section (x = 1 m).


Figure 14.
Resistance and velocity results for various bubble diameters: (a) resistance and (b) velocity.
Figure 14.
Resistance and velocity results for various bubble diameters: (a) resistance and (b) velocity.

Table 1.
The rheological properties of the cement slurry and standard foam.
| Fluid Type | Yield Stress τ0 (Pa) | Plastic Viscosity μ (Pa·s) |
|---|---|---|
| Cement slurry | 68.23 | 0.41 |
| Standard foam | 15.54 | 0.08 |
Table 2.
The basic properties of the cement slurry and the standard foam.
| Fluid Type | Cement-to-Sand Ratio | Mass Fraction (wt %) | Density (kg/m3) | Bubble Volume Fraction (vol %) | Bubble Diameter (μm) | Yield Stress τ0 (Pa) | Plastic Viscosity μ (Pa·s) |
|---|---|---|---|---|---|---|---|
| Cement slurry | 1:5 | 70 | 1750 | * | * | 68.23 | 0.41 |
| Standard foam | * | * | 50 | 0–40 | 30–100 | 15.54 | 0.08 |
* Represent no corresponding parameters.
Table 3.
The value of plastic viscosity by theoretical calculation and simulation.
| Studied Case | Bubble Volume Fraction (vol %) | Plastic Viscosity μ (Pa·s) | Relative Error (%) | |
|---|---|---|---|---|
| Theoretical Calculation | Simulation | |||
| 1 | 0 | 0.4100 | 0.4116 | 0.39 |
| 2 | 5 | 0.3935 | 0.3902 | 0.19 |
| 3 | 10 | 0.3770 | 0.3690 | 0.24 |
| 4 | 15 | 0.3605 | 0.3491 | 0.17 |
| 5 | 20 | 0.3440 | 0.3287 | 0.21 |
| 6 | 25 | 0.3275 | 0.3080 | 0.14 |
| 7 | 30 | 0.3110 | 0.2878 | 0.25 |
| 8 | 35 | 0.2945 | 0.2667 | 0.05 |
| 9 | 40 | 0.2780 | 0.2462 | 0.05 |
Table 4.
The resistances in the various studied cases.
| Studied Case | Bubble Volume Fraction (vol %) | Inlet Pressure (MPa) | Outlet Pressure (MPa) | Resistance (MPa) | Average Resistance (kPa/m) | Gravitational Potential Energy (MPa) | Self-Flowing Transport |
|---|---|---|---|---|---|---|---|
| 1 | 0 | 0.0044 | -1.86 | 1.86 | 3.09 | 1.72 | No |
| 2 | 5 | 0.28 | -1.56 | 1.84 | 3.06 | 1.72 | No |
| 3 | 10 | 0.27 | -1.51 | 1.78 | 2.96 | 1.72 | No |
| 4 | 15 | 0.25 | -1.39 | 1.64 | 2.73 | 1.72 | Yes |
| 5 | 20 | 0.24 | -1.33 | 1.57 | 2.60 | 1.72 | Yes |
| 6 | 25 | 0.22 | -1.23 | 1.45 | 2.42 | 1.72 | Yes |
| 7 | 30 | 0.21 | -1.14 | 1.35 | 2.25 | 1.72 | Yes |
| 8 | 35 | 0.19 | -1.07 | 1.26 | 2.09 | 1.72 | Yes |
| 9 | 40 | 0.18 | -1.04 | 1.22 | 2.02 | 1.72 | Yes |
Table 5.
Comparison between the pressures in the pipeline and the elbow.
| Studied Case | Bubble Volume Fraction (vol %) | Elbow | Pipe | W (%) | ||
|---|---|---|---|---|---|---|
| Resistance (MPa) | Average Resistance kPa/m) | Resistance (MPa) | Average Resistance (kPa/m) | |||
| 1 | 0 | 0.0086 | 5.46 | 1.86 | 3.09 | 43.41 |
| 2 | 5 | 0.0083 | 5.30 | 1.84 | 3.06 | 42.26 |
| 3 | 10 | 0.0077 | 4.88 | 1.78 | 2.96 | 39.34 |
| 4 | 15 | 0.0074 | 4.74 | 1.64 | 2.73 | 42.41 |
| 5 | 20 | 0.0070 | 4.46 | 1.57 | 2.60 | 41.70 |
| 6 | 25 | 0.0066 | 4.19 | 1.45 | 2.42 | 42.24 |
| 7 | 30 | 0.0062 | 3.94 | 1.35 | 2.25 | 42.89 |
| 8 | 35 | 0.0056 | 3.59 | 1.26 | 2.09 | 41.78 |
| 9 | 40 | 0.0051 | 3.24 | 1.22 | 2.02 | 37.65 |
W represents the percentage of pipe average resistance in elbow average resistance.
Table 6.
The results of industrial tests.
| Goaf Number | Density (kg/m3) | Bubble Volume Fraction (vol %) | Strength (MPa) | |
|---|---|---|---|---|
| 7 days | 28 days | |||
| S01 | 1496 | 16 | 1.21 | 2.33 |
| N02 | 1402 | 19 | 1.20 | 2.17 |
| S05 | 1533 | 12 | 1.38 | 2.38 |
Table 7.
The economic indicators for conventional backfill material and three-phase foam slurry backfill (TFSB).
Table 7.
The economic indicators for conventional backfill material and three-phase foam slurry backfill (TFSB).
| Project Specifications | Conventional Cement Slurry | TFSB |
|---|---|---|
| Cement consumption (kg/m3) | 288 | 240 |
| Foam agent consumption (kg/m3) | 0 | 0.14 |
| Unit cost ($/m3) | 14.4 | 12.84 |
| Cost savings ($/m3) | 1.56 | |
© 2017 by the authors. Licensee MDPI, Basel, Switzerland. This article is an open access article distributed under the terms and conditions of the Creative Commons Attribution (CC BY) license (http://creativecommons.org/licenses/by/4.0/).
Share and Cite
MDPI and ACS Style
Chen, X.; Zhou, J.; Chen, Q.; Shi, X.; Gou, Y. CFD Simulation of Pipeline Transport Properties of Mine Tailings Three-Phase Foam Slurry Backfill. Minerals 2017, 7, 149. https://doi.org/10.3390/min7080149
AMA Style
Chen X, Zhou J, Chen Q, Shi X, Gou Y. CFD Simulation of Pipeline Transport Properties of Mine Tailings Three-Phase Foam Slurry Backfill. Minerals. 2017; 7(8):149. https://doi.org/10.3390/min7080149
Chicago/Turabian StyleChen, Xin, Jian Zhou, Qiusong Chen, Xiuzhi Shi, and Yonggang Gou. 2017. "CFD Simulation of Pipeline Transport Properties of Mine Tailings Three-Phase Foam Slurry Backfill" Minerals 7, no. 8: 149. https://doi.org/10.3390/min7080149
Note that from the first issue of 2016, this journal uses article numbers instead of page numbers. See further details here.