Article

Recycling Y and Eu from Waste Fluorescent Powder and High Temperature Solid-State Synthesis of Y2O3:Eu Phosphors

1
School of Resources and Environmental Engineering, Wuhan University of Technology, Wuhan 430070, China
2
School of Chemistry and Life Science, Hubei University of Education, Wuhan 430205, China
*
Author to whom correspondence should be addressed.
Minerals 2017, 7(3), 44; https://doi.org/10.3390/min7030044
Submission received: 11 January 2017 / Revised: 15 March 2017 / Accepted: 15 March 2017 / Published: 20 March 2017
(This article belongs to the Special Issue Mineral Resources and the Environment)

Abstract

:
Y2O3:Eu were prepared through precursors synthesized by leaching tests, removing impurities, enrichment of Y and Eu from residual purified liquors, annealing treatment, and high temperature solid-state reaction method, which is the most suitable for large-scale production. The analysis of product shows that the purity is 99.42%. The resultant powders were characterized by X-ray diffraction (XRD), differential thermal analysis (TG-DTA), scanning electron microscope (SEM), and photoluminescence (PL). Compared with the commercial phosphors, the XRD spectrum of the product samples revealed the synthesized particles to have a pure cubic Y2O3:Eu structure without any impurities in the crystalline phase. On the morphology, the Y2O3:Eu particles synthesized by a combustion and high temperature solid state process with sintering aids, were large and uniform. For luminescence property, the emission intensity of Y2O3:Eu phosphors synthesized by combustion process and high temperature solid state process with sintering aids were higher than those without sintering aids, at 1400 °C.

1. Introduction

Yttrium oxide doped with trivalent europium (Y2O3:Eu) phosphor—which have the characteristics of optics, electricity, and magnetism—are unsurpassed and non-renewable strategic resources, and have been extensively used in the field of electronic information, energy environment, petrochemical, and metallurgical machinery, especially in rare earth luminescent materials. With the popularization of fluorescent lamps, computers, mobile phones, and other related products, pollutive waste fluorescent powder is sharply increasing. According to statistics, as much as eight thousand tons of waste fluorescent powders were produced in China in 2010; additionally, according to the current market value, rare earth resources in waste fluorescent powder are estimated to be about four billion RMB in value [1]. If the waste fluorescent powders were recycled efficiently, not only could it reduce the dwindling quantity of rare earth mineral, but it can also be fused to the industrial chain of rare earth recovery, which could greatly improve the utilization of rare earth resources.
In recent years, recycling of rare earth elements from waste fluorescent phosphors has been researched by many foreign and domestic researchers. Tsuyoshi Hirajima et al. [2] used collecting agents and dispersants to separate rare earth trichromatic fluorescent phosphors by flotation method. Hirajima et al. [3] used diazomethane as the layered medium and sodium oleate as a surfactant to recycle rare earth fluorescent phosphors by centrifugal separation method. Akira Otsuki et al. [4] adopted two-step liquid–liquid extraction methods to separate red, green, and blue rare earth fluorescent phosphors. Youming Yang et al. [5] used hydrochloric acid and hydrogen peroxide to leach red powders, and adopted the sodium carbonate roasting method to leach green and blue phosphors. Guangjun Mei et al. [6] recovered Y2O3 from waste fluorescent powders by the process of leaching, precipitation, and roasting. Hongmin Cui et al. [7] utilized Aliquat 336 functionalized chelating adsorbent derived from chitosan to enrich and separate Y(III) from diluted solutions. However, rare earth elements are not effectively retrieved by these methods. The above methods are used with mixing power which has pure red, green, and blue phosphors, but waste fluorescent powder in China is obtained by the crushing method.
For the synthesis of Y2O3:Eu nanoparticles, several processes such as the gas-phase condensation technique, sol–gel route, polyol method, spray pyrolysis, and the hydrothermal method were studied by researchers [8]. Jitao Chen et al. [9] reported the self-assembled Y2O3:Eu3+ 3D architectures synthesized by a simple hydrothermal process, followed by calcination treatment. They found that some of the nano lamellas wrinkled into the petals of flowerlike architectures, which may be potentially applied in optoelectronics due to their strong red emission. Guowei Chen et al. [10] synthesized Y2O3:Eu phosphor powder via a facile Pechini sol–gel method using pluronic F127 as a template agent. Under the excitation of 245 nm UV radiation, the mesoporous Y2O3:Eu particles show stronger PL intensity than that of particles without special structure, due to the advantage of surface area and pores. Arunkumar Paulraj et al. [11] compared the hydrothermal method with the combustion method and solid-state metathesis reaction.
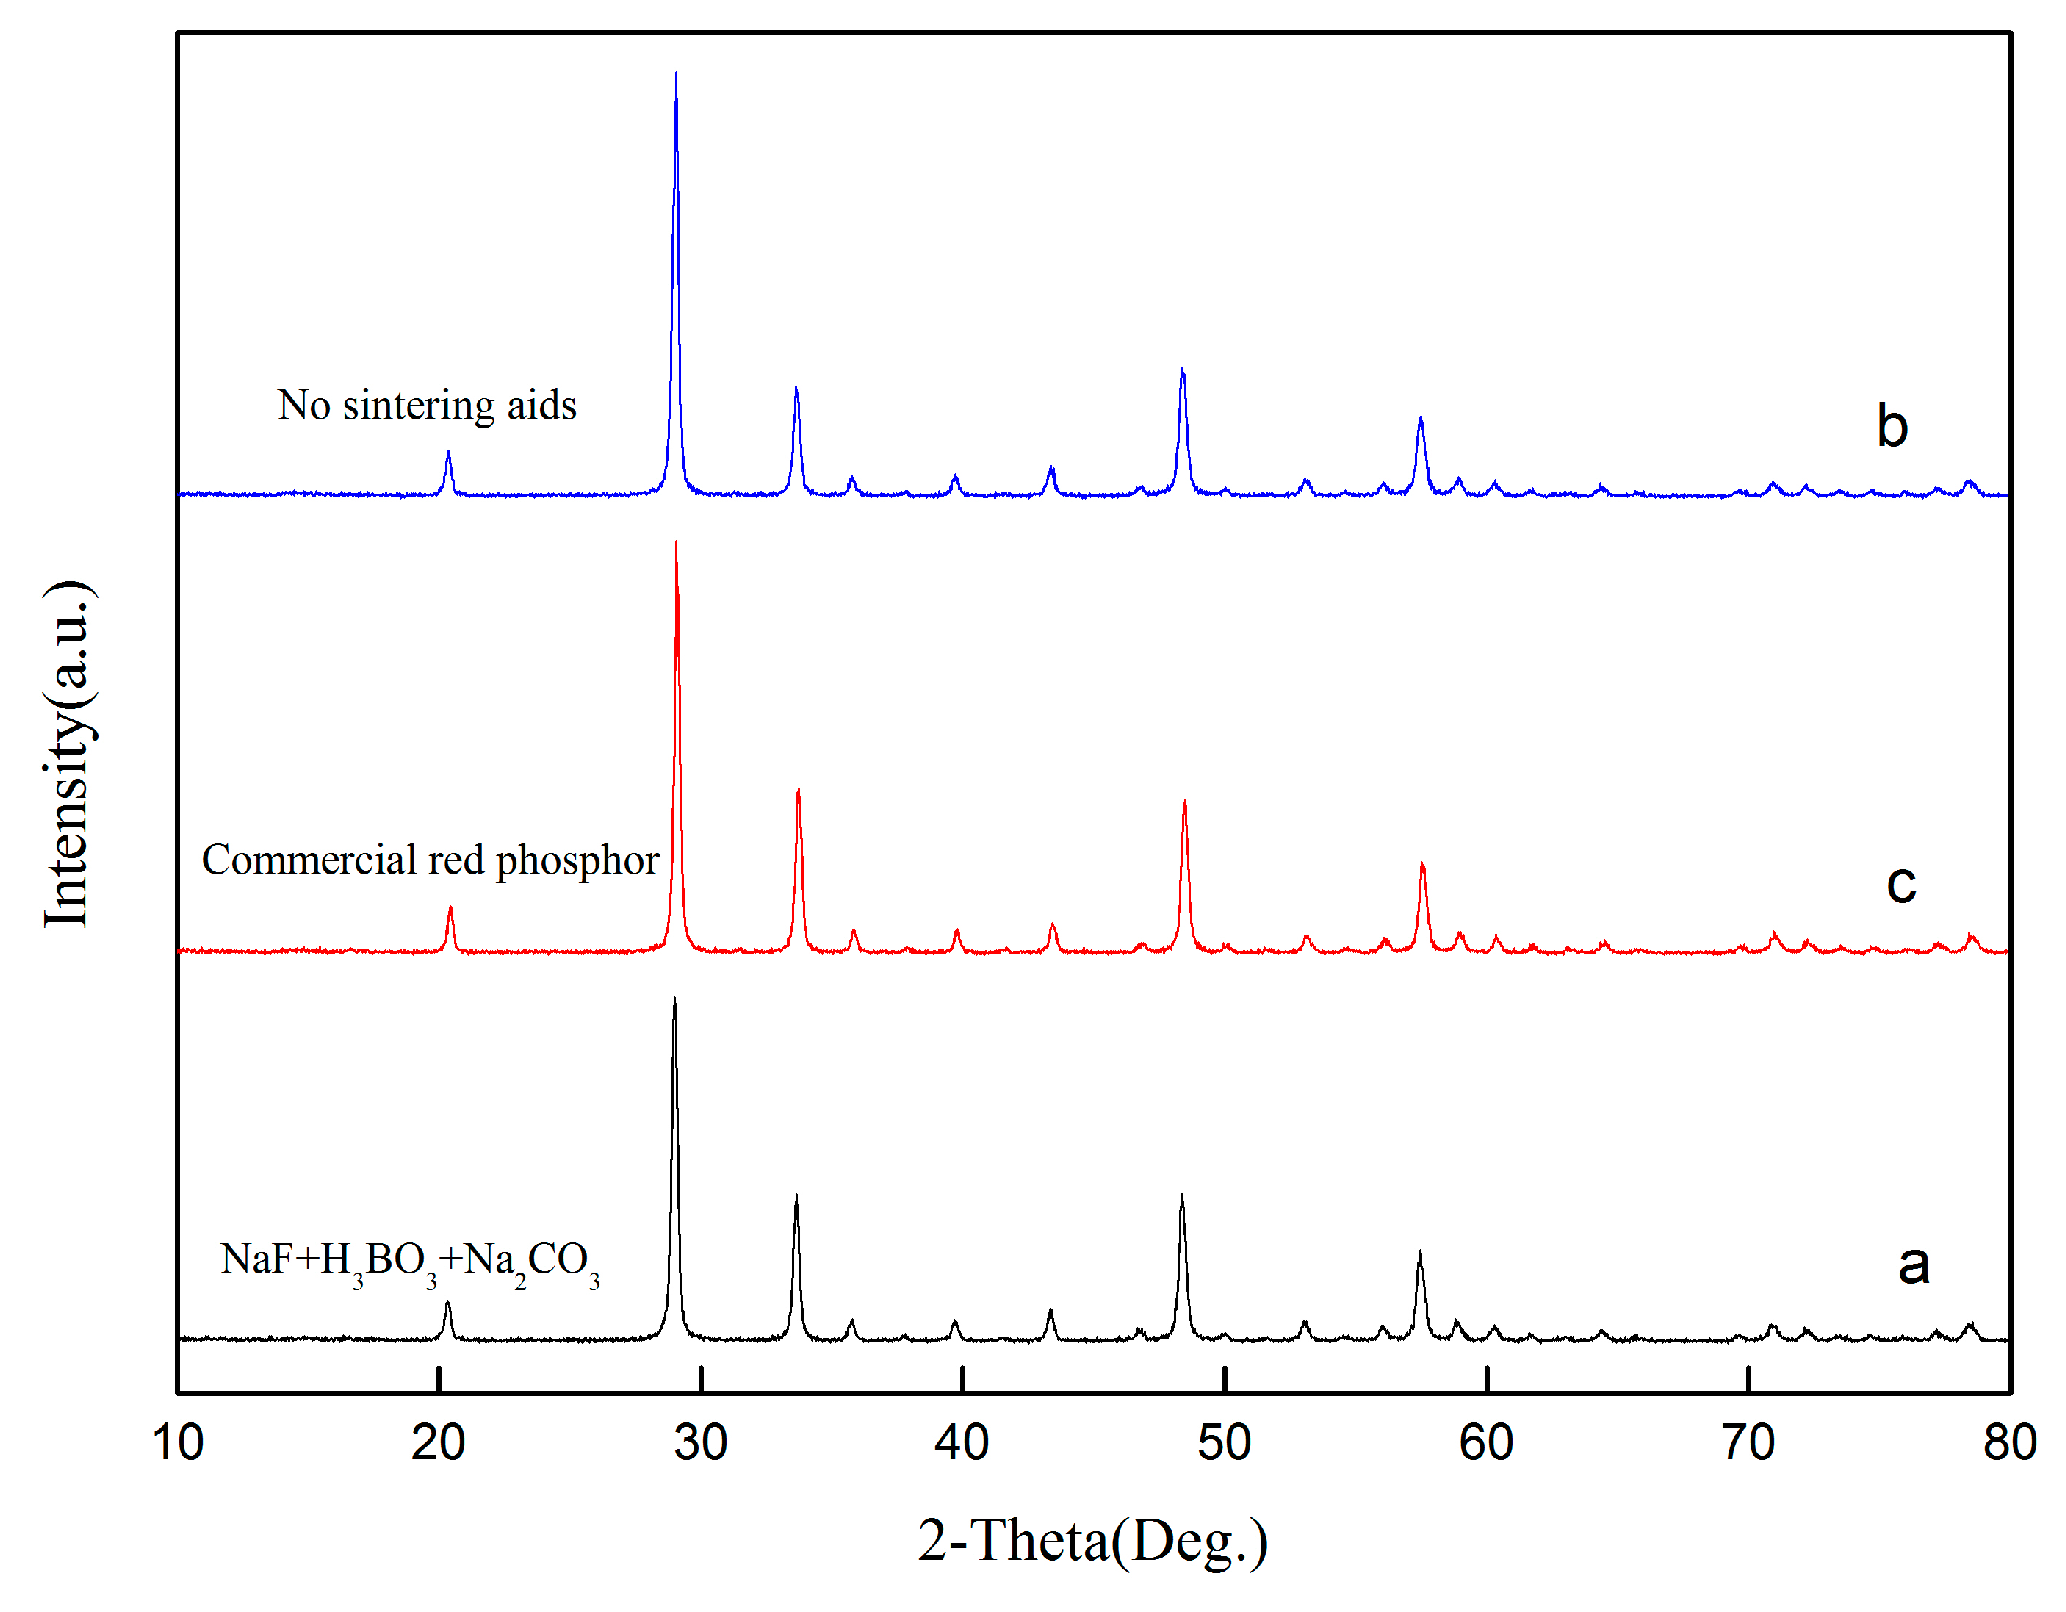
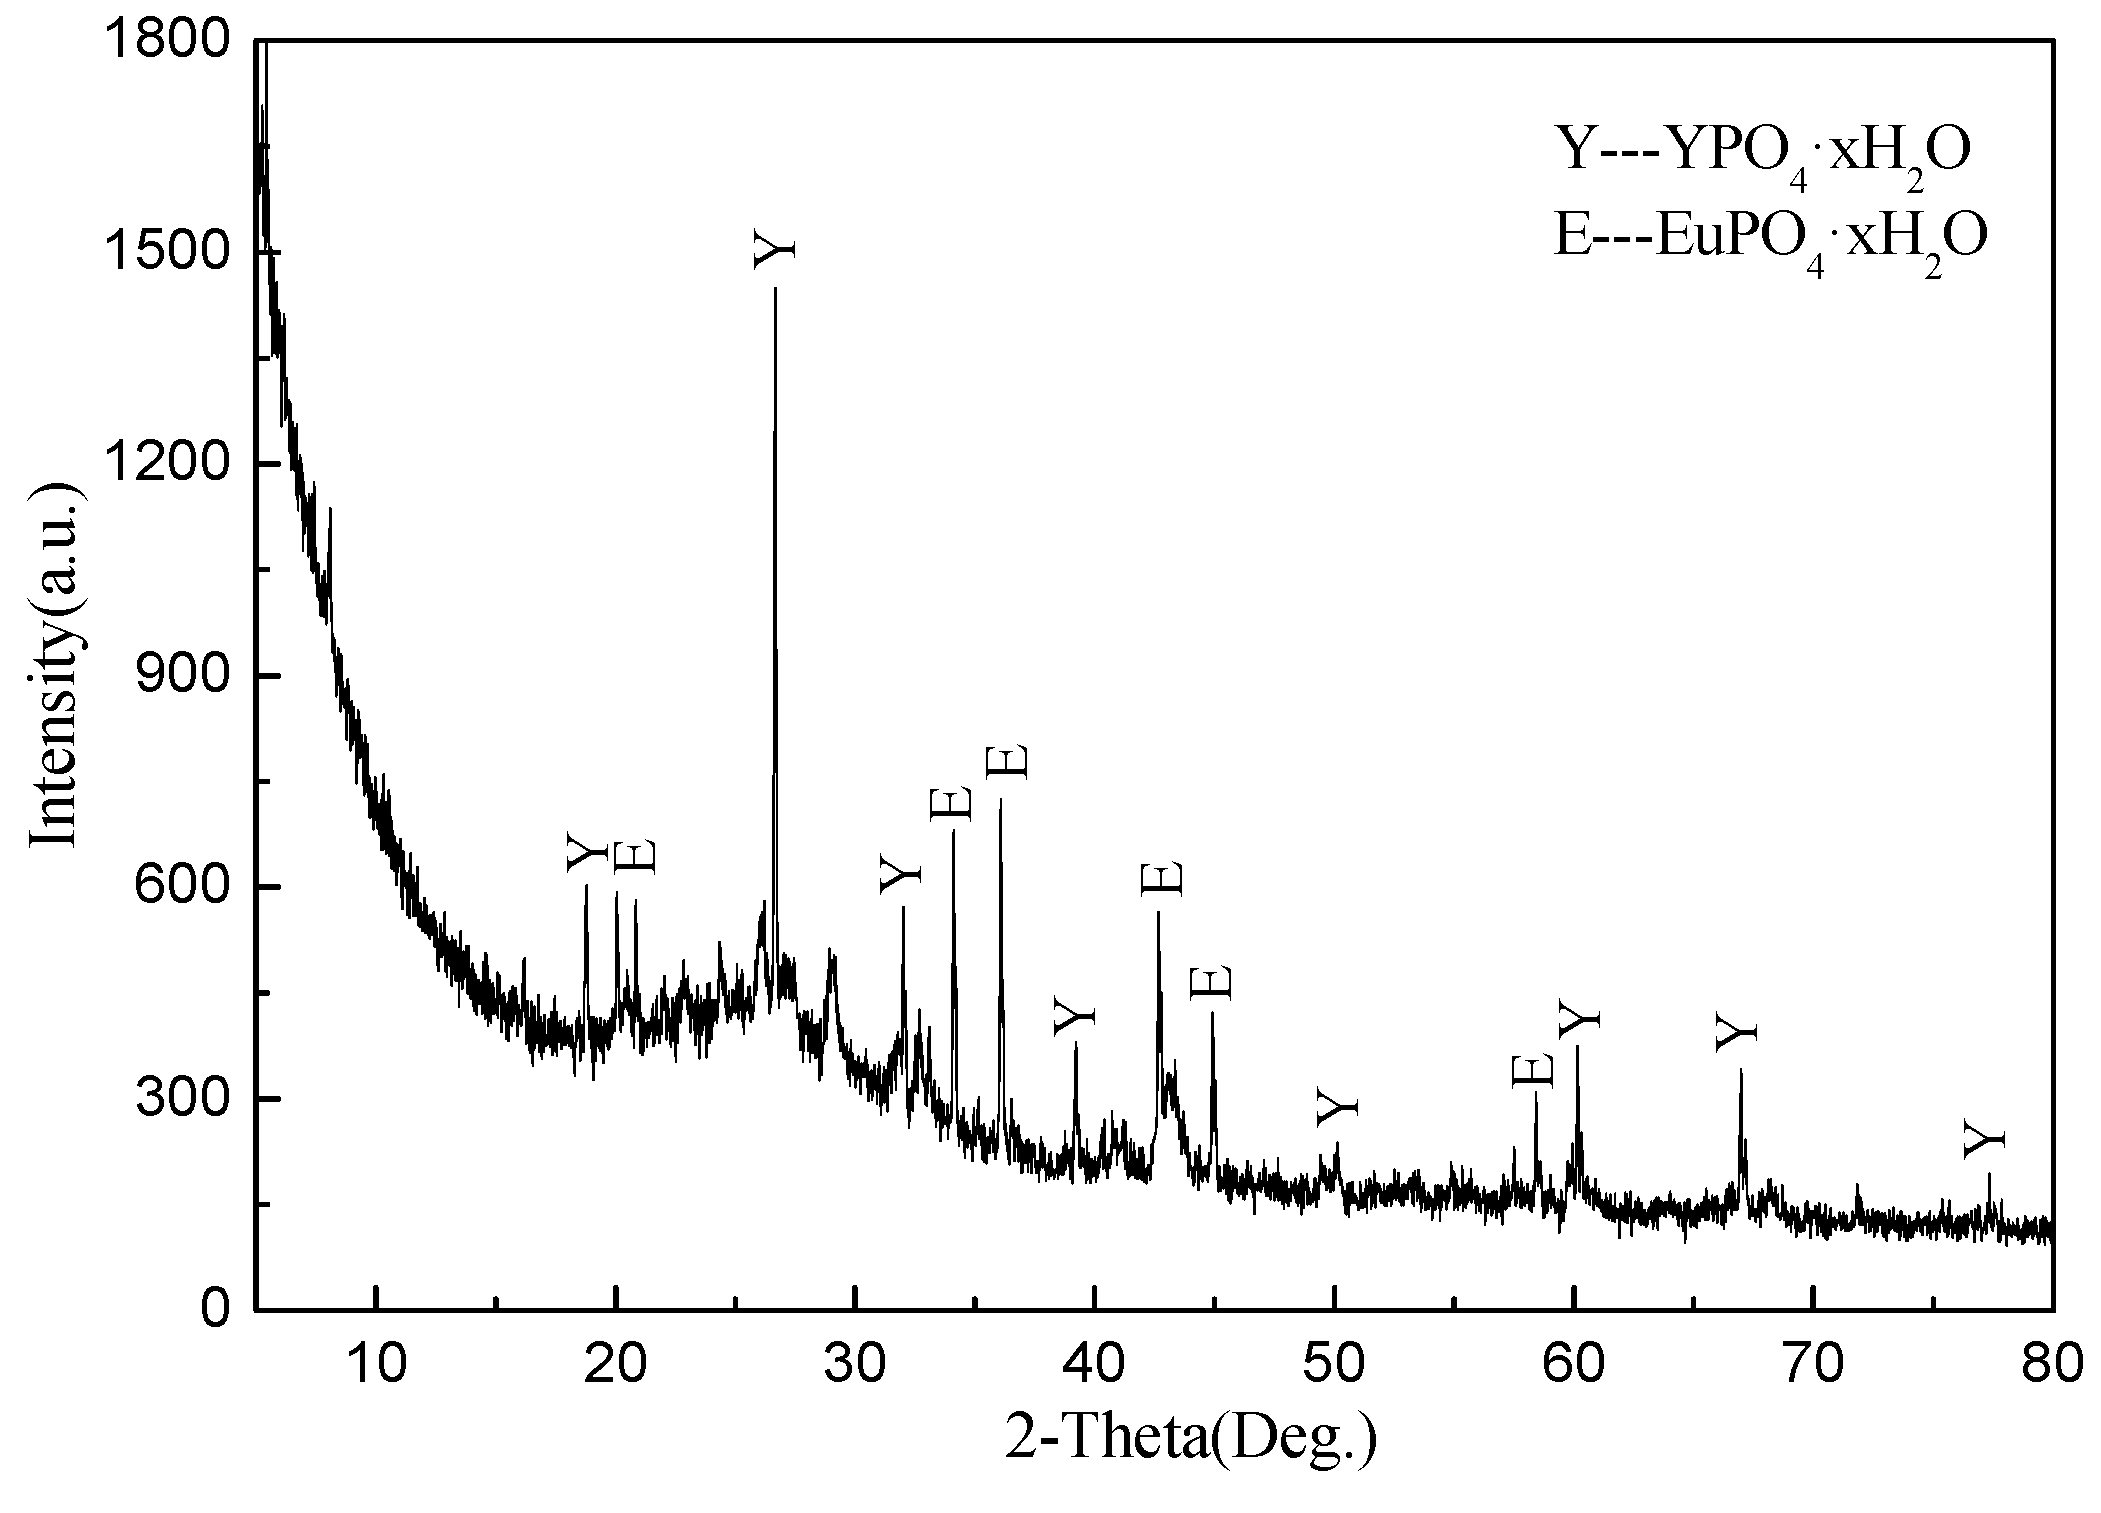
In this paper, recycling and synthesis of high-purity rare earth oxides (Y2O3:Eu) from waste fluorescent powder were studied. Compared to previous work, the innovation of this work is that the purification step was added to the process, with ammonia, sodium sulfide, and Sodium diethyldithiocarbamate trihydrate (DDTC), before precipitation with oxalic acid, which will reduce the amount of oxalic acid. After annealing of the precursor at 1400 °C, we obtained the materials of Y2O3:Eu, which have excellent luminescent properties. The products were characterized by X-ray diffraction (XRD), scanning electron microscope (SEM), and fluorescence spectrometer.

2. Experiment Procedure

2.1. Materials

The waste fluorescent powder was provided by a Chinese company which recycles and reprocesses these types of wastes. All the reagents used in the present study were analytical-grade materials. Hydrochloric acid and hydrogen peroxide (30%) were used as leaching reagents. Ammonia was used to adjust pH of the leach liquors, and sodium sulfide and DDTC were used to remove heavy metals such as Al, Fe, Pb, Zn, and Cu. Oxalic acid was used to precipitate the precursor. For the synthesis of Y2O3:Eu nanoparticles, different proportions of NaF, boric acid, and sodium carbonate were doped with the precursor.

2.2. Procedure

2.2.1. Leaching Tests

Leaching tests were performed with hydrochloric acid and hydrogen peroxide. Different leaching tests of reaction conditions on the hydrochloric acid concentrations (1.0 mol/L, 2.0 mol/L, 3.0 mol/L, 4.0 mol/L, 5.0 mol/L), the amount of hydrogen peroxide (0.0 mL/g, 0.1 mL/g, 0.2 mL/g, 0.3 mL/g, 0.4 mL/g), the leaching temperature (25 °C, 40 °C, 60 °C, 75 °C, 90 °C) and the leaching time (1 h, 2 h, 3 h, 4 h, 5 h) were compared, and the optimum condition is determined as: 4.0 mol/L of hydrochloric acid, 0.2 mL/g of hydrogen peroxide, 7.5 mL/g liquid–solid ratio, 60 °C, and 4 h of reaction.

2.2.2. Impurity Removals

Impurity removals were carried out by using ammonia (1:1), sodium sulfide (0.5 mol/L solution), and DDTC. These experiments were operated to precipitate the majority of impurities dissolved, especially heavy metals. After adding ammonia into the leaching solutions and adjusting pH at the range of 2–6, sodium sulfide was added to remove heavy metals such as Al, Fe, Pb, and Zn.

2.2.3. Rare Earth Element (REE) Enrichment

Rare earth elements were precipitated with oxalic acid (100 g/L), and more oxalic acid was used to react with other residual elements.

2.2.4. Annealing Process

The oxalates were annealed at the suitable temperature, and the characteristics of the rare earth oxide were analyzed with XRD, differential thermal analysis (TG-DTA), and SEM.

2.2.5. High Temperature Solid-State

Different proportions of sintering aids (NaF, boric acid, and sodium carbonate) were doped into the precursor, then placed in an agate mortar and grounded to a certain particle size. After that, the mixed powder was calcined at 1400 °C for 5 h in a vacuum. Lastly, the product was chartered with XRD, SEM, and Fluorescence Spectrometer.

3. Results and Discussion

3.1. Leaching Tests

The component analysis of waste fluorescent powder is listed in Table 1. Table 1 shows that SiO2 and Al2O3 are found to be the predominant impurities (23.25% of SiO2, 22.79% of Al2O3); the proportion of rare earth oxides (Y2O3, Eu2O3, CeO2, Tb4O7) reached 25.1%; and they have high recycling value. In order to improve the leaching rate of Y and Eu, the effect of HCl concentration, the addition of hydrogen peroxide, the leaching temperature, and time have been discussed, and the results are shown in Figure 1, Figure 2, Figure 3 and Figure 4, respectively.
The HCl concentration plays an important role in the leaching test. It is clearly shown from Figure 1 that by increasing the concentration of hydrochloric acid, the leaching rate of Y and Eu greatly improved. During the leaching test, the HCl in the solid–liquid interface was first to be consumed, resulting in a great increase of the concentration gradient of hydrochloric acid in the solution, and speeding up the rate of diffusion of hydrochloric acid to solid interface. When the concentration of HCl was 4 mol/L, the leaching rate of Y and Eu reached 99.48% and 88.02%, respectively, so there was no need to increase the concentration of HCl continuously. Figure 2 shows that adding hydrogen peroxide into the solution has a great influence on the leaching rate of rare earth, especially Eu. Hydrogen peroxide can improve the activation energy of the reaction in the solution and accelerate the solid–liquid chemical reaction rate. The leaching rate of Y and Eu achieved 99.48% and 88.02%, respectively, at the hydrogen peroxide amount of 0.2 mL/g. At higher concentrations of hydrogen peroxide, the leaching solution generated a dense oxide film on the surface of the reactants, hindering the reaction; thus, the amount of hydrogen peroxide was ultimately determined to be 0.2 mL/g.
To obtain the best leaching rate of Y and Eu, it is very important to find a suitable leaching temperature and leaching time. As shown in Figure 3, raising the reaction temperature can promote hydrochloric acid to diffuse and penetrate to the phosphor lattice, and accelerate the solid–liquid chemical reaction rate. Simultaneously, while increasing the leaching temperature, the thermal motion of molecules in solution speeded up. It resulted in a corresponding reduction in solution viscosity and reduced the diffusion resistance of soluble substances. The optimal leaching temperature was kept at 60 °C. Figure 4 presents that when the leaching time was 1 h, the leaching rate of Y and Eu were only 60.52% and 23.11%, respectively, due to the leaching solution not having enough time to diffuse to the inside of REE particles. The HCl solution reacted with phosphor completely under the condition of 4 h leaching time.
The waste fluorescent phosphors were leached in the optimum condition (4.0 mol/L of hydrochloric acid, 0.2 mL/g of hydrogen peroxide, 7.5 mL/g liquid–solid ratio, 60 °C, and 4 h of reaction). Table 2 lists the dissolved yields of the elements by leaching 20 g waste fluorescent phosphors. It is clearly shown that the selected leaching conditions are very efficient in dissolving red phosphors, and that the leaching rates of Y and Eu were 99.54% and 88.61%, respectively, but the green and blue phosphors were hardly dissolved. There were also some heavy metals that needed to be removed. The following reaction may have occurred in the leaching process:
Y2O3:Eu + 6H+ → 2Y3+ + Eu3+ + 3H2O
Ca10 (PO4)6(F,Cl):Sb,Mn + 42H+ → 10Ca2+ + Sb3+ + Mn2+ + 6PO43− + F + 21H2O
Al2O3 + 6H+ → Al3+ + 3H2O
Fe2O3 + 6H+ → Fe3+ + 3H2O
PbO + 2H+ → Pb2+ + H2O

3.2. Purification of Leaching Solutions

The purification process can be separated into two steps: adjustment of the leach solutions with ammonia to remove aluminums and iron, and purification of heavy metals with sodium sulfide and DDTC.

3.2.1. Impurities Removal with Ammonia

It is found that the leachate contains a lot of impurities (Al, Fe, Pb, Zn, etc.), and that the neutralization method can be used to react with Al3+ and Fe3+. Figure 5 shows that Al3+ and Fe3+, which started to hydrolyze when the pH was 3.08 and 1.62, respectively, can be removed effectively by adjusting the pH of leaching solution. The Al(OH)3 and Fe(OH)3 generated were stable and not easy to dissolve because of their large solubility product constant; however, the pH cannot be too high, otherwise it may contribute to the loss of rare earth metals.
Figure 6 reports the relationship between pH and the yields of impurities and rare earth metals. With the adjustment of pH, Al3+ and Fe3+ were precipitated to some degree, and there existed the loss of rare earth elements (≥30%) at all conditions in these experiments. When pH was adjusted to 5.0, the impurities had been removed completely and the loss of rare earth metals was minimized. With the pH reaching 6.0, the rare earth elements almost completely precipitated.

3.2.2. Purification of Heavy Metals with Sodium Sulfide and DDTC

Although the neutralization method had precipitated Al3+ and Fe3+, there was still a mass of heavy metal elements that needed to be removed in the leaching solutions. Figure 7 shows that Cu2+, Pb2+, and Zn2+ could be precipitated with sodium sulfide. We can conclude that the final pH of the leaching solution could be controlled to 5.0, and that the addition of ammonia and sodium sulfide should be added in an appropriate proportion. After pH adjustment, sodium sulfide was directly added into the solutions to control pH up to 5.0.
DDTC is an excellent collector for heavy metal ions. The sulfur atom in the active group N-CS2 can capture the heavy metal ions from the solution to generate water-insoluble salt precipitates, which is called DDTC. The generated DDTC has a strong flocculating effect. Thus, in the case of low concentration of heavy metal ions in the solution, adding appropriate amounts of DDTC into the sulfide precipitation should be taken into consideration.
Table 3 reports that Cu2+, Pb2+, Zn2+, and Sb2+ reacted at a large extent. The best way to remove impurities was adjusting pH to 4.0 with ammonia, and adding sodium sulfide and DDTC to control pH up to 5.0.
Due to the loss of rare earth, the dark solid precipitates were analyzed with XRF and XRD. Table 4 and Figure 8 show that rare earth element loss existed in the process of removing impurities. The rare earth precipitation during impurities removal may be attributed to two aspects. One reason is that the precipitation of impurities can also entrap Y3+ and Eu3+, and bring them down when they pass. The other reason may be that the rare earth ions can react with phosphate in the case of low pH, and these precipitations have strong adsorptions with metal ions; this result also explains why that in the condition of pH adjustment with ammonia, there existed 30% loss of rare earth all of the way.
RE3+ + PO43− → REPO4

3.3. Recycling of Rare Earths with Oxalic Acid

The residual colorless liquid was then used to carry out the rare earth elements of Y and Eu with oxalic acid. As RE3+ and Ca2+ can generate oxalates, residuary Mg2+ and Al3+ can generate complexes with oxalic acid in the residual solutions. Hence, the amount of oxalic acid could be divided into three parts: one part used to precipitate rare earth and calcium; one part to maintain the rare earth ions precipitate completely; and the remaining oxalic acid should react with impurities [12].
2Y3+ + 3H2C2O4·Y2 → Y2 (C2O4)3 + 6H+
2Eu3+ + 3H2C2O4 → Eu2 (C2O4)3 + 6H+
Ca2+ + H2C2O4 → CaC2O4 + 2H+
Oxalic acid (100 g/L) was added to the residual solutions, and the temperature of the solutions were kept at 60 °C for 0.5 h. The precipitations were then separated, thoroughly washed with deionized water, dried, and used for annealing studies.
Rare earth oxalates Y2(C2O4)3 and Eu2(C2O4)3 would decompose under high temperature conditions. Figure 9 shows the TG-DSC curves of rare earth oxalates in air atmosphere. The thermal decomposition of these materials may be as depicted below [13]: dehydration, decomposed into rare earth carbonate, decomposed into rare earth oxides, and crystal transition ordering. DSC curve reports that there are four absorption peaks from 130 °C to 750 °C. Table 5 reports the weight loss of rare earth oxalates at different temperatures, and it can be found that the weight loss of the four stages are 13.73%, 7.84%, 29.97%, and 5.87%. When the temperature was up to 800 °C, the weight is no longer reduced from the TG curve. Therefore, the final annealing temperature is set at 850 °C.
According to the result of Figure 9, the rare earth oxalates were annealed at 850 °C for 2 h, and turned into rare earth oxides Y2O3 and Eu2O3. Table 6 shows the chemical composition of rare earth products. It is clear from the data that Y2O3 and Eu2O3 account for 99.42%, and the impurities take up 0.58%. Compared with waste fluorescent powder, the purity of rare earth had been improved greatly.
The synthesized precursor material was annealed at 800 °C for 3 h; its powder XRD pattern is depicted in Figure 10. The diffraction pattern clearly shows that the main diffraction peaks of the product correspond well to the body centered cubic structure of Y2O3. As the peak type of the product is sharp and its half height is small, it can be deduced that the crystalline grain of product is uniform and the crystallinity is well.
The morphologies of precursor samples were investigated by SEM images. It is shown from Figure 11 that the precursor is composed of lamellar crystals which were densely packed and irregular.

3.4. High Temperature Solid-State

Currently, solid phase method is commonly used in the industry to synthesize Y2O3:Eu because of its simple operation. Phosphors synthesized with the solid phase method (reaction, process, synthesis) have high brightness and stable performance, and can be easily extended in the industry. Thus, in this study, the solid phase method was used to synthesize Y2O3:Eu. This nano crystalline precursor was processed further by annealing at 1400 °C with or without sintering aids to yield phosphor material with varying crystallite sizes and morphologies. In the present work, we used NaF, boric acid, and sodium carbonate as the sintering aids in different proportions. After annealing at high temperature, the sintering aids were removed by washing with hot water repeatedly, and the powder XRD patterns of the materials were recorded [9]. The selected XRD patterns of the processed materials are depicted in Figure 12. From Figure 12, we can see that all of the XRD peaks could be indexed to the cubic phase of Y2O3 (No. 41-1105). Samples (a), (b), and (c) show sharp diffraction peaks due to good crystallinity after calcination at 1400 °C for 5 h. The peaks of sample (a)—in which the sintering aids are smoother, sharper, and where no additional peaks of other phases were observed after calcinations—indicate that the precursor has decomposed into Y2O3 completely and the Eu3+ has been effectively doped into the host lattice [9]. It is clear that the crystallinity of the product increased when the sintering aids were added.
The well-known Debye–Scherrer’s equation as follows was used to calculate the crystallite sizes of the material.
D = K λ / β cos θ
where D is the crystallite size, K is the dimensionless shape factor (0.9), λ is the X-ray wavelength, β is the FWHM, and θ is the Bragg’s angle [11]. The crystallite size of these materials was calculated using Scherer’s formula, and the values are tabulated in Table 7. It can be seen that the crystallite size of these samples, which were annealed at 1400 °C, increases when compared with the precursor. From Table 7 we can also see that the material obtained by annealing at 1400 °C in the presence of sintering aids had given the material 90% of photoluminescence (PL) intensity.
The morphologies of the samples after calcinations at 1400 °C with and without sintering aids were characterized by SEM. The SEM images of Y2O3:Eu obtained at 1400 °C and 1400 °C with sintering aids are shown in Figure 13. It is found that the material presented ellipsoid morphology with a particle size of 0.89–5.26 μm after annealing at 1400 °C with the sintering aids, and its surface is smoother; while those samples which were annealed at 1400 °C without sintering aids showed irregular shape with the particle size of 4.65–8.93 μm. Devaraju et al. [14] prepared nanorod and spherical shaped Y2O3:Eu particles by the solvothermal method, and observed that material with spherical morphology has higher PL efficiency than the rod-shaped one. Thus, it can be concluded that the samples which were annealed at 1400 °C with sintering aids had higher PL efficiency because of their ellipsoid morphology.
Apart from these, photoluminescence properties were also investigated in this study. The PL spectrum of the Y2O3:Eu material sintered at 1400 °C with sintering aids, along with the material sintered at 1400 °C without sintering aids, which were excited at a wavelength of 254 nm, is presented in Figure 14. Figure 14 depicts that all of the samples that exhibited emission at 610 nm corresponded to red emission, due to 5D07F2 transition [15,16,17]. The emission bands around 591 nm could be ascribed to the 5D07F1 magnetic dipole transitions, while the weak peak at 633 nm and 711 nm are related to the transition from 5D0 to 7F3 and from 5D0 to 7F4, respectively [18]. Figure 14 also reveals that the intensity of the materials annealed at 1400 °C with sintering aids was higher than that of the materials annealed at 1400 °C without sintering aids. The emission luminance of Y2O3:Eu particles synthesized by high temperature solid state with sintering aids reached 90.12%, compared to the commercial phosphor. It can be seen that the PL intensity of nano-sized phosphor with sphere shape is obviously higher than the phosphor with irregular shape.

4. Conclusions

In conclusion, this research describes the recycling and synthesis of Y2O3:Eu from waste fluorescent lamps. The process includes leaching tests; impurities removal from leaching solution using ammonia, sodium sulfide, and DDTC; precipitations of rare earth using oxalic acid; and synthesis of Y2O
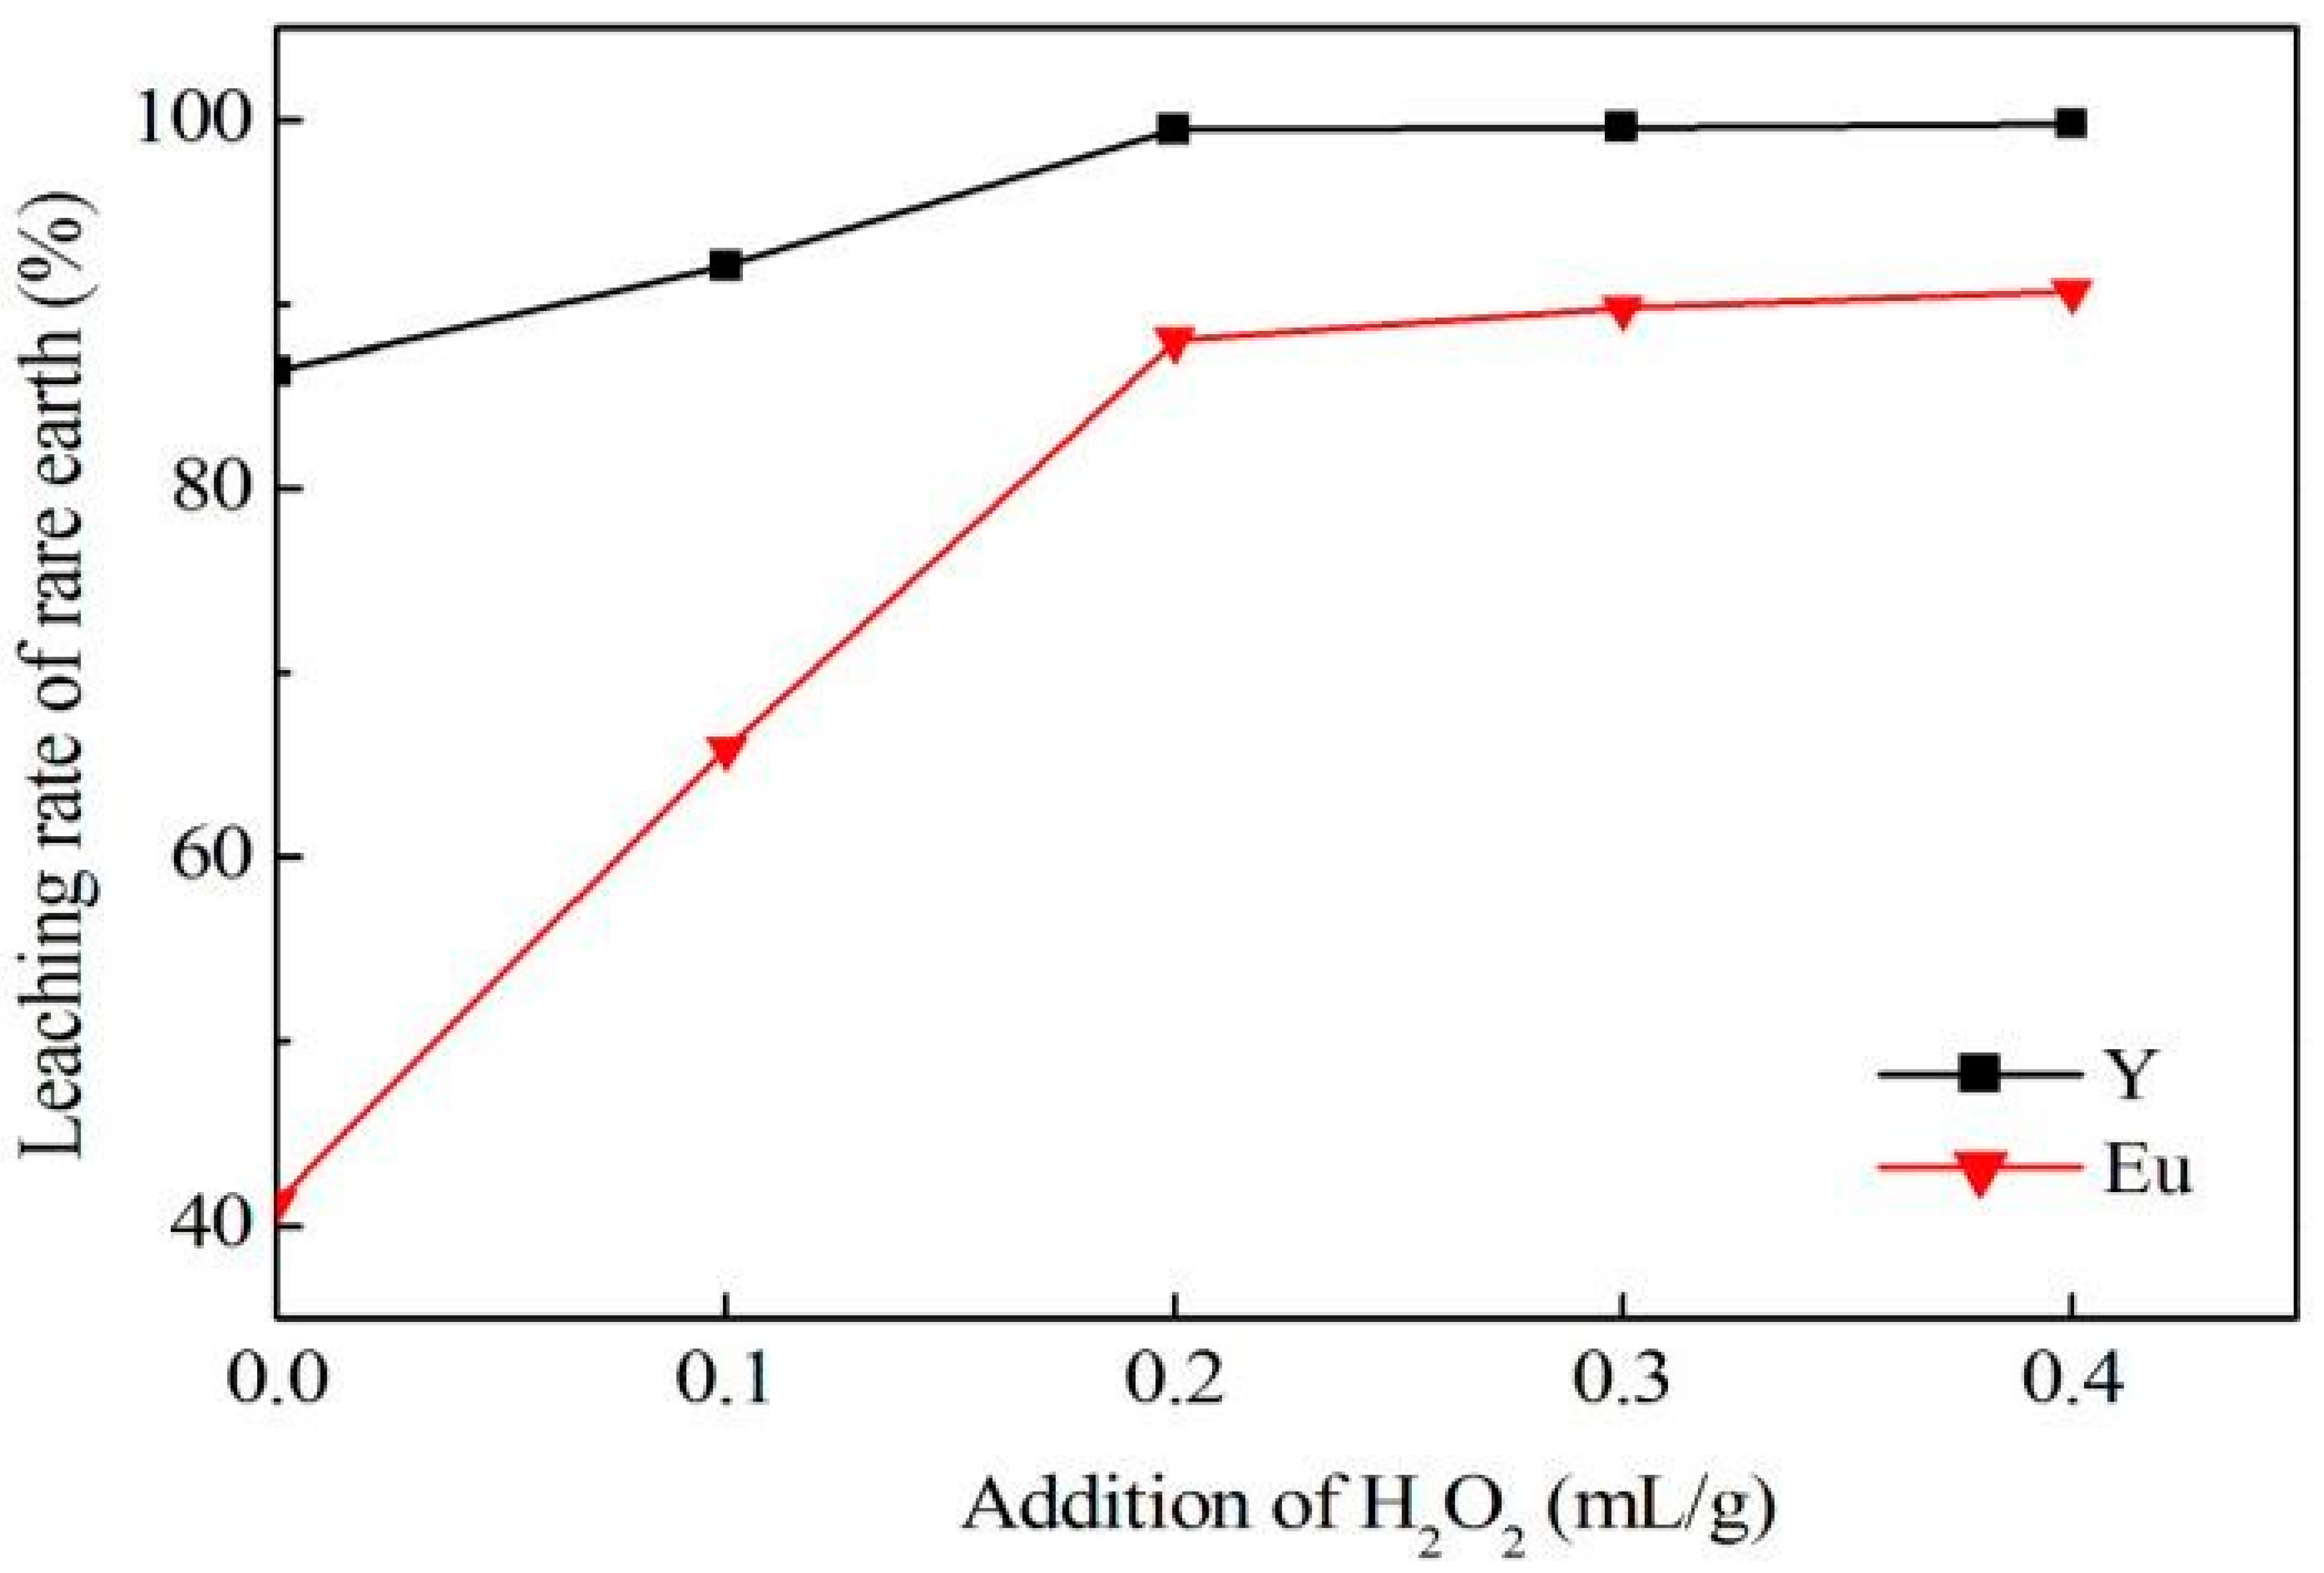
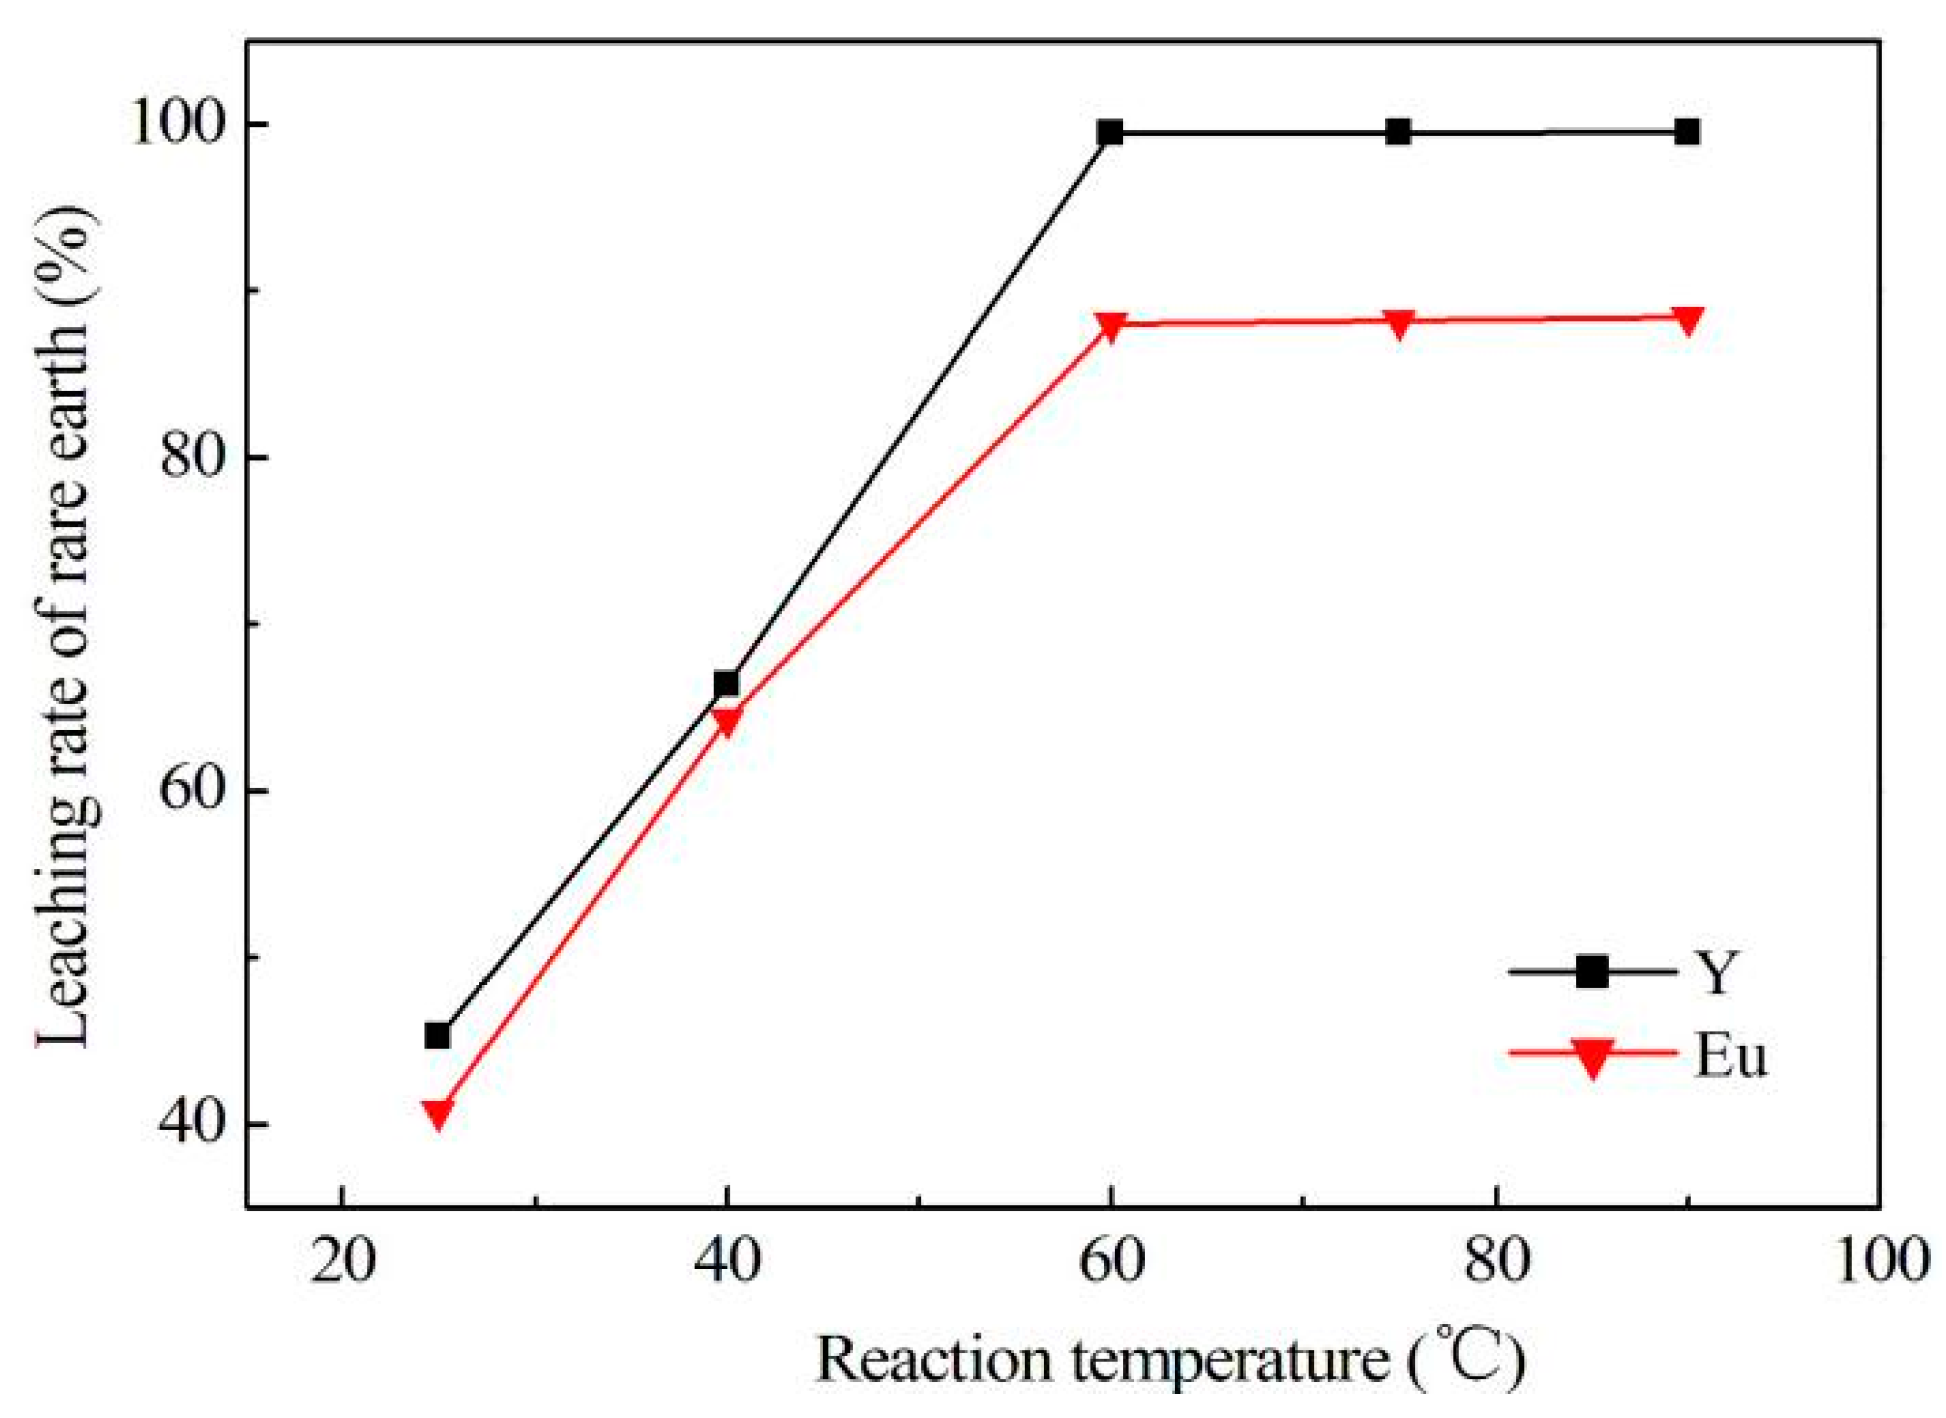
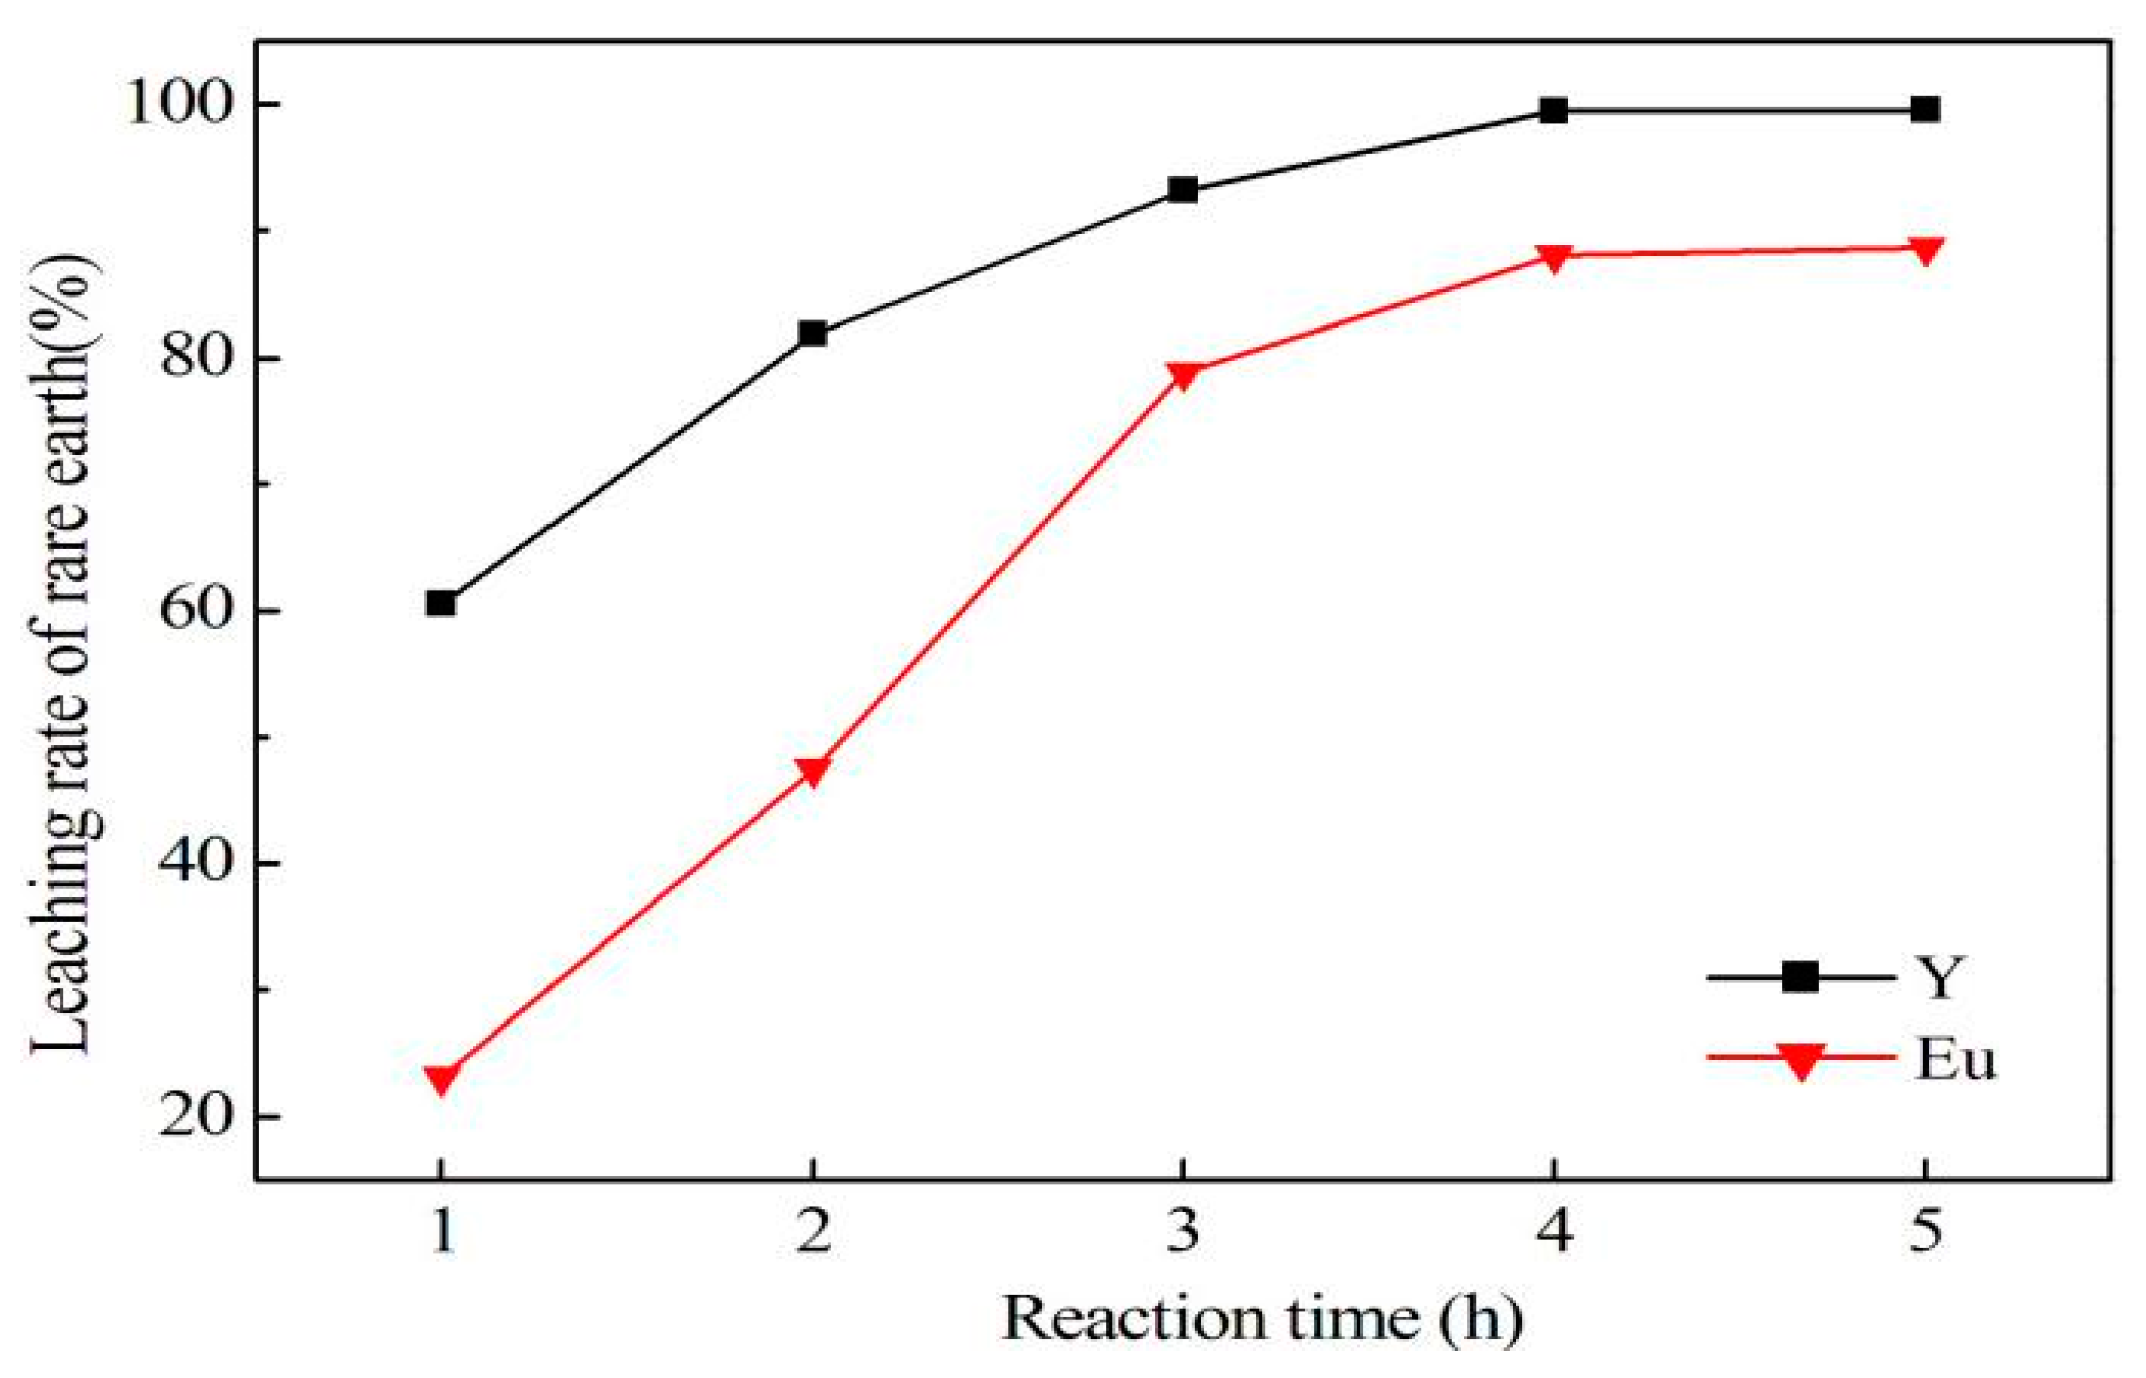
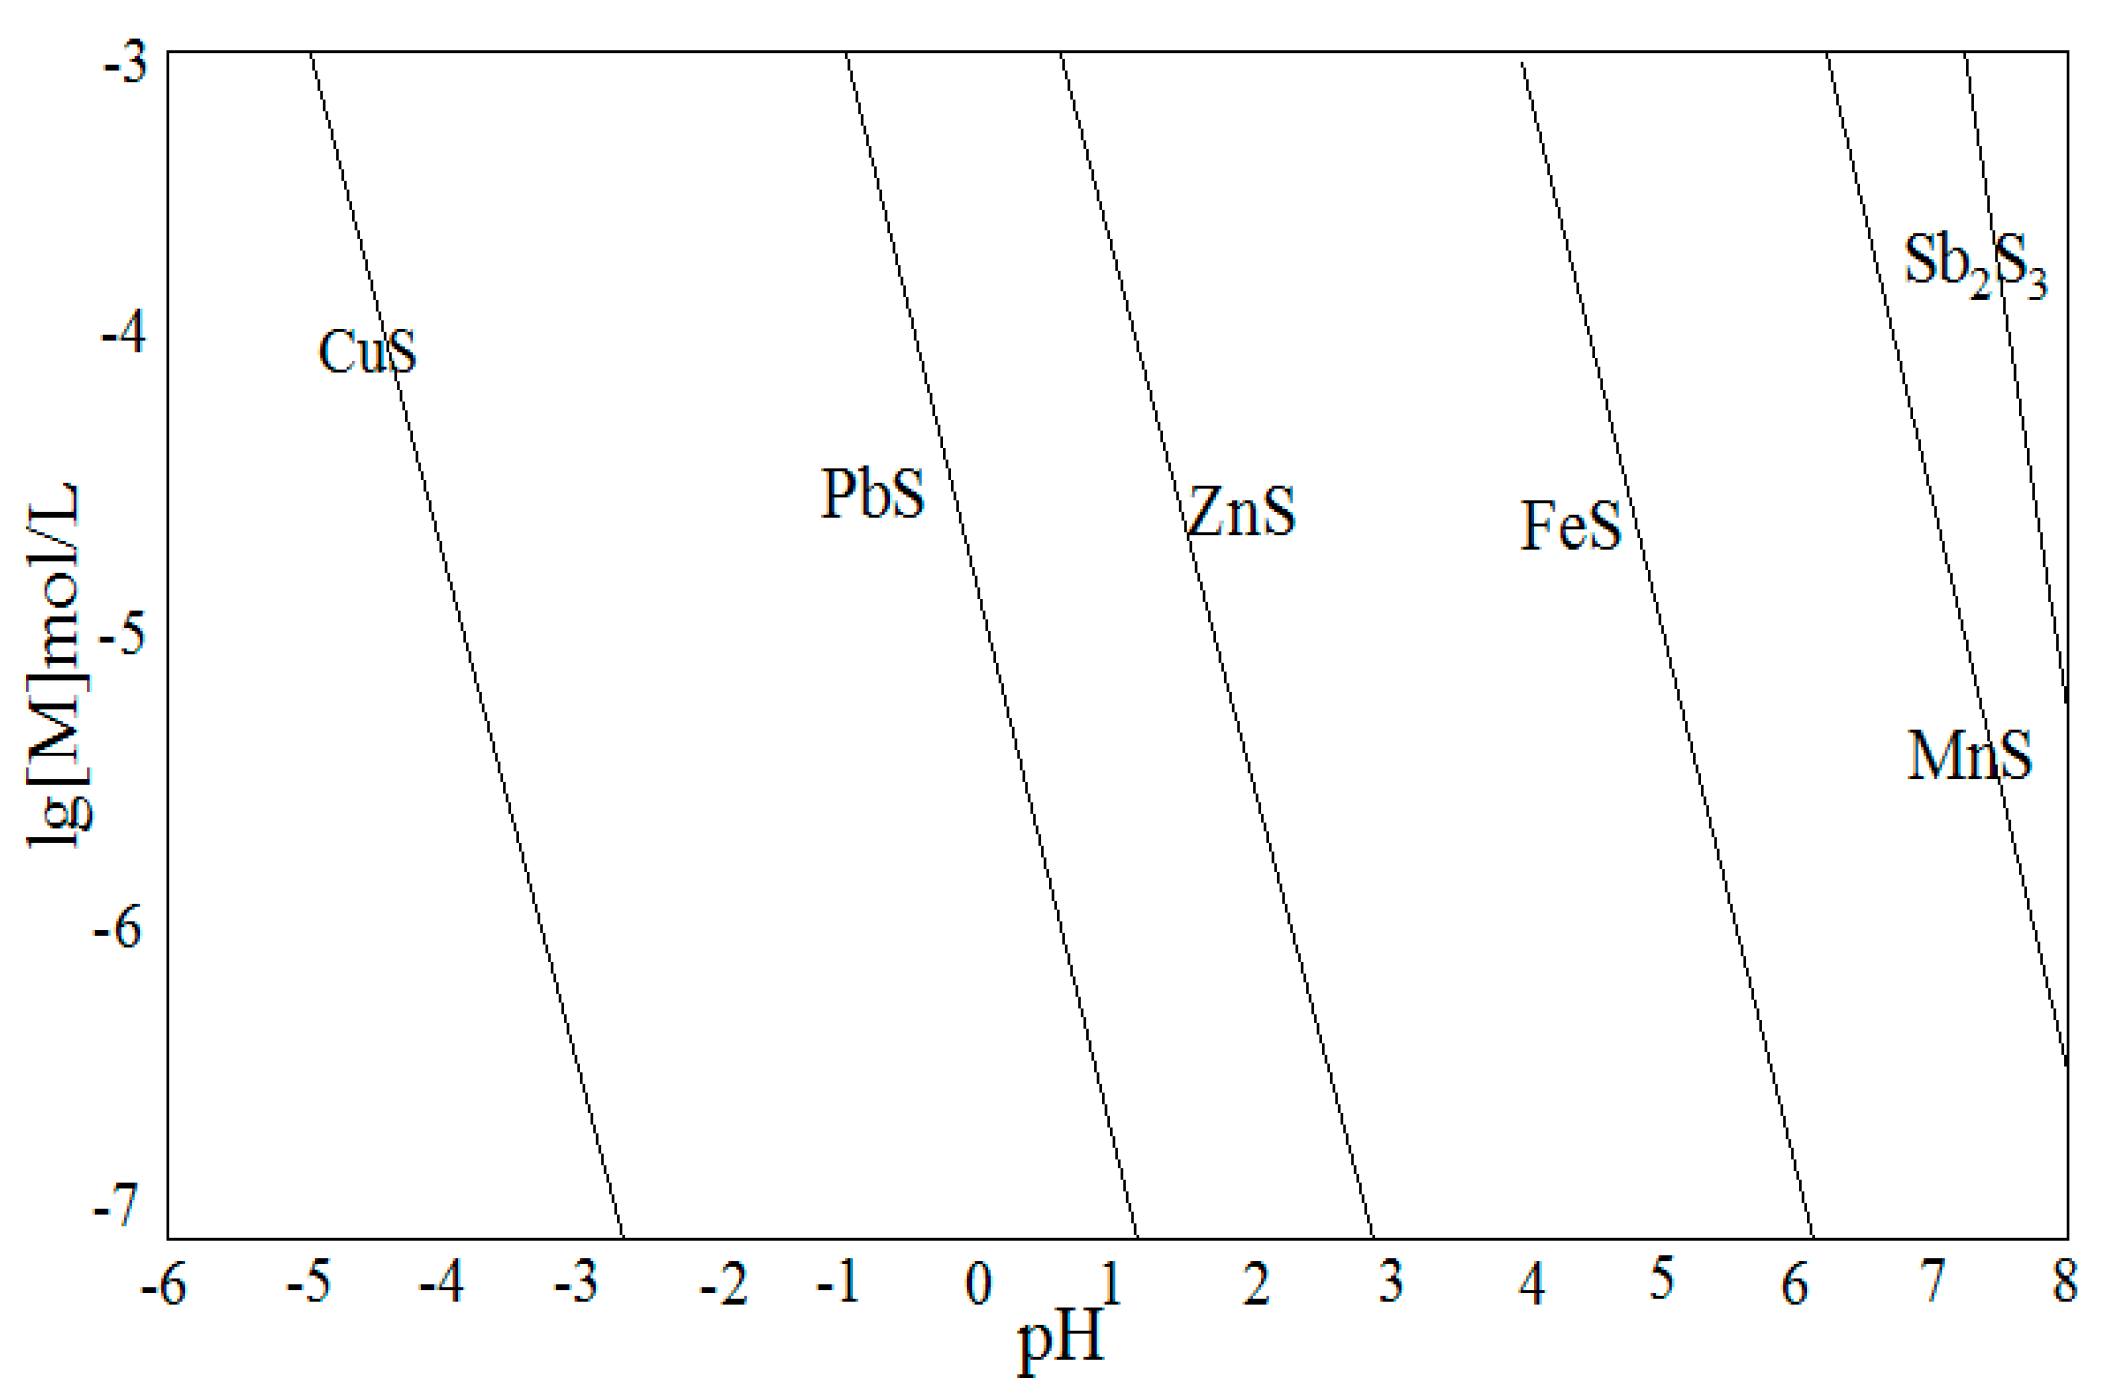
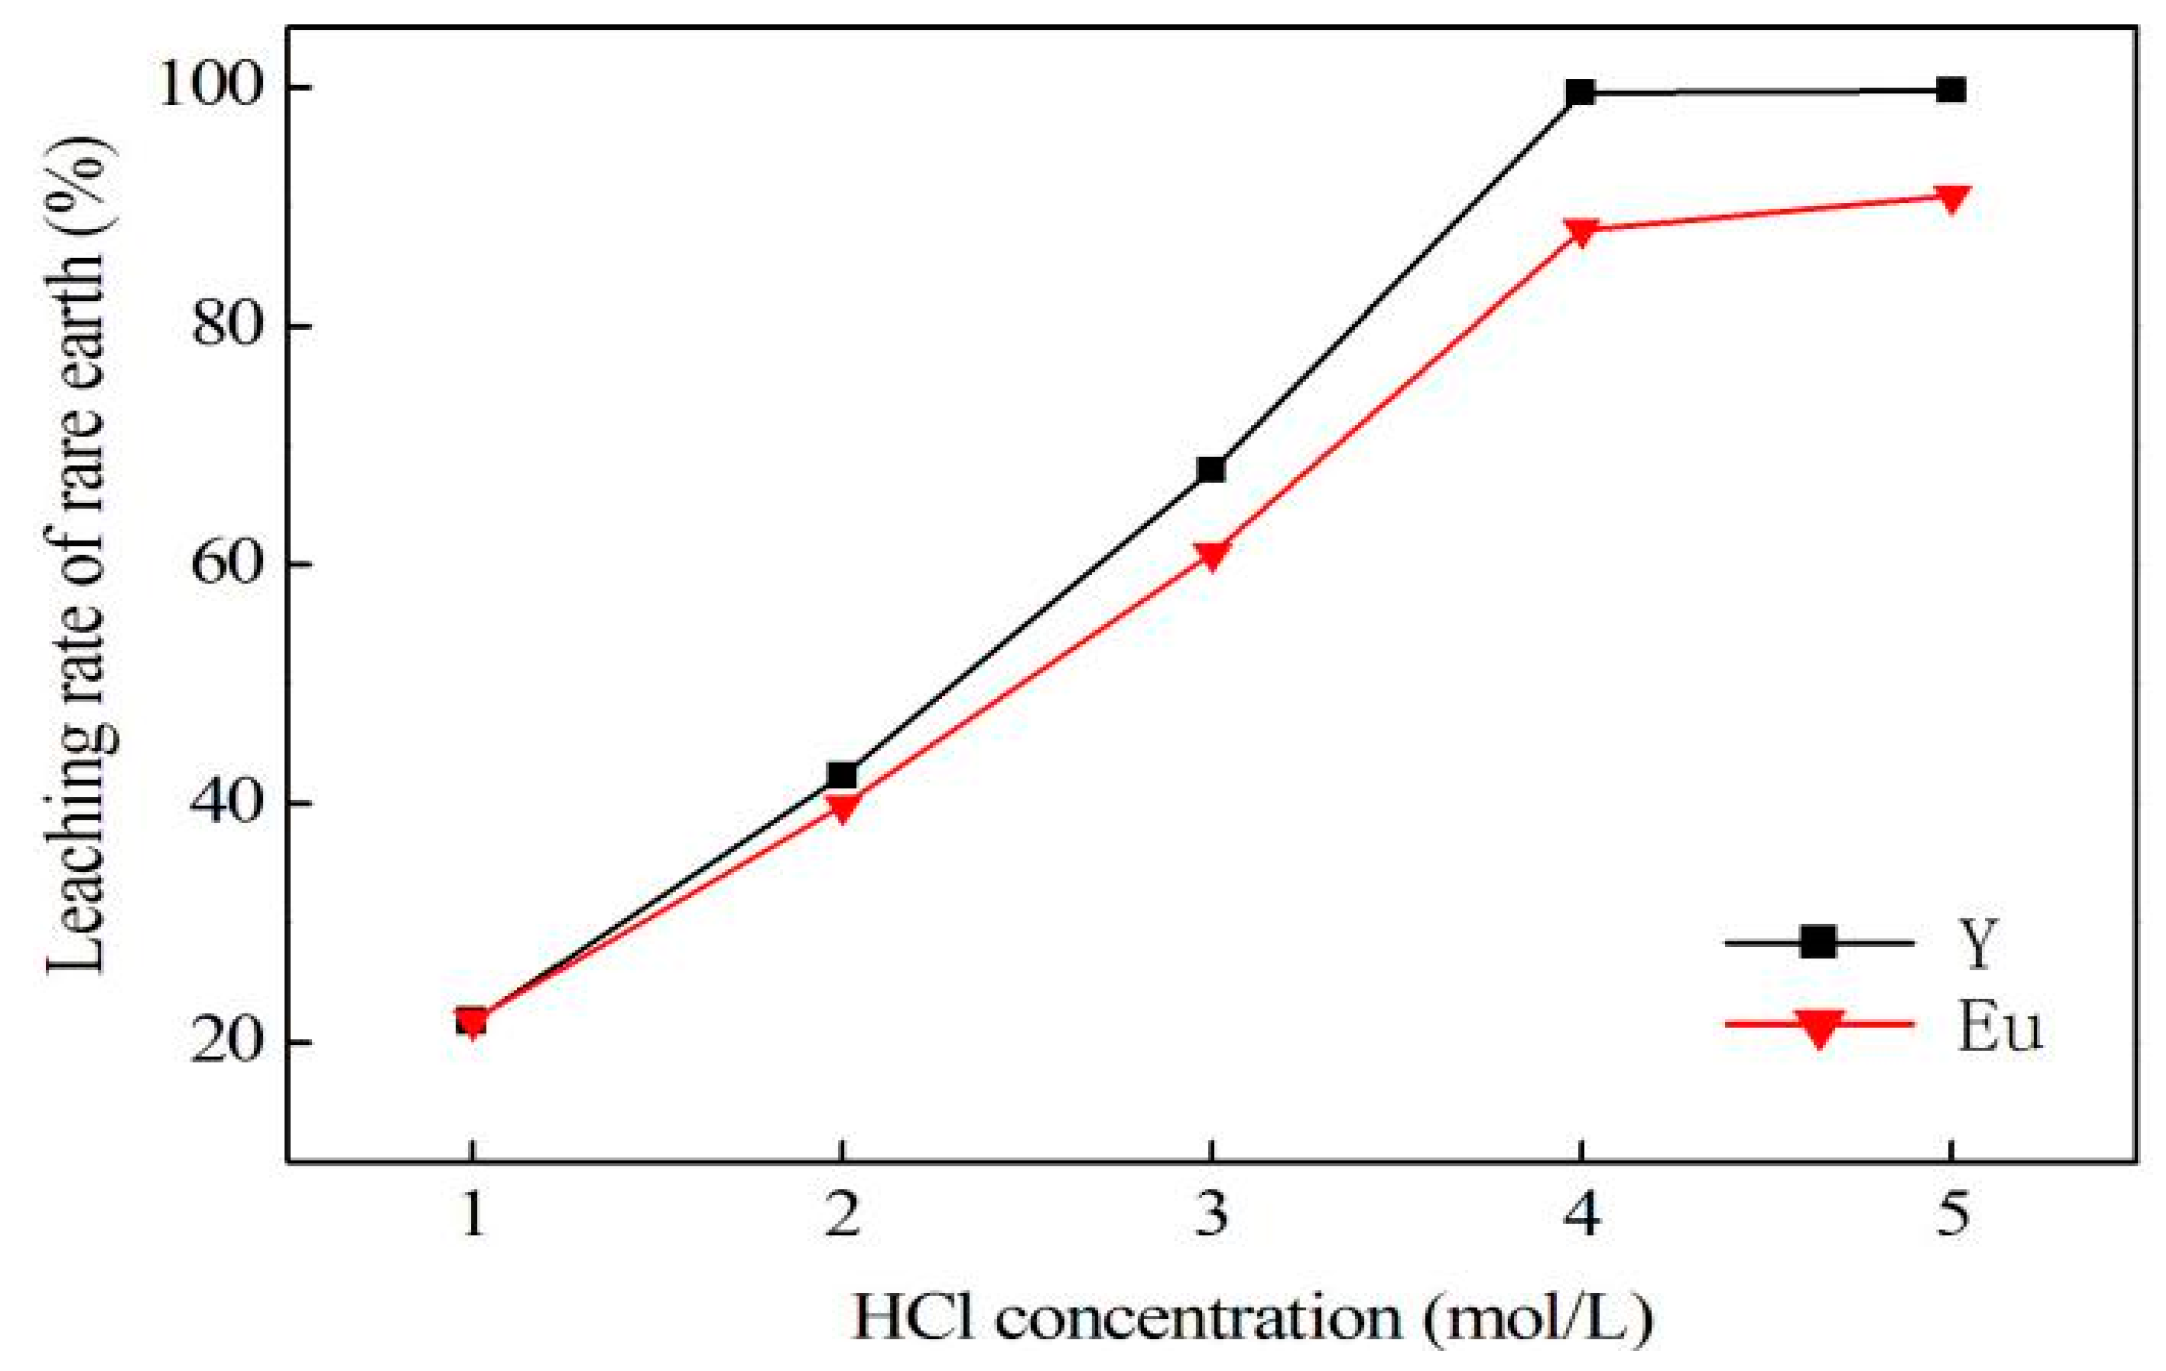
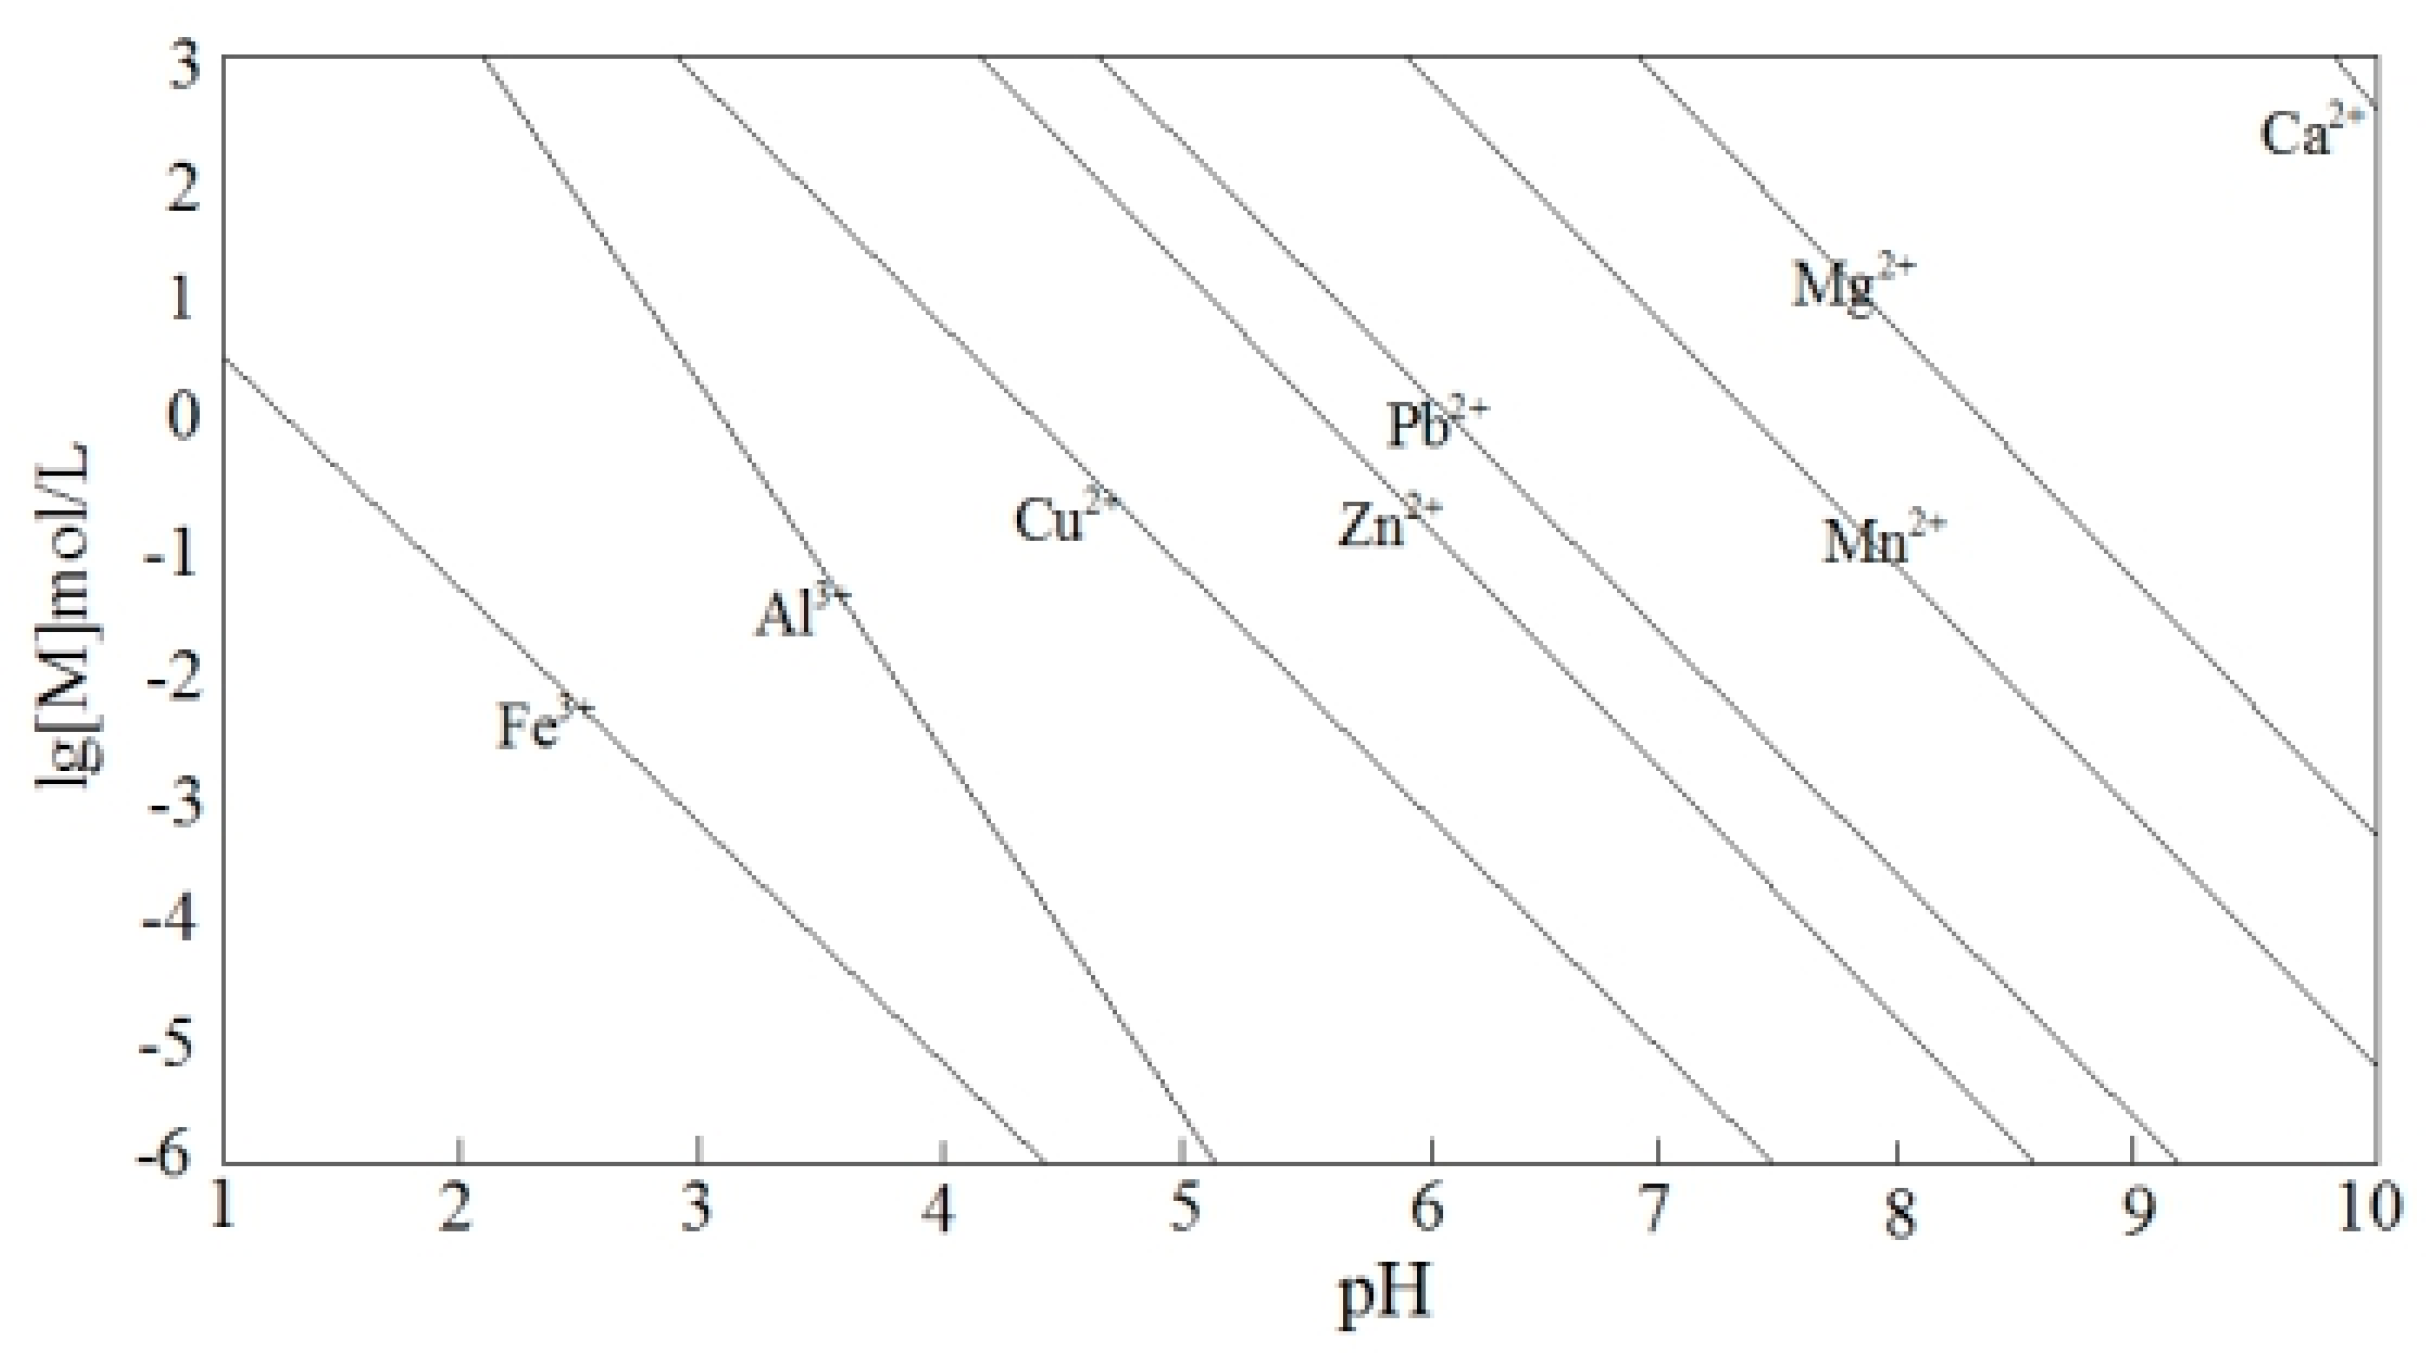
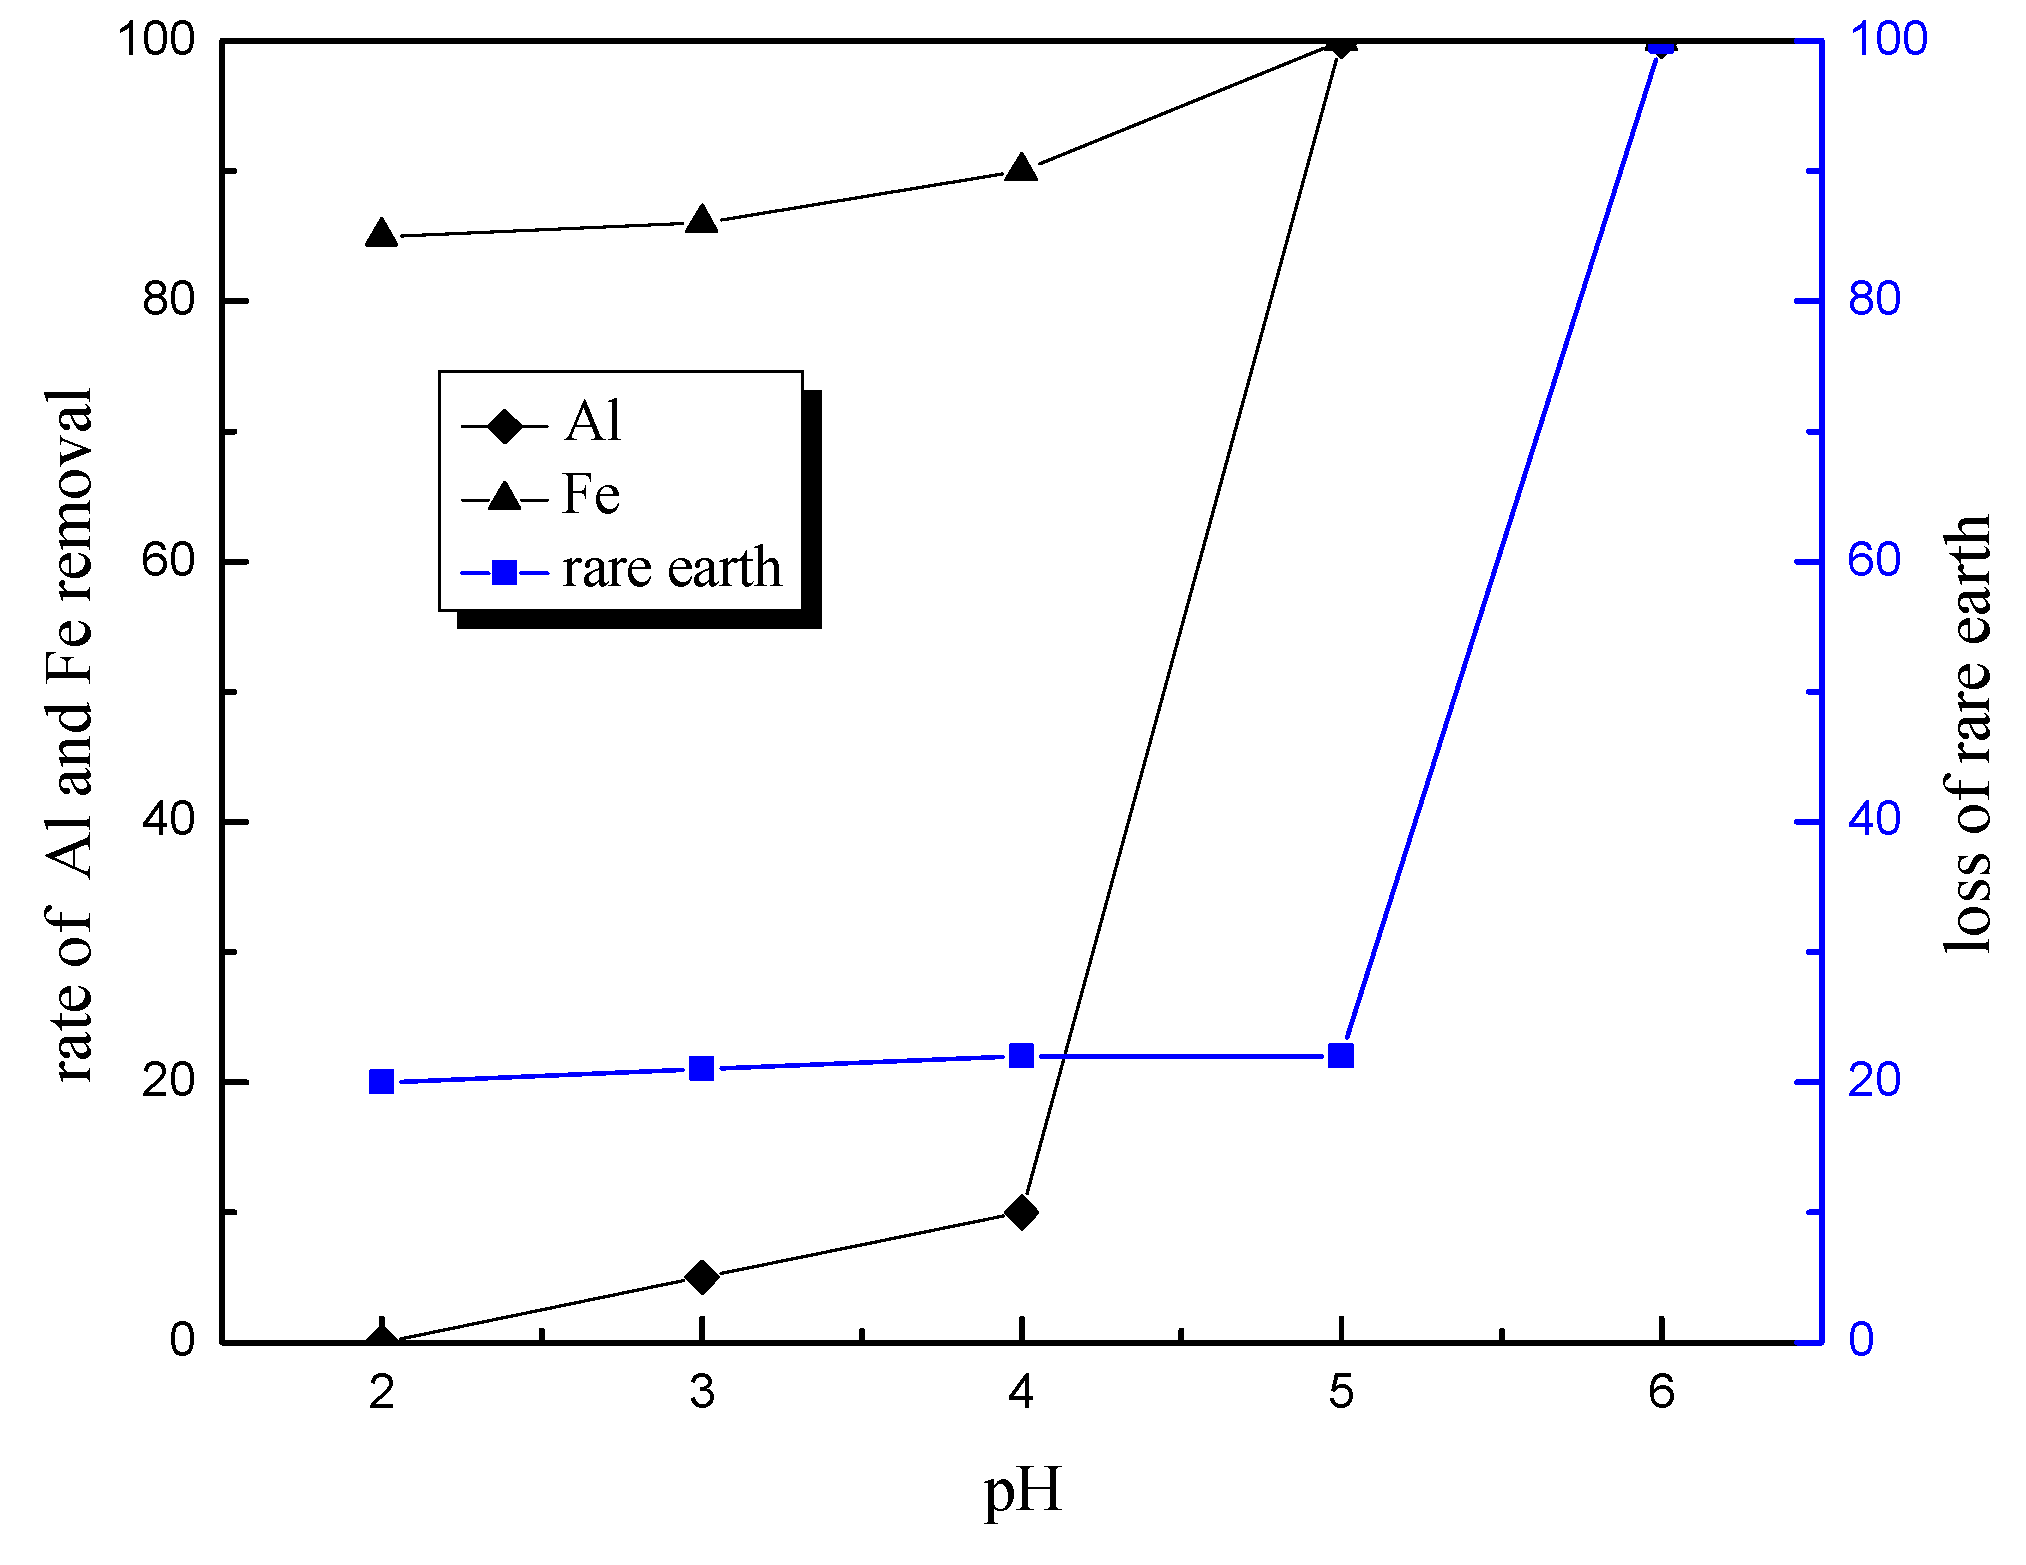
3:Eu by high temperature solid-state synthesis method. The leaching tests showed that the optimum condition to leach rare earth was: 4.0 mol/L of hydrochloric acid, 0.2 mL/g of hydrogen peroxide, 7.5 mL/g liquid–solid ratio, 60 °C, and 4 h of reaction. This study is mainly focused on the purification process aimed at optimization of experimental conditions for removal of impurities, as well as reduction of rare earth loss during this procedure. Tests showed that the best way to remove impurities is by adjusting pH to 4.0 using ammonia, and adding sodium sulfide and DDTC to control pH up to 5.0. In addition, Yongsong Liu et al. [17] found that the morphologies have a great effect on photoluminescence property, and that the microsphere Y2O3:Eu
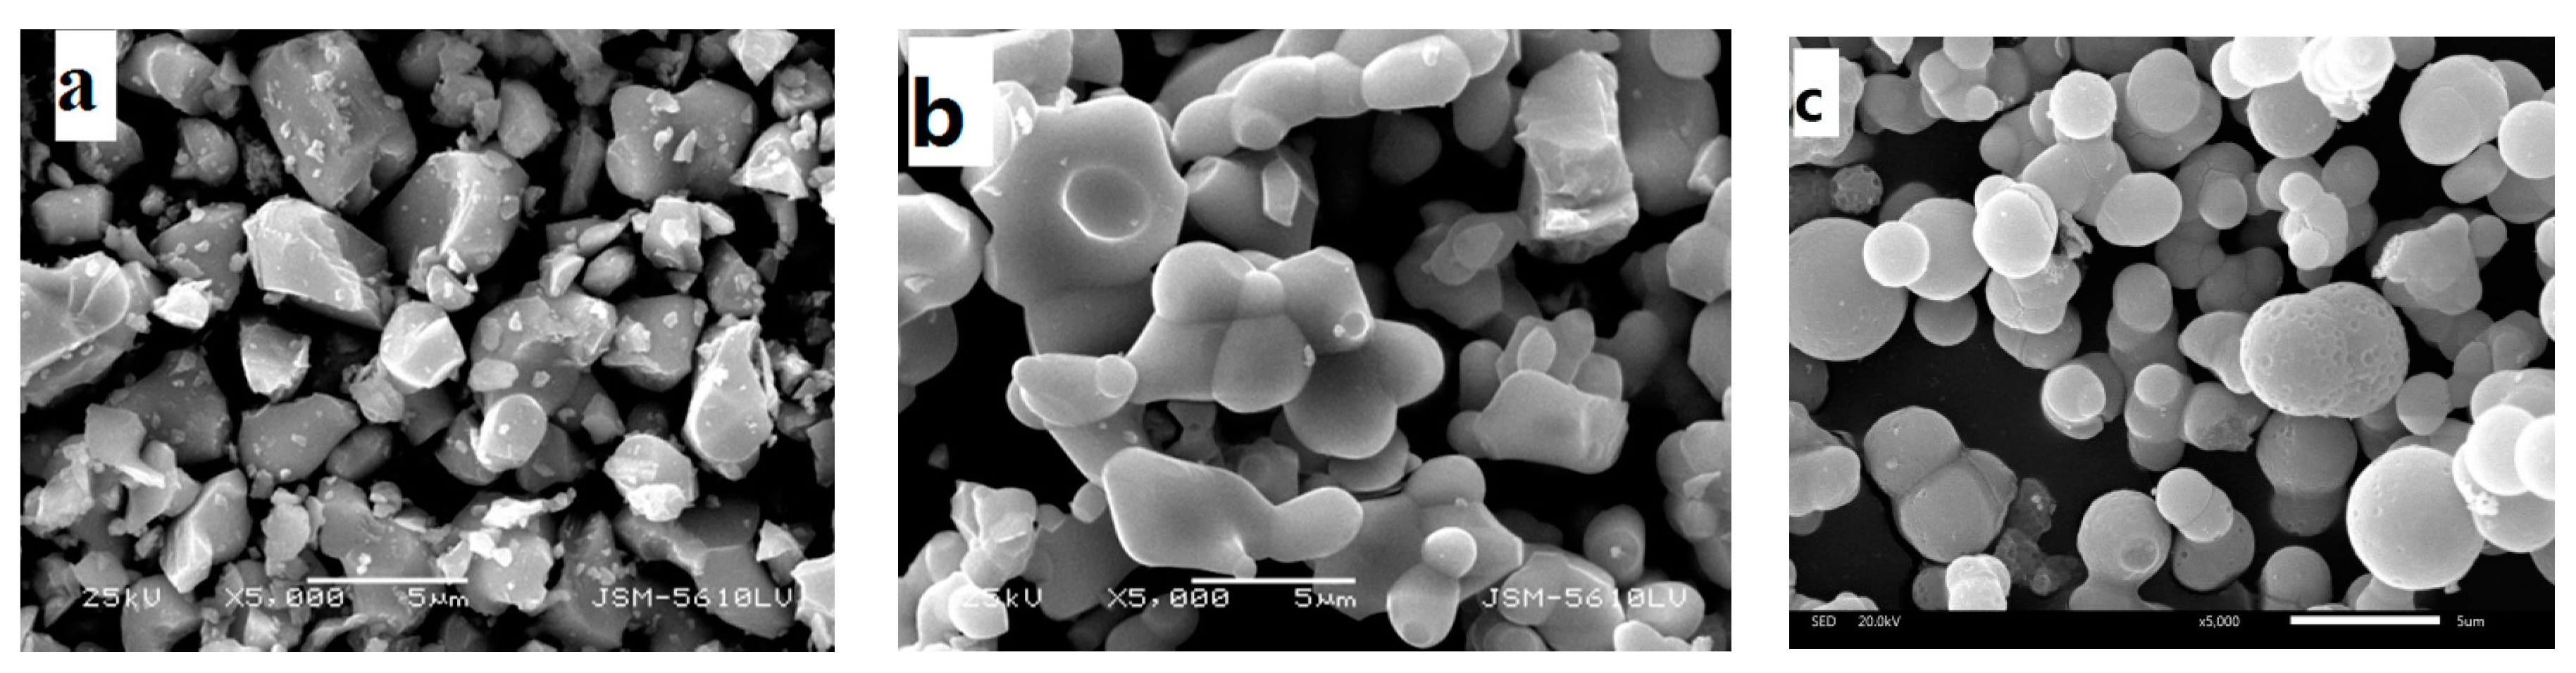
3+ exhibit the strongest red emission intensity among structures obtained in the experiments. M.K. Devaraju et al. [
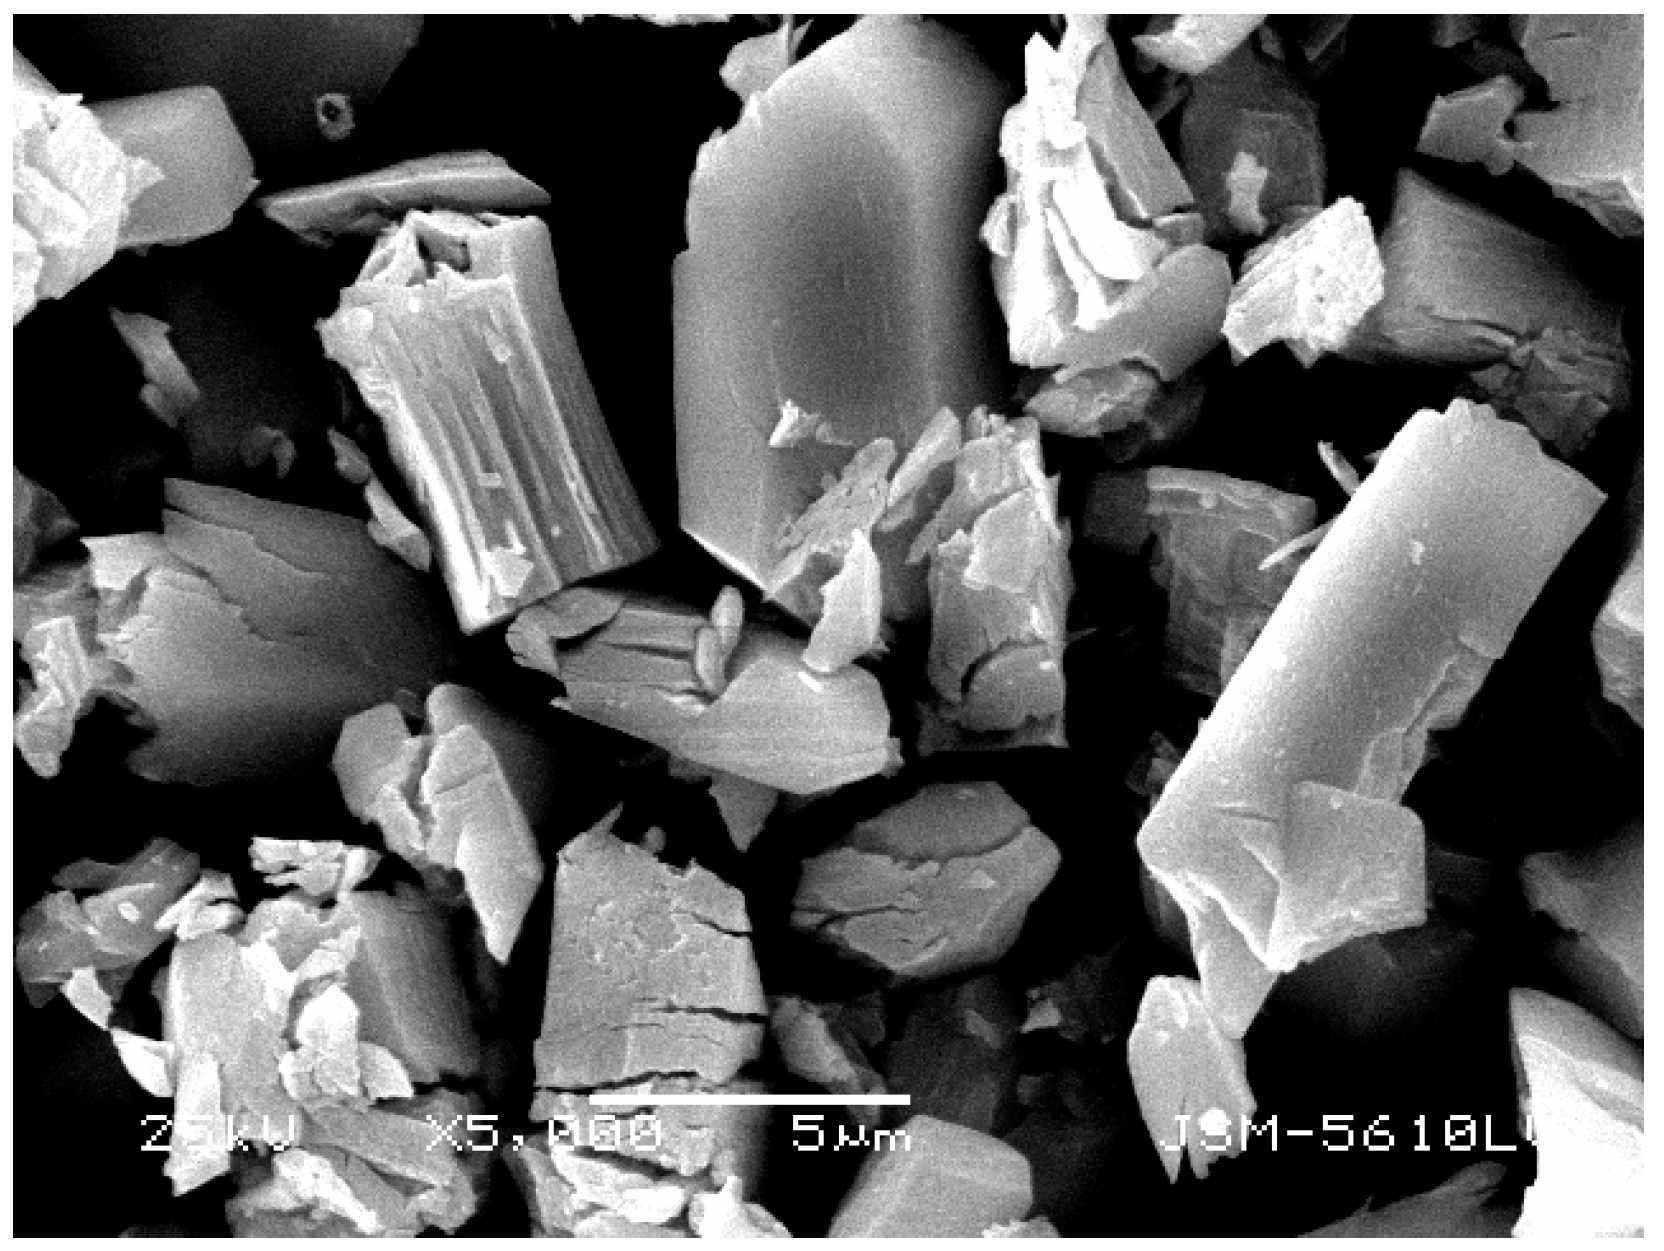
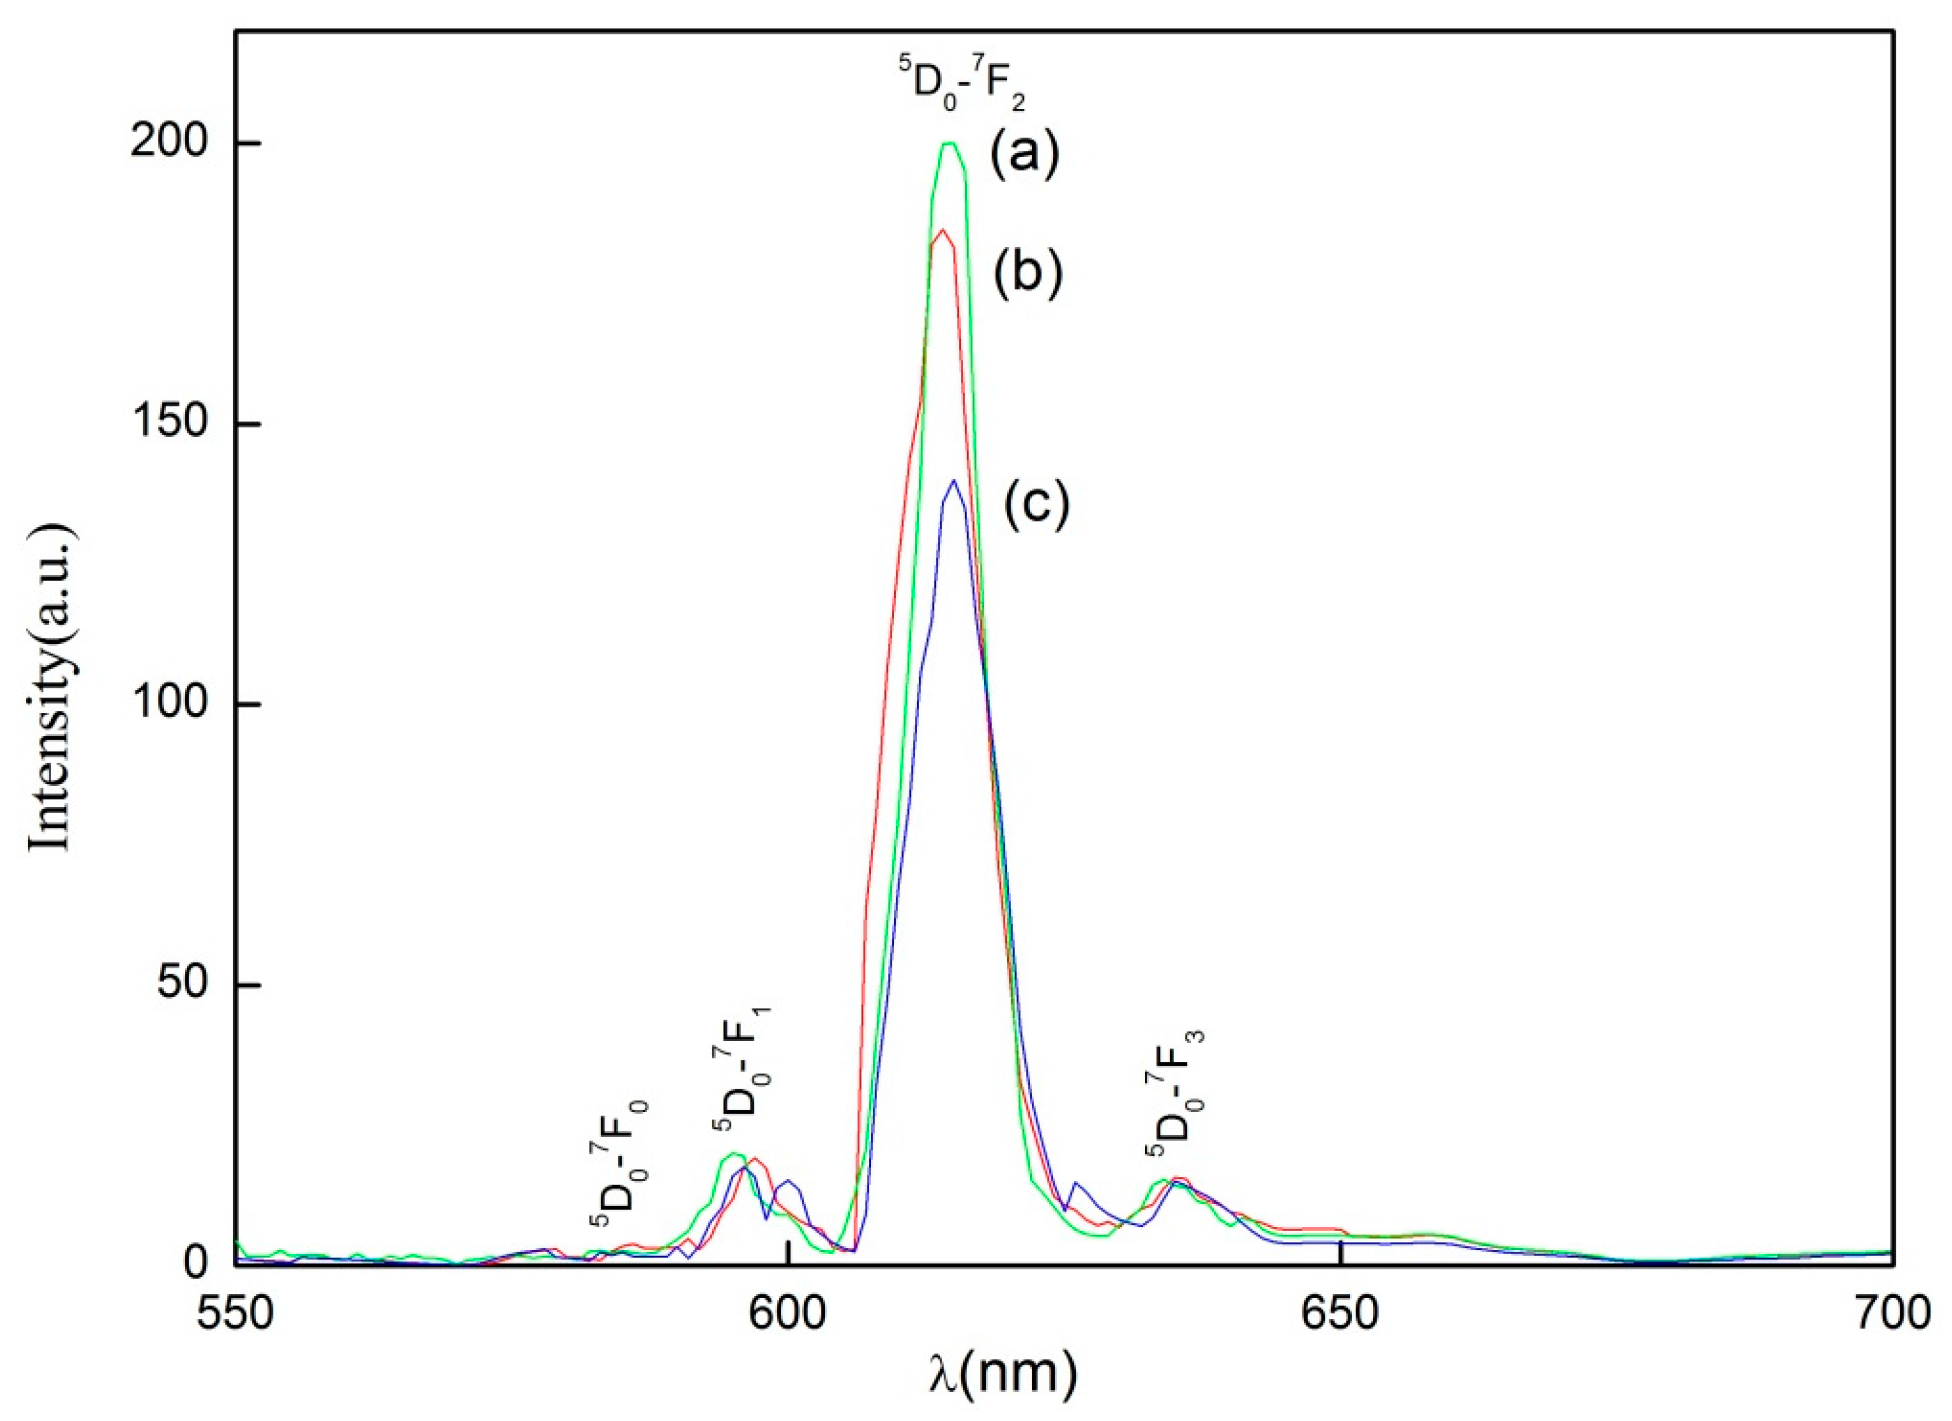
8] put forward that for successful applications, the phosphor particles should have a spherical shape and high luminescence. Phosphor particles with a spherical shape are capable of minimizing light scattering on their surface. Thus, in this paper, because of the smooth surface and ellipsoid morphology, the materials of Y2O3:Eu synthesized by high temperature solid-state synthesis method at 1400 °C with sintering aids exhibited higher PL intensity at 610 nm under the excitation of 254 nm, when compared to those synthesized without sintering aids. This result may provide helpful guidance for the application of phosphors.

Acknowledgments

This work was financially supported by “Key Projects in the National Science and Technology Pillar Program during the 12th Five-year Plan Period” (No. 2014BAC03B07), “Key Laboratory for Solid Waste Management and Environment Safety, Ministry of Education of China, Tsinghua University” (No. swmes 2011-03), and “The Fundamental Research Funds for the Central University” (No. WUH165208005).

Author Contributions

Xiaodong Chen and Nian Liu conceived and designed the experiments, Xiaodong Chen performed the experiments; Nian Liu analyzed the data; Guangjun Mei contributed reagents, materials, and analysis tools; Xiaodong Chen and Mingming Yu wrote the paper.

Conflicts of Interest

The authors declare no conflict of interest.

References

  1. Zhang, Q.J.; Wu, Y.F.; Cheng, H.Q.; Yin, X.F.; Wang, W. Research status and developing tendency of the recycling technologies of rare earth phosphors. Environ. Pollut. Control (China) 2013, 35, 79–83. [Google Scholar]
  2. Hirajima, T.; Bissombolo, A.; Sasaki, K.; Nakayama, K.; Hirai, H.; Tsunekawa, M. Floatability of rare earth phosphors from waste fluorescent lamps. Int. J. Min. Process. 2005, 77, 187–198. [Google Scholar] [CrossRef]
  3. Hirajima, T.; Sasaki, K.; Bissombolo, A.; Hirai, H.; Hamada, M.; Tsunekawa, M. Feasibility of an efficient recovery of rare earth-activated phosphors from waste fluorescent lamps through dense-mediun centrifugation. Sep. Purif. Technol. 2005, 44, 197–204. [Google Scholar] [CrossRef]
  4. Otsui, A.; Mei, G.J.; Jiang, Y.R.; Matsuda, M.; Shibayama, A.; Sadaki, J.; Fujita, T. Solid-solid separation of fluorescent powders by liquid-liquid extraction using aqueous and organic phases. Resour. Process. 2006, 53, 121–133. [Google Scholar] [CrossRef]
  5. Yang, Y.M.; Deng, S.H.; Xie, F.H.; Lan, Q.F.; Shen, W.M.; Huang, Z.H. Technical study on rare earth from fluorescent powder scrap. Nonferr. Met. 2012, 10, 23–26. (In Chinese) [Google Scholar]
  6. Mei, G.J.; Lei, Y.G.; Xie, K.F. Study on the recovery of Y2O3 from waste fluorescent powder. In Proceedings of the First Symposium on the Fifth Committee of Chinese Rare Earth Society on Geological, Mining and Mineral Processing Profession, Shenzhen, China, 23–26 October 2009; pp. 82–89. (In Chinese)
  7. Cui, H.M.; Chen, J.; Yang, H.L.; Wang, W.; Liu, Y.; Deng, Y.F.; Zhang, D.L. Enrichment and Separation of Y(III) from dilute solutions using Aliquat 336 functionalized chelating adsorbent derived from chitosan. Chin. J. Anal. Chem. 2014, 3, 446–451. (In Chinese) [Google Scholar]
  8. Devaraju, M.K.; Yin, S.; Sato, T. Solvothermal synthesis, controlled morphology and optical properties of Y2O3:Eu3+ nanocrystals. J. Cryst. Growth 2009, 311, 580–584. [Google Scholar] [CrossRef]
  9. Chen, J.T.; Gu, F.; Shao, W.; Li, C.Z. Hydrothermal synthesis of ordered nanolamella-composed Y2O3:Eu3+ architectures and their luminescent properties. Physica E 2008, 41, 304–308. [Google Scholar] [CrossRef]
  10. Chen, G.W.; Tao, S.; Yang, C.H.; Zhao, X.P. Facile preparation and fluorescence enhancement of mesoporous Eu-doped-Y2O3 phosphors. Mater. Sci. 2015, 26, 5970–5974. [Google Scholar] [CrossRef]
  11. Arunkumar, P.; Prabu, N.; Kottaisamy, M.; Mujafar, K.N.; Kamaraj, P.N.; Burkanudeen, A.; Jeyakumar, D. Photoluminescence Efficiencies of Nanocrystalline versus Bulk Y2O3:Eu Phosphor—Revisited. J. Am. Ceram. Soc. 2011, 94, 1627–1633. [Google Scholar]
  12. Chi, R.; Wang, D.Z. Experimental study on the amount of oxalic acid to precipitate rare earth in a complex solutions. Chin. Rare Earths 1992, 13, 10–14. (In Chinese) [Google Scholar]
  13. Williams, D.K.; Bihari, B.; Tissue, B.M. Preparation and Fluorescence Spectroscopy of Bulk Monoclinic. J. Phys. Chem. B 1998, 102, 916–920. [Google Scholar] [CrossRef]
  14. Devaraju, M.K.; Yin, S.; Sato, T. Eu3+:Y2O3 Microspheres and Microcubes: A Supercritical Synthesis and Characterization. Inorg. Chem. 2011, 50, 4698–4704. [Google Scholar] [CrossRef] [PubMed]
  15. Zhong, S.L.; Wang, S.J.; Xu, H.P.; Hou, H.Q.; Wen, Z.B.; Li, P.; Wang, S.P.; Xu, R. Spindle like Y2O3:Eu3+ nanorod bundles: Hydrothermal synthesis and photoluminescence properties. J. Mater. Sci. 2009, 44, 3687–3693. [Google Scholar] [CrossRef]
  16. Fu, Y.P. Preparation and characterization of Y2O3:Eu phosphors by combustion process. J. Mater. Sci. 2007, 42, 5165–5169. [Google Scholar] [CrossRef]
  17. Liu, Y.S.; Ruan, Y.Y.; Song, L.L.; Dong, W.J.; Li, C.R. Morphology-controlled synthesis of Y2O3:Eu3+ and the photoluminescence property. J. Alloys Compd. 2013, 581, 590–595. [Google Scholar] [CrossRef]
  18. Wang, J.; Xu, Y.H.; Hojamberdiev, M.; Peng, J.H.; Zhu, G.Q. Na2EDTA-assisted hydrothermal synthesis and luminescent properties of YVO4:Eu3+ with different morphologies in a wide pH range. Mater. Sci. Eng. B 2009, 156, 42–47. [Google Scholar] [CrossRef]
Figure 1. Effect of HCl concentration on the rare earth element (REE) leaching test (0.2 mL/g hydrogen peroxide, 60 °C leaching temperature, 4 h leaching time).
Minerals 07 00044 g001
Figure 2. Effect of the addition of hydrogen peroxide on the REE leaching test (4 mol/L HCl concentration, 60 °C leaching temperature, 4 h leaching time).
Minerals 07 00044 g002
Figure 3. Effect of leaching temperature on the REE leaching test (4 mol/L HCl concentration, 0.2 mL/g hydrogen peroxide, 4 h leaching time).
Minerals 07 00044 g003
Figure 4. Effect of leaching time on the REE leaching test (4 mol/L HCl concentration, 0.2 mL/g hydrogen peroxide, 60 °C leaching temperature).
Minerals 07 00044 g004
Figure 5. Relationship between equilibrium concentration of some metal ions and pH.
Minerals 07 00044 g005
Figure 6. Effects of pH on the yields of impurities and rare earth metals.
Minerals 07 00044 g006
Figure 7. Relationship between the residual concentration of metal ions and pH.
Minerals 07 00044 g007
Figure 8. The XRD pattern of the RE solid precipitation.
Minerals 07 00044 g008
Figure 9. TG-DSC curves of RE oxalates in air atmosphere (negative value is exothermal).
Minerals 07 00044 g009
Figure 10. XRD pattern of the precursor.
Minerals 07 00044 g010
Figure 11. SEM image of the RE precursor.
Minerals 07 00044 g011
Figure 12. XRD pattern of Y2O3:Eu3+annealed at 1400 °C with sintering aids (a); without sintering aids (b); and commercial red phosphor (c).
Minerals 07 00044 g012
Figure 13. SEM image of (a) Y2O3:Eu sintered at 1100 °C; (b) Y2O3:Eu sintered at 1100 °C with sintering aids; and (c) the commercial red phosphor.
Minerals 07 00044 g013
Figure 14. Photoluminescence spectra of (c) Y2O3:Eu annealed at 1400 °C without sintering aids; (b) Y2O3:Eu annealed at 1400 °C with sintering aids; and (a) the commercial red phosphor.
Minerals 07 00044 g014
Table 1. Main chemical composition of the waste fluorescent powder (wt %).
ComponentSiO2Al2O3Y2O3CaOP2O5BaONa2OMgOEu2O3CeO2Tb4O7
Content (%)23.2522.7920.439.068.112.672.791.862.061.601.01
ComponentPbOSrOFe2O3ClMnOSO3CuOSb2O3ZnOWO3-
Content (%)0.920.700.600.150.170.090.080.090.050.055-
Table 2. Inductively coupled plasma (ICP) emission spectroscopy analysis of the dissolved solution by leaching 20 g waste fluorescent powder.
ElementYEuCeTbCaAlFeSrSbBa
Yield (mg)3919281.4500.288164386.7235.3219.7511.9019.55
ElementMgMnWZnPbCuNaKSi-
Yield (mg)14.5211.181.4464.2176.3116.2234.4514.1522.31-
Table 3. Effect of Na2S after adding ammonia (R. = Rate of impurities removal).
pHPb R. (%)Zn R. (%)Cu R. (%)
3.098.370.164100
4.098.180.172100
4.592.810.175100
5.0000
Table 4. Main chemical composition of the solid precipitation.
CompoundY2O3Eu2O3SiO2Al2O3P2O5BaOCaOFe2O3
Content (%)44.835.401.605.4822.930.850.323.29
CompoundNa2OSrOZnOSb2O3PbOSO3Cl-
Content (%)0.040.250.350.560.3813.550.09-
Table 5. Loss-weight rate of RE oxalates at different temperature.
Temperature Range (°C)Thermal Decomposition StepsLoss-Weight Rate
130–200RE2(C2O4)3·nH2O → RE2(C2O4)3 + nH2O13.73%
200–430RE2(C2O4)3 → RE2(CO3)3 + 3CO27.84%
430–641RE2(CO3)3 → RE2O3 + 3CO229.97%
641–750Crystal transition ordering5.87%
Table 6. Main chemical composition of RE oxides.
CompoundY2O3Eu2O3SiO2Al2O3CaOSO3
Content (%)96.393.030.0970.020.290.078
Table 7. Physical Characteristics and PL Efficiency of Y2O3:Eu particles.
Temperature (°C)FWHM (°)Crystallite Size (nm)Shape of ParticleParticle SizePL (%)
80029.020.11670.61Bulk3–5 μm65
1400 with sintering aids29.110.15553.03Ellipsoid0.89–5.26 μm90
1400 without sintering aids29.180.16151.05Bulk4.65–8.93 μm77
Commercial red phosphor29.050.15353.71Spherical3–5 μm100

