Advances and Opportunities in Ore Mineralogy
by
 , and
, and
Nigel J. Cook
1,* ,
,
Cristiana L. Ciobanu
1,
Kathy Ehrig
2,
Ashley Slattery
3,
Max R. Verdugo-Ihl
1,
Liam Courtney-Davies
1 and
Wenyuan Gao
1,4 1
School of Chemical Engineering, The University of Adelaide, Adelaide, SA 5000, Australia
2
BHP Olympic Dam, Adelaide, SA 5000, Australia
3
Adelaide Microscopy, The University of Adelaide, Adelaide, SA 5000, Australia
4
Key Laboratory of Ministry of Education on Safe Mining of Deep Metal Mines, School of Resources and Civil Engineering, Northeastern University, Shenyang 110819, China
*
Author to whom correspondence should be addressed.
Minerals 2017, 7(12), 233; https://doi.org/10.3390/min7120233
Submission received: 28 October 2017
/
Revised: 19 November 2017
/
Accepted: 22 November 2017
/
Published: 24 November 2017
(This article belongs to the Special Issue Fundamentals and Frontiers in Mineralogy)
Abstract
:The study of ore minerals is rapidly transforming due to an explosion of new micro- and nano-analytical technologies. These advanced microbeam techniques can expose the physical and chemical character of ore minerals at ever-better spatial resolution and analytical precision. The insights that can be obtained from ten of today’s most important, or emerging, techniques and methodologies are reviewed: laser-ablation inductively-coupled plasma mass spectrometry; focussed ion beam-scanning electron microscopy; high-angle annular dark field scanning transmission electron microscopy; electron back-scatter diffraction; synchrotron X-ray fluorescence mapping; automated mineral analysis (Quantitative Evaluation of Mineralogy via Scanning Electron Microscopy and Mineral Liberation Analysis); nanoscale secondary ion mass spectrometry; atom probe tomography; radioisotope geochronology using ore minerals; and, non-traditional stable isotopes. Many of these technical advances cut across conceptual boundaries between mineralogy and geochemistry and require an in-depth knowledge of the material that is being analysed. These technological advances are accompanied by changing approaches to ore mineralogy: the increased focus on trace element distributions; the challenges offered by nanoscale characterisation; and the recognition of the critical petrogenetic information in gangue minerals, and, thus the need to for a holistic approach to the characterization of mineral assemblages. Using original examples, with an emphasis on iron oxide-copper-gold deposits, we show how increased analytical capabilities, particularly imaging and chemical mapping at the nanoscale, offer the potential to resolve outstanding questions in ore mineralogy. Broad regional or deposit-scale genetic models can be validated or refuted by careful analysis at the smallest scales of observation. As the volume of information at different scales of observation expands, the level of complexity that is revealed will increase, in turn generating additional research questions. Topics that are likely to be a focus of breakthrough research over the coming decades include, understanding atomic-scale distributions of metals and the role of nanoparticles, as well how minerals adapt, at the lattice-scale, to changing physicochemical conditions. Most importantly, the complementary use of advanced microbeam techniques allows for information of different types and levels of quantification on the same materials to be correlated.
1. Introduction
Mining, processing, and refining of minerals accounts for a significant portion of global GDP. Characterisation of the mineral, or in most cases minerals, making up an ore body (ore minerals) is critical for their efficient and sustainable exploitation and for the validation and refinement of genetic models that can underpin exploration, in turn leading to new discoveries to satisfy future demand. Ore minerals, in the context of the ore deposit that hosts them, can give important insights into fundamental topics of solid state chemistry and ore-forming processes.
Definitions of what constitutes an ore mineral vary significantly from source to source. Broadly, and in the context used in key reference texts [1,2,3], ore minerals are those containing one or more elements of economic interest, as well as related, co-existing mineral phases, which were concentrated and deposited via the same physical-chemical processes. Many ore minerals, notably the economically important sulphide [4], and oxide groups, are opaque, and are traditionally studied in reflected rather than transmitted light, a quality distinguishing them from rock-forming minerals. There are, however, many examples of minerals that represent an economic resource, but which are not opaque, and likewise, many opaque minerals that represent waste in many mining operations. A good example is hematite from iron oxide-copper-gold (IOCG) deposits, such as Olympic Dam, South Australia. This contribution therefore considers ore minerals in a loose sense, as those minerals concentrated within mineral deposits, whether of economic value or not.
The concept of “ore minerals” has changed over the past generation, as mines have become larger and in general of a lower grade, and as new discoveries of giant, high-grade mineral deposits have become less frequent relative to exploration dollars spent (e.g., [5]). Moreover, the global transition to new technologies has modified the patterns of demand for individual commodities. The emergence of the critical metals sector [6], for example, has catalysed both exploration and research interest into a range of new mineral resources that were previously regarded as sub-economic or waste. Examples include minerals that host lithium (Li), scandium (Sc), or the rare earth elements (REE). Such commodities may occur in traditional gangue minerals (e.g., silicates, carbonates etc.), or as trace substituents within sulphides, as in the case of indium (In) or germanium (Ge), for example. The boundaries of ore mineralogy are further blurred by a recognition among researchers that all of the minerals making up ore assemblages are best addressed collectively, and that gangue and accessory components within the ores, rather than the ore minerals themselves, may provide valuable information on ore genesis, formation conditions, or serve as indicators in mineral exploration.
We briefly review some of the recent advances in ore mineralogy—how these minerals are studied?—why they need to be studied?—and why an approach using complementary techniques gives results that can accelerate progress in understanding how the ores are formed, and why they occur where they do. We examine emerging trends in contemporary ore mineral research, including opportunities that are introduced by the ability to observe and measure more precisely and at ever smaller scales. We also consider a selection of the longer-term challenges faced by researchers in the field. We support our conclusions by drawing upon research addressing mineralogy provides insights into understanding formation of giant ore deposits, such as the giant Olympic Dam IOCG deposit, and from Fe-Ti-oxides within layered intrusions, such as Panzhihua, southeast China. We emphasise how a combination of nanoscale techniques can offer insights into ore-forming processes and the sequence of alteration and mineralization events in these complex ore systems.
2. Advances
2.1. Microanalytical Methods
The scanning electron microscope (SEM) and electron probe microanalyzer (EPMA) were two of the most important developments in mineralogy in the period 1950–1980. In mineral deposit geology, direct measurement of ore-forming fluids that are preserved within fluid inclusions trapped within minerals [7], and stable isotopes [8], stand out as the landmark technologies, which, during that same period, changed the way in which ores and ore minerals are studied. Analytical strategies for the routine study of ore minerals have undergone a revolution during the past 30 or so years due to an explosion of different, complementary in-situ microanalytical capabilities. The rapid expansion of microanalysis, with improved resolution and sensitivity, enables the ore mineralogist to observe, measure and quantify in ways that were not previously possible.
We summarise contemporary research topics from ten analytical methodologies, either well established, or currently emerging, that enable a greater understanding of the structural, physical, and chemical characteristics of many of the more common ore minerals. In most cases, these methods are routinely applied to resolve broader problems in mineralogy, but have proven particularly valuable for the study of ore minerals. We include references to selected publications that have demonstrated both of the types of application for each method and their future potential.
2.1.1. Laser-Ablation Inductively-Coupled Plasma Mass Spectrometry (LA-ICP-MS)
LA-ICP-MS [9,10] has rapidly established itself as a requisite research tool with application across the earth sciences. For ore mineralogists, LA-ICP-MS represents a rapid and relatively inexpensive method for accurate, precise in-situ measurement of concentrations of trace elements in mineral matrices, and to map the distributions of those elements at the grain-scale. This, in turn, enables genetic models for mineral deposits to be refined. Large LA-ICP-MS datasets can form a foundation for understanding trace element incorporation and release from ore minerals, as well as for the development of geochemical vectors of value in mineral exploration. Coupled with automated mineralogy (see below), LA-ICP-MS allows for reliable deportment models to be generated for elements of interest. Moreover, LA-ICP-MS also offers a platform for in-situ geochronology [11], and in-situ chemical characterization of fluid inclusions [12]. Cook et al. (2016) [13] provide an overview of current applications of LA-ICP-MS to the trace element analysis of minerals in hydrothermal ore deposits, also noting research gaps, some of the outstanding issues, and future opportunities. The rapidly expanding capabilities of current LA-ICP-MS instrumentation, including both quadrupole and multi-collector systems, include in-situ determination of stable isotopes, and grain-scale mapping of isotopic signatures [14,15,16,17,18]. Outstanding challenges include inadequately constrained issues of down-hole fractionation, the impact of matrix effects, and concerns about how the behaviour of certain minerals during ablation may induce fractionation (e.g., [19]). To this, we add the long-standing question of how LA-ICP-MS data from fine-grained, heterogeneous, complex ores can best be interpreted, when the sample volumes analysed by LA-ICP-MS contain measured elements that are in solid solution within the host, as well as sub-micron-sized mineral inclusions, which, in many cases, are just a few nanometres across (Figure 1).
2.1.2. Focussed Ion Beam-Scanning Electron Microscopy (FIB-SEM)
FIB-SEM methods have helped resolve problems that are associated with in-situ extraction of small amounts of sample material that has been well-characterised at the micron-scale, e.g., by EPMA or LA-ICP-MS, from the surface of a polished mount for milling and subsequent analysis by transmission electron microscopy ([20,21,22,23], and references therein). Direct application of FIB-SEM methods in ore mineralogy is expanding steadily ([22,23,24,25,26,27,28,29,30,31,32,33], and references therein). The technique has revolutionized mineral characterization by enabling scales of observation to be bridged, i.e., linking observations at the nanometre-scale to features observable at the scale of microns in reflected light or by SEM. In tomographic analysis mode, the FIB-SEM provides three-dimensional visualisation of a sample with resolution well below the micron-scale (e.g., [34]).
Figure 2 illustrates an example in which FIB-SEM has been used to visualise and extract thin foils in-situ from iron-oxides to examine and identify nanoscale inclusions using high-angle angular dark field scanning transmission electron microscopy (HAADF STEM). The magnetite illustrated occurs as a magmatic accessory in the host granite (Roxby Downs Granite; RDG) to the Olympic Dam Cu-U-Au-Ag deposit. In general, magmatic magnetite in the RDG is associated with ilmenite, apatite and zircon, as well as minor titanite. The binary inclusions that are shown here were observed at the micron scale only for a sub-population of magnetite grains. Nanoscale investigation shows they are however ubiquitously present throughout the magnetite although they vary in size down to the smallest nanoparticles. The presence of such inclusions in RDG magnetite is taken as further evidence for mixing between granitic and mafic magmas, as was suggested by studies of apatite that contain pyrrhotite-fluorite inclusions [35], relationships among feldspars in the RDG [36], and indeed observations on intrusive rocks from other granitic plutons elsewhere (e.g., [37]).
2.1.3. HAADF STEM Imaging and STEM-EDS Mapping
Transmission electron microscopy has been a routine mineralogical technique dating back to the middle of the 20th Century, but continues to advance at an extraordinary rate [38]. The application of HAADF STEM, is, however, a more recent development. HAADF STEM enhances Z-scale contrast, enabling atomic-scale resolution with applicability to many minerals that are found within ore deposits, e.g., mixed-layer chalcogenide compounds of the tetradymite group [39], as shown in Figure 3.
The atomic-scale resolution possible with contemporary state-of-the-art STEM instrumentation in HAADF STEM mode is particularly well-suited to visualise the structures of complex sulphosalts e.g., Pb-Bi-sulphosalts [23], Zn-bearing smectites [41,42], or disordered intergrowths among mixed-layer compounds, such as the REE-fluorocarbonates [43]. Atomic-scale HAADF STEM imaging is a more direct tool than high-resolution TEM since it provides a better control on the correlation between crystal structures and chemical variation. It is therefore an ideal tool for resolving issues of polysomatism within mineral series, in which the crystal structural motifs or layer stacking change gradually. In combination with energy-dispersive X-ray (EDX) mapping, the HAADF STEM technique is well suited to the identification of nanoparticles, and even the smallest atomic clusters that are present within a mineral. The technique is particularly useful for heavier (U, Au, Te, Bi, Pb, REE etc. [23,43]), rather than lighter atoms. Remarkable insights have, however, been obtained by HAADF STEM into the nanoscale mechanisms responsible for precipitation of siliceous magnetite [44]. Electron energy loss spectroscopy (EELS) on a TEM platform is also an important technique that can be used to show the oxidation state of elements of interest within a nanoparticulate mineral and any variation in such oxidation state at the nanoscale, e.g., [45]. Based on our accumulated experience, HAADF STEM imaging works better on FIB-prepared foils (often with variable thickness and distortions) than HR TEM imaging. Future research topics with potential in ore mineralogy include: (i) trace element incorporation in minerals and their release; (ii) polysomatism in mixed-layer compounds; and, (iii) lattice-scale order/disorder as a tool to constrain equilibrium crystallisation versus mineral replacement.
To illustrate an application of HAADF STEM, we show, in Figure 4, an early hydrothermal association of hyalophane-albite within the core of a magmatic K-feldspar phenocryst (mm-sized), with rapakivi texture [36,46] from granite outside the orebody at Olympic Dam. The sample is considered “fresh”, based on whole rock geochemical data analysis and the preservation of magmatic amphibole and biotite. In IOCG deposits, alteration is often defined based on mineral associations that are constrained regionally or at the scale of the deposit (e.g., [47]). This example shows, however, that intensive hydrothermal alteration with the development of calc-silicates and their replacement (e.g., chlorite replacing epidote, as shown here) can occur at the nanoscale, even though magmatic features (e.g., cryptoperthites) are preserved. The assemblage also contains abundant, nm-scale inclusions of hematite and larger grains of sericite epitaxially intergrown with chlorite (also see [46]). Such associations draw attention to the telescoping character of alteration stages in IOCG deposits, which are otherwise treated only as well-defined spatial-temporal stages. Moreover, these mineral reactions are driven by coupled dissolution-reprecipitation reaction (CDRR), and thus chemical exchange is trapped within areas ranging in scales from a few nm (as shown here) up to several meters. Considering that we show here a representative case for an IOCG deposit with high metal endowment, it may be that these types of reaction are paramount in contributing to the fertility of an IOCG system by confining the alteration within an area that will become the orebody.
In Figure 5, we show HAADF STEM images and element maps of REE-fluorocarbonates from a locality adjacent to the Olympic Dam deposit. These are part of an assemblage containing sericite and molybdenite pseudomorphically replacing magmatic feldspar (plagioclase) in a red-stained K-feldspar altered granite [36,46]. Bastnäsite [(REE)CO3F] and parisite [Ca(REE)2(CO3)3F2] are recognised as the main REE-species, and nanometre-sized hematite is seen as platelets throughout the parisite [46]. Atomic-scale HAADF STEM imaging was undertaken for the first time on such assemblages, and has shown the presence of a third species, “B2S”, with composition between bastnäsite and parisite, as well as the changes between the minerals along directions that are perpendicular to the stacking sequences [43]. The element maps in Figure 5 show the changes in parisite-bastnäsite stacking sequences across a microfracture adjacent to areas where hematite is also present as epitaxial intergrowths with minerals of the bastnäsite-synchysite group. This type of assemblage is important for understanding development of the early stages of alteration associated with IOCG deposits, and particularly the link between REE-enrichment and the initial stages of Fe-metasomatism. As in the other example above (Figure 4), this reinforces the hypothesis that the earliest hydrothermal Fe-oxide formed at Olympic Dam is not necessarily magnetite, but hematite. This contradicts generic schemes of IOCG alteration invoking a so-called IOA-stage or “magnetite-apatite” assemblage, which is contended as typifying “early mineralisation” [48] at Olympic Dam, or indeed in IOCG and related “IOA” systems elsewhere (e.g., [49]).
2.1.4. Electron Back-Scatter Diffraction (EBSD)
Since the technique first emerged in the mid-1990’s, EBSD [50,51,52] has found wide application in mineralogy, with particular suitability to more refractory phases, such as zircon and garnet. Among the ore minerals, pyrite has been a major focus. Many studies used EBSD to target mechanisms of sulphide deformation at different conditions in metamorphic environments [53,54,55,56,57,58,59,60]. Other studies [61,62,63] used EBSD to address the growth of colloform and framboidal pyrite. Reddy and Hough (2013) [64] investigated Witwatersrand pyrite, linking trace element distribution patterns to sulphide deformation, and showed that some of the genetic controversies on the Witwatersrand gold ores can be explained with a model of gold mobilization before and after the re-deposition of pyrite. Iron-(Ti)-oxides are also refractory minerals in which genetic and deformational history can be preserved. Several EBSD studies have been undertaken in rocks ranging from gabbros [65] and deformed granites [66] to marine sediments [67]. Barbosa and Lagoeiro, 2010 [68] used EBSD to address transformation between magnetite and hematite in samples from the Quadrilátero Ferrífero of Brazil, while Rosière et al. (2013) [69] assessed the interplay between deformation and mineralization in high-grade iron ores hosted by shear zones. Based on synthetic deformation experiments showing the crystallographic textures may be weak or slow to develop, caution has been raised [70] regarding the interpretation of magnetite deformation mechanisms. In recent years, however, researchers have begun to use EBSD to investigate a range of other ore minerals, such as pyrrhotite-pentlandite from komatiite-hosted ores [71], in which trace element concentrations were found to correlate with microstructures, indicating intragrain diffusion.
EBSD has also proven most helpful in examining potential variation in isotopic signature with crystal orientation of iron-oxides [72], rutile [73], or cassiterite [74]. Because electron backscatter patterns are generated from the uppermost few tens of nanometres of the sample surface, preparation and chemical polishing routines need to be optimised. In our experience, this can be problematic for some ore minerals or intergrowths thereof where conventional grinding and polishing causes damage to crystal lattices. Increasingly, EBSD is run on a FIB-SEM platform, offering high-resolution imaging and the potential of three-dimensional tomography (e.g., [75]). FIB-SEM based EBSD also offers the possibility of working on ion-milled surfaces, negating the need for chemical polishing. Investigating single crystals of uraninite by EBSD on a FIB platform, Macmillan et al. [76] addressed how lattice strain could be correlated with changes in chemical zonation patterns. Expanding on this work, the same authors examined mineral replacement between minerals with completely different chemistry (uraninite and Cu-Fe-sulphides) via coherent processes coupling dissolution to reprecipitation ratios [77]. The use of the FIB-SEM platform for EBSD analysis can be followed by TEM work on thinned foils subsequently extracted from the same material.
2.1.5. Trace Element X-ray Fluorescence (SXRF) Mapping Using Synchrotron Radiation
The resolving power of synchrotron radiation and increased availability of access to synchrotron facilities has generated new avenues for investigation of ore minerals. Megapixel high-definition trace element X-ray fluorescence (SXRF) mapping using the Maia detector [78,79,80,81], for example, enables the generation of maps with the dimensions of a full thin section or drillcore fragment at resolutions of a few μm in only a few hours, complementing EPMA or LA-ICP-MS analysis. Applications of SXRF mapping in ore mineralogy and petrology are given by [82,83,84]. We would also single out the recent use of synchrotron X-ray sources for the determination of the oxidation states of minor elements (~1000 ppm) in common sulphides via extended X-ray absorption fine structure (EXAFS) and X-ray absorption near edge structure (XANES). For example, Cook et al. [85] determined the presence of Cu+ in indium-bearing sphalerite, confirming 2Zn2+ ↔ Cu+ + In3+ coupled substitution. A second study [86] confirmed the presence of Ge4+ in sphalerite, which is suggested to substitute for (Zn,Fe)2+ with vacancies introduced to achieve charge balance. Most recently, Bonnet et al. [87] presented evidence for both Ge2+ and Ge4+ in sphalerite. Opportunities exist to use such synchrotron source methods to validate the oxidation states of other proposed substituents, e.g., Sn in common sulphides.
2.1.6. Automated Mineralogy
Automated mineralogy techniques on a SEM platform, notably Quantitative Evaluation of Mineralogy via Scanning Electron Microscopy (QEMSCAN) and Mineral Liberation Analysis (MLA), have proven invaluable for the investigation of ore samples ([88], and references therein). QEMSCAN uses signals from the BSE and EDS detectors to identify each particle based on average atomic mass, and a comparison of the obtained image with a “mineral library” database to search for probable fits for the compound in question. MLA uses grey-scale BSE images as a primary method of mineral identification and is faster, since the dead time that is required for X-ray analysis is minimized. These methods allow for the determination of which minerals are present, and in which proportions, their grain size distributions and associations. MLA data is especially useful where sample representivity is paramount.
Automated mineralogy has thus found widespread application in quantitative geometallurgy (e.g., [89,90,91]) and routine MLA analysis on large numbers of samples is an essential component of validated deposit-scale zonation models, e.g., for Cu-Fe-sulphide species at Olympic Dam [92]. Automated mineralogy is increasingly used for the identification of unconventional or less common ore minerals and to understand the distributions of minor and trace elements. For example, Bachmann et al. (2017) [93] describe new strategies, combining MLA and EPMA, for the systematic detection and identification of small particles containing the critical element indium. Correct interpretation of automated mineralogy data does, however, require a sound mineralogical understanding of the material, and thus should not be considered as a direct substitute for that. MLA may also not necessarily detect phases present as smallest phases, or resolve subtle compositional variations.
2.1.7. Nanoscale Secondary Ion Mass Spectrometry (nanoSIMS)
NanoSIMS [94] offers in-situ visualisation of mass abundances in solid materials with chemical imaging down to the nanoscale. There are currently ~40 nanoSIMS instruments worldwide, and the technique is proving extraordinarily valuable for understanding the internal structure and composition of ore minerals. Among ore minerals, pyrite and arsenopyrite have been a major focus in published work, particularly with respect to their capacity for hosting both nanoparticulate and solid solution gold [95,96,97]. Opportunity exists to use nanoSIMS to address other outstanding issues in the mineralogy of compositionally-zoned minerals, trace element partitioning, and in mineral processing. In one innovative application of nanoSIMS, Wacey et al. (2015) [98] have used nanoSIMS mapping of organic carbon and nitrogen in framboidal pyrite, elucidating mechanisms of framboid formation in terms of organic biofilms.
NanoSIMS is proving a frontier technique for tracking the grain-scale distributions of daughter products of uranium decay in ores [99]. This approach has shown both the versatility and extreme sensitivity of the method, even at extremely low concentrations, and points to the future promise of nanoSIMS to constrain element and isotope mobility at the grain-scale, with major implications for improved microbeam geochronology. NanoSIMS has been used to map trace element distributions in minerals that are zoned at the nanoscale, including datable minerals such as zircon or monazite [100,101].
2.1.8. Atom Probe Tomography (APT)
APT has, until recently, been little applied to ore minerals, despite being around for more than a decade and widely used by material scientists and others to map the spatial distribution of atomic species in three dimensions and at the nanoscale [102]. APT couples chemical sensitivity and three-dimensional capabilities with a spatial resolution near the atomic scale to provide unique information about nanoscale structures. The technique has been demonstrated as a valuable tool to complement SIMS and allow for smallest-scale geochronology (e.g., [103]), to understand nanoscale diffusion within zircon [104,105], and for the examination of homogeneity within geochronological reference materials [106].
Two recent papers have shown the potential that this unique method may have in mineralogy. Weber et al. (2016) [107] used APT to demonstrate a hitherto-unrecognised layering of nanoscale pore structures in barites, which carries implications for the observed reactivity of barite and rapid uptake of Ra. In another APT study, Parman et al. (2015) [108] address natural isoferroplatinum (Pt3Fe), showing potential order-disorder distribution of trace elements. Both these papers highlight the considerable potential of APT as a breakthrough method that may help to resolve outstanding issues that connect structural features (as observed by TEM) with geochemical features. Introducing APT to a mineralogical audience, Parman (2015) [109] notes that the method “forces one to merge mineralogy and geochemistry”, and that APT “should stimulate a range of new discoveries”.
2.1.9. Geochronology Using Ore Minerals
The accurate determination of the timing of mineralization has been a long-standing issue in mineral deposit studies. Effective dating is frequently hampered by a mismatch between those minerals that can be accurately and reliably dated, and those which are abundant in ores and can be petrographically constrained as part of, and therefore contemporaneous with mineralization. Molybdenite Re-Os geochronology [110] has proven an invaluable tool to navigate this impasse, and has been widely applied to the many cases where molybdenite is present within the ore assemblage. More recently, other non-traditional minerals have been shown to have utility in geochronology, notably hematite, which, in some ore systems, readily incorporates U and radiogenic Pb into its crystal structure [111,112,113]. These studies have shown that hematite can be accurately and precisely dated by LA-ICP-MS, sensitive high-resolution ion microprobe (SHRIMP), or isotope dilution thermal ionization mass spectrometry (ID-TIMS). Moreover, hematite (and magnetite) appears remarkably robust and do not undergo extensive metamictization. U-Pb dating of iron-oxides by LA-ICP-MS can provide rapid, reliable results, at a sufficient resolution to be of value in reconnaissance studies.
Geochronological data can also be obtained on several other ore minerals, including columbite-tantalite, rutile, thorite and uraninite by LA-ICP-MS [11]. LA-ICP-MS “age” mapping of radiogenic isotopes by rastering across a selected area of a grain using appropriate reference standards in zircon [114], or hematite [115], as demonstrated in Figure 6. Such methods also have potential for the assessment of homogeneity in minerals with zonation patters relative to U and radiogenic Pb. As mentioned above, the ability to investigate minerals and visualise element and isotope distributions at the nanoscale, using LA-ICP-MS mapping, nanoSIMS, APT, and other techniques, with complementary structural information obtained via EBSD, have highlighted the heterogeneity present in natural samples and the possibility of intra-grain diffusion, as well as the need to ensure that reference standards are as homogeneous as possible.
2.1.10. Non-Traditional Stable Isotopes
The growing interest in in-situ analysis of “traditional” stable isotopes notwithstanding (e.g., sulphur [116], development and wider availability of laser-ablation multi-collector (LA-MC)-ICP-MS instrumentation has catalysed a rapid expansion in analysis of non-traditional stable isotopes, including the isotopes of several elements concentrated within ores and measured in ore minerals. These include iron, nickel, copper, zinc, germanium, selenium, and molybdenum. Several other isotopic systems with potential application to understanding the evolution of ore deposits are rapidly emerging. These include thallium, tellurium, and mercury. Table 1 briefly reviews current research on these isotopes in ores and the topics that are being addressed.
2.2. New Approaches and Sub-Disciplines
The recent advances outlined above have, however, not only been brought about by rapid developments in analytical capability, but also by an evolution in conceptual approaches to ore mineralogy.
2.2.1. Trace Elements in Ore Minerals
Very few minerals are ever “pure”; many can incorporate two dozen or more different elements at measurable and quantifiable concentrations—and furthermore, many minerals can be compositionally zoned. Interest in the content and distribution of minor and trace elements in ore minerals has expanded rapidly for several reasons, driven by analytical capabilities that are highlighted above [154]. Firstly, the precise in-situ measurement of trace element concentrations has direct economic implications since it enables the mineralogical distribution of elements that represent either potential economic by-products [155], or harmful elements in an ore potentially decreasing its value, to be accurately pinpointed. This type of knowledge may directly or indirectly impact upon plant design for mineral processing (e.g., [156]). Secondly, accurate information on the mineral site(s) of potentially process deleterious elements provides data that can assist in management and long-term storage of mining or processing waste. Thirdly, trace element analysis can assist in understanding the genetic history of complex ore deposits. The recognition of distinct generations of a given mineral, or of grain-scale compositional zoning, can, for example, help to track the evolution of hydrothermal fluids, or expose evidence for an overprinting event that has implications for metal distributions within the deposit. Such an understanding can, in turn, underpin metallogenetic models, with direct application to model-based mineral exploration. Lastly, spatial patterns of trace element distribution within specific minerals can be potentially applied in exploration vectoring, offering greater sensitivity than whole-rock analysis (see [13] for a brief review).
2.2.2. The Significance of Gangue Minerals—A Holistic Approach to Ore Deposits
The gangue components of an ore mineral assemblage are increasingly recognised as rich sources of information to support models of ore formation and petrogenesis. Some particularly refractory minerals may, in fact, preserve textural and compositional features that reveal deposit evolution better than many ore minerals. In our laboratory, these have ranged from garnets and other calc-silicate minerals in skarns [157,158], through fluorapatite [35,159,160] and REE-fluorocarbonates [43,161], to alkali and plagioclase feldspars [36,46]. A detailed investigation of hematite, which contributes as much as 80 wt % of the ore at Olympic Dam, has shown how this mineral can encode a wealth of valuable trace element information [162].
This approach has led to the recognition that to adequately understand the distribution of those elements, which are particularly valuable for petrogenetic interpretation, notably REE, or the high field strength elements, a holistic approach is needed, in which all of the minerals, major and minor, in the system are studied as potential hosts. Partitioning among coexisting minerals can impact significantly on geochemical signatures, and changes in partitioning behaviour may itself provide insights into the evolution of mineral deposits. Holistic LA-ICP-MS strategies have also revealed how elements of interest (potential by-products and process deleterious impurities) may partition among coexisting hydrothermal base metal sulphides, for example, between galena, sphalerite, chalcopyrite, and tetrahedrite-tennantite [163,164,165,166]. This type of research has also shown how some gangue minerals can host unexpectedly high concentrations of elements of economic interest; concentration of U, W, Sn and Mo in skarn garnets [158] representing one good example. Several opportunities currently exist to confirm whether significant resources of so-called critical metals occur within new resource types, e.g., gallium in epidotites. These represent exciting research areas in which grain-scale analysis by LA-ICP-MS is expected to play a key role.
We have shown [167] how establishing models of trace element distribution in mineralogically complex ore systems need to acknowledge not only the major sulphide and oxide ore minerals and rock-forming silicates, but also relatively minor phases that can sequester some trace elements at significant concentrations. In the example from Fe-Ti-V ores from the Panzhihua layered intrusive complex, China [167], and, as shown as Figure 7, trace elements are distributed between rock-forming silicates (pyroxene, olivine, feldspar), titanomagnetite (the dominant oxide), and sulphides (pyrrhotite and minor chalcopyrite and cobaltpentlandite). Exsolution of ilmenite and spinel from titanomagnetite has, however, sequestered certain trace elements. Importantly, the high field strength elements (Sc, Zr, Hf, Ta, and Nb) are all markedly enriched in ilmenite relative to titanomagnetite, whereas Zn, Ga, and others, occur preferentially in spinel exsolutions within titanomagnetite.
2.2.3. Solid Solutions and Nanoparticles
The capability to explore smaller and smaller volumes of sample material has opened up exciting opportunities to understand the nature and behaviour of ore minerals at the nanoscale. Visualisation of the nanoscale features of minerals allows for the verification of crystal structures, polytypism and/or polysomatism in mixed-layer compounds, etc. Moreover, atomic-scale microscopy can help address fundamental questions on the nature of sold solution and how minerals adapt to incorporation of trace and minor elements. Nanoscale studies have also confirmed the role played by mineral nanoparticles, the stability and reaction behaviour of which are governed by very different sets of thermodynamic rules compared to their larger counterparts [168,169].
The example in Figure 8 shows hematite from the Olympic Dam orebody. This contains not only nanoparticles of uraninite (U-NPs), but also micron-scale oriented lamellae of REE-fluorocarbonates (bastnäsite-parisite group), which are interpreted to have coarsened up during recrystallization of granitophile (U-W-Sn-Mo-bearing)-rich hematite interacting with fluids via CDR reactions [162]. Such reactions evolve via transient porosity providing sites for mineral deposition, as in this case U-NPs. The source of U is from hematite, which can incorporate up to hundreds of ppm of these “granitophile” elements [162].
Accessibility to the nano- to microscale domain has permitted a better understanding of the critical mechanisms involved in fluid–mineral reaction. Coupled dissolution replacement reaction (CDRR) [170,171,172] is recognised as a widespread phenomenon that is responsible for local-scale mineral transformation in hydrothermal ores. In our work on the Olympic Dam deposit, evidence for CDRR is recorded in feldspars [36,46], uraninite [76,77,173], hematite [162], and REE-fluorocarbonates [43].
2.2.4. New Sub-Disciplines
In the past two decades, a new sub-discipline, geometallurgy, has emerged, in which geology and mineralogy are combined with extractive metallurgy and geostatistics. Geometallurgy enables the derivation of geologically-based predictive models for minerals processing that can assist plant design and promote efficient exploitation of mineral resources (e.g., [174,175,176,177]). Geometallurgy requires an interdisciplinary approach and widespread application of automated mineralogy, expanding traditional ore mineralogy into new spheres of economic relevance. Geometallurgical approaches are increasingly applied to a wide range of different deposit types. Key geometallurgy publications highlighting the importance of ore textures for mineral processing include [178,179,180].
2.3. Discovery of New Minerals
Despite only making up a tiny fraction of the Earth’s crust, mineral deposits have proven to be rich sources for the discovery of new mineral species. In fact, if we include samples from abandoned mines and oxidised ores at the surface associated with historical mine workings, mineral deposits account for roughly half of the new minerals that were accepted between 2011 and 2016. This is perhaps unsurprising as mineral deposits are anomalous in elements that are prone to greater mineralogical diversity [181], and even more importantly, will contain various combinations of those elements. Sulphosalts represent a particularly fertile area of ore mineral research, with more than a dozen new sulphosalt species being approved since the publication of the report of the IMA Commission on Ore Mineralogy Sub-Committee on Sulphosalts [182]. It is also reasonable to expect that many of the predicted >1563 yet-to-be-discovered mineral species [183] will be identified in samples from existing or historical mine sites. Localities such as Tsumeb (Namibia), Långban (Sweden), Lengenbach (Switzerland), Shinkolobwe (Democratic Republic of Congo), and Franklin (NJ, USA) all feature in a listing of the top 10 localities in terms of the number of minerals, for which that locality is registered as the type locality, with 72, 72, 43, 38, and 35 mineral species, respectively [184]. The technological revolution outlined above has accelerated the search for, and characterization of new ore minerals, particularly in cases where the phase in question is only a few microns in size and intergrown with other related phases. For example, FIB-SEM was successfully used to extract tiny samples of the new mineral graţianite for structural study [185].
Hazen et al. (2017) [186] have recently made a convincing case for the acknowledgement, as “anthropogenic minerals”, of compounds that originate from human action. The majority of the 208 species put forward as anthropogenic mineral candidates can be attributed to mining-related activities, and are found within ore dumps, in slags and their weathering products, in mine shafts and adits, and on smelter walls.
3. Challenges—A Short Discussion
Ore mineralogy and ore microscopy remain highly relevant. Underteaching of traditional ore microscopy techniques in the World’s higher education institutions is perhaps a reflection of the relative ease of access to advanced microanalytical instrumentation, which offer the advantage of compositional information. The need for innovative, interdisciplinary approaches in the search for mineral resources to guarantee future security of supply means that not only geologists, but also metallurgists and processing engineers, need to appreciate the pivotal role that is played by ore mineralogy in ensuring the sustainable exploitation of limited resources. Mineral characterisation remains a critical part of any study, so that reliable interpretations can be made based on knowledge of exactly what has been analysed.
Descriptions of ore minerals, new occurrences, and information on mineral textures or paragenesis, remain important, as do compilations of compositional or other types of quantitative data. Ores are by essence ephemeral in character, and once mined, are gone forever. Museums and other national, state, or municipal institutions have a vital role to play in archiving particularly interesting or instructive sample material. Likewise, universities need to ensure that teaching and research collections are maintained to provide students with representative material from typical “run of mine” ore. Reference collections should be assembled in collaboration with the mining companies at the time of mining, and maintained as a resource for future research.
Identifying current frontiers in ore mineralogy is a subjective exercise. Obtaining quantitative compositional data on the smallest particles is one obvious frontier that can be crossed with contemporary instrumentation. The increased focus on smaller and smaller scales of observation, and not infrequently on smaller sample suites due to restricted access, or the high cost and time-consuming nature of the more advanced microanalytical techniques, does, however, generate unease about just how representative the investigated samples are. This may, in turn, impact on the reliability of broad interpretations that are based on empirical observation on only the tiniest fractions of an orebody. Further in the future, the widespread use of automated mineralogical techniques and large microanalytical datasets will likely trigger a new revolution in which machine learning can be expected to play an increasing role.
Many of the techniques and approaches discussed here complement one another and can often be used in combination to achieve in-situ characterisation of the same sample at different observational scales ([23] and references therein). Most methods do, however, have their limitations, in terms of sensitivity, resolution, or less quantifiable factors, such as ill-constrained sources of error, a lack of suitable standard materials, and so on. A comprehensive understanding of mineralogy and geochemistry—and increasingly, a working knowledge of mineral physics and crystallography, is critical.
Re-reading the author’s preface to “The Ore Minerals and their Intergrowths” [1], published nearly 50 years ago at the start of the “microprobe era”, we wonder what Paul Ramdohr (1890–1985) [187] would make of the advances that are summarised here. Some of the points raised, such as the impact of solid solutions and lattice defects on optical properties, are now far better understood and quantified. Ramdohr notes “The variation which a mineral as ‘trivial’ as pyrite can exhibit is simply baffling”, a point that can be readily responded to in the light of a half-century of studies of trace element distributions, deformation mechanisms, and lattice-scale phenomena that have shown pyrite to be among the most complex and intriguing among ore minerals—a host for “invisible gold”, stable in an extraordinary range of environments and increasingly viewed as a valuable indicator of ore formation processes. Several hundred new ore minerals have been discovered since the publication of “The Ore Minerals and their Intergrowths”, yet the basic principle that ore minerals are best studied in the context of their associations is as true today as it was then. Likewise, only high-quality sample preparation can reveal the intricacies and beauty of ore minerals.
The new data that is presented here represent a glimpse into the characterisation of ore minerals that can shed new light on processes of ore formation. Recognition and measurement of minerals, and their characteristics at the nanoscale can explain features seen at the microscale (e.g., petrographic microscope), macroscale (in drillcore or underground), or are mappable at the deposit-scale. Moreover, mechanisms of alteration and mineralization can often only be correctly understood if evidence at the nanoscale is considered. In the case of complex, enigmatic IOCG systems, such as the 10,000 Mt Olympic Dam deposit, observations that can bridge scales of observation from nanometres to hundreds of metres are contributing to a working understanding of how giant ore systems formed and developed.
4. Conclusions
The diversity of current research on ore minerals is remarkable and only a few topics could be mentioned here without making this text excessive. The breadth of advances made possible by the availability of microanalytical techniques with ever-improving sensitivity and spatial resolution, opens many new approaches to resolve long-standing gaps in knowledge. Changing demand patterns that are driving the very nature of which phases can be defined as ore minerals, a blurring of traditional research domains of mineralogy, geochemistry and even materials science, and the ever-increasing complexity of all minerals as they are studied at smaller and smaller scales, has dramatically changed ore mineralogy during the last 20 years.
Acknowledgments
The support of BHP Olympic Dam and the IMA Commission on Ore Mineralogy is gratefully acknowledged. N.J.C. acknowledges the ARC Research Hub for Australian Copper–Uranium and CLC acknowledges the “FOX” project (Trace Elements in Iron Oxides), supported by BHP Olympic Dam and the South Australian Mining and Petroleum Services Centre of Excellence. The assistance of Ben Wade, Sarah Gilbert and Animesh Basak (Adelaide Microscopy) with microanalytical development is deeply appreciated. Constructive comments from three anonymous Minerals reviewers assisted with expression of our ideas.
Author Contributions
N.J.C. conceived this contribution and wrote the article assisted by C.L.C. and all other co-authors. K.E. supplied Olympic Dam samples used in supporting images and much advice. A.S. assisted with HAADF STEM operation (Figure 2, Figure 3, Figure 4 and Figure 5 and Figure 8). M.R.V.-I., L.C.-D. and W.G. contributed original data. The contribution benefitted from discussion with colleagues and with past and present graduate students and research visitors at The University of Adelaide. Illustrations used in this article are previously unpublished. They were obtained at Adelaide Microscopy, The University of Adelaide, using a FEI Quanta 450 SEM (Figure 1), a Titan Themis S-TEM (Figure 2, Figure 3, Figure 4 and Figure 5 and Figure 8), and a Resonetics M-50-LR 193 nm Excimer laser coupled to an Agilent 7700cx Quadrupole ICP mass spectrometer (Figure 6 and Figure 7). See text and references therein for additional information on analytical set-up and operating conditions.
Conflicts of Interest
The authors declare no conflict of interest.
References
- Ramdohr, P. The Ore Minerals and Their Intergrowths, English translation of the 3rd ed.; Pergamon Press: Oxford, UK, 1969; p. 1174. [Google Scholar]
- Picot, P.; Johan, Z.; Watkinson, D.H. Atlas of Ore Minerals; Elsevier: Amsterdam, The Netherlands, 1982. [Google Scholar]
- Craig, J.R.; Vaughan, D.J. Ore Microscopy and Ore Petrography, 2nd ed.; Wiley-Interscience: New York, NY, USA, 1994; p. 368. [Google Scholar]
- Vaughan, D.J.; Corkhill, C.L. Mineralogy of sulfides. Elements 2017, 13, 81–87. [Google Scholar] [CrossRef]
- McCuaig, T.C.; Vann, J.E.; Sykes, J.P. Mines versus Mineralisation—Deposit Quality, Mineral Exploration Strategy and the Role of ‘Boundary Spanners’. In Proceedings of the 9th International Mining Geology Conference, Adelaide, Australia, 18–20 August 2014; pp. 33–41. [Google Scholar]
- Gunn, G. (Ed.) Critical Metals Handbook; American Geophysical Union: Washington, DC, USA, 2014; 454p. [Google Scholar]
- Roedder, E. Fluid inclusions. Rev. Mineral. 1984, 12, 646. [Google Scholar]
- Ohmoto, H. Stable isotope geochemistry of ore deposits. Rev. Mineral. 1986, 16, 491–559. [Google Scholar]
- Sylvester, P. Laser Ablation ICP-MS in the Earth Sciences: Current Practices and Outstanding Issues; Mineralogical Association of Canada: Québec, QC, Canada, 2008; Volume 40. [Google Scholar]
- Sylvester, P.J.; Jackson, S.E. A Brief History of Laser Ablation Inductively Coupled Plasma Mass Spectrometry (LA–ICP–MS). Elements 2016, 12, 307–310. [Google Scholar] [CrossRef]
- Woodhead, J.D.; Horstwood, M.S.A.; Cottle, J.M. Advances in Isotope Ratio Determination by LA–ICP–MS. Elements 2016, 12, 317–322. [Google Scholar] [CrossRef]
- Wagner, T.; Fusswinkel, T.; Wälle, M.; Heinrich, C.A. Microanalysis of Fluid Inclusions in Crustal Hydrothermal Systems using Laser Ablation Methods. Elements 2016, 12, 323–328. [Google Scholar] [CrossRef]
- Cook, N.J.; Ciobanu, C.L.; George, L.; Zhu, Z.-Y.; Wade, B.; Ehrig, K. Trace Element Analysis of Minerals in Magmatic-Hydrothermal Ores by Laser Ablation Inductively-Coupled Plasma Mass Spectrometry: Approaches and Opportunities. Minerals 2016, 6, 111. [Google Scholar] [CrossRef]
- Woodhead, J.; Hergt, J.; Meffre, S.; Large, R.R.; Danyushevsky, L.; Gilbert, S. In situ Pb-isotope analysis of pyrite by laser ablation (multi-collector and quadrupole) ICPMS. Chem. Geol. 2009, 262, 344–354. [Google Scholar] [CrossRef]
- Darling, J.R.; Storey, C.D.; Hawkesworth, C.J.; Lightfoot, P.C. In-situ Pb isotope analysis of Fe–Ni–Cu sulphides by laser ablation multi-collector ICPMS: New insights into ore formation in the Sudbury impact melt sheet. Geochim. Cosmochim. Acta 2012, 99, 1–17. [Google Scholar] [CrossRef]
- Gilbert, S.E.; Danyushevsky, L.V.; Rodemann, T.; Shimizu, N.; Gurenko, A.; Meffre, S.; Thomas, H.; Large, R.R.; Death, D. Optimisation of laser parameters for the analysis of sulphur isotopes in sulphide minerals by laser ablation ICP-MS. J. Anal. At. Spectrom. 2014, 29, 1042–1051. [Google Scholar] [CrossRef]
- McFarlane, C.R.M.; Soltani Dehnavi, A.; Lentz, D. Pb-Isotopic Study of Galena by LA-Q-ICP-MS: Testing a New Methodology with Applications to Base-Metal Sulphide Deposits. Minerals 2016, 6, 96. [Google Scholar] [CrossRef]
- Zhu, Z.Y.; Yang, T.; Ciobanu, C.L.; Cook, N.J.; Zhao, K.D.; Jiang, S.Y. Mapping of S isotopes and trace elements in sulfides by LA-(MC)-ICP-MS: Potential problems and implications. Minerals 2016, 6, 110. [Google Scholar] [CrossRef]
- Zhu, Z.Y.; Jiang, S.Y.; Yang, T.; Ciobanu, C.L.; Cook, N.J. Sulfur isotope fractionation in pyrite during laser ablation: Implications for laser ablation multiple collector inductively coupled plasma mass spectrometry mapping. Chem. Geol. 2017, 450, 223–234. [Google Scholar] [CrossRef]
- Heaney, P.J.; Vicenzi, E.P.; Giannuzzi, L.A.; Livi, K.J.T. Focused ion beam milling: A method of site-specific sample extraction for microanalysis of Earth and planetary materials. Am. Mineral. 2001, 86, 1094–1099. [Google Scholar] [CrossRef]
- Wirth, R. Focused Ion Beam (FIB) combined with SEM and TEM: Advanced analytical tools for studies of chemical composition, microstructure and crystal structure in geomaterials on a nanometre scale. Chem. Geol. 2009, 261, 217–229. [Google Scholar] [CrossRef]
- Ciobanu, C.L.; Cook, N.J.; Utsunomiya, S.; Pring, A.; Green, L. Focussed ion beam–transmission electron microscopy applications in ore mineralogy: Bridging micro- and nanoscale observations. Ore Geol. Rev. 2011, 42, 6–31. [Google Scholar] [CrossRef]
- Ciobanu, C.L.; Cook, N.J.; Maunders, C.; Wade, B.P.; Ehrig, K. Focused Ion Beam and Advanced Electron Microscopy for Minerals: Insights and Outlook from Bismuth Sulphosalts. Minerals 2016, 6, 112. [Google Scholar] [CrossRef]
- Ciobanu, C.L.; Pring, A.; Cook, N.J.; Self, P.; Jefferson, D.; Dima, G.; Melnikov, V. Chemical-structural modularity in the tetradymite group: A HRTEM study. Am. Mineral. 2009, 94, 517–534. [Google Scholar] [CrossRef]
- Ciobanu, C.L.; Birch, W.D.; Cook, N.J.; Pring, A.; Grundler, P.V. Petrogenetic significance of Au-Bi-Te-S associations: The example of Maldon, Central Victorian gold province, Australia. Lithos 2010, 116, 1–17. [Google Scholar] [CrossRef]
- Ciobanu, C.L.; Cook, N.J.; Utsunomiya, S.; Kogagwa, M.; Green, L.; Gilbert, S.; Wade, B. Gold-telluride nanoparticles revealed in arsenic-free pyrite. Am. Mineral. 2012, 97, 1515–1518. [Google Scholar] [CrossRef]
- Ciobanu, C.L.; Cook, N.J.; Ehrig, K. Ore minerals down to the nanoscale: Cu-(Fe)-sulphides from the Iron Oxide Copper Gold deposit at Olympic Dam, South Australia. Ore Geol. Rev. 2017, 81, 1218–1235. [Google Scholar] [CrossRef]
- Wirth, R.; Reid, D.; Schreiber, A. Nanometer-sized platinum-group minerals (PGM) in base metal sulfides: New evidence for an orthomagmatic origin of the Merensky Reef PGE ore deposit, bushveld complex, South Africa. Can. Mineral. 2013, 51, 143–155. [Google Scholar] [CrossRef]
- Junge, M.; Wirth, R.; Oberthür, T.; Melcher, F. Mineralogical siting of platinum-group elements in pentlandite from the Bushveld Complex, South Africa. Miner. Depos. 2015, 50, 41–54. [Google Scholar] [CrossRef]
- Harries, D.; Pollok, K.; Langenhorst, F. Translation interface modulation in NC-pyrrhotites: Direct imaging by TEM and a model toward understanding partially disordered structural states. Am. Mineral. 2011, 96, 716–731. [Google Scholar] [CrossRef]
- Harries, D.; Pollok, K.; Langenhorst, F. Oxidative dissolution of 4C- and NC-pyrrhotite: Intrinsic reactivity differences, pH dependence, and the effect of anisotropy. Geochim. Cosmochim. Acta 2013, 102, 23–44. [Google Scholar] [CrossRef]
- Reith, F.; Fairbrother, L.; Nolze, G.; Wilhelmi, O.; Clode, P.L.; Gregg, A.; Parsons, J.E.; Wakelin, S.A.; Pring, A.; Hough, R.; et al. Nanoparticle factories: Biofilms hold the key to gold dispersion and nugget formation. Geology 2010, 38, 843–846. [Google Scholar] [CrossRef]
- Shuster, J.; Reith, F.; Cornelis, G.; Parsons, J.E.; Parsons, J.M.; Southam, G. Secondary gold structures: Relics of past biogeochemical transformations and implications for colloidal gold dispersion in subtropical environments. Chem. Geol. 2017, 450, 154–164. [Google Scholar] [CrossRef]
- Liu, Y.; King, H.E.; van Huis, M.A.; Drury, M.R.; Plümper, O. Nano-tomography of porous geological materials using Focused Ion Beam-Scanning Electron Microscopy. Minerals 2016, 6, 104. [Google Scholar] [CrossRef]
- Krneta, S.; Ciobanu, C.L.; Cook, N.J.; Ehrig, K.; Kontonikas-Charos, A. Apatite at Olympic Dam, South Australia: A petrogenetic tool. Lithos 2016, 262, 470–485. [Google Scholar] [CrossRef]
- Kontonikas-Charos, A.; Ciobanu, C.L.; Cook, N.J.; Ehrig, K.; Krneta, S.; Kamenetsky, V.S. Feldspar evolution in the Roxby Downs Granite, host to Fe-oxide Cu-Au-(U) mineralisation at Olympic Dam, South Australia. Ore Geol. Rev. 2017, 80, 838–859. [Google Scholar] [CrossRef]
- Hraško, L.; Kotov, A.B.; Salinikova, E.B.; Kovach, V.P. Enclaves in the Rochovce granite intrusion as indicators of the temperature and origin of the magma. Geol. Carpathica 1998, 49, 125–138. [Google Scholar]
- Nieto, F.; Livi, K.J.T. (Eds.) Minerals at the Nanoscale; EMU Notes in Mineralogy 14; European Mineralogical Union: London, UK, 2013; p. 440. [Google Scholar]
- Cook, N.J.; Ciobanu, C.L.; Wagner, T.; Stanley, C.J. Minerals of the system Bi-Te-Se-S related to the tetradymite archetype: Review of classification and compositional variation. Can. Mineral. 2007, 45, 665–708. [Google Scholar] [CrossRef]
- Feutelais, Y.; Legendre, B.; Rodier, N.; Agafonov, V.A. Study of the phases in the bismuth—Tellurium system. Mater. Res. Bull. 1993, 28, 591–596. [Google Scholar] [CrossRef]
- Balassone, G.; Nieto, F.; Arfè, G.; Boni, M.; Mondillo, N. Zn-clay minerals in the Skorpion Zn nonsulfide deposit (Namibia): Identification and genetic clues revealed by HRTEM and AEM study. Appl. Clay Sci. 2017, 150, 309–322. [Google Scholar] [CrossRef]
- Mondillo, N.; Nieto, F.; Balassone, G. Micro- and nano-characterization of Zn-clays in nonsulfide supergene ores of southern Peru. Am. Mineral. 2015, 100, 2484–2496. [Google Scholar] [CrossRef]
- Ciobanu, C.L.; Kontonikas-Charos, A.; Slattery, A.; Cook, N.J.; Ehrig, K.; Wade, B.P. Short-range stacking disorder in mixed-layer compounds: A HAADF STEM study of bastnäsite-parisite intergrowths. Minerals 2017, 7, 227. [Google Scholar] [CrossRef]
- Xu, H.; Shen, Z.; Konishi, H. Si-magnetite nano-precipitates in silician magnetite from banded iron formation: Z-contrast imaging and ab initio study. Am. Mineral. 2014, 99, 2196–2202. [Google Scholar] [CrossRef]
- Utsunomiya, S.; Kogawa, M.; Kamiishi, E.; Ewing, R.C. Scanning Transmission Electron Microscopy and Related Techniques for Research on Actinide and Radionuclide Nanomaterials. In Actinide Nanoparticle Research; Kalmykov, S.N., Denecke, M.A., Eds.; Springer-Verlag: Berlin/Heidelberg, Germany, 2011; pp. 33–62. [Google Scholar]
- Kontonikas-Charos, A.; Ciobanu, C.L.; Cook, N.J.; Ehrig, K.; Ismail, R.; Krneta, S.; Basak, A. Feldspar mineralogy and rare earth element (re)mobilization in iron-oxide copper gold systems from South Australia: A nanoscale study. Mineral. Mag. 2017, in press. [Google Scholar] [CrossRef]
- Barton, M.D. Iron oxide (-Cu-Au-REE-P-Ag-U-Co) systems. In Treatise on Geochemistry, 2nd ed.; Elsevier: Amsterdam, The Netherlands, 2014; Volume 13, pp. 515–541. [Google Scholar]
- Apukhtina, O.B.; Kamenetsky, V.S.; Ehrig, K.; Kamenetsky, M.B.; Maas, R.; Thompson, J.; McPhie, J.; Ciobanu, C.L.; Cook, N.J. Early, deep magnetite-fluorapatite mineralization at the Olympic Dam Cu-U-Au-Ag deposit, South Australia. Econ. Geol. 2017, 112, 1531–1542. [Google Scholar] [CrossRef]
- Knipping, J.L.; Bilenker, L.D.; Simon, A.C.; Reich, M.; Barra, F.; Deditius, A.P.; Lundstrom, C.; Bindeman, I.; Munizaga, R. Giant Kiruna-type deposits form by efficient flotation of magmatic magnetite suspensions. Geology 2015, 43, 591–594. [Google Scholar] [CrossRef]
- Prior, D.J.; Boyle, A.P.; Brenker, F.; Cheadle, M.C.; Day, A.; Lopez, G.; Potts, G.J.; Reddy, S.M.; Spiess, R.; Trimby, P.W.; et al. The application of electron backscatter diffraction and orientation contrast imaging in the SEM to textural problems in rocks. Am. Mineral. 1999, 84, 1741–1759. [Google Scholar] [CrossRef]
- Prior, D.J.; Mariani, E.; Wheeler, J. EBSD in the earth sciences: Applications, common practice, and challenges. In Electron Backscatter Diffraction in Materials Science; Springer: Berlin/Heidelberg, Germany, 2009; pp. 345–360. [Google Scholar]
- Wilkinson, A.J.; Britton, B. Strains, planes, and EBSD in materials science. Mater. Today 2012, 15, 366–376. [Google Scholar] [CrossRef]
- Boyle, A.P.; Prior, D.J.; Banham, M.H.; Timms, N.E. Plastic deformation of metamorphic pyrite: New evidence from electron-backscatter diffraction and forescatter orientation-contrast imaging. Miner. Depos. 1998, 34, 71–81. [Google Scholar] [CrossRef]
- Freitag, K.; Boyle, A.P.; Nelson, E.; Hitzman, M.; Churchill, J.; Lopez-Pedrosa, M. The use of electron backscatter diffraction and orientation contrast imaging as tools for sulphide textural studies: Example from the Greens Creek deposit (Alaska). Miner. Depos. 2004, 39, 103. [Google Scholar]
- Barrie, C.D.; Boyle, A.P.; Prior, D.J. An analysis of the microstructures developed in experimentally deformed polycrystalline pyrite and minor sulphide phases using electron backscatter diffraction. J. Struct. Geol. 2007, 29, 1494–1511. [Google Scholar] [CrossRef]
- Barrie, C.D.; Boyle, A.P.; Salter, M. How low can you go?—Extending downwards the limits of plastic deformation in pyrite. Mineral. Mag. 2009, 73, 895–913. [Google Scholar] [CrossRef]
- Barrie, C.D.; Boyle, A.P.; Cox, S.F.; Prior, D.J. Slip systems and critical resolved shear stress in pyrite: An electron backscatter diffraction (EBSD) investigation. Mineral. Mag. 2009, 72, 1181–1199. [Google Scholar] [CrossRef]
- Barrie, C.D.; Boyle, A.P.; Cook, N.J.; Prior, D.J. Pyrite deformation textures in the massive sulfide ore deposits of the Norwegian Caledonides. Tectonophysics 2010, 483, 269–286. [Google Scholar] [CrossRef]
- Barrie, C.D.; Cook, N.J.; Boyle, A.P. Textural variation in the pyrite-rich ore deposits of the Røros district, Trondheim Region, Norway: Implications for pyrite deformation mechanisms. Miner. Depos. 2010, 45, 51–68. [Google Scholar] [CrossRef]
- Barrie, C.D.; Pearce, M.A.; Boyle, A.P. Reconstructing the pyrite deformation mechanism map. Ore Geol. Rev. 2011, 39, 265–276. [Google Scholar] [CrossRef]
- Ohfuji, H.; Boyle, A.P.; Prior, D.J.; Rickard, D. Structure of framboidal pyrite: An electron backscatter diffraction study. Am. Mineral. 2005, 90, 1693–1704. [Google Scholar] [CrossRef]
- Barrie, C.D.; Boyce, A.J.; Boyle, A.P.; Williams, P.J.; Blake, K.; Ogawara, T.; Akai, J.; Prior, D.J. Growth controls in colloform pyrite. Am. Mineral. 2009, 94, 415–429. [Google Scholar] [CrossRef]
- Gao, S.; Huang, F.; Gu, X.; Chen, Z.; Xing, M.; Li, Y. Research on the growth orientation of pyrite grains in the colloform textures in Baiyunpu Pb–Zn polymetallic deposit, Hunan, China. Mineral. Petrol. 2017, 111, 69–79. [Google Scholar] [CrossRef]
- Reddy, S.M.; Hough, R.M. Microstructural evolution and trace element mobility in Witwatersrand pyrite. Contrib. Mineral. Petrol. 2013, 166, 1269–1284. [Google Scholar] [CrossRef]
- Feinberg, J.M.; Wenk, H.-R.; Renne, P.R.; Scott, G.R. Epitaxial relationships of clinopyroxene-hosted magnetite determined using electron backscatter diffraction (EBSD) technique. Am. Mineral. 2004, 89, 462–466. [Google Scholar] [CrossRef]
- Mamtani, M.A.; Piazolo, S.; Greiling, R.O.; Kontny, A.; Hrouda, F. Process of magnetite fabric development during granite deformation. Earth Plan. Sci. Lett. 2011, 308, 77–89. [Google Scholar] [CrossRef]
- Franke, C.; Pennock, G.M.; Drury, M.R.; Engelmann, R.; Lattard, D.; Garming, J.F.L.; von Dobeneck, T.; Dekkers, M.J. Identification of magnetic Fe-Ti oxides in marine sediments by electron backscatter diffraction in scanning electron microscopy. Geophys. J. Int. 2007, 170, 545–555. [Google Scholar] [CrossRef]
- Barbosa, P.F.; Lagoeiro, L. Crystallographic texture of the magnetite-hematite transformation: Evidence for topotactic relationships in natural samples from Quadrilátero Ferrífero, Brazil. Am. Mineral. 2010, 95, 118–125. [Google Scholar] [CrossRef]
- Rosière, C.A.; Garcia, O.L.; Siemes, H.; Schaeben, H. Domainal fabrics of hematite in schistose, shear zone-hosted high-grade Fe ores: The product of the interplay between deformation and mineralization. J. Struct. Geol. 2013, 55, 150–166. [Google Scholar] [CrossRef]
- Till, J.L.; Moskowitz, B.M. Deformation microstructures and magnetite texture development in synthetic shear zones. Tectonophysics 2014, 629, 211–223. [Google Scholar] [CrossRef]
- Vukmanovic, Z.; Reddy, S.M.; Godel, B.; Barnes, S.J.; Fiorentini, M.L.; Barnes, S.-J.; Kilburn, M.R. Relationship between microstructures and grain-scale trace element distribution in komatiite-hosted magmatic sulphide ores. Lithos 2014, 184–187, 42–61. [Google Scholar] [CrossRef]
- Huberty, J.M.; Kita, N.T.; Kozdon, R.; Heck, P.R.; Fournelle, J.H.; Spicuzza, M.J.; Xu, H.; Valley, J.W. Crystal orientation effects in δ18O for magnetite and hematite by SIMS. Chem. Geol. 2010, 276, 269–283. [Google Scholar] [CrossRef]
- Taylor, R.; Clark, C.; Reddy, S.M. The effect of grain orientation on secondary ion mass spectrometry (SIMS) analysis of rutile. Chem. Geol. 2012, 300–301, 81–87. [Google Scholar] [CrossRef]
- Carr, P.A.; Norman, M.D.; Bennett, V.C. Assessment of crystallographic orientation effects on secondary ion mass spectrometry (SIMS) analysis of cassiterite. Chem. Geol. 2017, 467, 122–133. [Google Scholar] [CrossRef]
- West, G.D.; Thompson, R.C. Combined EBSD/EDS tomography in a dual-beam FIB/FEG–SEM. J. Microsc. 2009, 233, 442–450. [Google Scholar] [CrossRef] [PubMed]
- Macmillan, E.; Ciobanu, C.L.; Ehrig, K.; Cook, N.J.; Pring, A. Chemical zoning and lattice distortion: Uraninite from Olympic Dam, South Australia. Am. Mineral. 2016, 101, 2351–2354. [Google Scholar] [CrossRef]
- Macmillan, E.; Ciobanu, C.L.; Ehrig, K.; Cook, N.J.; Pring, A. Replacement of uraninite by bornite via coupled dissolution-reprecipitation: Evidence from texture and microstructure. Can. Mineral. 2016, 54, 1369–1383. [Google Scholar] [CrossRef]
- Ryan, C.; Kirkham, R.; Hough, R.; Moorhead, G.; Siddons, D.; De Jonge, M.; Paterson, D.; De Geronimo, G.; Howard, D.; Cleverley, J. Elemental X-ray imaging using the Maia detector array: The benefits and challenges of large solid-angle. Nucl. Instrum. Methods Phys. Res. Sect. A 2010, 619, 37–43. [Google Scholar] [CrossRef]
- Ryan, C.G.; Siddons, D.P.; Kirkham, R.; Li, Z.Y.; de Jonge, M.D.; Paterson, D.; Cleverley, J.S.; Kuczewski, A.; Dunn, P.A.; Jensen, M.; et al. The Maia detector array and X-ray fluorescence imaging system: Locating rare precious metal phases in complex samples. In Proceedings of the SPIE 8851, X-ray Nanoimaging: X-ray Nanoimaging: Instruments and Methods, San Diego, CA, USA, 25–29 August 2013. [Google Scholar] [CrossRef]
- Ryan, C.J.; Ryan, C.; Siddons, D.; Kirkham, R.; Dunn, P.; Kuczewski, A.; Moorhead, G.; De Geronimo, G.; Paterson, D.; de Jonge, M.; et al. The New Maia Detector System: Methods for High Definition Trace Element Imaging Of Natural Material. In Proceedings of the International Conference on X-ray Optics and Microanalysis, Karlsruhe, Germany, 15–18 September 2009; Volume 1221, pp. 9–17. [Google Scholar]
- Ryan, C.; Siddons, D.; Kirkham, R.; Li, Z.; de Jonge, M.; Paterson, D.; Kuczewski, A.; Howard, D.; Dunn, P.; Falkenberg, G. MAIA X-ray fluorescence imaging: Capturing detail in complex natural samples. J. Phys. Conf. Ser. 2014, 499, 12002. [Google Scholar] [CrossRef]
- Barnes, S.; Godel, B.; Locmelis, M.; Fiorentini, M.; Ryan, C. Extremely Ni-rich Fe-Ni sulfide assemblages in komatiitic dunite at Betheno, Western Australia: Results from synchrotron X-ray fluorescence mapping. Aust. J. Earth Sci. 2011, 58, 691–709. [Google Scholar] [CrossRef]
- Fisher, L.; Fougerouse, D.; Cleverley, J.; Ryan, C.; Micklethwaite, S.; Halfpenny, A.; Hough, R.; Gee, M.; Paterson, D.; Howard, D.; et al. Quantified, multi-scale X-ray fluorescence element mapping using the Maia detector array: Application to mineral deposit studies. Miner. Depos. 2014, 50, 665–674. [Google Scholar] [CrossRef]
- Li, K.; Etschmann, B.; Rae, N.; Reith, F.; Ryan, C.G.; Kirkham, R.; Howard, D.; Rosa, D.R.N.; Zammit, C.; Pring, A.; et al. Ore Petrography Using Megapixel X-Ray Imaging: Rapid Insights into Element Distribution and Mobilization in Complex Pt and U-Ge-Cu Ores. Econ. Geol. 2016, 111, 487–501. [Google Scholar] [CrossRef]
- Cook, N.J.; Ciobanu, C.L.; Brugger, J.; Etschmann, B.; Howard, D.J.; de Jonge, M.; Ryan, C.G.; Paterson, D. Determination of the oxidation state of Cu in substituted Cu-In-Fe-bearing sphalerite via μ-XANES spectroscopy. Am. Mineral. 2012, 97, 476–479. [Google Scholar] [CrossRef]
- Cook, N.J.; Etschmann, B.; Ciobanu, C.L.; Geraki, K.; Howard, D.L.; Williams, T.; Rae, N.; Pring, A.; Chen, G.; Johannessen, B.; et al. Distribution and substitution mechanism of Ge in a Ge-(Fe)-bearing sphalerite. Minerals 2015, 5, 117–132. [Google Scholar] [CrossRef]
- Bonnet, J.; Cauzid, J.; Testemale, D.; Kieffer, I.; Proux, O.; Lecomte, A.; Bailly, L. Characterization of germanium speciation in sphalerite (ZnS) from Central and Eastern Tennessee, USA, by X-ray absorption spectroscopy. Minerals 2017, 7, 79. [Google Scholar] [CrossRef]
- Frandrich, R.; Gu, Y.; Burrows, D.; Moeller, K. Modern SEM-based mineral liberation analysis. Int. J. Miner. Process. 2007, 84, 310–320. [Google Scholar] [CrossRef]
- Goodall, W.R.; Scales, P.J.; Butcher, A.R. The use of QEMSCAN and diagnostic leaching in the characterisation of visible gold. Miner. Eng. 2005, 18, 877–886. [Google Scholar] [CrossRef]
- Goodall, W.R.; Scales, P.J. An overview of the advantages and disadvantages of the determination of gold mineralogy by automated mineralogy. Miner. Eng. 2007, 20, 506–517. [Google Scholar] [CrossRef]
- Gu, Y.; Schouwstra, R.; Rule, C. The value of automated mineralogy. Miner. Eng. 2007, 58, 100–103. [Google Scholar] [CrossRef]
- Ehrig, K.; McPhie, J.; Kamenetsky, V.S. Geology and mineralogical zonation of the Olympic Dam iron oxide Cu-U-Au-Ag deposit, South Australia. In Geology and Genesis of Major Copper Deposits and Districts of the World, a Tribute to Richard Sillitoe; Hedenquist, J.W., Harris, M., Camus, F., Eds.; Society of Economic Geologists: Littleton, CO, USA, 2012; Volume 16, pp. 237–268. [Google Scholar]
- Bachmann, K.; Frenzel, M.; Krause, J.; Gutzmer, J. Advanced identification and quantification of In-bearing minerals by scanning electron microscope-based image analysis. Microsc. Microanal. 2017, 23, 527–537. [Google Scholar] [CrossRef] [PubMed]
- Kilburn, M.R.; Wacey, D. Nanoscale secondary ion mass spectrometry (NanoSIMS) as an analytical tool in the geosciences. In Principles and Practice of Analytical Techniques in Geosciences; Royal Society of Chemistry: London, UK, 2015; pp. 1–34. [Google Scholar]
- Barker, S.L.L.; Hickey, K.A.; Cline, J.S.; Dipple, G.M.; Kilburn, M.; Vaughan, J.R.; Longo, A.A. Uncloaking invisible gold: Use of nanosims to evaluate gold, trace elements, and sulfur isotopes in pyrite from Carlin-type gold deposits. Econ. Geol. 2009, 104, 897–904. [Google Scholar] [CrossRef]
- Fougerouse, D.; Micklethwaite, S.; Halfpenny, A.; Reddy, S.M.; Cliff, J.B.; Martin, L.A.J.; Kilburn, M.; Guagliardo, P.; Ulrich, S. The golden ark: Arsenopyrite crystal plasticity and the retention of gold through high strain and metamorphism. Terra Nova 2016, 28, 181–187. [Google Scholar] [CrossRef]
- Fougerouse, D.; Micklethwaite, S.; Tomkins, A.G.; Mei, Y.; Kilburn, M.; Guagliardo, P.; Fisher, L.A.; Halfpenny, A.; Gee, M.; Paterson, D.; et al. Gold remobilisation and formation of high grade ore shoots driven by dissolution-reprecipitation replacement and Ni substitution into auriferous arsenopyrite. Geochim. Cosmochim. Acta 2016, 178, 143–159. [Google Scholar] [CrossRef]
- Wacey, D.; Kilburn, M.R.; Saunders, M.; Cliff, J.B.; Kong, C.; Liu, A.G.S.C.; Matthews, J.J.; Brasier, M.D. Uncovering framboidal pyrite biogenicity using nano-scale CNorg mapping. Geology 2015, 43, 27–30. [Google Scholar] [CrossRef]
- Rollog, M.; Cook, N.J.; Guagliardo, P.; Kilburn, M.; Ehrig, K.; Ciobanu, C.L. NanoSIMS mapping of 210RN and 226Ra in South Australian copper concentrates. Abstract of Goldschmidt 2017, Paris, France, 13–18 August 2017. [Google Scholar]
- Didier, A.; Bosse, V.; Bouloton, J.; Mostefaoui, S.; Viala, M.; Paquette, J.L.; Devidal, J.L.; Duhamel, R. NanoSIMS mapping and LA-ICP-MS chemical and U-Th-Pb data in monazite from a xenolith enclosed in andesite (Central Slovakia Volcanic Field). Contrib. Mineral. Petrol. 2016, 170, 45. [Google Scholar] [CrossRef]
- Wang, W.; Lin, Y.; Hao, J.; Zhang, J.; Hu, S.; Ni, H. Phosphorus-controlled trace element distribution in zircon revealed by NanoSIMS. Contrib. Mineral. Petrol. 2016, 171, 28. [Google Scholar] [CrossRef]
- Kelly, T.F.; Larson, D.J. Atom Probe Tomography 2012. Ann. Rev. Mater. Res. 2012, 42, 1–31. [Google Scholar] [CrossRef]
- Valley, J.W.; Reinhard, D.A.; Cavosie, A.J.; Ushikubo, T.; Lawrence, D.F.; Larson, D.J.; Kelly, T.F.; Snoeyenbos, D.R.; Strickland, A. Nano-and micro-geochronology in Hadean and Archean zircons by atom-probe tomography and SIMS: New tools for old minerals. Am. Mineral. 2015, 100, 1355–1377. [Google Scholar] [CrossRef]
- Peterman, E.M.; Reddy, S.M.; Saxey, D.W.; Snoeyenbos, D.R.; Rickard, W.D.A.; Fougerouse, D.; Kylander-Clark, A.R.C. Nanogeochronology of discordant zircon measured by atom probe microscopy of Pb-enriched dislocation loops. Sci. Adv. 2016, 2, e1601318. [Google Scholar] [CrossRef] [PubMed]
- Reddy, S.M.; van Riessen, A.; Saxey, D.W.; Johnson, T.E.; Rickard, W.D.A.; Fougerouse, D.; Fischer, S.; Prosa, T.J.; Rice, K.P.; Reinhard, D.A.; et al. Mechanisms of deformation-induced trace element migration in zircon resolved by atom probe and correlative microscopy. Geochim. Cosmochim. Acta 2016, 195, 158–170. [Google Scholar] [CrossRef]
- Piazolo, S.; Belousova, E.; La Fontaine, A.; Corcoran, C.; Cairney, J.M. Trace element homogeneity from micron- to atomic scale: Implication for the suitability of the zircon GJ-1 as a trace element reference material. Chem. Geol. 2017, 456, 10–18. [Google Scholar] [CrossRef]
- Weber, J.; Barthel, J.; Brandt, F.; Klinkenberg, M.; Breuer, U.; Kruth, M.; Bosbach, D. Nano-structural features of barite crystals observed by electron microscopy and atom probe tomography. Chem. Geol. 2016, 424, 51–59. [Google Scholar] [CrossRef]
- Parman, S.W.; Diercks, D.R.; Gorman, B.P.; Cooper, R.F. Atom probe tomography of isoferroplatinum. Am. Mineral. 2015, 100, 852–860. [Google Scholar] [CrossRef]
- Parman, S.W. Highlights and Breakthroughs. Going small: Nanoscale geochronology using atom probe tomography. Am. Mineral. 2015, 100, 1333–1334. [Google Scholar] [CrossRef]
- Stein, H.J.; Markey, R.J.; Morgan, J.W.; Hannah, J.L.; Schersten, A. The remarkable Re-Os chronometer in molybdenite: How and why it works. Terra Nova 2001, 13, 479–486. [Google Scholar] [CrossRef]
- Ciobanu, C.L.; Wade, B.; Cook, N.J.; Schmidt Mumm, A.; Giles, D. Uranium-bearing hematite from the Olympic Dam Cu-U-Au deposit, South Australia; a geochemical tracer and reconnaissance Pb-Pb geochronometer. Precambr. Res. 2013, 238, 129–147. [Google Scholar] [CrossRef]
- Courtney-Davies, L.; Zhu, Z.; Ciobanu, C.L.; Wade, B.P.; Cook, N.J.; Ehrig, K.; Cabral, A.R.; Kennedy, A. Matrix-matched iron-oxide laser ablation ICP-MS U-Pb geochronology using mixed solutions standards. Minerals 2016, 6, 85. [Google Scholar] [CrossRef]
- Courtney-Davies, L.; Ciobanu, C.L.; Tapster, S.; Cook, N.J.; Kennedy, A.; Ehrig, K.; Condon, D.; Wade, B.P.; Gilbert, S.; Verdugo-Ihl, M.; et al. ID-TIMD U-Pb dating of oscillatory zoned U-bearing hematite from the Olympic Dam deposit (South Australia): A glimpse at the mineralization timeframe. Geology 2017. in review. [Google Scholar]
- Chew, D.M.; Petrus, J.A.; Kenny, G.G.; McEvoy, N. Rapid high-resolution U–Pb LA-Q-ICPMS age mapping of zircon. J. Anal. At. Spectrom. 2017, 32, 262–276. [Google Scholar] [CrossRef]
- Courtney-Davies, L.; Ciobanu, C.L.; Cook, N.J.; Verdugo-Ihl, M.; Tapster, S.R.; Condon, D.J.; Kennedy, A.K.; Ehrig, K.; Wade, B.P.; Gilbert, S.E. Oscillatory-zoned hematite: A reliable U-Pb mineral geochronometer. Abstract of Goldschmidt 2017, Paris, France, 13–18 August 2017. [Google Scholar]
- LaFlamme, C.; Martin, L.; Jeon, H.; Reddy, S.M.; Selvaraja, V.; Caruso, S.; Bui, T.H.; Roberts, M.P.; Voute, F.; Hagemann, S.; et al. In situ multiple sulfur isotope analysis by SIMS of pyrite, chalcopyrite, pyrrhotite, and pentlandite to refine magmatic ore genetic models. Chem. Geol. 2016, 444, 1–15. [Google Scholar] [CrossRef]
- Dauphas, N.; John, S.G.; Rouxel, O. Iron isotope systematics. Rev. Mineral. Geochem. 2017, 82, 415–510. [Google Scholar] [CrossRef]
- Rouxel, O.; Shanks, W.C.; Bach, W.; Edwards, K.J. Integrated Fe- and S-isotope study of seafloor hydrothermal vents at East Pacific Rise 9–10° N. Chem. Geol. 2008, 252, 214–227. [Google Scholar] [CrossRef]
- Hofmann, A.; Bekker, A.; Rouxel, O.; Rumble, D.; Master, S. Multiple sulphur and iron isotope composition of detrital pyrite in Archaean sedimentary rocks: A new tool for provenance analysis. Earth Plan. Sci. Lett. 2009, 286, 436–445. [Google Scholar] [CrossRef]
- Syverson, D.D.; Pester, N.J.; Craddock, P.R.; Seyfried, W.E. Fe isotope fractionation during phase separation in the NaCl–H2O system: An experimental study with implications for seafloor hydrothermal vents. Earth Plan. Sci. Lett. 2014, 406, 223–232. [Google Scholar] [CrossRef]
- Nie, N.X.; Dauphas, N.; Greenwood, R.C. Iron and oxygen isotope fractionation during iron UV photo-oxidation: Implications for early earth and mars. Earth Plan. Sci. Lett. 2017, 458, 179–191. [Google Scholar] [CrossRef]
- Zhu, Z.-Y.; Jiang, S.-Y.; Mathur, R.; Cook, N.J.; Yang, T.; Wang, M.; Ma, L.; Ciobanu, C.L. Iron isotope behavior during fluid/rock interaction in K-feldspar alteration zone—A model for pyrite in gold deposits from the Jiaodong Peninsula, East China. Geochim. Cosmochim. Acta 2018, 222, 94–116. [Google Scholar] [CrossRef]
- Elliott, T.; Steele, R.C.J. The Isotope Geochemistry of Ni. Rev. Mineral. Geochem. 2017, 82, 511–542. [Google Scholar] [CrossRef]
- Hofmann, A.; Bekker, A.; Dirks, P.; Gueguen, B.; Rumble, D.; Rouxel, O.J. Comparing orthomagmatic and hydrothermal mineralization models for komatiite-hosted nickel deposits in Zimbabwe using multiple-sulfur iron and nickel isotope data. Miner. Depos. 2014, 49, 75–100. [Google Scholar] [CrossRef]
- Ratié, G.; Quantin, C.; Jouvin, D.; Calmels, D.; Ettler, V.; Sivry, Y.; Cruz Viera, L.; Ponzevera, E.; Garnier, J. Nickel isotope fractionation during laterite Ni ore smelting and refining: Implications for tracing the sources of Ni in smelter-affected soils. Appl. Geochem. 2016, 64, 136–145. [Google Scholar] [CrossRef]
- Moynier, F.; Vance, D.; Fujii, T.; Savage, P. The Isotope Geochemistry of Zinc and Copper. Rev. Mineral. Geochem. 2017, 82, 543–600. [Google Scholar] [CrossRef]
- Larson, P.B.; Maher, K.; Ramos, F.C.; Chang, Z.; Gaspar, M.; Meinert, L.D. Copper isotope ratios in magmatic and hydrothermal ore forming environments. Chem. Geol. 2003, 201, 337–350. [Google Scholar] [CrossRef]
- Mason, T.F.D.; Weiss, D.J.; Chapman, J.B.; Wilkinson, J.J.; Tessalina, S.G.; Spiro, B.; Horstwood, M.S.A.; Spratt, J.; Coles, B.J. Zn and Cu isotopic variability in the Alexandrinka volcanic-hosted massive sulphide (VHMS) ore deposit, Urals, Russia. Chem. Geol. 2005, 221, 170–187. [Google Scholar] [CrossRef]
- Markl, G.; Lahaye, Y.; Schwinn, G. Copper isotopes as monitors of redox processes in hydrothermal mineralization. Geochim. Cosmochim. Acta 2006, 70, 4215–4228. [Google Scholar] [CrossRef]
- Mathur, R.; Titley, S.; Barra, F.; Brantley, S.; Wilson, M.; Phillips, A.; Munizaga, F.; Maksaev, V.; Vervoort, J.; Hart, G. Exploration potential of Cu isotope fractionation in porphyry copper deposits. J. Geochem. Explor. 2009, 102, 1–6. [Google Scholar] [CrossRef]
- Mathur, R.; Dendas, M.; Titley, S.; Phillips, A. Patterns in the copper isotope composition of minerals in porphyry copper deposits in southwestern United States. Econ. Geol. 2010, 105, 1457–1467. [Google Scholar] [CrossRef]
- Wilkinson, J.J.; Weiss, D.J.; Mason, T.F.D.; Coles, B.J. Zinc isotope variation in hydrothermal systems: Preliminary evidence from the Irish Midlands ore field. Econ. Geol. 2005, 110, 583–590. [Google Scholar] [CrossRef]
- Gagnevin, D.; Boyce, A.J.; Barrie, C.D.; Menuge, J.F.; Blakemann, R.J. Zn, Fe and S isotope fractionation in a large hydrothermal system. Geochim. Cosmochim. Acta 2012, 88, 183–198. [Google Scholar] [CrossRef]
- Rouxel, O.; Luais, B. Germanium Isotope Geochemistry. Rev. Mineral. Geochem. 2017, 82, 601–656. [Google Scholar] [CrossRef]
- Escoube, R.; Rouxel, O.J.; Edwards, K.; Glazer, B.; Donard, O. Coupled Ge/Si and Ge isotope ratios as geochemical tracers of seafloor hydrothermal systems: Case studies at Loihi Seamount and East Pacific Rise 9°50′ N. Geochim. Cosmochim. Acta 2015, 167, 93–112. [Google Scholar] [CrossRef]
- Johnson, T.M. A review of mass-dependent fractionation of selenium isotopes and implications for other heavy stable isotopes. Chem. Geol. 2004, 204, 201–214. [Google Scholar] [CrossRef]
- Layton-Matthews, D.; Leybourne, M.I.; Peter, J.M.; Scott, S.D.; Cousens, B.; Eglington, B.M. Multiple sources of selenium in ancient seafloor hydrothermal systems: Compositional Se, S and Pb-isotopic evidence from volcanic-hosted and volcanic-sediment-hosted massive sulphide deposits of the Finlayson Lake District, Yukon, Canada. Geochim. Cosmochim. Acta 2013, 117, 318–331. [Google Scholar] [CrossRef]
- Kendall, B.; Dahl, T.W.; Anbar, A.D. Good Golly, Why Moly? The Stable isotope geochemistry of molybdenum. Rev. Mineral. Geochem. 2017, 82, 683–732. [Google Scholar] [CrossRef]
- Hannah, J.L.; Stein, H.J.; Wieser, M.E.; de Laeter, J.R.; Varner, M.D. Molybdenum isotope variations in molybdenite: Vapor transport and Rayleigh fractionation of Mo. Geology 2007, 35, 703–706. [Google Scholar] [CrossRef]
- Mathur, R.; Brantley, S.; Anbar, A.; Munizaga, F.; Maksaev, V.; Newburry, R.; Vervoort, J.; Hart, G. Variation of Mo isotopes from molybdenite in high-temperature hydrothermal ore deposits. Miner. Depos. 2010, 45, 43–50. [Google Scholar] [CrossRef]
- Breillat, N.; Guerrot, C.; Marcoux, E.; Négrel, P. A new global database of δ98Mo in molybdenites: A literature review and new data. J. Geochem. Explor. 2016, 161, 1–15. [Google Scholar] [CrossRef] [Green Version]
- Fornadel, A.P.; Spry, P.G.; Haghnegahdar, M.A.; Schauble, E.A.; Jackson, S.E.; Mills, S.J. Stable Te isotope fractionation in tellurium-bearing minerals from precious metal hydrothermal ore deposits. Geochim. Cosmochim. Acta 2017, 202, 215–230. [Google Scholar] [CrossRef]
- Blum, J.D.; Johnson, M.W. Recent Developments in Mercury Stable Isotope Analysis. Rev. Mineral. Geochem. 2017, 82, 733–757. [Google Scholar] [CrossRef]
- Smith, C.N.; Kesler, S.E.; Klaue, B.; Blum, J.D. Mercury isotope fractionation in fossil hydrothermal systems. Geology 2005, 33, 825–828. [Google Scholar] [CrossRef]
- Smith, C.N.; Kesler, S.E.; Blum, J.D.; Rytuba, J.J. Isotope geochemistry of mercury in source rocks, mineral deposits and spring deposits of the California Coast Ranges, USA. Earth Plan. Sci. Lett. 2008, 269, 399–407. [Google Scholar] [CrossRef]
- Sonke, J.E.; Schäfer, J.; Chmeleff, J.; Audry, S.; Blanc, G.; Dupré, B. Sedimentary mercury stable isotope records of atmospheric and riverine pollution from two major European heavy metal refineries. Chem. Geol. 2010, 279, 90–100. [Google Scholar] [CrossRef]
- Blum, J.D.; Sherman, L.S.; Johnson, M.W. Mercury isotopes in earth and environmental sciences. Ann. Rev. Earth Plan. Sci. 2014, 42, 249–269. [Google Scholar] [CrossRef]
- Yin, R.; Feng, X.; Hurley, J.P.; Krabbenhoft, D.P.; Lepak, R.F.; Hu, R.; Zhang, Q.; Li, Z.; Bi, X. Mercury isotopes as proxies to identify sources and environmental impacts of mercury in sphalerites. Sci. Rep. 2016, 6, 18686. [Google Scholar] [CrossRef] [PubMed]
- Nielsen, S.G.; Rehkämper, M.; Prytulak, J. Investigation and application of thallium isotope fractionation. Rev. Mineral. Geochem. 2017, 82, 759–798. [Google Scholar] [CrossRef]
- Baker, G.G.A.; Rehkämper, M.; Ihlenfeld, C.; Oates, C.J.; Coggon, R. Thallium isotope variations in an ore-bearing continental igneous setting: Collahuasi Formation, northern Chile. Geochim. Cosmochim. Acta 2010, 74, 4405–4416. [Google Scholar] [CrossRef]
- Coggon, R.M.; Rehkämper, M.; Atteck, C.; Teagle, D.A.H.; Alt, J.C.; Cooper, M.J. Controls on thallium uptake during hydrothermal alteration of the upper ocean crust. Geochim. Cosmochim. Acta 2014, 144, 25–42. [Google Scholar] [CrossRef]
- Hettmann, K.; Marks, M.A.W.; Kreissig, K.; Zack, T.; Wenzel, T.; Rehkämper, M.; Jacob, D.E.; Markl, G. The geochemistry of Tl and its isotopes during magmatic and hydrothermal processes: The peralkaline Ilimaussaq complex, southwest Greenland. Chem. Geol. 2014, 366, 1–13. [Google Scholar] [CrossRef]
- Hettmann, K.; Kreissig, K.; Rehkämper, M.; Wenzel, T.; Mertz-Kraus, R.; Markl, G. Thallium geochemistry in the metamorphic Lengenbach sulfide deposit, Switzerland: Thallium-isotope fractionation in a sulfide melt. Am. Mineral. 2014, 99, 793–803. [Google Scholar] [CrossRef]
- Reich, M.; Large, R.; Deditius, A.P. New advances in trace element geochemistry of ore minerals and accessory phases. Ore Geol. Rev. 2017, 81, 1215–1217. [Google Scholar] [CrossRef]
- Cook, N.J.; Ciobanu, C.L.; Williams, T. The mineralogy and mineral chemistry of indium in sulphide deposits and implications for mineral processing. Hydrometallurgy 2011, 108, 226–228. [Google Scholar] [CrossRef]
- Lane, D.J.; Cook, N.J.; Grano, S.R.; Ehrig, K. Selective leaching of penalty elements from copper concentrates: A review. Miner. Eng. 2016, 98, 110–121. [Google Scholar] [CrossRef]
- Ismail, R.; Ciobanu, C.L.; Cook, N.J.; Teale, G.S.; Giles, D.; Schmidt Mumm, A.; Wade, B. Rare earths and other trace elements in minerals from skarn assemblages, Hillside iron oxide–copper–gold deposit, Yorke Peninsula, South Australia. Lithos 2014, 184–187, 456–477. [Google Scholar] [CrossRef]
- Xu, J.; Ciobanu, C.L.; Cook, N.J.; Zheng, Y.; Sun, X.; Wade, B.P. Skarn formation and trace elements in garnet and associated minerals from Zhibula copper deposit, Gangdese Belt, southern Tibet. Lithos 2016, 262, 213–231. [Google Scholar] [CrossRef]
- Krneta, S.; Ciobanu, C.L.; Cook, N.J.; Ehrig, K.; Kontonikas-Charos, A. Rare earth element behaviour in apatite from the Olympic Dam Cu-U-Au-Ag deposit, South Australia. Minerals 2017, 7, 135. [Google Scholar] [CrossRef]
- Krneta, S.; Cook, N.J.; Ciobanu, C.L.; Ehrig, K.; Kontonikas-Charos, A. The Wirrda Well and Acropolis prospects Gawler Craton, South Australia: Insights into evolving fluid conditions through apatite chemistry. J. Geochem. Explor. 2017, 181, 276–291. [Google Scholar] [CrossRef]
- Schmandt, D.S.; Cook, N.J.; Ehrig, K.; Ciobanu, C.L.; Wade, B.P.; Gilbert, S.; Kamenetsky, V.S. Rare earth element fluorocarbonate minerals from the Olympic Dam Cu-U-Au-Ag deposit, South Australia. Minerals 2017, 7, 202. [Google Scholar] [CrossRef]
- Verdugo-Ihl, M.R.; Ciobanu, C.L.; Cook, N.J.; Ehrig, K.; Courtney-Davies, L.; Gilbert, S. Textures and U-W-Sn-Mo signatures in hematite from the Cu-U-Au-Ag orebody at Olympic Dam, South Australia: Defining the archetype for IOCG deposits. Ore Geol. Rev. 2017, in press. [Google Scholar] [CrossRef]
- George, L.; Cook, N.J.; Ciobanu, C.L.; Wade, B.P. Trace and minor elements in galena: A reconnaissance LA-ICP-MS study. Am. Mineral. 2015, 100, 548–569. [Google Scholar] [CrossRef]
- George, L.L.; Cook, N.J.; Ciobanu, C.L. Partitioning of trace elements in co-crystallized sphalerite–galena–chalcopyrite hydrothermal ores. Ore Geol. Rev. 2016, 77, 97–116. [Google Scholar] [CrossRef]
- George, L.L.; Cook, N.J.; Crowe, B.B.P.; Ciobanu, C.L. Trace elements in hydrothermal chalcopyrite. Mineral. Mag. 2017, in press. [Google Scholar] [CrossRef]
- George, L.L.; Cook, N.J.; Ciobanu, C.L. Minor and trace elements in natural tetrahedrite-tennantite: Effects on element partitioning among base metal sulphides. Minerals 2017, 7, 17. [Google Scholar] [CrossRef]
- Gao, W.; Ciobanu, C.L.; Cook, N.J.; Huang, F.; Mang, L.; Gao, S. Petrography and trace element signatures in silicates and Fe-Ti-oxides from the Lanjiahuoshan deposit, Panzhihua layered intrusion, Southwest China. Lithos 2017, 294–295, 164–183. [Google Scholar] [CrossRef]
- Navrotsky, A. Nanoscale Effects on Thermodynamics and Phase Equilibria in Oxide Systems. ChemPhysChem 2011, 12, 2207–2215. [Google Scholar] [CrossRef] [PubMed]
- Navrotsky, A.; Mazeina, L.; Majzlan, J. Size-Driven Structural and Thermodynamic Complexity in Iron Oxides. Science 2008, 319, 1635–1638. [Google Scholar] [CrossRef] [PubMed]
- Putnis, A. Mineral replacement reactions: From macroscopic observations to microscopic mechanisms. Mineral. Mag. 2002, 66, 689–708. [Google Scholar] [CrossRef]
- Putnis, A. Mineral replacement reactions. Rev. Mineral. Geochem. 2009, 70, 87–124. [Google Scholar] [CrossRef]
- Altree-Williams, A.; Pring, A.; Ngothai, Y.; Brugger, J. Textural and compositional complexities resulting from coupled dissolution-reprecipitation reactions in geomaterials. Earth-Sci. Rev. 2015, 150, 628–651. [Google Scholar] [CrossRef]
- Macmillan, E.; Cook, N.J.; Ehrig, K.; Ciobanu, C.L.; Pring, A. Uraninite from the Olympic Dam IOCG-U-Ag deposit: Linking textural and compositional variation to temporal evolution. Am. Mineral. 2016, 101, 1295–1320. [Google Scholar] [CrossRef]
- Bowell, R.J.; Grogan, J.; Hutton-Ashkenny, M.; Brough, C.; Penman, K.; Sapsford, D.J. Geometallurgy of uranium deposits. Miner. Eng. 2011, 24, 1305–1313. [Google Scholar] [CrossRef]
- Hunt, J.; Berry, R.; Bradshaw, D. Characterising chalcopyrite liberation and flotation potential: Examples from an IOCG deposit. Miner. Eng. 2011, 24, 1271–1276. [Google Scholar] [CrossRef]
- Lotter, N.O.; Kormos, L.J.; Oliveira, J.; Fragomeni, D.; Whiteman, E. Modern Process Mineralogy: Two case studies. Miner. Eng. 2011, 24, 638–650. [Google Scholar] [CrossRef]
- Lund, C.; Lamberg, P. Geometallurgy—A tool for better resource efficiency. Eur. Geol. 2014, 37, 39–43. [Google Scholar]
- Pérez-Barnuevo, L.; Pirard, E.; Castroviejo, R. Automated characterisation of intergrowth textures in mineral particles. A case study. Miner. Eng. 2013, 52, 136–142. [Google Scholar] [CrossRef] [Green Version]
- Lund, C.; Lamberg, P.; Lindberg, T. Development of a geometallurgical framework to quantify mineral textures for process prediction. Miner. Eng. 2015, 82, 61–77. [Google Scholar] [CrossRef]
- Tungpalan, K.; Wightman, E.; Manlapig, E. Relating mineralogical and textural characteristics to flotation behaviour. Minerals Eng. 2015, 82, 136–140. [Google Scholar] [CrossRef]
- Christy, A.G. Causes of anomalous mineralogical diversity in the Periodic Table. Mineral. Mag. 2015, 79, 33–49. [Google Scholar] [CrossRef]
- Moëlo, Y.; Makovicky, E.; Mozgova, N.N.; Jambor, J.L.; Cook, N.J.; Pring, A.; Paar, W.; Nickel, E.H.; Graeser, G.; Karup-Møller, S.; et al. Sulfosalt systematics: A review. Report of the Sulfosalt Sub-committee of the IMA Commission on Ore Mineralogy. Eur. J. Mineral. 2008, 20, 7–46. [Google Scholar] [CrossRef]
- Hazen, R.M.; Hystad, G.; Downs, R.T.; Golden, J.; Pires, A.J.; Grew, E.S. Earth’s “missing” minerals. Am. Mineral. 2015, 100, 2344–2347. [Google Scholar] [CrossRef]
- Mindat.org. Most Prolific Type Localities. 2017. Available online: https://www.mindat.org/toptypelocs.php (accessed on 24 October 2017).
- Ciobanu, C.L.; Brugger, J.; Cook, N.J.; Mills, S.J.; Elliott, P.; Damian, G.; Damian, F. Graţianite, MnBi2S4, a new mineral from the Bǎiţa Bihor skarn, Romania. Am. Mineral. 2014, 99, 1163–1170. [Google Scholar] [CrossRef]
- Hazen, R.M.; Grew, E.S.; Origlieri, M.J.; Downs, R.T. On the mineralogy of the “Anthropocene Epoch”. Am. Mineral. 2017, 102, 595–611. [Google Scholar] [CrossRef]
- Schreyer, W. Memorial of Paul Ramdohr, January 1, 1890–March 8, 1985. Am. Mineral. 1986, 71, 839–840. [Google Scholar]
Figure 1.
Back-scatter electron (BSE) image of compositionally-zoned hematite (Olympic Dam, South Australia). Brighter bands are enriched in U, W, Mo, and Sn relative to darker bands. Note also sub-microscopic inclusions of uraninite (tiny white spots) along band margins.
Figure 1.
Back-scatter electron (BSE) image of compositionally-zoned hematite (Olympic Dam, South Australia). Brighter bands are enriched in U, W, Mo, and Sn relative to darker bands. Note also sub-microscopic inclusions of uraninite (tiny white spots) along band margins.
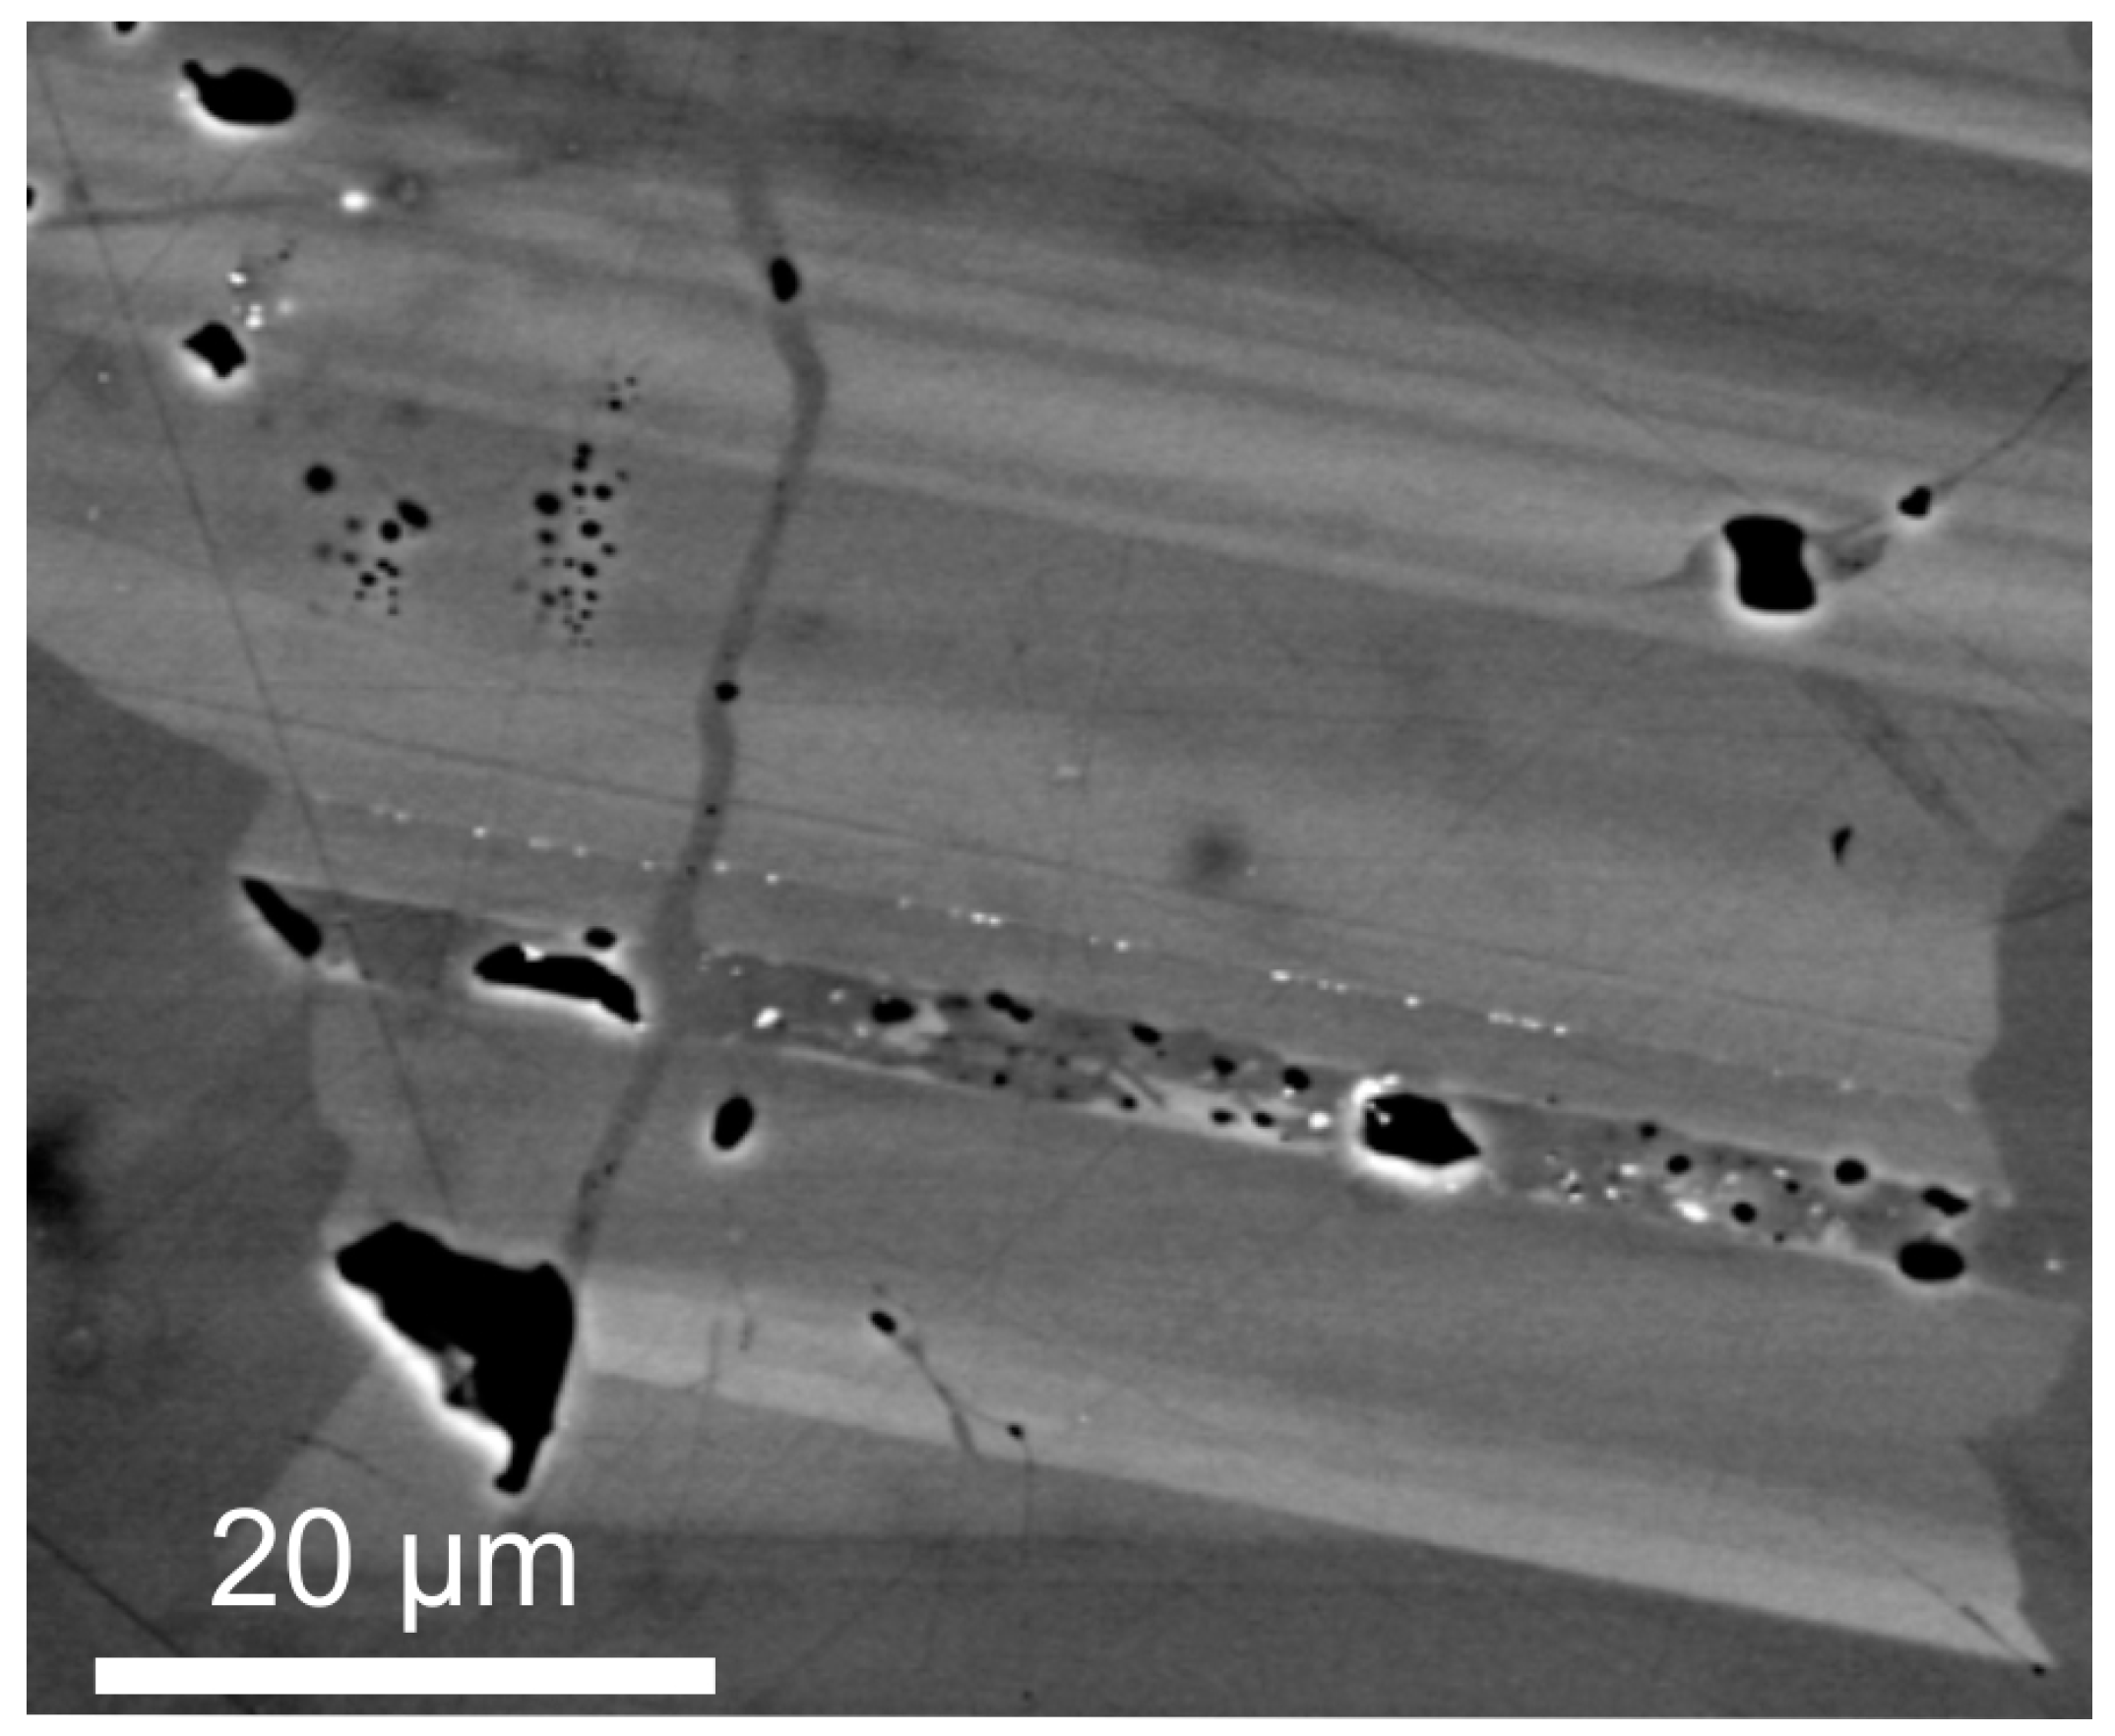
Figure 2.
(a) Secondary electron (SE) image of a FIB-SEM-prepared TEM foil consisting of magnetite with dense fields of sub-μm-scale, binary inclusions of ilmenite and hercynite. Ilmenite is also present as trellis-like exsolution (darker grey). Note that colour on the SE image is not indicative of the average atomic mass of the mineral species and their identification requires dedicated nanoscale analysis; (b) HAADF STEM image of one of the larger composite inclusions and transmission electron microscope—energy-dispersive X-ray spectrometry (EDS) element maps of Fe, O, Ti and Al clearly showing two components (ilmenite and hercynite). Image and map obtained on a Titan Themis S-TEM instrument operated at 200 kV.

Figure 3.
(a) High-resolution HAADF STEM image of tellurobismuthite, Bi2Te3; and (b) simulated crystal structure viewed down the (1–10) axis (.cif file from American Mineralogist Crystallographic Database; Feutelais et al., 1993 [40]). Note the match between the marked atoms, i.e., Bi—brighter and Te—darker; in (a) with the structure in (b). Dashed line shows the size of the unit cell. The three layer-subunits containing the characteristic atom array for tellurobismuthite, Te-Bi-Te-Bi-Te, are separated by darker lines corresponding to Van der Waals gaps. Image obtained on a Titan Themis TEM instrument operated at 200 kV. Sample from the Clogau gold deposit, U.K.
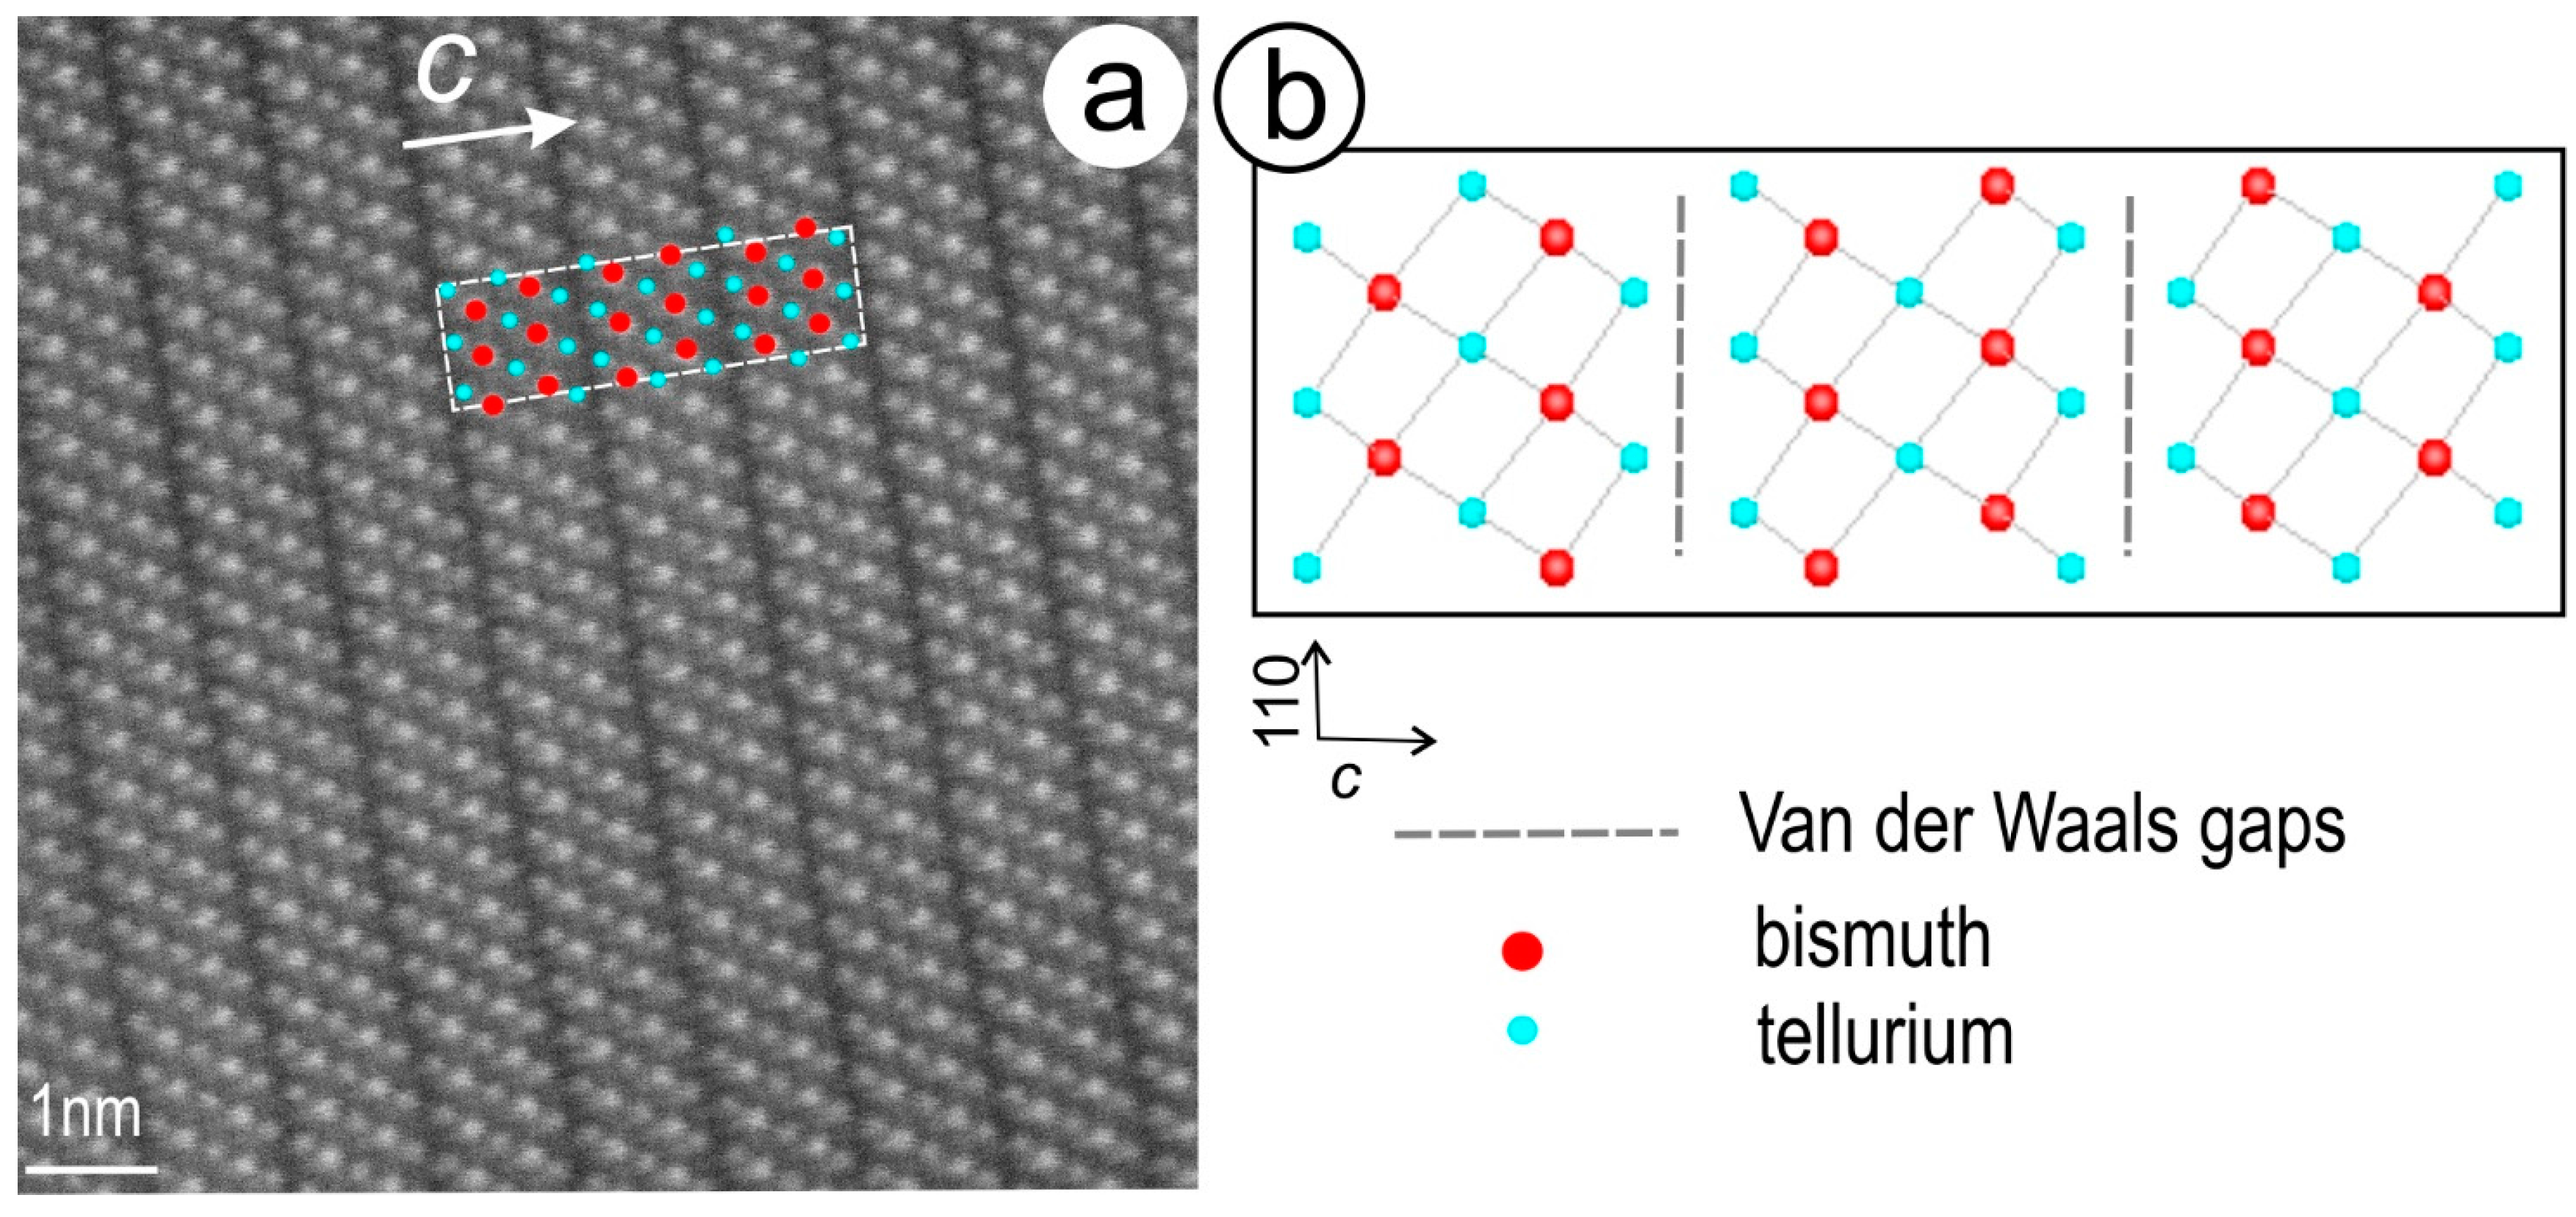
Figure 4.
HAADF STEM image (top left) and energy-dispersive X-ray-STEM element maps (Fe, Mg, Al, Ca, Si, K, Ba) of ~1 μm-sized inclusion of epidote (Ep) replaced by chlorite (Chl) within hyalophane (Hyl). Note the presence of sub-μm size hematite (Hm). Image and map obtained on a Titan Themis S-TEM instrument operated at 80 kV.
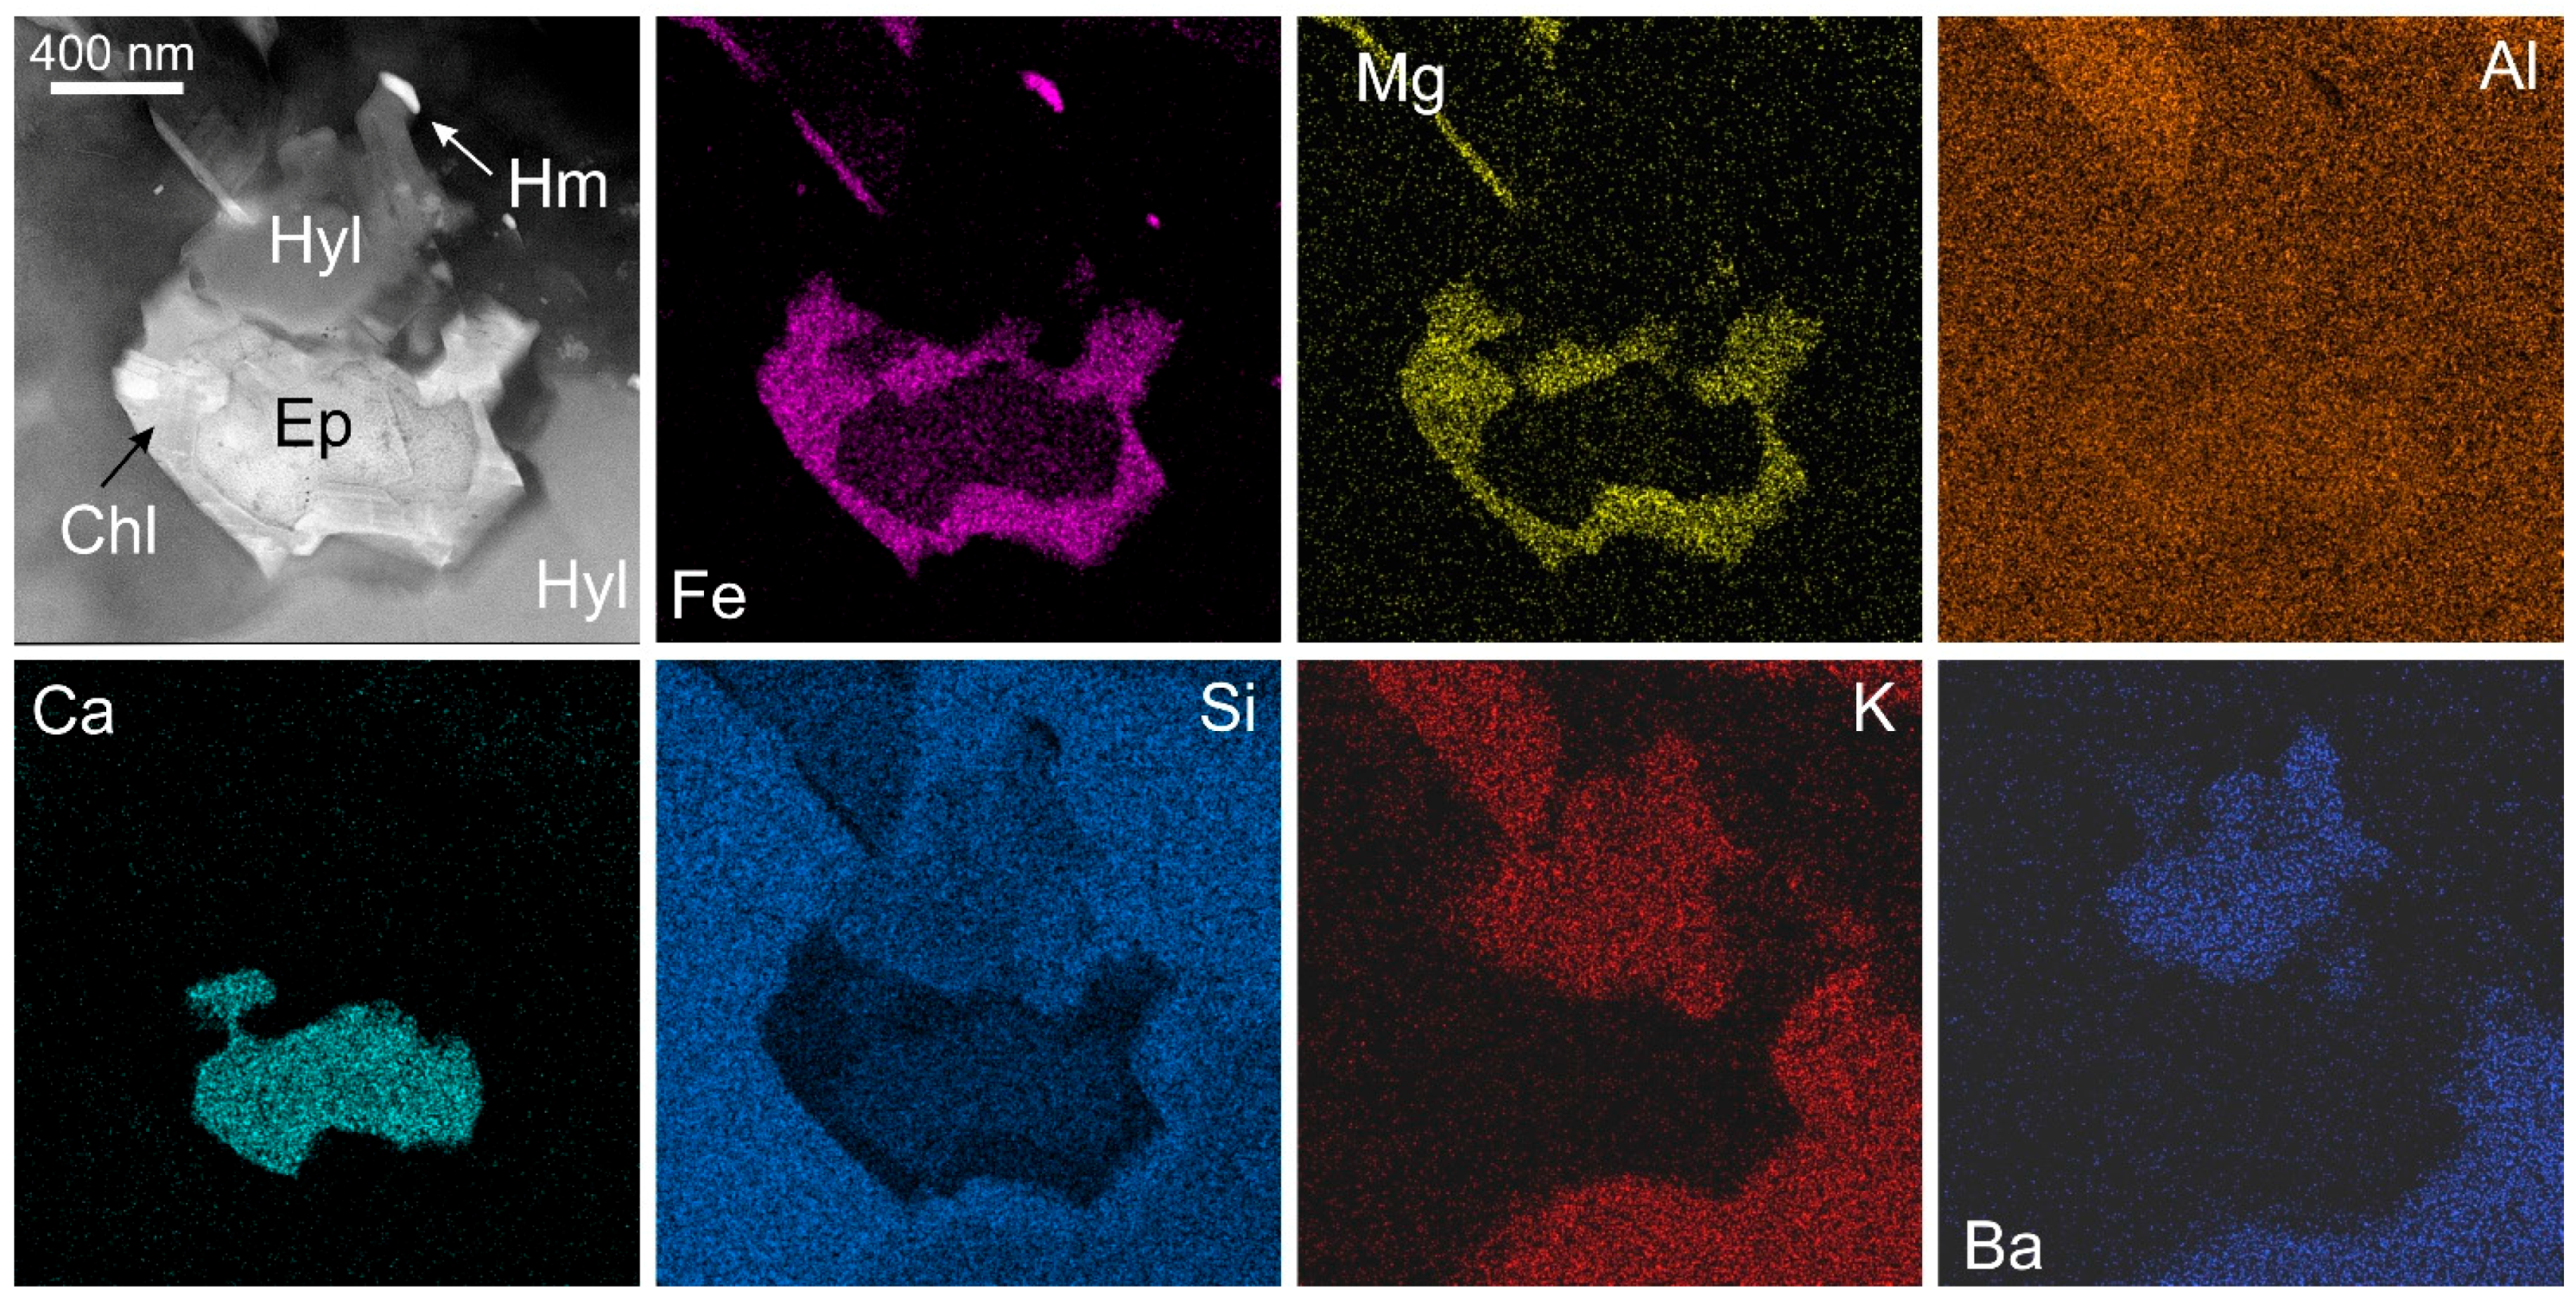
Figure 5.
HAADF STEM image and STEM-EDS element maps (Ca, Ce, La, Fe) showing lattice-scale intergrowths between bastnäsite and parisite. Note epitaxial hematite is also present. Image and map obtained on a Titan Themis TEM instrument operated at 200 kV. Bastnäsite is brighter and parisite is darker on the image.
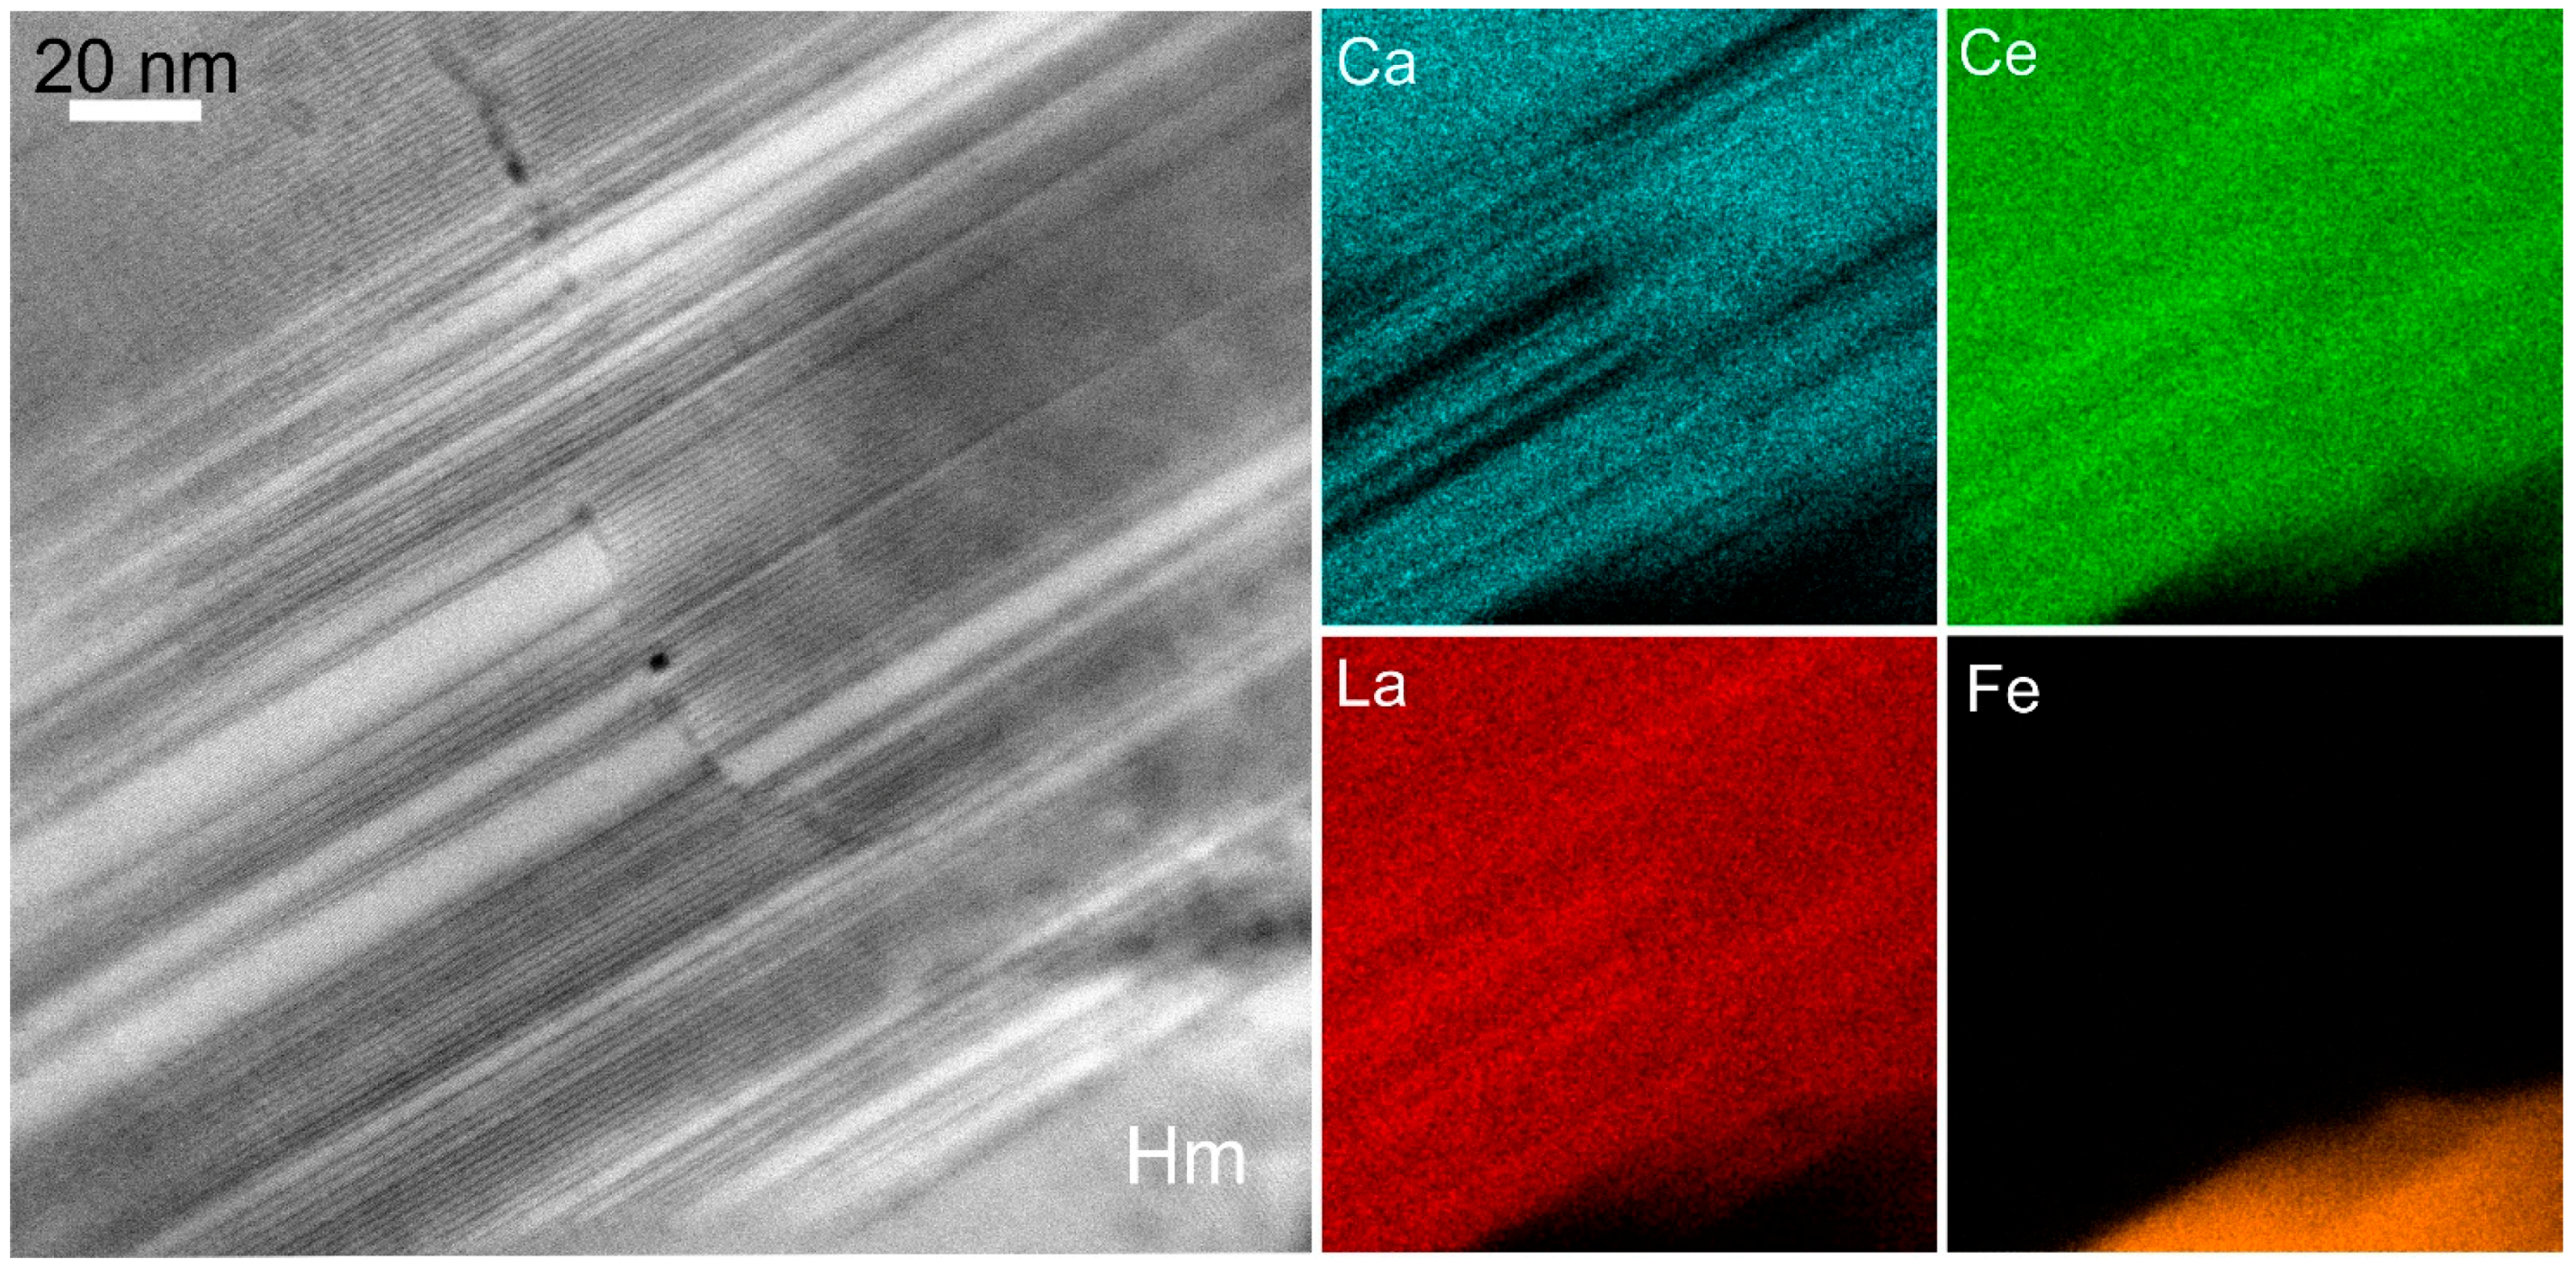
Figure 6.
(a) BSE image of a U-bearing, compositionally-zoned hematite grain (Olympic Dam); (b) LA-ICP-MS concentration map for U (scale in counts-per-second, logarithmic scale, 10n); and (c) Map showing 206Pb/238Pb ratio and scale in in Ma. The yellow background represents high 204Pb in the surrounding matrix mineralogy.
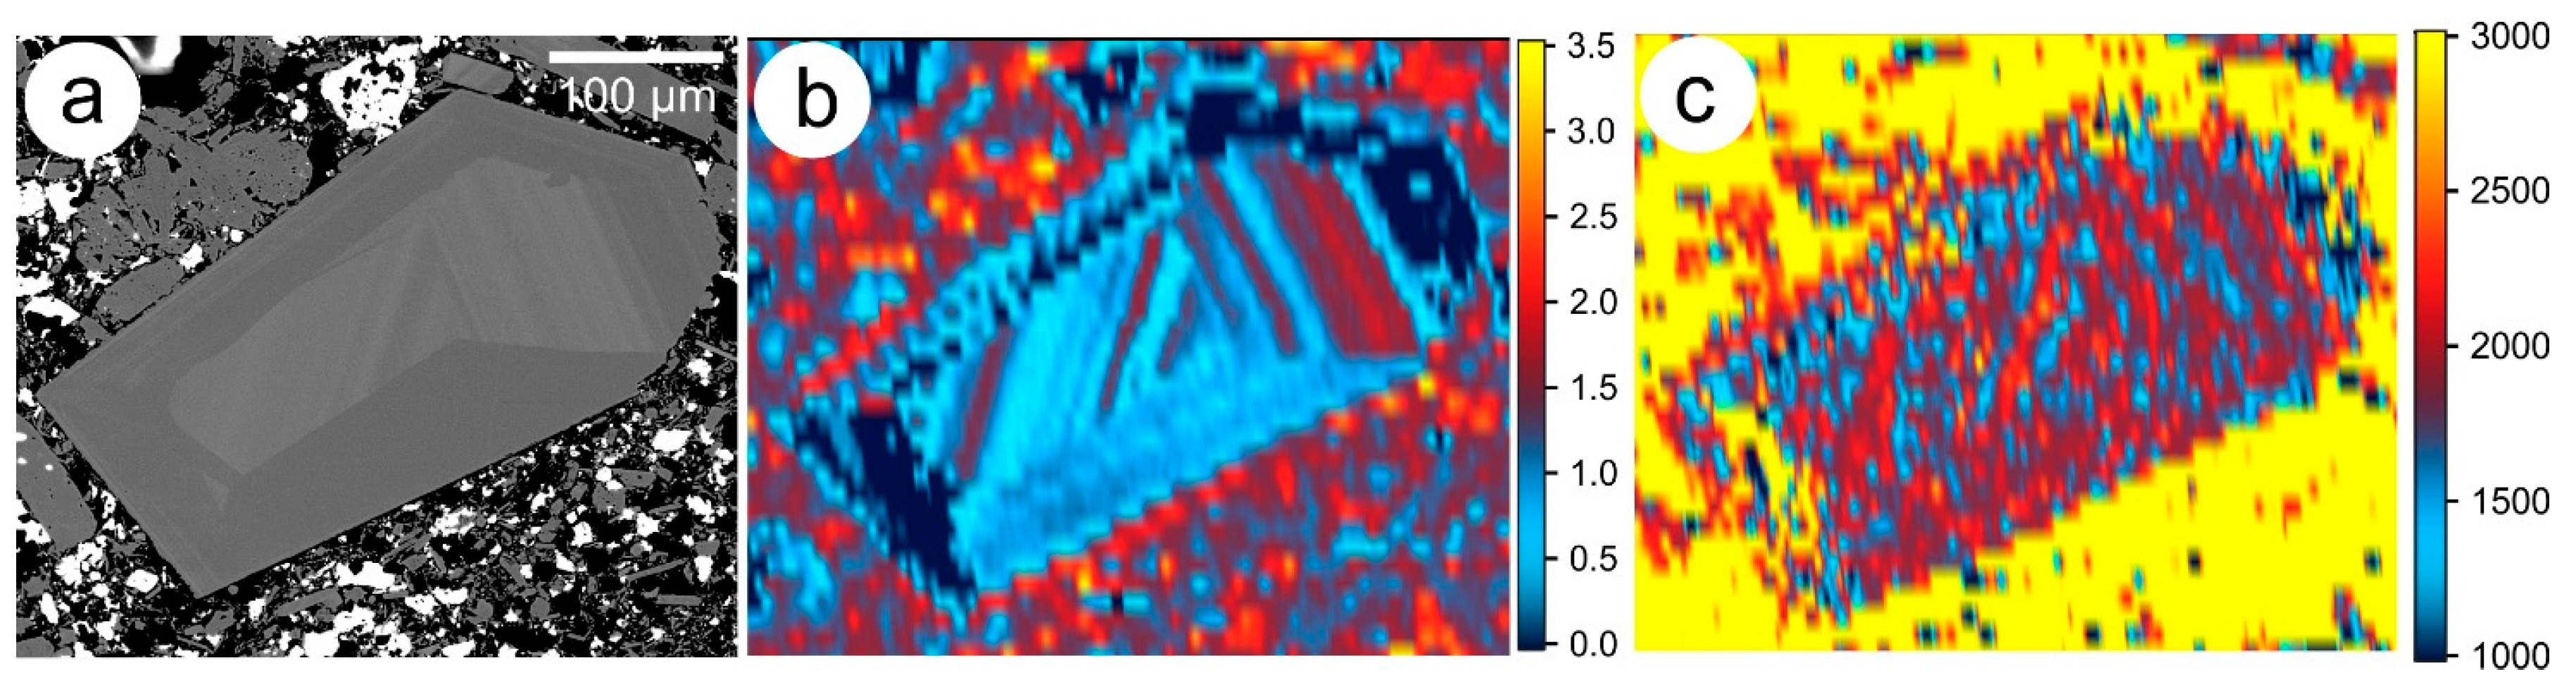
Figure 7.
LA-ICP-MS maps of assemblages in Fe-Ti ore from the Panzhihua intrusion, southeast China: Ti-Mt: titanomagnetite, Ilm-ilmenite, Spn-spinel, Po-pyrrhotite, Pn-pentlandite. Note the relative enrichment of Ti, Sc, Mg, Mn, Zr, Hf, Ta, and Nb in ilmenite relative to titanomagnetite. Note also relative enrichment of Zn and Ga in the fine-grained exsolved spinel within titanomagnetite. The reader is referred to [167] for additional background information on these samples.

Figure 8.
(a) HAADF-STEM image of uraninite nanoparticles (bright spots) in hematite. Dark areas are pores; (b) STEM-EDS element map (U) confirming identity of the bright inclusions. Image and map obtained on a Titan Themis S-TEM instrument operated at 200 kV.
Figure 8.
(a) HAADF-STEM image of uraninite nanoparticles (bright spots) in hematite. Dark areas are pores; (b) STEM-EDS element map (U) confirming identity of the bright inclusions. Image and map obtained on a Titan Themis S-TEM instrument operated at 200 kV.


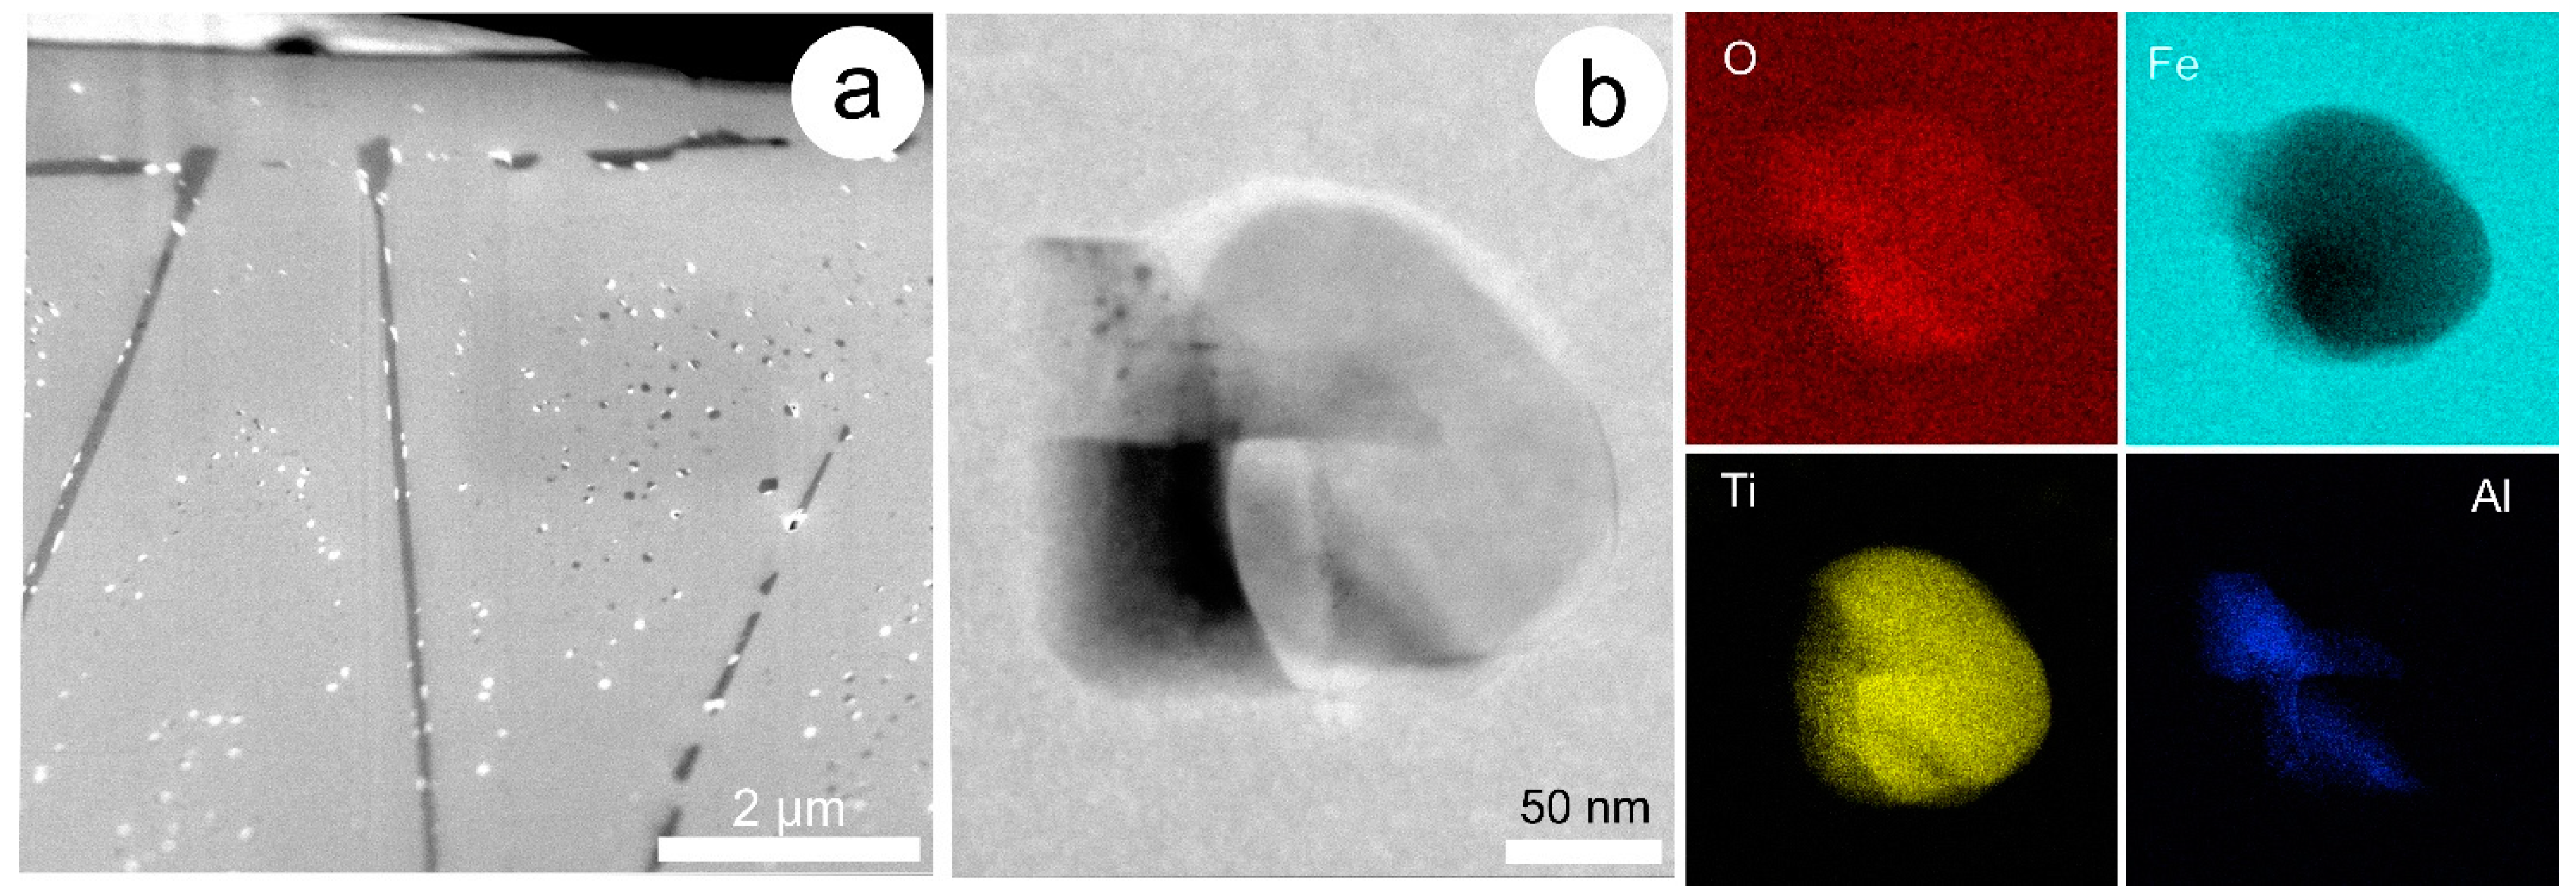
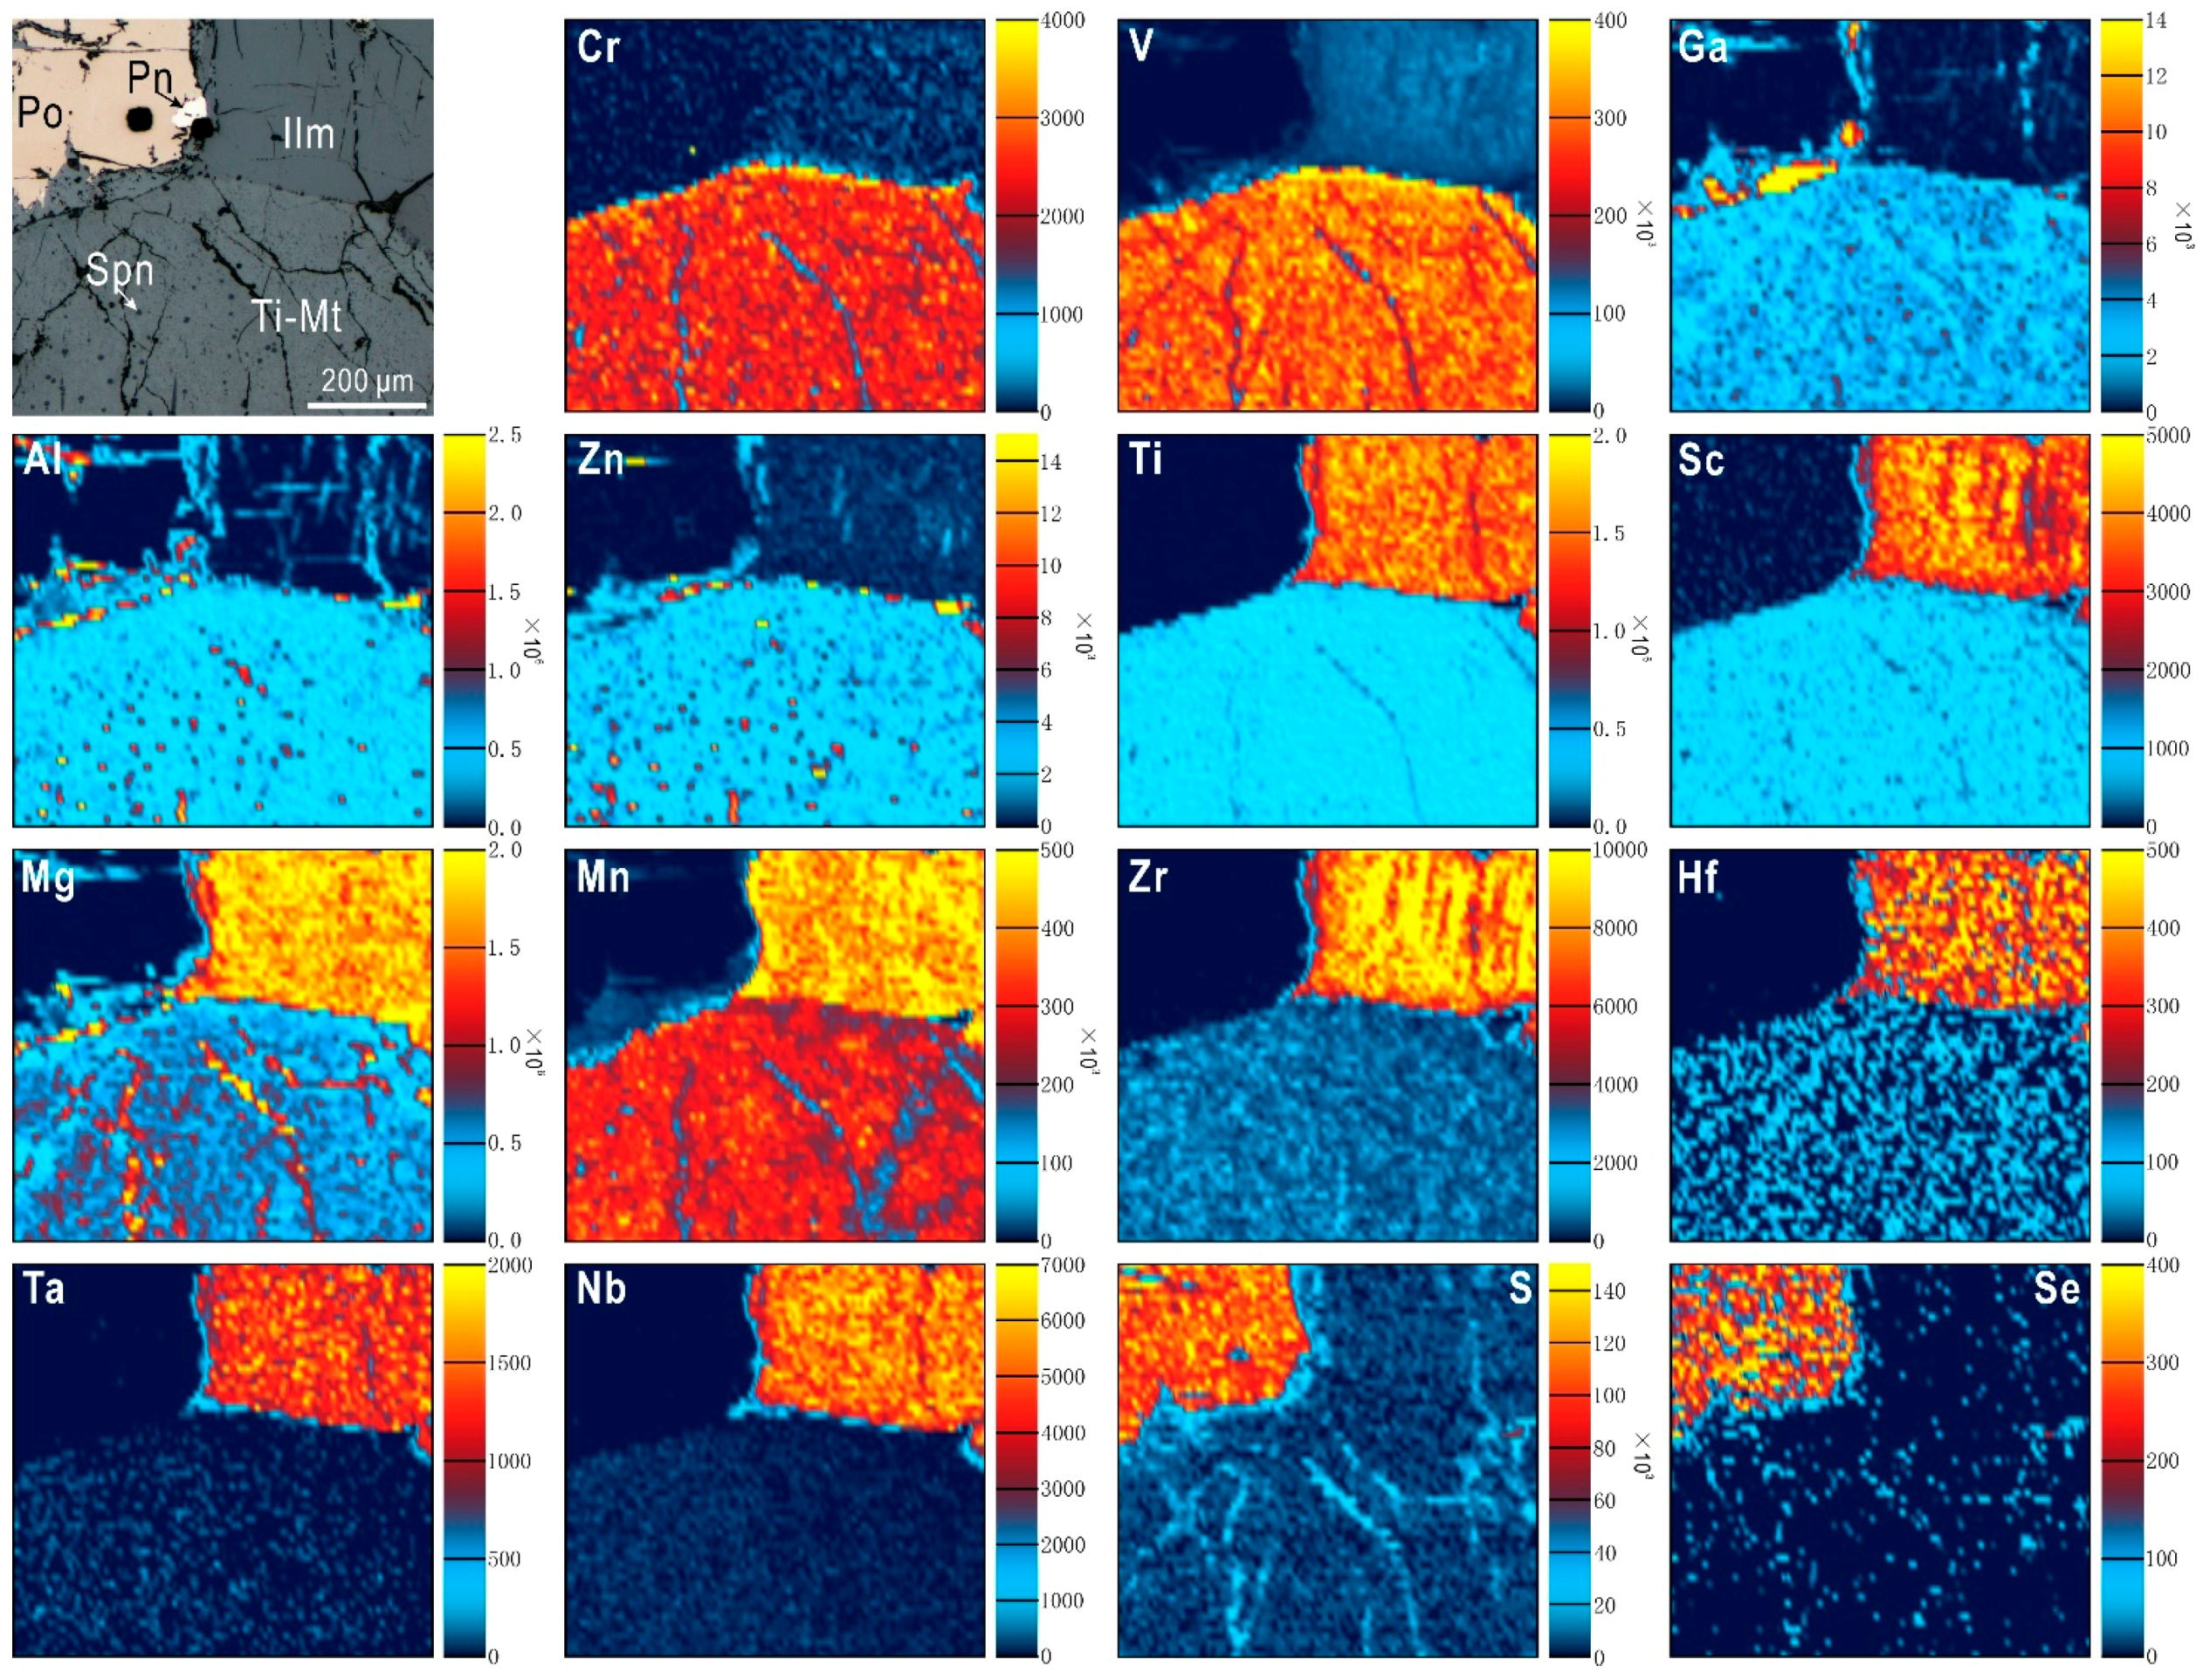
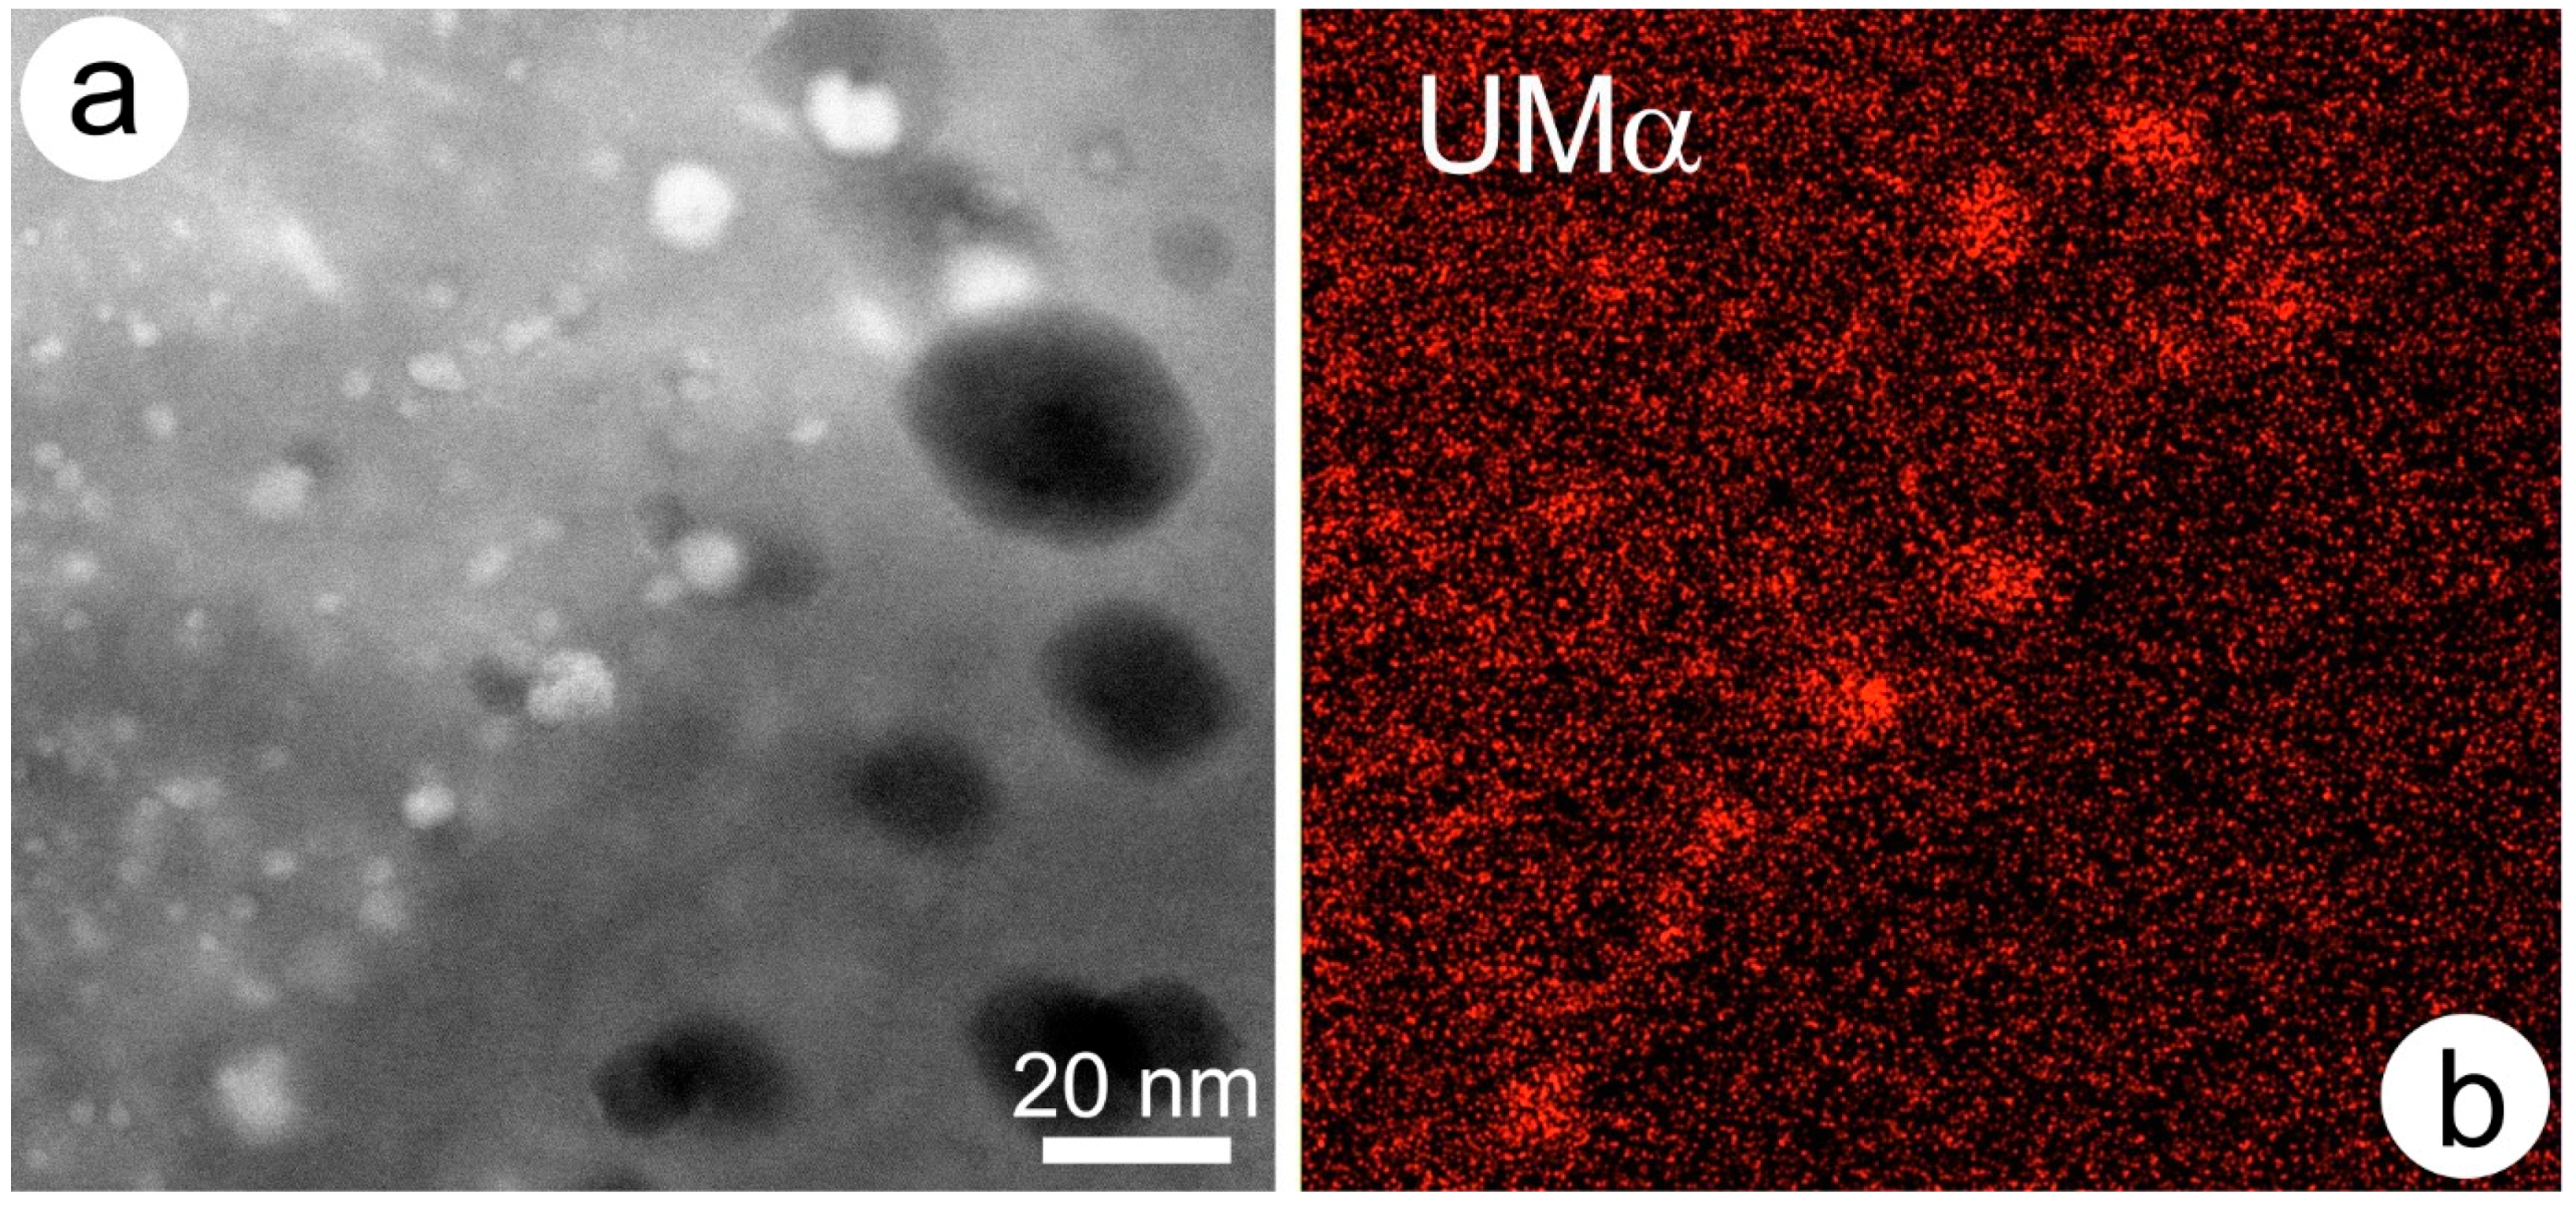
Table 1.
Applications of stable isotope geochemistry in ore mineralogy.
| Isotope System | Selected References | Key Ore-Related Questions Addressed |
|---|---|---|
| Fe | [117] and references therein, [118,119,120,121,122] | Origin of BIFs; metal-silicate, sulphide-melt, fluid-mineral and various mineral-mineral fractionations; δ56Fe as a tracer of ore-forming processes, including seafloor hydrothermal vents; discrimination of hydrothermal vs. magmatic processes; origin of detrital pyrite in Archaean sedimentary rocks |
| Ni | [123] and references therein, [124,125] | The origin of komatiite- and laterite-hosted nickel ores |
| Cu | [126] and references therein, [127,128,129,130,131] | Redox-induced fractionations wide large variability in supergene ores; large potential for application to complex deposits, e.g., IOCGs |
| Zn | [126] and references therein, [130,132,133] | Less data than for Cu-isotopes. Evidence for modest fractionation during evolution of hydrothermal fluids |
| Ge | [134] and references therein, [135] | Ge concentrated in sphalerite; potential for tracing processes in seafloor hydrothermal systems. |
| Se | [136,137] | Selenium source; distinguishing magmatic and hydrothermal input in ancient deposits |
| Mo | [138,139,140,141] | Significant application to ore-forming processes in deposits containing molybdenite; fractionation induced by redox reactions, fluid boiling. |
| Te | [142] | Ore-forming processes in Te-bearing epithermal and orogenic precious metal deposits |
| Hg | [143] and references therein, [144,145,146,147,148] | Relatively little used in ore geology to date but with potential application to hydrothermal systems. |
| Tl | [149] and references therein, [150,151,152,153] | Significant isotopic variability in natural samples points to the potential of Tl-isotopes for understanding formation of hydrothermal deposits; more baseline data are needed. |
© 2017 by the authors. Licensee MDPI, Basel, Switzerland. This article is an open access article distributed under the terms and conditions of the Creative Commons Attribution (CC BY) license (http://creativecommons.org/licenses/by/4.0/).
Share and Cite
MDPI and ACS Style
Cook, N.J.; Ciobanu, C.L.; Ehrig, K.; Slattery, A.; Verdugo-Ihl, M.R.; Courtney-Davies, L.; Gao, W. Advances and Opportunities in Ore Mineralogy. Minerals 2017, 7, 233. https://doi.org/10.3390/min7120233
AMA Style
Cook NJ, Ciobanu CL, Ehrig K, Slattery A, Verdugo-Ihl MR, Courtney-Davies L, Gao W. Advances and Opportunities in Ore Mineralogy. Minerals. 2017; 7(12):233. https://doi.org/10.3390/min7120233
Chicago/Turabian StyleCook, Nigel J., Cristiana L. Ciobanu, Kathy Ehrig, Ashley Slattery, Max R. Verdugo-Ihl, Liam Courtney-Davies, and Wenyuan Gao. 2017. "Advances and Opportunities in Ore Mineralogy" Minerals 7, no. 12: 233. https://doi.org/10.3390/min7120233
Note that from the first issue of 2016, this journal uses article numbers instead of page numbers. See further details here.