Article

Improvement of Sodium Leaching Ratio of Ferric Bauxite Sinter after Direct Reduction

1
State Key Laboratory of High-Efficient Mining and Safety of Metal Mines (USTB), Ministry of Education, Beijing Key Laboratory of Resource-Oriented Treatment of Industrial Pollutants, University of Science and Technology Beijing, Beijing 100083, China
2
State Key Laboratory of Mineral Processing Science and Technology, Beijing General Research Institute of Mining and Metallurgy, Beijing 100070, China
3
Industrial Research Department, China Noferrous Metals Industry Association Recycling Metal Branch, Beijing 100037, China
*
Author to whom correspondence should be addressed.
Minerals 2017, 7(1), 10; https://doi.org/10.3390/min7010010
Submission received: 6 November 2016 / Revised: 10 December 2016 / Accepted: 21 December 2016 / Published: 18 January 2017

Abstract

:
The sodium leaching ratio (ηN) of ferric bauxite direct reduction process is much lower than that of ordinary bauxite; thus, the former consumes more sodium than the latter. ηN can be promoted by increasing the dosage of sodium or restricted by increasing the heating temperature and time. However, the restriction effect of heating temperature is 16.67 times larger than that of heating time, and the restriction effect decreases 47.03 times faster when heating temperature increases than that process of heating time. These imply that ηN improves with the increasing sodium carbonate dosage and the decreasing heating temperature.

1. Introduction

Ferric bauxite is a typical refractory bauxite which has a wide distribution in Asia [1,2,3] and Africa [1], however, it is improperly developed. The potential methods of treating ferric bauxite include the extraction of alumina before iron [4,5], extraction of iron before alumina [6,7], beneficiation before leaching [8], and biological technique [9,10]. Direct reduction before leaching is another method [11,12,13] that has recently seen a boom. By adopting this technology, hematite and goethite in ferric bauxite are reduced to granular iron in a carbothermic reduction process, and then iron powder is separated from the sinter produced after the reduction. Iron powder may then be employed for producing steel and casting after agglomeration, or used as a metallic powder material directly. Simultaneous with hematite and goethite reduction, the additive of sodium carbonate reacted with diaspore and boehmite then generates water-soluble sodium aluminate, which is then separated from the solution obtained after leaching and utilized for alumina production. In the alumina leaching process, sodium is also leached out and recycled partially. However, before reduction, iron-containing minerals react with sodium carbonate to generate evaporable sodium ferrite, and silicon-containing minerals react with sodium carbonate to generate nepheline [12,14]. These reactions reduce sodium leaching ratio and increase alkali consumption. The Box–Benhken design [15] is typically adopted to conduct quantitative research by determining the regression model. In this research, Box–Benhken design is utilized to investigate the effects of heating temperature, heating time, and sodium carbonate dosage on sodium leaching ratio and to understand the change patterns of these effects. The results of this study may be used to reduce the alkali consumption of the direct reduction of ferric bauxite. The findings may also improve current alumina production.

2. Experimental

2.1. Experimental Methods

The experimental instruments employed in this investigation include a rod mill (Hengcheng, XMB-70, Ganzhou, China), an electric box furnace (INCH, SX2-10-13, Changsha, China), an electronic balance (Mettler, AR1140, Changzhou, China), a vacuum filter (Hengcheng, XTLZ, Ganzhou, China), a magnetic separator (Yihao, CXG-99, Tangshan, China), and an electrothermal constant-temperature dry box (Shuangxu, PH050, Shanghai, China).
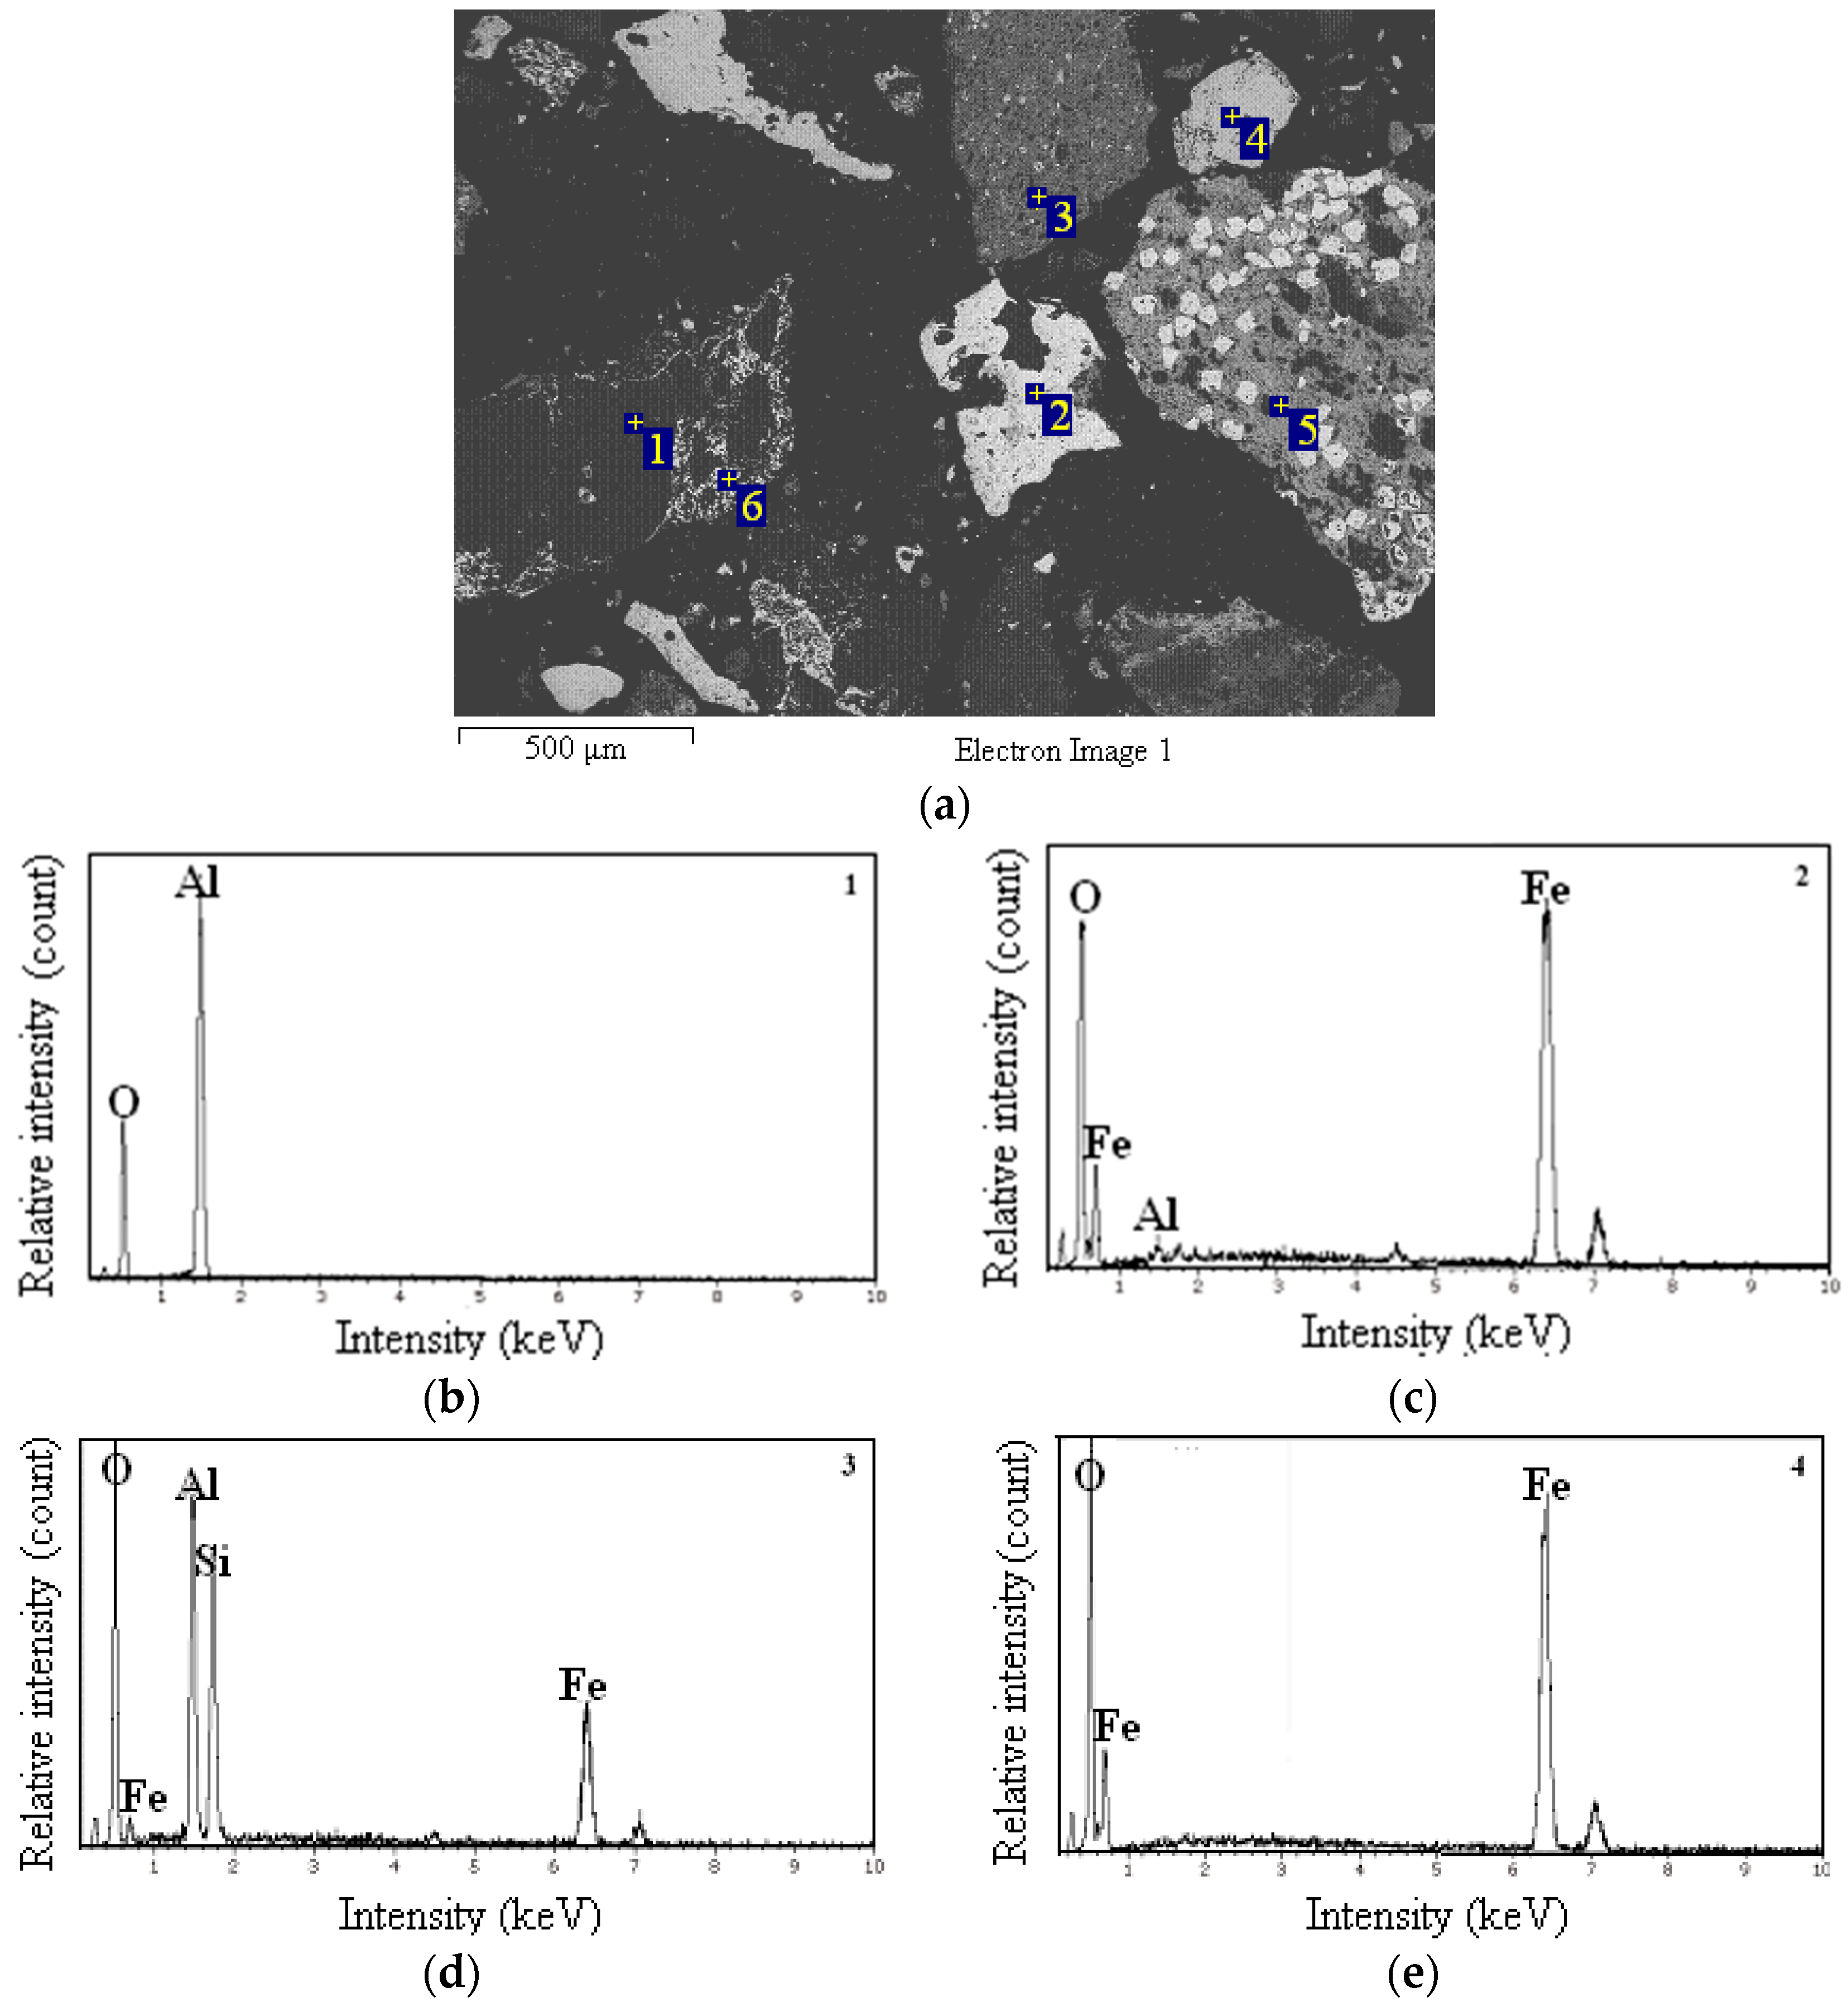
The Chemical compositions of the ore and product were analyzed by an atomic absorption spectrophotometer (Rayleigh, UV-9600, Beijing, China). The mineral composition of ore was examined by an X-ray diffractometer, XRD (Rigaku, TTRIII, Tokyo, Japan). The morphology and chemical composition of micro zone in samples were determined using a scanning electron microscope equipped with an energy dispersive spectrometer, SEM-EDS (ZEISS, EVO 18, Jena, Germany).
The chemical and mineral compositions of ferric bauxite were examined by atomic absorption spectrophotometer and XRD, respectively. The microstructure and chemical composition were tested by SEM-EDS.
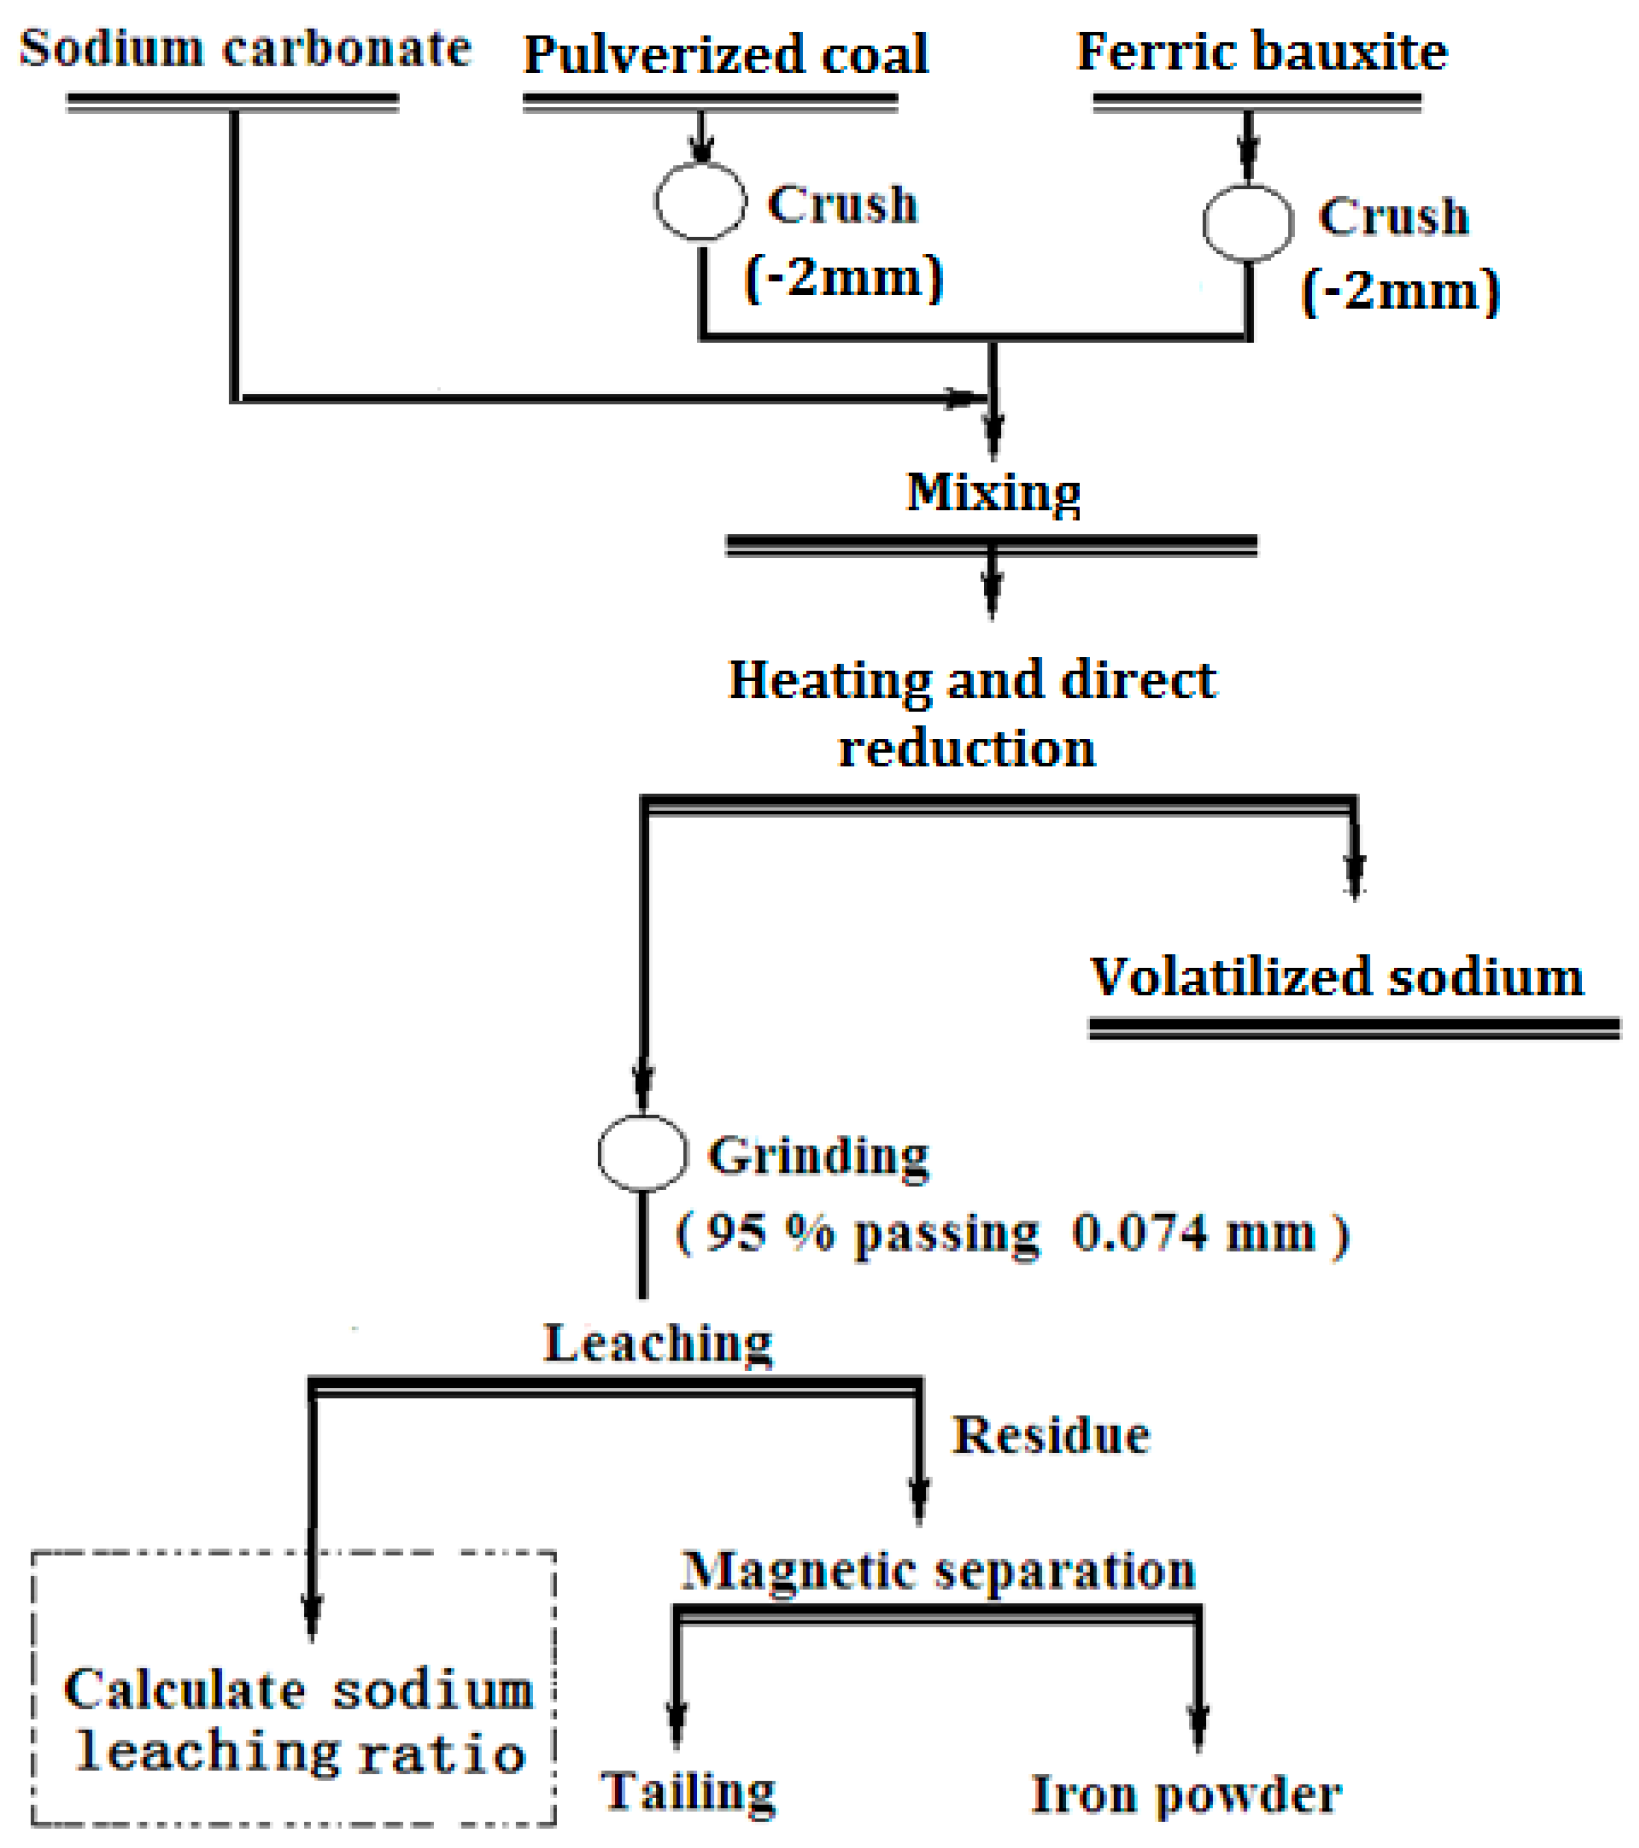
In the experiments, ore, sodium carbonate, and coal were crushed to 100% passing 2 mm, and then mixed. The mixing ratio of ore and coal was 1:0.25, whereas the amount of sodium carbonate was varied. In each unit experiment, 41 g of the mixed materials was transferred to a lidded 100 mL graphite clay crucible. The crucible was then placed in a muffle furnace with an uncontrolled gaseous atmosphere at 1100 to 1150 °C. A distance of more than 3 cm was left between the crucible lid and the powder mixture in the crucible to prevent them from making contact with each other. After cooling, the material was ground to 100% passing 74 μm at the grinding density of 50%, and then leached under the conditions of water–solid ratio of 15:1, leaching temperature of 75 °C, and leaching time of 0.5 h. Sodium leaching ratio (ηN) was then calculated from Equation (1):
η N = 46 c N V o l 106 M ω N
  • ηN, sodium leaching ratio, %;
  • cN, sodium concentration of lixivium, g/L;
  • Vol, volume of lixivium, L;
  • M, mass of raw material mixture adopted in each unit experiment, g;
  • ωN, mass fraction of sodium carbonate in raw material mixture, %.
The leaching residues were transferred to magnetic separators, and the iron powder was isolated from tailing with a magnetic separation of 0.14 T. The entire flow chart adopted in the experiments is shown in Figure 1, but only the sodium leaching part was investigated in this study.

2.2. Ore Characteristics

The ferric bauxite used was sampled from the Guangxi province of China. The chemical composition, SEM-EDS photos, and XRD image of the ferric bauxite adopted are presented in Table 1 and Figure 2 and Figure 3, respectively.
Table 1 indicates that the iron and silicon dioxide of ferric bauxite are 28.79% and 12.22%, respectively. 
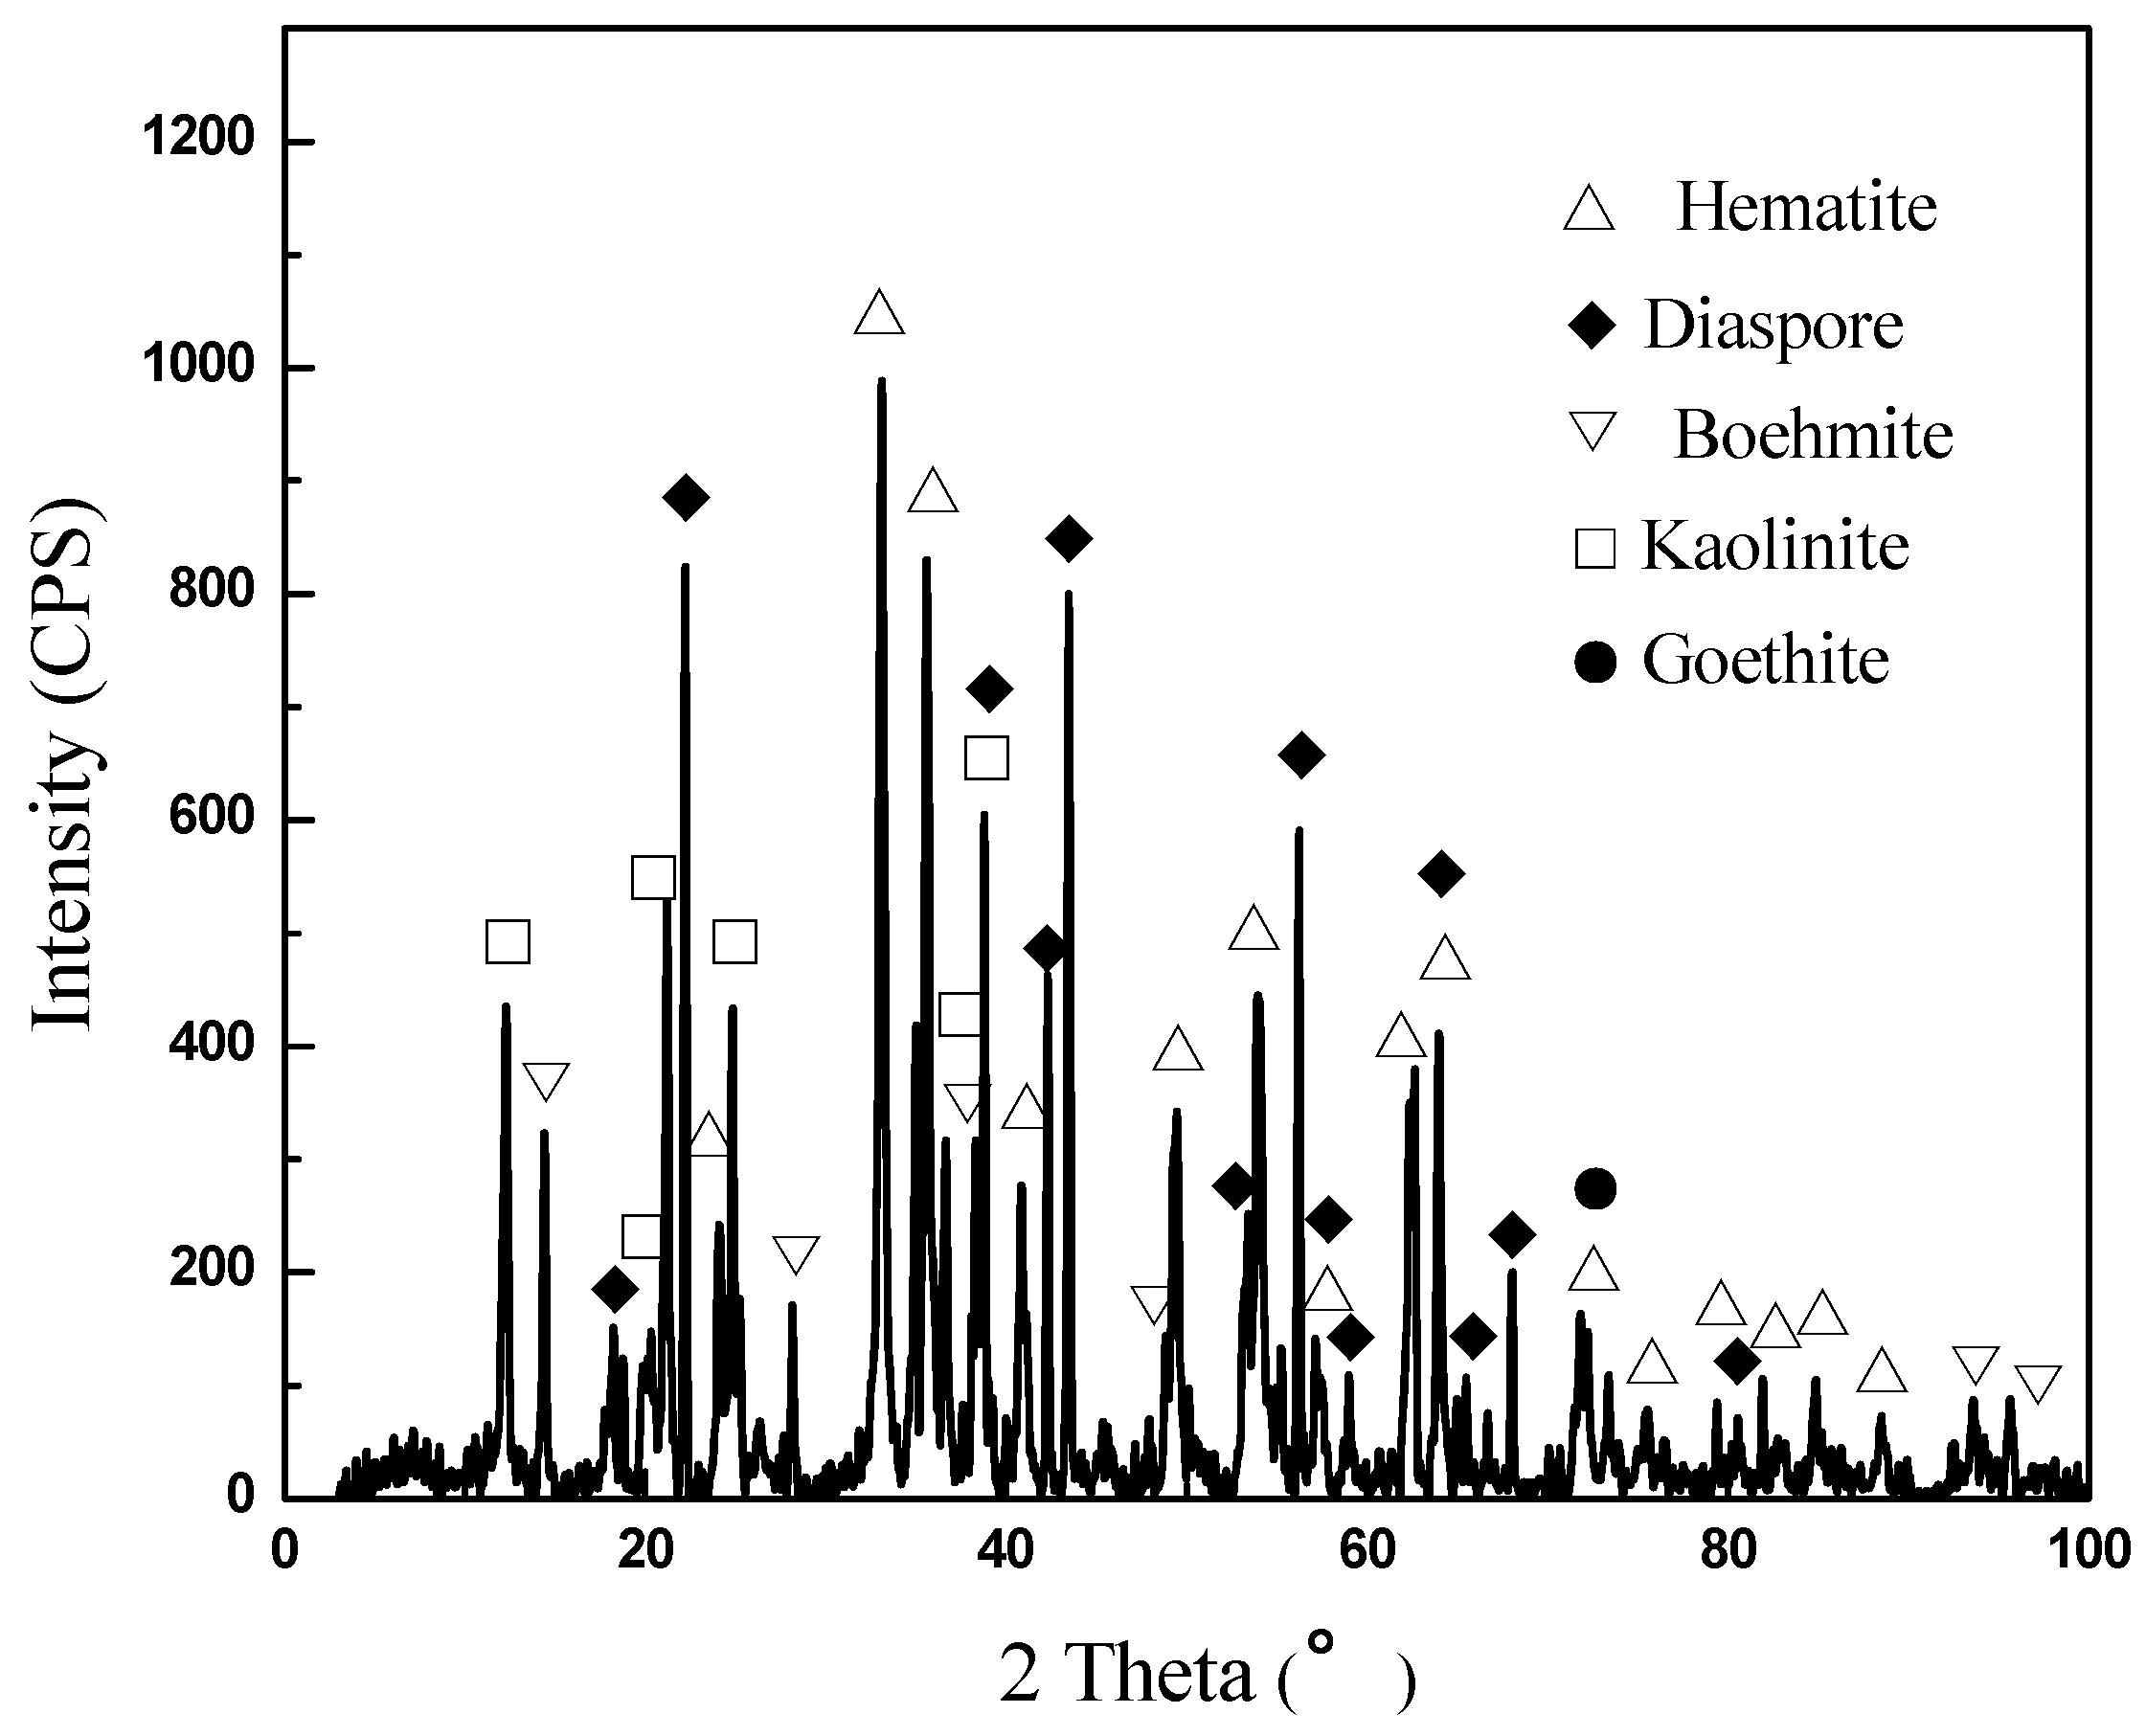
Figure 2 shows five main crystalline mineral phases in raw ferric bauxite: hematite, boehmite, diaspore, kaolinite, and goethite. 
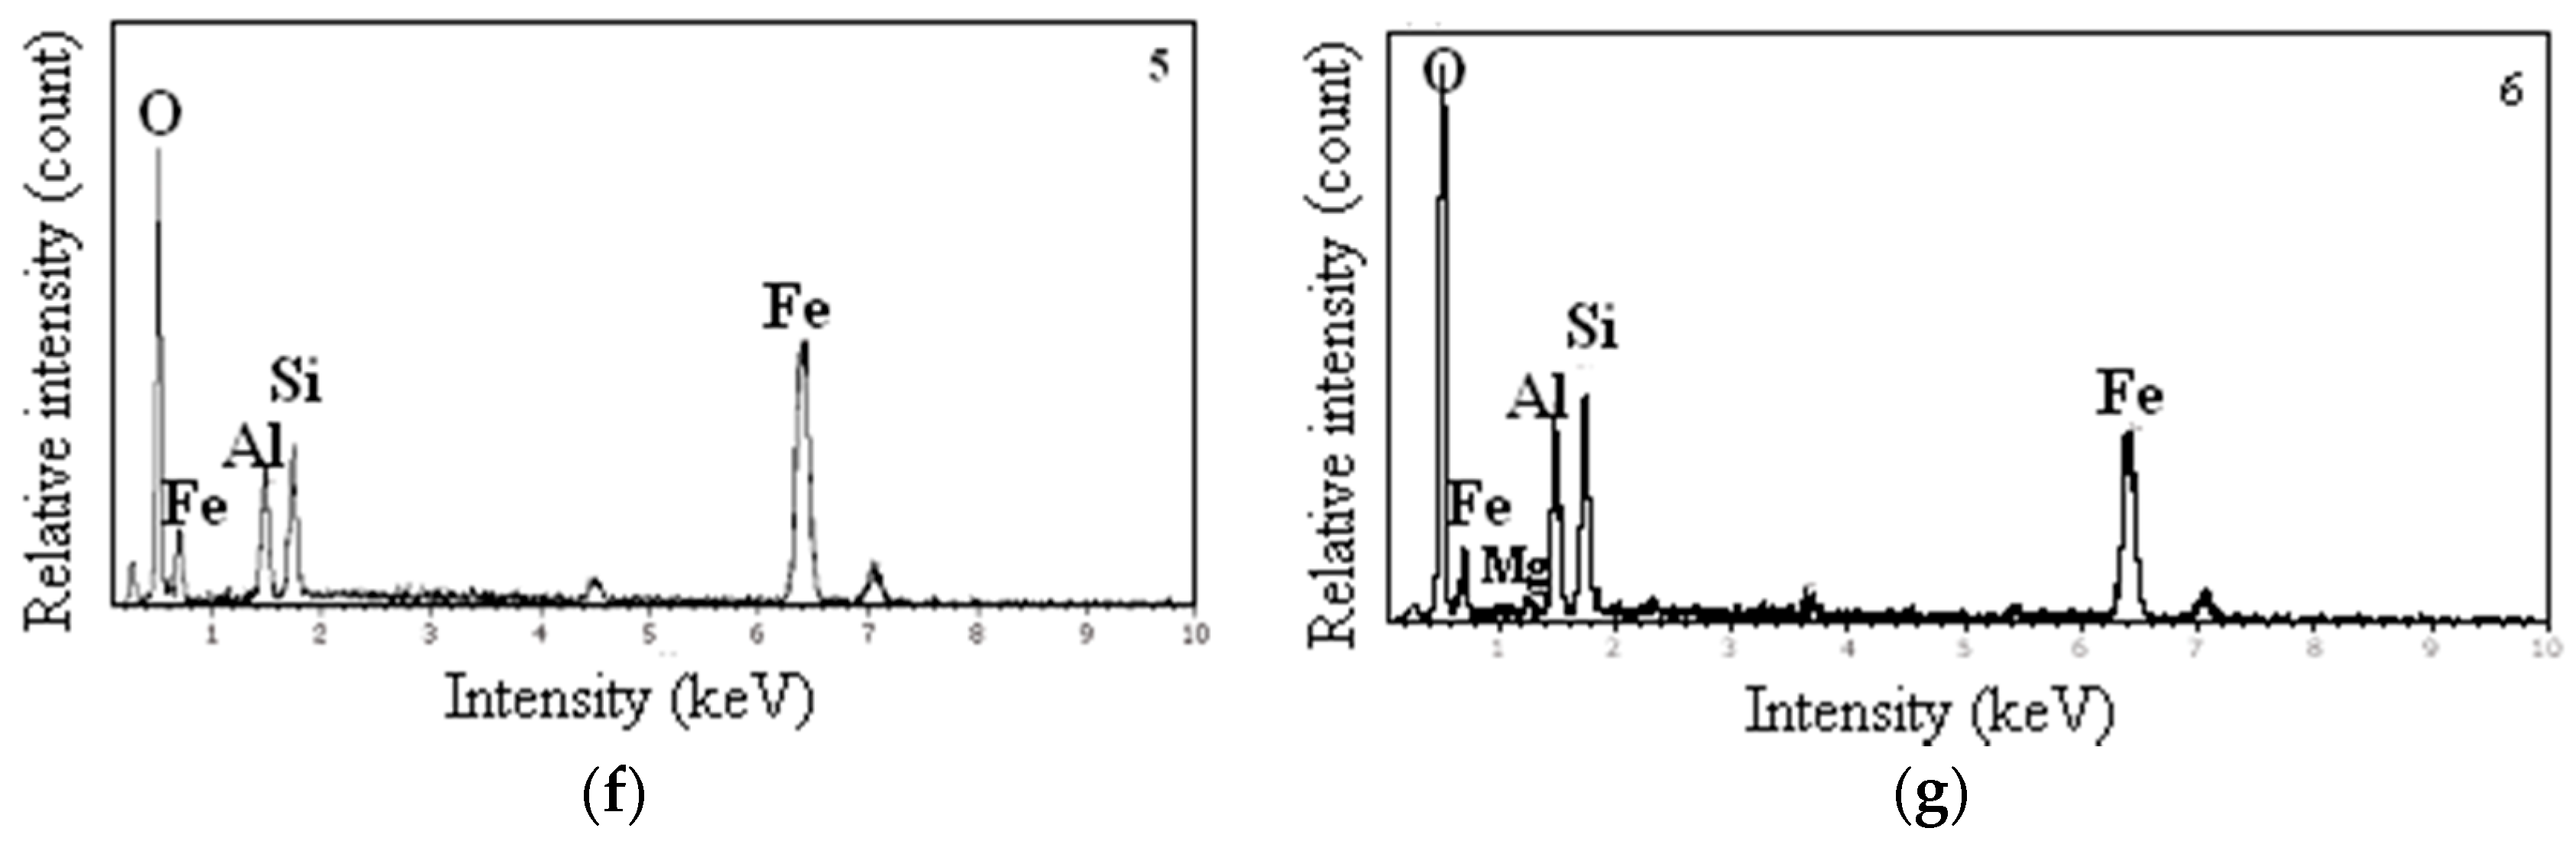
Figure 3 reveals that the minerals in ferric bauxite are finely disseminated and symbiotic with one another, particularly the fine disseminated silicon-containing minerals distributed in hematite and diaspore grains (see points 5 and 6 in Figure 3a). Ferric bauxite is characterized by the high contents of iron and silicon dioxide, as well as finely disseminated and symbiotic silicon-containing mineral.
Proximate analysis and inorganic composition data of coal are shown in Table 2 and Table 3, respectively.

3. Results and Discussion

3.1. Leaching Rules

Coal dosage, heating temperature, heating time, and sodium carbonate dosage are the four significant factors that influence ferric bauxite direct reduction and leaching process [14]. Among them, coal dosage is usually determined by the hematite content of ore, and can hardly be changed to promote ηN. Thus, only the effects of heating temperature, heating time, and sodium carbonate dosage on ηN were measured in this research, and every experiment was conducted under a constant coal dosage. The parameter scales were established under previously reported optimum conditions [16], because ηN must be promoted on the premise of synthetically recovering iron and aluminum. In the Box–Benhken design, the fluctuation range of each parameter scale is 10%. The Box–Benhken design and experiment results are shown in Table 4.
Research shows the appropriate model simulated by Box–Behnken is quadratic. The variance analysis of the regression models is shown in Table 5, where Df is the degrees of freedom (a non-dimensional number), F is the homogeneity test of variance, P is the probability of obtaining a result that is at least as extreme as the actually observed result, given that the null hypothesis is true.
Using a quadratic model, it was calculated that R2 = 740.12/758.72 = 0.9755. This indicates that 97.55% of the ηN changes coming from the factors have been considered. The lack of fit value and the significance level of the model selected show that the model and experimental data fit well, using quadratic to describe the quantitative relation between ηN and its influence factors is appreciated.
The confidence analysis of the quadratic model is shown in Table 6, where Df is the degrees of freedom (a non-dimensional number), and VIF is the variance inflation factor (a non-dimensional number).
The variance analysis of the regression models in Table 5 shows that the quadratic model fits the data well. The response surfaces of the heating temperature–heating time plot and their corresponding contours are shown in Figure 4. The response surfaces of the heating time–sodium carbonate dosage plot and their corresponding contours are shown in Figure 5. The response surfaces of the heating temperature–sodium carbonate dosage plot and their corresponding contours are shown in Figure 6.
Figure 4, Figure 5 and Figure 6 show that the value gradients correlated with heating temperature is much sharper than that with sodium carbonate dosage and heating time. Exerting the minimal impact on ηN, the effect of heating time is negligible. Namely, the significance of the influencing factors of ηN can be arranged in descending order, as follows: heating temperature > sodium carbonate dosage > heating time.

3.2. Quantitative Analysis of Leaching Model

The quadratic model suggested by Box–Behnken design is shown in Equation (2).
η N = 3 . 01 A 2 0 . 064 B 2 + 2 . 77 C 2 0 . 083 A B + 0 . 44 A C + 0 . 32 B C 9 . 11 A 0 . 2 B 0 . 97 C + 59 . 33
Generally, the changing rate and speed of a quantity can be described by calculating its partial derivative and second partial derivative. Specifically, the effects of heating temperature (A), heating time (B), and sodium carbonate dosage (C) on ηN changings mean promotion or restraint; thus, these promotion or restraint effects can be investigated by calculating the partial derivative and second partial derivative of ηN. Necessary processes and the results of the calculation are shown in Equations (3)–(8).
η N A | A = 1150 B = 2700 C = 40.75 = 6.02 A 0.083 B + 0.44 C 9.11 = 7138.2
2 η N A 2 = 6.02
η N B | A = 1150 B = 2700 C = 40.75 = 0.128 B 0.083 A + 0.32 C 0.2 = 428.21
2 η N B 2 = 0.128
η N C | A = 1150 B = 2700 = 5054 C + 0.44 A 0.97 = 1590.71 C = 40.75
2 η N C 2 = 5.54
Analysis shows that η N A < η N B < 0 when A = 1150 °C, B = 45 min, and C = 40.75%, indicating that ηN is restricted with increasing heating temperature and heating time. In addition, the restriction effect of the former is 16.67 times larger than that of the latter. η N C > 0 means that ηN increases with increasing sodium carbonate dosage. 2 η N A 2 = 6.02 < 2 η N B 2 = 0.128 < 0 indicates that the restriction effects of heating temperature and time on ηN decrease, and the decrease of the former is 47.03 times larger than that of the latter. 2 η N C 2 = 5.54 > 0 indicates that the promoting effect from the increase in sodium carbonate dosage will become reinforced. Therefore, sodium leaching improves with increasing sodium carbonate dosage and decreasing heating temperature. However, taking economic effects into consideration, the increasing of sodium carbonate dosage means more materials costs, while the decreasing of heating temperature reduces fuel consumption. Thus, in addition to the technical factor, it is also necessary to perform a financial evaluation to verify the economic value of these optimality conditions.

4. Conclusions

Ferric bauxite is characterized by high contents of iron and silicon dioxide, as well as finely disseminated and symbiotic silicon-containing mineral. ηN can be promoted by increasing sodium carbonate dosage. The promotion effect can be restricted by increasing the heating temperature and time. The restriction effect of heating temperature is 16.67 times larger than that of heating time. However, the decreasing effects of heating temperature and time on ηN both reduce when heating temperature or heating time increase, but the effect of heating temperature weakens 47.03 times faster than that of heating time. Therefore, in conclusion, sodium leaching improves with increasing sodium carbonate dosage and decreasing heating temperature.

Acknowledgments

This study was supported by the National Natural Science Foundation of China by a grant number 51304012, the Found of State Key Laboratory of Mineral Processing by a grant number BGRIMM-KJSKL-2015-08, the State Key Laboratory of Solid Waste Reuse for Building Materials by a grant number of SWR-2015-003, the Fundamental Research Funds for the Central Universities by a grant number FRF-TP-15-050A1, and the Open Foundation of the State Key Laboratory of Advanced Metallurgy (USTB) by a grant number KF 13-04 and 13-05.

Author Contributions

Wentao Hu and Chuanyao Sun conceived the experiments; Wentao Hu, Xinwei Liu, Hanwen Xia, and Bo Wang performed the experiments; Huajun Wang contributed experimental materials and analysis tools; Wentao Hu wrote the paper; Wentao Hu, Xiaojie Dai, Dongling Pan, and Jia Li made the final modification.

Conflicts of Interest

The authors declare no conflict of interest.

References

  1. Cheng, G.; Gao, G.M.; Chen, S.L. Geological characteristics and mineralization regularity of bauxite in Boloven Plateau Laos. J. Cent. South Univ. Nat. Sci. Ed. 2008, 39, 380–386. [Google Scholar]
  2. Deng, J.; Wang, Q.F.; Yang, S.J.; Liu, X.F.; Zhang, Q.Z.; Yang, L.Q.; Yang, Y.H. Genetic relationship between the Emeishan plume and the bauxite deposits in Western Guangxi, China: Constraints from U-Pb and Lu-Hf isotopes of the detrital zircons in bauxite ores. J. Asian Earth Sci. 2010, 37, 412–424. [Google Scholar] [CrossRef]
  3. Zhang, Z.W.; Zhou, L.J.; Li, Y.J.; Wu, C.Q.; Zheng, C.F. The “coal-bauxite-iron” structure in the ore-bearing rock series as a prospecting indicator for southeastern Guizhou bauxite mines. Ore Geol. Rev. 2013, 53, 145–158. [Google Scholar] [CrossRef]
  4. Zwingmann, N.; Jone, A.J.; Dye, S.; Swash, P.M.; Gilkes, R.J. A method to concentrate boehmite in bauxite by dissolution of gibbsite and iron oxides. Hydrometallurgy 2009, 97, 80–85. [Google Scholar] [CrossRef]
  5. Jiang, T.; Li, G.H.; Fan, X.H. Desilication from diasporic bauxite by roasting-alkali leaching process. Chin. J. Nonf. Met. 2000, 10, 534–538. [Google Scholar]
  6. Zhu, Z.P.; Jiang, T.; Li, G.H.; Huang, Z.C. Thermodynamics of reaction of alumina during sintering process of high-iron gibbsite-type bauxite. Chin. J. Nonferr. Metals 2009, 19, 2243–2250. [Google Scholar]
  7. Shi, G.S.; Fang, J.; Yang, G.Y.; Xin, H.Y.; Gao, Y.J. Feasibility Study of Guangxi High-Fe Bauxite Sintering. J. Hebei Polytecj. Univ. Nat. Sci. Ed. 2013, 33, 11–13. [Google Scholar]
  8. Kahn, H.; Tassinari, M.M.L.; Ratti, G. Characterization of bauxite fines aiming to minimize their iron content. Miner. Eng. 2003, 16, 1313–1315. [Google Scholar] [CrossRef]
  9. Papassiopi, N.; Vaxevanidou, K.; Paspaliaris, I. Effectiveness of iron reducing bacteria for the removal of iron from bauxite ores. Miner. Eng. 2010, 23, 25–31. [Google Scholar] [CrossRef]
  10. Natayauan, K.A. Some microbiological aspects of bauxite mineralization and beneficiation. Miner. Metall. Process. 1997, 14, 47–50. [Google Scholar]
  11. Yeh, C.H.; Zhang, G.Q. Stepwise carbothermal reduction of bauxite ores. Int. J. Miner. Process. 2013, 124, 1–7. [Google Scholar] [CrossRef]
  12. Hu, W.T.; Wang, H.J.; Liu, X.W.; Sun, C.Y. Effect of nonmetallic additives on iron grain grindability. Int. J. Miner. Process. 2014, 130, 108–113. [Google Scholar] [CrossRef]
  13. Hu, W.T.; Wang, H.J.; Liu, X.W.; Sun, C.Y. Correlation between aggregation structure and tailing mineral crystallinity. Int. J. Miner. Metall. Mater. 2014, 21, 845–850. [Google Scholar] [CrossRef]
  14. Hu, W.T.; Wang, H.J.; Liu, X.W.; Sun, C.Y.; Duan, X.Q. Restraining sodium volatilization in the ferric bauxite direct reduction system. Minerals 2016, 6, 31. [Google Scholar] [CrossRef]
  15. Cai, Z.L.; Feng, Y.L.; Li, H.R.; Du, Z.W.; Liu, X.W. Co-recovery of manganese from low-grade pyrolusite and vanadium from stone coal using fluidized roasting coupling technology. Hydrometallurgy 2013, 131–132, 40–45. [Google Scholar] [CrossRef]
  16. Hu, W.T.; Wang, H.J.; Sun, C.Y.; Tong, G.K.; Ji, C.L. Direct reduction-leaching process for high ferric bauxite. J. Univ. Sci. Tech. Beijing 2012, 34, 506–511. [Google Scholar]
Figure 1. The entire flow chat adopted in the experiment.
Minerals 07 00010 g001
Figure 2. The XRD image of the ferric bauxite adopted.
Minerals 07 00010 g002
Figure 3. (a) The SEM image of the ferric bauxite adopted; (b) energy dispersive spectrometer image of point 1; (c) the EDS image of point 2; (d) the EDS image of point 3; (e) the EDS image of point 4; (f) the EDS image of point 5; (g) the EDS image of point 6.
Minerals 07 00010 g003aMinerals 07 00010 g003b
Figure 4. (a) Response surface of heating temperature–heating time plot; (b) contour of heating temperature–heating time plot.
Minerals 07 00010 g004
Figure 5. (a) Response surface of heating time–sodium carbonate dosage; (b) contour of heating time–sodium carbonate dosage plot.
Minerals 07 00010 g005aMinerals 07 00010 g005b
Figure 6. (a) Response surface of heating temperature–sodium carbonate dosage; (b) contour of heating temperature–sodium carbonate dosage plot.
Minerals 07 00010 g006
Table 1. The chemical composition of the ferric bauxite adopted.
CompositionsFe2O3Al2O3SiO2TiO2MgOCaONa2OK2OP2O5LOI
Content/%41.1333.0212.221.490.680.630.320.060.048.97
Table 2. Proximate analysis of the coal used.
CompositionsTotal Moisture (Mt)Volatiles (Vad)Ash (Aad)Fixed Carbon (FCad)
Content/%9.1639.425.0746.35
Table 3. Inorganic composition of coal ash.
ComponentSiO2Al2O3Fe2O3MgOCaONa2OK2OTiO2P2O5
Content/%38.021.3736.191.97.150.431.380.840.41
Table 4. Box–Benhken design and experiment results.
No.Experimental FactorsηN (%)
Heating Temperature (°C)Heating Time (min)Sodium Carbonate Dosage (%)
1103549.58566.05
2103540.58567.04
310354593.566.49
410354576.567.56
5115049.576.563.75
6115049.593.560.68
7115040.576.564.04
8115040.593.559.70
91150458559.23
101150458559.31
111150458559.55
121150458559.12
131150458559.47
1412654576.550.81
1512654593.551.52
16126540.58546.63
17126549.58545.30
Table 5. Variance analysis of regression models.
SourceSum of SquaresDfMean SquaresFP-Value Prob > FResult
Model740.12982.2430.95<0.0001Significant
A663.851663.85249.85<0.0001Significant
B0.0310.030.130.7736-
C7.5417.542.840.1359-
AB0.02810.0280.010.9213-
AC0.7910.790.30.6033-
BC0.4110.410.150.7077-
A238.27138.2714.40.0068-
B20.01710.0176.4378 × 10−30.9383-
C232.41132.4112.20.01-
Residual18.672.66---
Lack of Fit18.4836.16203.26<0.0001-
Pure Error0.1240.03---
Cor Total758.7216----
Table 6. Confidence analysis of the quadratic model. VIF: variance inflation factor.
FactorCoefficient EstimateDfStandard Error95% Cl Low95% Cl HighVIF
Intercept59.3310.7357.6161.06-
A-Temperature−9.1110.58−10.47−7.751.00
B-Time−0.210.58−1.571.161.00
C-sodium carbonate−0.9710.58−2.330.391.00
AB−0.08310.82−2.011.841.00
AC0.4410.82−1.482.371.00
BC0.3210.82−1.612.251.00
A2−0.3110.79−4.89−1.141.01
B2−0.06410.79−1.941.811.01
C20.2710.790.94.651.01

