
In Situ AFM Study of Crystal Growth on a Barite (001) Surface in BaSO4 Solutions at 30 °C

Abstract
:1. Introduction
2. Materials and Methods
2.1. Materials and Solutions
2.2. Barite Growth Experiments and AFM Imaging
3. Results
4. Discussion
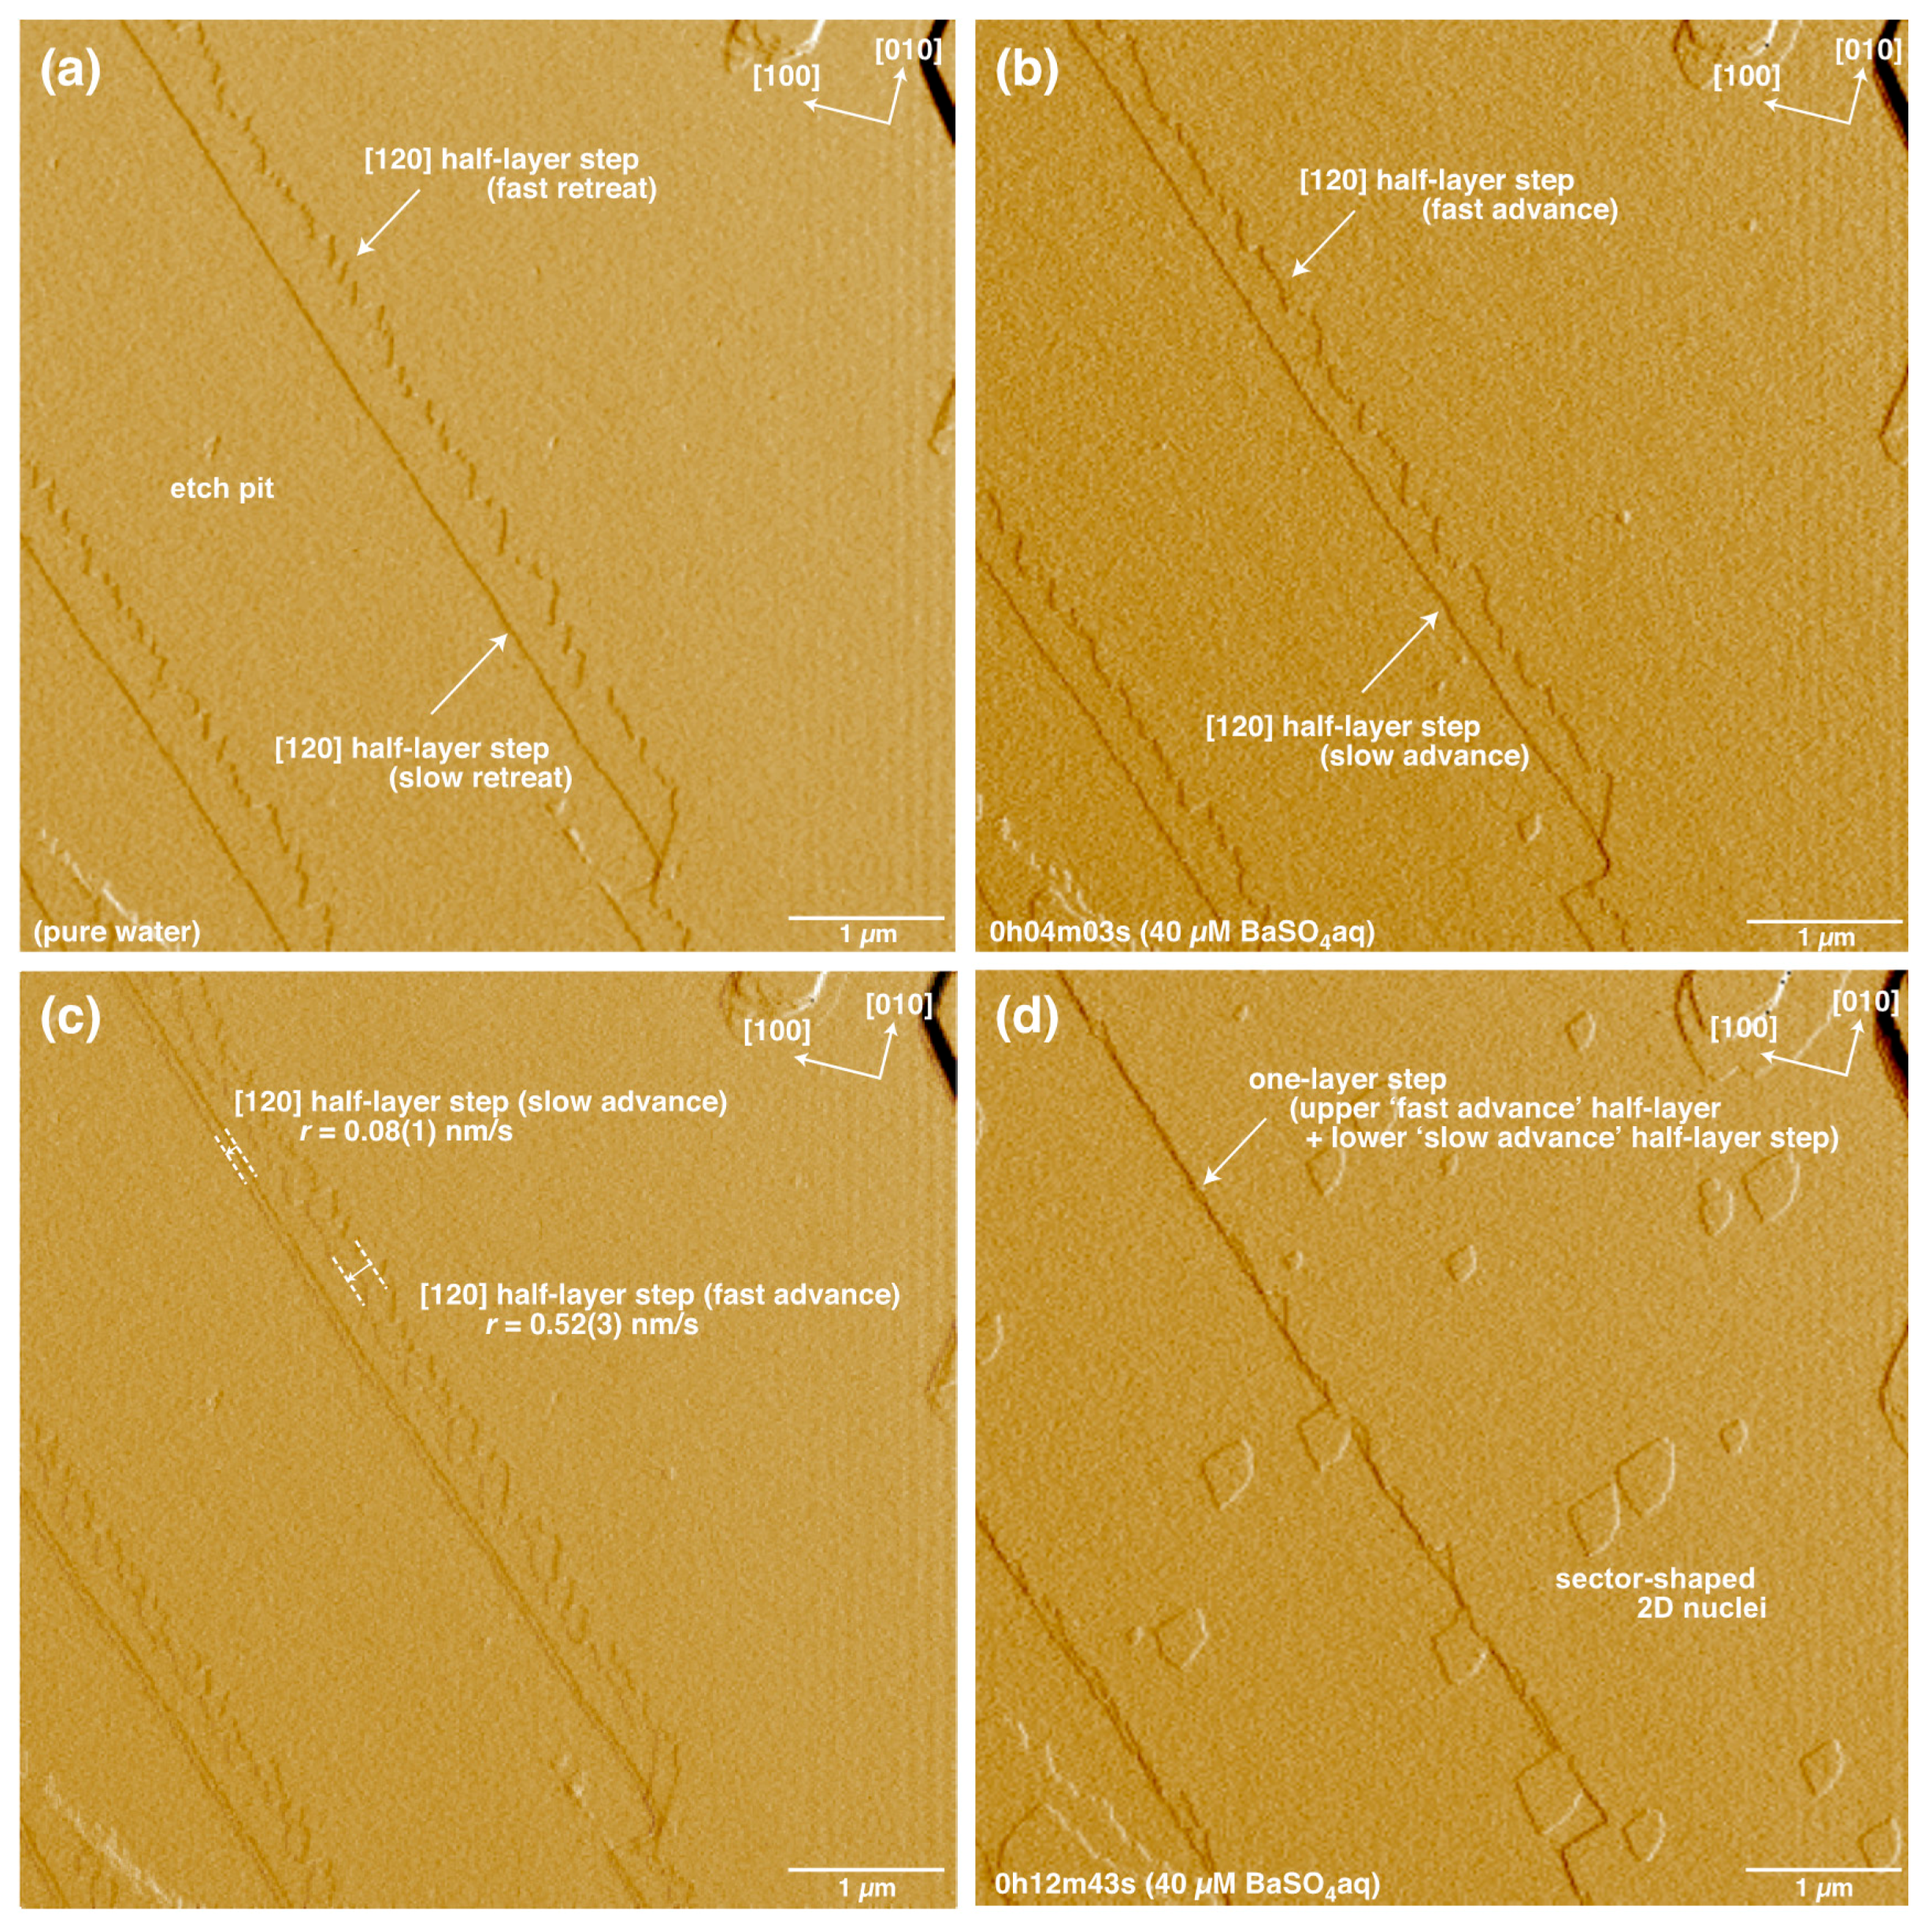
4.1. Advance and Retreat Behavior of the Steps
4.2. Growth Spiral Formation and Development
4.3. Formation and Growth of 2D Nuclei
4.4. Implication of Microscopic Growth Kinetic Data for Macroscopic Features
5. Conclusions
Acknowledgments
Author Contributions
Conflicts of Interest
References
- Gaines, R.V.; Skinner, H.C.W.; Foord, E.E.; Mason, B.; Rosenzweig, A. Dana’s New Mineralogy, 8th ed.; John Wiley & Sons: New York, NY, USA, 1997; pp. 571–582. [Google Scholar]
- Hanor, J.S. Barite-Celestine geochemistry and environments of formation. In Sulfate Minerals–Crystallography, Geochemistry, and Environmental Significance. Reviews in Mineralogy and Geochemistry; Alpers, C.N., Jambor, J.L., Nordstrom, D.K., Eds.; Mineralogical Society of America: Chantilly, VA, USA, 2000; Volume 40, pp. 193–275. [Google Scholar]
- Griffith, E.M.; Paytan, A. Barite in the ocean—Occurrence, geochemistry and palaeoceanographic applications. Sedimentology 2012, 59, 1817–1835. [Google Scholar] [CrossRef]
- Bosbach, D.; Hall, C.; Putnis, A. Mineral precipitation and dissolution in aqueous solution: In-situ microscopic observations on barite (001) with atomic force microscopy. Chem. Geol. 1998, 151, 143–160. [Google Scholar] [CrossRef]
- Putnis, C.V.; Kowacz, M.; Putnis, A. The mechanism and kinetics of DTPA-promoted dissolution of barite. Appl. Geochem. 2008, 23, 2778–2788. [Google Scholar] [CrossRef]
- Wang, K.S.; Resch, R.; Koel, B.E.; Shuler, P.J.; Tang, Y.; Chen, H.J. Study of the dissolution of the barium sulfate (001) surface with hydrochloric acid by atomic force microscopy. J. Colloid Interface Sci. 1999, 219, 212–215. [Google Scholar] [CrossRef] [PubMed]
- Wang, K.S.; Resch, R.; Dunn, K.; Shuler, P.; Tang, Y.; Koel, B.E.; Yen, T.F. Dissolution of the barite (001) surface by the chelating agent DTPA as studied with non-contact atomic force microscopy. Colloids Surf. 1999, 160, 217–227. [Google Scholar] [CrossRef]
- Risthaus, P.; Bosbach, D.; Becker, U.; Putnis, A. Barite scale formation and dissolution at high ionic strength studied with atomic force microscopy. Colloids Surf. 2001, 191, 201–214. [Google Scholar] [CrossRef]
- Becker, U.; Biswas, S.; Kendall, T.; Risthaus, P.; Putnis, C.V.; Pina, C.M. Interactions between mineral surfaces and dissolved species: From monovalent ions to complex organic molecules. Am. J. Sci. 2005, 305, 791–825. [Google Scholar] [CrossRef]
- Brandt, F.; Curti, E.; Klinkenberg, M.; Rozov, K.; Bosbach, D. Replacement of barite by a (Ba,Ra)SO4 solid solution at close-to-equilibrium conditions: A combined experimental and theoretical study. Geochim. Cosmochim. Acta 2015, 155, 1–15. [Google Scholar] [CrossRef]
- Culti, E.; Fujiwara, K.; Iijima, K.; Tits, J.; Cuesta, C.; Kitamura, A.; Glaus, M.A.; Müller, W. Radium uptake during barite recrystallization at 23 ± 2 °C as a function of solution composition: An experimental 133Ba and 226Ra tracer study. Geochim. Cosmochim. Acta 2010, 74, 3553–3570. [Google Scholar]
- De Yoreo, J.J.; Dove, P.M. Shaping crystals with biomolecules. Science 2004, 306, 1301–1302. [Google Scholar] [CrossRef] [PubMed]
- Kowacz, M.; Putnis, A. The effect of specific background electrolytes on water structure and solute hydration: Consequences for crystal dissolution and growth. Geochim. Cosmochim. Acta 2008, 72, 4476–4487. [Google Scholar] [CrossRef]
- Bosbach, D.; Charlet, L.; Bickmore, B.; Hochella, M.F., Jr. The dissolution of hectorite: In-situ, real-time observations using atomic force microscopy. Am. Mineral. 2000, 85, 1209–1216. [Google Scholar] [CrossRef]
- Kuwahara, Y. In situ Atomic Force Microscopy study of dissolution of the barite (001) surface in water at 30 °C. Geochim. Cosmochim. Acta 2011, 75, 41–51. [Google Scholar] [CrossRef]
- Kuwahara, Y. In situ hot-stage AFM study of the dissolution of the barite (001) surface in water at 30–55 °C. Am. Mineral. 2012, 97, 1564–1573. [Google Scholar] [CrossRef]
- Pina, C.M.; Becker, U.; Risthaus, P.; Bosbach, D.; Putnis, A. Molecular-scale mechanisms of crystal growth in barite. Nature 1998, 395, 483–486. [Google Scholar]
- Pina, C.M.; Bosbach, D.; Prieto, M.; Putnis, A. Microtopography of the barite (001) face during growth: AFM observations and PBC theory. J. Cryst. Growth 1998, 187, 119–125. [Google Scholar] [CrossRef]
- Higgins, S.R.; Bosbach, D.; Eggleston, C.M.; Knauss, K.G. Kink dynamics and step growth on barium sulfate (001): A hydrothermal scanning probe microscopy study. J. Phys. Chem. B 2000, 104, 6978–6982. [Google Scholar] [CrossRef]
- Becker, U.; Risthaus, P.; Bosbach, D.; Putnis, A. Selective attachment of monovalent background electrolyte ions and growth inhibitors to polar steps on sulfates as studied by molecular simulations and AFM observations. Mol. Simul. 2002, 28, 607–632. [Google Scholar] [CrossRef]
- Bosbach, D. Linking molecular-scale barite precipitation mechanisms with macroscopic crystal growth rates. In Water-Rock Interactions, Ore Deposits, and Environmental Geochemistry: A Tribute to David A. Crerar; Hellmann, R., Wood, S.A., Eds.; The Geochemical Society: St. Louis, MO, USA, 2002; Special Publication No. 7; pp. 97–110. [Google Scholar]
- Kuwahara, Y.; Ishida, K.; Uehara, S.; Kita, I.; Nakamuta, Y.; Hayashi, T.; Fujii, R. Cool-stage AFM, a new AFM method for in situ observations of mineral growth and dissolution at reduced temperature: Investigation of the responsiveness and accuracy of the cooling system and a prelim experiment on barite growth. Clay Sci. 2012, 16, 111–119. [Google Scholar]
- Ruiz-Agudo, C.; Putnis, C.V.; Putnis, A. The effect of a copolymer inhibitor on baryte precipitation. Mineral. Mag. 2014, 78, 1423–1430. [Google Scholar] [CrossRef]
- Kuwahara, Y.; Makio, M. In situ AFM study on barite (001) surface dissolution in NaCl solutions at 30 °C. Appl. Geochem. 2014, 51, 246–254. [Google Scholar] [CrossRef]
- Parkhurst, D.L.; Appelo, C.A.J. User’s Guide to PHREEQC (Version 2)—A Computer Program for Speciation, Batch-Reaction, One-Dimensional Transport, and Inverse Geochemical Calculations; U.S. Geological Survey; U.S. Department of the Interior: Washington, DC, USA, 1999.
- Henry Teng, H.; Dove, P.M.; De Yoreo, J.J. Kinetics of calcite growth: Surface processes and relationships to macroscopic rate laws. Geochim. Cosmochim. Acta 2000, 64, 2255–2266. [Google Scholar] [CrossRef]
- Kowacz, M.; Putnis, C.V.; Putnis, A. The effect of cation: Anion ratio in solution on the mechanism of barite growth at constant supersaturation: Role of the desolvation process on the growth kinetics. Geochim. Cosmochim. Acta 2007, 71, 5168–5179. [Google Scholar] [CrossRef]
- Zhang, F.; Yan, C.; Henry Teng, H.; Roden, E.E.; Xu, H. In situ AFM observations of Ca-Mg carbonate crystallization catalyzed by dissolved sulfide: Implications for sedimentary dolomite formation. Geochim. Cosmochim. Acta 2013, 105, 44–55. [Google Scholar] [CrossRef]
- Kuwahara, Y. In situ observations of muscovite dissolution under alkaline conditions at 25–50 °C by AFM with an air/fluid heater system. Am. Mineral. 2008, 93, 1209–1216. [Google Scholar] [CrossRef]
- Kuroda, T. Crystal Lives (Kesshou-ha-ikiteiru): The Mechanism of Its Growth and Transformation of Morphology; Science-sha: Tokyo, Japan, 1984. (In Japanese) [Google Scholar]
- Hill, R.J. A further refinement of the barite structure. Can. Mineral. 1977, 15, 522–526. [Google Scholar]
- Higgins, S.R.; Jordan, G.; Eggleston, C.M. Dissolution kinetics of the barium sulfate (001) surface by hydrothermal atomic force microscopy. Langmuir 1998, 14, 4967–4971. [Google Scholar] [CrossRef]
- Bracco, J.N.; Gooijer, Y.; Higgins, S.R. Hydrothermal atomic force microscopy observantions of barite step growth rates as a function of the aqueous barium-to-sulfate ratio. Geochim. Cosmochim. Acta 2016, 183, 1–13. [Google Scholar] [CrossRef]
- Stack, A.G.; Raiteri, P.; Gale, J.D. Accurate rates of the complex mechanisms for growth and dissolution of minerals using a combination of rare-event theories. J. Am. Chem. Soc. 2012, 134, 11–14. [Google Scholar] [CrossRef] [PubMed]
- Stack, A.G. Molecular dynamics simulations of solvation and kink site formation at the {001} barite-water interface. J. Phys. Chem. C 2009, 113, 2104–2110. [Google Scholar] [CrossRef]
- Brice, J.C. The Growth of Crystals from Liquids. In Selected Topics in Solid State Physics; Wohlfarth, E.P., Ed.; North-Holland Publishing Company: Amsterdam, The Netherlands, 1973. [Google Scholar]
- Brice, J.C. Crystal Growth Processes; Blackie Halsted Press: Glasgow/London, UK, 1986. [Google Scholar]
- Burton, W.K.; Cabrera, N.; Frank, F.C. The growth of crystals and the equilibrium structure of their surfaces. Philos. Trans. R. Soc. Lond. A 1951, 243, 299–358. [Google Scholar] [CrossRef]
- Zhang, J.; Nancollas, G.H. Kink densities along a crystal surface step at low temperatures and under nonequilibrium conditions. J. Cryst. Growth 1990, 106, 181–190. [Google Scholar] [CrossRef]
- Zhang, J.; Nancollas, G.H. Kink density and rate of step movement during growth and dissolution of an AB crystal in a nonstoichiometric solution. J. Colloid Interface Sci. 1998, 200, 131–145. [Google Scholar] [CrossRef]
- Morales, J.; Astilleros, J.M.; Fernández-Díaz, L. Nanoscopic characteristics of anhydrite (001) growth. Cryst. Growth Des. 2012, 12, 414–421. [Google Scholar] [CrossRef]
- Chernov, A.A. The Spiral Growth of Crystals. Sov. Phys. Uspekhi 1961, 4, 116–148. [Google Scholar] [CrossRef]
- Chernov, A.A. Modern Crystallography III. Crystal Growth; Springer Series in Solid-State Science; Springer: Berlin/Heidelberg, Germany, 1984. [Google Scholar]
- Walton, A.G. Nucleation in Liquids and Solutions. In Nucleation; Zettlemoyer, A.C., Ed.; Marcel Dekker Inc.: New York, NY, USA, 1969; pp. 225–307. [Google Scholar]
- Godinho, J.R.A.; Stack, A.G. Growth kinetics and morphology of barite crystals derived from face-specific growth rates. Cryst. Growth Des. 2015, 15, 2064–2071. [Google Scholar] [CrossRef]
- Shikazono, N. Precipitation mechanisms of barite in sulfate-sulfide deposits in back-arc basins. Geochim. Cosmochim. Acta 1994, 58, 2203–2213. [Google Scholar] [CrossRef]
- Paytan, A.; Mearon, S.; Cobb, K.; Kastner, M. Origin of marine barite deposits: Sr and S isotope characterization. Geology 2002, 30, 747–750. [Google Scholar] [CrossRef]
- Ray, D.; Kota, D.; Das, P.; Surya Prakash, L.; Khedekar, V.D.; Paropkari, A.L.; Mudholkar, A.V. Microtexture and distribution of minerals in hydrothermal barite-silica chimney from the Franklin seamount, SW Pacific: Constraints on the mode of formation. Acta Geol. Sin. 2014, 88, 213–225. [Google Scholar]
- Pina, C.M.; Enders, M.; Putnis, A. The composition of solid solutions crystallising from aqueous solutions: The influence of supersaturation and growth mechanisms. Chem. Geol. 2000, 168, 198–210. [Google Scholar] [CrossRef]
- Dinamani, M.; Kamath, P.V.; Seshadri, R. Electrochemical deposition of BaSO4 coatings on stainless steel substrates. Chem. Mater. 2001, 13, 3981–3985. [Google Scholar] [CrossRef]
- Mavredaki, E.; Neville, A.; Sorbie, K.S. Assessment of barium sulphate formation and inhibition at surfaces with synchrotron X-ray diffraction (SXRD). Appl. Surf. Sci. 2011, 257, 4264–4271. [Google Scholar] [CrossRef]
- Mavredaki, E.; Neville, A.; Sorbie, K.S. Initial stages of barium sulfate formation at surfaces in the presence of inhibitors. Cryst. Growth Des. 2011, 11, 4751–4758. [Google Scholar] [CrossRef]


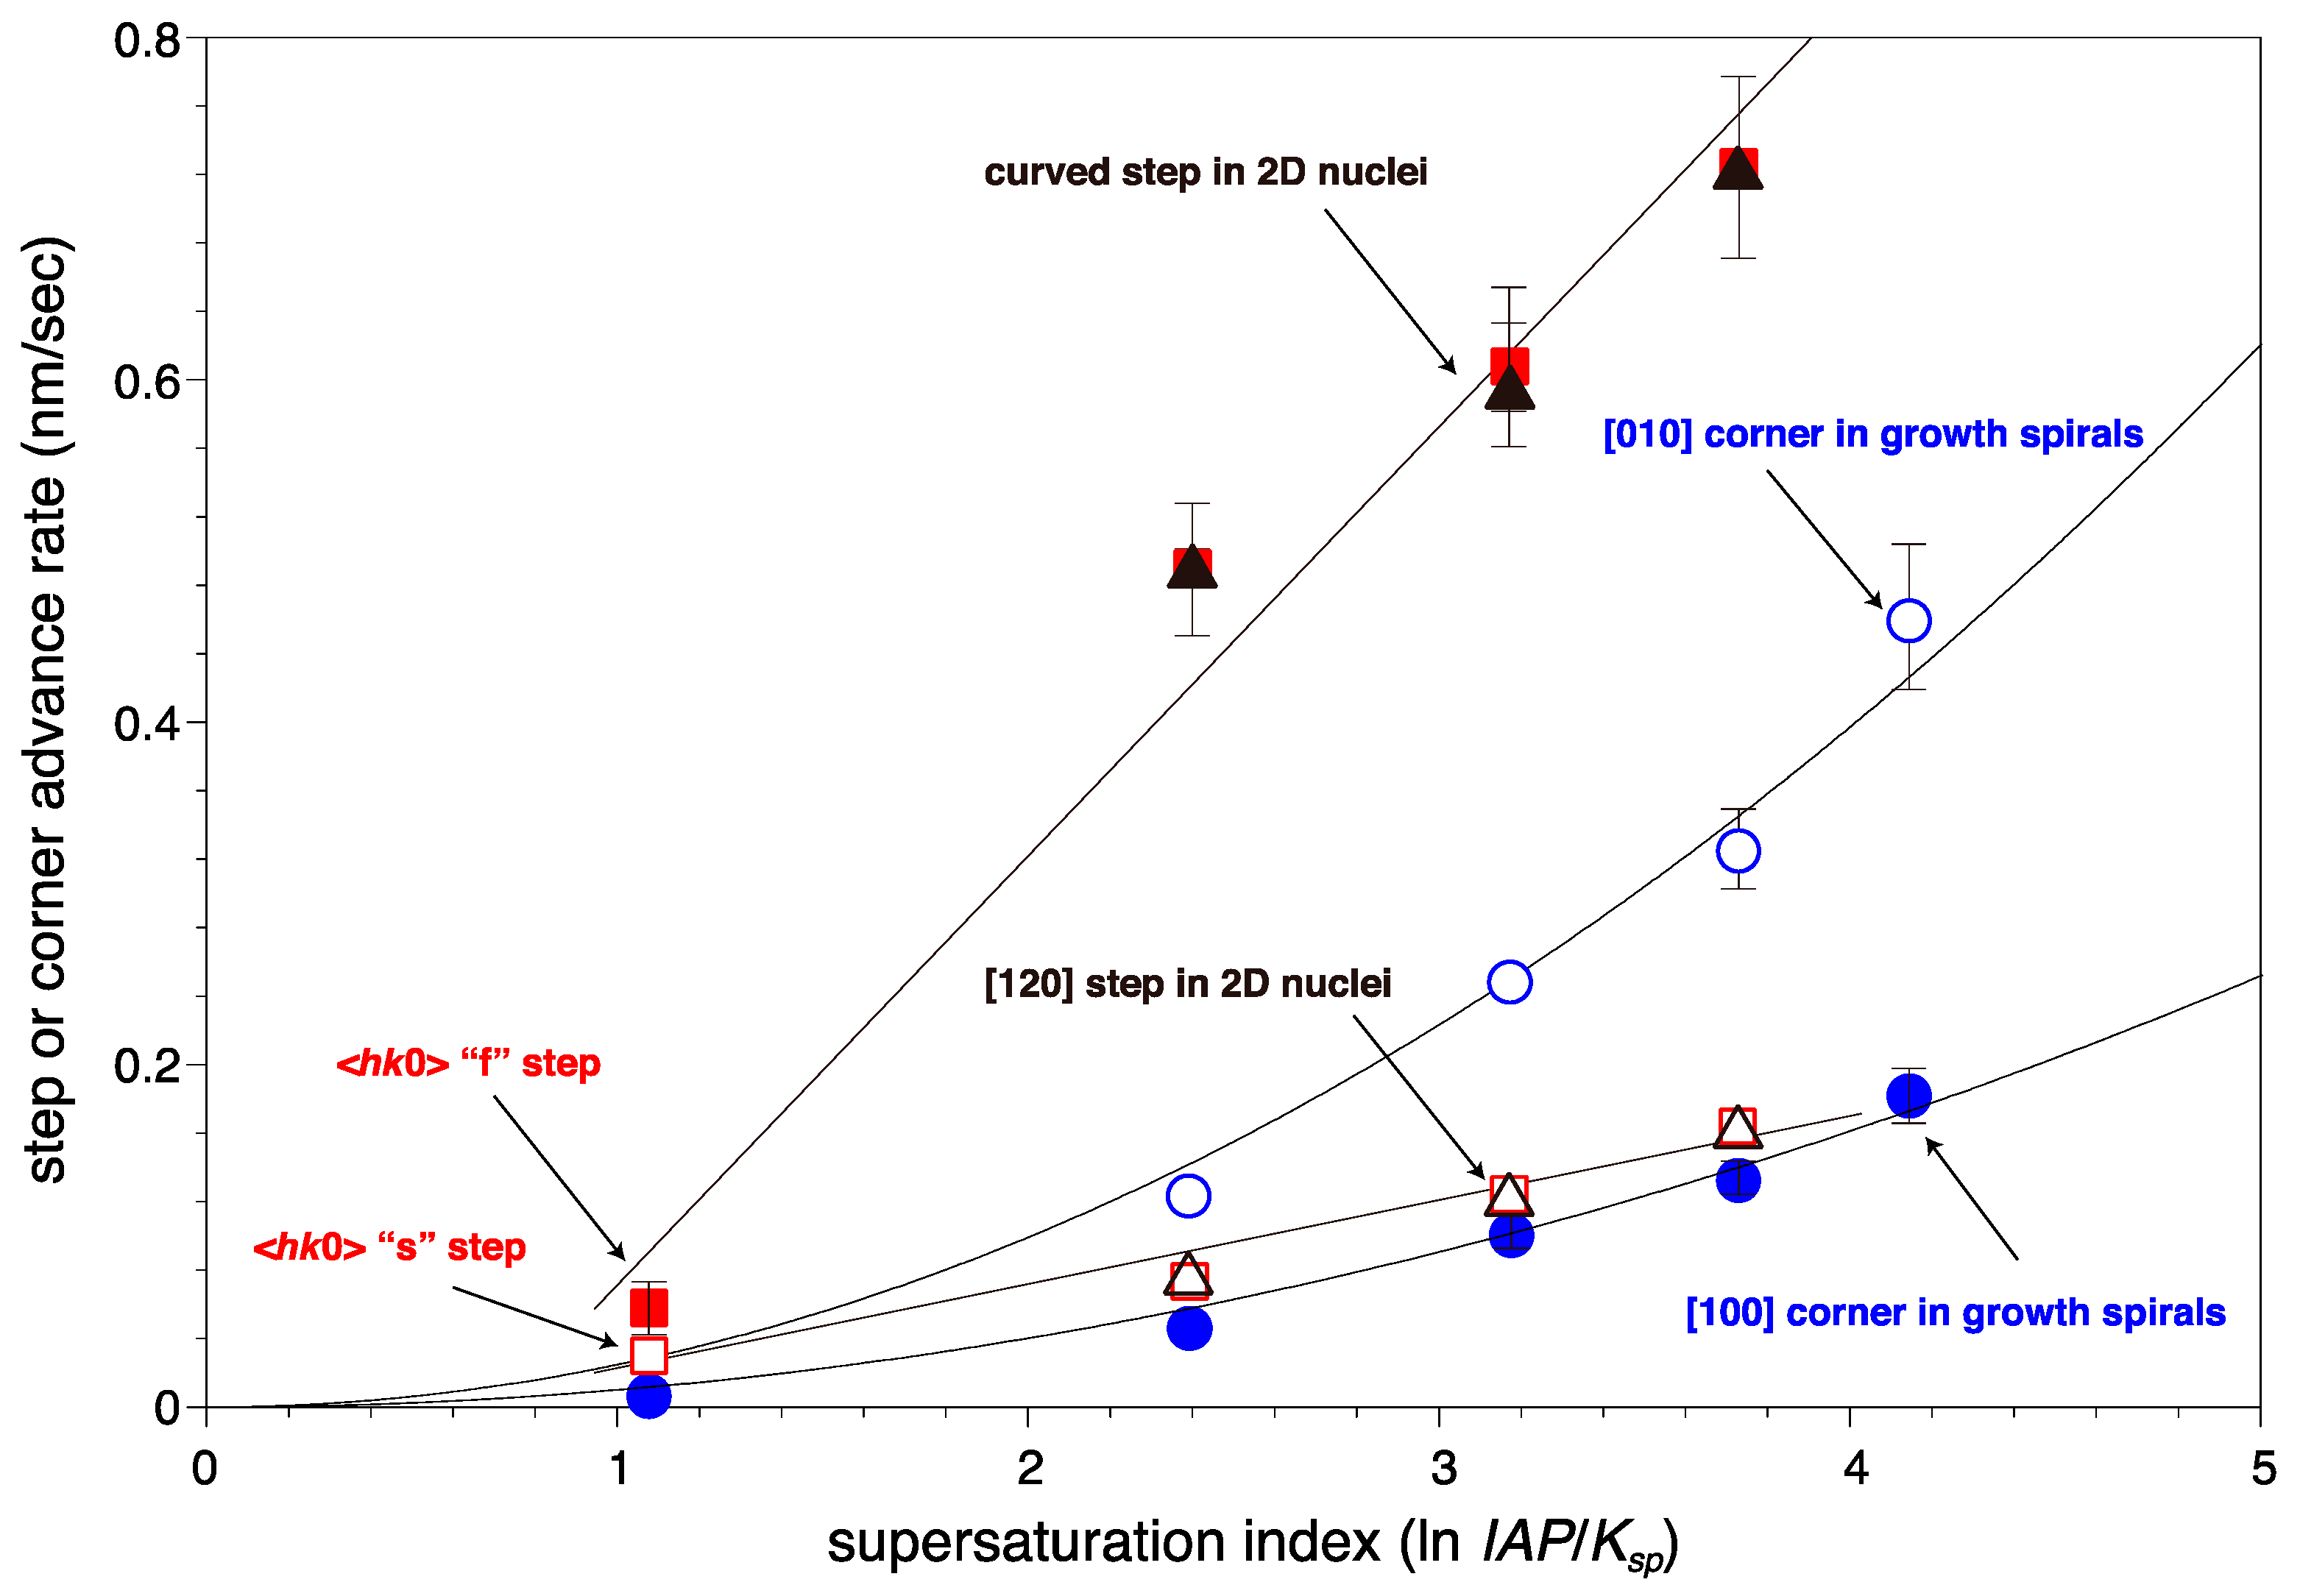
| BaSO4 Concentration (µM) | Advance Rates of Steps on the (001) Surface (nm/s) | ||||
|---|---|---|---|---|---|
| <uv0> * “f” Step with Half-Layer | <uv0> * “s” Step with Half-Layer | <uv0> * Step with One Layer (“f” upper + “s” Lower Half-Layers) | [010] “f” Step with Half-Layer | [010] “s” Step with Half-Layer | |
| 20 | 0.06 ± 0.01 | 0.03 ± 0.01 | 0.03 ± 0.01 | 0.05 ±0.01 | 0.02 ±0.01 |
| 40 | 0.50 ± 0.03 | 0.08 ± 0.01 | 0.12 ± 0.01 | 0.51 ± 0.02 | 0.07 ±0.01 |
| 60 | 0.62 ± 0.03 | 0.12 ± 0.01 | 0.21 ± 0.01 | 0.62 ± 0.03 | 0.11 ± 0.01 |
| 80 | 0.73 ± 0.05 | 0.16 ± 0.01 | - ** | - ** | - ** |
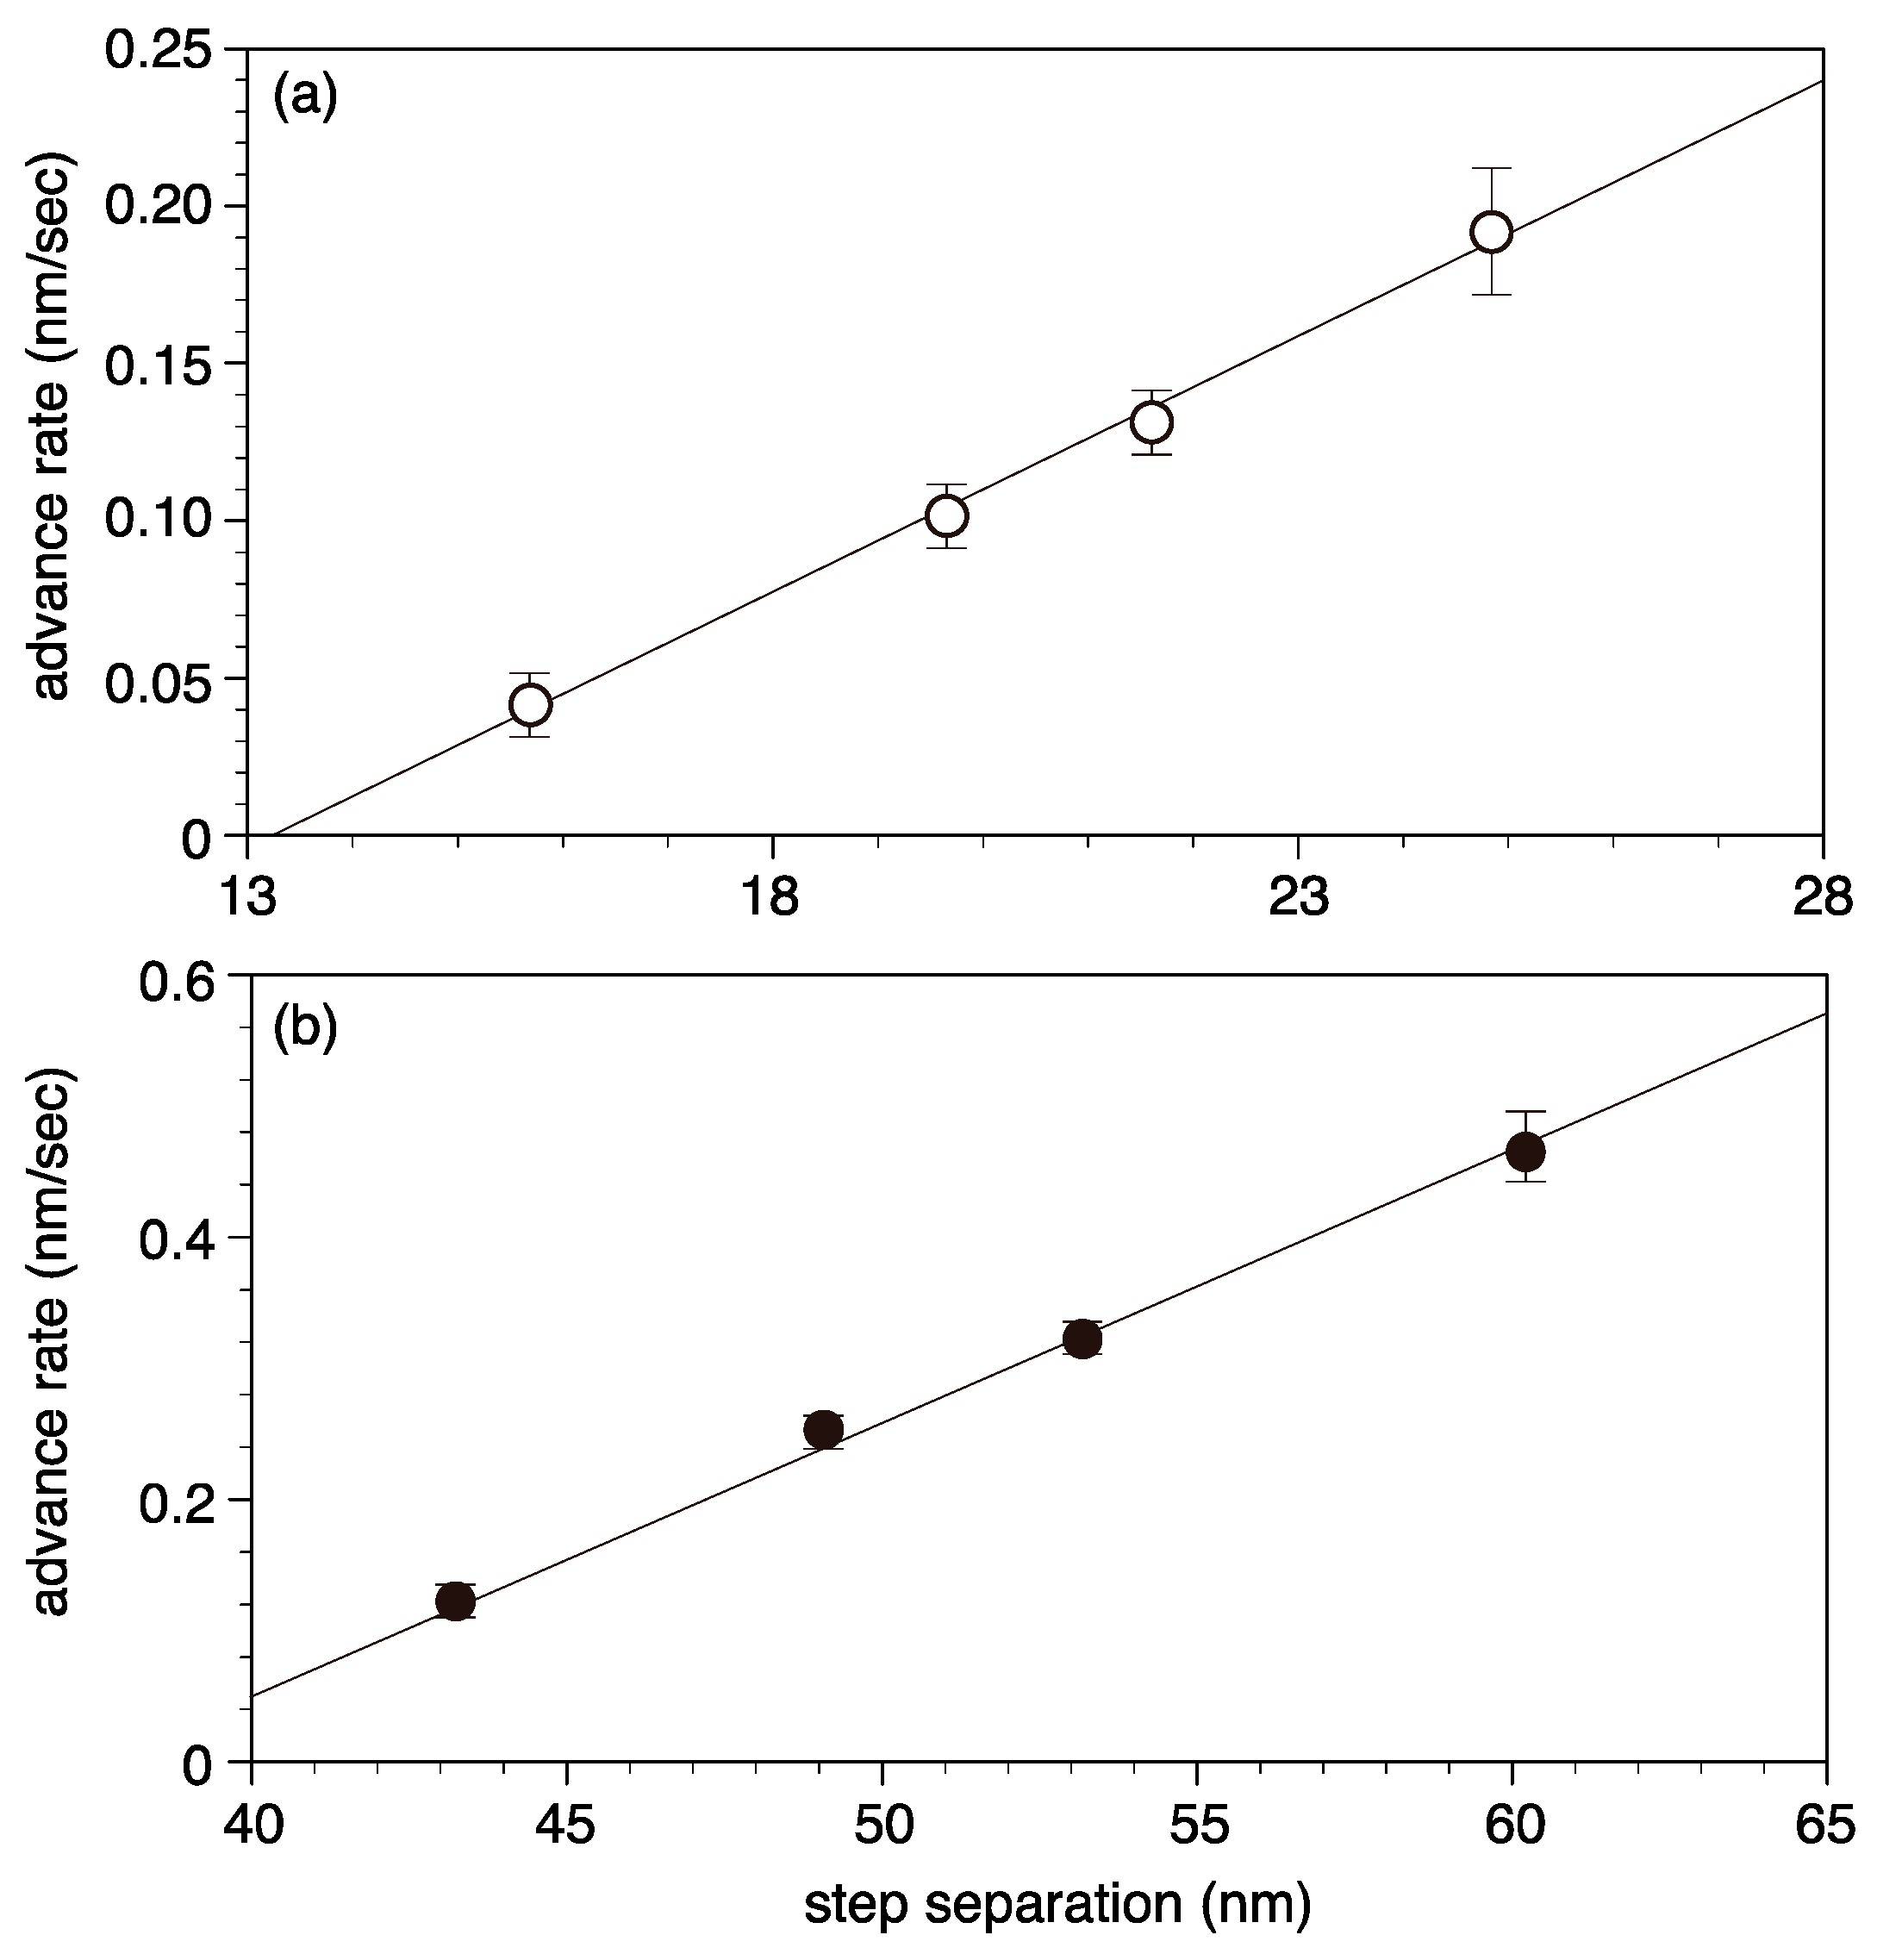
| BaSO4 Concentration (µM) | Face or Corner Advance Rates in the Growth Spirals | The Ratio of the Advance Rates in the Growth Spirals | Mean Step Separations * (nm) | |||||
|---|---|---|---|---|---|---|---|---|
| [100] Corner (nm/s) | [010] Corner (nm/s) | (001) (nm/min) | (001)/[100] | (001)/[010] | [010]/[100] | [100] | [010] | |
| 20 | (0.002) ** | (0.006) ** | (0.006) ** | |||||
| 40 | 0.04 ± 0.01 | 0.11 ± 0.01 | 0.11 ± 0.02 | 4.58 × 10⁻² | 1.67 × 10⁻² | 2.9 | 15.7 | 43.2 |
| 60 | 0.10 ± 0.01 | 0.25 ± 0.01 | 0.22 ± 0.05 | 3.67 × 10⁻² | 1.47 × 10⁻² | 2.5 | 19.6 | 49.1 |
| 80 | 0.13 ± 0.01 | 0.32 ± 0.02 | 0.26 ± 0.05 | 3.33 × 10⁻² | 1.35 × 10⁻² | 2.4 | 21.6 | 53.2 |
| 100 | 0.19 ± 0.02 | 0.46 ± 0.04 | 0.33 ± 0.09 | 2.89 × 10⁻² | 1.20 × 10⁻² | 2.4 | 24.9 | 60.2 |
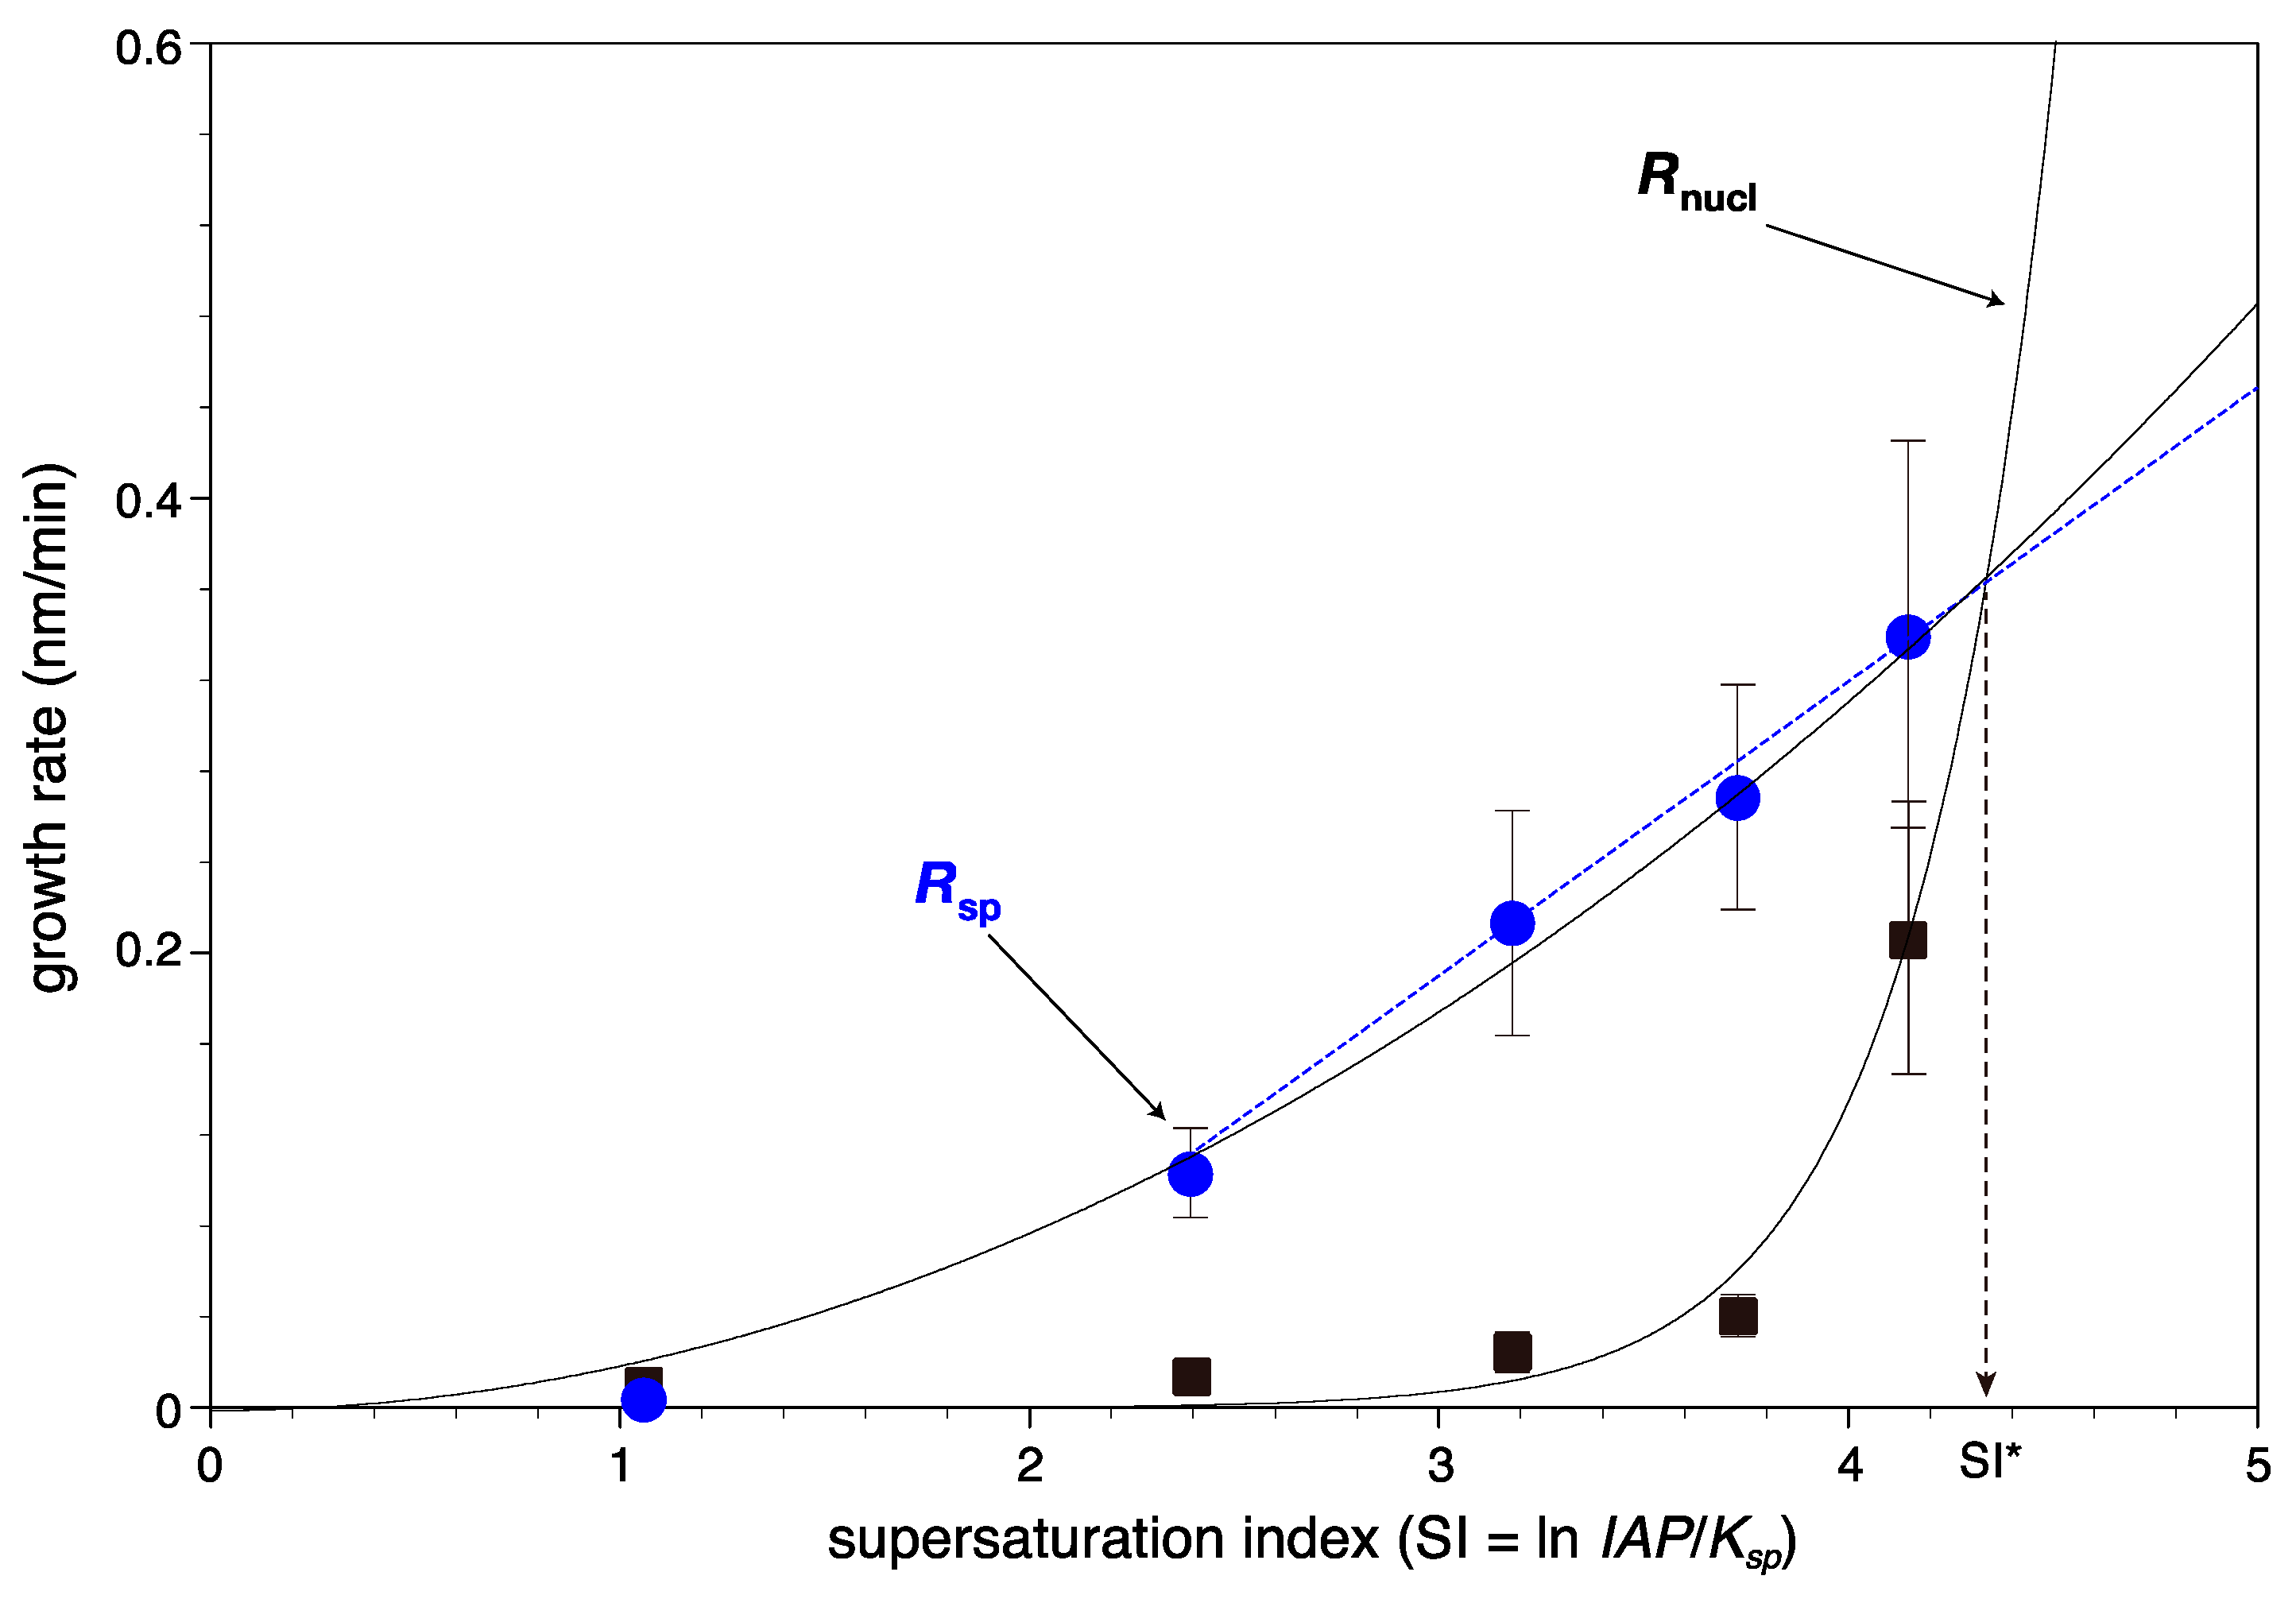
| BaSO4 Concentration (µM) | Advance Rates of the Steps (nm/s) | Growth Rates toward the [001] Direction (nm/min) | Nucleation Rates (N/(µm2·min)) | |
|---|---|---|---|---|
| [120] Step | Curved Step | |||
| 40 | 0.08 ± 0.01 | 0.50 ± 0.02 | 0.012 ± 0.001 | 0.029 ± 0.007 |
| 60 | 0.12 ± 0.01 | 0.60 ± 0.02 | 0.022 ± 0.002 | 0.030 ± 0.008 |
| 80 | 0.16 ± 0.01 | 0.73 ± 0.05 | 0.041 ± 0.002 | 0.14 ± 0.08 |
| 100 | - * | - * | 0.21 ± 0.06 | 2.2 ± 0.3 |
| BaSO4 Concentration (µM) | Spiral Growth Rate * (×10−9 mol/(m2·s)) | 2D Growth Rate ** (×10−9 mol/(m2·s)) | Total Growth Rate (×10−9 mol/(m2·s)) |
|---|---|---|---|
| 40 | 1.3 ± 0.5 | 3.3 ± 0.8 | 5 ± 1 |
| 60 | 3.1 ± 1.2 | 3.7 ± 1.0 | 7 ± 2 |
| 80 | 4.0 ± 1.7 | 7.1 ± 4.1 | 11 ± 6 |
| 100 | 5.7 ± 2.4 | 20 ± 1 | 26 ± 4 |
© 2016 by the authors; licensee MDPI, Basel, Switzerland. This article is an open access article distributed under the terms and conditions of the Creative Commons Attribution (CC-BY) license (http://creativecommons.org/licenses/by/4.0/).
Share and Cite
Kuwahara, Y.; Liu, W.; Makio, M.; Otsuka, K. In Situ AFM Study of Crystal Growth on a Barite (001) Surface in BaSO4 Solutions at 30 °C. Minerals 2016, 6, 117. https://doi.org/10.3390/min6040117
Kuwahara Y, Liu W, Makio M, Otsuka K. In Situ AFM Study of Crystal Growth on a Barite (001) Surface in BaSO4 Solutions at 30 °C. Minerals. 2016; 6(4):117. https://doi.org/10.3390/min6040117
Chicago/Turabian StyleKuwahara, Yoshihiro, Wen Liu, Masato Makio, and Keisuke Otsuka. 2016. "In Situ AFM Study of Crystal Growth on a Barite (001) Surface in BaSO4 Solutions at 30 °C" Minerals 6, no. 4: 117. https://doi.org/10.3390/min6040117