Article

Mapping of Sulfur Isotopes and Trace Elements in Sulfides by LA-(MC)-ICP-MS: Potential Analytical Problems, Improvements and Implications

1
State Key Laboratory for Mineral Deposits Research, Department of Earth Sciences, Nanjing University, Nanjing 210093, China
2
School of Chemical Engineering, The University of Adelaide, Adelaide 5005, SA, Australia
3
State Key Laboratory of Geological Processes and Mineral Resources, Faculty of Earth Resources, Collaborative Innovation Center for Exploration of Strategic Mineral Resources, China University of Geosciences, Wuhan 430074, China
*
Author to whom correspondence should be addressed.
Minerals 2016, 6(4), 110; https://doi.org/10.3390/min6040110
Submission received: 7 July 2016 / Revised: 17 August 2016 / Accepted: 22 August 2016 / Published: 20 October 2016
(This article belongs to the Special Issue Advances in Mineral Analytical Techniques)

Abstract

:
Constraints on accurate quantitative trace element and sulfur (S) isotope analysis of sulfide minerals, especially pyrite, by laser-ablation inductively coupled plasma mass spectrometry (LA-ICP-MS) remain imperfectly understood at the present time. Mapping of S isotope distributions within a complex sample containing several minerals requires an evaluation of the matrix effects and accuracy. Here, we apply LA-Q(quadrupole)-ICP-MS and LA-MC(multiple collector)-ICP-MS methods to analyze trace elements and S isotopes in sulfides. Spot analysis of S isotopes was conducted to evaluate the influence of matrix effects. The matrix effects from siderite and magnetite are deemed to be negligible in mapping analysis at the precision of this study. Both Fe and S were used as internal standard elements to normalize trace element concentrations in pyrite. Fe proved to be the better choice because the normalized counts per second ratio of trace elements with Fe is much more stable than if using S. A case study of a sulfide sample from the Chengmenshan Cu deposit, Jiangxi Province, South China, demonstrates the potential of combined S isotope and trace element mapping by LA-(MC)-ICP-MS. The results suggest that this deposit underwent multi-stage ore formation. Elements, including Au and Ag, were hosted in early-stage pyrite but were re-concentrated into multi-component sulfide assemblages during a late-stage hydrothermal event, which also led to crosscutting veins containing pyrite largely devoid of trace elements, except Se. Combining in situ S isotope and trace element analysis on the same sample represents a powerful tool for understanding ore-forming processes.

1. Introduction

In hydrothermal ore deposits, sulfur isotope systematics and the concentration of trace elements in sulfides are closely related to those in the ore-forming fluids. Changes in physicochemical conditions or sulfur source will result in variation of the sulfur (S) isotope signature of sulfide minerals [1]. Investigation of the S-isotope and trace element signatures of sulfides can thus help to interpret ore-forming processes. Sulfur isotopes have been investigated in a wide range of geological environments, including metamorphosed volcanic-hosted massive sulfide VMS deposits [1], seafloor diagenetic/hydrothermal environments [2], sedimentary deposits [3], and many others. Due to the rapid development of laser ablation systems and mass spectrometry in the last two decades, in situ S isotope [4,5,6] and trace element analysis [7,8] of sulfides has become both viable and widely applied. Such in situ techniques can distinguish S isotope and trace element patterns in individual generations of minerals that derive from different stages of ore formation. Such discrimination is often difficult or impossible to achieve using traditional bulk sampling and analysis techniques.
Isotopic and elemental mapping of samples by laser ablation (multi-collector) inductively coupled plasma mass spectrometry (LA-(MC)-ICP-MS) significantly expands the applications of this in-situ technique, allowing a clear visualization of spatial relationships and variation at the grain scale. LA-ICP-MS mapping has been applied to a variety of geological samples to study magmatic evolution [9], the distribution of platinum group elements (PGE) in sulfides [10], to develop solid standards [11], to understand substitutions and distribution mechanisms among element pairs [12,13], ore forming processes [14,15,16], and many other applications.
It is worth noting that, although mapping of radiogenic isotopes has been achieved (87Sr/86Sr) [17], stable isotopic mapping has not been widely performed by LA-MC-ICP-MS due to the potential of matrix effects. For example, when mapping S isotope variation on the surface of a sample, many other minerals co-existing with sulfides may also be present, and will be collaterally analyzed. An evaluation of potential matrix effects, and their implications for accurate measurement of S isotopes, is thus a pre-requisite before applying mapping techniques to complex multi-phase samples. The matrix effects of Ca on S isotope analysis in wet plasma were investigated in detail by Pribil et al. [18] and Liu et al. [19].
There is, at present, no perfect solution for quantitative trace element mapping of samples containing multiple minerals. Paul et al. [20] suggest to spatially register the element map with principal component analysis, segment the phases, normalize them with different internal standards and generate the map through iterative calculations. In previous quantitative spot trace element studies, both S or Fe have been used as an internal element standard [13,21,22]. However, one recent study [23] identified decomposition of pyrite during laser ablation into at least two phases, and subsequent disproportionate transport of materials to the mass spectrometer, leading us to re-evaluate which element, Fe or S, is the better choice as an internal standard element. Hence, given the intention to produce isotopic and trace element maps that complement one another, we also explore a suitable internal standard element for quantitative trace element analysis of pyrite.
The present study aims at introducing a methodology for S isotope mapping by LA-(MC)-ICP-MS. We consider details of spatial resolution, evaluate matrix effects on S isotope mapping, and also discuss the most suitable element to be used as internal standard in complimentary quantitative trace element analysis and mapping. Spatial resolution has been studied by many methods, e.g., via mapping of a regular Cu grid [9], or by scanning of a National Institute of Standards and Technology (NIST) “glass sandwich” [24]. Triglav et al. [25] and van Elteren et al. [26] developed mathematical models to optimize element imaging and enhance the spatial resolution. To demonstrate the potential of this approach, a combined S isotope and trace element mapping study of a multi-stage sulfide assemblage from the Chenmenshan copper deposit, Jiangxi Province, South China, is presented. In combination with in-depth petrological studies, this map can be used to place constraints on pyrite generations relative to changes in fluid source(s).

2. Background

Remarkable advances have been achieved in in situ LA-ICP-MS analysis of isotopic ratios and trace elements, and the technique is widely applied well beyond the geosciences. Isotope compositions and trace elements concentrations are, however, seldom homogeneously distributed, even at the micron-scale, making two-dimensional mapping of inhomogeneous areas an attractive option to provide a visualization of distribution patterns. Alongside compositional mapping using an electron probe microanalyzer (EPMA), and chemical or isotopic mapping by secondary ion mass spectrometry (SIMS), LA-ICP-MS has found a place as a technique of choice. It has the advantage of being a relatively rapid technique, is suitable for both elemental and isotopic mapping, and can be applied to a wide range of sample scales (from μm to cm).
Early attempts at element mapping using LA-Q-ICP-MS were mainly done in the biological sciences. Kindness et al. [27] and Becker et al. [28,29] generated two-dimensional element maps though off-line calibration and subsequent conversion of the raster lines to an XY grid. In the geosciences, application of element and isotope mapping using laser ablation was initially relatively slow, but accelerated rapidly after the development of “Iolite” software [7,17]. Iolite is commercially available software, which after version 3.0, has been based on Wavemetrics IGOR Pro program. Its data reduction algorithms are open-source, which means that users have control over how to process their data and calculate appropriate output parameters. Due to the user-friendly, capable self-coded data reduction scheme (DRS), isotopic and elemental mapping are processed with Iolite in this study and many others. Spatial resolution is a key parameter to judge the quality of mapping results. The spatial resolution of LA-ICP-MS and LA-MC-ICP-MS methods are, thus, a focus of the present study.

3. Samples and Analytical Methodology

3.1. Geological Background

Porphyry Cu-Au-Mo and Fe-Cu skarn deposits are widespread in the Middle and Lower Yangtze River Metallogenic Belt (MLYMB), eastern China, one of the most important Cu-polymetallic metal producing regions of China [30]. The Chenmenshan copper deposits in the Jiurui District of Jiangxi Province consist of three ore types: Skarn, porphyry and stratiform massive sulfide ore bodies [31]. The stratiform massive sulfides are hosted between the Carboniferous Huanglong Formation (carbonate rocks) and the Devonian Wutong Formation (clastic rocks) [31]. Whereas the skarn and the porphyry ores can be readily genetically related to Yanshanian granodiorites, the genesis of the stratiform ores is much debated. Some researchers believe that the stratiform massive sulfides result from a late Mesozoic hydrothermal event superimposed onto submarine hydrothermal exhalative mineralization of Hercynian age [32,33]. Other researchers [34,35] consider that the stratiform massive sulfides are just another form of skarn type deposit. In the present study, we do not aim to resolve the genesis of this ore in detail but to explore the potential of complementary in situ S isotope and trace element analysis to obtain evidence that may contribute to a future genetic model.

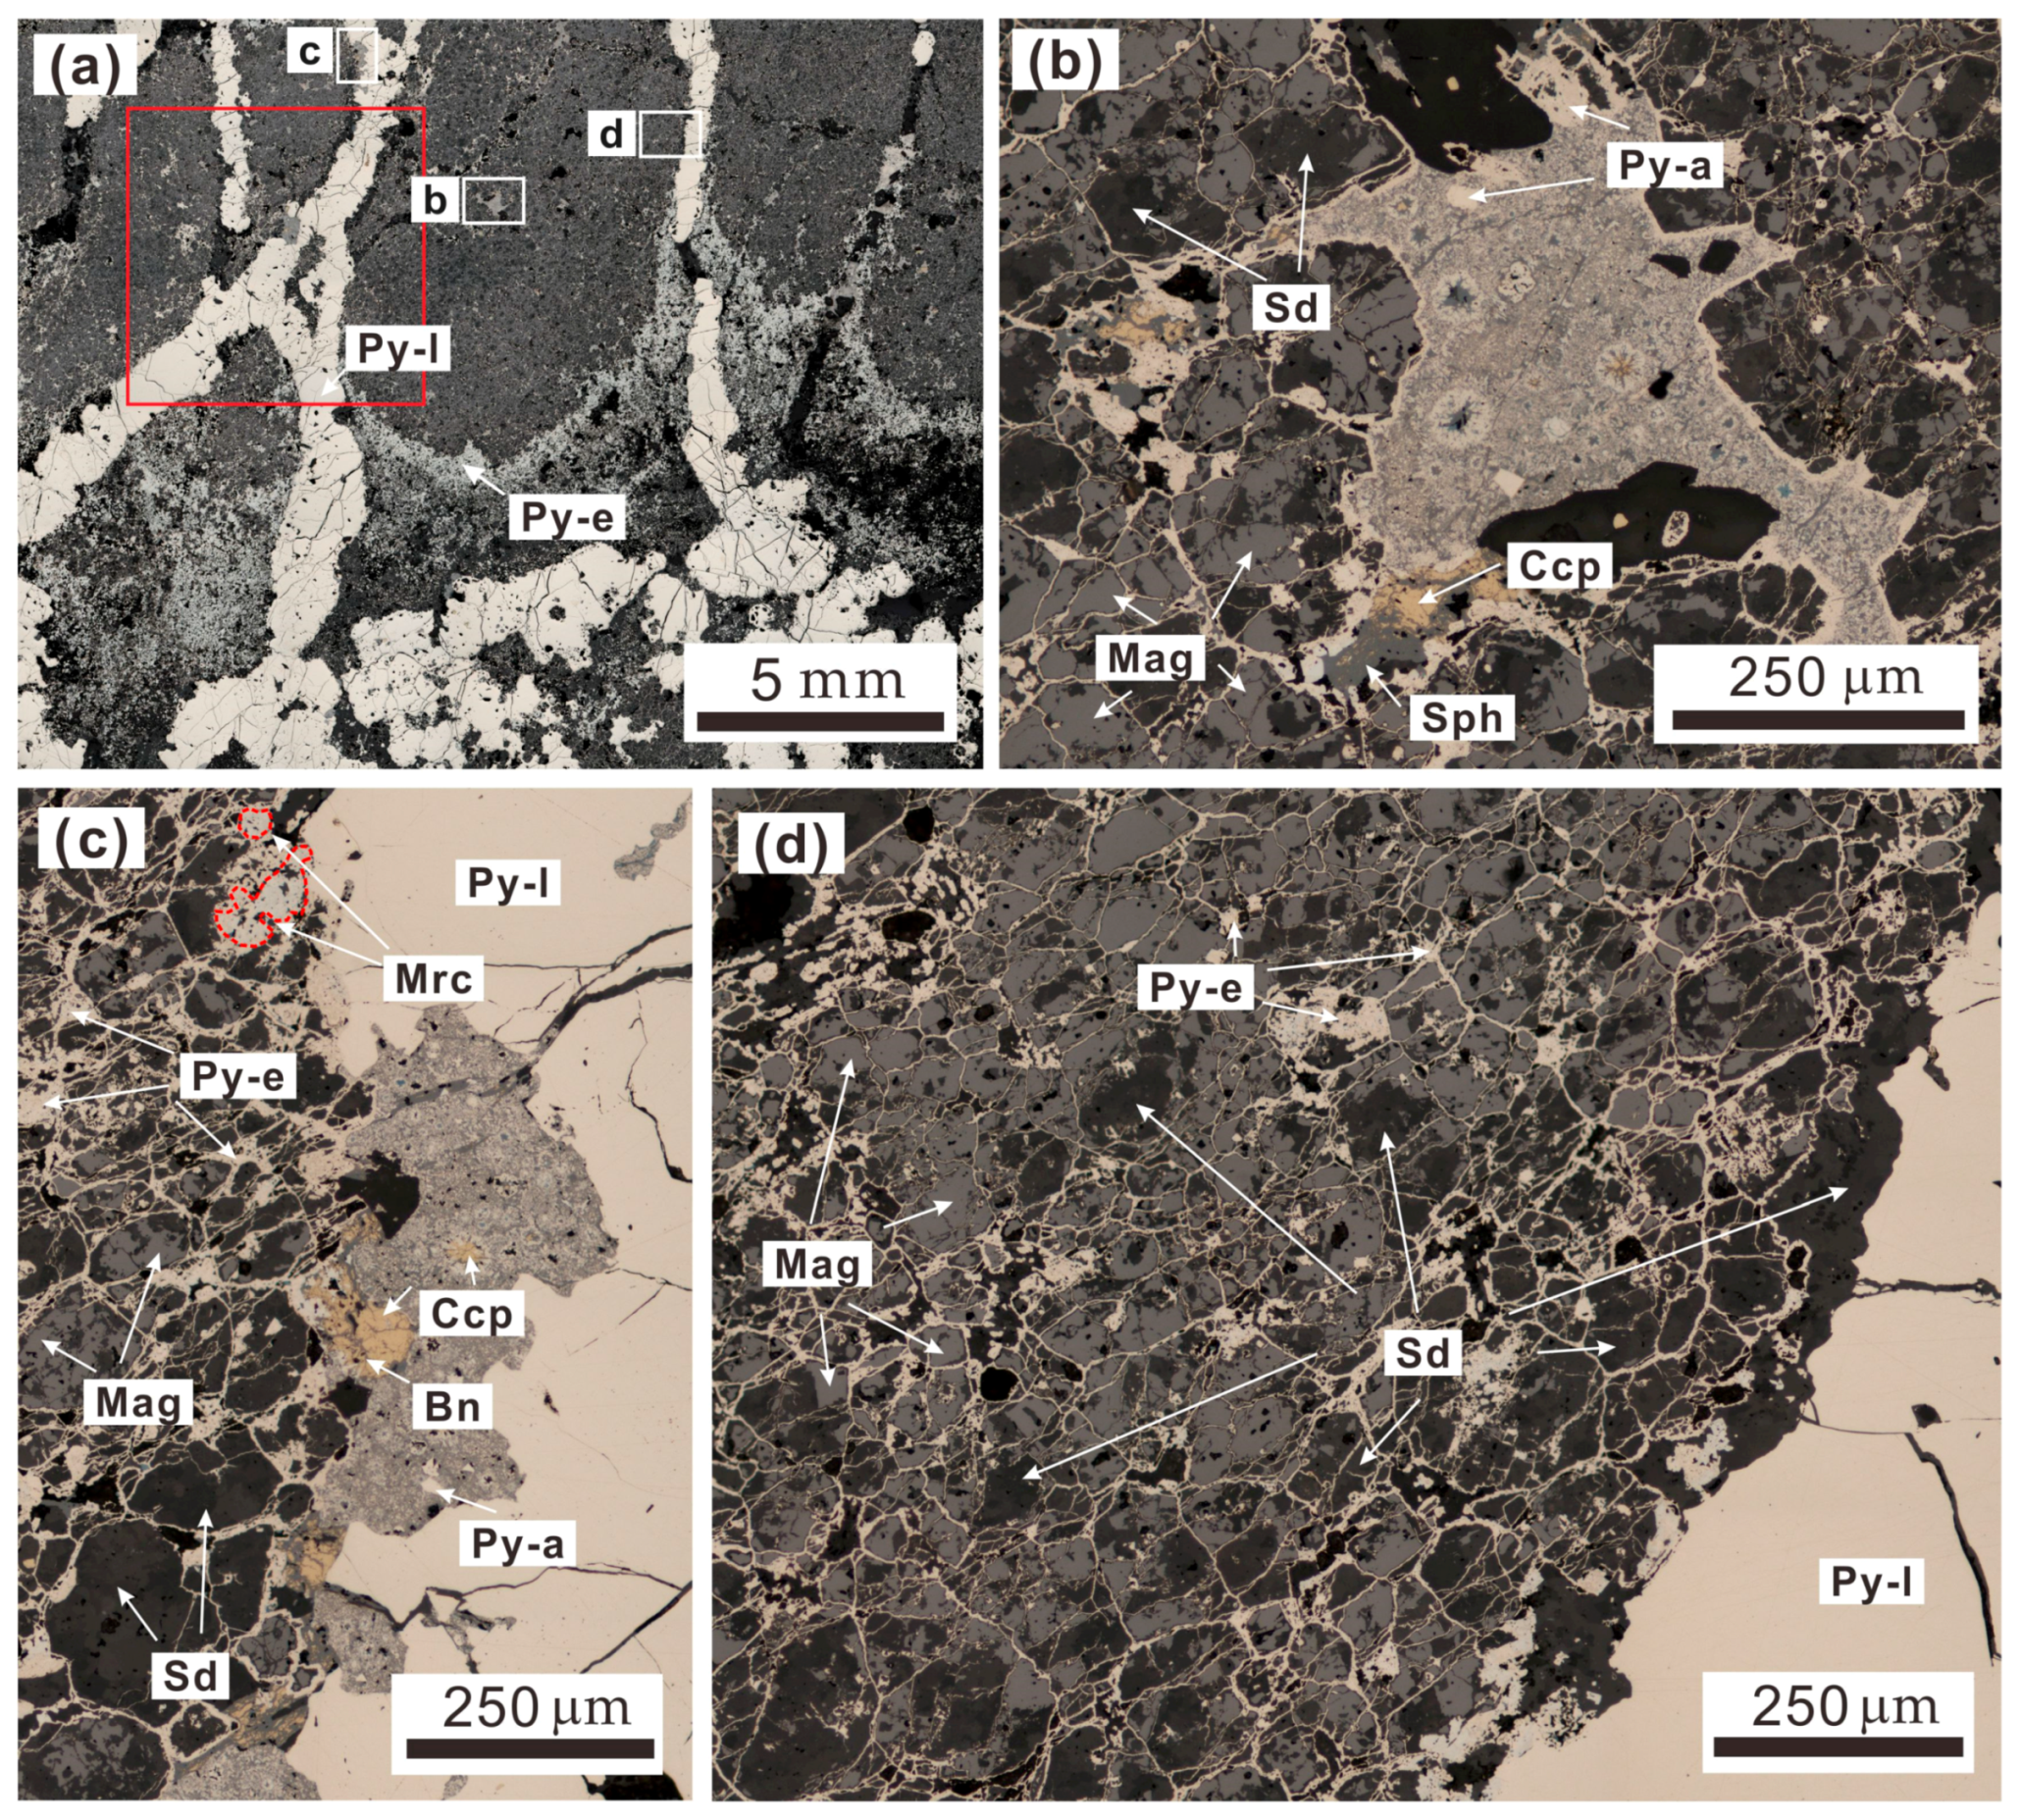
3.2. Sample Selection and Petrology

The pyrite sample studied is from stratiform massive sulfide ore. Three generations of pyrite can be distinguished: (1) early stage pyrite (Py-e) in association with siderite and magnetite, the pyrite was likely transformed from marcasite (Figure 1a); (2) main ore stage pyrite (Py-a) associated with chalcopyrite-sphalerite-bornite-covellite (Figure 1b,c); (3) late stage crosscutting veins of pyrite (Py-l) (Figure 1a,c,d). The siderite is partially replaced by magnetite (Figure 1b–d) and main ore stage sulfides (Figure 1b,c). In the early stage, pyrite (Py-e) has probably replaced marcasite; relict marcasite can be seen in Figure 1c. ‘Clean’ late-stage pyrite occurs in fractures within the matrix (Figure 1a,c,d), crosscutting all other minerals. Py-a is hosted within assemblages of chalcopyrite, sphalerite, bornite and covellite. This sulfide assemblage co-exists with Py-e, but tends to occur around the margins of Py-l (Figure 1c).
Sulfur isotope distributions and trace element concentrations are measured on these three generations of pyrite to understand if, and how, sulfur isotope and trace element patterns differ in the distinct ore-forming stages. Samples were mounted in epoxy as 1-inch blocks and polished prior to analysis. Minerals were identified and characterized by optical microscopy at the University of Adelaide.

3.3. Trace Element Analysis by LA-Q-ICP-MS

Trace element analysis was carried out using the LA-Q-ICP-MS facility at State Key Laboratory of Geological Processes and Mineral Resources, Wuhan, China, composed of a 193 nm Resonetics ArF Excimer laser coupled with the Thermo iCap-Q quadrupole ICP-MS. Laser ablation was performed with a constant 10 Hz pulse rate at 80 mJ laser energy with an approximate energy fluence of 4 J/cm2. The ablated material is transported using a constant helium gas flow (0.55 L/min) and mixed with argon (0.8 L/min) in a cyclone coaxial mixer prior to entering the ICP torch to be ionized. The length of the gas tube is about 1.5 m. The ions are then sampled, accelerated and focused before being separated and analyzed in the quadrupole mass spectrometer. A set of 29 isotopes have been analyzed with the dwell time for each mass set at 10 ms to enhance the number of sweeps, and decrease the sweep time for trace elements. Linear raster velocity was 20 μm/s with a spot diameter of 60 μm for mapping analysis. The laser diameter was set to 26 μm for spot analysis. There is no one single internal standard element that could be applied to all of the minerals in the mapping area. Hence, we adopt the semi-quantitative mapping strategy in this study. The typical 57Fe signal for pyrite was ~3 × 10⁶ CPS. It took 20 s to wash the signal to background levels (~100 CPS).

3.4. Sulfur Isotope Analysis by LA-MC-ICP-MS

Mapping and spot analysis of sulfur isotopes was carried out using a LA-MC-ICP-MS at State Key Laboratory for Mineral Deposits Research, Nanjing, China, comprising a 193 nm New Wave ArF Excimer laser coupled with the Neptune Plus MC-ICP-MS. Helium gas was used to transport the ablated materials into the plasma with a gas flow of 0.7 L/min. Sample gas (argon, 0.85 L/min) was mixed with the carrier gas in a cyclone coaxial mixer before being transported into the ICP torch. The energy fluence of the laser is about 3 J/cm2. Integration time of the isotope was 1.023 s, and the MC-ICP-MS was set to medium-resolution mode to separate polyatomic interferences (e.g., 16O2+, 1H32S+, 16O17O+, 1H16O16O+, 16O18O+ etc.) from 32S, 33S to 34S. Linear raster velocity was 50 μm/s with a spot diameter of 60 μm. The interval of the adjacent line is the same as the spot diameter. For single spot analysis, the diameter is 25 µm with a laser repletion rate of 8 Hz. The low background of less than 70 mV on 32S compared to approximately 20 V of signal (for pyrite samples) and the fast “washout” time of 25 s allows a high sample throughput.

3.5. Data Collection and Processing

The pulse-homogenizing device (squid) fitted to the 193 nm Resonetics ArF Excimer laser was removed for mapping analysis. It was, however, used for spot analysis. Both S isotope and trace element data were processed with Iolite [7], which can accommodate a self-coded Data Reduction Scheme (DRS). The DRS used here for S isotope data processing is from [23] whereas the DRS used for the trace element data is from [7]. Both S isotope and trace element maps are composed of raster lines, standards were measured before or after each set of 10 lines. Each line corresponds to an ICP-MS output file. Total acquisition time for a single raster line for trace elements analysis is 330 s, comprising 30 s background measurement followed by 300 s of sample ablation. Total acquisition time for a single raster line S isotope analysis is 150 s, comprising 30 s background measurement followed by 120 s of sample ablation. Total acquisition times for trace element and S isotope spot analysis are 60 s, of which the first 30 s is for background measurement. Sample standard bracketing method was used to calibrate the mass bias of S isotope. A 35-s delay for each spot or raster line is allowed to wash out the sample cell, stabilize the gas flow and wait for a response from the computer controlling the mass spectrometer. The MASS-1 Standard [36] is a Fe-Cu-Zn-S matrix pressed-powder sulfide pellet, which is used to calibrate the trace elements. An in-house pyrite standard named WS-1 is used to calibrate the mass bias for S isotopes [23]. This consists of a natural pyrite crystal from the Wenshan polymetallic skarn deposit, Yunnan Province, China. The δ34SV-CDT values (1.1‰ ± 0.2‰) of WS-1 natural pyrite were determined with SIMS at the Chinese Academy of Geochemistry, Guangzhou. The standards were measured before and after each 10 lines.

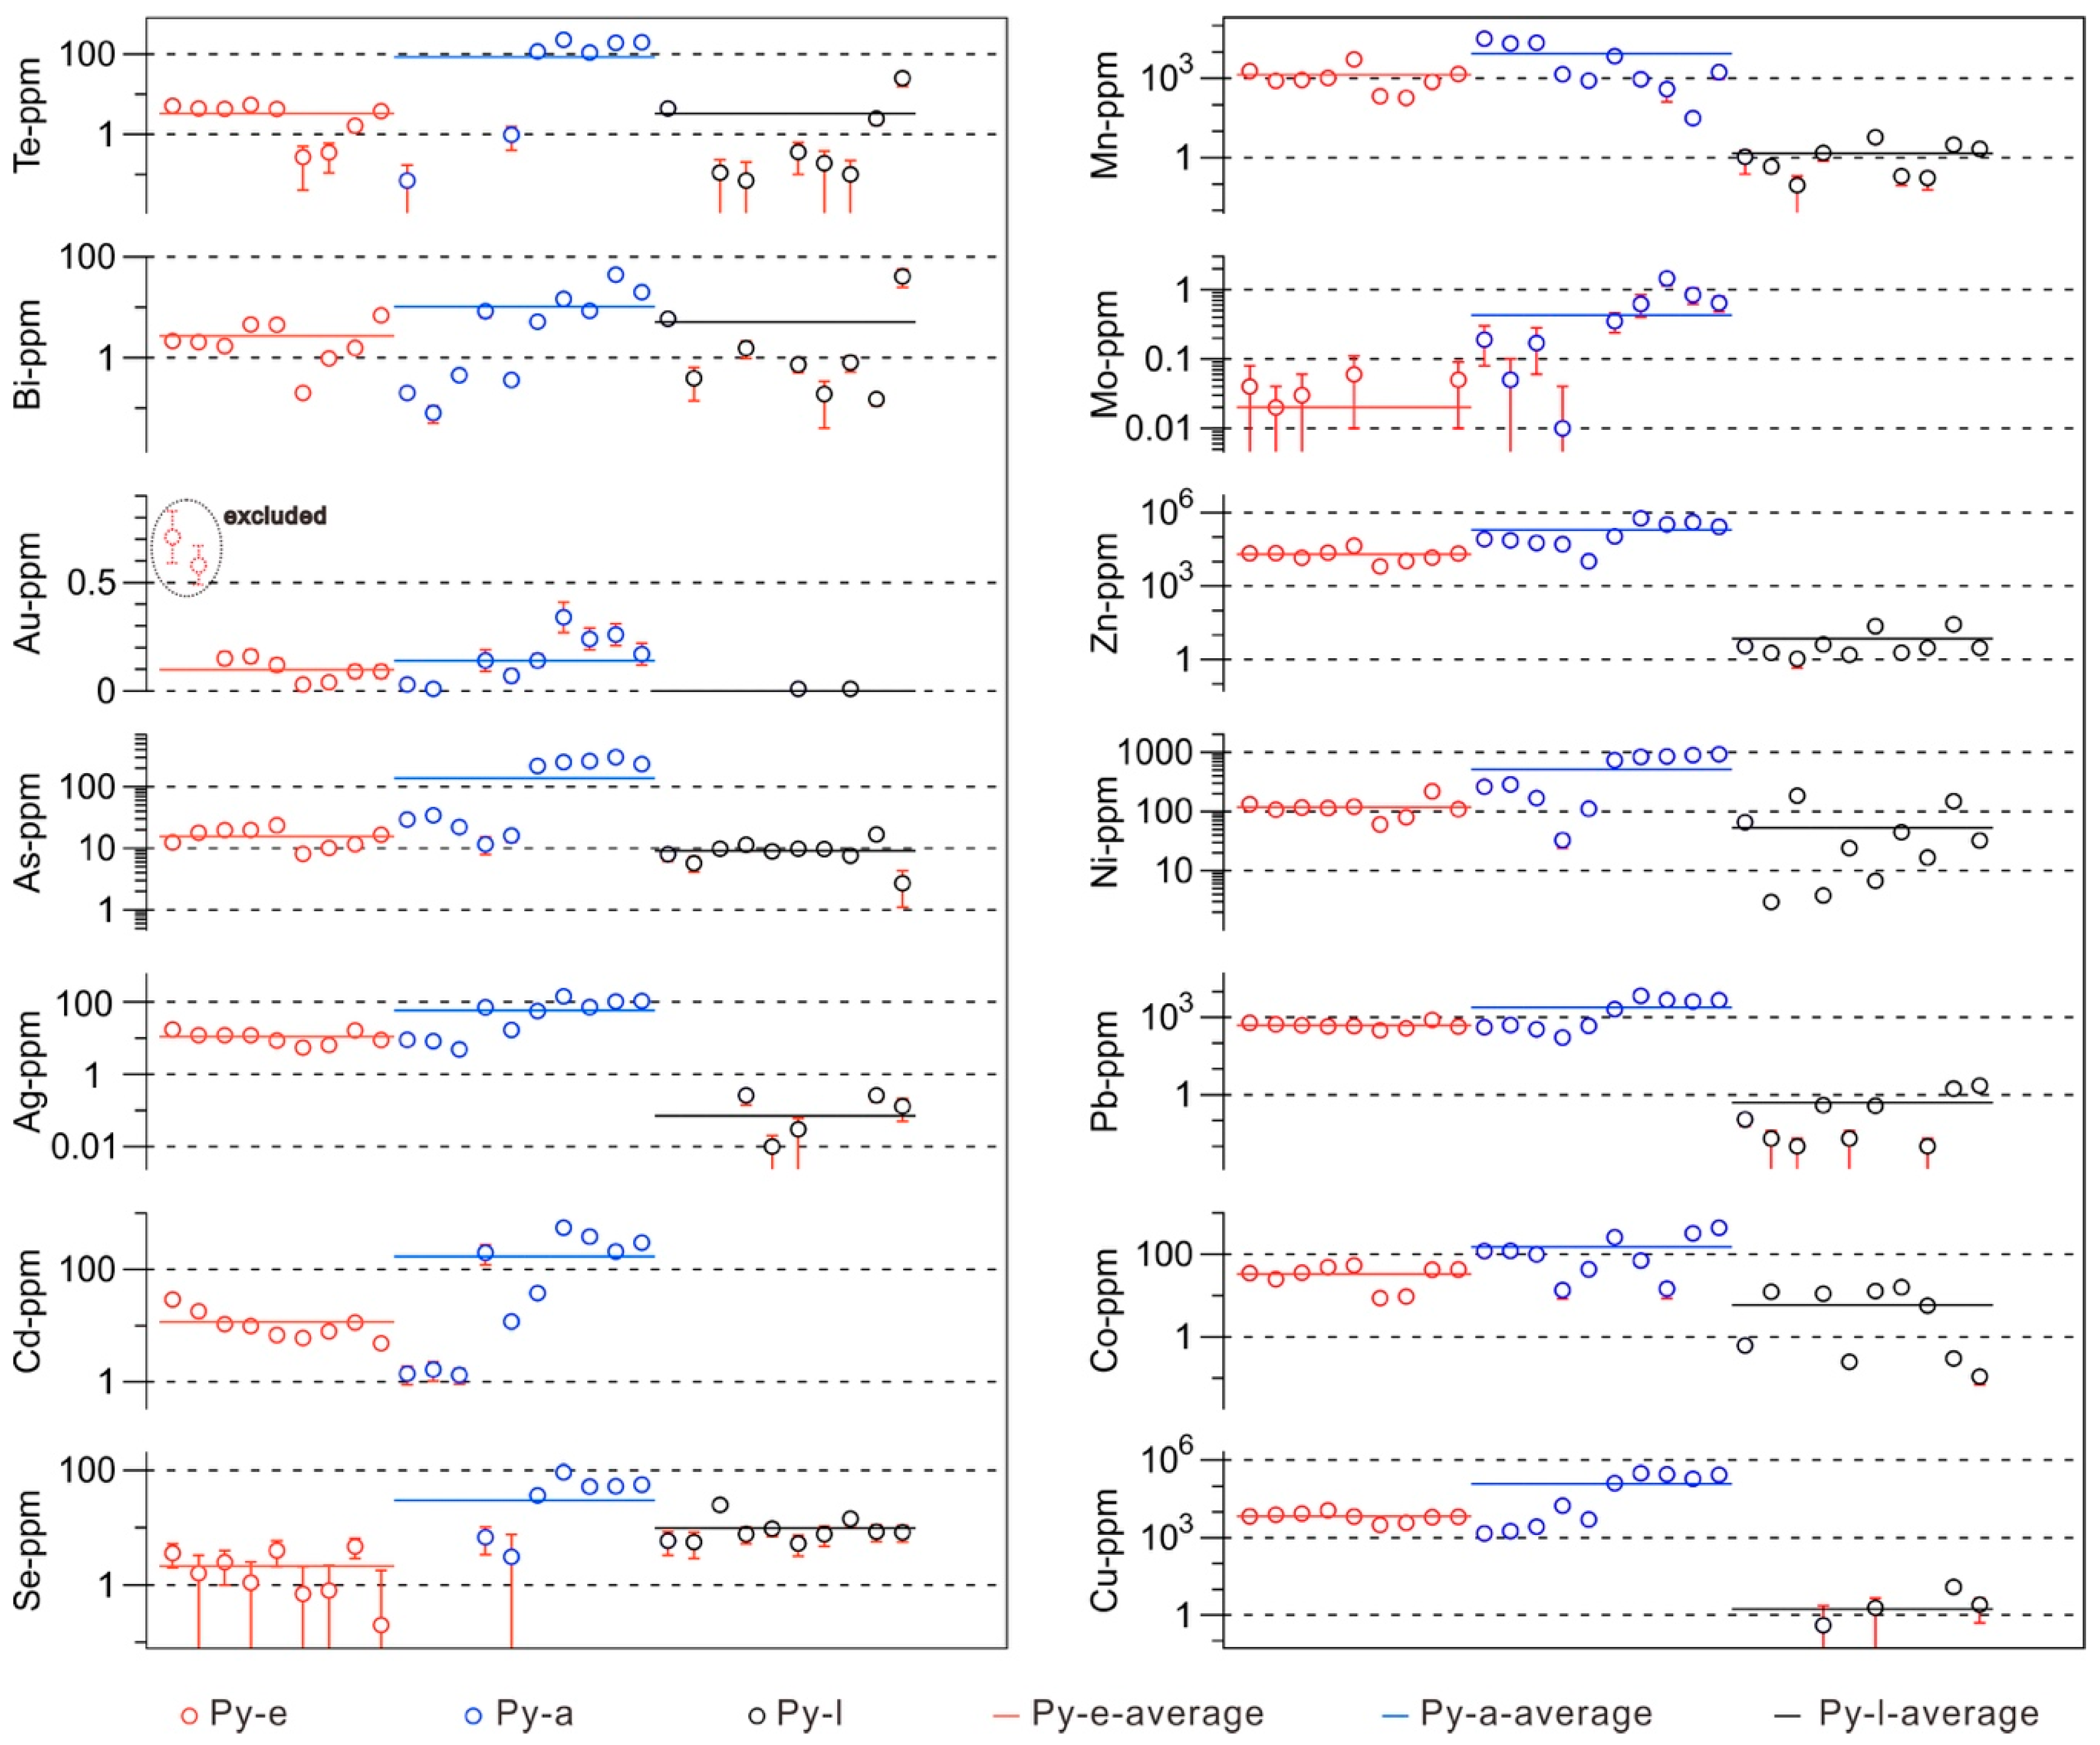
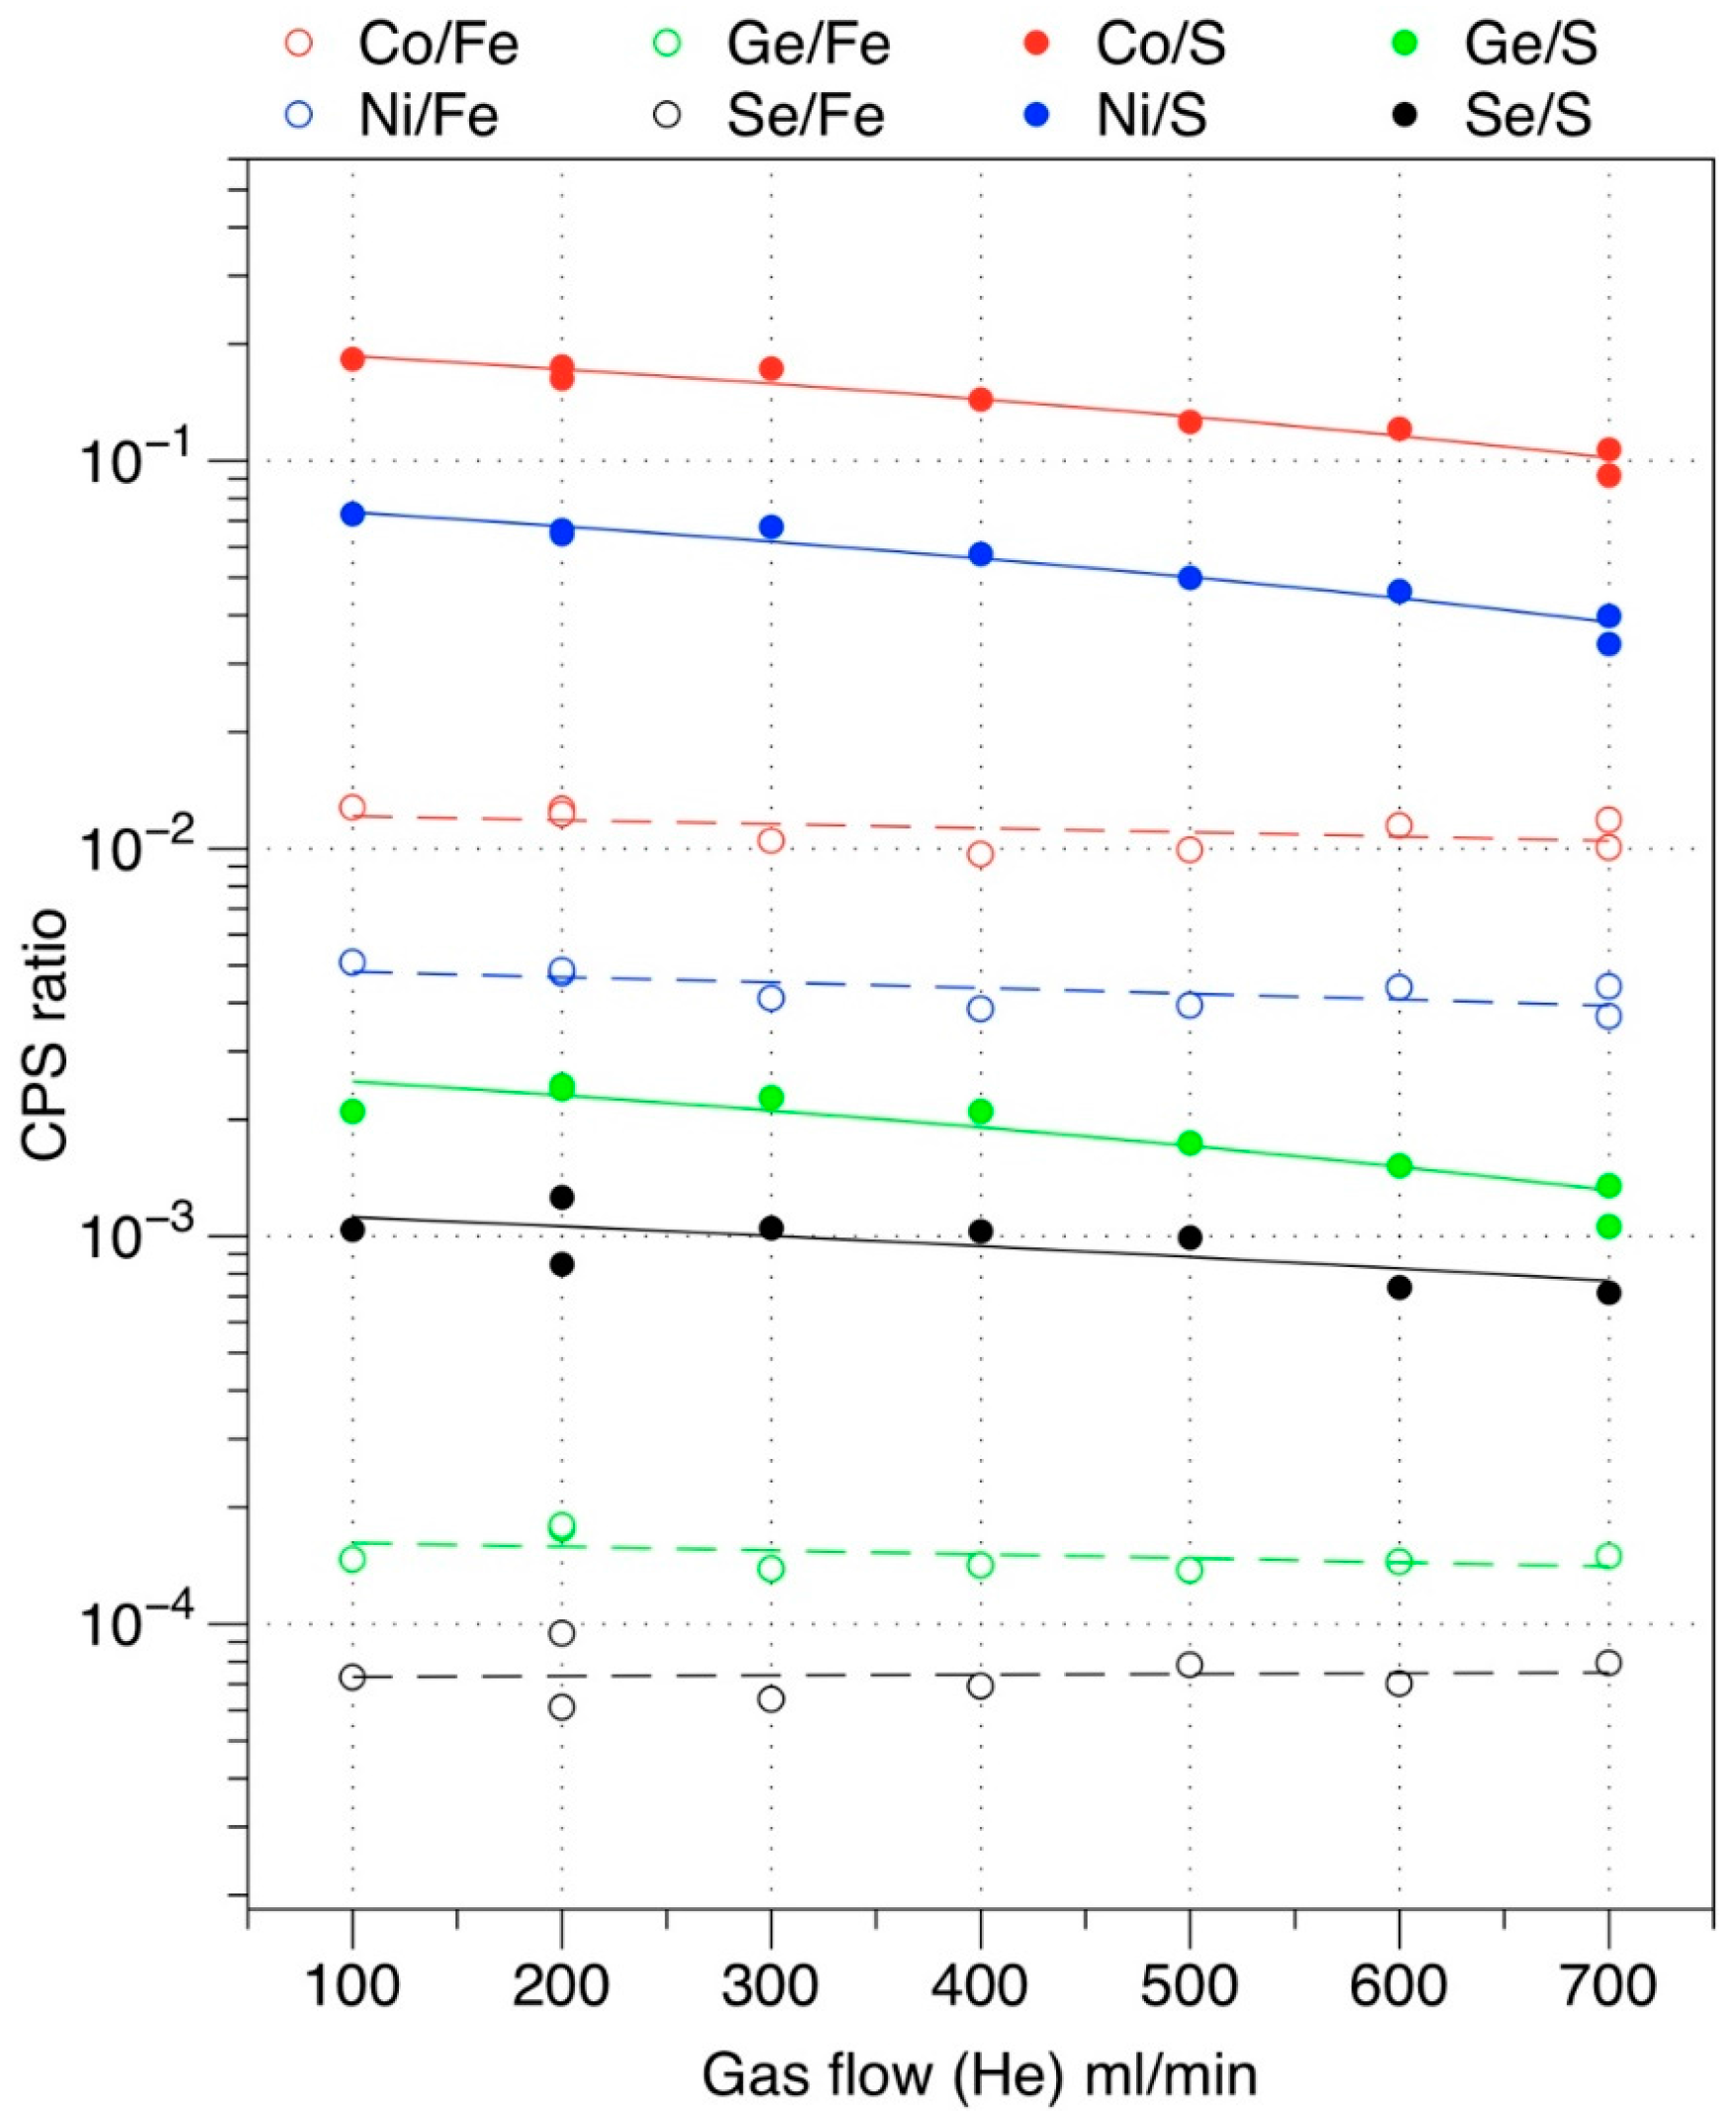
4. Precise Determination of Trace Elements using Fe or S normalization in Pyrite

Precise determination of trace elements in sulfide minerals (e.g., pyrite) is the goal for in-situ LA-ICP-MS measurement, and one of the key analytical issues is how to perform the normalization of trace elements during analysis. An experiment was designed to reveal which element, Fe or S, is the better choice as internal standard element when for trace element analysis of pyrite. This experiment was conducted on the aforementioned in-house pyrite standard (single crystal). The ablated particles of a single pyrite crystal were transported into the mass spectrometer with different carrier gas (He) flow rates. The sensitivities of the analyzed element vary with changing gas flow. The measured elements, in this case Co, Ni, Ge and Se, were normalized to S and Fe, respectively. The Se/Fe, Co/Fe, Ni/Fe and Ge/Fe ratios keep reasonably constant, whereas the Se/S, Co/S, Ni/S and Ge/S ratios are readily affected by changes in carrier gas flow. Results (Figure 2) clearly show that Fe is a much more suitable choice as internal element standard compared with S. As observed by Gilbert et al. [22], significant fractionation of S relative to Fe occurs in all sulfides during LA-ICP-MS. The underlying mechanisms explaining this phenomenon are not clear at present, but are possibly linked to decomposition of pyrite during laser ablation [23]. The performance of other elements could not be addressed in this study, as they are not enriched in this pyrite sample.

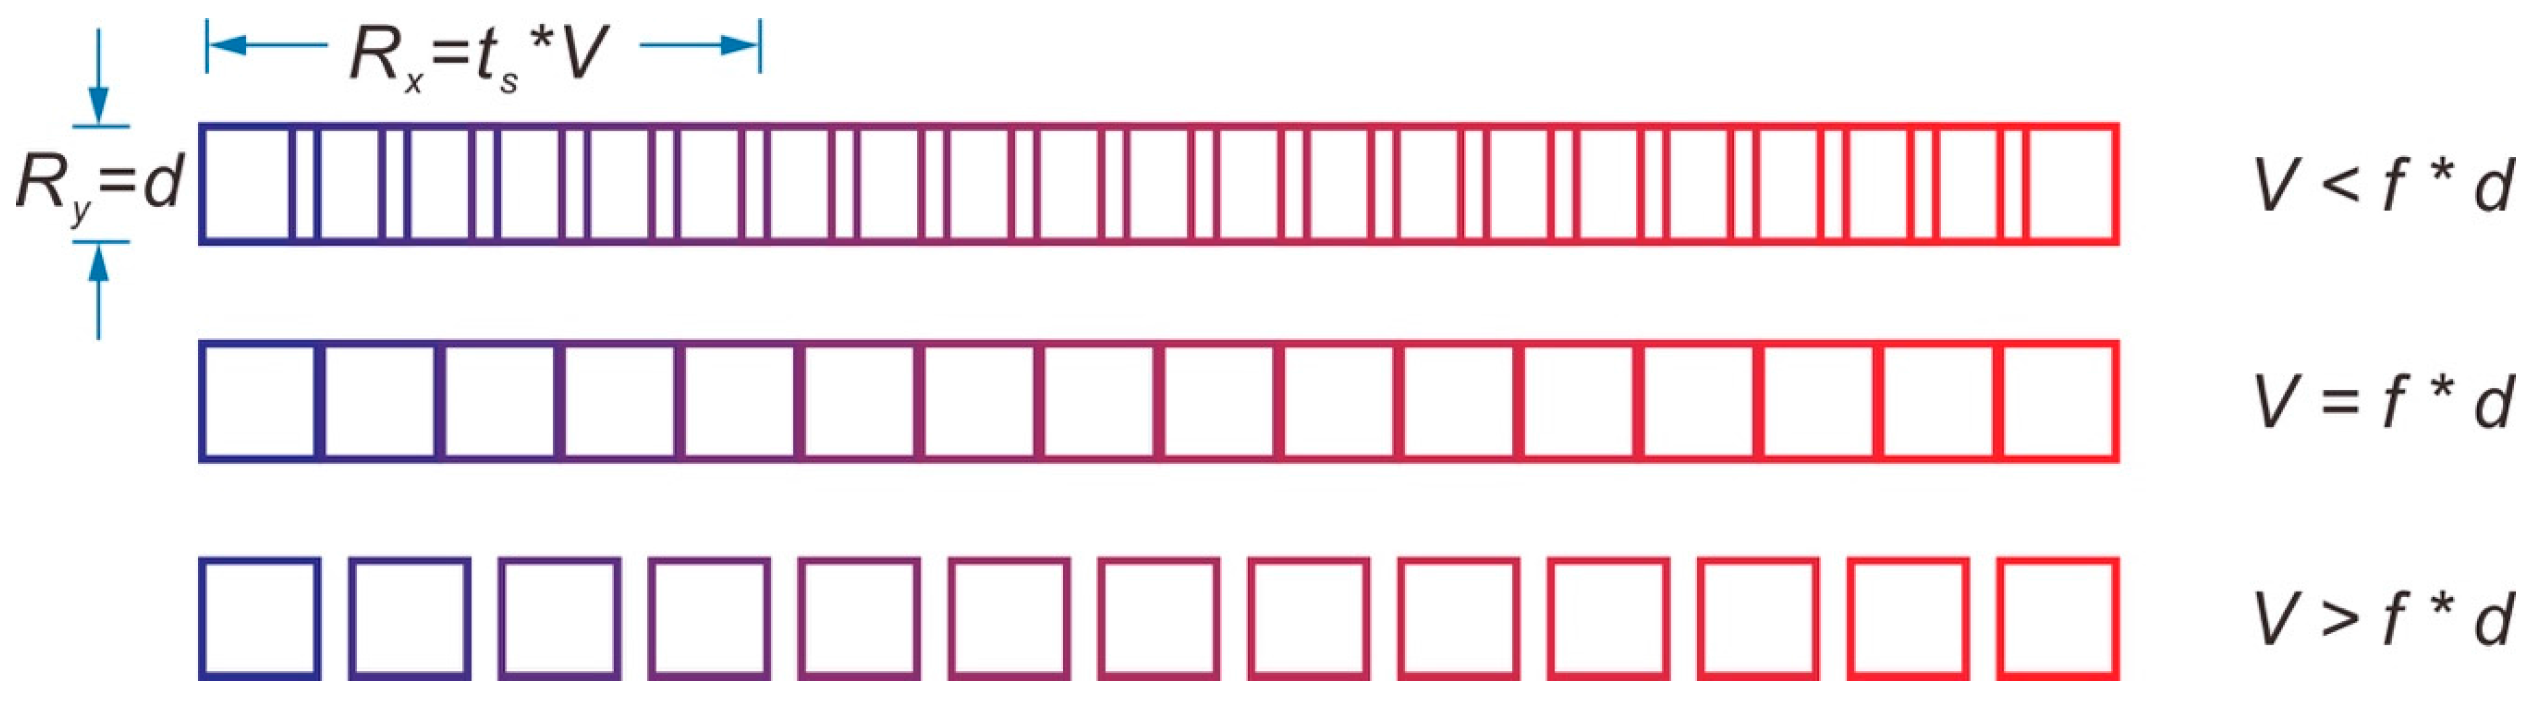
5. Spatial Resolution for Pulsed Laser during ICP-MS Measurement

The spatial resolution is a very important issue for trace element and isotope mapping of a mineral by LA-ICP-MS. In this study, we carried out all mapping in line raster mode and each map is composed of 100 individual parallel lines. The interval between each line was the same as the laser spot size; each line thus abuts the line above. The spatial resolution of a map with these parameters can be defined as the area on the sample represented by a single pixel on the map. The lateral and vertical resolutions are the horizontal and vertical lengths on the sample of that of a single pixel on the map. The vertical resolution (Ry) is clearly equal to the spot size (d). The laser ablation system used in this study is a pulsed laser. In order to cover the entire surface of the mapped area, the laser repetition rate (f), spot size (d) and raster velocity (V) should satisfy the following relationship: Vf × d (Figure 3). Every sweep recorded in the mass spectrometer forms a separate pixel in the map. The theoretical horizontal resolution (Rx) can be calculated based on the sweep time of mass spectrometer (ts), and the raster velocity (V): Rx = ts × V. However, the lower limit of Rx is d, which means that the spatial resolution can never be better than the size of a single spot.
For trace element analysis, the total sweep time was thus ~0.3 s. The line raster velocity is 20 μm/s. Hence, one pixel in the map represents ~6 μm (0.3 s × 20 μm/s). For isotope analysis, masses were measured by a multi-collector. The mass spectrometer does not need to sweep to collect different masses of isotopes. Hence, the dwell time (1.049 s) for each mass is equal to the sweep time. The linear raster velocity was 50 μm/s, and one pixel on the map would thus represent ~52 μm (1.049 s × 50 μm/s).
Both horizontal spatial resolutions calculated above are theoretical. There are several other factors that will influence final resolution, of which the most important is the spot size; spot size was set to 60 μm for all mapping. The measured isotopes or trace elements are a mixture of all phases sampled within an individual ablation pulse. Hence, the spatial resolution can never be greater than the spot size. To achieve the best possible resolution, the theoretical resolution should be set better than the spot size through an optimization of the laser line raster velocity, pulse rate, and the dwell time (including sweep time) of the mass spectrometer. Other factors that can make the actual resolution worse than the theoretical resolution include the transportation of ablated particles within the sample cell and gas tube. The ablated particles are transported into the mass spectrometer with helium. In the transportation process, these particles are very likely to be mixed with those ablated in previous laser pulses. In order to avoid the risk of particle mixing as much as possible, pulse-homogenizing devices (squid) were not applied during mapping; they were, however, used in analysis in spot mode. Washout time of the system is another important factor effecting spatial resolution. Triglav et al. [25] proposed a mathematical model to decrease the effect of washout time and enhance the spatial resolution. Resampling of deposited material ahead of the laser beam is also a potential cause of the actual spatial resolution being worse than that calculated theoretically [17]. A pre-ablation on the raster line helps avoid resampling of deposited materials from the former ablation [17]. These factors cannot be completely eliminated and will limit the spatial resolution of LA-ICP-MS. Note also that if the theoretical spatial resolution R x = t s × V ( V f × d ) is already less than the spot size, the actual spatial resolution will be worse still. Hence, we recommend keeping the theoretical spatial resolution as high as possible though an optimization of spot size, pulse rate and raster velocity to achieve high spatial resolution maps.
We acknowledge that the spatial resolution of LA-ICP-MS is not as good as that of (nano)-SIMS, however that method can be both time-consuming in terms of sample preparation, and relatively expensive to use. LA-ICP-MS is both cheap and fast prompting the suggestion that LA-ICP-MS could be used to screen samples and characterize variation before more detailed work is undertaken using SIMS.

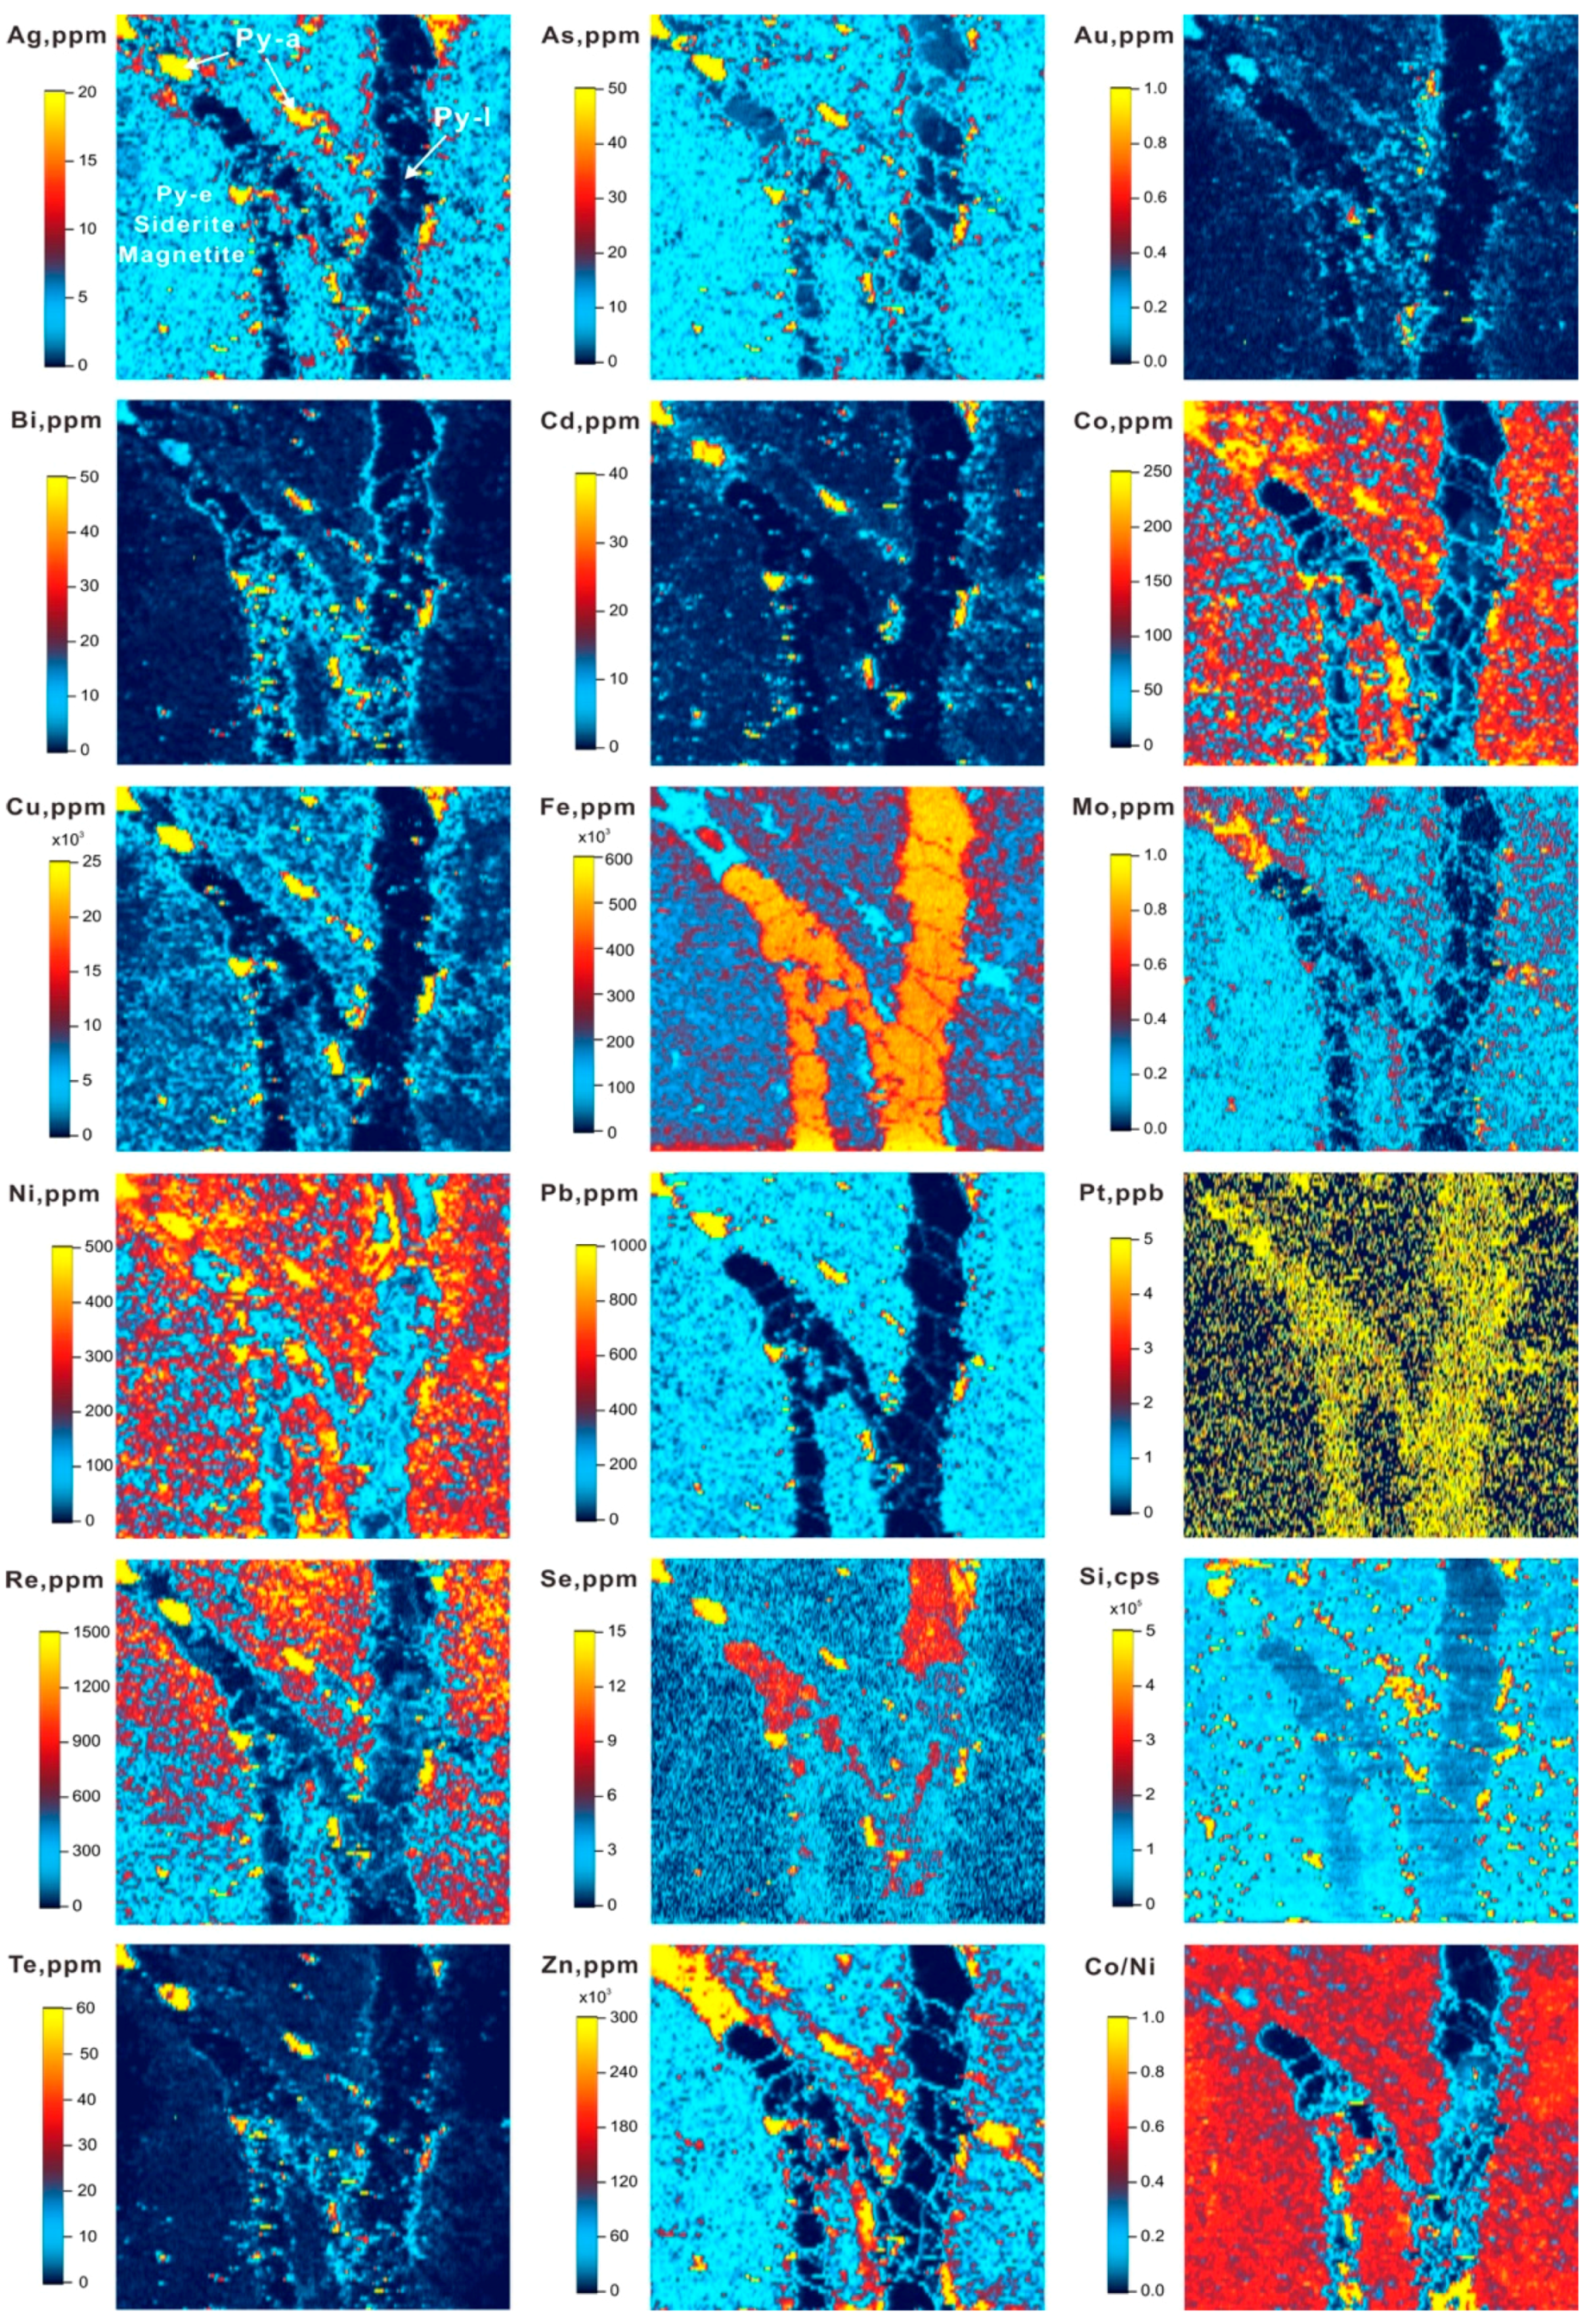
6. Mapping of Trace Elements in Pyrite

Selected element maps are presented in Figure 4. Early-stage pyrite in the matrix is extremely fine-grained and largely concealed by the siderite-magnetite. The multi-component sulfide assemblage mainly consists of pyrite, and is large enough to be recognized on the element maps (Figure 4). This figure shows that Ag, As, Cu, Cd, Mo, Pb, Zn, Se, Si and Zn are preferentially enriched in the multi-component sulfide assemblage. Selenium is heterogenously distributed within the late pyrite vein. Calcium, La, U and Th (not shown in Figure 4) tend to be enriched in siderite relative to sulfides. To reveal how these elements are distributed in early-stage pyrite, the early stage sulfide assemblage (mainly pyrite), and in the late-pyrite veins, spot analyses were conducted on the three types of pyrite. These data are shown in Figure 5.
The concentrations of Cu, Zn, Pb, Co, Ni, Mn, Mo, As, Au, Ag and Cd are significantly higher in Py-e and Py-a than those in Py-l. We note, in particular, that Mo, Cd and Au are near or below detection limit in Py-l (Figure 4 and Figure 5). Py-e is, in contrast, a good host for these elements. Se is preferentially enriched in Py-l rather than Py-e, even if Se is non-homogenously distributed in Py-l. Unexpectedly, Pt with ppb levels is found to be enriched in Py-l. Since the concentrations of Th, U and REE (high field strength elements, as is Hf) are much higher in the siderite or magnetite matrix than in the Py-l vein, the higher 195Pt+ we measured was unlikely to be caused by interference from 179Hf16O+ [37]. Further study is required to confirm whether the Pt is real or the result of interference. The Se signature geochemically defines the late-stage hydrothermal event.
Reliable quantitative analysis by LA-ICP-MS is our ultimate goal, however, if the mapping area includes several kinds of minerals, it may be difficult to find a single stable internal element standard that covers all minerals or their matrices. In one attempt to address this problem, George et al. [13] used an average sulfur value of 25 wt % as the internal element standard when mapping sulfide assemblages comprising combinations of galena, sphalerite, and chalcopyrite. They checked the accuracy of using an average sulfur wt % value as the internal element standard and found it agreed well with data obtained by spot analysis (see also data presented by Cook et al., this volume [38]). In the sample studied here, however, the three major minerals are pyrite, siderite and magnetite, i.e., a sulfide, a carbonate and an oxide. wt % Fe values in these three minerals vary from ~47% to ~72%. Hence, a semi-quantitative strategy has been applied, where the element concentrations were calculated using the following equation: C S a m i = C P S S a m i C P S S t d i × C S t d i . C S a m i and C S t d i represent the concentrations of element i in the sample and standard, respectively. C P S S a m i and C P S S t d i are the measured counts per second (CPS) of element i after background subtraction in the sample and standard, respectively. The reference material MASS-1 [36] was used as the standard material. In cases when there is no element i in the standard, we directly produced 2D maps using the CPS data for that element to show the distribution of the interested element. Although the semi-quantitative mapping results in this study are not 100% accurate, they, nevertheless, can be used to show where elements of interest reside, and the relationships between those elements and different sulfide stages. Note that mapping should be complemented by spot analysis to compare element partitioning among sulfides belonging to different ore stages, which may beyond the resolution of the mapping.
For a complex sample containing multiple mineral assemblages, mapping reveals spatial relationships among elements in minerals belonging to different stages of mineralization. These patterns carry implications for element input and redistribution during ore-formation. Quantitative spot analysis highly depends on the choice of external reference material and chosen internal element standard. In contrast, element mapping can show where all elements are hosted (e.g., Au, Si, Se and others; Figure 4), even if the standard does not contain these elements at certified concentrations. Spot analysis is, however, both necessary and useful when the spatial resolution is insufficient to reveal the character of fine grains.
Another advantage of mapping is that it provides an understanding of the distribution of elements that are close, or even below the minimum limit of detection (LOD) offered by spot mode analysis, as in the case of Pt here. Mapping can also decrease the standard error and the detection limit through the analysis of thousands of points within the mapped area. Iolite adopts the LOD defined by Longerich et al. [39]:
L O D i = 3 × 1 σ B l a i × 1 n B l a i + 1 n S a m i × C S t d i C P S S t d i × ( C S a m I S C S t d I S × C P S S t d I S C P S S a m I S )
where, 1 σ B l a i is 1 standard deviation of the background measurement for element i, n B l a i and n S a m i is the number of measurements in the background and sample selections for element i, respectively. C S a m I S and C S t d I S represent the concentrations of the internal standard element IS in the sample and standard, respectively. C P S S a m I S and C P S S t d I S are the net CPS of the internal standard element IS in the sample and standard, respectively. For semi-quantitative mapping analysis in this study, no internal standard element was applied. Hence, L O D i depends on 1 σ B l a i , n B l a i , n S a m i and C P S S t d i . A larger number of n B l a i and n S a m i in the mapping analysis could decrease the L O D i . More importantly, the spot diameter used for mapping analysis was 60 μm, which is larger than is generally used for spot analysis (20–30 μm). Larger spot sizes produced higher sensitivity ( C P S S t d i ) , which significantly decreased the L O D i . Quantitative mapping can, of course, also reveal primary or reworked zonation patterns within single crystals, if the internal standard is a major component of that mineral.

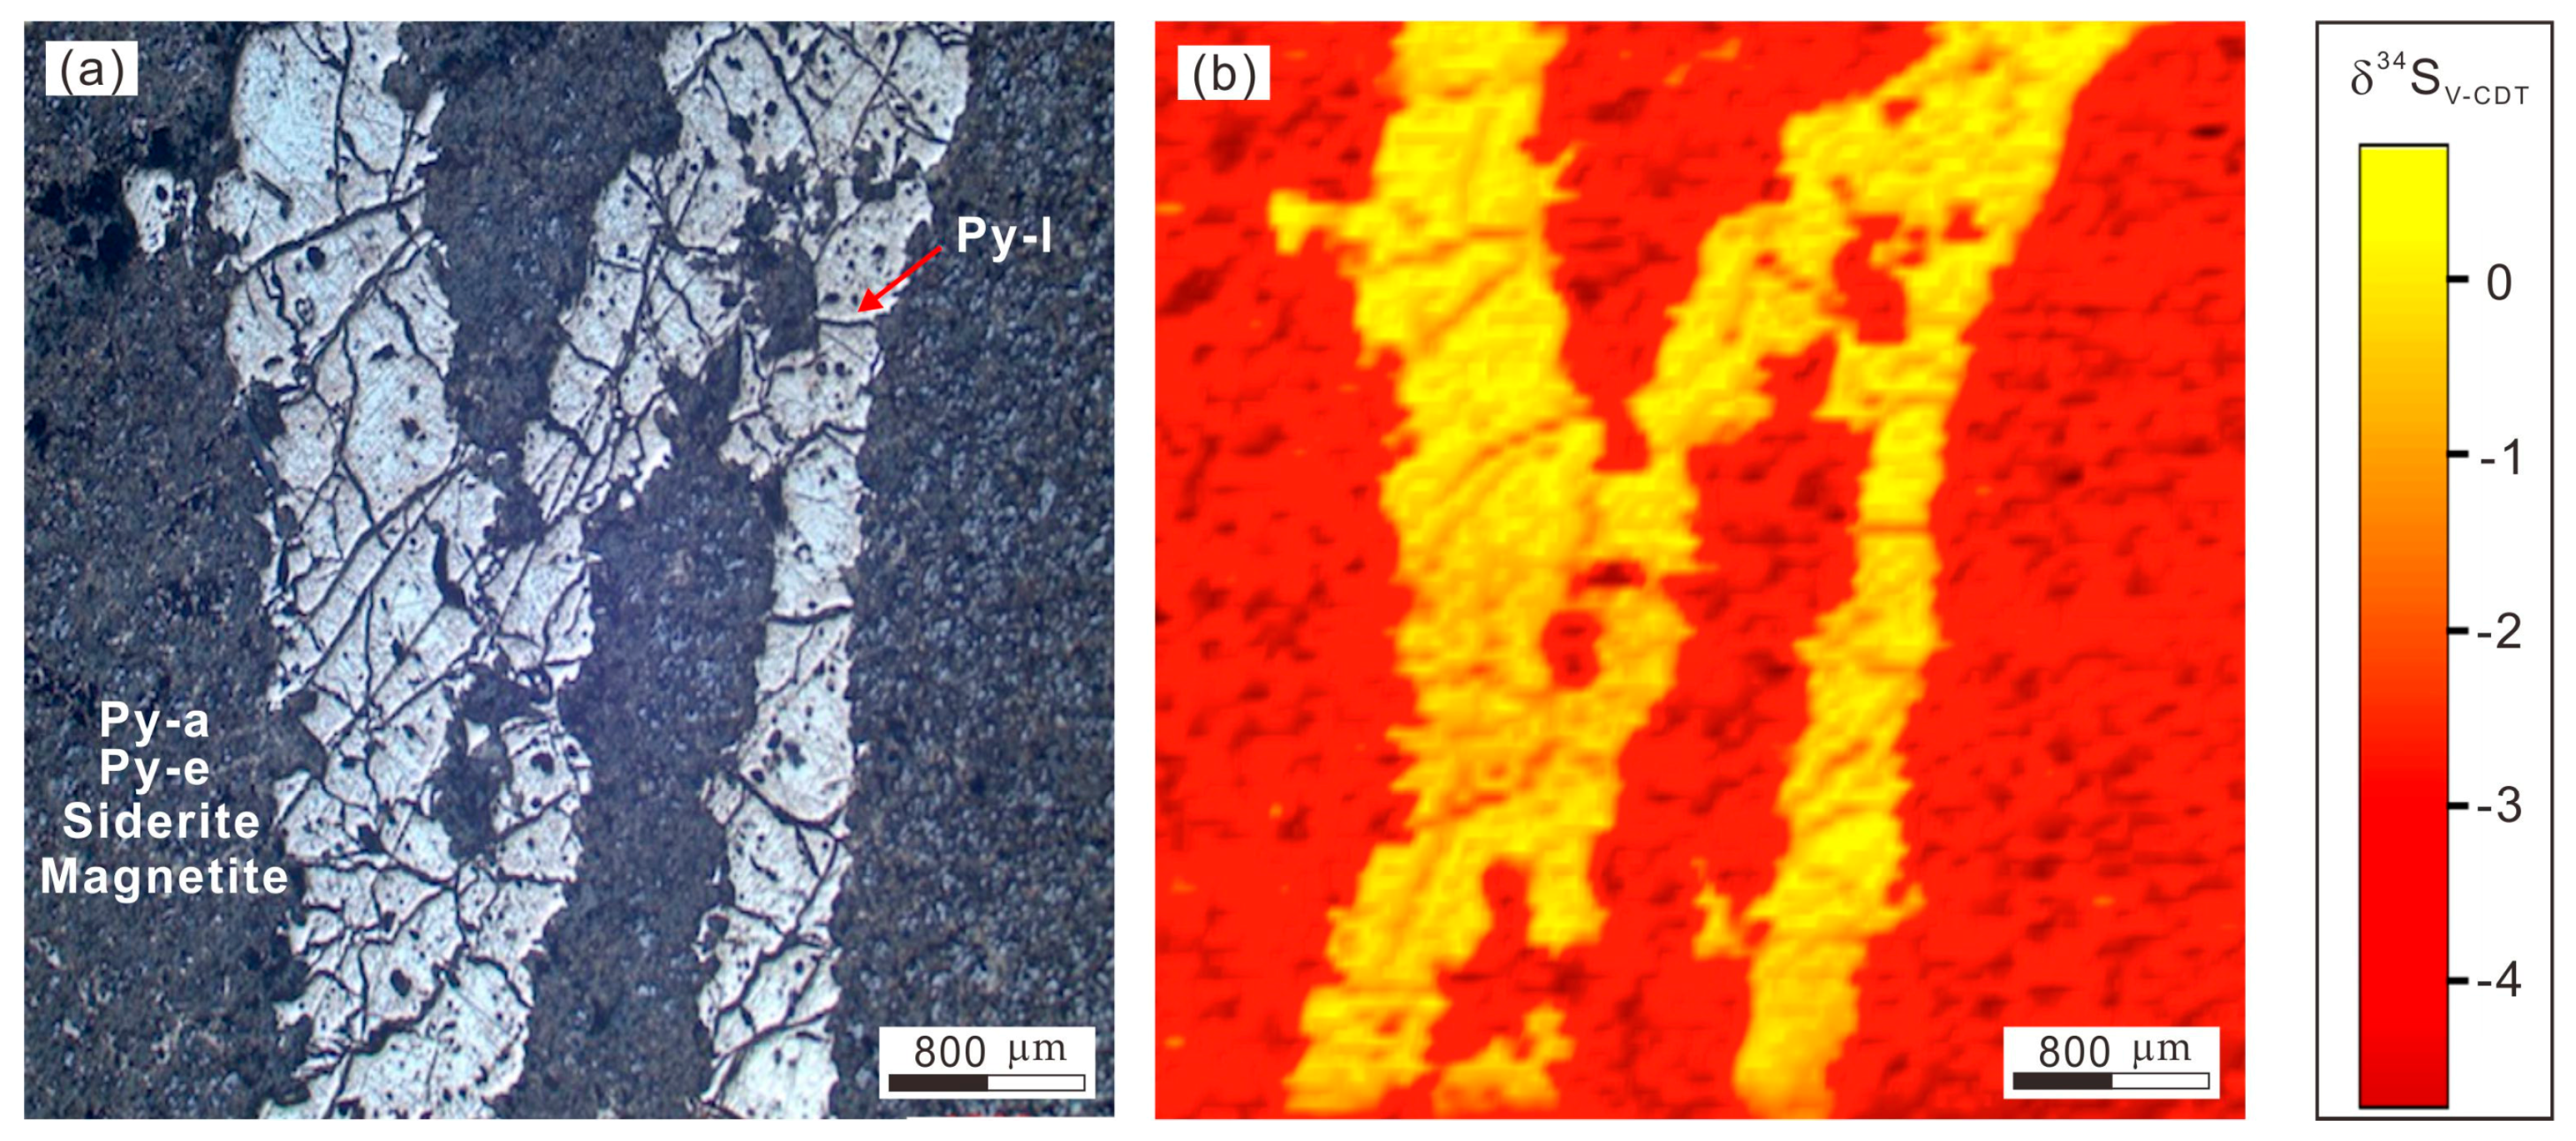
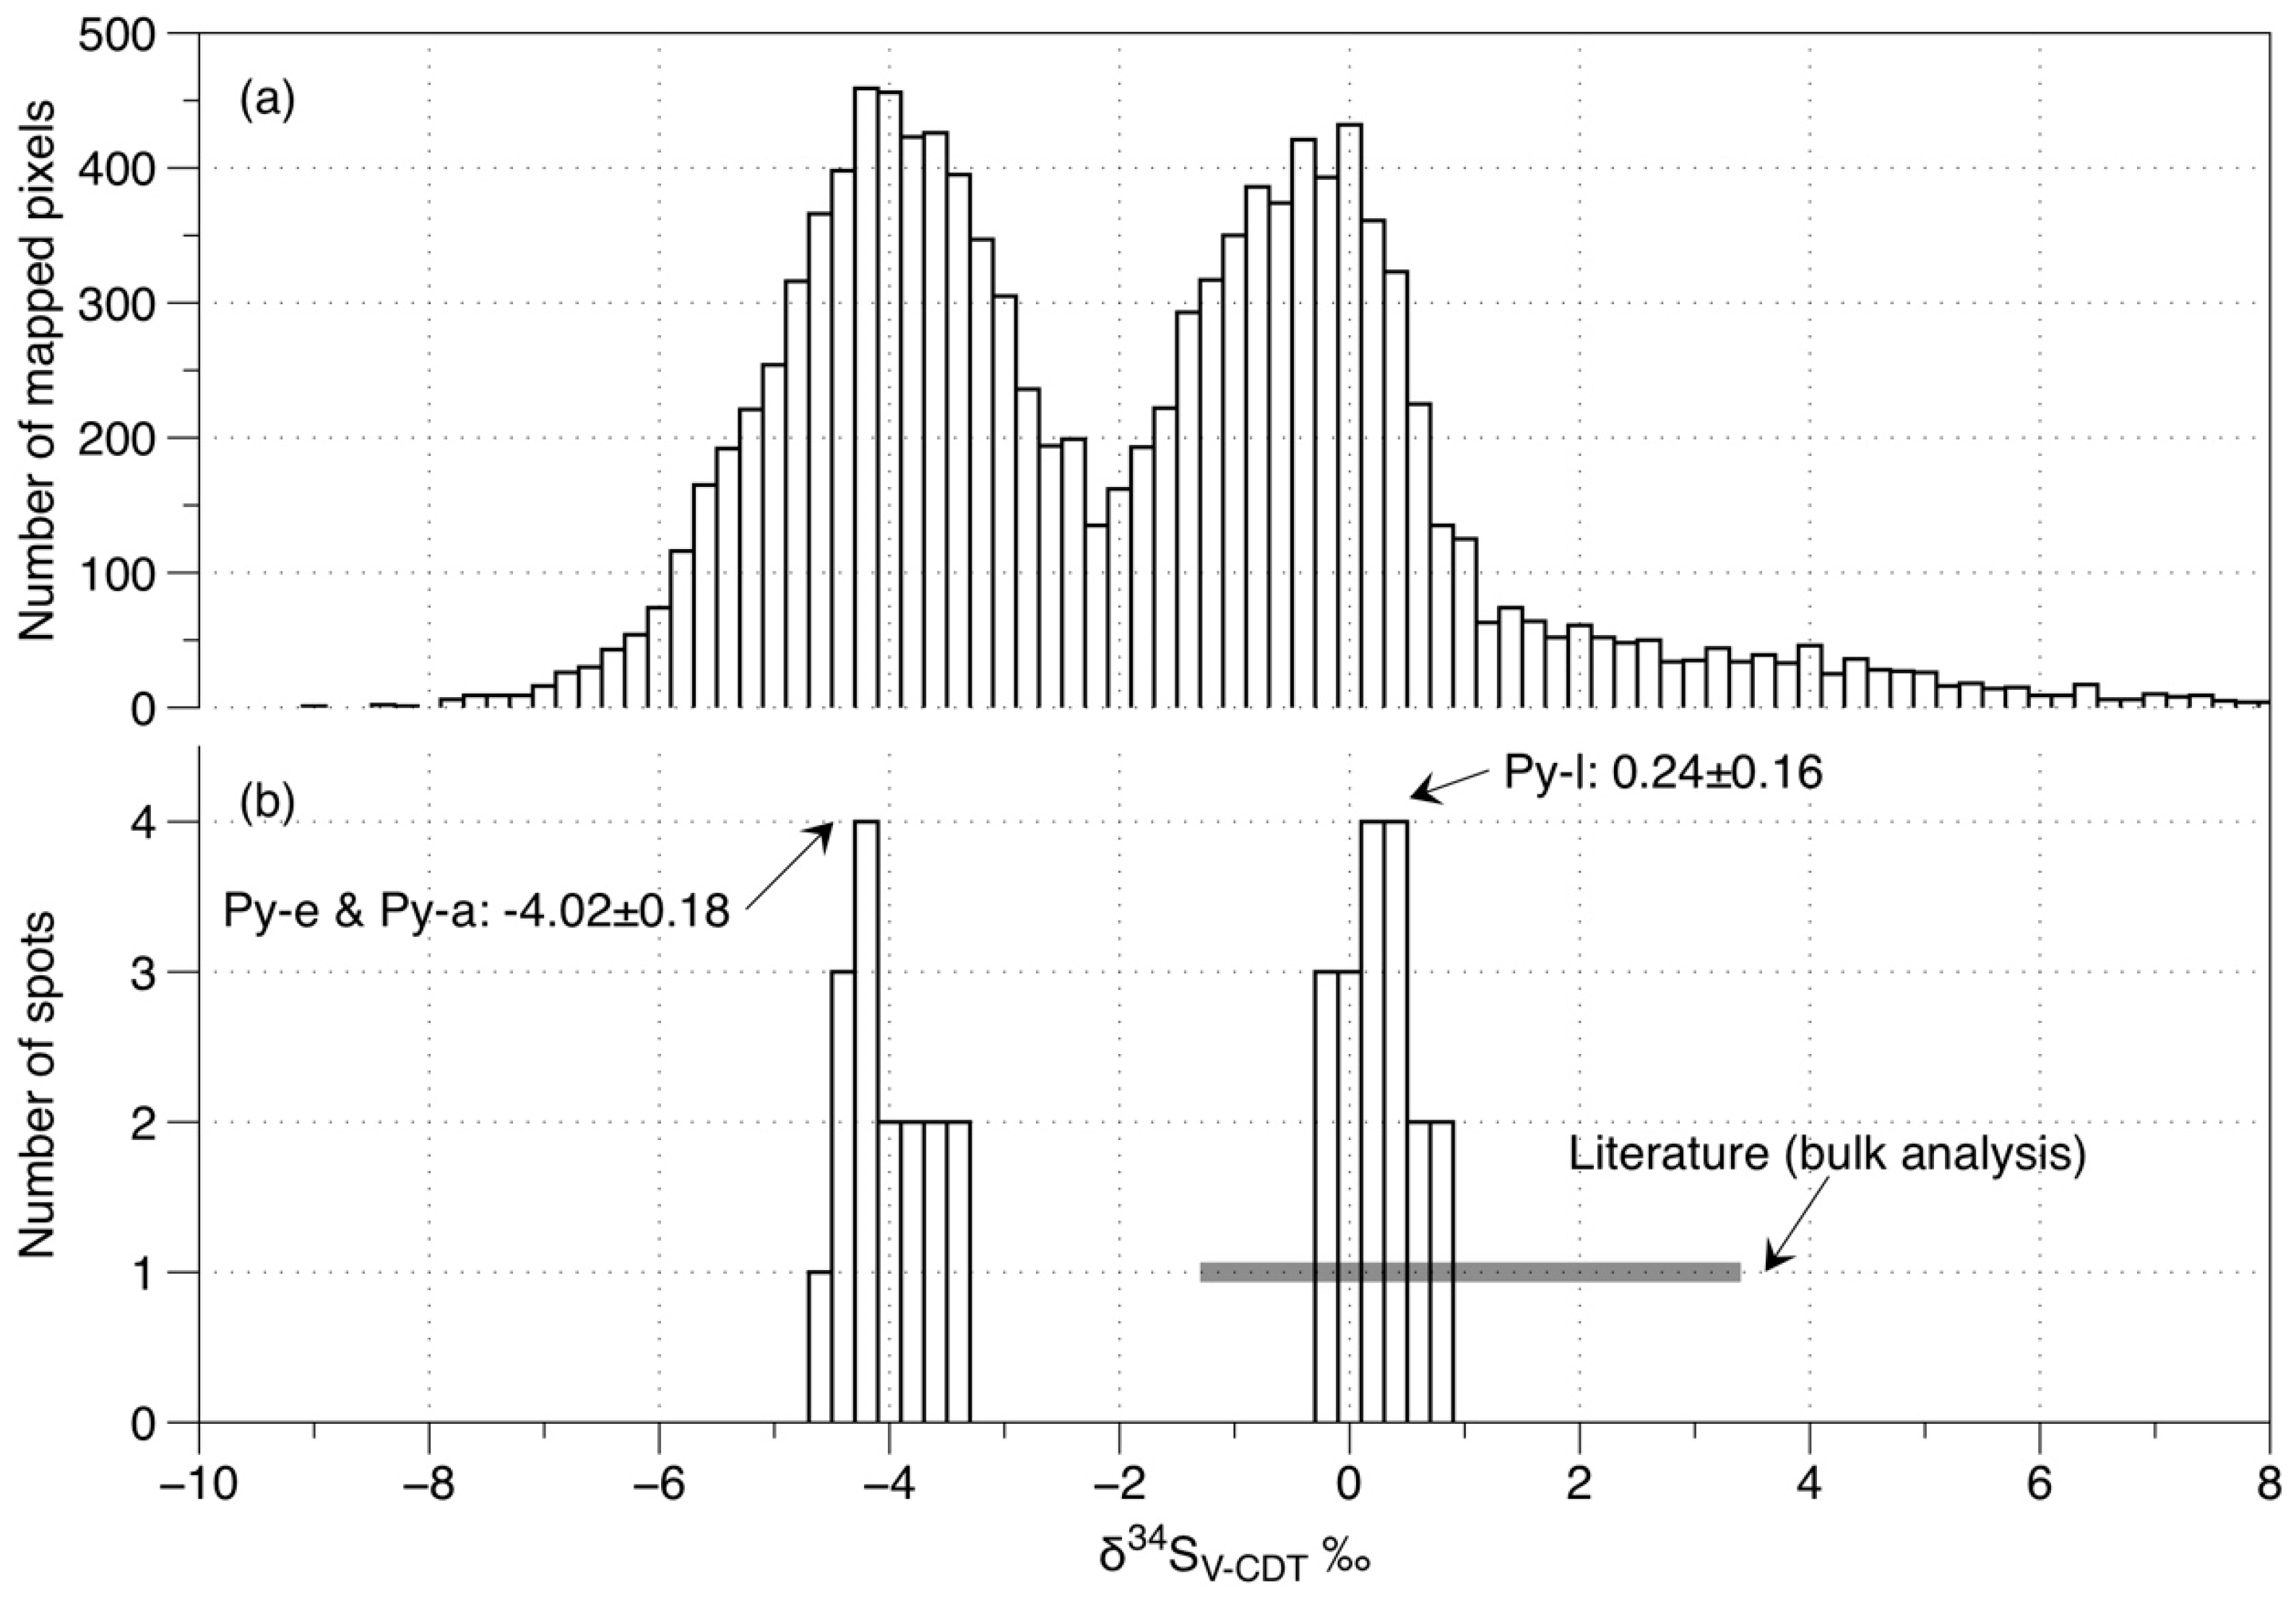
7. Mapping of Sulfur Isotopes in Pyrite

Sulfur isotope map of an area, 6 mm × 6 mm, was generated by LA-MC-ICP-MS (Figure 6). Early-stage pyrite (Py-e) shows clearly a lighter sulfur isotope signature than late-stage pyrite (Py-l). Mean S isotope δ34SV-CDT values for Py-e and Py-l are ~−4.0‰ and ~0.2‰, respectively. There is no clear difference in the S isotope signature of Py-e and Py-a.
Mapping involves a full sampling of all minerals exposed at the sample surface. The sample contains siderite, magnetite and a small amount of other sulfides, as well as two distinct generations of pyrite. Hence, there may be a potential matrix effect from the two other Fe-bearing phases. Previous studies have shown that absolute concentrations of matrix element affects sulfur isotope analysis when solution methods are used [19]. Unfortunately, only matrix effects from Ca have been previously investigated [19], whereas the effects of a siderite or magnetite matrix effect on S isotope analysis of pyrite are unknown. To constrain the accuracy of mapping, a spot analysis study was conducted at the same time, where only pyrite was ablated so as to avoid potential matrix effects caused by siderite or magnetite.
The statistical results of all pixels in the S isotope map agree well with those of the spot analyses (Figure 7), suggesting that the matrix of siderite and magnetite on S isotope analysis are statistically negligible. There is no systematic drift between mapping and spot analysis. One previous study [18] demonstrated that the matrix effect of Ca on S isotope analysis was minimal in wet plasma, however, the effects under laser ablation conditions remain less well constrained. Note that the standard used in this study is a matrix-matched pyrite single crystal. Such matrices should not lead to any systematic drift of S isotopes in pyrite as long as pyrite is used as a standard (Figure 7). The mapping results are thus considered reliable and sufficient to statistically distinguish two generations of pyrite (Figure 6 and Figure 7).
Traditional bulk analysis [40] has shown that the range of δ34S values in the pyrite is from −1.3‰ to 3.4‰. This only covers, however, variation in the late-stage vein pyrite (Py-l, Figure 7b), which is clean of inclusions and sufficiently large to be easily located, extracted and analyzed. Early-stage pyrite and the multi-component sulfide assemblages (Py-e and Py-a) are, in contrast, fine-grained, and cannot be readily separated, prohibiting their inclusion in previous S-isotope studies. This study has shown that in situ LA-MC-ICP-MS S isotope mapping is an important tool that can reveal additional information critical for reconstruction of ore-forming processes.

8. Conclusions

The spatial resolution of mapping is dependent on several factors, including sweep time of mass spectrometry, laser spot diameter, pulse rate and raster velocity. Optimizing these parameters can improve spatial resolution but the lower limit of spatial resolution is ultimately controlled by the diameter of the laser spot.
This study of S isotope mapping shows that matrix effects from analysis of different minerals (magnetite and siderite) are negligible at the precision of the data, and can thus be ignored when using a pyrite mineral for normalization. Mapping results in the case study presented here are considered accurate. In situ S isotope analysis has observed a fractionation between pyrite from different ore stages in the Chengmenshan system, which has not been resolvable by bulk analysis reported in previous studies.
For quantitative trace element analysis of pyrite, we suggest use of Fe, rather than S, as the internal standard, since normalization with Fe is appreciably more stable. The reasons for these differences are, however, unclear at present and demand further study.
When a certified value for a particular element is lacking, mapping can reveal the distribution of that element, simply using instrumental drift calibrated counts-per-second data. This is true when mapping a single mineral. It is a risk, however, to simply compare CPS among different minerals in the mapping area. Due to the larger number of points analyzed and the larger spot diameter we used for mapping analysis, the mapping results are statistically more reliable (lower standard deviation and error) and show where elements of interest are concentrated. The statistical results of mapping are also far better in accurately describing correlations between elements.

Acknowledgments

This research was supported by the National 973 project (2012CB416706), China Scholarship Council (CSC) and China National Science Foundation (No. 4142203 and 41573004). We thank Yaoming Xu and Wei Zhou for their assistance in the field survey. We would also like to thank Dr. Antonio Simonetti and three anonymous reviewers for their critical comments and suggestions, which helped us to improve the manuscript.

Author Contributions

Shao-Yong Jiang applied for funding for this work and designed this project; Zhi-Yong Zhu, Tao Yang and Kui-Dong Zhao performed the experiments; Zhi-Yong Zhu, Nigel J. Cook, Tao Yang and Cristiana L. Ciobanu analyzed the data; Tao Yang and Kui-Dong Zhao contributed reagents, materials and analysis tools; Zhi-Yong Zhu prepared the first draft of this paper; Nigel J. Cook, Cristiana L. Ciobanu and Shao-Yong Jiang revised the paper.

Conflicts of Interest

The authors declare no conflict of interest.

Abbreviations

The following abbreviations are used in this manuscript:
LA-(Q/MC)-ICP-MSLaser Ablation (Quadrupole/Multiple Collector) Inductively Coupled Plasma Mass Spectrometer
CPSCounts per Second
DRSData Reduction Scheme
LODLimit of Detection
EPMAElectron Probe Microanalyser
SIMSSecondary Ion Mass Spectrometry

References

  1. Ohmoto, H. Systematics of sulfur and carbon isotopes in hydrothermal ore deposits. Econ. Geol. 1972, 67, 551–578. [Google Scholar] [CrossRef]
  2. Paytan, A.; Mearon, S.; Cobb, K.; Kastner, M. Origin of marine barite deposits: Sr and S isotope characterization. Geology 2002, 30, 747–750. [Google Scholar] [CrossRef]
  3. Ingham, E.S.; Cook, N.J.; Cliff, J.; Ciobanu, C.L.; Huddleston, A. A combined chemical, isotopic and microstructural study of pyrite from roll-front uranium deposits, Lake Eyre Basin, South Australia. Geochim. Cosmochim. Acta 2014, 125, 440–465. [Google Scholar] [CrossRef]
  4. Craddock, P.R.; Rouxel, O.J.; Ball, L.A.; Bach, W. Sulfur isotope measurement of sulfate and sulfide by high-resolution MC-ICP-MS. Chem. Geol. 2008, 253, 102–113. [Google Scholar] [CrossRef]
  5. Fu, J.; Hu, Z.; Zhang, W.; Yang, L.; Liu, Y.; Li, M.; Zong, K.; Gao, S.; Hu, S. In situ sulfur isotopes (δ34S and δ33S) analyses in sulfides and elemental sulfur using high sensitivity cones combined with the addition of nitrogen by laser ablation MC-ICP-MS. Anal. Chim. Acta 2016, 911, 14–26. [Google Scholar] [CrossRef] [PubMed]
  6. Bendall, C.; Lahaye, Y.; Fiebig, J.; Weyer, S.; Brey, G.P. In situ sulfur isotope analysis by laser ablation MC-ICPMS. Appl. Geochem. 2006, 21, 782–787. [Google Scholar] [CrossRef]
  7. Paton, C.; Hellstrom, J.; Paul, B.; Woodhead, J.; Hergt, J. Iolite: Freeware for the visualisation and processing of mass spectrometric data. J. Anal. Atomic Spectrom. 2011, 26, 2508–2518. [Google Scholar] [CrossRef]
  8. Liu, Y.; Gao, S.; Hu, Z.; Gao, C.; Zong, K.; Wang, D. Continental and oceanic crust recycling-induced melt-peridotite interactions in the Trans-North China Orogen: U-Pb Dating, Hf isotopes and trace elements in zircons from mantle xenoliths. J. Petrol. 2010, 51, 537–571. [Google Scholar] [CrossRef]
  9. Ubide, T.; McKenna, C.A.; Chew, D.M.; Kamber, B.S. High-resolution LA-ICP-MS trace element mapping of igneous minerals: In search of magma histories. Chem. Geol. 2015, 409, 157–168. [Google Scholar] [CrossRef]
  10. Ulrich, T.; Kamber, B.S.; Jugo, P.J.; Tinkham, D.K. Imaging element-distribution patterns in minerals by laser ablation-inductively coupled plasma-mass spectrometry (LA-ICP-MS). Can. Mineral. 2009, 47, 1001–1012. [Google Scholar] [CrossRef]
  11. Chew, D.M.; Babechuk, M.G.; Cogné, N.; Mark, C.; O’Sullivan, G.J.; Henrichs, I.A.; Doepke, D.; McKenna, C.A. (LA,Q)-ICPMS trace-element analyses of Durango and McClure Mountain apatite and implications for making natural LA-ICPMS mineral standards. Chem. Geol. 2016, 435, 35–48. [Google Scholar] [CrossRef]
  12. Cook, N.; Etschmann, B.; Ciobanu, C.; Geraki, K.; Howard, D.; Williams, T.; Rae, N.; Pring, A.; Chen, G.; Johannessen, B.; et al. Distribution and substitution mechanism of Ge in a Ge-(Fe)-Bearing sphalerite. Minerals 2015, 5, 117–132. [Google Scholar] [CrossRef]
  13. George, L.L.; Cook, N.J.; Ciobanu, C.L. Partitioning of trace elements in co-crystallized sphalerite–galena–chalcopyrite hydrothermal ores. Ore Geol. Rev. 2016, 77, 97–116. [Google Scholar] [CrossRef]
  14. Agangi, A.; Hofmann, A.; Wohlgemuth-Ueberwasser, C.C. Pyrite zoning as a record of mineralization in the Ventersdorp Contact Reef, Witwatersrand Basin, South Africa. Econ. Geol. 2013, 108, 1243–1272. [Google Scholar] [CrossRef]
  15. Gagnevin, D.; Menuge, J.F.; Kronz, A.; Barrie, C.; Boyce, A.J. Minor elements in layered sphalerite as a record of fluid origin, mixing, and crystallization in the Navan Zn-Pb ore deposit, Ireland. Econ. Geol. 2014, 109, 1513–1528. [Google Scholar] [CrossRef]
  16. Large, R.R.; Danyushevsky, L.; Hollit, C.; Maslennikov, V.; Meffre, S.; Gilbert, S.; Bull, S.; Scott, R.; Emsbo, P.; Thomas, H.; et al. Gold and trace element zonation in pyrite using a laser imaging technique: Implications for the timing of gold in orogenic and carlin-style sediment-hosted deposits. Econ. Geol. 2009, 104, 635–668. [Google Scholar] [CrossRef]
  17. Woodhead, J.D.; Hellstrom, J.; Hergt, J.M.; Greig, A.; Maas, R. Isotopic and elemental imaging of geological materials by laser ablation inductively coupled plasma-mass spectrometry. Geostand. Geoanal. Res. 2007, 31, 331–343. [Google Scholar] [CrossRef]
  18. Pribil, M.J.; Ridley, W.I.; Emsbo, P. Sulfate and sulfide sulfur isotopes (δ34S and δ33S) measured by solution and laser ablation MC-ICP-MS: An enhanced approach using external correction. Chem. Geol. 2015, 412, 99–106. [Google Scholar] [CrossRef]
  19. Liu, C.; Bian, X.-P.; Yang, T.; Lin, A.-J.; Jiang, S.-Y. Matrix effects of calcium on high-precision sulfur isotope measurement by multiple-collector inductively coupled plasma mass spectrometry. Talanta 2016, 151, 132–140. [Google Scholar] [CrossRef] [PubMed]
  20. Paul, B.; Woodhead, J.D.; Paton, C.; Hergt, J.M.; Hellstrom, J.; Norris, C.A. Towards a method for quantitative LA-ICP-MS imaging of multi-phase assemblages: Mineral identification and analysis correction procedures. Geostand. Geoanal. Res. 2014, 38, 253–263. [Google Scholar] [CrossRef]
  21. Perkins, W.T.; Pearce, N.J.G.; Westgate, J.A. The development of laser ablation ICP-MS and calibration strategies: Examples from the analysis of trace elements in volcanic glass shards and sulfide minerals. Geostand. Geoanal. Res. 1997, 21, 175–190. [Google Scholar] [CrossRef]
  22. Gilbert, S.E.; Danyushevsky, L.V.; Goemann, K.; Death, D. Fractionation of sulphur relative to iron during laser ablation-ICP-MS analyses of sulphide minerals: Implications for quantification. J. Anal. Atomic Spectrom. 2014, 29, 1024–1033. [Google Scholar] [CrossRef]
  23. Zhu, Z.-Y.; Ciobanu, C.L.; Jiang, S.-Y.; Yang, T.; Cook, N.J. Sulfur isotope fractionation in pyrite during laser ablation: Implications for laser ablation multiple collector inductively coupled plasma mass Spectrometry mapping. Chem. Geol. 2016, in press. [Google Scholar]
  24. Sanborn, M.; Telmer, K. The spatial resolution of LA-ICP-MS line scans across heterogeneous materials such as fish otoliths and zoned minerals. J. Anal. Atomic Spectrom. 2003, 18, 1231–1237. [Google Scholar] [CrossRef]
  25. Triglav, J.; van Elteren, J.T.; Šelih, V.S. Basic modeling approach to optimize elemental imaging by laser ablation ICPMS. Anal. Chem. 2010, 82, 8153–8160. [Google Scholar] [CrossRef] [PubMed]
  26. Van Elteren, J.T.; Izmer, A.; Šelih, V.S.; Vanhaecke, F. Novel image metrics for retrieval of the lateral resolution in line scan-based 2D LA-ICPMS imaging via an experimental-modeling approach. Anal. Chem. 2016, 88, 7413–7420. [Google Scholar] [CrossRef] [PubMed]
  27. Kindness, A. Two-dimensional mapping of copper and zinc in liver sections by laser ablation-inductively coupled plasma mass spectrometry. Clin. Chem. 2003, 49, 1916–1923. [Google Scholar] [CrossRef] [PubMed]
  28. Becker, J.S.; Zoriy, M.V.; Pickhardt, C. Imaging of copper, zinc, and other elements in thin section of human brain samples (hippocampus) by laser ablation inductively coupled plasma mass spectrometry. Anal. Chem. 2005, 77, 3208–3216. [Google Scholar] [CrossRef] [PubMed]
  29. Becker, J.S.; Matusch, A.; Depboylu, C.; Dobrowolska, J.; Zoriy, M.V. Quantitative imaging of selenium, copper, and zinc in thin sections of biological tissues (Slugs—Genus Arion) measured by laser ablation inductively coupled plasma mass spectrometry. Anal. Chem. 2007, 79, 6074–6080. [Google Scholar] [CrossRef] [PubMed]
  30. Chang, Y.F.; Liu, X.P.; Wu, Y.C. The Copper Iron Belt of the Middle and Lower Reaches of Yangtze River; Geological Publishing House: Beijing, China, 1991. (In Chinese) [Google Scholar]
  31. Huang, E.; Zhang, N.; Luo, Z. The genesis of the Chengmenshan and Wushan copper deposits. Miner. Depos. 1990, 9, 291–308. (In Chinese) [Google Scholar]
  32. Gu, L.; Xu, K. On the carboniferous submarine massive sulphide deposits in the lower reaches of the Changjiang (Yangzi) River. Acta Geol. Sin. 1986, 176–189. (In Chinese) [Google Scholar]
  33. Jiang, S.Y.; Ding, Q.F.; Yang, S.Y.; Zhu, Z.Y.; Sun, M.Z.; Sun, Y. Discovery and Significance of carbonate mud mounds from cu-polymetallic deposits in the middle and Lower Yangtze metallogenic belt: Examples from the Wushan and Dongguashan deposit. Acta Geol. Sin. 2011, 85, 744–756. (In Chinese) [Google Scholar]
  34. Mao, J.; Xie, G.; Duan, C.; Pirajno, F.; Ishiyama, D.; Chen, Y. A tectono-genetic model for porphyry–skarn–stratabound Cu-Au-Mo-Fe and magnetite–apatite deposits along the Middle–Lower Yangtze River Valley, Eastern China. Ore Geol. Rev. 2011, 43, 294–314. [Google Scholar] [CrossRef]
  35. Mao, J.W.; Shao, Y.J.; Xie, G.Q.; Zhang, J.D.; Chen, Y.C. Mineral deposit model for porphyry-skarn polymetallic copper deposits in Tongling ore dense district of Middle-Lower Yangtze Valley metallogenic belt. Miner. Depos. 2009, 28, 109–119. (In Chinese) [Google Scholar]
  36. Wilson, S.A.; Ridley, W.I.; Koenig, A.E. Development of sulfide calibration standards for the laser ablation inductively-coupled plasma mass spectrometry technique. J. Anal. At. Spectrom. 2002, 17, 406–409. [Google Scholar] [CrossRef]
  37. Parent, M.; Vanhoe, H.; Moens, L.; Dams, R. Investigation of HfO+ interference in the determination of platinum in a catalytic converter (cordierite) by inductively coupled plasma mass spectrometry. Talanta 1997, 44, 221–230. [Google Scholar] [CrossRef]
  38. Cook, N.J.; Ciobanu, C.L.; George, L.; Zhu, Z.-Y.; Wade, B.; Ehrig, K. Trace element analysis of minerals in magmatic-hydrothermal ores by laser ablation inductively-coupled plasma mass spectrometry: Approaches and opportunities. Minerals 2016, 6, 111. [Google Scholar]
  39. Longerich, H.P.; Jackson, S.E.; Günther, D. Inter-laboratory note. Laser ablation inductively coupled plasma mass spectrometric transient signal data acquisition and analyte concentration calculation. J. Anal. Atomic Spectrom. 1996, 11, 899–904. [Google Scholar] [CrossRef]
  40. Zhao, R.; Xie, Y.H.; Yao, Y.Y. Sulfur isotope study of the copper ore deposit of Chengmenshan and Wushan. Sci. Geol. Sin. 1985, 3, 251–258. (In Chinese) [Google Scholar]
Figure 1. Photomicrographs in reflected light showing petrographic aspects of the studied sample. (a) Overview of the hand specimen, the early stage pyrite (Py-e) is associated with siderite-magnetite-dominant matrix that was crosscut by late-stage pyrite veins (Py-l); (b) the main-ore stage with multi-component sulfide assemblage including chalcopyrite (Ccp), sphalerite (Sph), Bornite (Bn) and pyrite (Py-a); (c) early pyrite (Py-e) hosted interstitially within the siderite (Sd)-magnetite (Mag) matrix and has possibly replaced marcasite (Mrc); relict marcasite can be seen within Py-e; (d) replacements of siderite by magnetite within the sample matrix.
Minerals 06 00110 g001
Figure 2. Plot showing variation in normalized CPS for Co, Ni, Ge and Se, using Fe and S as the internal standard, respectively. The analysis shown was conducted on a single crystal pyrite in spot mode. Carrier gas flow was changed to control the amount of ablated particles into the ICP-MS.
Minerals 06 00110 g002
Figure 3. Rx and Ry are horizontal and vertical spatial resolutions respectively. Each square represents a laser pulse. To make the laser cover the entire surface of the mapped area, raster velocity (V) should not larger than the product of laser repetition rate (f) and spot size (d).
Minerals 06 00110 g003
Figure 4. LA-Q-ICP-MS element maps. The elements are arranged in alphabetical orders. Se, Co, Ni and Co/Ni ratios are inhomogeneous in Py-l. Ag, As, Au, Bi, Cd, Co, Cu, Mo, Ni, Pb, Re, Se, Si, Te and Zn are hosted within the sulfide assemblages, which are always distributed around Py-l, or in the fracture. Py-l is barren of these metals, but is relatively enriched in Pt and Se. The resolution of these images is not high enough to distinguish Py-e from siderite and magnetite. Spot results are shown in Figure 5. The area mapped is approximately the same as that indicated by the red square in Figure 1a. Sulfur isotopes are also mapped in this same area. The sample block was carefully polished after S isotope analysis in preparation for trace element mapping.
Minerals 06 00110 g004
Figure 5. Concentrations of 16 selected elements in the three generations of pyrite using spot analysis mode. Precious metals are more enriched in the sulfide assemblages than Py-e, Py-l is barren of precious metals, but enriched in Se relative to Py-e. We excluded two spots (see diagram for Au) after checking the time-resolved spectra data, where the extremely abnormal peaks in the 197Au signal are very likely caused by the presence of included native gold.
Minerals 06 00110 g005
Figure 6. (a) Reflected-light image of mapped area and (b) LA-MC-ICP-MS S isotope map. The vein appearing bright on both the image and the map is Py-l, whereas the darker areas are the matrix dominated by siderite and magnetite but also containing interstitial Py-e and Py-a. Note that the S-isotope map shows that the S isotope signature of Py-l is about 4‰ heavier than Py-e and Py-a.
Minerals 06 00110 g006
Figure 7. Comparison of S-isotope data from mapping and spot analysis. (a) Statistic results of mapping analysis in the Figure 6b; (b) Spot analysis results. There is no systematic drift between the statistical results from the two methods. Published data (obtained via traditional bulk analysis methods [40]) are also marked. These cover only the coarser Py-l. The fine-grained Py-e in the matrix had been observed but was not analyzed previously.
Minerals 06 00110 g007

