Article

The Flotation of Kyanite and Sillimanite with Sodium Oleate as the Collector

School of Resources and Environmental Engineering, Wuhan University of Technology, Wuhan 430070, China
*
Author to whom correspondence should be addressed.
Minerals 2016, 6(3), 90; https://doi.org/10.3390/min6030090
Submission received: 22 July 2016 / Revised: 24 August 2016 / Accepted: 25 August 2016 / Published: 31 August 2016
(This article belongs to the Special Issue Flotation in Mineral Processing)

Abstract

:
Kyanite and sillimanite are two polymorphic minerals with the same formula of Al2SiO5, but different crystal structures. Despite their high economic values, selectively recovering them by flotation is a challenge. In this study, the flotation behaviors of the two minerals with sodium oleate as the collector were examined at different pH conditions. Zeta potential measurement, infrared spectroscopic measurement, chemical speciation and X-ray photoelectron spectroscopy measurement were conducted to identify the underpinning mechanisms. It is found that the flotation behavior of both minerals is different under the same flotation condition. The flotation recovery of sillimanite is much higher than that of kyanite in the presence of the collector sodium oleate. Sodium oleate adsorbs onto the surfaces of kyanite and sillimanite mainly through the chemical interaction of the ionic–molecular dimers with aluminum atoms at pH 8.0. The higher sillimanite flotation recovery between the two minerals is related to the higher electrostatic charge densities of the aluminum atoms in six-fold coordination, which leads to the higher collector adsorption.

1. Introduction

Kyanite and sillimanite are two polymorphic minerals with the same chemical formula of Al2SiO5 [1,2]. However, the crystal structures of the two minerals are different. Kyanite crystallizes in the triclinic system, while sillimanite crystallize in the orthorhombic system [3].
Kyanite and sillimanite are composed of regionally-metamorphosed rocks, and the formation process is controlled by temperature and pressure [4]. Kyanite is formed in the metamorphic area of high or medium pressure and low temperature, and sillimanite is formed in the metamorphic area of medium or low pressure and low temperature [5]. The entropy and Gibbs free energy of the two minerals are very similar, so they can be stably formed at the transition temperature [6]. The ore deposit where kyanite and sillimanite are associated is not rare [7,8,9,10]. The different formation conditions lead to the different crystal structures of the two minerals. The unit cell models of kyanite and sillimanite were created by Material studio 6.0, shown in Figure 1. The lattice constants and atom positions were taken from the structural reports of sillimanite [11] and kyanite [12] based on X-ray studies. They have one feature in common, which is that half of the Al atoms occur in six-fold coordination forming chains of edge-shared AlO6 octahedra parallel to the crystallographic c-axis [13]. The differences in their stability depend critically on the chemical bonding of the remaining Al atoms in each polymorph: Al is in four-fold coordination in sillimanite [11] and six-fold coordination in kyanite [12]. The Si atom is in four-fold coordination in both polymorphs [14].
Kyanite and sillimanite are important ceramic and refractory minerals [15]. They are used to produce high performance lightweight aluminum–silicon alloys, to fabricate metallic fiber, the leading edge of supersonic aircraft and spaceships, and so on [3,16]. A concentration process is necessary in order to produce kyanite and sillimanite products from ores to meet industrial needs [17,18]. The traditional concentration methods are gravity and magnetic separation. However, flotation is becoming the dominant concentration method due to the decreasing ore grade and the growing industrial demand for higher product grades [19,20]. Sodium oleate has been applied in the flotation of kyanite and sillimanite [21,22]. The flotation behaviors of kyanite and sillimanite using sodium oleate as the collector are different. However, the different response of the collector to the two minerals has not been studied. Such a study is important especially when the selective separation of kyanite and sillimanite is required.
This study investigated the flotation behavior of kyanite and sillimanite by using sodium oleate as a collector. Zeta potential measurement, infrared spectroscopic measurement, chemical speciation and X-ray photoelectron spectroscopy measurement were used to study the crystal structure and composition on mineral surfaces and their effects on the interaction between both minerals and the collector.

2. Experimental Section

2.1. Materials and Reagents

Kyanite and sillimanite single minerals were obtained from a kyanite mine in Nanyang, Henan, China, and a sillimanite mine in Hebei, China. High grade minerals were handpicked, ground in a ceramic mill and then screened to collect −0.10 mm + 0.074 mm particle size fractions. Table 1 shows the chemical composition of the mineral samples analyzed by the X-ray fluorescence spectrometer (XRF). The content of the aluminum of the samples was 62.76 wt % and 60.56 wt % for kyanite and sillimanite, respectively. X-ray diffraction (XRD) analysis of the samples revealed the purity of the minerals to be more than 95 wt %.
Sodium oleate with 99% purity was obtained from Sinopharm Chemical Reagent Co., Ltd. (Shanghai, China). Sodium oleate was used in the form of 0.5% w/w solution. The 1.0% w/w HCl or NaOH solutions were used to adjust the slurry pH. De-ionized (DI) water was used in all experiments. All chemical solutions were made fresh daily.

2.2. Flotation Tests

Flotation tests for single mineral (kyanite and sillimanite) were conducted by using an XFG-35 laboratory mechanical flotation cell with a volume of 35 mL. Two grams of single mineral were firstly mixed with 35 mL DI water in the flotation cell for 1 min with an impeller speed of 2000 rpm. HCl or NaOH was then added to adjust the pulp pH to a predetermined pH. Sodium oleate was then added and conditioned for 3 min. The pulp pH was then adjusted slightly before flotation and was assumed to be the slurry pH at the end of flotation. The total flotation time was 3 min, and the concentrates were collected by manually scraping. Both the concentrates collected and the tailings remaining in the cell were dried and weighed for calculating flotation recoveries. All recovery results presented are the average of duplicate flotation tests.

2.3. Zeta Potential Measurements

Zeta potentials measurements were carried out by ZetaPlus Zeta Potential Analyzer (Brookhaven Instruments Corporation, Austin, TX, USA). A 20.0-mg sample was placed in a 150-mL beaker with 100 mL DI water containing 1.0 × 10⁻³ mol·L−1 KCl as a supporting electrolyte. The tested sample particles were ground to −5 μm in an agate mortar. The pH value was then adjusted by using HCl or NaOH solutions, and the sample was conditioned for 6 min. Some suspension was sampled for the Zeta potential measurements. The measurements were performed at 25 °C. Each sample was measured three times, and the average zeta potential with the standard deviation was reported.

2.4. Infrared Spectroscopic Measurements

Fourier transform infrared (FTIR) spectra were recorded on a Nicolet iS10 FTIR Spectrometer (Thermo Fisher Scientific, Waltham, MA, USA) in the range from 4000 to 400 cm−1. Slurry samples were collected directly from the flotation cell after conditioning with the reagents and then dried in a vacuum oven at 40 °C. The pellet was prepared by mixing the tested sample and KBr at the mass ratio of 1/100 and then transferred into the spectrometer for measurement at room temperature.

2.5. X-ray Photoelectron Spectroscopy Measurements

The X-ray photoelectron spectroscopy (XPS) spectra of samples untreated and treated by sodium oleate were carried out by the Thermo Electron Corporation (Waltham, MA, USA) VG Multilab 2000 with a monochromatic Al X-ray source operating at 300 W. The samples were firstly examined in the survey mode to identify all elements present on the surface, and then, various elemental regions were scanned in order to extract information on chemical bonding and elemental valence. The samples were analyzed at a pressure of 10−8 Torr at room temperature. Each analysis started with a survey scan from 0 to 1100 eV using a pass energy of 100 eV at steps of 1.0 eV with 1 sweep. High resolution spectra of Al2p, Si2p, O1s and C1s were collected at 25 eV pass energy at steps of 100 meV with 2 sweeps. Binding energies were charge-corrected by referencing to adventitious carbon at 284.6 eV [23].

3. Results and Discussion

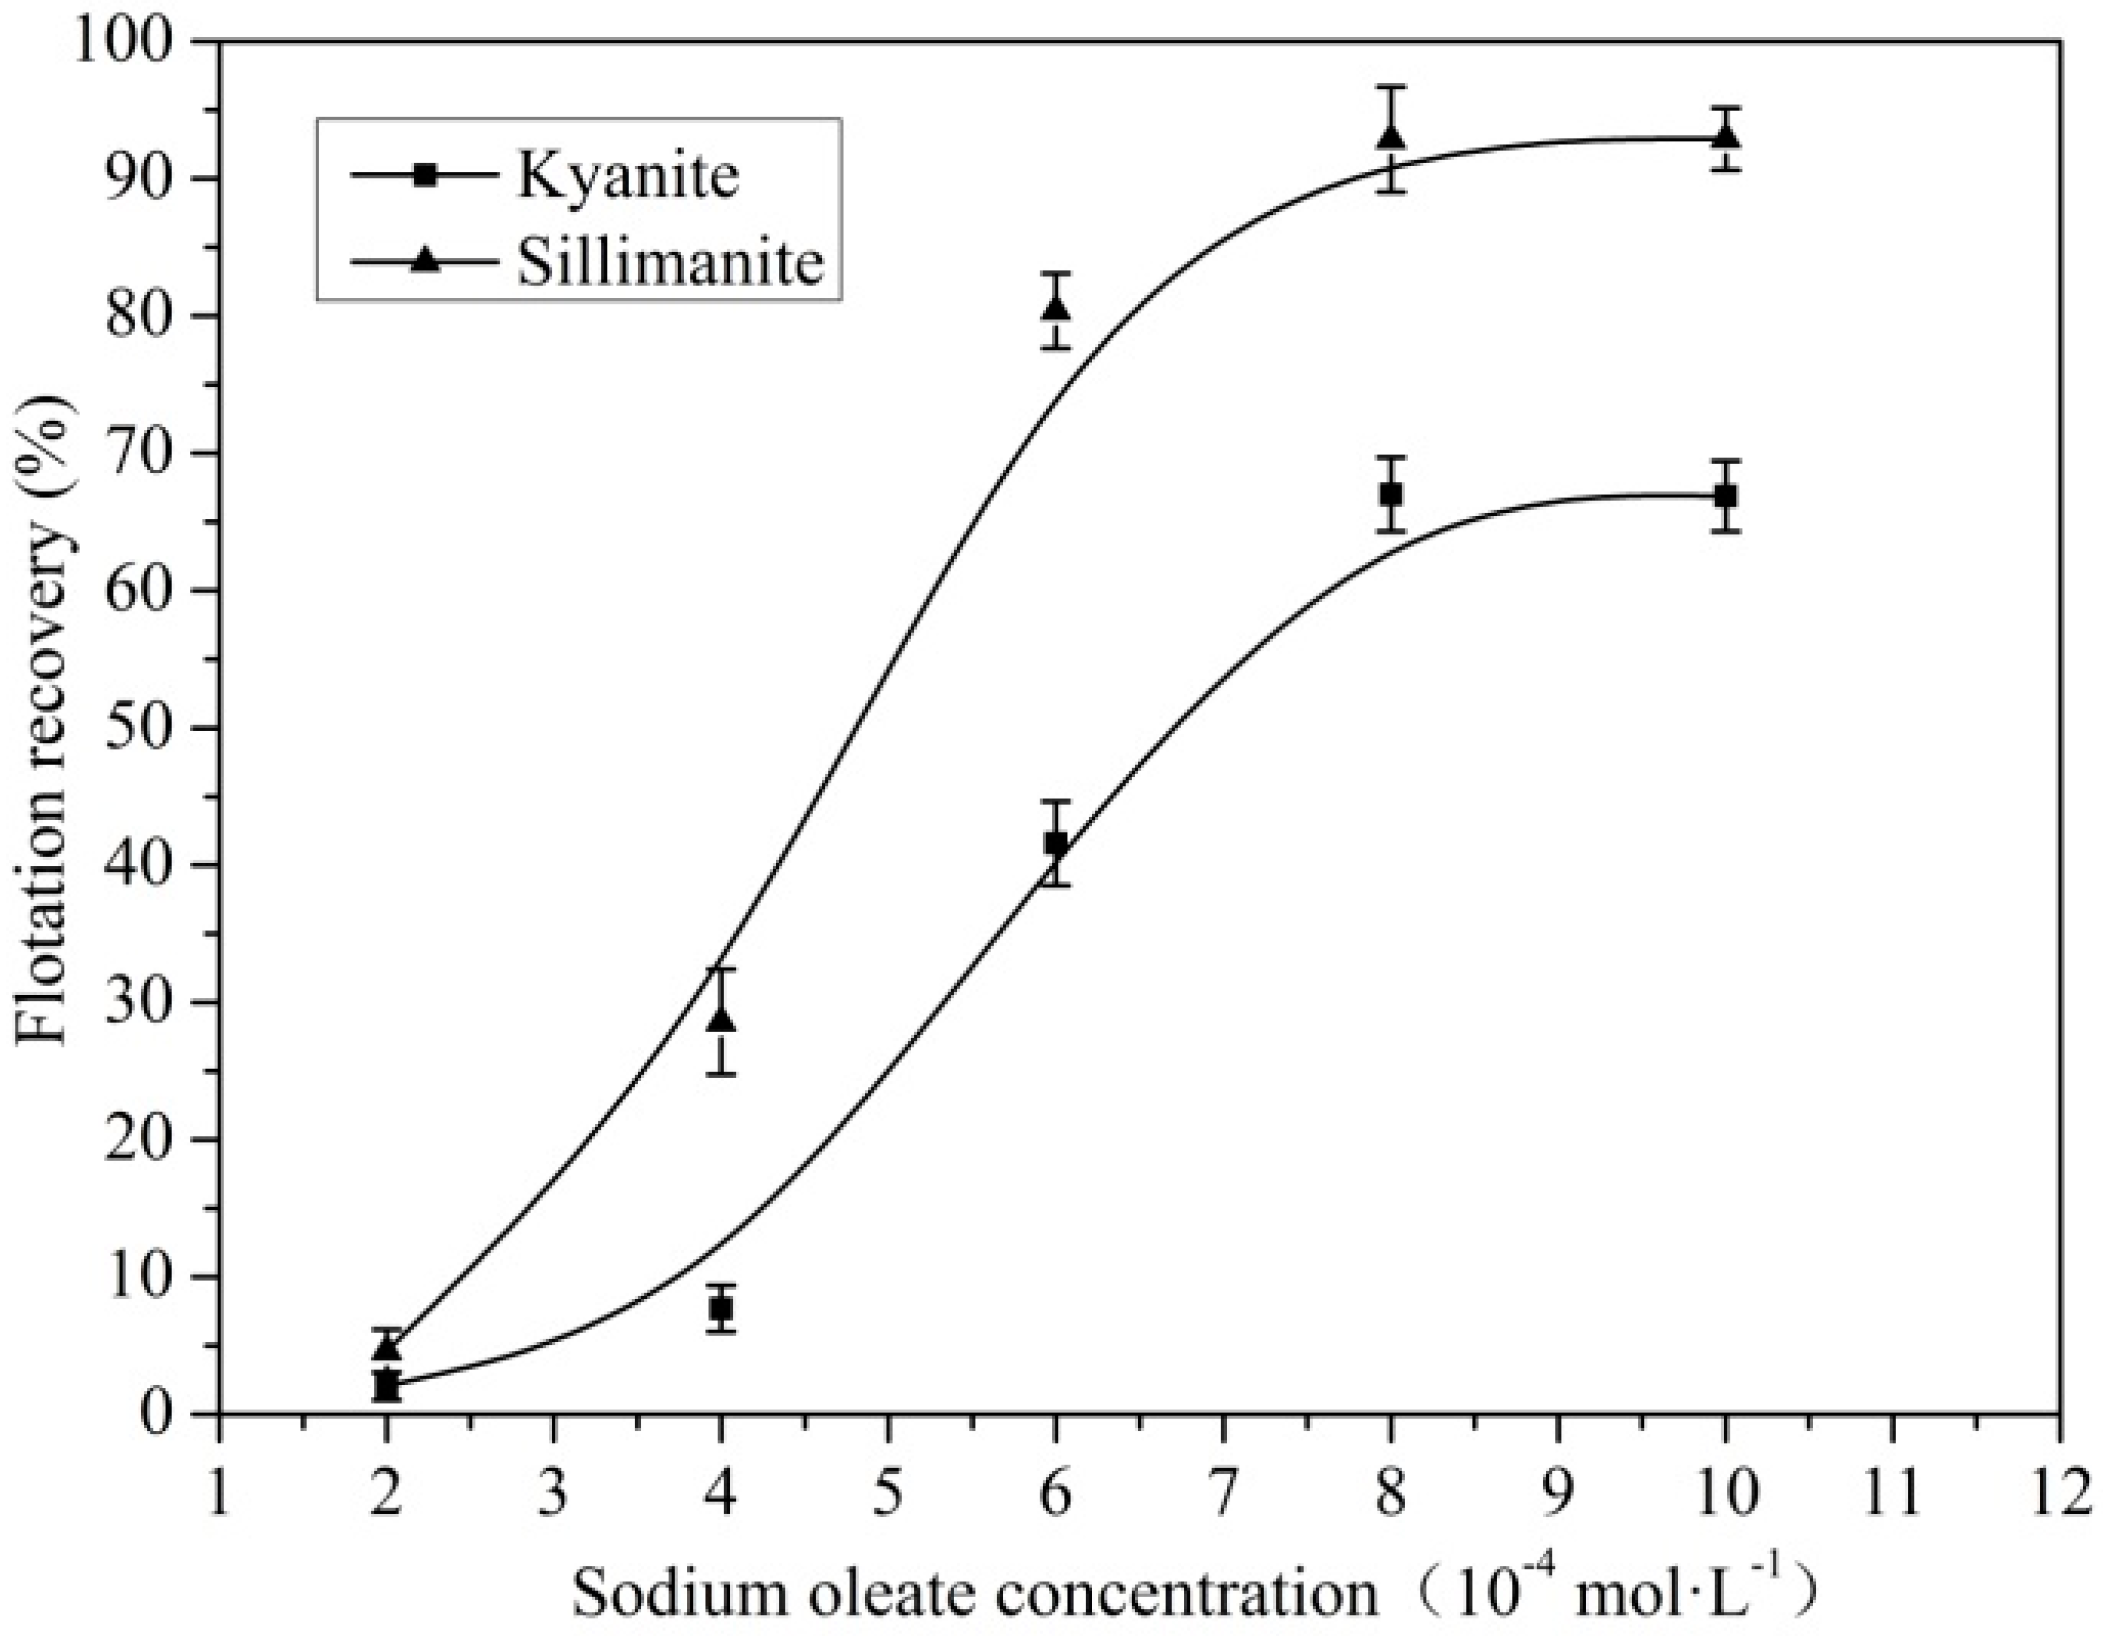
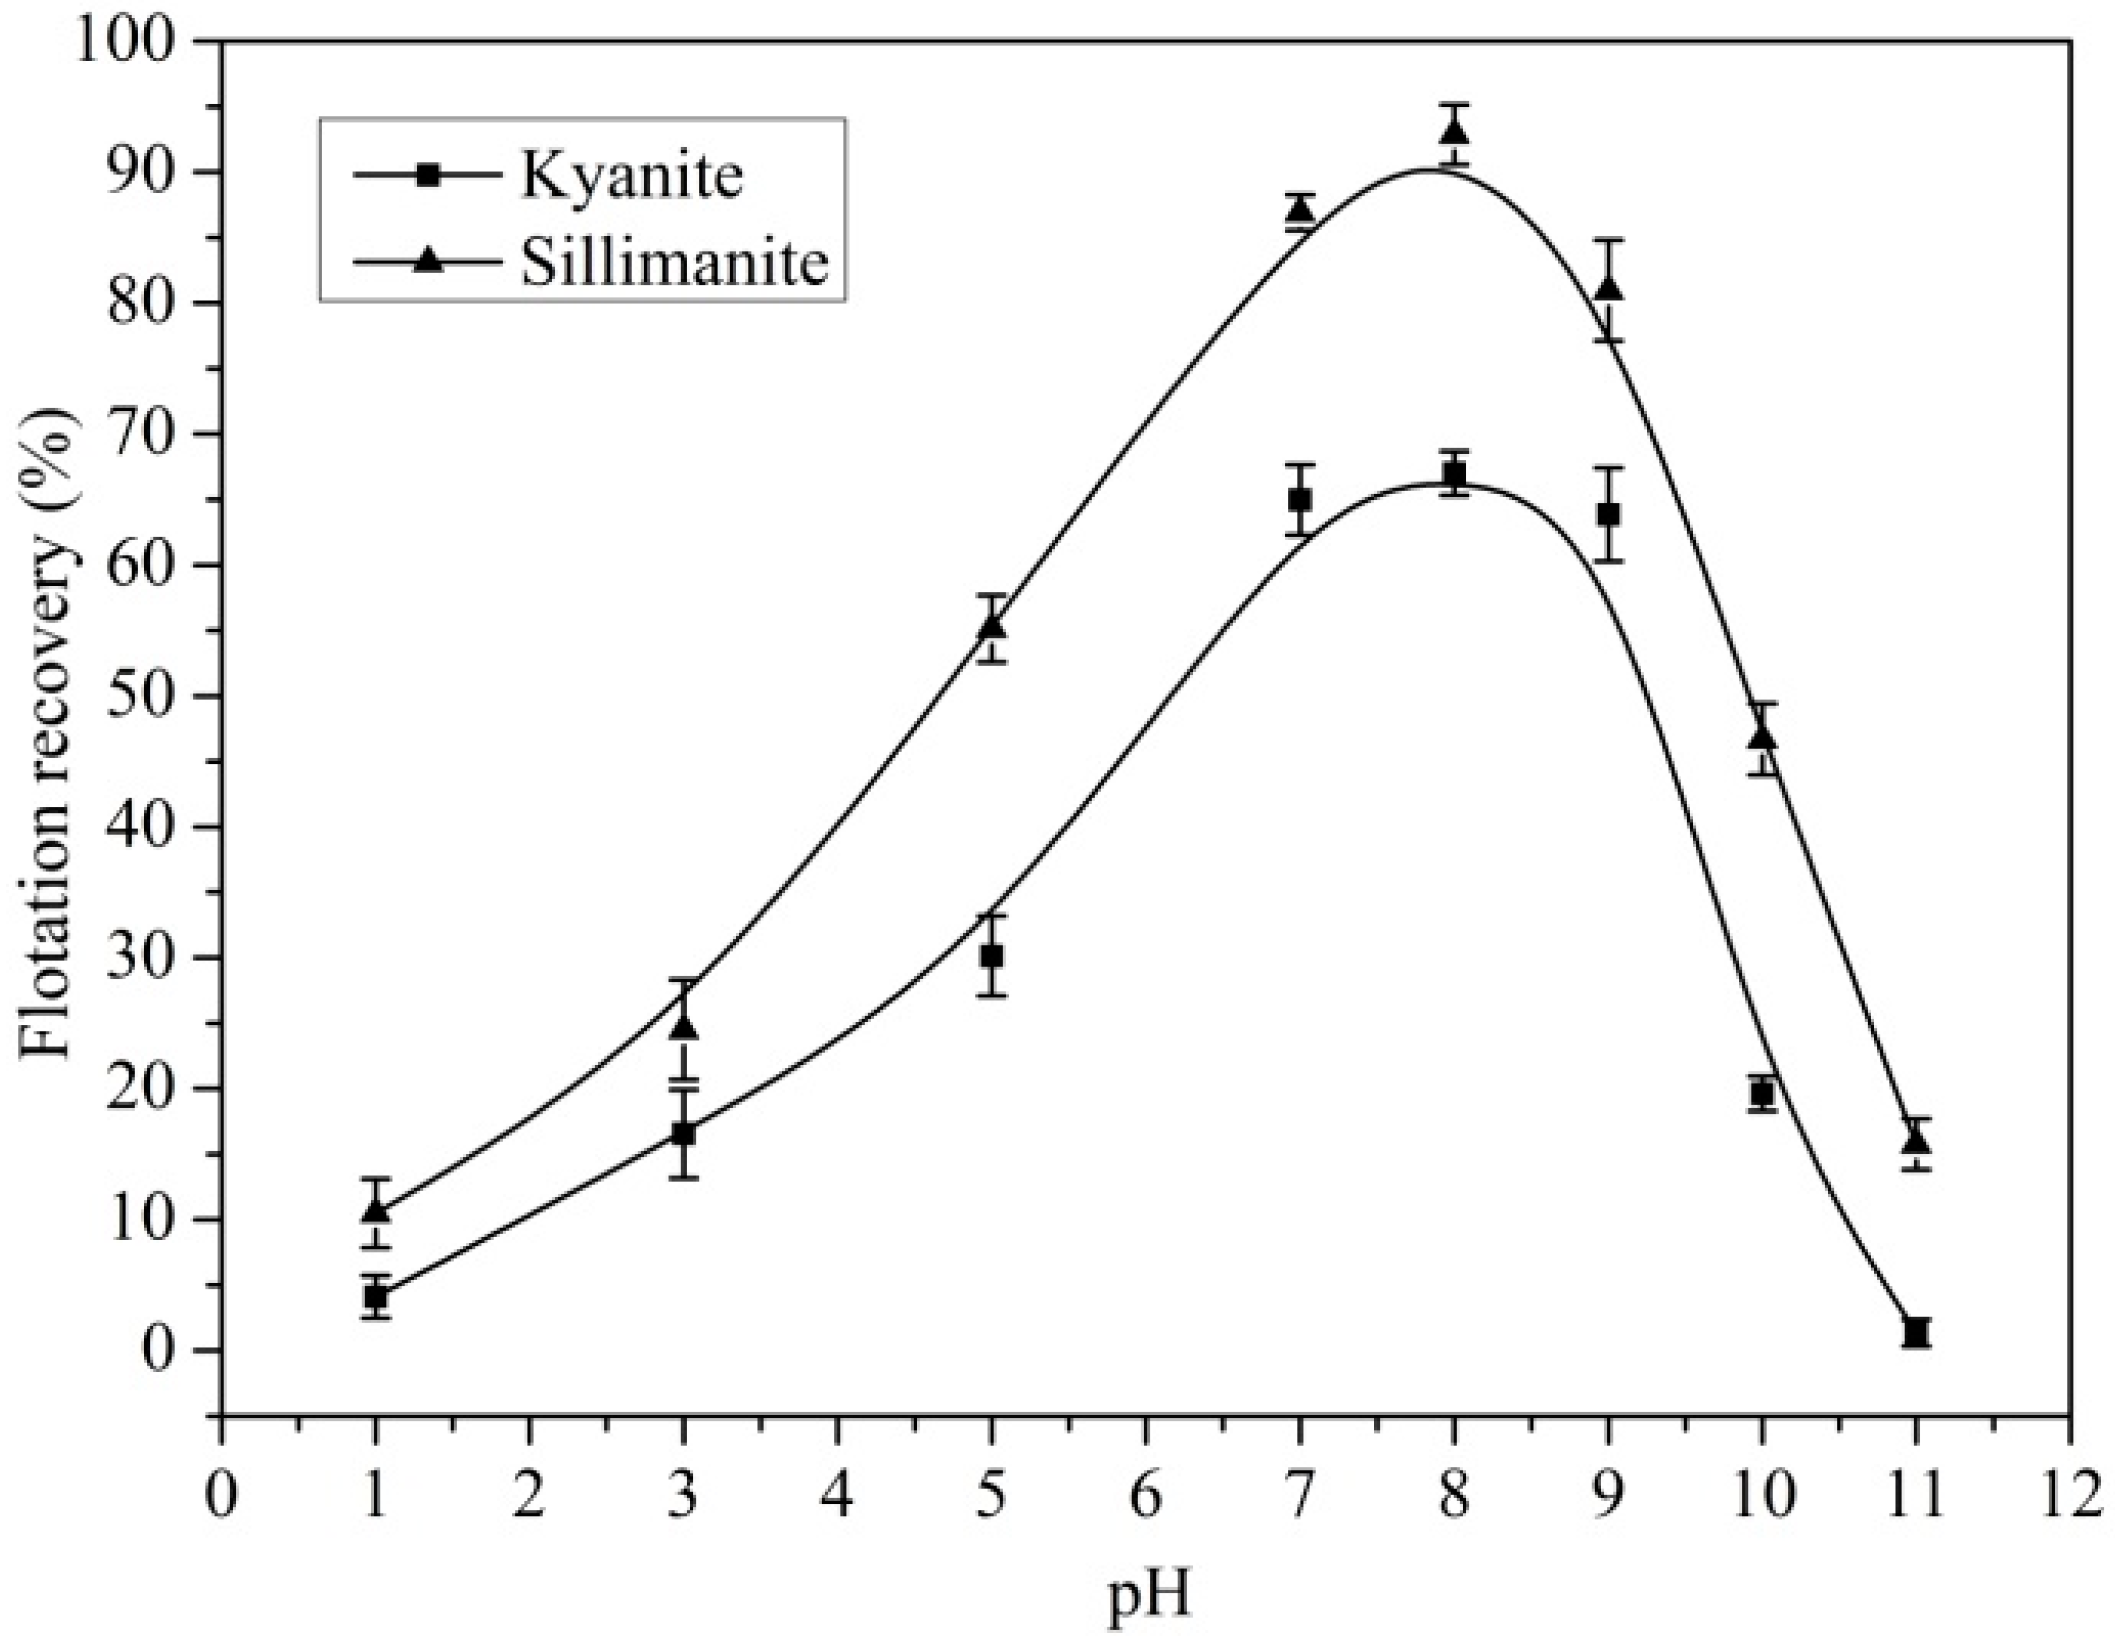
3.1. Flotation of Kyanite and Sillimanite

Flotation tests were conducted by using kyanite and sillimanite single minerals. The effect of sodium oleate concentration on the flotation recovery of kyanite and sillimanite at pH 8.0 is shown in Figure 2. The flotation recovery of the two minerals increased with the sodium oleate concentration. The maximum recovery was achieved at a sodium oleate concentration of 8.0 × 10⁻⁴ mol·L−1. The highest recovery of kyanite and sillimanite was about 67% and 93%, respectively. Under the same flotation condition, sillimanite presented a higher flotation recovery, while kyanite presented a lower flotation recovery after three minutes of flotation.
The effect of pH on the flotation recovery when using 8.0 × 10⁻⁴ mol·L−1 sodium oleate as the collector is shown in Figure 3. Kyanite and sillimanite showed a poor floatability when the pH was below 3.0. However, the flotation recovery increased significantly after increasing the slurry pH from 3.0 to 8.0. The maximum recovery of kyanite and sillimanite was obtained at the pH range of 8.0 to 9.0. The flotation recovery decreased significantly after increasing the slurry pH from 9.0 to 11.0. In general, pH plays an important role in the flotation of kyanite and sillimanite with the anionic collector sodium oleate. Sillimanite recovery was much higher than kyanite recovery at the pH range of 1.0 to 11.0.

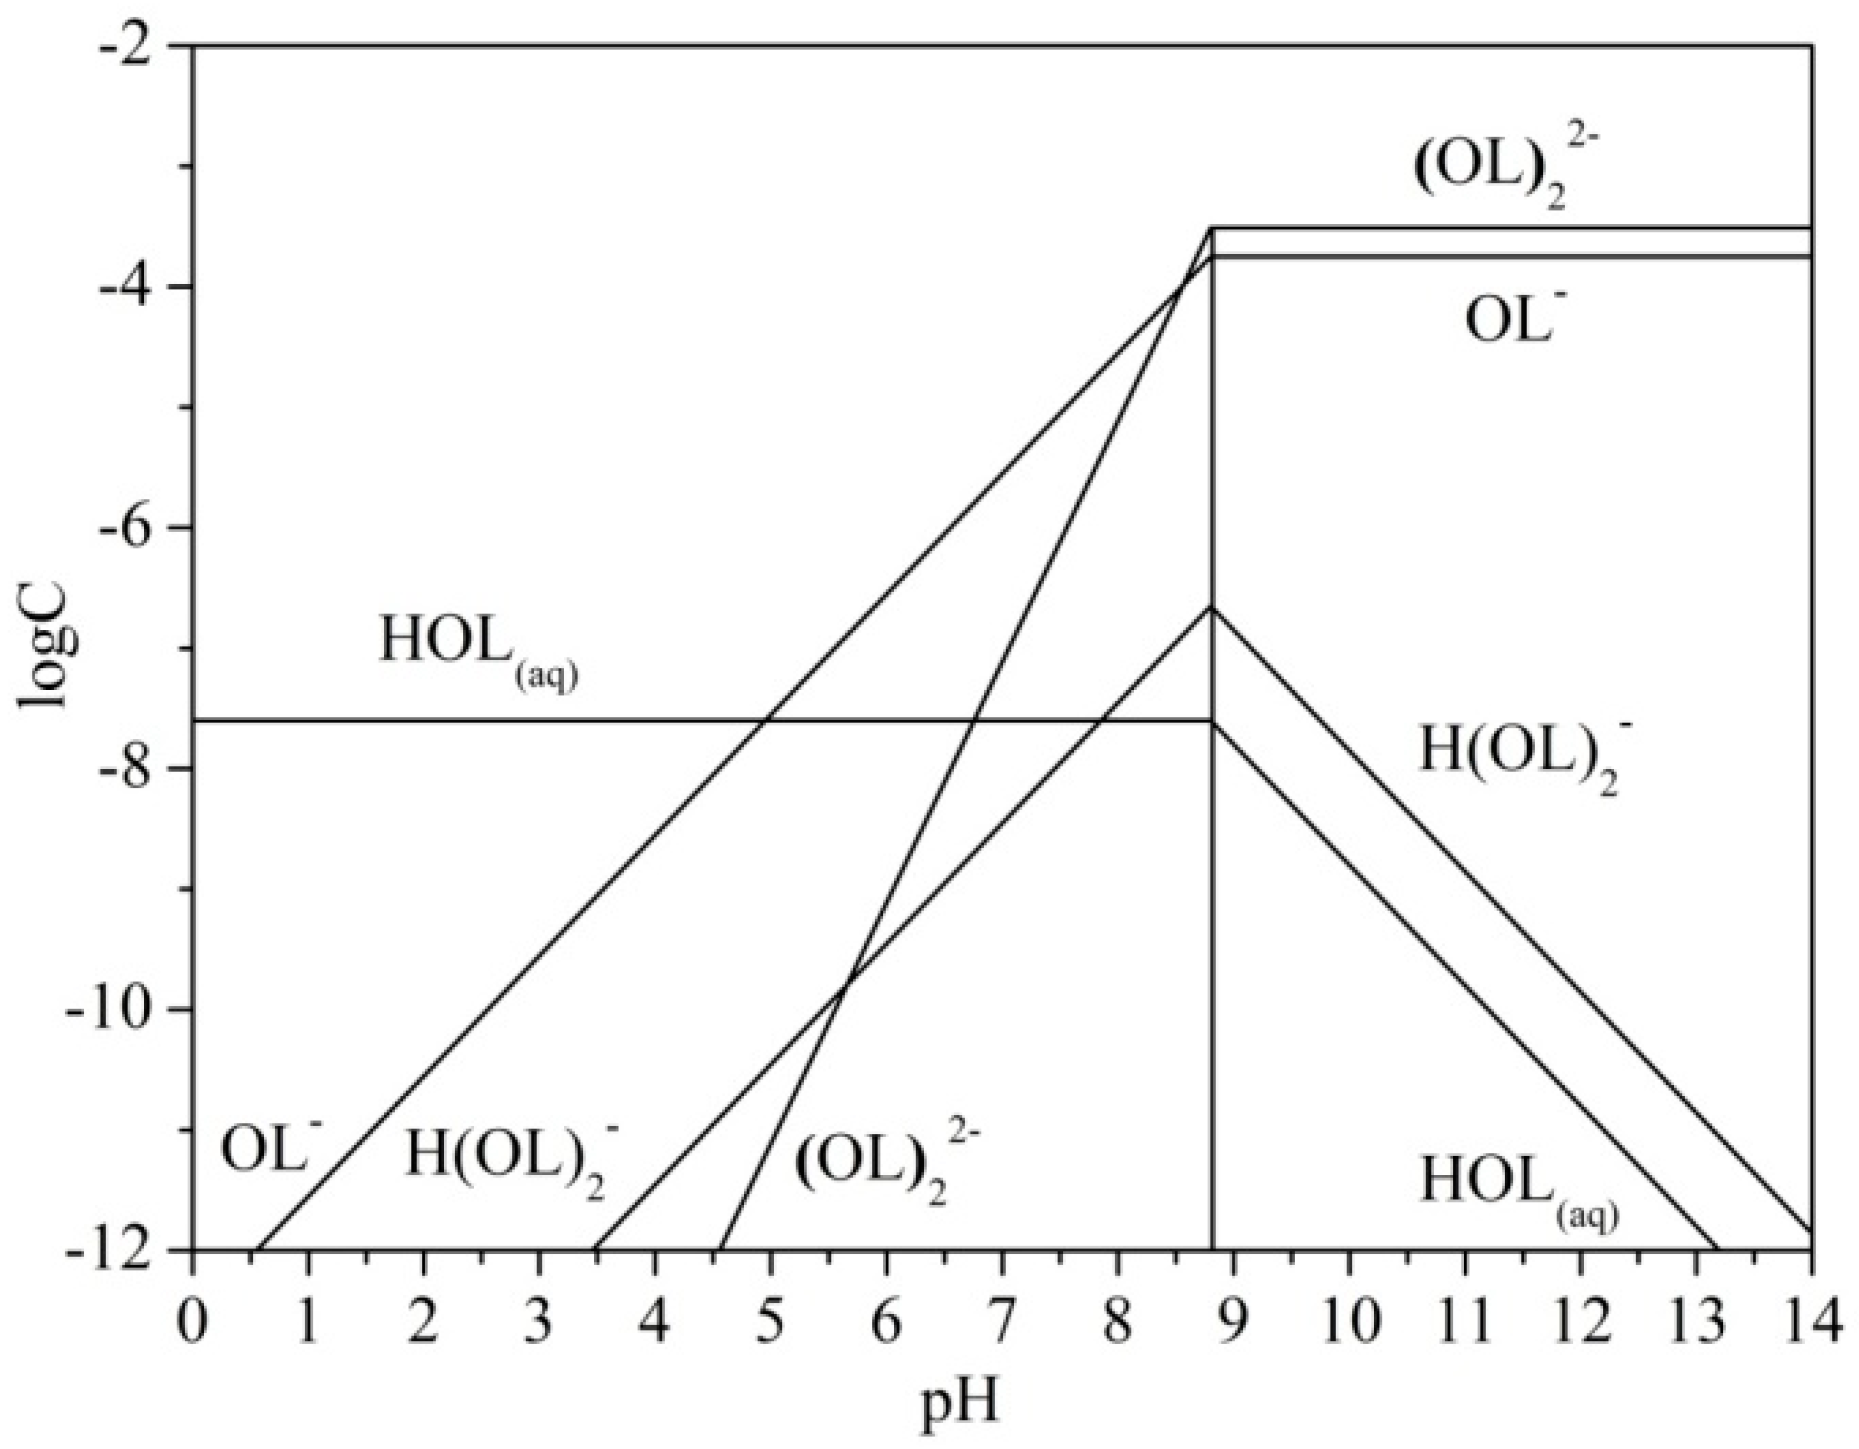
3.2. Chemical Speciation of Sodium Oleate
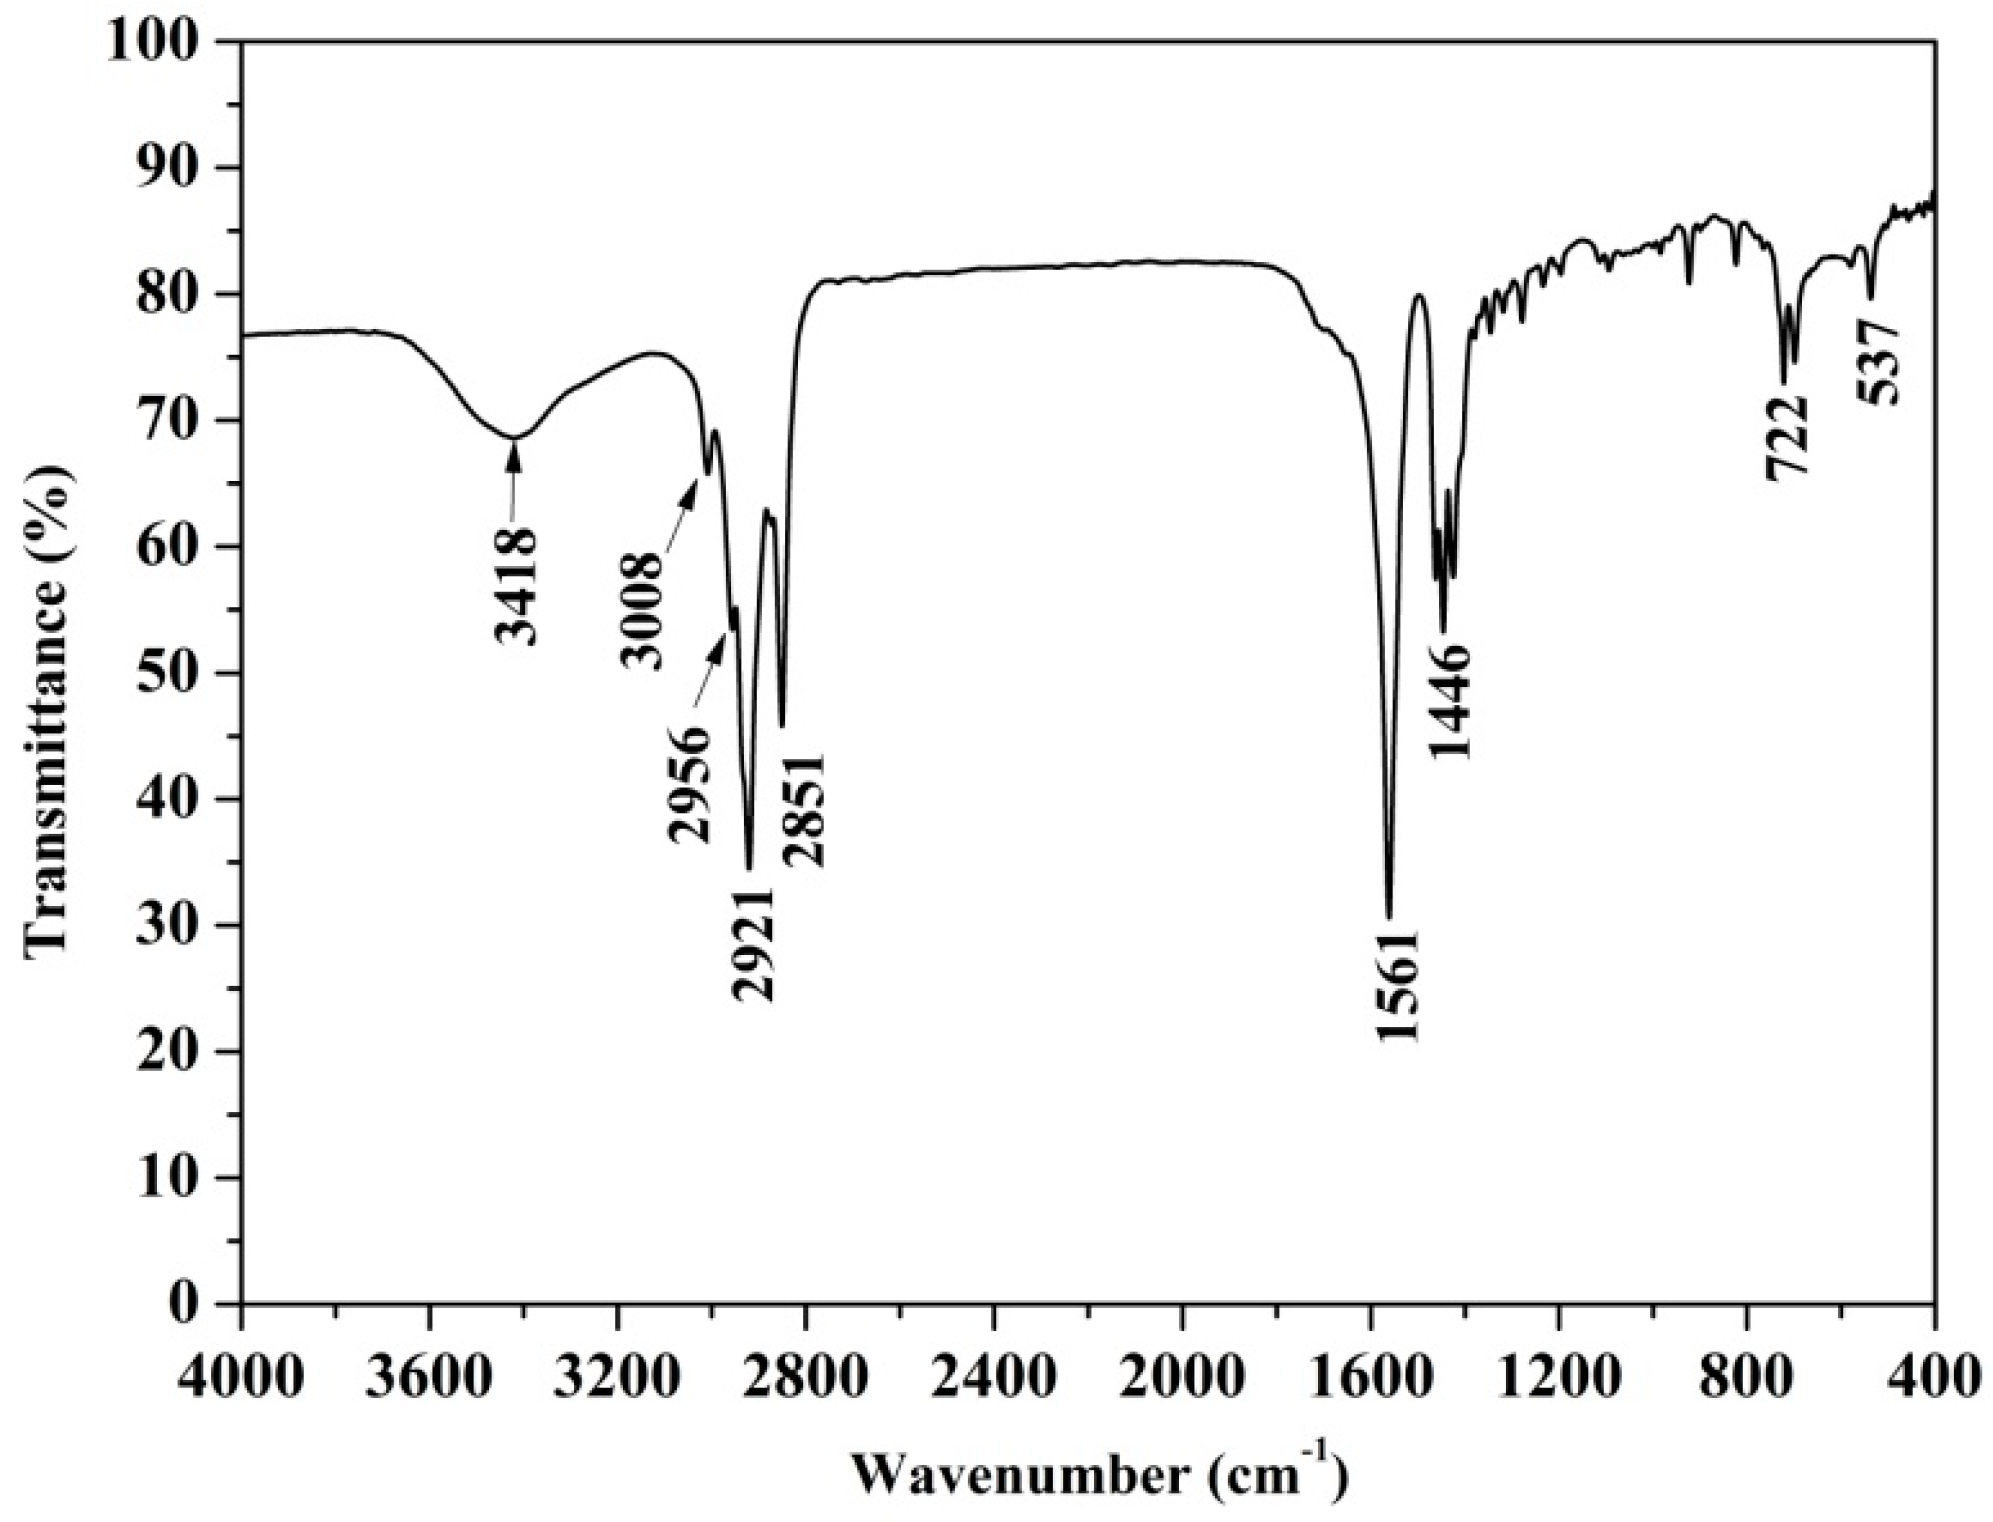
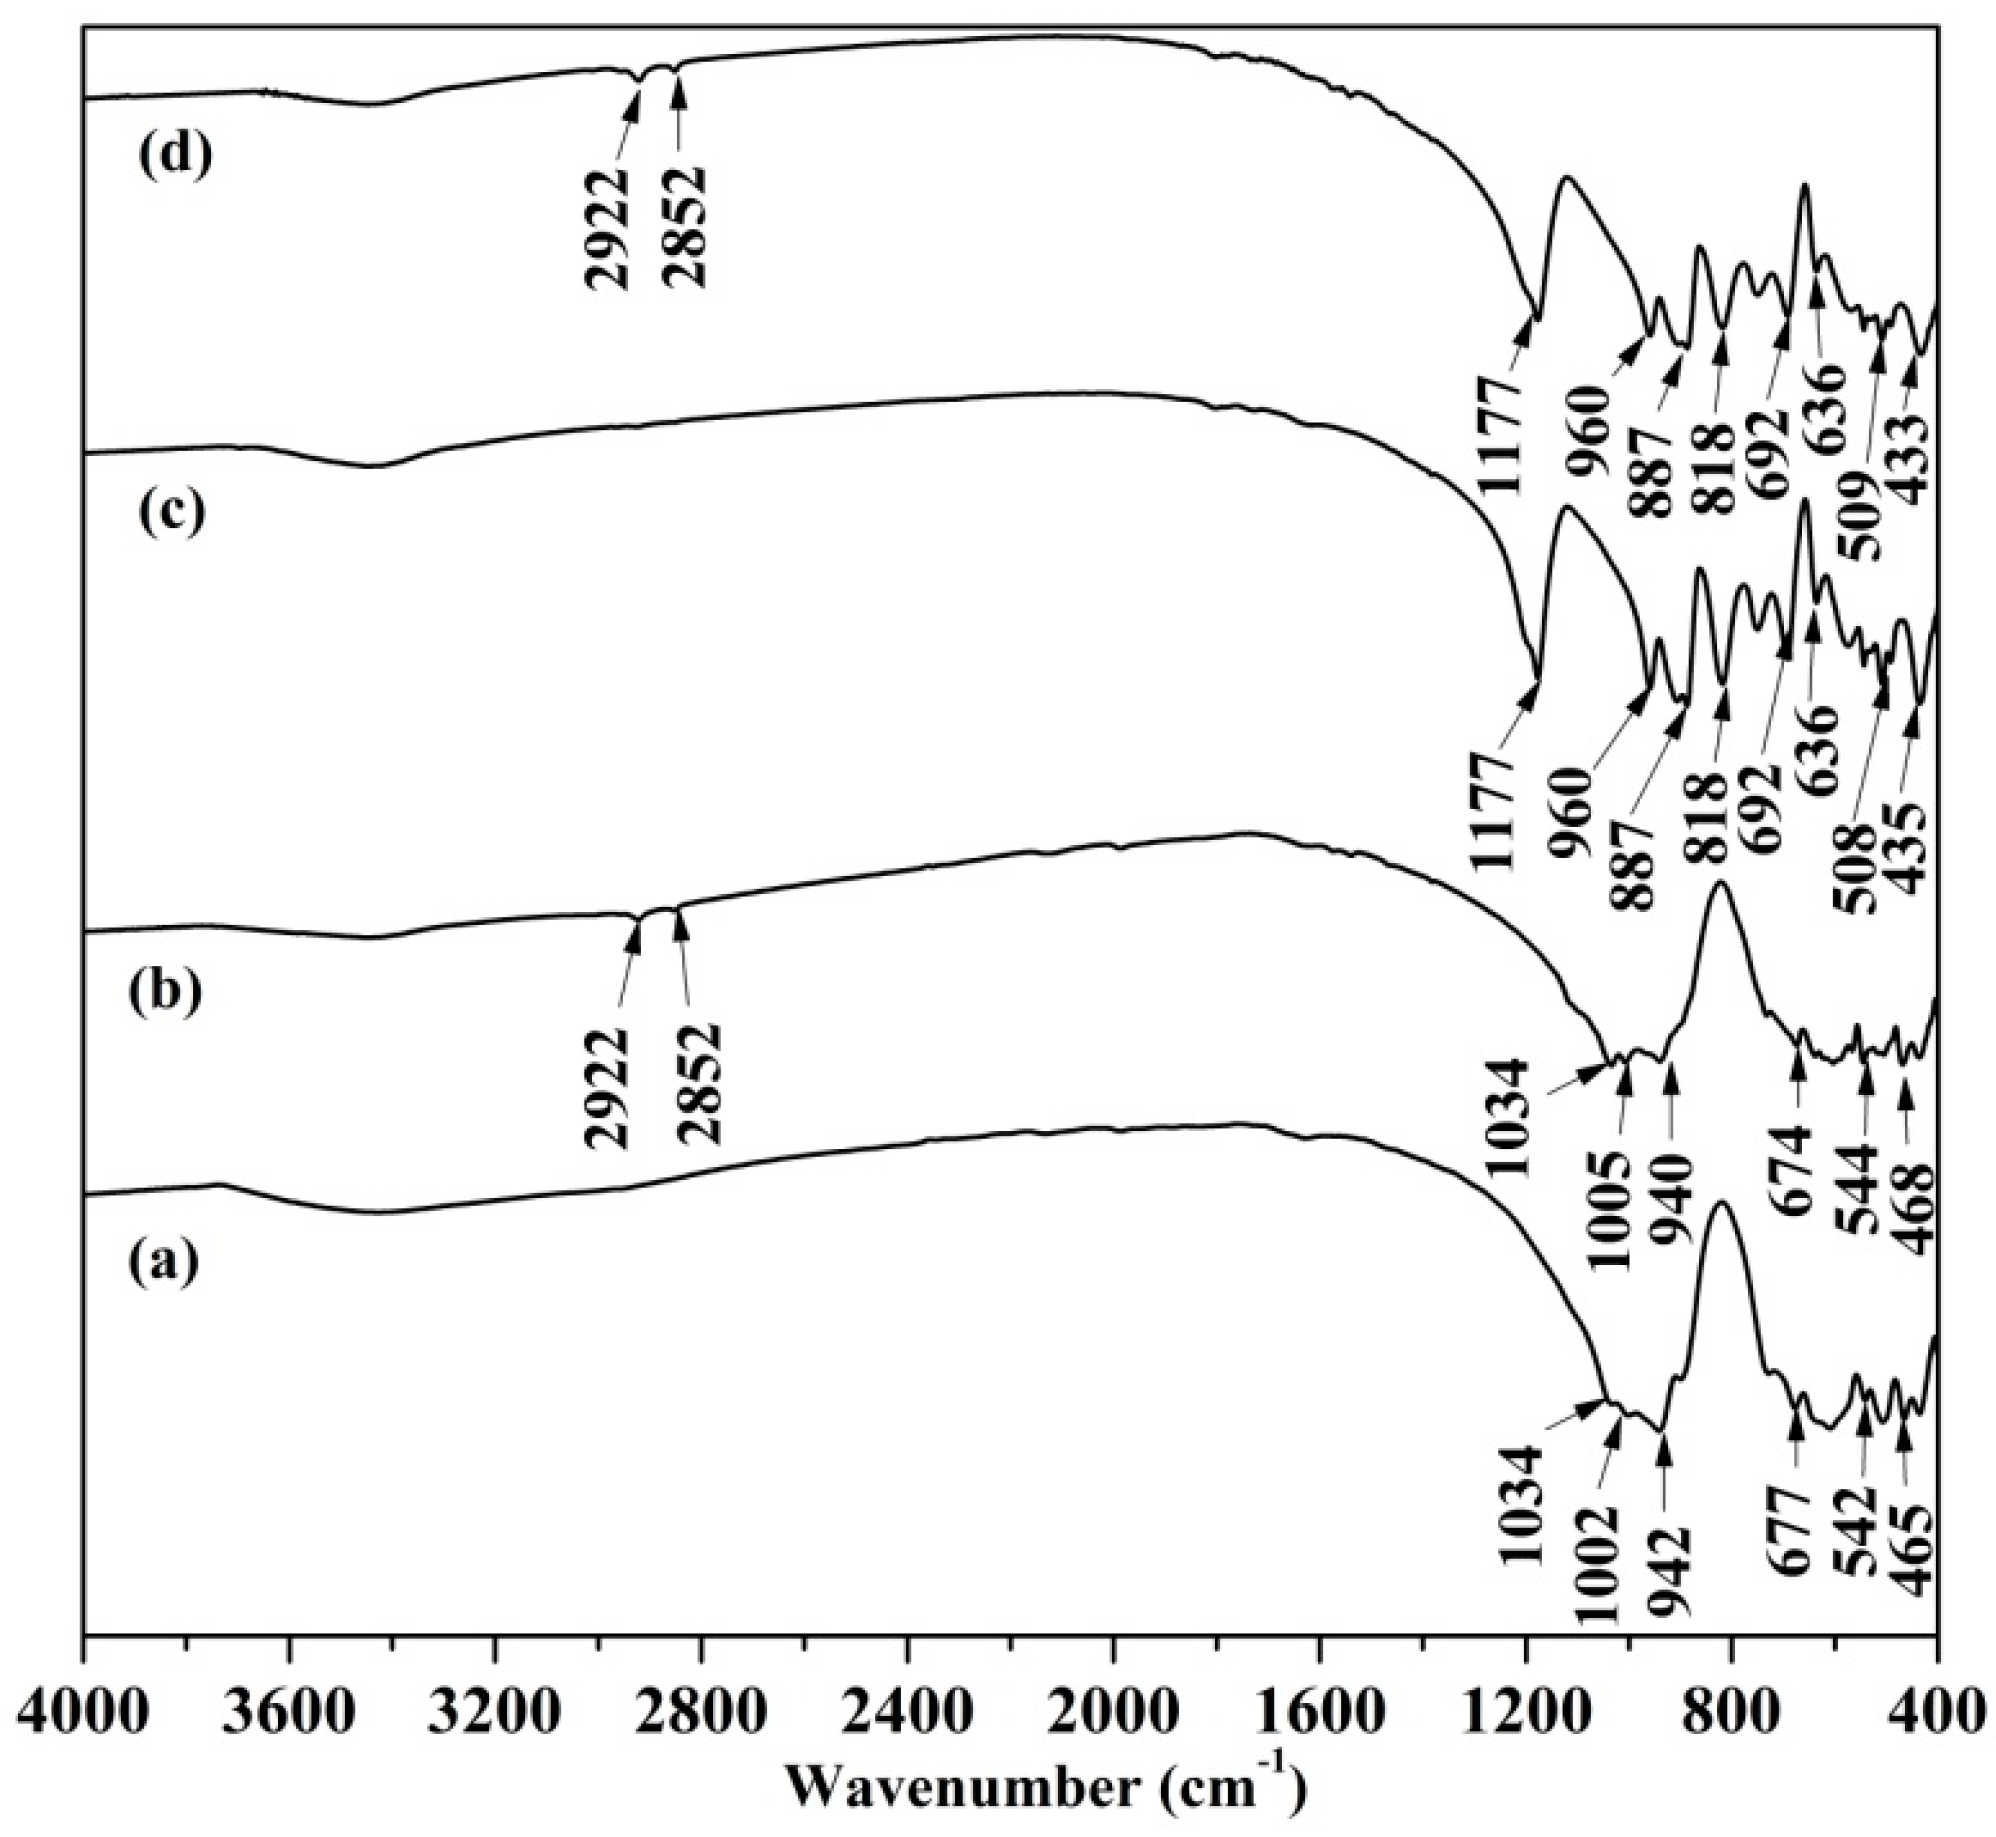
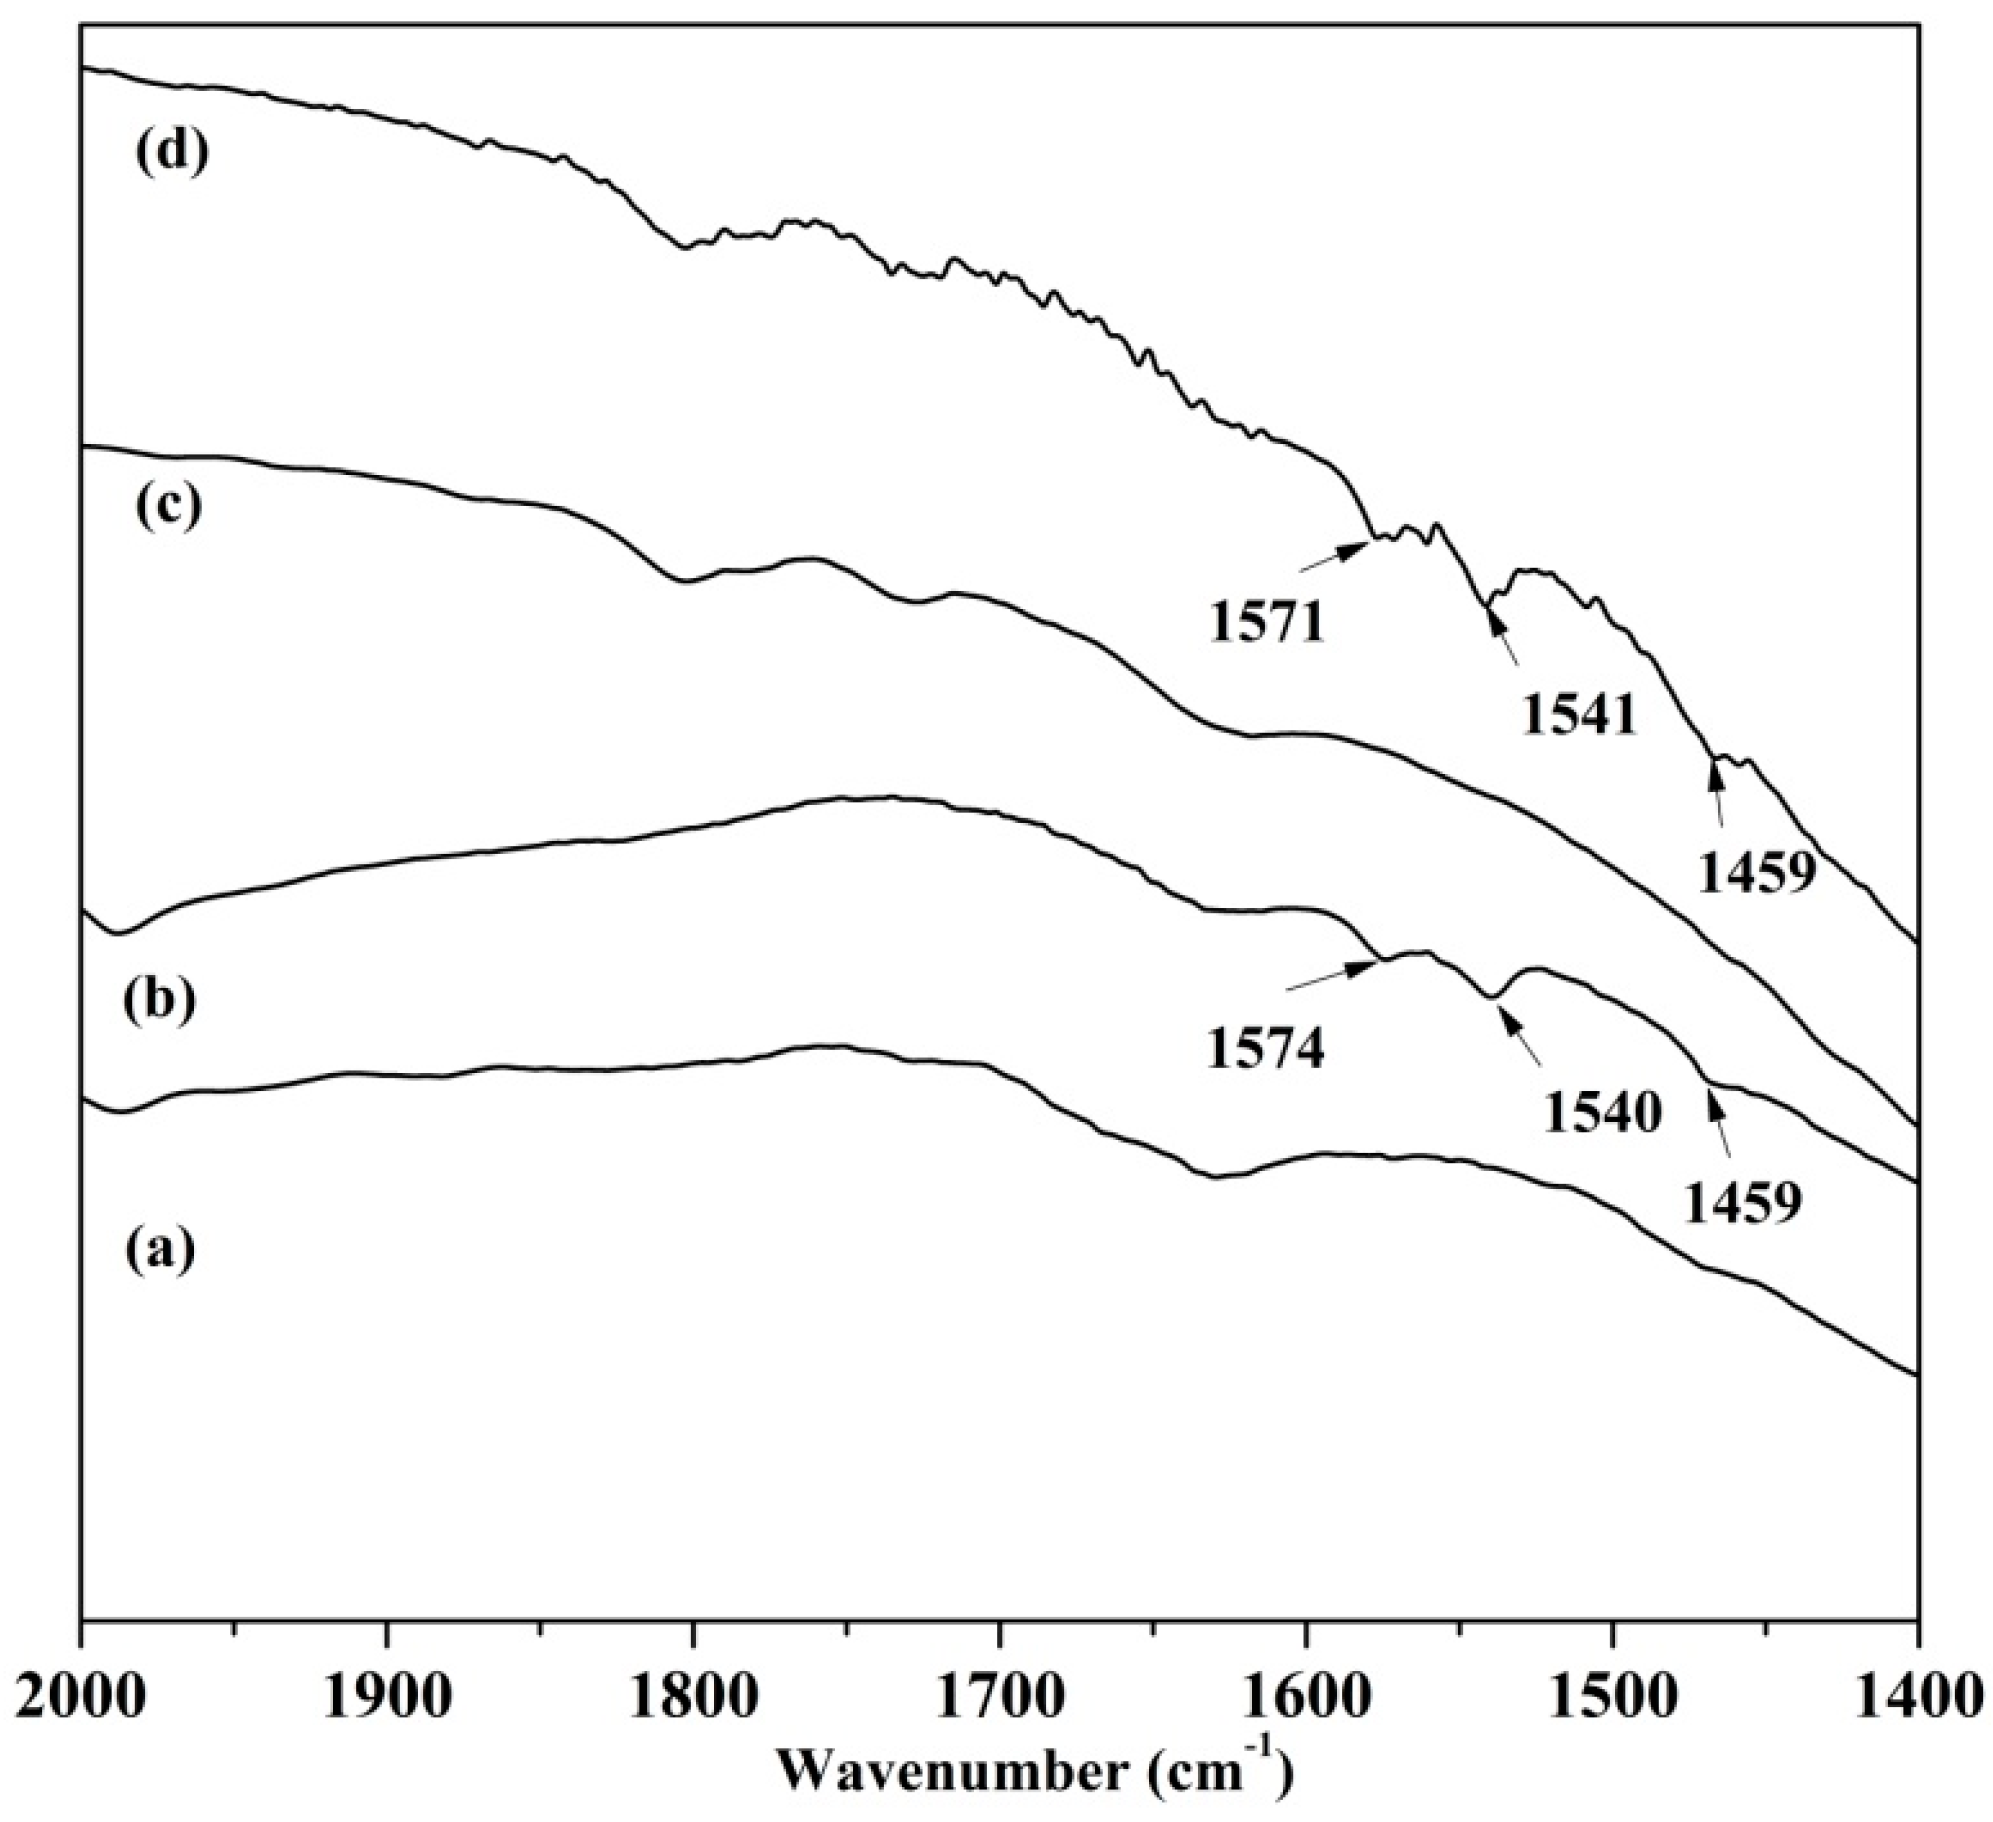
Sodium oleate (NaOL) is an alkali salt, and strong hydrolysis reaction occurs in aqueous solution. It is known that sodium oleate forms various species, such as oleic acid HOL, oleate ion OL, oleate dimer (OL)22− and the ionic–molecular dimers H(OL)2. The following are the balanced equations and equilibrium constants of sodium oleate species [24].
HOL ( l ) HOL ( aq ) ,   S = 2.5 × 10 8
HOL ( aq ) OL + H + ,   K a = [ H + ] [ OL ] [ HOL aq ] = 1.1 × 10 5
2 OL ( OL ) 2 2 ,   K d = [ ( OL ) 2 2 ] [ OL ] 2 = 1.0 × 10 4
HOL ( aq ) + OL H ( OL ) 2 ,   K i m = [ H ( OL ) 2 ] [ HOL aq ] [ OL ] = 5 × 10 4
Based on Equations (1) to (4), the logarithmic concentration of the hydrolysis species of sodium oleate at an initial concentration of 8.0 × 10⁻⁴ mol·L−1 was calculated and plotted in Figure 4. Figure 4 shows that the main species in the solution are mainly the form of the oleic acid molecule in the acidic range and of the oleic acid ion in the alkaline range. A large number of the ionic–molecular dimers exist in the weak alkaline range of pH. The concentration of the ionic–molecular dimers reached maxima at the pH range of 8.0 to 9.0, which was most identical to the optimum pH range of the high flotation recovery. With the pH value varying from the weak alkaline condition to the acidic or strong basic condition, the concentration of ionic–molecular dimers formed in solution decreases gradually, and the flotation recovery of minerals also declines correspondingly. It is reasonable to conclude that the ionic–molecular dimers are the main component resulting in the flotation of kyanite and sillimanite.

3.3. FTIR Analysis

To understand the interaction of sodium oleate with kyanite and sillimanite, FTIR was employed to measure the adsorption of sodium oleate on mineral surfaces. Figure 5 shows the infrared spectra of sodium oleate. The sodium oleate spectra show broad bands at 1561 and 1446 cm−1 attributed to the asymmetric and symmetric stretching vibrations of the COO group in sodium oleate [25]. The band at 3008 cm−1 is characteristic of the =C–H stretching vibration. The 2956 cm−1 band is due to the –CH3 asymmetric stretching vibration. The bands at 2851 and 2921 cm−1 are from the –CH2– asymmetric and symmetric stretching vibration. The 722 cm−1 band is attributed to the –(CH2)n– deformation [26]. The band at 3418 cm−1 is characteristic of the O–H stretching vibration of the acid, which is known to be in dimeric form due to hydrogen bonding [27].
The FTIR spectra and enlarged spectra of kyanite and sillimanite in the absence and presence of sodium oleate are shown in Figure 6 and Figure 7, respectively. The FTIR spectra of kyanite show the strong bands at 400 to 750 cm−1 attributed to the deformation vibration of Si–O tetrahedron and the vibration of the Al–O octahedron. The bands at 900 to 1100 cm−1 are due to the asymmetric stretching vibration of the Si–O tetrahedron. In addition, the strong bands at 1000 to 1200 cm−1, 750 to 800 cm−1, 450 to 530 cm−1 and 360 to 400 cm−1 are all from the vibration of the Si–O tetrahedron [28].
The FTIR spectra of sillimanite show that the bands at 1177 and 960 cm−1 are due to the asymmetric stretching vibration of the Si–O tetrahedron. The bands at 887 and 818 cm−1 are due to the bending and stretching vibration of the Si–O tetrahedron. In addition, the bands at 692, 636 and 435 cm−1 are all from the vibration of the Al–O octahedra [28,29]. The band at 508 cm−1 is due to the vibration of the Al–O tetrahedron [29].
The FTIR spectra of kyanite and sillimanite after being treated by sodium oleate show two characteristic peaks of sodium oleate at 2922 and 2852 cm−1 that were previously attributed to the stretching vibration of –CH2. This indicates the adsorption of sodium oleate on both minerals. The enlarged spectra of kyanite and sillimanite conditioned with sodium oleate show the new band at 1459 cm−1 previously attributed to symmetric stretching vibration of the carboxylate ion. The band at 1446 cm−1 shifted to a higher wave number by 13 cm−1 compared to that in the FTIR spectrum of sodium oleate (Figure 5). The result indicates that sodium oleate reacted on kyanite and sillimanite surfaces. In addition, the spectrum of kyanite after being treated by sodium oleate shows the doublet peaks at 1574 and 1540 cm−1. The similar doublet peaks at 1571 and 1541 cm−1 are also observed on the spectra of sillimanite conditioned with sodium oleate. It has been well established that the doublet peaks arise from the asymmetric carboxylate stretching vibration, whereas for sodium oleate, this vibration corresponds to a single peak at about 1561 cm−1 [30]. Therefore, the doublet peaks are assigned to the asymmetric carboxylate vibration in chemisorbed oleate on both minerals. This proves that the adsorption of the ionic–molecular dimers on the surfaces of both minerals is mainly a chemical interaction.

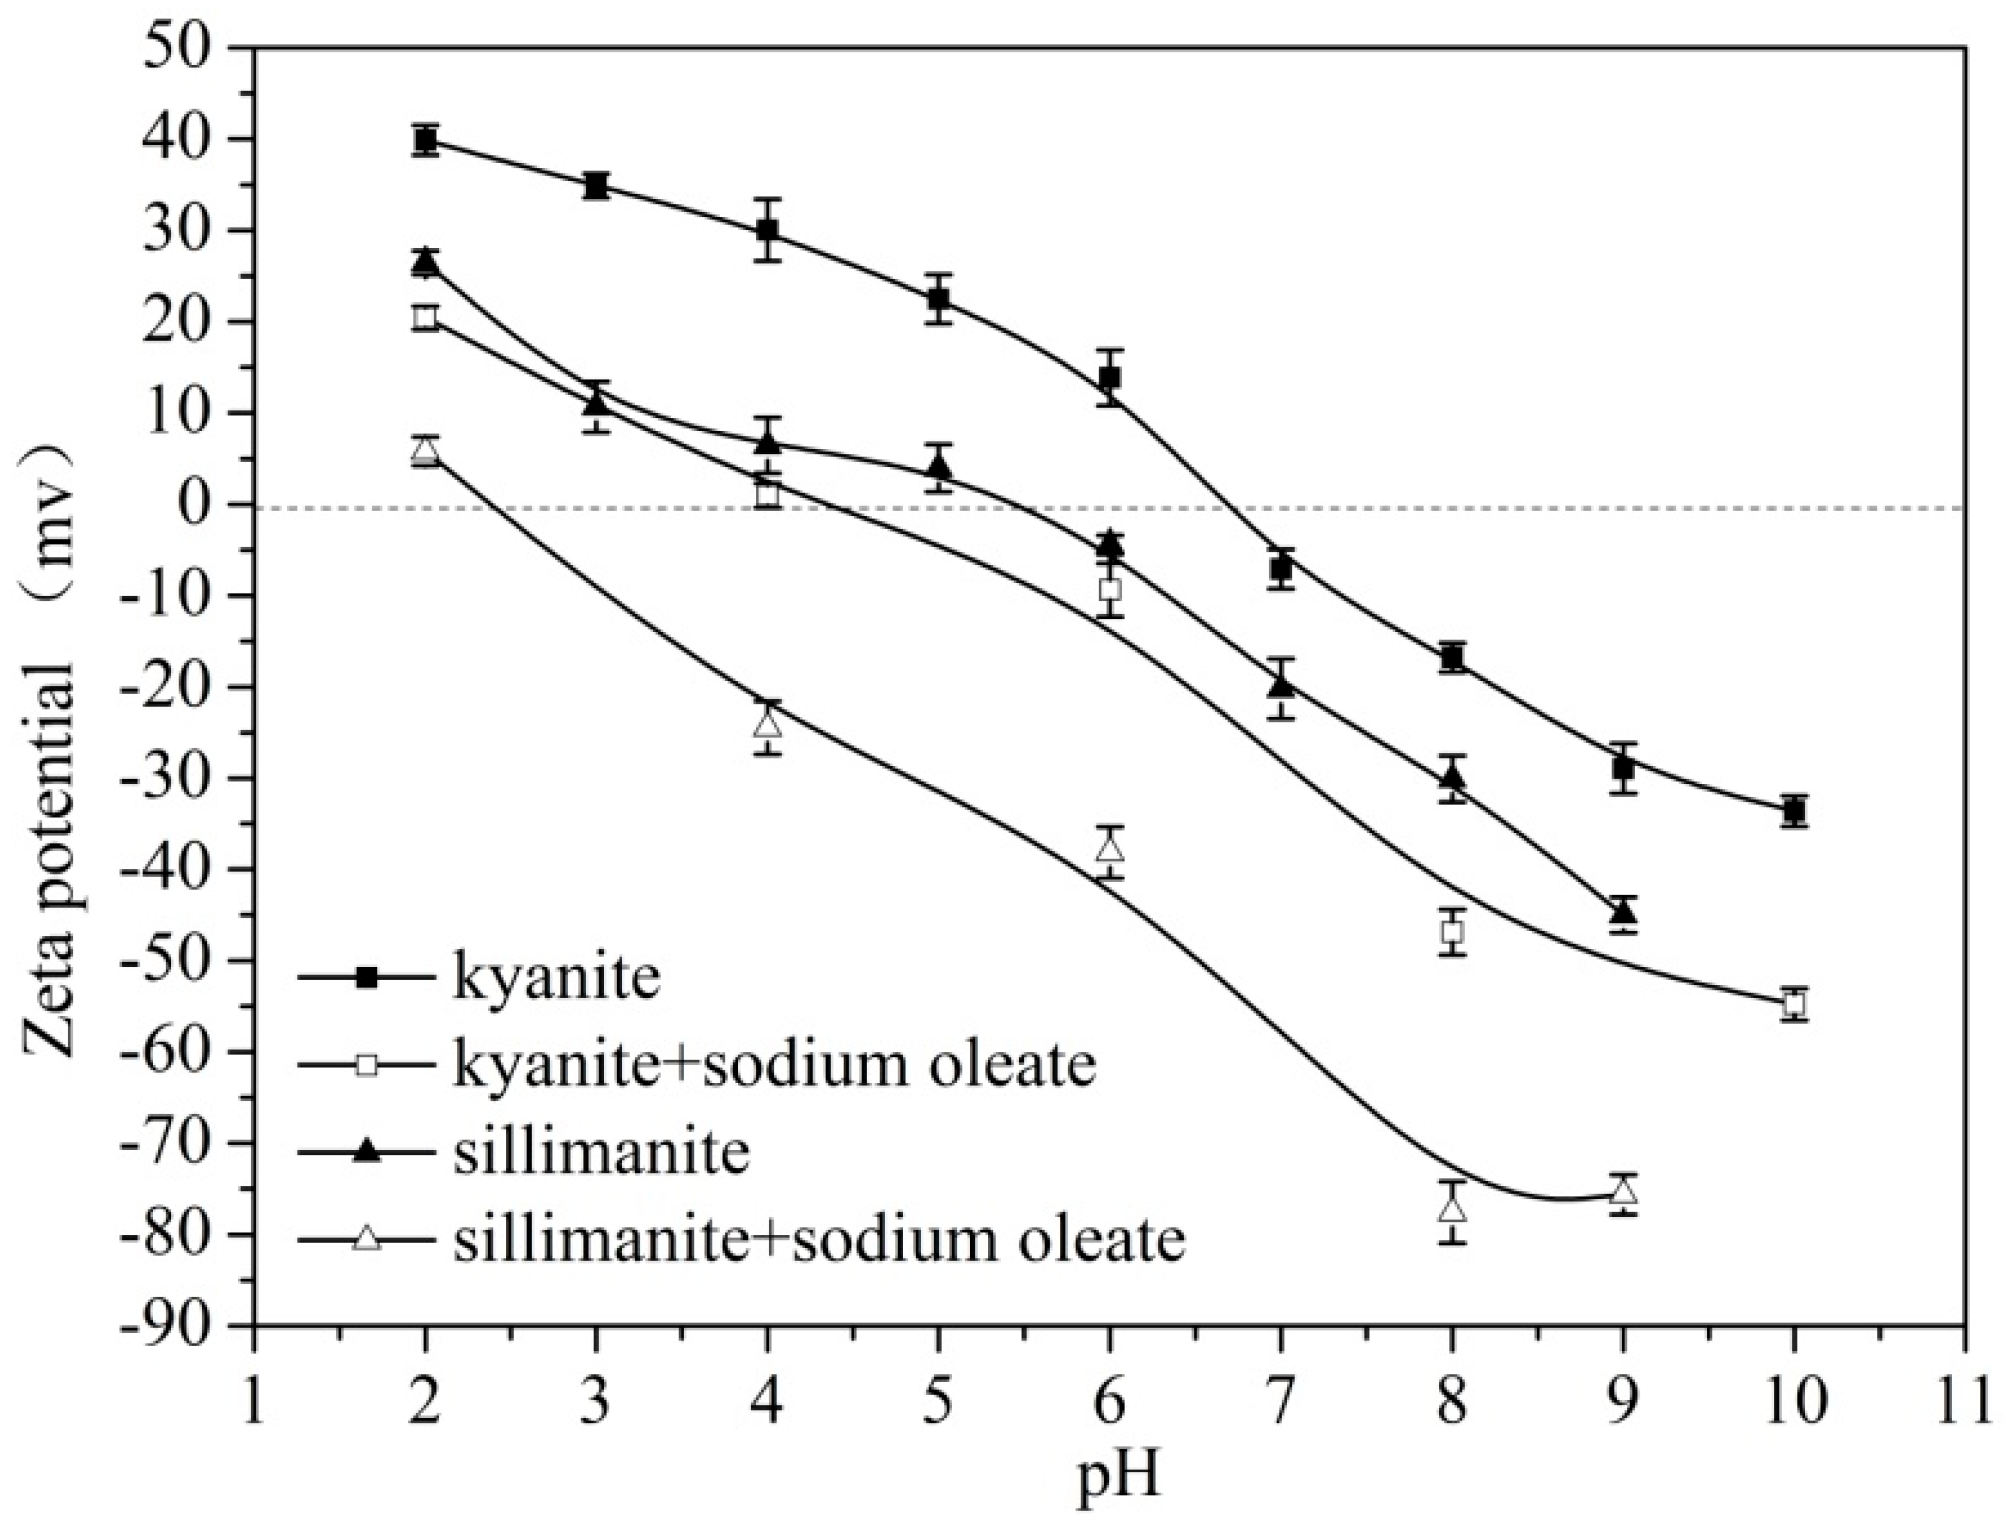
3.4. Zeta Potential Analysis
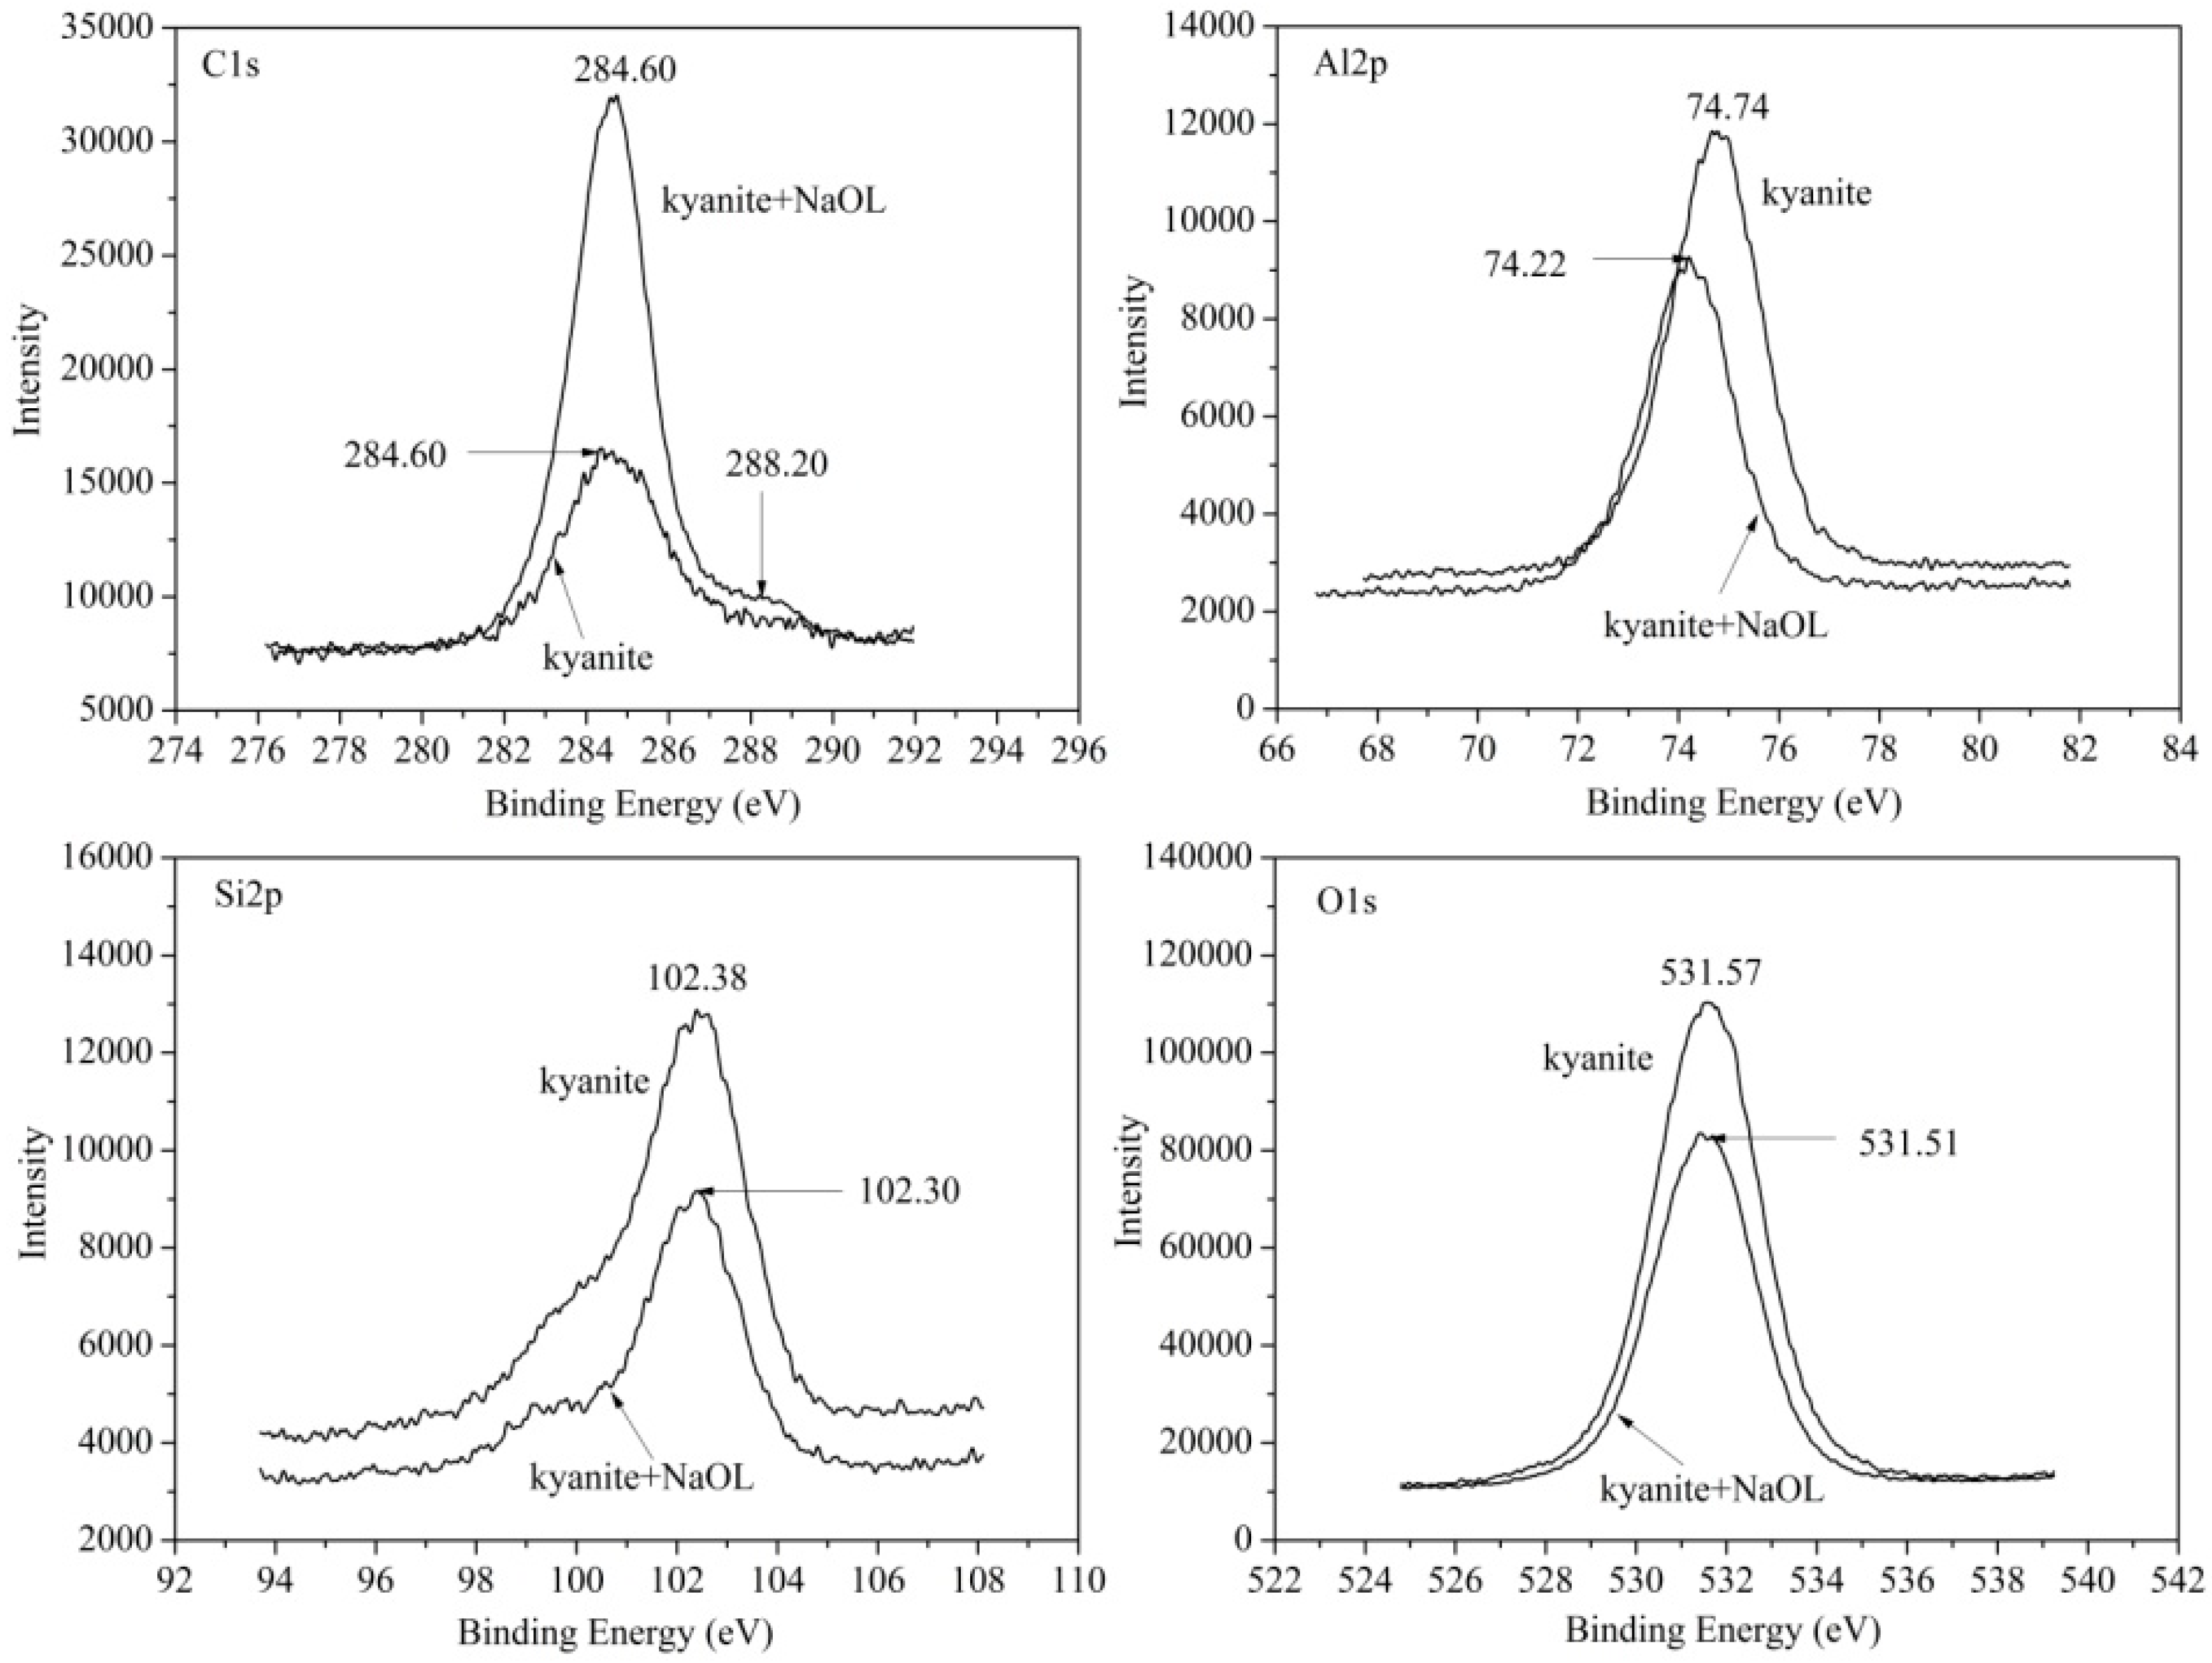
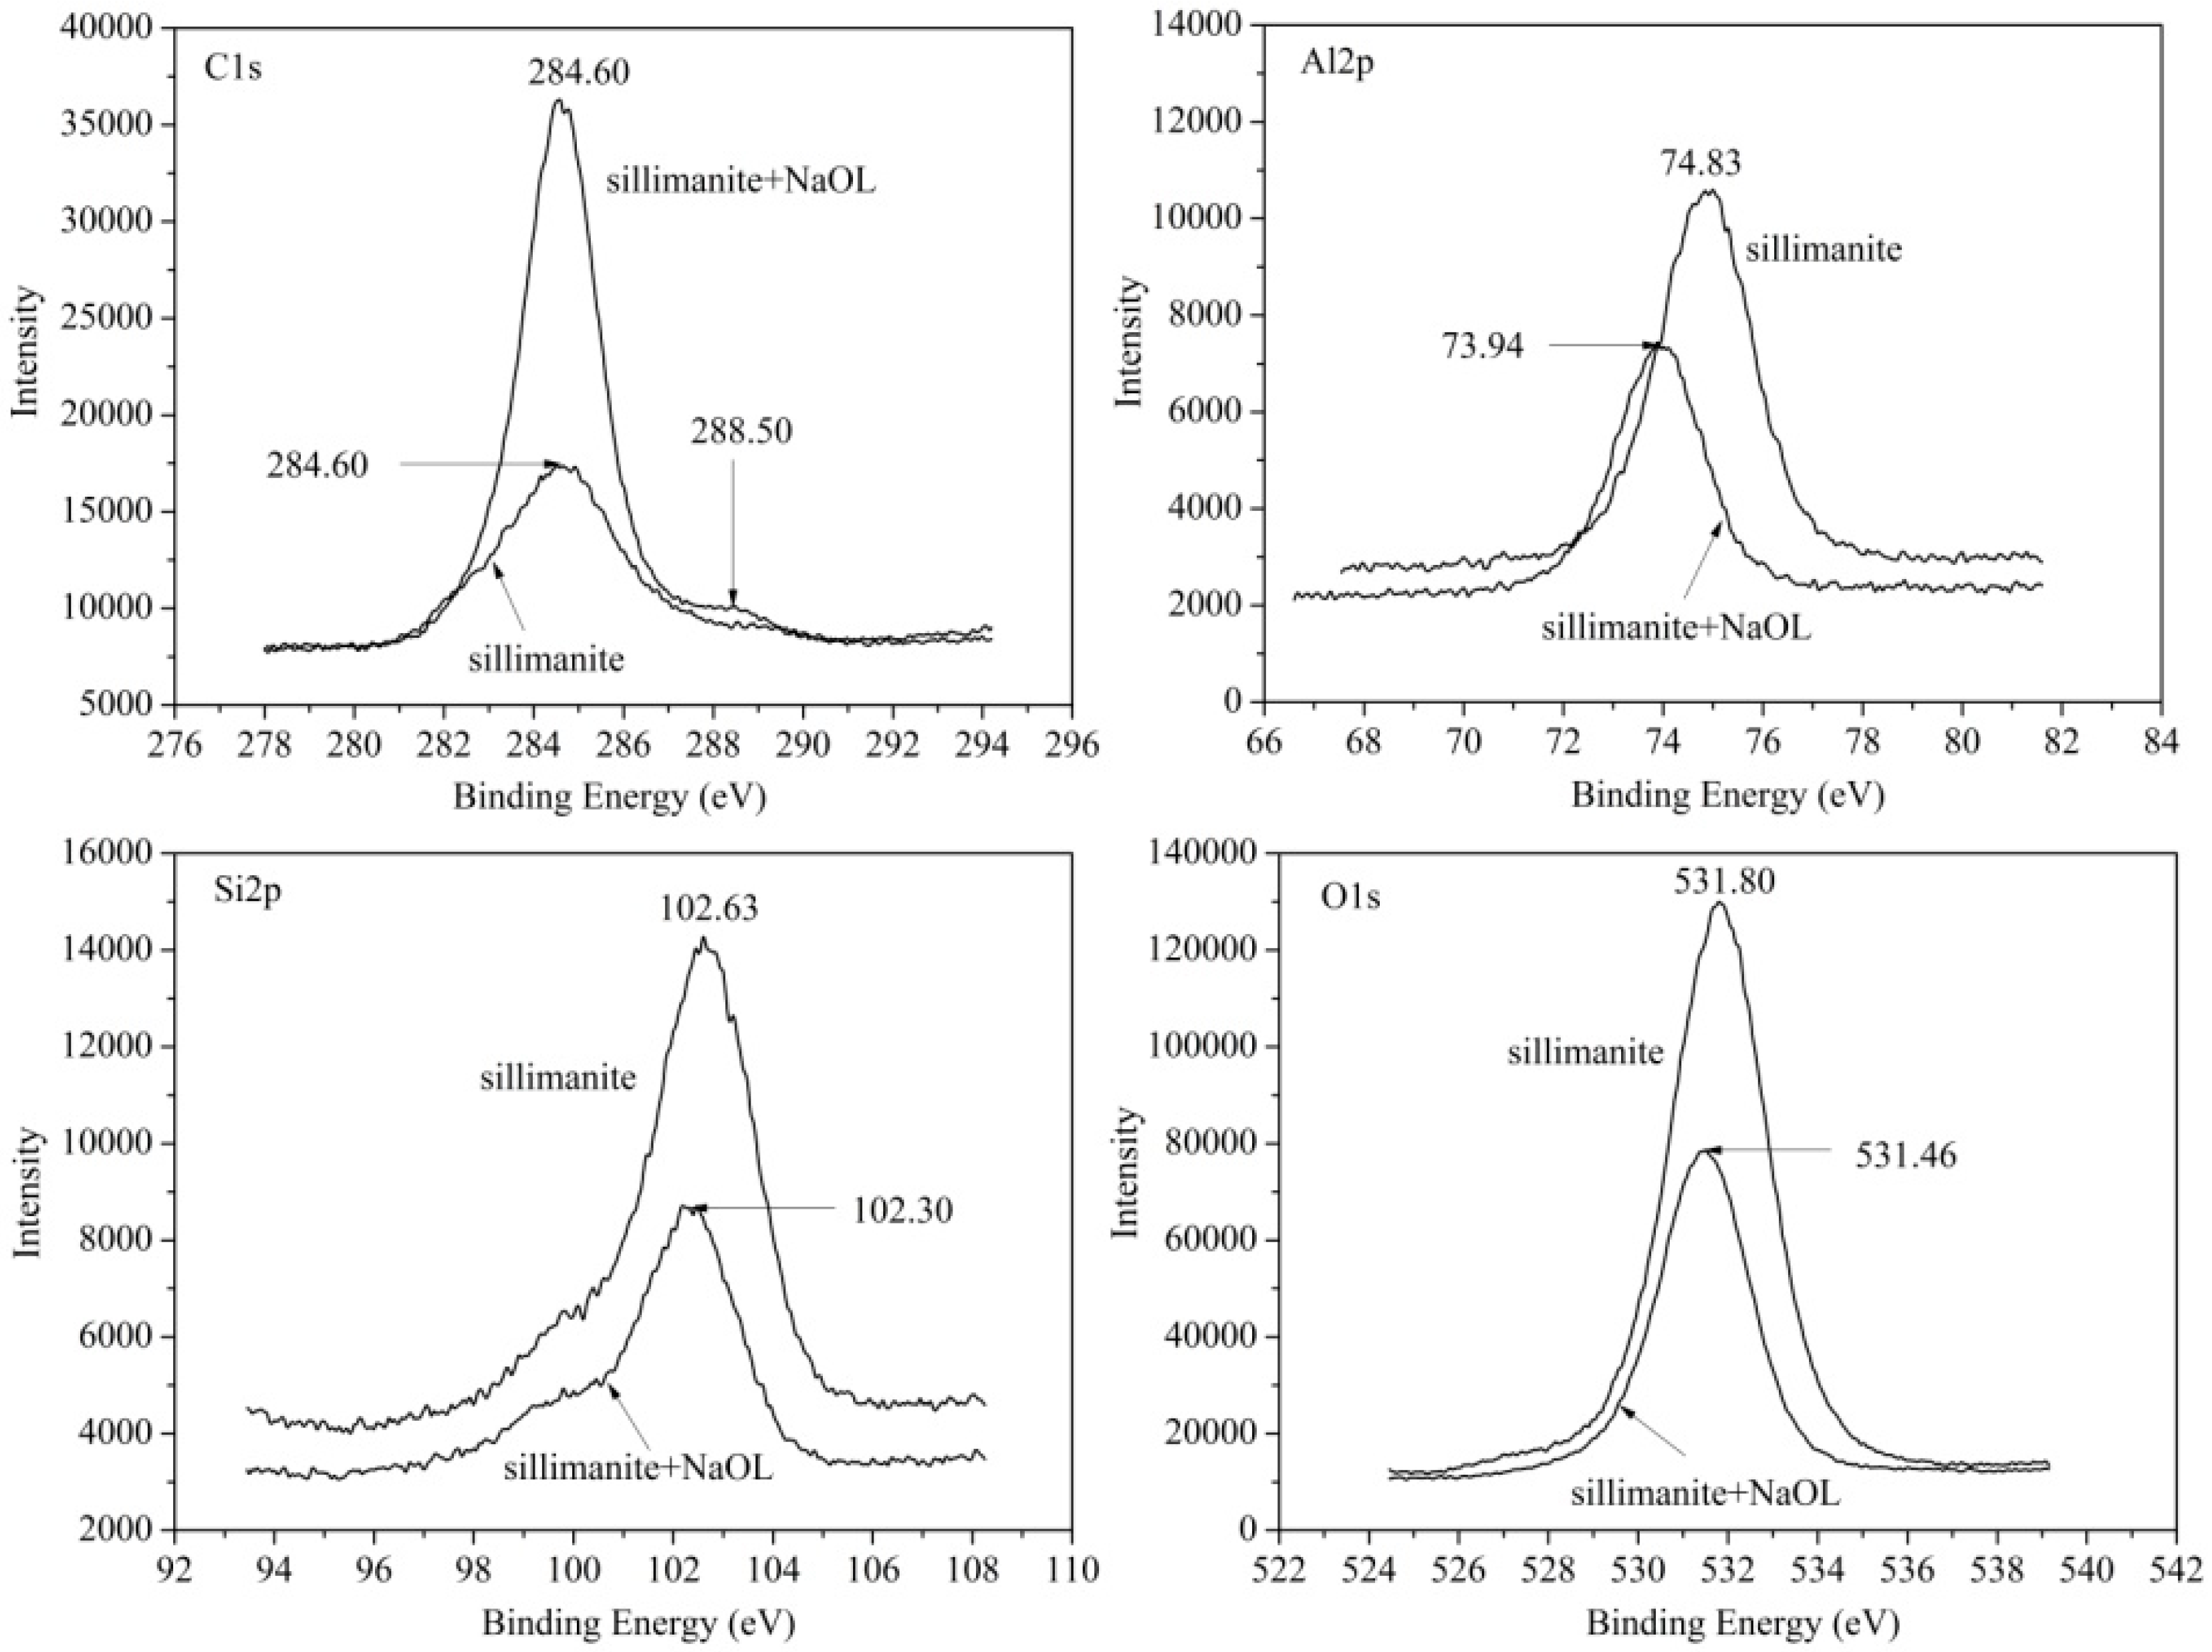
To better understand the adsorption of sodium oleate on kyanite and sillimanite, the electrokinetic phenomenon of mineral suspensions was investigated. Figure 8 shows the zeta potential of kyanite and sillimanite in the absence and presence of sodium oleate (8.0 × 10⁻⁴ mol·L−1) as a function of pH. Kyanite and sillimanite exhibited an iso-electric point (IEP) at pH 6.6 and pH 5.5, respectively. These values are in agreement with those reported in the literature [21,31]. They were positively charged at pH smaller than their IEP values, but negatively charged at pH greater than their IEP values. With an increase in pH, they became more negatively charged. After being treated by sodium oleate, the zeta potential of kyanite and sillimanite was shifted downwards. This indicates that the negatively-charged hydrolysate of sodium oleate adsorbed on their surfaces and made them more negatively charged.
Figure 8 also shows that the decrease in the zeta potential of sillimanite is greater than that for kyanite after the addition of sodium oleate. The result indicates that the adsorption of sodium oleate on the sillimanite surface is greater than that on the surface of kyanite. Therefore, the interaction between sodium oleate and sillimanite is stronger than that between the sodium oleate and kyanite. The result is consistent with the floatability of kyanite and sillimanite shown in Figure 2 and Figure 3.

3.5. XPS Analysis

Kyanite and sillimanite share the same chemical composition, but have different crystal structures. Crystal structures of silicate minerals not only have a direct effect on the properties of the mineral surfaces, but also influence the interaction with collectors and, therefore, play an important role in mineral flotation. XPS is a surface-sensitive technique and has been widely used to analyze the mineral surface properties [32,33,34]. In this study, XPS was used to investigate the surface species on the two minerals and also the interaction of mineral surfaces with sodium oleate.

3.5.1. Surface Species of Kyanite and Sillimanite

Table 2 shows the atomic concentration of oxygen, aluminum and silicon on the surfaces of kyanite and sillimanite. The XPS-measured atomic concentration was normalized to oxygen, aluminum and silicon. The component removed from the elemental accounting by this normalization process was C in the form of adventitious hydrocarbons.
As shown in Table 2, the aluminum concentration was 21.66 at% on the kyanite surface and 18.66 at% on the sillimanite surface, respectively. There was 16 at% more aluminum concentration detected on the kyanite surface. The elemental composition on the kyanite surface was Al0.358Si0.296O. Compared with the bulk stoichiometry of kyanite (Al0.484Si0.137O) based on the chemical composition in Table 1, the surface deviated from the bulk by Al −25.92 at% and Si 115.17 at% with O being a reference. The elemental composition on the sillimanite surface was Al0.302Si0.315O. Compared with the bulk stoichiometry of sillimanite (Al0.469Si0.148O) based on the chemical composition in Table 1, the sillimanite surface deviated from the bulk by Al −35.70 at% and Si 112.82 at% with O being a reference. In contrast, the difference of silicon concentrations between the surface and the bulk is similar for both minerals. However, the difference of aluminum concentrations between the surface and the bulk is larger for sillimanite, while smaller for kyanite.
The iso-electric point of alumina occurs at pH 9.0, whereas that of silica occurs somewhere around pH 2 to 3 [35,36]. Therefore, the Al–O sites tend to be basic, which tend to be proton acceptors, and Si–O sites tend to be acidic. Since kyanite and sillimanite are composed of a mixture of Al–O bonds and Si–O bonds, the surface electrostatic properties of them may be considered to be determined by the Al-to-Si ratio in the surface region. As shown in Table 2, the Al-to-Si ratio on the surface of kyanite and sillimanite is 1.21 and 0.96, respectively. Therefore, it is anticipated that the IEP value of kyanite should be higher than that of sillimanite. The results are consistent with the zeta potential results, which show that kyanite and sillimanite exhibit an iso-electric point at pH 6.6 and pH 5.5, respectively.

3.5.2. Sodium Oleate Adsorption on Mineral Surfaces

XPS analyses were outperformed to further confirm that sodium oleate mainly interacts with kyanite and sillimanite. XPS high-resolution spectra of C1s, Al2p, Si2p and O1s were measured for kyanite and sillimanite in the absence and presence of sodium oleate, shown in Figure 9 and Figure 10, respectively. Based on the data in the literature, the binding energy of C1s, Al2p, Si2p and O1s is normally assigned at about 285, 74, 102 and 531 eV, respectively [37,38].
The C1s spectra of kyanite and sillimanite have a noticeable peak at 288 to 289 eV at the higher binding energy sides of the main peaks in the presence of sodium oleate, which are not observed in the C1s spectrum of both minerals in the absence of sodium oleate. The component in the regions at 288 to 289 eV of the C1s spectra of kyanite and sillimanite treated by sodium oleate is assigned to carboxyl or carbonyl groups, respectively, by reference to the reported C1s chemical shift data in various organic compounds [39], which indicates that sodium oleate adsorbed on the surfaces of kyanite and sillimanite. In addition, a clear shift of the Al2p binding energy was observed after sodium oleate conditioning, and the shifts on kyanite and sillimanite were 0.52 and 0.89 eV, respectively. The chemical shifts of other elements were less than 0.35 eV. Such great changes in the binding energy of Al2p reveal that chemical interaction has arisen between the ionic–molecular dimers and aluminum atoms on the surfaces of the two minerals, which is consistent with FTIR analysis. In fact, the oxygen atoms in the ionic–molecular dimers have high negative net charge and easily donate electrons [40]. Therefore, the oxygen atoms in the ionic–molecular dimers coordinate to the aluminum atoms on the surfaces of the two minerals by chemical interaction.
Table 3 summarizes the binding energy of each detected element and the atomic concentrations, which were normalized to oxygen, aluminum, silicon and carbon. Again, in the absence of sodium oleate, the element of C1s originated from environmental contamination, but in the presence of sodium oleate, it originated from both environmental contamination and adsorbed sodium oleate.
Although kyanite and sillimanite were conditioned with the same dosage of sodium oleate, the changes of surface element concentrations were different. The decrement of aluminum concentrations on the surfaces of kyanite and sillimanite was 4.0% and 5.12%, respectively. The bigger change of aluminum concentration on the sillimanite surface suggests the higher collector adsorption, which is consistent with zeta potential analysis and the higher flotation recovery shown in Figure 2 and Figure 3. In contrast, the change of aluminum concentration on the kyanite surface was smaller, which correlates well with the lower flotation recovery under the same flotation condition.
The differences of aluminum coordination lead to the different electrostatic charge densities of aluminum atoms in kyanite and sillimanite. The aluminum atoms in six-fold coordination in both minerals have the highest electrostatic charge densities and are the most positive sites [41]. Therefore, priority is given to the reaction with the aluminum atoms in six-fold coordination when the sodium oleate adsorbs on the surfaces of kyanite and sillimanite. The different electrostatic charge densities of the aluminum atoms in six-fold coordination may determine the affinity of sodium oleate. The oxygen atoms in the ionic–molecular dimers have high negative net charge, and it should be easier to adsorb onto the mineral with the higher electrostatic charge densities of the aluminum atoms in six-fold coordination. It is found that the electrostatic charge densities of the aluminum atoms in six-fold coordination in sillimanite are higher than in kyanite by quantum chemical calculations [41]. As a result, the adsorption of collector sodium oleate is easier on the sillimanite surface, while more difficult on the kyanite surface. The results are consistent with zeta potential analysis, which shows that sillimanite has a higher collector adsorption, while kyanite has a lower collector adsorption under the same collector concentration and flotation conditions.

4. Conclusions

Kyanite and sillimanite show different flotation behaviors due to their different crystal structures. Sillimanite presents a higher flotation recovery, while kyanite presents a lower flotation recovery in the presence of collector sodium oleate. The flotation recovery of the two minerals increases with pH, reaches maxima at the pH range of 8.0 to 9.0 and then starts to decrease.
Kyanite and sillimanite exhibit an iso-electric point at pH 6.6 and pH 5.5, respectively. The IEP value of kyanite is higher due to the higher Al-to-Si ratio of the surface. The ionic–molecular dimers of sodium oleate are the main component resulting in the flotation of kyanite and sillimanite. Zeta potential analyses and XPS measurement confirm that the adsorption of sodium oleate on sillimanite is higher than that on kyanite.
At pH 8.0, sodium oleate adsorbs onto the surfaces of kyanite and sillimanite mainly through the chemical interaction of the ionic–molecular dimers with aluminum atoms. The higher sillimanite flotation recovery between both minerals is related to the higher electrostatic charge densities of the aluminum atoms in six-fold coordination and, therefore, the higher adsorption of the collector sodium oleate.

Acknowledgments

The authors gratefully acknowledge the financial support of this study from Wuhan University of Technology. Nanyang Kyanite Mining Limited is thanked for the supply of the mineral samples. The first author also thanks the scholarship provided by Wuhan University of Technology.

Author Contributions

Huimin Gao conceived and designed the experiments; the experiments, analysis of data and article writing were carried out by Junxun Jin, Zijie Ren and Zhijie Chen performed a part of experiments.

Conflicts of Interest

The authors declare no conflict of interest.

References

  1. Schmidt, M.W.; Poli, S.; Comodi, P.; Zanazzi, P.F. High pressure behavior of kyanite: Decomposition of kyanite into stishovite and corundum. Am. Mineral. 1997, 82, 460–466. [Google Scholar] [CrossRef]
  2. Harben, P.W. The Industrial Minerals Handbook; Warwick Printing: Warwick, UK, 1995. [Google Scholar]
  3. Aryal, S.; Rulis, P.; Ching, W.Y. Density functional calculation of the electronic structure and optical properties of aluminosilicate polymorphs (Al2SiO5). Am. Mineral. 2008, 93, 114–123. [Google Scholar] [CrossRef]
  4. Whitney, D.L. Coexisting andalusite, kyanite and sillimanite: Sequential formation of three Al2SiO5 polymorphs during progressive metamorphism near the triple point, Sivrihisar, Turkey. Am. Mineral. 2002, 87, 405–416. [Google Scholar] [CrossRef]
  5. Kerrick, D.M. The Al2SiO5 Polymorphs; The Mineralogical Society of America: Washington, D.C., USA, 1990. [Google Scholar]
  6. Klein, C.; Hurlbut, C.S.; Dana, J.D. Manual of Mineralogy, 20th ed.; Wiley: New York, NY, USA, 1993. [Google Scholar]
  7. Chinner, G.A. The significance of the aluminum silicates in metamorphism. Earth Sci. Rev. 1966, 2, 111–126. [Google Scholar] [CrossRef]
  8. Hietanen, A. Kyanite, andalusite, and sillimanite in the schist in Boehls Butte quadrangle, Idaho. Am. Mineral. 1956, 41, 1–27. [Google Scholar]
  9. Fuerstenau, M.C. Flotation: A.M. Gaudin Memorial Volume; American Institute of Mining, Metallurgical, and Petroleum Engineers: New York, NY, USA, 1976. [Google Scholar]
  10. White, A.J.R.; Compston, W.; Kleeman, A.W. The Palmer Granite—A study of a granite within a regional metamorphic environment. J. Petrol. 1967, 8, 29–50. [Google Scholar] [CrossRef]
  11. Yang, H.; Hazen, R.M.; Finger, L.W.; Prewitt, C.T.; Downs, R.T. Compressibility and crystal structure of sillimanite, Al2SiO5 at high pressure. Phys. Chem. Miner. 1997, 25, 39–47. [Google Scholar] [CrossRef]
  12. Yang, H.X.; Downs, R.T.; Finger, L.W.; Hazen, R.M.; Prewitt, C.T. Compressibility and crystal structure of kyanite, Al2SiO5, at high pressure. Am. Mineral. 1997, 82, 467–474. [Google Scholar] [CrossRef]
  13. Ohuchi, F.S.; Ghose, S.; Engelhard, M.H.; Baer, D.R. Chemical bonding and electronic structures of the Al2SiO5 polymorphs, andalusite, sillimanite, and kyanite: X-ray photoelectron- and electron energy loss spectroscopy studies. Am. Mineral. 2006, 91, 740–746. [Google Scholar] [CrossRef]
  14. Burnham, C.W. Refinement of the crystal structure of sillimanite. Z. Krist. Cryst. Mater. 1963, 118, 127–148. [Google Scholar] [CrossRef]
  15. McMichael, B. Aluminosilicate minerals. Refractories steel the Show. Ind. Miner. 1990, 277, 27–43. [Google Scholar]
  16. Skoog, A.J.; Moore, R.E. Refractory of the past for the future: Mullite and its use as a bonding phase. Am. Ceram. Soc. Bull. 1988, 67, 1180–1185. [Google Scholar]
  17. Guo, H.; Ye, F.B.; Li, W.F.; Song, X.Z.; Xie, G.F. Preparation and characterization of foamed microporous mullite ceramics based on kyanite. Ceram. Int. 2015, 41, 14645–14651. [Google Scholar] [CrossRef]
  18. Xu, L.F.; Xi, X.A.; Zhu, W.L.; Shui, A.Z.; Dai, W.B. Investigation on the influence factors for preparing mullite-whister-structured porous ceramic. J. Alloy. Compd. 2015, 649, 739–745. [Google Scholar] [CrossRef]
  19. Brandao, E.R.G.; Mendes, S.L.C. Kyanite from Minas Gerais, Brasil: Characterization for use inceramic. In Innovations in Mineral and Coal Processing, Proceedings of the 7th International Mineral Processing Symposium, Istanbul, Turkey, 15–17 September 1998.
  20. Zhou, L.C.; Zhang, Y.M. Flotation separation of Xixia andalusite ore. Trans. Nonferrous Met. Soc. China 2011, 21, 1388–1394. [Google Scholar] [CrossRef]
  21. Bulut, G.; Yurtsever, C. Flotation behavior of Bitlis kyanite ore. Int. J. Miner. Process. 2004, 73, 29–36. [Google Scholar] [CrossRef]
  22. Prabhakar, S.; Raju, G.B.; Rao, S.S. Beneficiation of sillimanite by column flotation—A pilot scale study. Int. J. Miner. Process. 2006, 81, 159–165. [Google Scholar] [CrossRef]
  23. Metson, J.B. Charge compensation and binding energy referencing in XPS analysis. Surf. Interface Anal. 1999, 27, 1069–1072. [Google Scholar] [CrossRef]
  24. Shibata, J.; Fuerstenau, D.W. Flocculation and flotation characteristics of fine hematite with sodium oleate. Int. J. Miner. Process. 2003, 72, 25–32. [Google Scholar] [CrossRef]
  25. Wen, X.T.; Yang, J.X.; He, B.; Gu, Z.W. Preparation of monodisperse magnetite nanoparticles under mild conditions. Curr. Appl. Phys. 2008, 8, 535–541. [Google Scholar] [CrossRef]
  26. Liu, W.J.; Zhang, J.; Wang, W.Q.; Deng, J.; Chen, B.Y.; Yan, W.; Xiong, S.Q.; Huang, Y.; Liu, J. Flotation behaviors of ilmenite, titanaugite, and forsterite using sodium oleate as the collector. Miner. Eng. 2015, 72, 1–9. [Google Scholar] [CrossRef]
  27. Roonasi, P.; Holmgren, A. A Fourier transform infrared (FTIR) and thermogravimetric analysis (TGA) study of oleate adsorbed on magnetite nano-particle surface. Appl. Surf. Sci. 2009, 255, 5891–5895. [Google Scholar] [CrossRef]
  28. Wen, L.; Liang, W.X.; Zhang, Z.G.; Huang, J.C. The Infrared Spectroscopy of Minerals; Chongqing University Press: Chongqing, China, 1989. (In Chinese) [Google Scholar]
  29. Salje, E.; Werneke, C. The phase equilibrium between sillimanite and andalusite as determined from lattice vibrations. Contrib. Miner. Petrol. 1982, 79, 56–67. [Google Scholar] [CrossRef]
  30. Lovell, V.M.; Goold, L.A.; Finkelstein, N.P. Infrared studies of the adsorption of oleate species on calcium fluoride. Int. J. Miner. Process. 1974, 1, 183–192. [Google Scholar] [CrossRef]
  31. Smolik, J.J.; Harman, E.; Fuerstenau, D.W. Surface characteristics and flotation of aluminosilicate. Trans. AIME 1966, 235, 367–375. [Google Scholar]
  32. Chen, X.M.; Peng, Y.J.; Bradshaw, D. The effect of particle breakage mechanisms during regrinding on the subsequent cleaner flotation. Miner. Eng. 2014, 66–68, 157–164. [Google Scholar] [CrossRef]
  33. Peng, Y.J.; Wang, B.; Gerson, A. The effect of electrochemical potential on the activation of pyrite by copper and lead ions during grinding. Int. J. Miner. Process. 2012, 102–103, 141–149. [Google Scholar] [CrossRef]
  34. Wang, L.; Sun, W.; Hu, Y.H.; Xu, L.H. Adsorption mechanism of mixed anionic/cationic collectors in Muscovite–Quartz flotation system. Miner. Eng. 2014, 64, 44–50. [Google Scholar] [CrossRef]
  35. Onoda, G.Y.; Fuerstenau, D.W. Amine flotation of quartz in the presence of inorganic electrolytes. In Technical Papers 7th International Mineral Processing Congress; Gordon and Breach: New York, NY, USA, 1964; pp. 301–306. [Google Scholar]
  36. Robinson, M.; Pask, J.A.; Fuerstenau, D.W. Surface charge of alumina and magnesia in aqueous media. J. Am. Ceram. Soc. 1964, 47, 516–520. [Google Scholar] [CrossRef]
  37. Yumitori, S. Correlation of C1s chemical state intensities with the O1s intensity in the XPS analysis of anodically oxidized glass-like carbon samples. J. Mater. Sci. 2000, 35, 139–146. [Google Scholar] [CrossRef]
  38. Zhang, J.; Wang, W.Q.; Liu, J.; Huang, Y.; Feng, Q.M.; Zhao, H. Fe (III) as an activator for the flotation of spodumene, albite, and quartz minerals. Miner. Eng. 2014, 61, 16–22. [Google Scholar]
  39. Takahagi, T.; Ishitani, A. XPS studies by use of the digital difference spectrum technique of functional groups on the surface of carbon fiber. Carbon 1984, 22, 43–46. [Google Scholar] [CrossRef]
  40. Jiang, Y.R.; Li, W.; Feng, R. Preparation and performance of 4-alkyl-4,4-bis(hydroxycarbamoyl) carboxylic acid for flotation separation of diaspore against aluminosilicates. Miner. Eng. 2011, 24, 1571–1579. [Google Scholar] [CrossRef]
  41. Sun, C.Y.; Yin, W.Z. Flotation Principles of Silicate Minerals; Science Press: Beijing, China, 2001. (In Chinese) [Google Scholar]
Figure 1. The unit cell model of kyanite (a) and sillimanite (b). Atom color: pink = Al, red = O, yellow = Si.
Minerals 06 00090 g001
Figure 2. Flotation recovery of kyanite and sillimanite as a function of sodium oleate concentration at pH 8.0. Error bars represent mean values of three tests ± standard deviation.
Minerals 06 00090 g002
Figure 3. Flotation recovery of kyanite and sillimanite as a function of slurry pH at a sodium oleate concentration of 8.0 × 10⁻⁴ mol·L−1. Error bars represent mean values of three tests ± standard deviation.
Minerals 06 00090 g003
Figure 4. Logarithmic concentration of the hydrolysis species at an initial sodium oleate concentration of 8.0 × 10⁻⁴ mol·L−1.
Minerals 06 00090 g004
Figure 5. The infrared spectra of sodium oleate.
Minerals 06 00090 g005
Figure 6. The infrared spectra of kyanite (a), kyanite treated with sodium oleate (b), sillimanite (c) and sillimanite treated with sodium oleate (d).
Minerals 06 00090 g006
Figure 7. The enlarged spectra of kyanite (a), kyanite treated with sodium oleate (b), sillimanite (c) and sillimanite treated with sodium oleate (d).
Minerals 06 00090 g007
Figure 8. Zeta potentials of kyanite and sillimanite as a function of pH. Error bars represent mean values of three tests ± standard deviation.
Minerals 06 00090 g008
Figure 9. XPS high-resolution spectra of C1s, Al2p, Si2p and O1s on kyanite in the absence and presence of sodium oleate (NaOL).
Minerals 06 00090 g009
Figure 10. XPS high-resolution spectra of C1s, Al2p, Si2p and O1s on sillimanite in the absence and presence of sodium oleate (NaOL).
Minerals 06 00090 g010
Table 1. Chemical components of kyanite and sillimanite (%).
SampleAl2O3SiO2Fe2O3TiO2K2OCaOIgnition loss
Kyanite62.7635.650.15-0.020.081.04
Sillimanite60.5638.220.410.120.020.430.24
Table 2. XPS-derived surface concentrations (atomic% normalized to Al, O and Si) of kyanite and sillimanite.
SampleElementConcentration (at%)
KyaniteO60.47
Si17.87
Al21.66
SillimaniteO61.85
Si19.49
Al18.66
Table 3. XPS-derived surface concentrations (atomic % normalized to Al, O, Si and C) on kyanite and sillimanite at pH 8.0 in the absence and presence of sodium oleate (8.0 × 10⁻⁴ mol·L−1).
SampleConcentrations (at%)
C1sO1sSi2pAl2p
Kyanite15.2051.3515.1318.32
Kyanite + sodium oleate33.9638.5213.2014.32
Sillimanite15.2252.5216.4915.77
Sillimanite + sodium oleate39.2435.9314.1710.65

