Article

Microstructural Control on Perlite Expansibility and Geochemical Balance with a Novel Application of Isocon Analysis: An Example from Milos Island Perlite (Greece)

by
Basilios Tsikouras
1,2,*,
Kalliopi-Sofia Passa
2,
Ioannis Iliopoulos
2 and
Christos Katagas
2
1
Faculty of Science, Physical and Geological Sciences, Jalan Tungku Link, Universiti Brunei Darussalam, Gadong, BE1410 Bandar Seri Begawan, Brunei Darussalam
2
Department of Geology, Section of Earth Materials, University of Patras, 26500 Patras, Greece
*
Author to whom correspondence should be addressed.
Minerals 2016, 6(3), 80; https://doi.org/10.3390/min6030080
Submission received: 29 October 2015 / Revised: 26 July 2016 / Accepted: 26 July 2016 / Published: 2 August 2016

Abstract

:
Representative perlite bulk rock samples from two areas of Milos Island, Greece were collected and the expansion properties of their industrial product were investigated. Coarse crude perlite from Tsigrado exhibits better expansibility, which is assigned to the presence of coarser crystallites in its bulk parent rock. During thermal treatment, the finer crystallites of the coarse crude perlite from Trachilas are entrapped in the groundmass and lead to overheating, which inhibits expansion and eventually results in shrinkage. Geochemical modification of the expanded perlites relative to their crude precursors were investigated, using the isocon method. Volatilisation of crystalline water is the main factor controlling mass reduction of the expanded perlites. Other elements, during the adequate expansion of the Tsigrado perlite, can be classified into three categories. The elements that participate preferentially in crystals decrease in the expanded material at amounts higher than the total mass loss of the rock, due to their escape controlled mainly by the removal of the crystalline phases. The elements equally participating in crystals and the groundmass show losses equivalent to the total mass loss of the rocks, as they escaped in the crystalline phases and airborne particles from the groundmass during thermal treatment. Decrease of highly incompatible elements, which mostly participate in the groundmass, in the expanded products is less than the total mass loss, as they escaped mainly in the airborne particles. The inadequate expansion and burst of the Trachilas perlite did not allow for a similar categorisation, due to random and unpredictable escape of the elements. We propose the application of this method to an artificial system to predict unexpandable mineral phases in bulk perlite, as well as elements that are most likely to participate in the amorphous perlite phase, which cannot be determined from a regular industrial production line. This graphical method may also predict environmental pollution of the atmosphere from the release of volatile compounds and airborne particles during thermal treatment of perlite or other processes of mineral treatment.

Graphical Abstract

1. Introduction

Perlite is a hydrated natural volcanic glass and is commercially valuable because of its expansion ability from four to 20 times its original volume and its simultaneous reduction in bulk density by up to 90%. The expansibility of perlite and the ability of the industrial product to achieve a low density and a high surface area makes it an ideal lightweight insulating material (bulk density ranges from 60 to 120 kg·m−3) for a wide range of applications.
Efficient expansion of perlite depends on a complex combination of parameters such as its properties (particle diameter, differences in chemical composition and particularly water content, different sites of water occurrence and surface area per volume ratio of perlite grains) and furnace operating conditions (wall temperature, air feed temperature, and flow rate) [1,2,3]. Eight perlite samples from Milos Island (Greece) with similar mineralogical and chemical composition, as well as similar physical properties were thermally treated under the same furnace conditions, but they yielded different expansion behaviours. Therefore, in the present work, we investigate factors other than the furnace conditions that are involved in the capability of perlite to expand. The geochemical modification of perlites after their thermal treatment is moreover investigated as a guide for the prediction of material that escapes in the environment during the expansion process, thus allowing an assessment of potential environmental consequences.

2. Materials and Methods

Milos Island (southwest Cyclades, Aegean Sea, Greece) belongs to the active southern Aegean volcanic arc and includes rhyolitic to rhyodacitic lava flows associated with extensive perlite deposits [4,5]. Twenty bulk perlite samples from two active quarries (Tsigrado and Trachilas) of S & B Industrial Minerals S.A. (currently IMERYS S.A., Athens, Greece) were collected and their mineralogical, petrographic and geochemical characteristics were studied. Six samples from Tsigrado (TS1-TS6) and two from Trachilas (TR1, TR2) quarries were treated thermally to produce their expanded counterparts. These bulk samples were crushed initially in jaw crushers and screened to a coarse (1.18–2.5 mm) industrial size fraction (coarse crude perlite or CCP). These fractions were dried at 105 °C for 16 h and 40.00 g of each sample was expanded using a purpose-built, gas-fired and back-set to alimentation, vertical laboratory expansion furnace in the chemistry laboratory of the central facilities of S & B Industrial Minerals S.A. The cylindrical heating chamber of the vertical furnace is 2 m long and its diameter is 0.15 m. Perlite expansion was achieved between 500 and 700 °C, and was recorded by two thermocouples placed at 170 and 45 cm from the bottom of the flame, respectively. Since perlite expansion is achieved under varying conditions [1], internal regular, reference standards of S & B Industrial Minerals S.A. were used to control expansion and attain an optimal loose bulk density of ~90 kg·m−3. Mass losses were calculated after weighing the expanded material (EP). During the expansion of perlite, the unexpanded components (termed as drops) were collected at the bottom of the vertical laboratory expansion furnace and were weighed twice with mean values used in the analysis. The whole procedure involved materials and methods identical to those used during the industrial production of perlite, in order to simulate as much as possible the real conditions.
The mineralogical compositions of CCP samples and their expanded counterparts were investigated by X-ray powder diffraction analysis (XRPD) from 2° to 70° 2θ, using a Bruker D8 Advance X-Ray diffractometer (Bruker-AXS, Madison, WI, USA), with Ni filtered Cu Kα radiation, at the Department of Geology, University of Patras, Patras, Greece. The interpretation of the acquired diffractograms and mineral identification was performed using DIFFRACplus EVA software (Bruker-AXS) based on the International Centre for Diffraction Data Powder Diffraction File (2006) [6]. The degree of crystallinity (Ic) in the samples was calculated using the methodology of Krimm and Tobolsky [7] by the ratio of the crystalline area Ac present in the diffractograms to the total area At (= amorphous + crystalline) present in the same diffractograms, using the equation: Ic = 100 × (Ac/At).
Microstructural and morphological observations on Au-coated grains from the CCP samples and their expanded counterparts were conducted using a JEOL 6300 scanning electron microscope (SEM), equipped with a Link ISIS 300 energy dispersive spectrometer (EDS) (JEOL-USA, Peabody, MA, USA) at the Laboratory of Electron Microscopy and Microanalysis, School of Natural Sciences, University of Patras.
Chemical analyses of the CCP samples and their expanded counterparts were performed at Geoscience Laboratories (Geo Labs), Sudbury, Ontario, by X-ray fluorescence (XRF) on pressed pellets for major elements and inductively coupled plasma-mass spectrometry (ICP-MS) for trace and rare earth element (REE) analysis. The analytical precision from replicate analyses is better than 3% for most major elements and better than 5% for most trace elements and REEs. The loss on ignition (LOI) for all the samples was determined by mass loss after heating at 1100 °C.
The isocon method [8,9] was used as a quantitative method to determine elemental losses during perlite expansion. It is a graphical approach to the mass transfer equation used by Gresens [10], which is frequently used in natural systems for the determination of element exchange between metasomatic rocks and their surrounding environment. According to this technique, when the compositions of unaltered and altered rocks are plotted as variables, the immobile elements (i.e., the elements that are unaffected by any alteration process) must lie on a straight line (isocon) which passes through the origin. The reciprocal slope (i.e., cotangent of the angle between the isocon line and the abscissa) gives the total mass change during alteration. Deviation of points for mobile elements above or below the isocon line provides the gain or loss, respectively, of each chemical component in the altered rock with respect to the original. In this paper, isocon analysis is applied, to our knowledge for the first time, in an artificial system, considering the thermal treatment of perlite as equivalent to a high-temperature alteration process. According to the isocon method, untreated and treated samples compositions (analogous to unaltered and altered rocks) are plotted on the abscissa and ordinate, respectively. Unlike most natural systems, in our case, the mass loss during thermal treatment is known, hence all calculations and plots of the isocon line are made on this basis.

3. Results

3.1. Petrographic Characterisation

A petrographic study of polished thin sections of 20 rock samples collected from Tsigrado and Trachilas quarries, using polarising and scanning electron microscopy showed that they comprise rhyolites dominated by amorphous groundmass. Primary phenocrysts include quartz, K-feldspar, plagioclase, biotite, ilmenite and accessory zircon and galena; accessory spinel occurs only in Tsigrado. Limited alteration resulted in the presence of muscovite and sericite after feldspars.

3.2. Perlite Expansion

The Tsigrado and Trachilas CCP samples exhibited a significant loss of mass after their expansion (EP), varying from 8.3% to 11.8% of their initial amount (Table 1), in line with the regular values of mass loss during industrial treatment. However, the Trachilas samples showed inefficient expansion (the desired bulk density was never achieved) and the amounts of the collected drops during their expansion is negligible and significantly lower than those collected from the Tsigrado samples (Table 1).

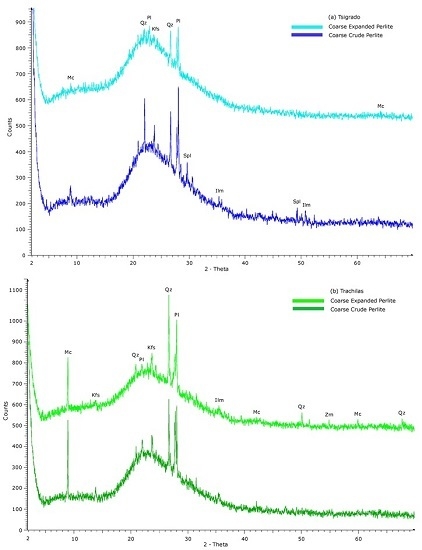
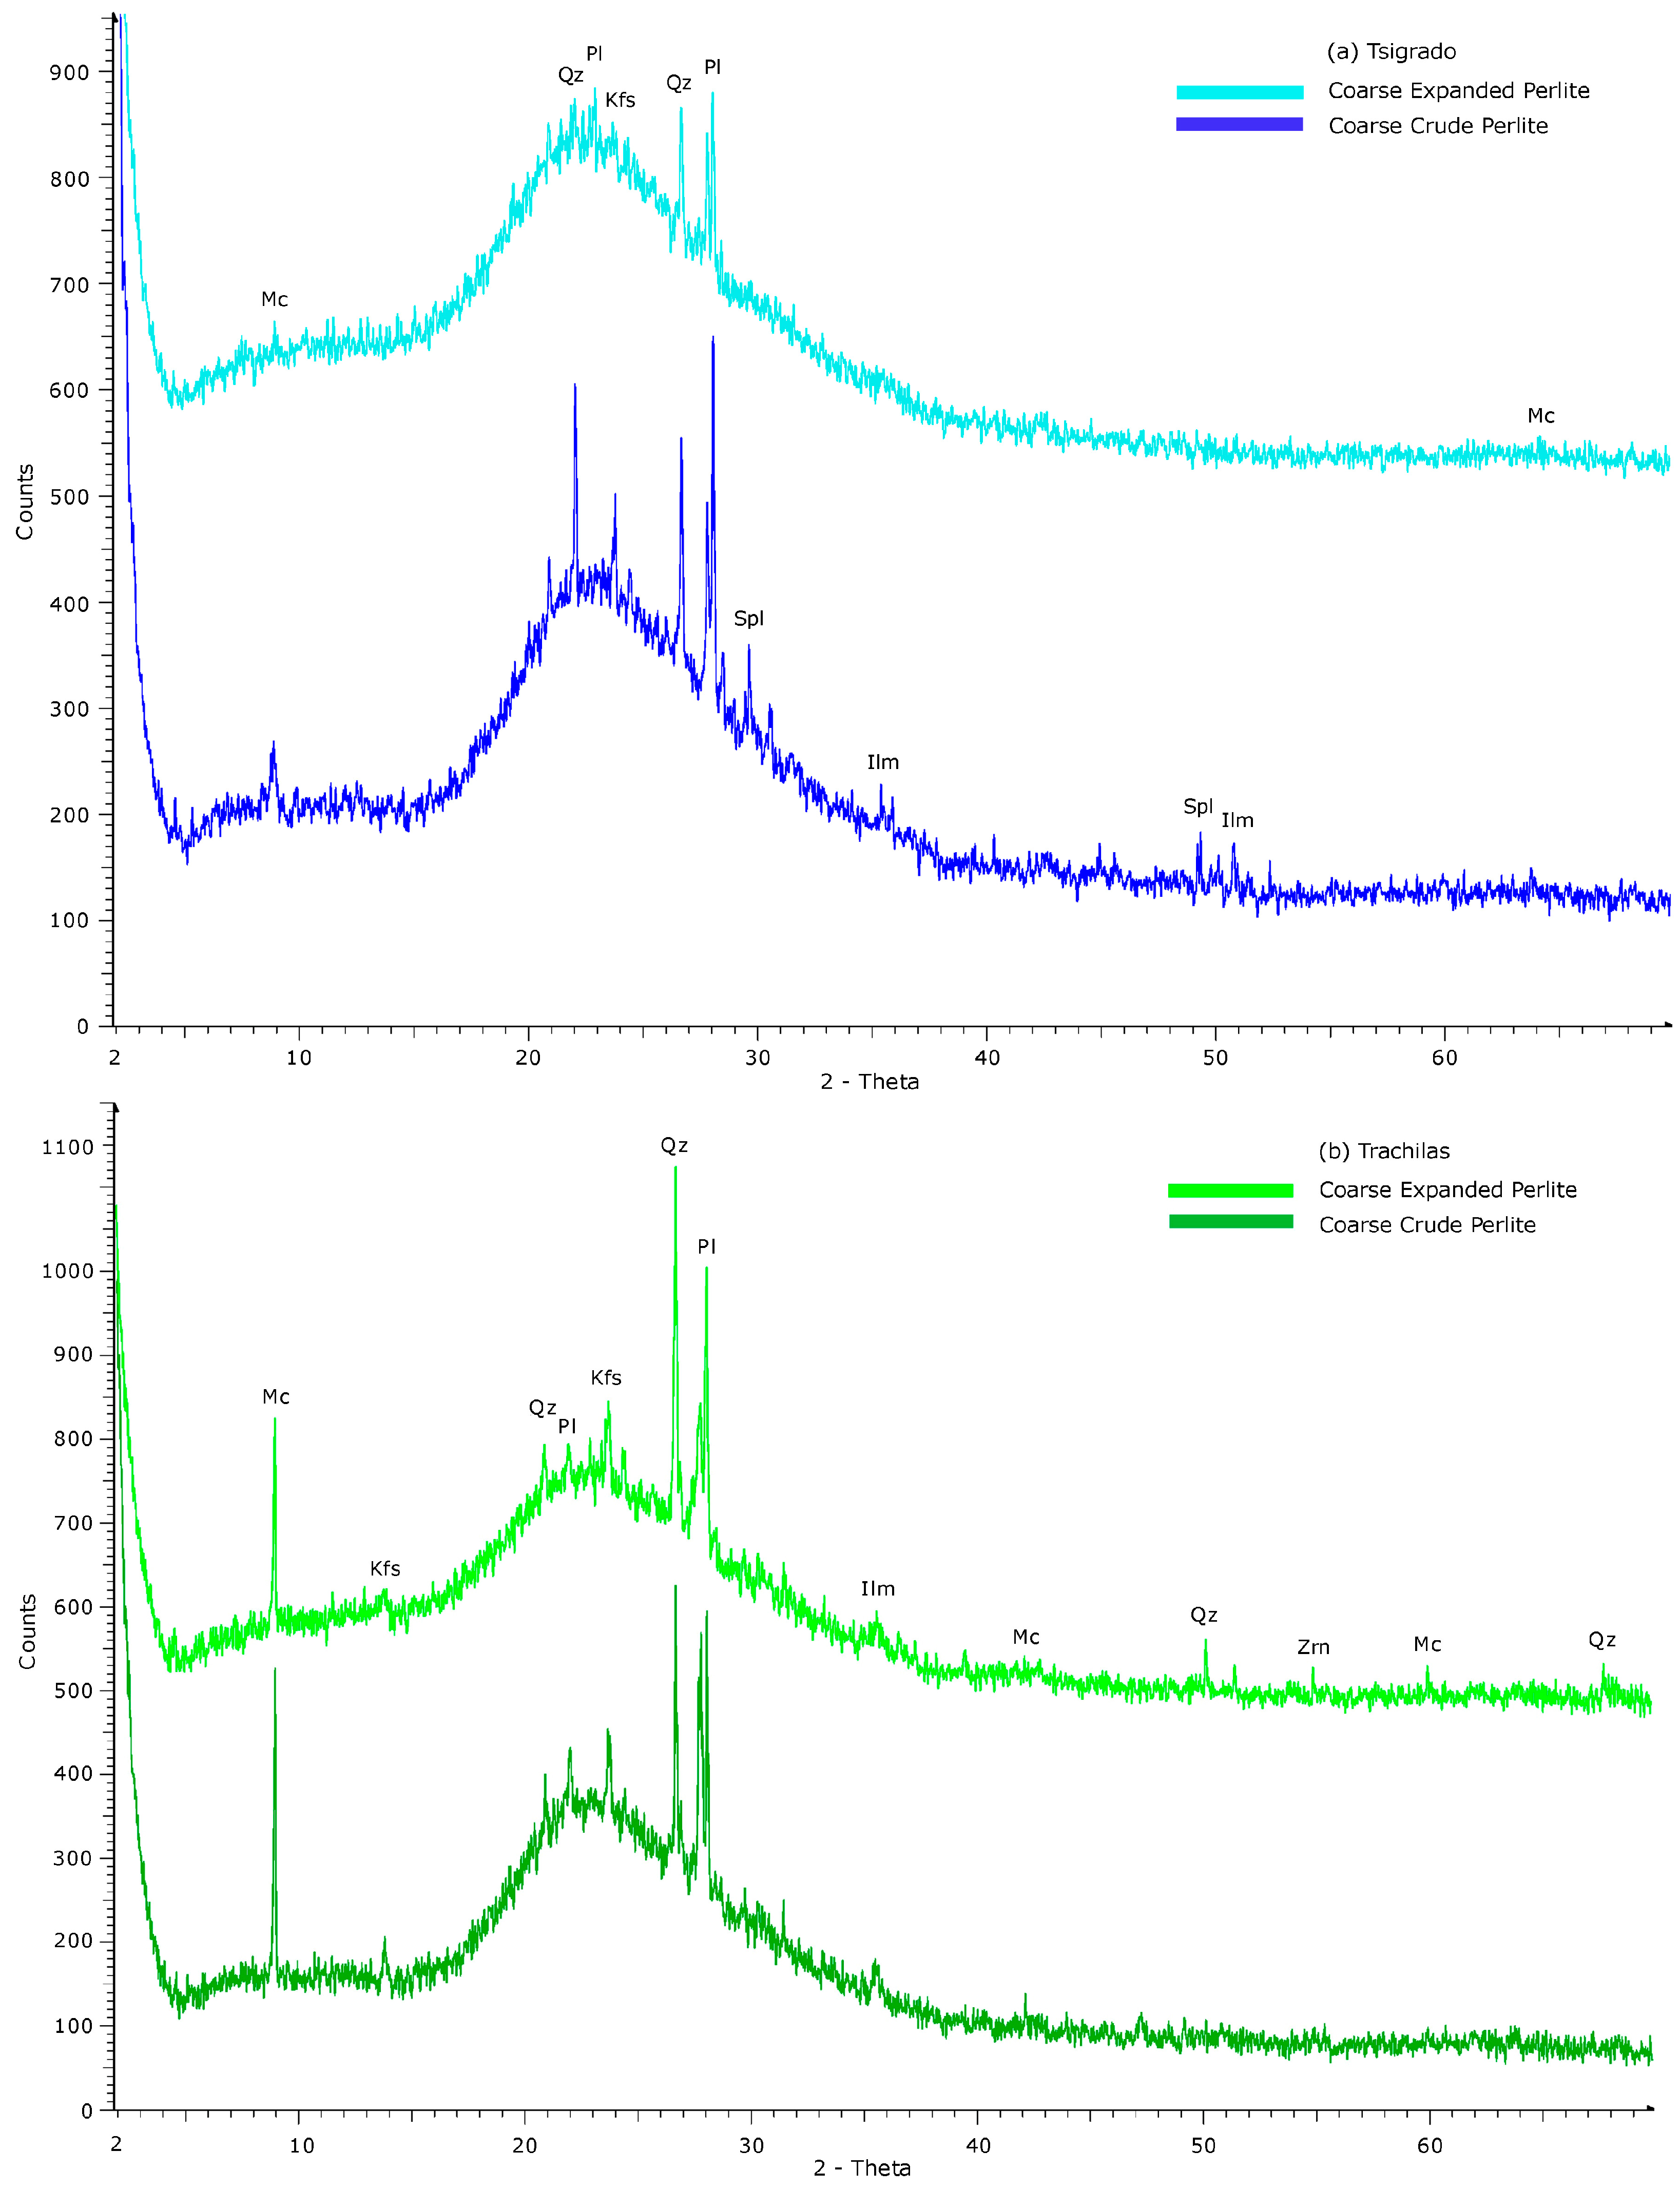
3.3. Interpretation of XRD Patterns

X-ray diffraction (XRD) patterns are compatible with the microscopic observations (Figure 1). Certain weak peaks are assigned to accessory ilmenite, zircon and spinel; the latter detected only in the Tsigrado samples (Figure 1). Detailed observation and comparison of the X-ray diffractograms from the CCP and EP from Tsigrado revealed a decrease in intensities (quartz, K-feldspar, plagioclase, mica) or even disappearance (spinel, zircon and ilmenite) of mineral peaks in the expanded sample (Figure 1a). This is interpreted as the result of an accumulation of these crystallites mostly as drops that escaped from the expanded material. Contrarily, a comparison of the X-ray diffractograms from the CCP and the EP Trachilas samples shows that the mineral peaks remain intact in the expanded sample (Figure 1b), which suggests that the unexpandable crystallites were unable to escape as drops.
The broad humps between 18° and 30° 2θ on the acquired X-ray diffractograms are assigned to the presence of amorphous, glassy mass, both in the coarse crude and expanded perlite samples from the two areas. The calculated degrees of crystallinity (Ic) in the CCP Tsigrado and Trachilas samples yielded values of 14% and 12%, respectively, indicating the presence of 86% and 88% amorphous phase, respectively. However, the same calculations showed a significant decrease of the crystallinity in the EP Tsigrado sample (7%) relative to the Trachilas EP sample (13%), suggesting an increase in the amorphous phase to 93% for the first sample but a nearly constant value of 87% for the second. Heating is expected to have a slight, if any, positive influence in the crystallinity of the samples; therefore, the absolute values of crystallinity must be considered with care. In any case, an essential relative increase in the amorphous material is observed only in the expanded Tsigardo perlite.

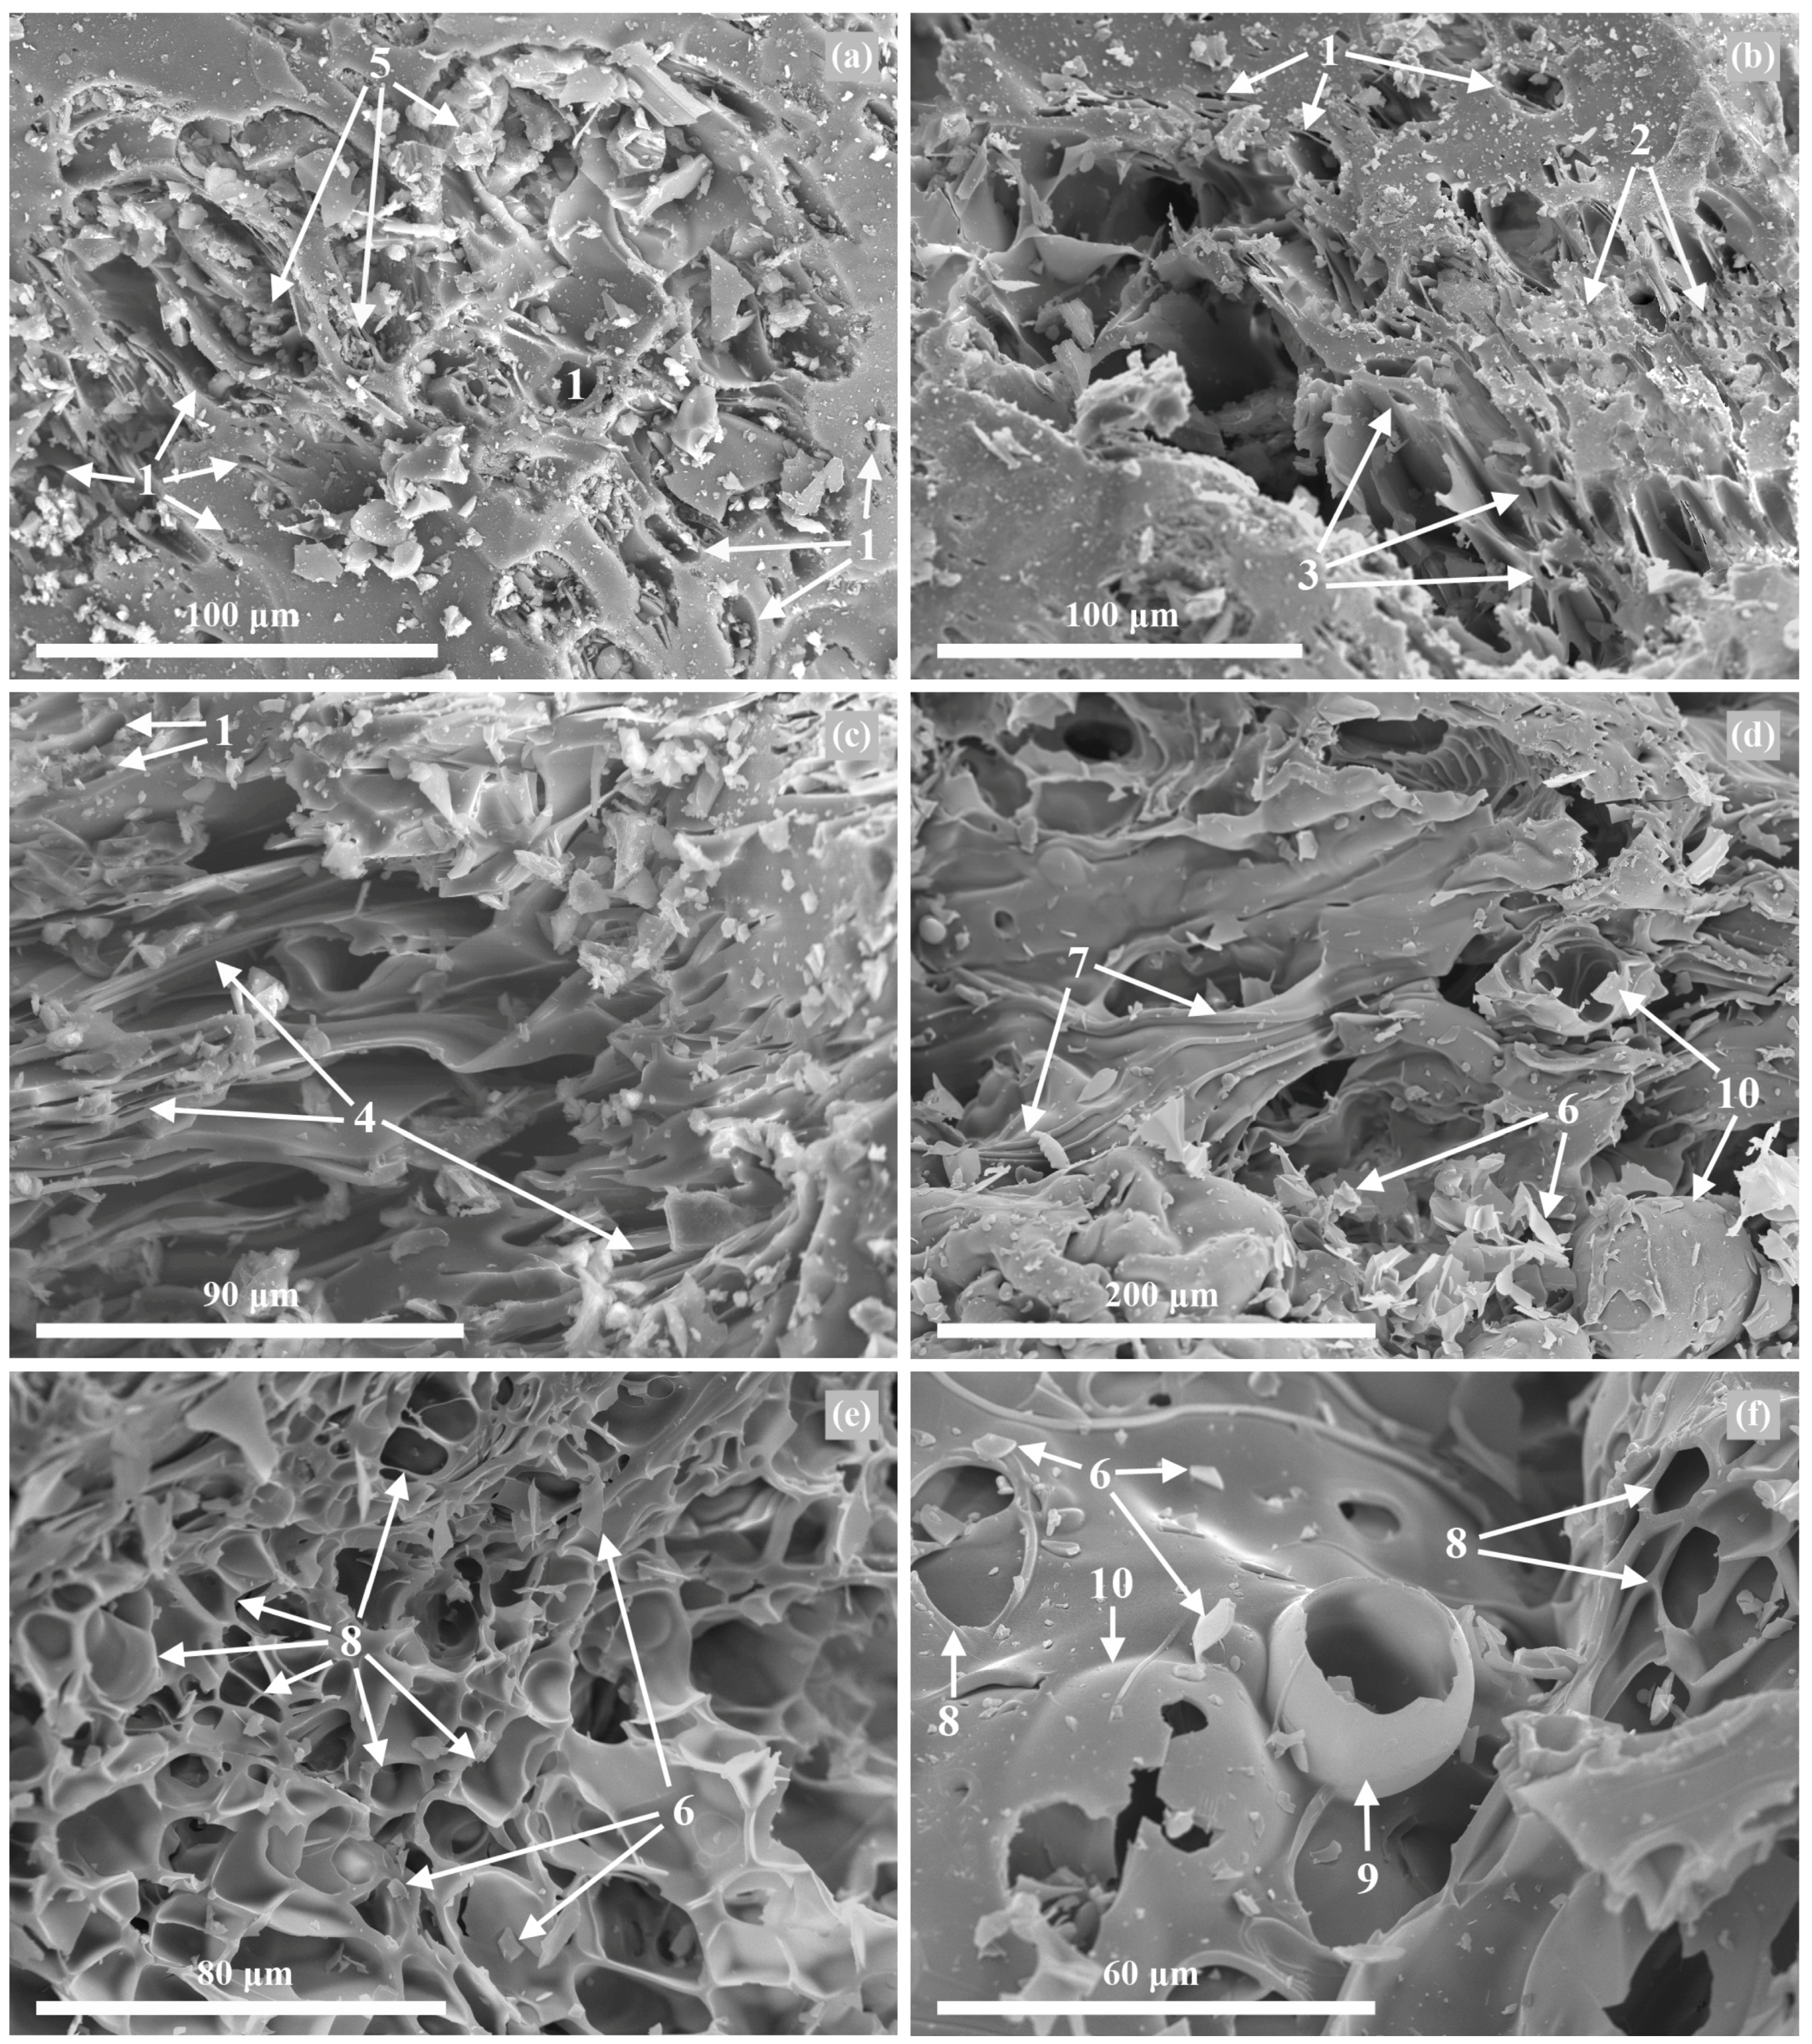
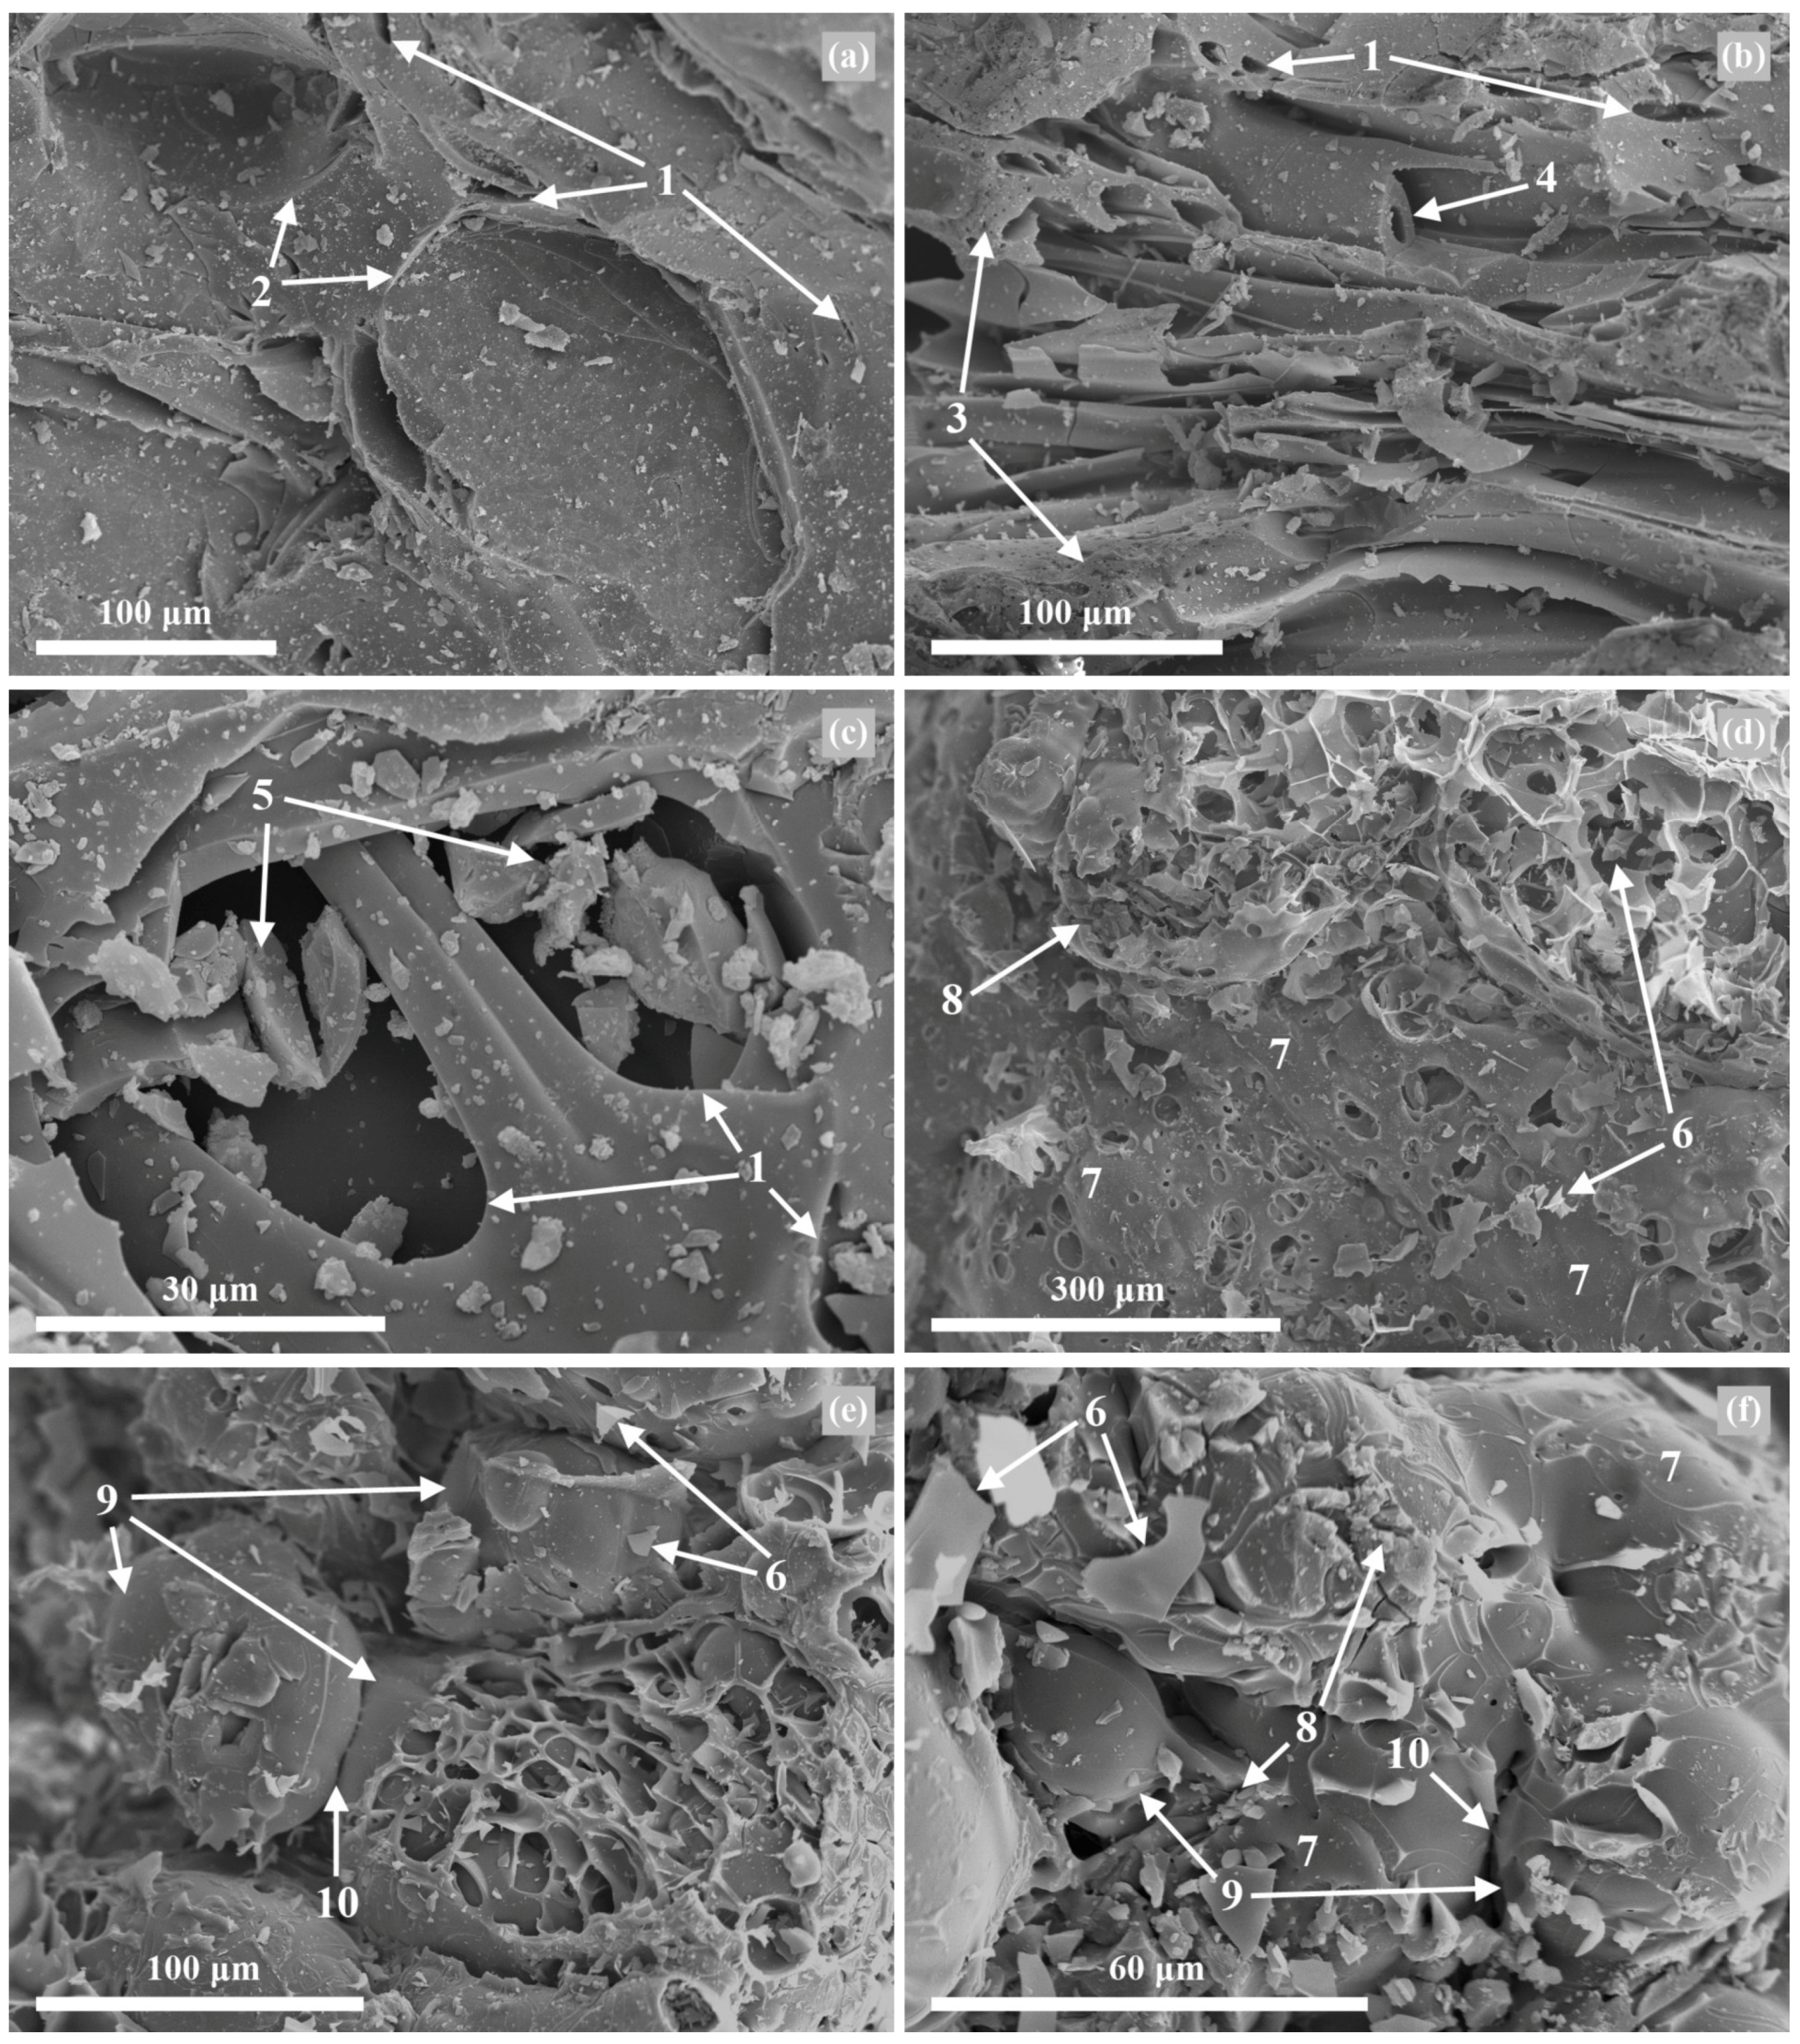
3.4. Morphological and Microstructural Properties

SEM observations were also used to study the grain morphology and microstructures of the CCP samples and the changes induced by expansion, as well as to measure the crystallite size (Figure 2 and Figure 3). CCP samples from both areas show similar characteristics. They have planar and curvilinear surfaces with dispersed voids with variable forms and sizes (Figure 2a–c and Figure 3a–c), display local perlitic microcracks (Figure 3a) and have a pumiceous microstructure (Figure 2b and Figure 3b). The formation of sharp grain edges by smooth, curved and hollow surface textures is common (Figure 2a and Figure 3c). Pipes (Figure 3b) elongated vesicles (Figure 2b) form a pumice flow microstructure. Well-developed elongated vesicles contain pockets of coalesced vesicles with thin walls (Figure 2c). The CCP samples from Tsigrado and Trachilas contain crystalline patches embedded in the groundmass (Figure 2a and Figure 3c).
The EP samples from both areas show considerable differences. They are characterised mainly by fragmented surfaces that are comprised of irregular tiny shreds, generated during expansion, when perlite particles burst violently (Figure 2d–f and Figure 3d–f). However, the dominant microstructures in the EP from the Tsigrado area comprise open pores, as small channels, that form a thick network (Figure 2d), and closed pores as inner cavities, with less intercommunication (Figure 2e,f). The expansion of this sample led to the formation of thin-walled, well-formed, rounded bubbles (Figure 2f) and hollow microspheres that exist as isolated cells (Figure 2d,f). The amount of the observed crystallites is significantly lower relative to the crude raw material. Contrarily, the Trachilas expanded perlite sample includes glassy groundmass with prominent inclusions of crystallites that appear to remain largely intact and attached to the groundmass (Figure 3d,f); microspheres that were formed at the middle stage of its expansion remained compact and contain cracks (Figure 3e,f), which indicates low expansion.
Statistical measurements of crystallite grain size included the average diameters of 80 crystallites from each crude sample, from micro-sites at regular intervals on the investigated particles. The crystallite size of the Trachilas sample reaches 10 μm, whereas the Tsigrado sample contains coarser crystallites with more than 80% of them ranging from 10 to 20 μm (compare Figure 2a and Figure 3c). Individual exceptions with crystals up to a few millimetres also occur in the last sample.

3.5. Whole-Rock Chemistry

Whole-rock geochemical analyses of the CCP samples from Milos Island are listed in Table 2 and Table S1 (see online Supplementary Materials). The samples from both areas have similar mineralogical and geochemical characteristics and are classified as rhyolites, according to their mineralogical and chemical compositions (see Figure 1, as well as Table 2 and Table S1). The perlites from both areas have similar SiO2 and Al2O3 contents of ~74%–76% and around 12%, respectively. The Tsigrado CCP samples contain slightly higher amounts of CaO and Na2O and a lower K2O than the Trachilas samples (Table 2 and Table S1).

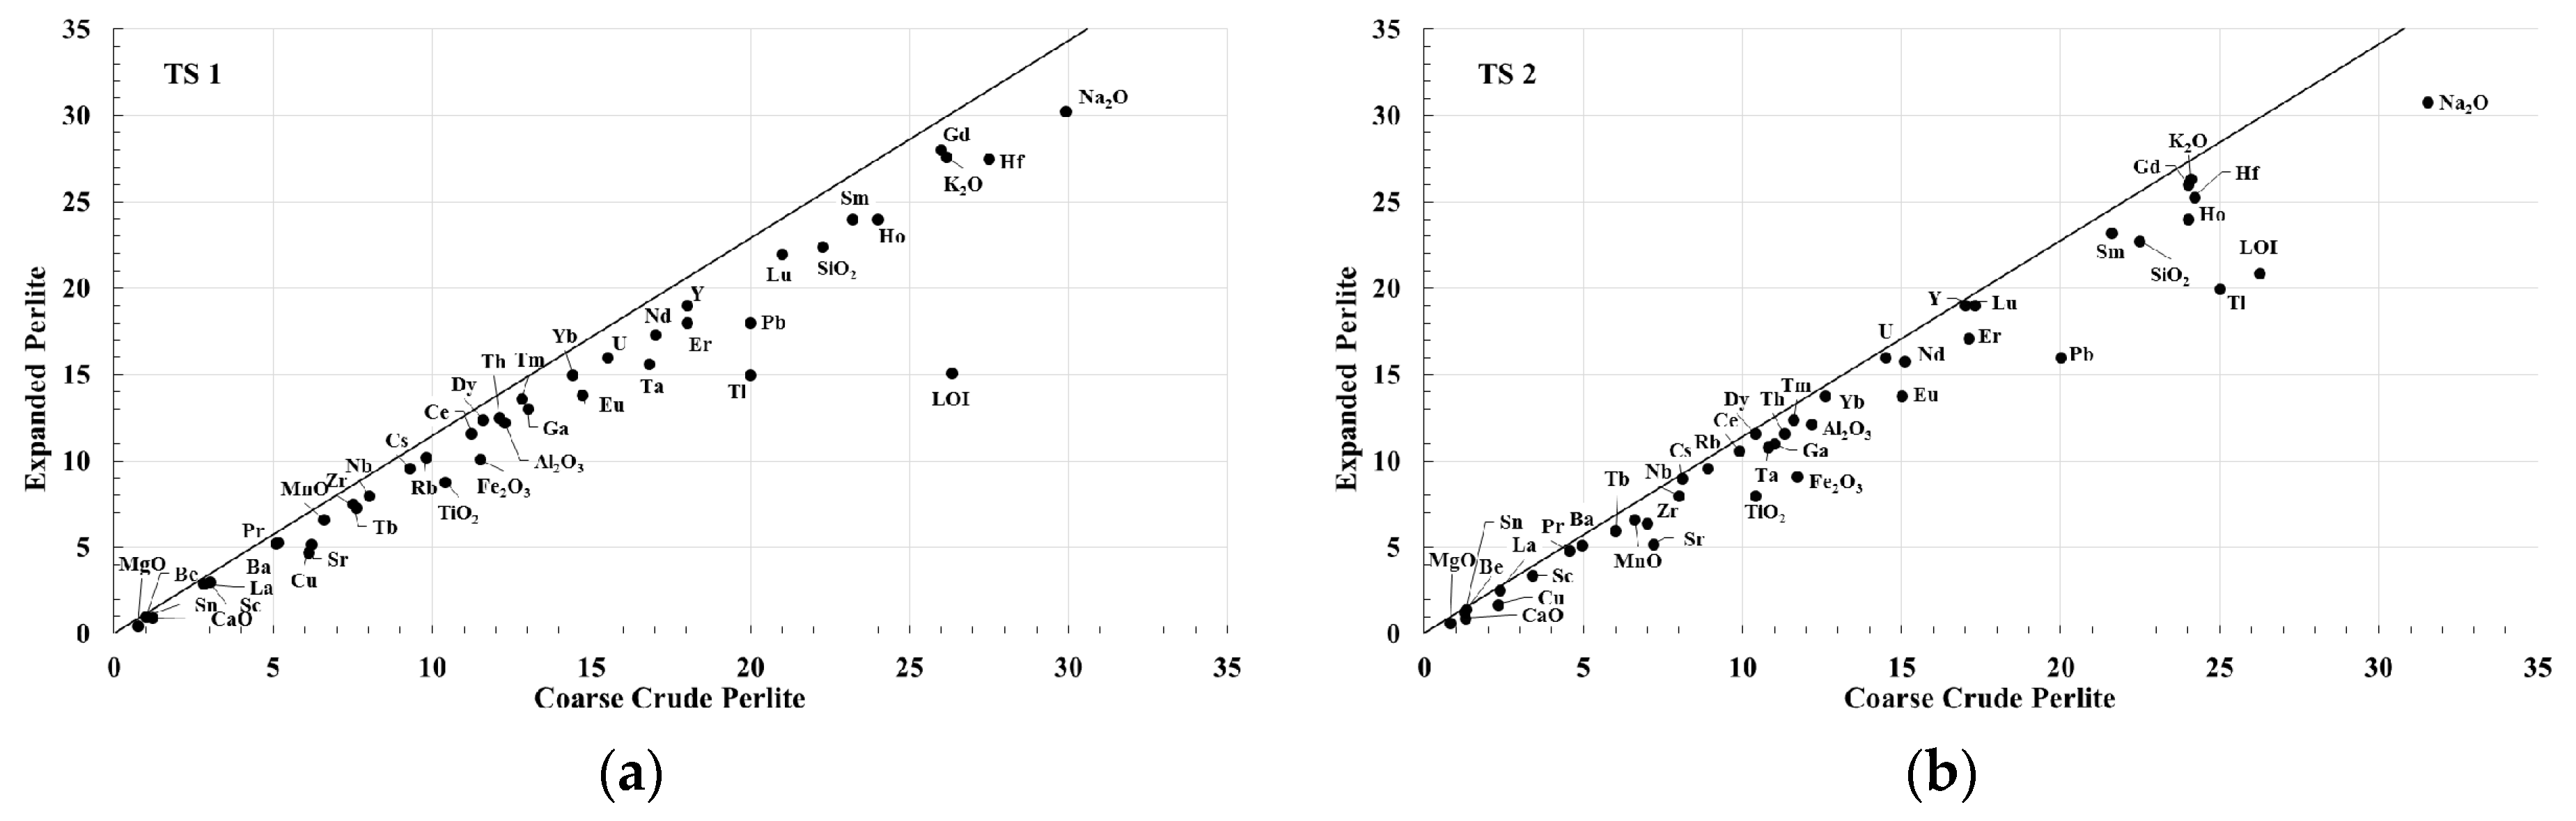
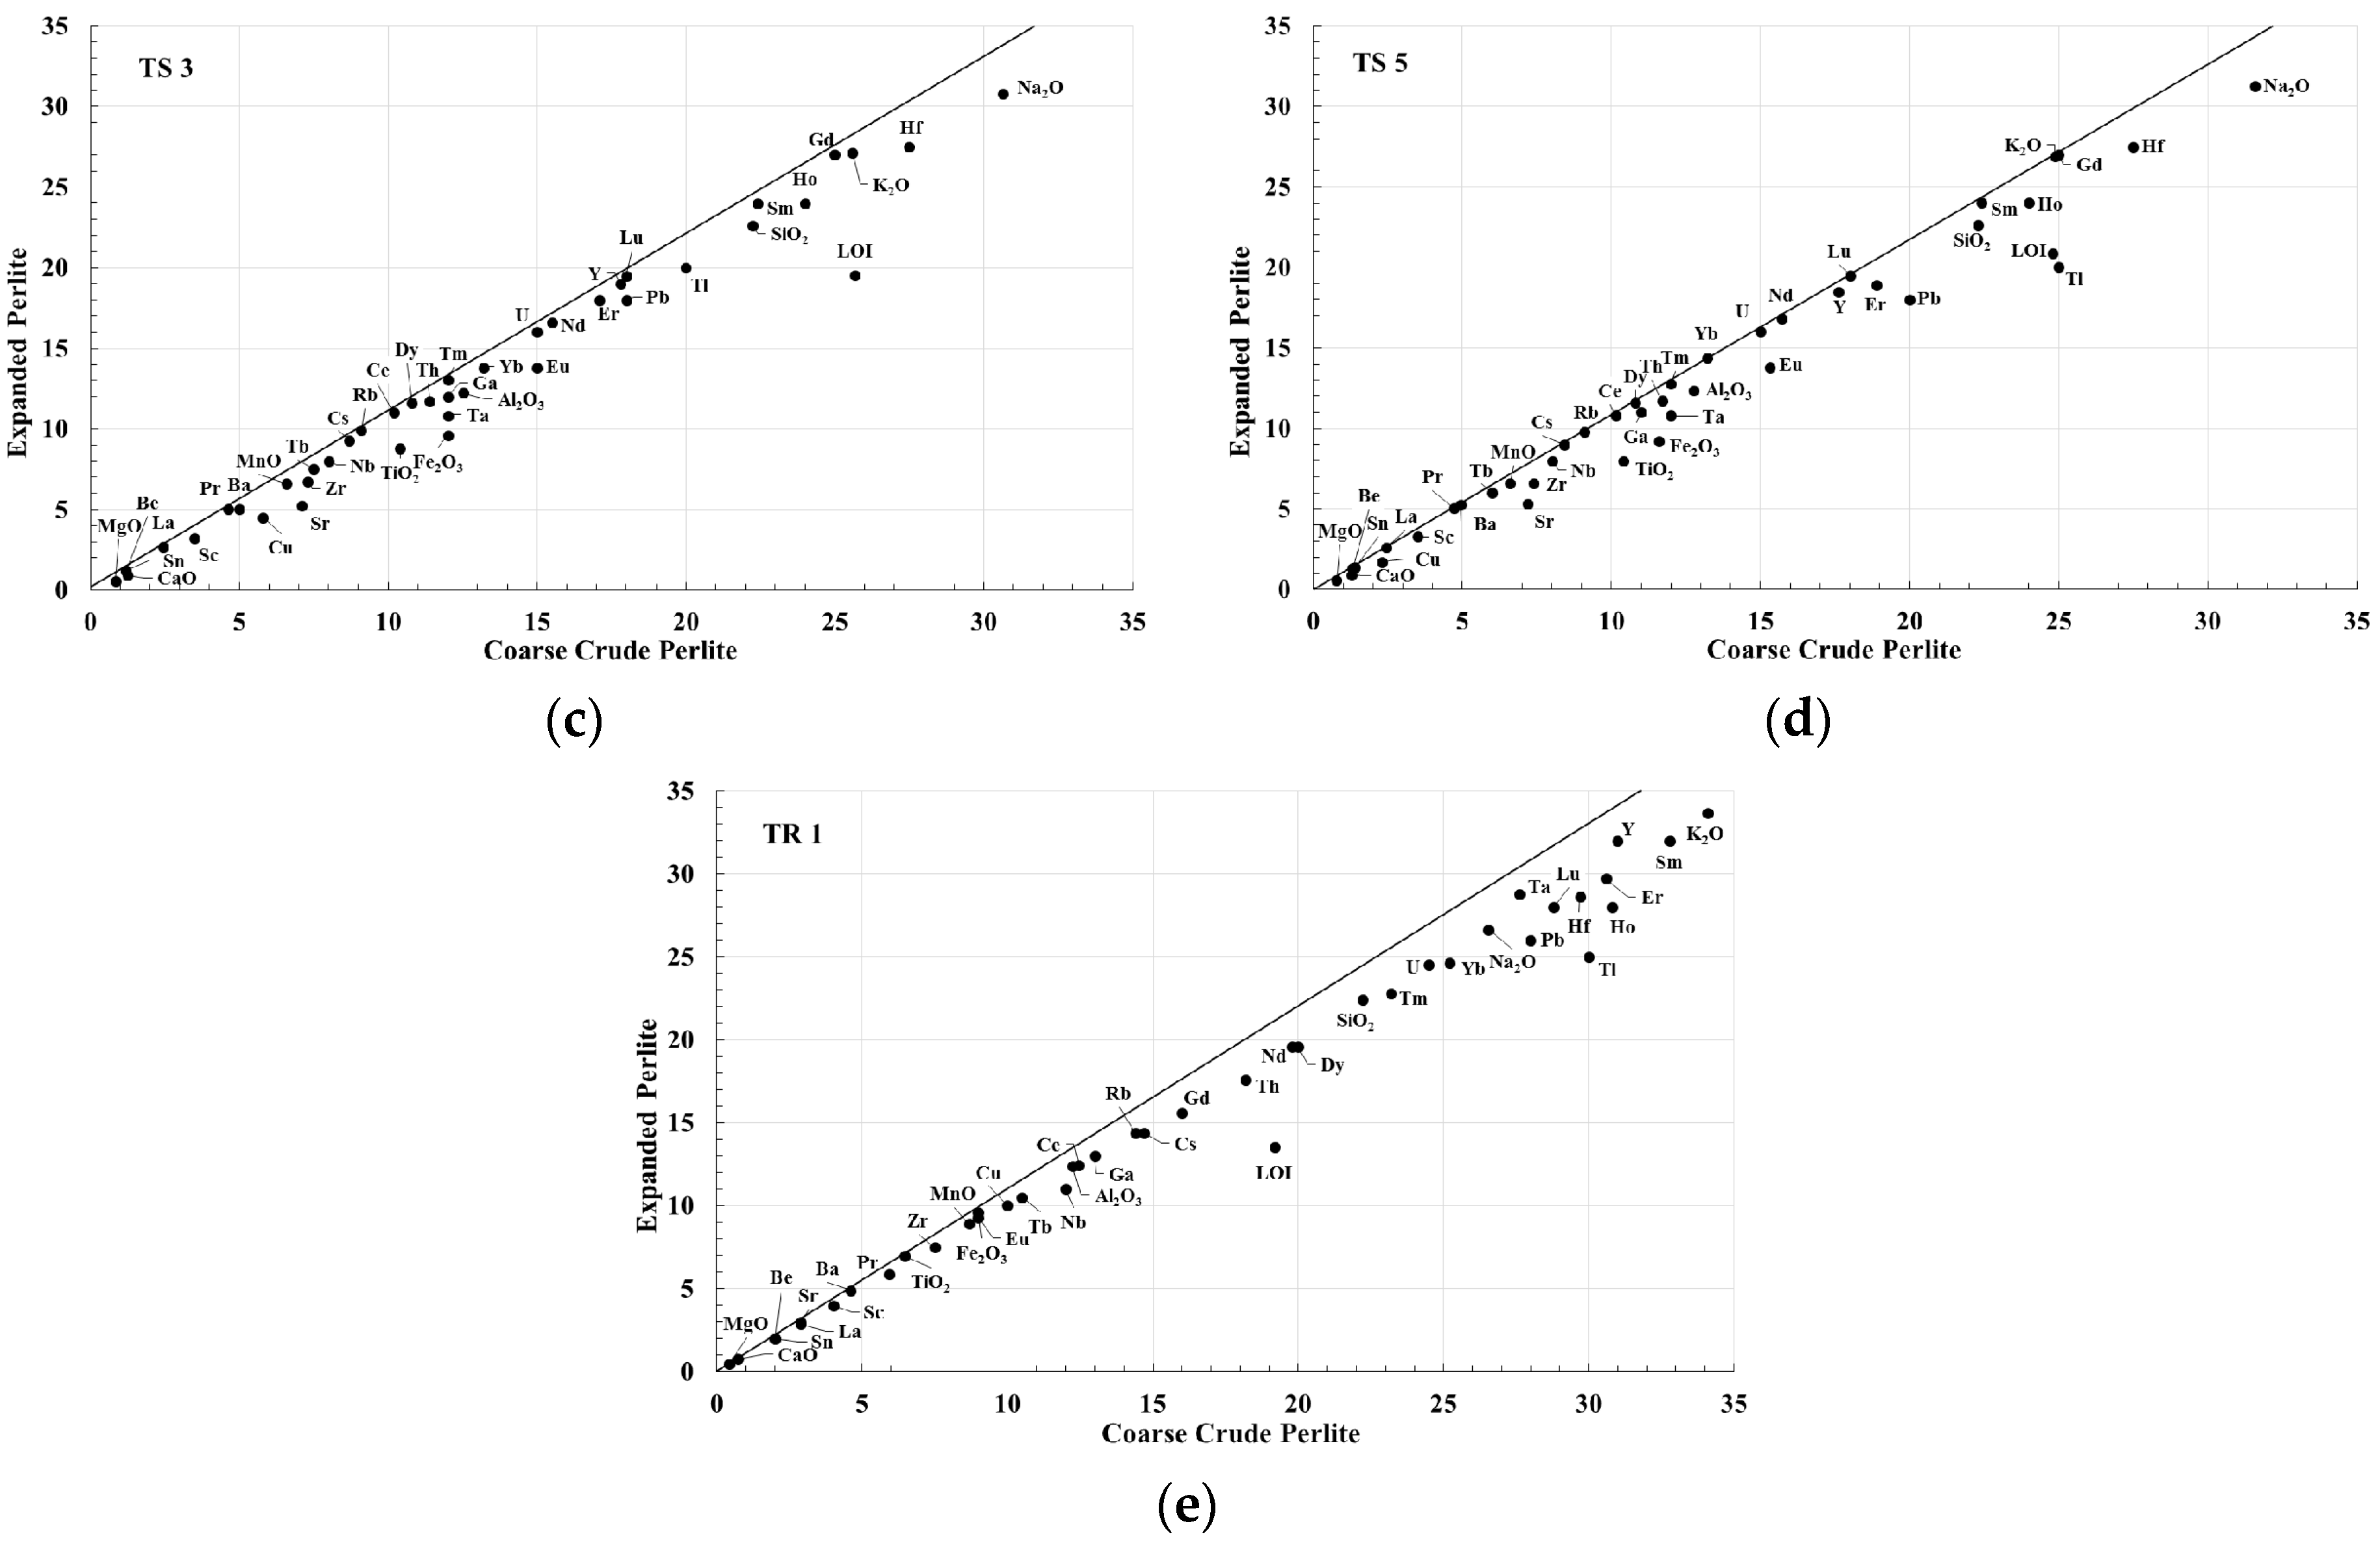
3.6. Isocon Approach

Results derived from a consideration of the geochemical compositions and isocon analysis of the coarse crude and expanded material from four samples from Tsigrado and one from Trachilas are given in Table S1 (see online Supplementary Materials). As the main focus of this study is the application of isocon method on the effectively expanded perlites, we did not find it necessary to provide calculations for more than one sample from the ineffectively expanded Trachilas perlites. For the application of isocon analysis to this artificial process, it is plausible to consider that only elemental losses occurred from the CCP since there is no mechanism that adds amounts of elements into the system. An advantage of using the isocon method in this artificial treatment is prior knowledge of the mass loss, unlike natural systems where this information is commonly unknown. Therefore, for each sample, we calculated elemental losses and drew the relevant isocon lines with a reciprocal slope derived on the basis of the measured mass losses (see Table 1 and Table S1, as well as Figure 4).
Considerable LOI losses recorded in all samples occur mainly because of perlite dehydration during its expansion regardless if it is effective or not. In the case of Tsigrado samples, the elements can be categorised in three groups according to their variable behaviours: (i) elements with calculated losses well above the relevant measured total mass losses for each CCP sample (11.25, 11.20, 9.40 and 8.33 wt %, respectively; see Table S1 in online Supplementary Materials); (ii) elements with calculated losses similar (within error) to total mass losses for each CCP sample; and (iii) elements with calculated losses well below the total mass losses for each of the CCP (Table 3). Few elements (SiO2, Al2O3, Na2O, Ba, Y, Tb, Ga, Tl and Pb) and LOI show similar categorisation in both Tsigardo and Trachilas samples, however most of the elements in the expanded Trachilas sample show distinctively dissimilar behaviour to the Tsigardo ones (Table 3 and Table S1).
Sc, Be and Sn contents lie close to their detection limits, hence they are not considered for further discussion because of potential significant errors; however, their behaviour cannot affect the chemical balance significantly. Geochemical analyses for Cr, Ni, Zn, Co, In, Mo, Ge, Sb and Bi were elaborated on too; however, in most of the samples, they lie below their detection limits; therefore, they are not presented here.

4. Discussion

4.1. Expansion of Perlite from Milos Island

As it has been shown elsewhere, expansion occurs only in the amorphous phase of perlite [11] because of the presence of 2–6 wt % chemisorbed and interlayered water in its structure [12], after the heating of crude perlite to close to its softening point (700–1260 °C). In the present study, coarse crude industrial fractions of all perlite samples were treated under the same furnace operating conditions (wall temperature, temperature rate increase, air feed temperature and flow rate air flow), aiming to achieve expanded material with ~90 kg·m−3 loose bulk density. They had a similar mineralogical and geochemical composition comprising hydrated volcanic glasses of rhyolitic composition. All samples were dominated by an amorphous glass phase with phenocrysts of quartz, feldspars, biotite, ilmenite, secondary muscovite and accessory zircon, galena and spinel (the last only in Tsigrado), with similar percentages for the amorphous and crystalline phases. However, during the expansion process, the perlite samples from Tsigrado showed different behaviour from the Trachilas ones. The calculated decrease in remaining crystalline phases from 14% to 7% within the Tsigrado expanded perlite (Figure 1a) indicate that ~50% of them escaped as drops, thus allowing sufficient expansion of the groundmass. The constant amount of the crystalline phases in the expanded Trachilas sample (calculated from its XRD diffractograms) is compatible with the negligible amount of drops collected after its thermal treatment. This fact implies that the crystallites stuck on the amorphous phase and prevented its unobstructed expansion.
Sodeyama et al. [13] and Rotella and Simandl [14] have shown that, during its softening, the decrease in perlite viscosity results in the formation of a cellular structure, similar to that observed in the Tsigrado sample, which enhances its expansion. According to these authors, whenever adequate softening occurs, perlite grains explode violently and display extensive morphological and microstructural changes. Micromorphological observations suggest that drop removal from the Tsigrado sample allowed for adequate expansion of the amorphous phase with the formation of open pores as small channels that had coalesced into a thick network and closed pores as isolated cells, inner cavities and holes (Figure 2d–f). The expansion of perlite started from the inner grain layers, which grew significantly and forced its structure to expand, thus forming the observed bubbles on the grain surfaces. Bubbles, upon further expansion, formed small holes, similarly to structures previously suggested by Roulia et al. [11]. The differential, relative to the groundmass, volume increase of the larger size of crystallites, which do not soften, fuse or dissolve at these temperatures, causes flaws in the amorphous phase that allow their easier liberation. Similar effects have been observed from the presence of crystals during thermal treatment of ceramic and porcelain materials [15,16]. Removal of the crystallites enhances heat diffusion in the remaining groundmass, thus assisting its softening and successful expansion.
Failure of the Trachilas sample to expand is also verified from detailed SEM observations of semi-expanded structures, with the prevalence of almost intact glassy groundmass and inclusions (Figure 3d–f), and consequent cracks among the compact bubbles (Figure 3e). Inefficient removal of crystallites in the 1.18–2.5 mm crude industrial fraction of the Trachilas perlite during its treatment was verified by SEM observations. However, previous studies have shown that the fine industrial size fraction (0.15–0.6 mm) of perlite from Trachilas presents good expansibility [1,17]; hence, a reasonable question is: what causes such a different behaviour between two similar rocks? The Trachilas differs from the Tsigrado CCP sample since it contains finer crystallites. We presume that, in the CCP sample from Trachilas, the finer size crystals show a higher degree of bonding with the groundmass, which inhibits their removal. This behaviour is attributed to the fact that the smaller crystallites are incapable of creating flaws in their host coarse particles during thermal treatment, thus disturbing significantly heat diffusion in the groundmass. The strong adherence of crystallites on the groundmass prevents its softening and expansion and makes the bubbles friable [18]. Under these conditions of failed expansion, within the range of its softening point, perlite overheats and eventually shrinks. We interpret that during thermal treatment, the forces exerted by the finer crystallites of the Trachilas perlite are capable of overcoming the resistance of the smaller particles of the fine industrial fraction, which have moreover suffered more intense fatigue during reduction of their size. Hence, in this case, the crystallites cause the desirable flaws allowing their easier liberation, which leads to adequate expansion of the amorphous phase in the fine industrial fraction. Therefore, it is reasonable to conclude that a strong correlation exists between the expansion efficiency of perlite with the combination of the selected particle size fraction and crystallite size in the bulk perlite.

4.2. Isocon Analysis of Expanded Perlite from Milos Island

Tsigrado samples yielded sufficient expansions and for each sample we calculated mass loss derived from the removal of drops, as well as from water volatilisation (Table S2, see online Supplementary Materials). After subtraction of these losses from the estimated total mass loss, there is still a considerable amount of missing material (ranging from 4.0 to 6.8 wt %), and it is plausible to assume that it escaped to the atmosphere mainly during thermal treatment or perhaps as fine material during sample collection, as well. Of the major elements, none (except LOI) can be considered to be volatile at perlite treatment temperatures; therefore, it is unlikely to involve volatilisation of a major compound other than that of crystalline water. The composition of minerals released from the expanded perlite is reflected in the elemental losses from the expanded material relative to its crude parent sample (Table S1). Isocon analysis revealed that a group of elements show consistent losses above the measured total mass loss of the CCP, which suggests that they escaped preferentially in the drops; hence, their behaviour can be explained by their selective partitioning in crystals rather than the groundmass. The elements of the second group that show losses similar to the total mass loss are considered to be partitioned equally in the groundmass (which mostly remained in the expanded material or secondarily escaped as airborne particles) and the crystals (that escaped mostly as drops). Elements that show losses less than the total mass loss indicate their strong connection with the groundmass; hence, their losses may be related only to the escape of airborne particles from the system.
LOI diminishes significantly after expansion (Figure 4, Table S1), presumably because of the loss of combined water, which is the main factor that reinforces perlite expansion. Eu and Sr substitute readily for Ca in the plagioclase structure [19,20]; therefore, their consistent losses reflect the prominent removal of plagioclases in the drops. Losses of Fe2O3 and TiO2 are associated with the removal of ilmenite and biotite from the expanded perlite sample. The loss of Ta is also connected with the removal of ilmenite from the Tsigrado expanded perlite sample, since this high field strength element is known to participate in the structure of Fe–Ti phases [21]. MgO loss from the expanded perlite sample is consistent with the removal of biotite in drops during expansion, whereas the depletion of limited spinel may also contribute to MgO loss. Losses of Zr are related to zircon removal, whereas the losses of Pb (and Cu, which, however, can participate in other sulphides too) reflect the removal of galena from the expanded perlite. Tl loss may be assigned to the removal of K-feldspars and micas after expansion, since it is known to participate in these mineral structures [22,23]; however, limited K, Rb and Ba losses do not substantiate that K-feldspar escape was prominent (see below). Tl and Pb are very volatile elements [24] and perlite treatment temperatures are in the range of their 50% condensation temperature, which strongly suggests that significant amounts of these elements are volatilised partially and escape in the atmosphere.
SiO2, Al2O3, Na2O from the second group participate in plagioclase and groundmass and the calculated amount of their removal, which is equal to the total mass loss, is consistent with this fact. Nb and Hf are incompatible elements that concentrate strongly in fractionated melts like the perlite groundmass but also participate in the biotite structure; Hf also participates in the zircon structure. REEs are generally considered to be strongly incompatible elements, and they are expected to concentrate mostly in the groundmass of acidic rocks, such as perlite, with the exception of Eu that readily participates in the plagioclase structure, too. Hence, it is expected that REE should be grouped in the third of the abovementioned group of minerals. The fact that few REEs (Tb, Ho and Er), are grouped with the second group of elements is possibly related to the preferential participation of these elements in the structure of certain trace minerals (e.g., phosphates, clay minerals), which are undetectable.
The remaining REEs are expectedly grouped in the third group as their incompatible character predicts that they mostly partition in the groundmass. K, Ba and Rb are also incompatible elements; however, they also participate readily in the K-feldspar structure. Their consistent behaviour shows losses of ~6–9 wt % and provides evidence that K-feldspar separation into drops was not very efficient and an appreciable amount of them remained attached as crystallites in the expanded perlite. Y, Th, Cs and U are typical highly incompatible elements that participate in the groundmass of acidic rocks; hence, it is reasonable that they belong to the third of the abovementioned group of elements.
Failure of the studied Trachilas sample to expand resulted in a very dissimilar behaviour of elements during thermal treatment. The calculated 9.50% total mass loss is related mostly to escape as airborne particles during thermal treatment (and perhaps as fine material during collection of the product) and secondarily by devolatilisation, as drops mass was trivial (Table S2, see online Supplementary Materials). LOI escaped significantly from the sample apparently due to devolatilisation similar to the Tsigrado samples, whereas Tl and Pb also showed a similar behaviour to the Tsigrado perlite (Table 3). SiO2, Al2O3 and Na2O escaped in amounts analogous to the total mass loss as main constituents of the groundmass and feldspars, which dominate these perlites. The observed inability of crystallites to separate from the groundmass likely results in random escape of airborne material (and hence most of trace elements) as perlite bursts; therefore, it is suggested that the estimated losses of most of the elements are random as well. Cracked material from bursting perlite includes both groundmass and crystallites, but, plausibly, groundmass has a tendency to escape easier, forming smaller and lighter particles. This explains why REEs were lost in amounts higher than the total mass loss, unlike other elements (e.g., Zr, Ti, Fe, Mg, Ca, Ba, Sr, Eu), which participate in crystallites likely forming larger and heavier particles.
To our knowledge, the isocon method has not been applied previously to an artificial, geochemical modification process. Results from this study suggest that this method can be applied to perlite expansion, provided that a good expansibility has been achieved. Using the isocon method, we obtained a clearer presentation of element mobility during perlite expansion, in which elements are most likely to participate in the amorphous expanded perlite phase and which appear to be associated with mineral and vapour phase removal from the expanded perlite. The use of this method at laboratory scale may predict the unexpandable mineral phases that are released from the coarse crude material during thermal treatment, by assigning the observed mobile elements to certain mineral phases prior to industrial production. In the production plant, where various batches of perlite are treated sequentially, it is not feasible to collect drops individually to calculate mass losses. It is recommended that the methodology presented here can be also applied in other processes of mineral treatment, as it can predict elements that escape to atmosphere either as volatiles or as combined airborne particles with obvious environmental impact.

5. Conclusions

Coarse crude 1.18–2.5 mm industrial size fraction of perlite samples from the Tsigrado and Trachilas areas of Milos Island with similar rhyolitic compositions were thermally treated but showed different expansibility behaviour. Apart from other factors that previously have been suggested to affect expansibility of perlite, we conclude that the ratio of the size of the crystallites over the size of the crude material is also an important parameter for achieving optimum expansibility. The easier removal of the coarser crystallites in the CCP from Tsigrado does not obstruct expansion. Thus, expanded perlite presents typical open pores that form a thick network of channels, and closed inner pores, bubbles and hollow microspheres. The strongly bound fine crystallites on the groundmass of the Trachilas CCP drive samples to overheat and shrink, due to their inadequacy to surpass the resistance of their host coarse particles during its thermal treatment.
The application of isocon analysis during perlite processing may predict the unexpandable mineral phases, as well as elements that are most likely to participate in the amorphous perlite phase. We suggest that this graphical method may also predict environmental charge to the atmosphere from the release of volatile compounds and airborne particles during thermal treatment of perlite or other processes of mineral treatment.

Supplementary Materials

The following are available online at www.mdpi.com/2075-163X/6/3/80/s1, Table S1: Results of whole rock geochemical analyses from coarse crude and expanded perlites from Milos Island with isocon calculations of their elemental losses during expansion; detection limits for each oxide/element are shown in the last column; Table S2: Calculations of mass losses for five thermally treated samples as a result of loss due to: (i) devolatilisation (LOI difference); (ii) removal of drops; and (iii) assumed escape of airborne particles. Calculations are explained at the footnote of the Table.

Acknowledgments

This research has been co-financed by the European Union (European Social Fund—ESF) and Greek national funds through the Operational Program “Education and Lifelong Learning” of the National Strategic Reference Framework (NSRF)—Research Funding Program: Heracleitus II. Investing in knowledge society through the European Social Fund. The authors would like to express their sincere appreciation to S & B Industrial Minerals S.A. for allowing us to collect the perlite samples and use their laboratory facilities, particularly to Athanasios Karalis, and Christos Dedeloudis for their valuable and constructive suggestions during this study. Critical review and editing of the manuscript by Laura Kuhar and Edanz are gratefully acknowledged. Thoughtful comments by two anonymous reviewers of the journal are greatly appreciated.

Author Contributions

Basilios Tsikouras conducted a part of the analytical work and calculations, and he participated in the interpretation of data and writing of the manuscript, Kalliopi-Sofia Passa conducted the laboratory and analytical work and participated in the interpretation of data and writing of the manuscript, Ioannis Iliopoulos and Christos Katagas designed the laboratory work and participated in the interpretation of data.

Conflicts of Interest

The authors declare no conflict of interest.

References

  1. Kogel, J.E.; Trivedi, N.C.; Barker, J.M.; Krukowski, S.T. Industrial Minerals and Rocks: Commodities, Markets and Uses, 7th ed.; Society for Mining, Metallurgy and Exploration Inc.: Littleton, CO, USA, 2006; p. 1548. [Google Scholar]
  2. Angelopoulos, P.M.; Gerogiorgis, D.I.; Paspaliaris, I. Mathematical modeling and process simulation of perlite grain expansion in a vertical electrical furnace. Appl. Math. Model. 2014, 38, 1799–1822. [Google Scholar] [CrossRef]
  3. Kaufhold, S.; Reese, A.; Schwiebacher, W.; Dohrmann, R.; Grathoff, G.H.; Warr, L.N.; Halisch, M.; Müller, C.; Schwarz-Schampera, U.; Ufer, K. Porosity and distribution of water in perlite from the island of Milos, Greece. SpringerPlus 2014, 3, 598. [Google Scholar] [CrossRef] [PubMed]
  4. Fytikas, M.; Innocenti, F.; Kolios, N.; Manneti, P.; Mazzuoli, R.; Poli, G.; Rita, F.; Villari, L. Volcanology and petrology of volcanic products from the island of Milos and neighbouring islets. J. Volcanol. Geotherm. Res. 1986, 28, 297–317. [Google Scholar] [CrossRef]
  5. Pe-Piper, G.; Piper, D.J.W. The South Aegean active volcanic arc: Relationships between magmatism and tectonics. Dev. Volcanol. 2007, 7, 113–133. [Google Scholar]
  6. International Centre for Diffraction Data. Powder Diffraction File; International Centre for Diffraction Data: Newtown Square, PA, USA, 2006. [Google Scholar]
  7. Krimm, S.; Tobolsky, A.V. Quantitative X-ray studies of order in amorphous and crystalline polymers. Quantitative X-ray determination of crystallinity in polyethylene. J. Polym. Sci. 1951, 7, 57–76. [Google Scholar] [CrossRef]
  8. Grant, J.A. The isocon diagram—A simple solution to Gresens’ equation for metasomatic alteration. Econ. Geol. 1986, 81, 1976–1982. [Google Scholar] [CrossRef]
  9. Grant, J.A. Isocon analysis: A brief review of the method and applications. Phys. Chem. Earth 2005, 30, 997–1004. [Google Scholar] [CrossRef]
  10. Gresens, R.L. Composition-volume relationship of metasomatism. Chem. Geol. 1967, 2, 47–65. [Google Scholar] [CrossRef]
  11. Roulia, M.; Chassapis, K.; Kapoutsis, J.A.; Kamitsos, E.I.; Savvidis, T. Influence of thermal treatment on the water release and the glassy structure of perlite. J. Mater. Sci. 2006, 41, 5870–5881. [Google Scholar] [CrossRef]
  12. Chatterjee, K.K. Uses of Industrial Minerals, Rocks and Freshwater; Nova Science Publishers: New York, NY, USA, 2009; p. 584. [Google Scholar]
  13. Sodeyama, K.; Sakka, Y.; Kamino, Y. Preparation of fine expanded perlite. J. Mater. Sci. 1999, 34, 2461–2468. [Google Scholar] [CrossRef]
  14. Rotella, M.; Simandl, G. Marilla perlite—Volcanic glass occurrence, British Columbia. In Geological Fieldwork 2002; Paper 2003-1; British Columbia Geological Survey: Vancouver, BC, Canada, 2003; pp. 165–173. [Google Scholar]
  15. Sánchez, E.; Ibáñez, M.J.; García-Ten, J.; Quereda, M.F.; Hutchings, I.M.; Xu, Y.M. Porcelain tile microstructure: Implications for polished tile properties. J. Eur. Ceram. Soc. 2006, 26, 2533–2540. [Google Scholar]
  16. García-Ten, J.; Orts, M.J.; Saburit, A.; Silva, G. Thermal conductivity of traditional ceramics: Part II: Influence of mineralogical composition. Ceram. Int. 2010, 36, 2017–2024. [Google Scholar]
  17. Saisuttichai, D.; Manning, D.A.C. Geochemical characteristics and expansion properties of a highly potassic perlitic rhyolite from Lopburi, Thailand. Res. Geol. 2007, 57, 301–312. [Google Scholar] [CrossRef]
  18. Varuzhanyan, Av.A.; Varuzhanyan, Ar.A.; Varuzhanyan, H.A. A mechanism of perlite expansion. Inorg. Mater. 2006, 42, 1039–1045. [Google Scholar] [CrossRef]
  19. Green, T.H. Island arc and continent-building magmatism: A review of petrogenetic models based on experimental petrology and geochemistry. Tectonophysics 1980, 63, 367–385. [Google Scholar] [CrossRef]
  20. Best, M.G.; Christiansen, E.H. Igneous Petrology; Blackwell Science: Oxford, UK, 2001; p. 455. [Google Scholar]
  21. Belousova, E.; Griffin, W.; O’Reilly, S.Y.; Fisher, N. Igneous zircon: Trace element composition as an indicator of source rock type. Contrib. Mineral. Petrol. 2002, 143, 602–622. [Google Scholar] [CrossRef]
  22. Badalov, S.T.; Radinovich, A.V. The geochemistry of indium and thallium in the Karamazar ore region (the Uzbek and Tadzhik republics). Geochem. Int. 1966, 3, 1095–1101. [Google Scholar]
  23. Heinrichs, H.; Schulz-Dobrick, B.; Wedepohl, K.H. Terrestrial geochemistry of Cd, Bi, Tl, Pb, Zn and Rb. Geochim. Cosmochim. Acta 1980, 44, 1519–1533. [Google Scholar] [CrossRef]
  24. Albarède, F. Volatile accretion history of the terrestrial planets and dynamic implications. Nature 2009, 461, 1227–1233. [Google Scholar]
Figure 1. XRD patterns of two 1.18–2.5 mm crude perlite samples from Milos Island and their expanded counterparts: (a) Tsigrado area (sample TS1) and (b) Trachilas area (sample TR1). For clarity, patterns of the expanded samples have been shifted 400 counts along the y-axis. Qz: quartz; Pl: plagioclase; Kfs: K-feldspar; Mc: mica; Phg: phengite; Spl: spinel; Ilm: ilmenite; Zrn: zircon.
Minerals 06 00080 g001
Figure 2. Secondary electron images of 1.18–2.5 mm industrial size fraction of Tsigrado perlite sample: (ac) crude perlite and (df) its expanded counterpart. 1: voids; 2: pumiceous microstructure; 3: elongated vesicles; 4: pockets of coalesced vesicles; 5: crystalline patches; 6: expanded perlite sherds; 7: open pores; 8: closed pores; 9: thin-walled bubbles; and 10: microspheres.
Minerals 06 00080 g002
Figure 3. Secondary electron images of 1.18–2.5 mm industrial size fraction of Trachilas perlite sample: (ac) crude perlite; (df) its expanded counterpart. 1: voids; 2: perlitic microcracks; 3: pumiceous microstructure; 4: pipes; 5: crystalline patches; 6: expanded perlite sherds; 7: intact glassy groundmass; 8: crystalline inclusions; 9: compact microspheres and 10: cracks.
Minerals 06 00080 g003
Figure 4. Plot of isocon analysis for crude 1.18–2.5 mm perlite expansion from Tsigrado (ad) and Trachilas (e) areas. Insets in diagrams show sample numbers. The abscissa and the ordinate represent original (CCP) and altered (expanded) elemental concentrations, respectively. Isocon lines are drawn on the basis of the calculated mass losses (Table 1). Major elements plotted as weight percent, trace and rare earth elements as ppm. Scaling factors are given in Table S1 (see online Supplementary Materials).
Minerals 06 00080 g004aMinerals 06 00080 g004b
Table 1. Mass values of coarse crude (CCP), expanded perlite (EP) samples and drops of expanded perlite.
SamplesMass (g)Total Mass Loss
CCPEPDrops(g)wt %
TsigradoTS140.0035.500.954.5011.25
TS240.0035.520.934.4811.20
TS340.0036.241.403.769.40
TS440.0035.301.204.7011.75
TS540.0036.671.233.338.33
TS640.0036.351.333.659.13
TrachilasTR140.0036.200.053.809.50
TR240.0036.150.033.859.63
Table 2. Whole-rock chemical composition of crude 1.18–2.5 mm perlite samples from Tsigrado and Trachilas areas (-: below detection limit; LOI: loss on ignition).
Major Elements wt %TsigradoTrachilas
TS1TS2TS3TS4TS5TS6TR1TR2
SiO274.2174.9374.1275.4674.2975.5974.0875.73
TiO20.130.130.130.140.130.140.080.14
Al2O312.2812.1612.5212.1212.7612.0912.2412.03
Fe2O31.151.171.200.981.160.980.900.70
MnO0.060.060.06-0.06-0.08-
MgO0.250.270.280.170.260.150.140.04
CaO1.201.281.251.251.271.210.740.71
Na2O3.743.943.834.073.954.103.323.52
K2O3.273.013.203.113.113.154.674.68
LOI3.293.283.212.713.102.602.402.87
Total99.58100.2399.80100.01100.09100.0198.65100.42
Table 3. Categorisation of elements according to their behaviour during expansion of the Tsigardo and Trachilas samples.
BehaviourTsigradoTrachilas
Elements lost in the expanded perlite in amounts higher than the total mass loss of the CCPLOI, TiO2, Fe2O3, MgO, CaO, Sr, Zr, Eu, Cu, Ta, Tl, PbLOI, K2O, Th, La, Pr, Nd, Sm, Gd, Dy, Ho, Er, Tm, Yb, Lu, Nb, Cs, Hf, Tl, Pb
Elements lost in the expanded perlite in amounts similar to the total mass loss of the CCPSiO2, Al2O3, MnO, Na2O, Tb, Ho, Er, Ga, Nb, HfSiO2, Al2O3, Na2O, Zr, Rb, Ce, Tb, Cu, Ga, U
Elements lost in the expanded perlite in amounts less than the total mass loss of the CCPK2O, Ba, Y, Rb, Th, La, Ce, Pr, Nd, Sm, Gd, Dy, Tm, Yb, Lu, Cs, UTiO2, Fe2O3, MnO, MgO, CaO, Ba, Sr, Y, Eu, Ta

