1. Introduction
There are numerous examples of crystal surfaces undergoing changes of nanotopographic features during growth from aqueous solutions containing foreign ions [
1,
2,
3,
4,
5,
6,
7]. One of the most remarkable phenomena is the so-called “template effect”, which was first defined by Astilleros [
8] to describe the reproduction of the original nanotopography of a crystal surface, including etch-pits and step edges, after successive completion of advancing monolayers. This effect has been interpreted as the result of the incorporation of the foreign ions in the growing layers during step advancement. The difference between the ionic radii of the substituted ions induces lattice mismatch between the new doped layer and the original substrate (free of impurities), which in turn causes elastic strain and stress. Subsequently, relaxation of this elastic stress occurs perpendicular to the layer, thereby introducing local variations in bond lengths. This, in turn, results in the roughing of the surface of the monolayer. This phenomenon is reflected by the characteristics of the advancement of successive monolayers on the original cleaved surface. Since the surface of successive monolayers is progressively rougher, their advancement also occurs at a progressively lower rate and eventually stops after a certain number of monolayers have piled up [
2,
8].
The template effect has been reported in varied systems as CaCO
3-Me
2+-H
2O (Me = Sr, Mn, Mg, Co), CaMg(CO
3)
2-H
2O; BaSO
4-Sr
2+-H
2O or BaSO
4-CO
32−-H
2O. In all cases, a slight lattice misfit through the interface between the original surface and the first growing monolayer is assumed. Most examples of the template effect correspond to systems where the compositional variation involves the substitution of cations [
8,
9,
10,
11,
12]. However, several examples of this phenomenon occurring during the growth of anionic solid solutions have also been reported [
3,
13,
14].
Chromium (Cr) is a most strategic element due to its use in numerous and important industrial procedures [
15]. These industrial applications have determined significant increases of the concentration of Cr in certain settlements with important environmental consequences. Indeed, the hexavalent form of this element, Cr(VI), is highly toxic and can poison most organisms even at low degrees of exposure [
15]. Moreover, Cr(VI) also is very soluble and, consequently, highly mobile. Thus, it is not surprising that the pollution of soil and ground waters by Cr(VI) is an important public health concern. Because under circumneutral to basic pHs CrO
42− is the most stable anion of Cr(VI), in most cases the remediation of Cr(VI)-related contamination can be achieved through the removal CrO
42− anions. CrO
42−-sorption on mineral surfaces can be an efficient method for this removal. Since the similarity of CrO
42− and SO
42− in both size and geometry permits the isomorphic substitution of these oxyanions in mineral structures, sulfate minerals are especially suitable phases for uptaking CrO
42− and reducing its bioavailability in the environment through the formation of solid solutions.
Here, we study the nanoscale characteristics of gypsum {010} growth in the presence of different concentrations of Cr(VI), aiming to confirm the template effect as a nanoscale phenomenon inherent to crystal growth in solid solution-aqueous solution systems. We also aim to study the capacity of gypsum to sequester Cr(VI). In order to achieve these goals, we conducted in situ crystal growth observations using atomic force microscopy (AFM) and direct precipitation experiments. The samples obtained from direct precipitation experiments were characterized using inductively coupled plasma-optical emission spectrometry (ICP-OES, SPECTRO Analytical Instruments, Kleve, Germany), X-ray diffraction (XRD, Panalytical B.V., Almelo, The Netherlands) and scanning electron microscopy (SEM JEOL Ltd., Tokyo, Japan).
2. Material and Methods
In order to study the growth of gypsum in the presence of Cr(VI), we conducted (i) nanoscale experiments of the growth of {010} gypsum surfaces using a Digital Instrument Multimode IIIA AFM (Veeco, Santa Barbara, CA, USA) and (ii) precipitation experiments by mixing solutions. Stock solutions of CaCl2, Na2SO4 and Na2CrO4 were prepared by the addition of reagent-grade compounds (Sigma Aldrich, St. Louis, MO, USA) to high-purity deionized water (resistivity = 18.2 MΩ·cm).
The supersaturation of the aqueous solutions with respect to gypsum was calculated by using the expression:
where
a(Ca
2+),
a(SO
42−) and
a(H
2O) are the respective activities of calcium, sulfate and water in the aqueous solution and K
sp,
Gp is the thermodynamic solubility product of gypsum (K
sp,
Gp = 10
−4.85 at 25 °C; “minteq” database [
16]). The solution is in equilibrium with respect to gypsum when β
Gp = 1, while β
Gp > 1 and β
Gp < 1 indicate that the solution is supersaturated and undersaturated, respectively. In all cases, the activities and supersaturation degrees were calculated by using the numerical code PHREEQC [
16].
Other possible solid phases, such as chromatite (CaCrO
4) or calcium chromate dihydrate (CaCrO
4·2H
2O), were not taken into consideration due to the very high solubilities of these phases [
17]. All the experiments were conducted at 25 °C and atmospheric pressure.
2.1. In Situ AFM Observations
In situ observations of the growth of gypsum {010} surfaces in contact with solutions supersaturated with respect to this phase and bearing different amounts of CrO42− were conducted using a Digital Instrument Multimode AFM equipped with a fluid cell and working in contact mode. Silicon nitride tips (Veeco NP-S10, Bruker, Camarillo, CA, USA) with a nominal force constant k = 0.06–0.58 N/m were used.
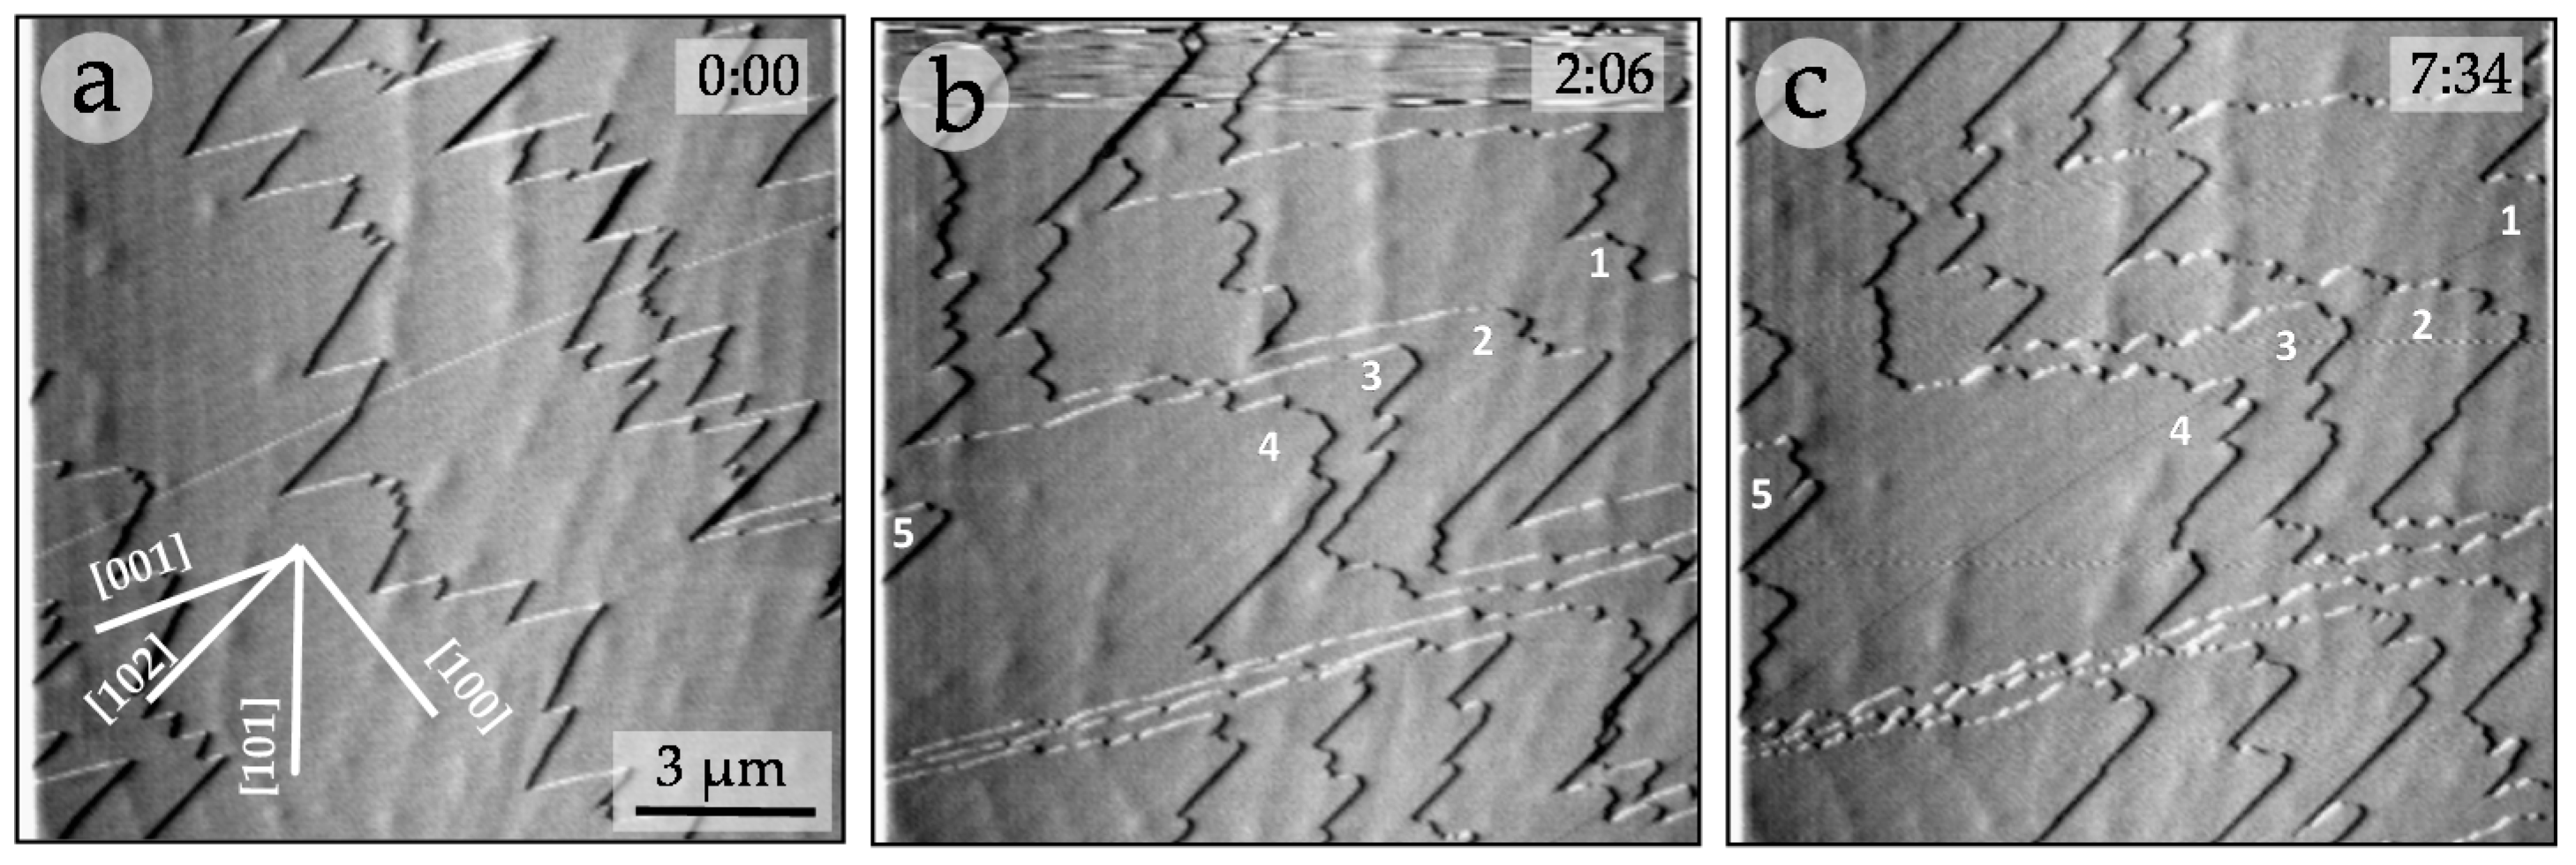
Gypsum has perfect cleavage along {010}, which is the most common crystallographic form in its habit [
18]. Freshly cleaved fragments of natural, optically clear gypsum from Toledo (Spain) (size ~ 3 × 3 × 2 mm
3) were placed within the fluid cell. In all the cases and prior to the experiment, a solution undersaturated with respect to gypsum (β
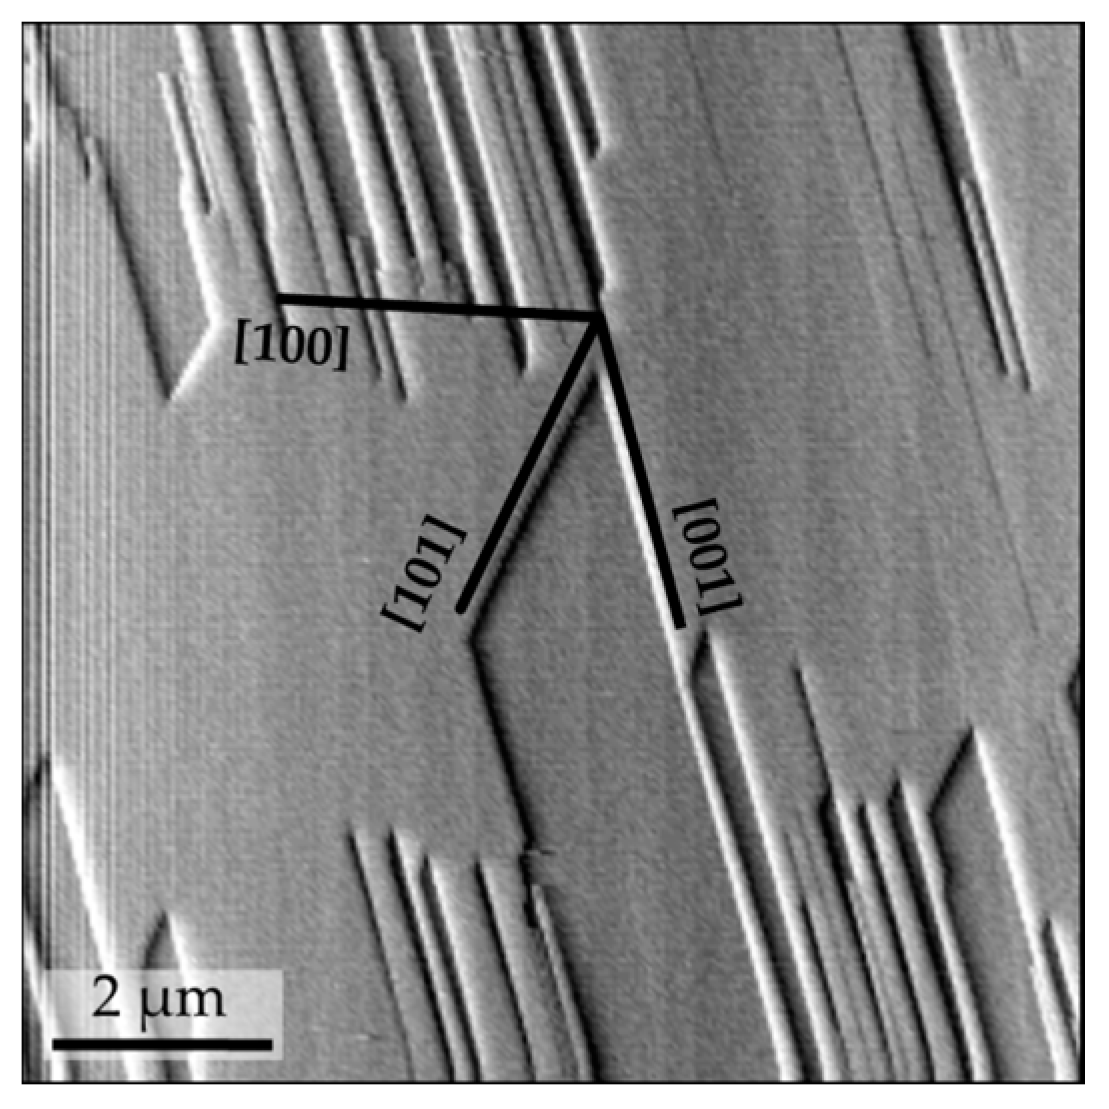
Gp = 0.8) was passed over the cleaved surface to ensure its cleaning and slight dissolution. Crystallographic directions on the gypsum surface were established on the basis of its dissolution features [
19]. The aqueous solutions were prepared from stock solutions immediately before being injected in the fluid cell.
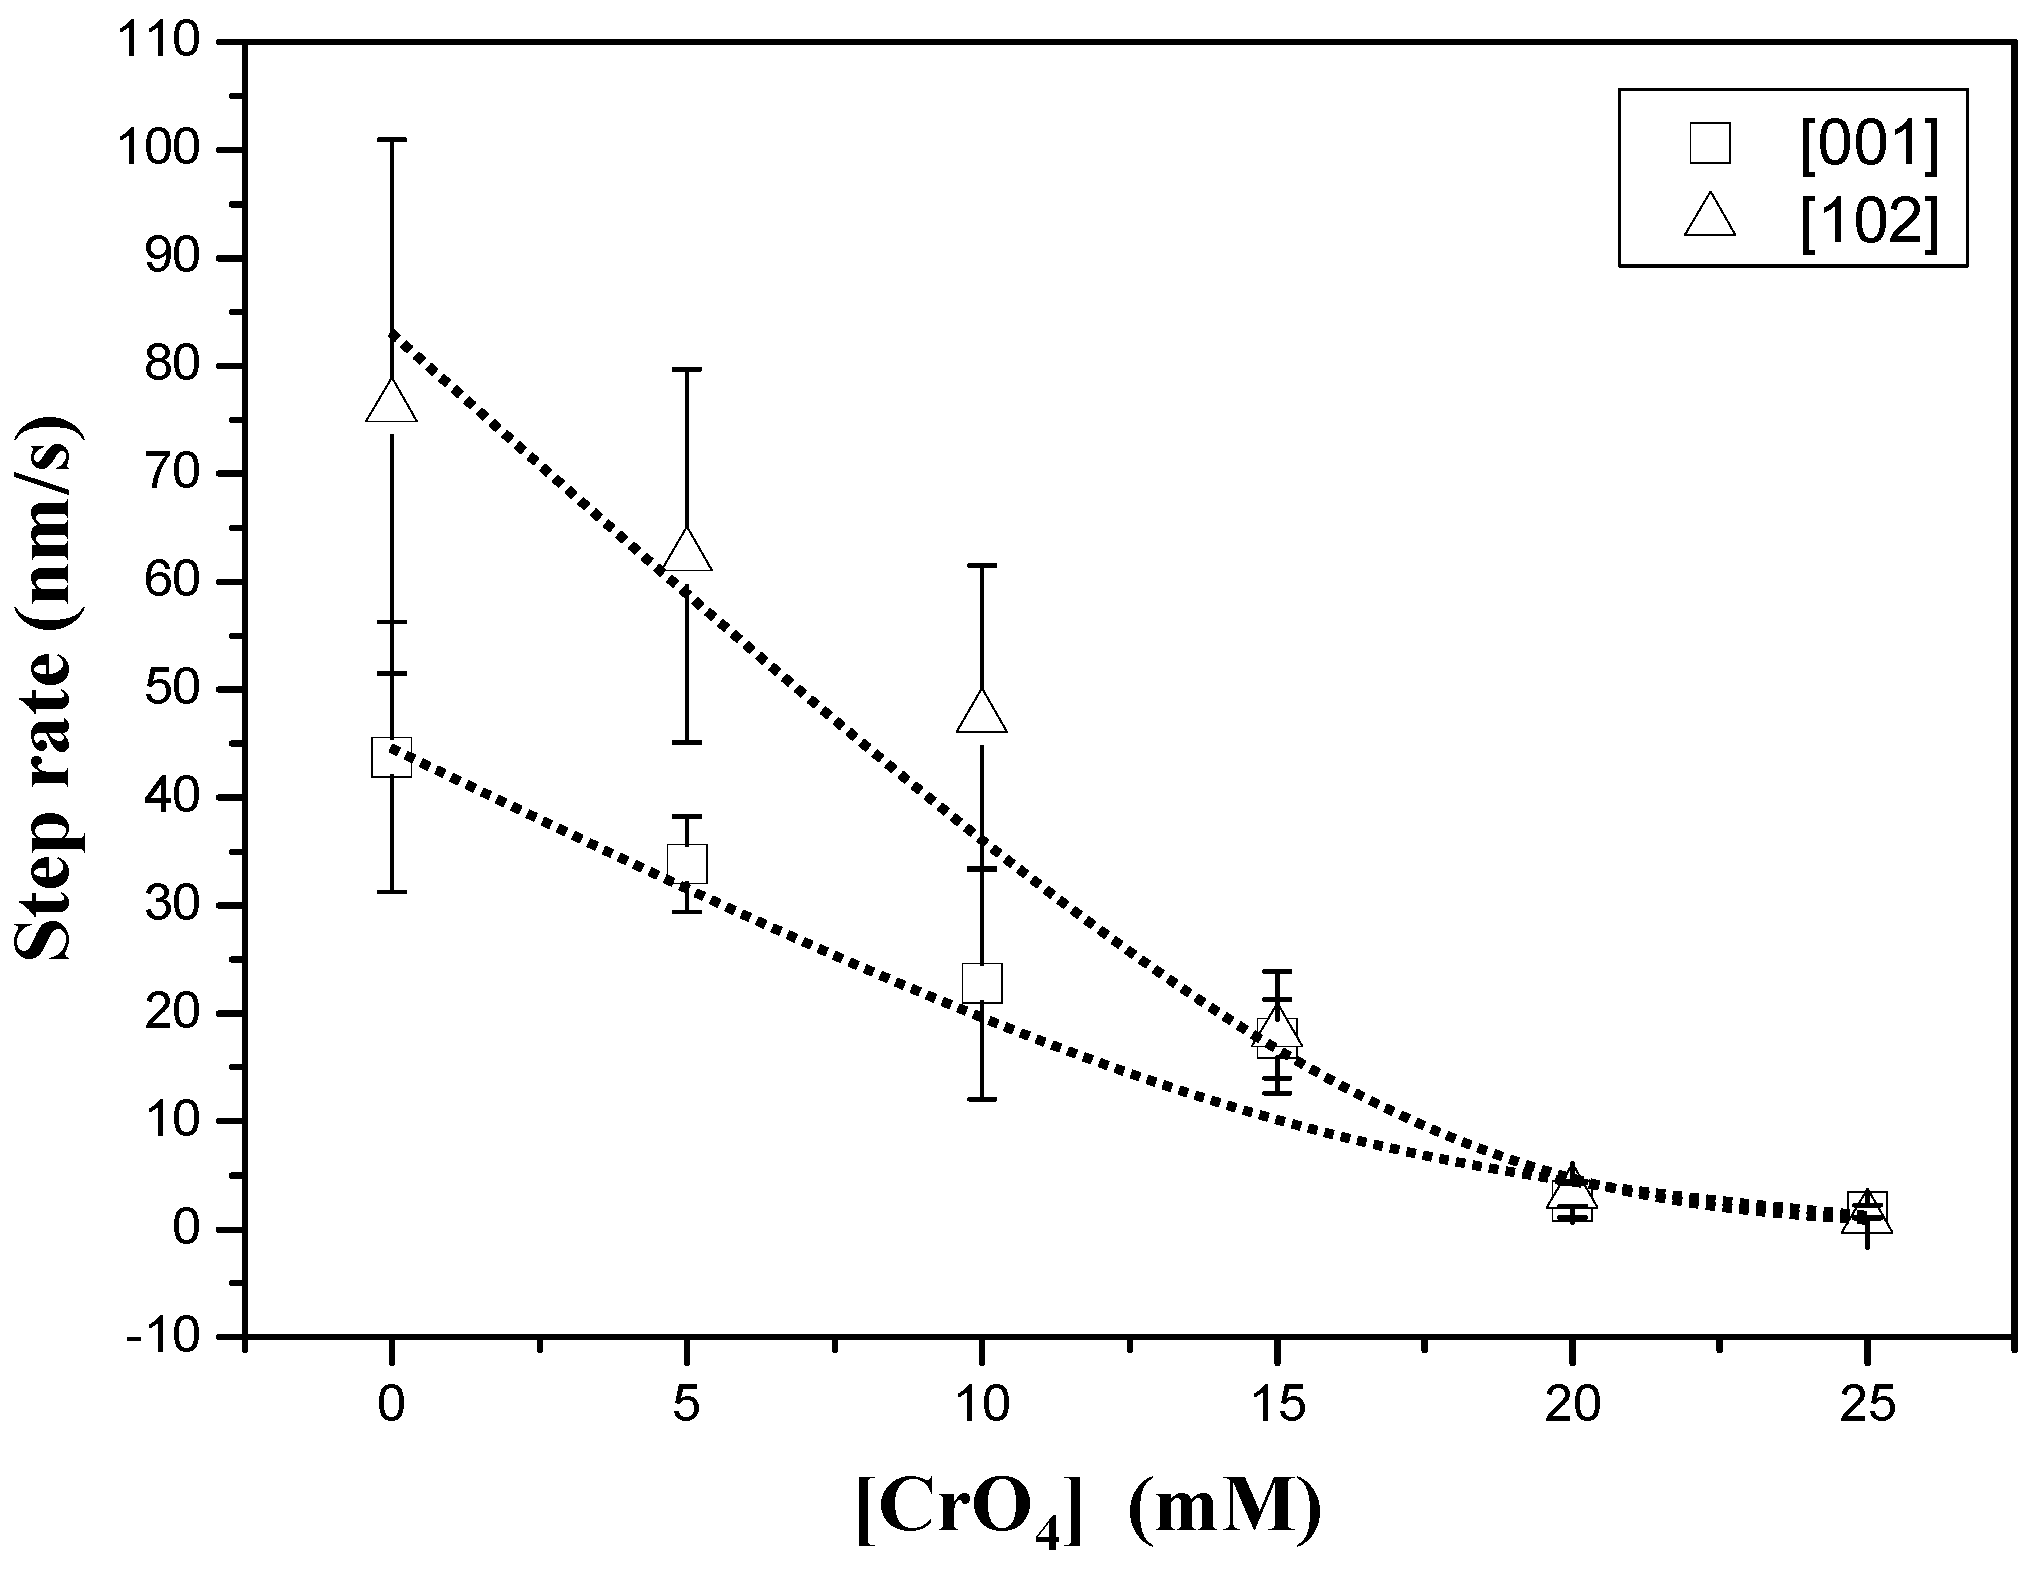
Kinetic information was obtained from measurements of advancement of [001] and [102] steps, which are the most stable ones on gypsum {010} surfaces.
Table 1 list the concentration of reactants used in the experiments (Ca
2+, Na
+, Cl
−, SO
42− and CrO
42−) and the respective supersaturation values. In all cases, the experiments were carried out varying the concentration of chromate in solution and keeping a relatively constant supersaturation value (β
Gp ≈ 1.35). In addition, some experiments using more concentrated and supersaturated solutions ([CrO
42−] = 0.075 M, β
Gp ≈ 2.4) were specifically conducted in order to enhance the effect of Cr(VI) on the growth process and, in this way, to clearly elucidate the inhibitory mechanism operating in this system. Special attention was paid to changes in the growth rate and morphology of the first layers.
2.2. Precipitation Experiments
In addition, sets of experiments were performed by mixing 50 mL of two equi-molar solutions, one of CaCl2 and the other of Na2SO4 in 100 mL polypropylene vessels. The latter solution contained amounts of Na2CrO4 ranging from 0.01 to 1 M. The vessels were immediately sealed after mixing and the solutions were kept at 25 °C and constantly stirred (200 rpm). Each experiment took one hour. In all the cases, the initial supersaturation with respect to gypsum was adjusted to a similar value (βGp ≈ 47), irrespective of the amount of Na2CrO4 in the solution. Three replicates of each experiment were conducted.
Once the solutions of CaCl
2 and Na
2SO
4 (+ Na
2CrO
4) were mixed, the induction period for nucleation (t
w) was determined. This parameter can be defined as the time elapsed between the onset of supersaturation and the first changes in the physical properties of the system due to the formation of a solid phase [
20]. t
w was determined by visually detecting the appearance of turbidity in the bulk of the solution. Although this method commonly yields slightly longer t
w than more sophisticated detection methods, such as conductivity measurements, its accuracy is sufficient for the purposes of this work. Indeed, early classical papers on nucleation kinetics concluded that in the case of nucleation in bulk solution, optical methods and conductivity methods yielded values not significantly different when t
w values were longer than 10 s (see, for example, [
21]). After one hour, solid phases were collected by filtering the solution through a 0.45-μm Millipore membrane under reduced pressure with a vacuum filtration system, washed twice with Milli-Q water and dried at 40 °C. After 24 h, the solids were weighed and prepared for analysis.
In order to investigate the possible incorporation of chromate in the precipitates, they were dissolved in Milli-Q water and analyzed by ICP-OES, Model Spectro Arcos.
X-Ray diffraction (XRD) analyses were carried out in reflection mode by using a Panalytical X’Pert PRO MPD Alfa1 diffractometer (Panalytical B.V., Almelo, The Netherlands) with Cu Kα radiation (λ = 1.54056 Å) from a Ge (111) primary beam monochromator and a fast X’Celerator detector. Diffractograms were acquired in continuous-scan mode with 50-s preset time and steps of 0.0084°. X-ray source conditions were 45 kV and 40 mA with 2200 W of power. Phase identification was done by means of X’Pert HighScore Plus (Panalytical B.V. software) in combination with ICDD PDF-4 database (International Center for Diffraction Data, Swarthmore, PA, USA). In addition, profile-matching refinement of the profile was done to study the possible variation of cell parameters due to the incorporation of chromate into the crystal structure. The lattice parameters were refined as monoclinic by the Le Bail method [
22] using FullProf software [
23]. Refinements were started using the
A2/
a space group and structure parameters derived from Comodi
et al. [
24]. Calculations were firstly performed for blank samples (grown in the absence of chromate) and the resulting data were used as starting point for subsequent refinements. In all cases, the background was fitted with a polynomial function with 6 coefficients, and peak shapes were modeled by means of a standard Thompson-Cox-Hasting pseudo-Voigt function [
25] modified to incorporate asymmetry from axial divergence [
26]. After several cycles of least-squares minimizations, the profile fitting converged to R
p < 14, R
wp < 24 and χ
2 < 2.4.
Selected samples of the precipitates were dried and coated with a thin Au layer for further observation by means of field emission scanning electron microscopy (FE-SEM; JSM-6335F, JEOL Ltd., Tokyo, Japan). Images of the gypsum particles were taken at 15 kV accelerating voltage.
4. Discussion
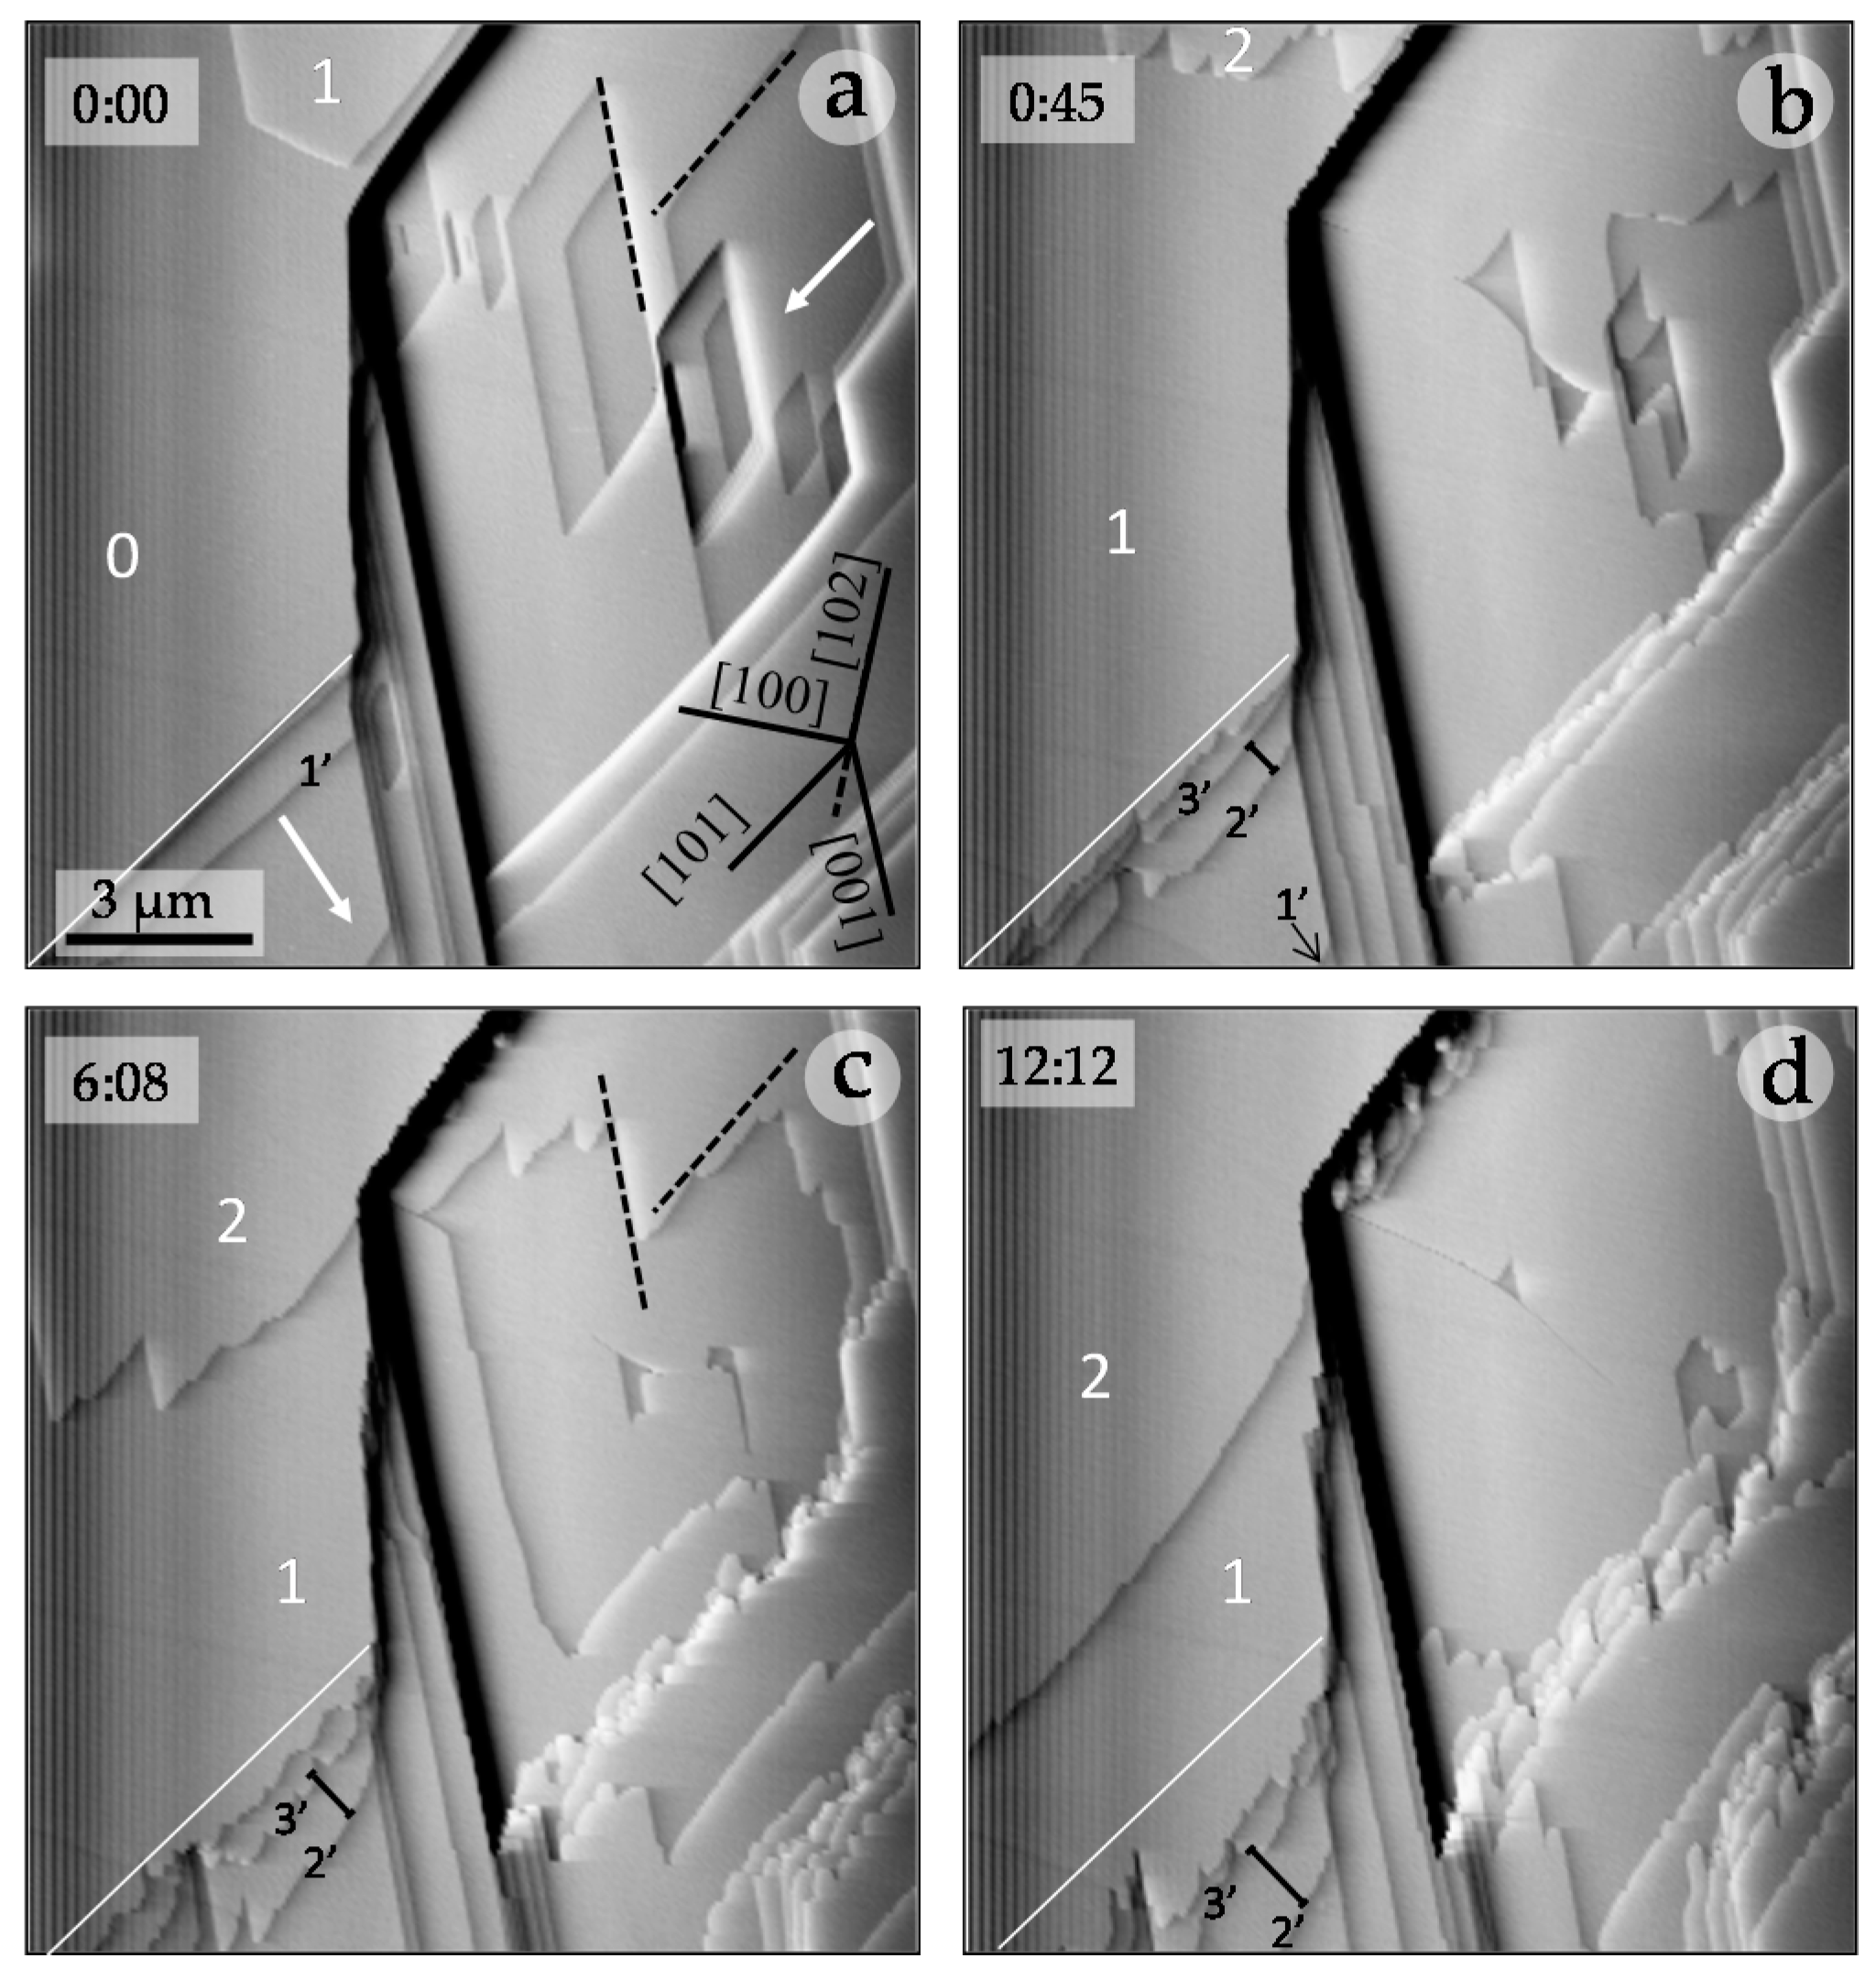
In situ AFM observations of the growth of gypsum {010} surfaces in the presence of chromate unequivocally show that this anion inhibits the growth of gypsum {010} surfaces, affecting not only the step advancement rate but also the morphology of the growing steps. These observations can be interpreted in terms of the so-called “template effect”, as defined by Astilleros
et al. [
2,
8,
9,
10,
11], who observed a similar inhibition-incorporation phenomenon during the growth of calcite surfaces in contact with supersaturated solutions bearing additives like Mn, Ba, Mg or Sr. The anomalous growth behavior of gypsum {010} surfaces and the inhibiting effect on gypsum growth caused by the presence of chromate can only be satisfactorily explained by assuming the incorporation of this pollutant into the structure of this mineral phase. Indeed, the subtle variation of the color shade of the solids obtained from precipitation experiments can be regarded as a first indication that chromate is probably incorporated into the crystal structure of gypsum.
In the experiments carried out, such a sorption mechanism involves the trapping of chromate ions into the structure of gypsum during the precipitation of this phase, according to the reaction:
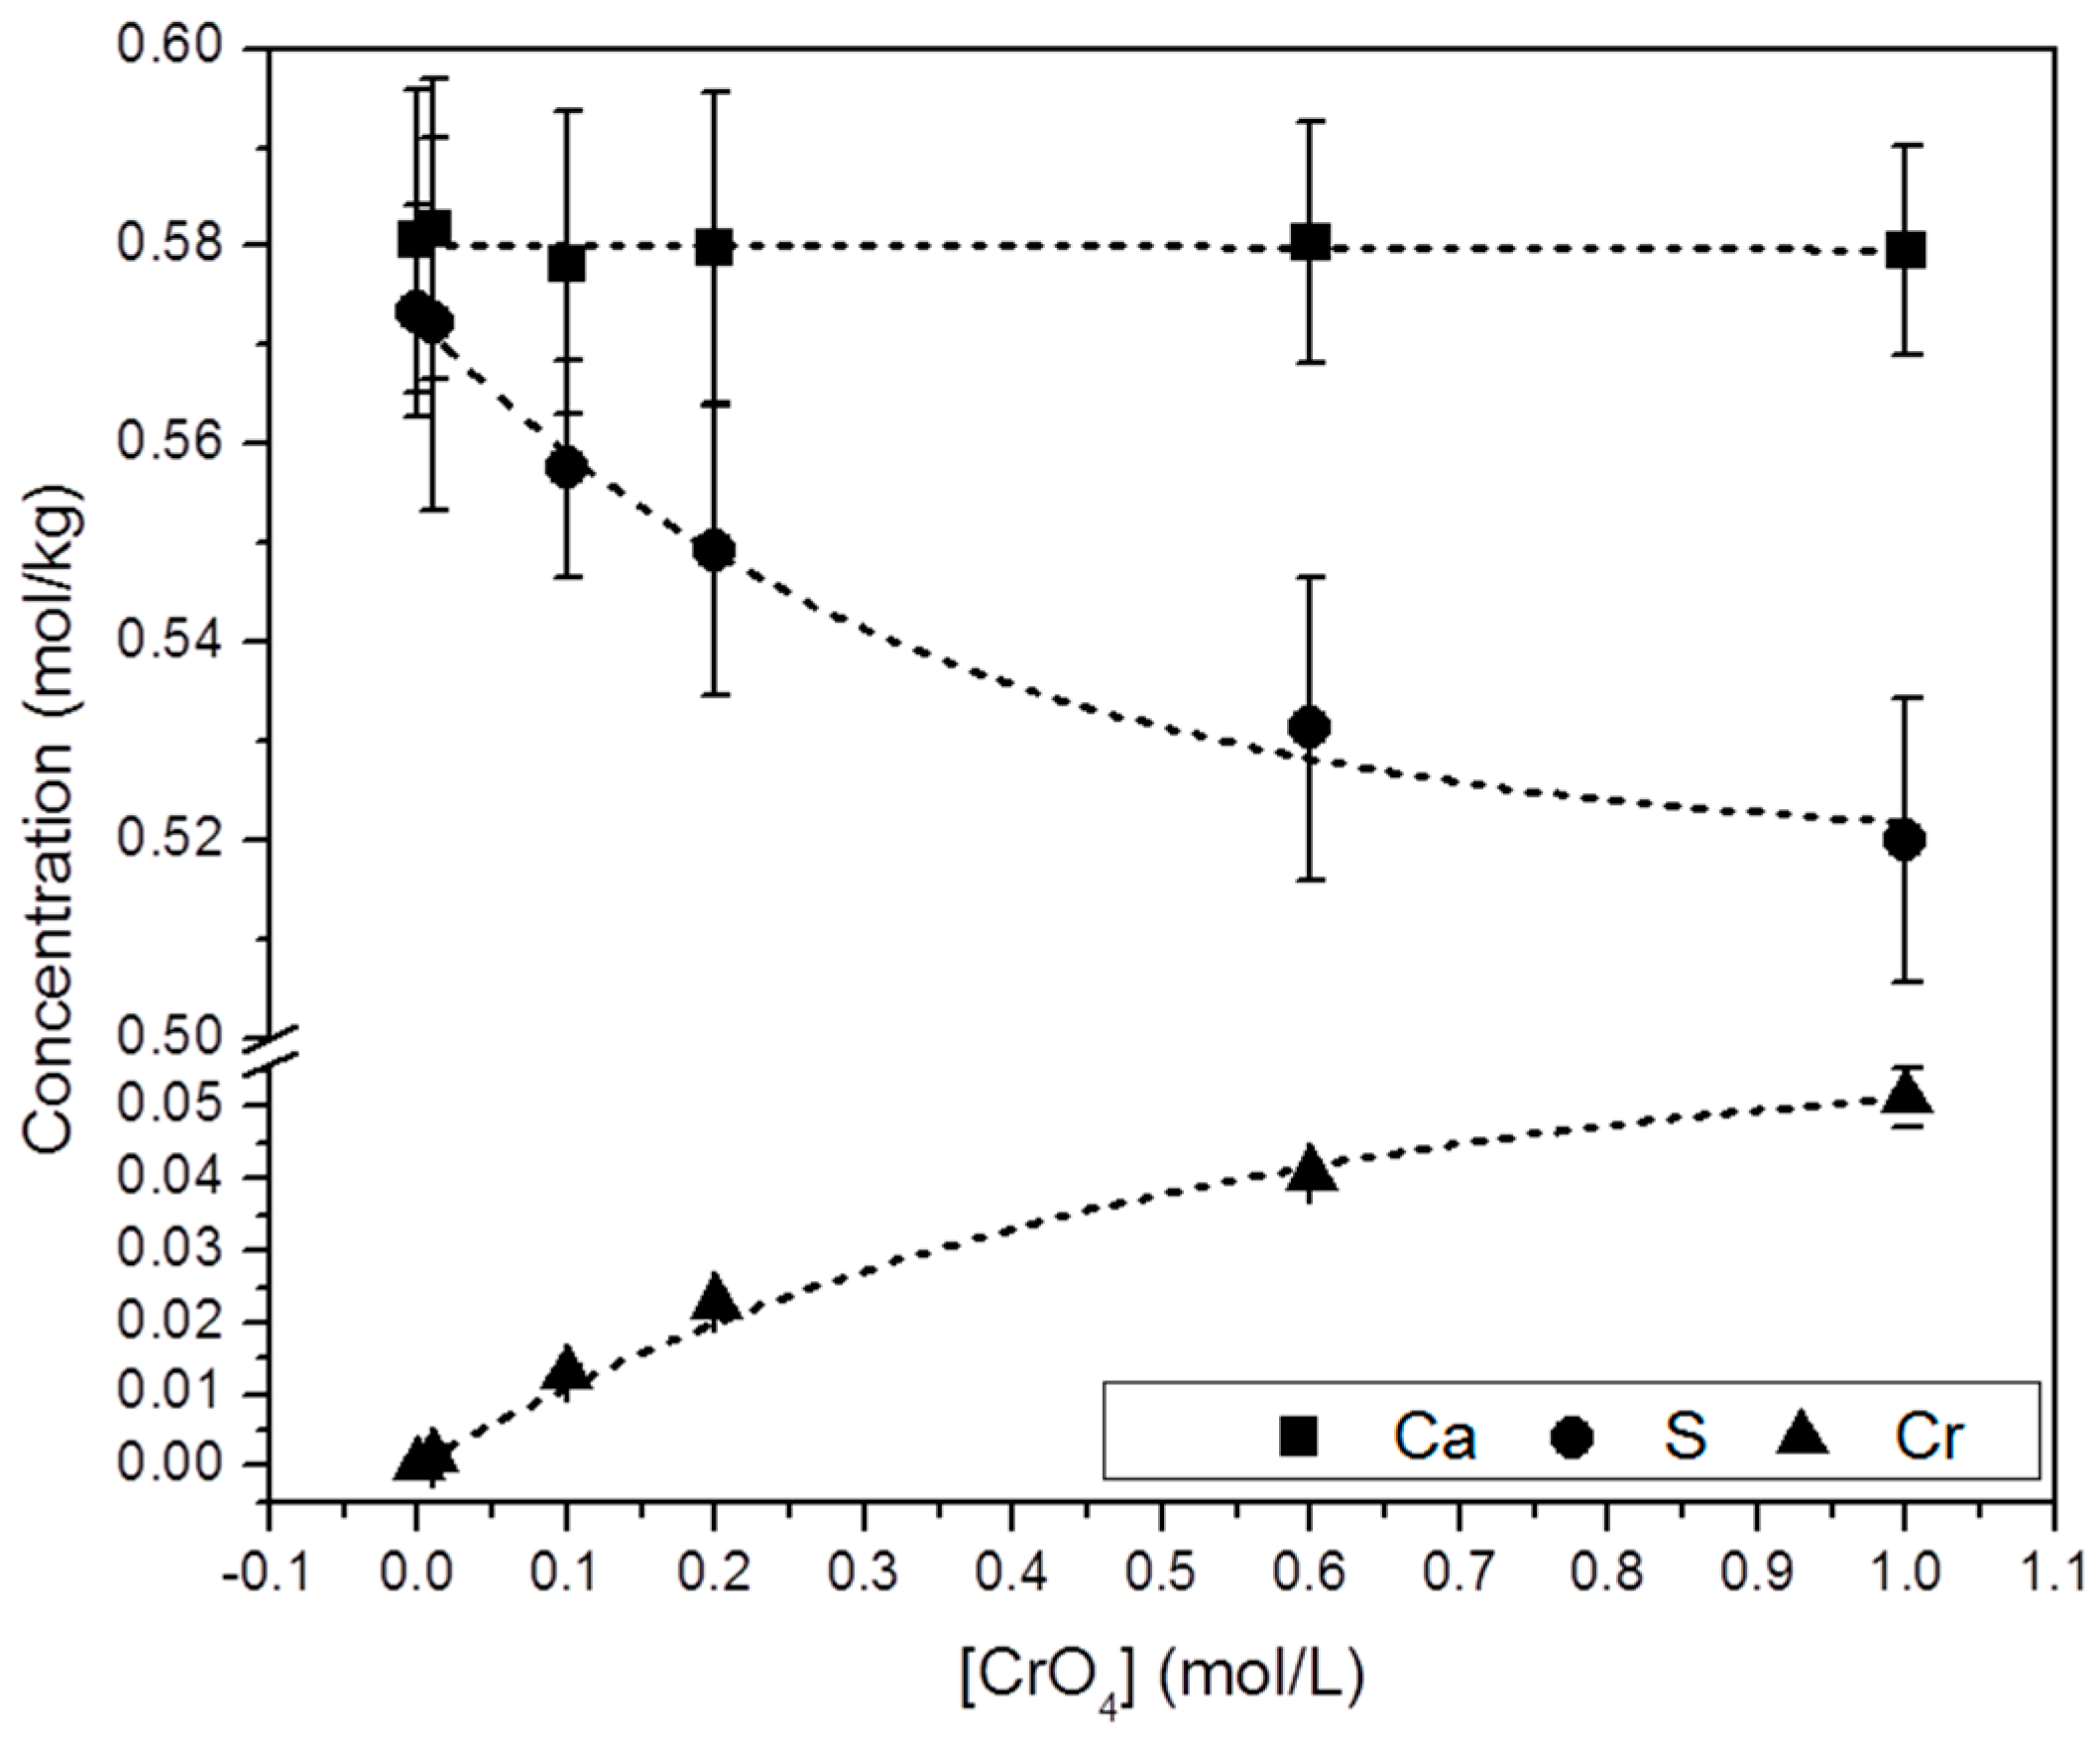
As highlighted in
Figure 5, the net increase of [Cr]
s (~0.51 mol/kg) virtually equals the net decrease in [S]
s (~0.53 mol/kg). Moreover, the total molalities of calcium and sulfate plus chromate are similar, clearly pointing to the existence of a substitutional solid solution between two end-members, CaSO
4·2H
2O and a hypothetical, isostructural with gypsum CaCrO
4·2H
2O. In such a solid solution, CrO
42− would substitute SO
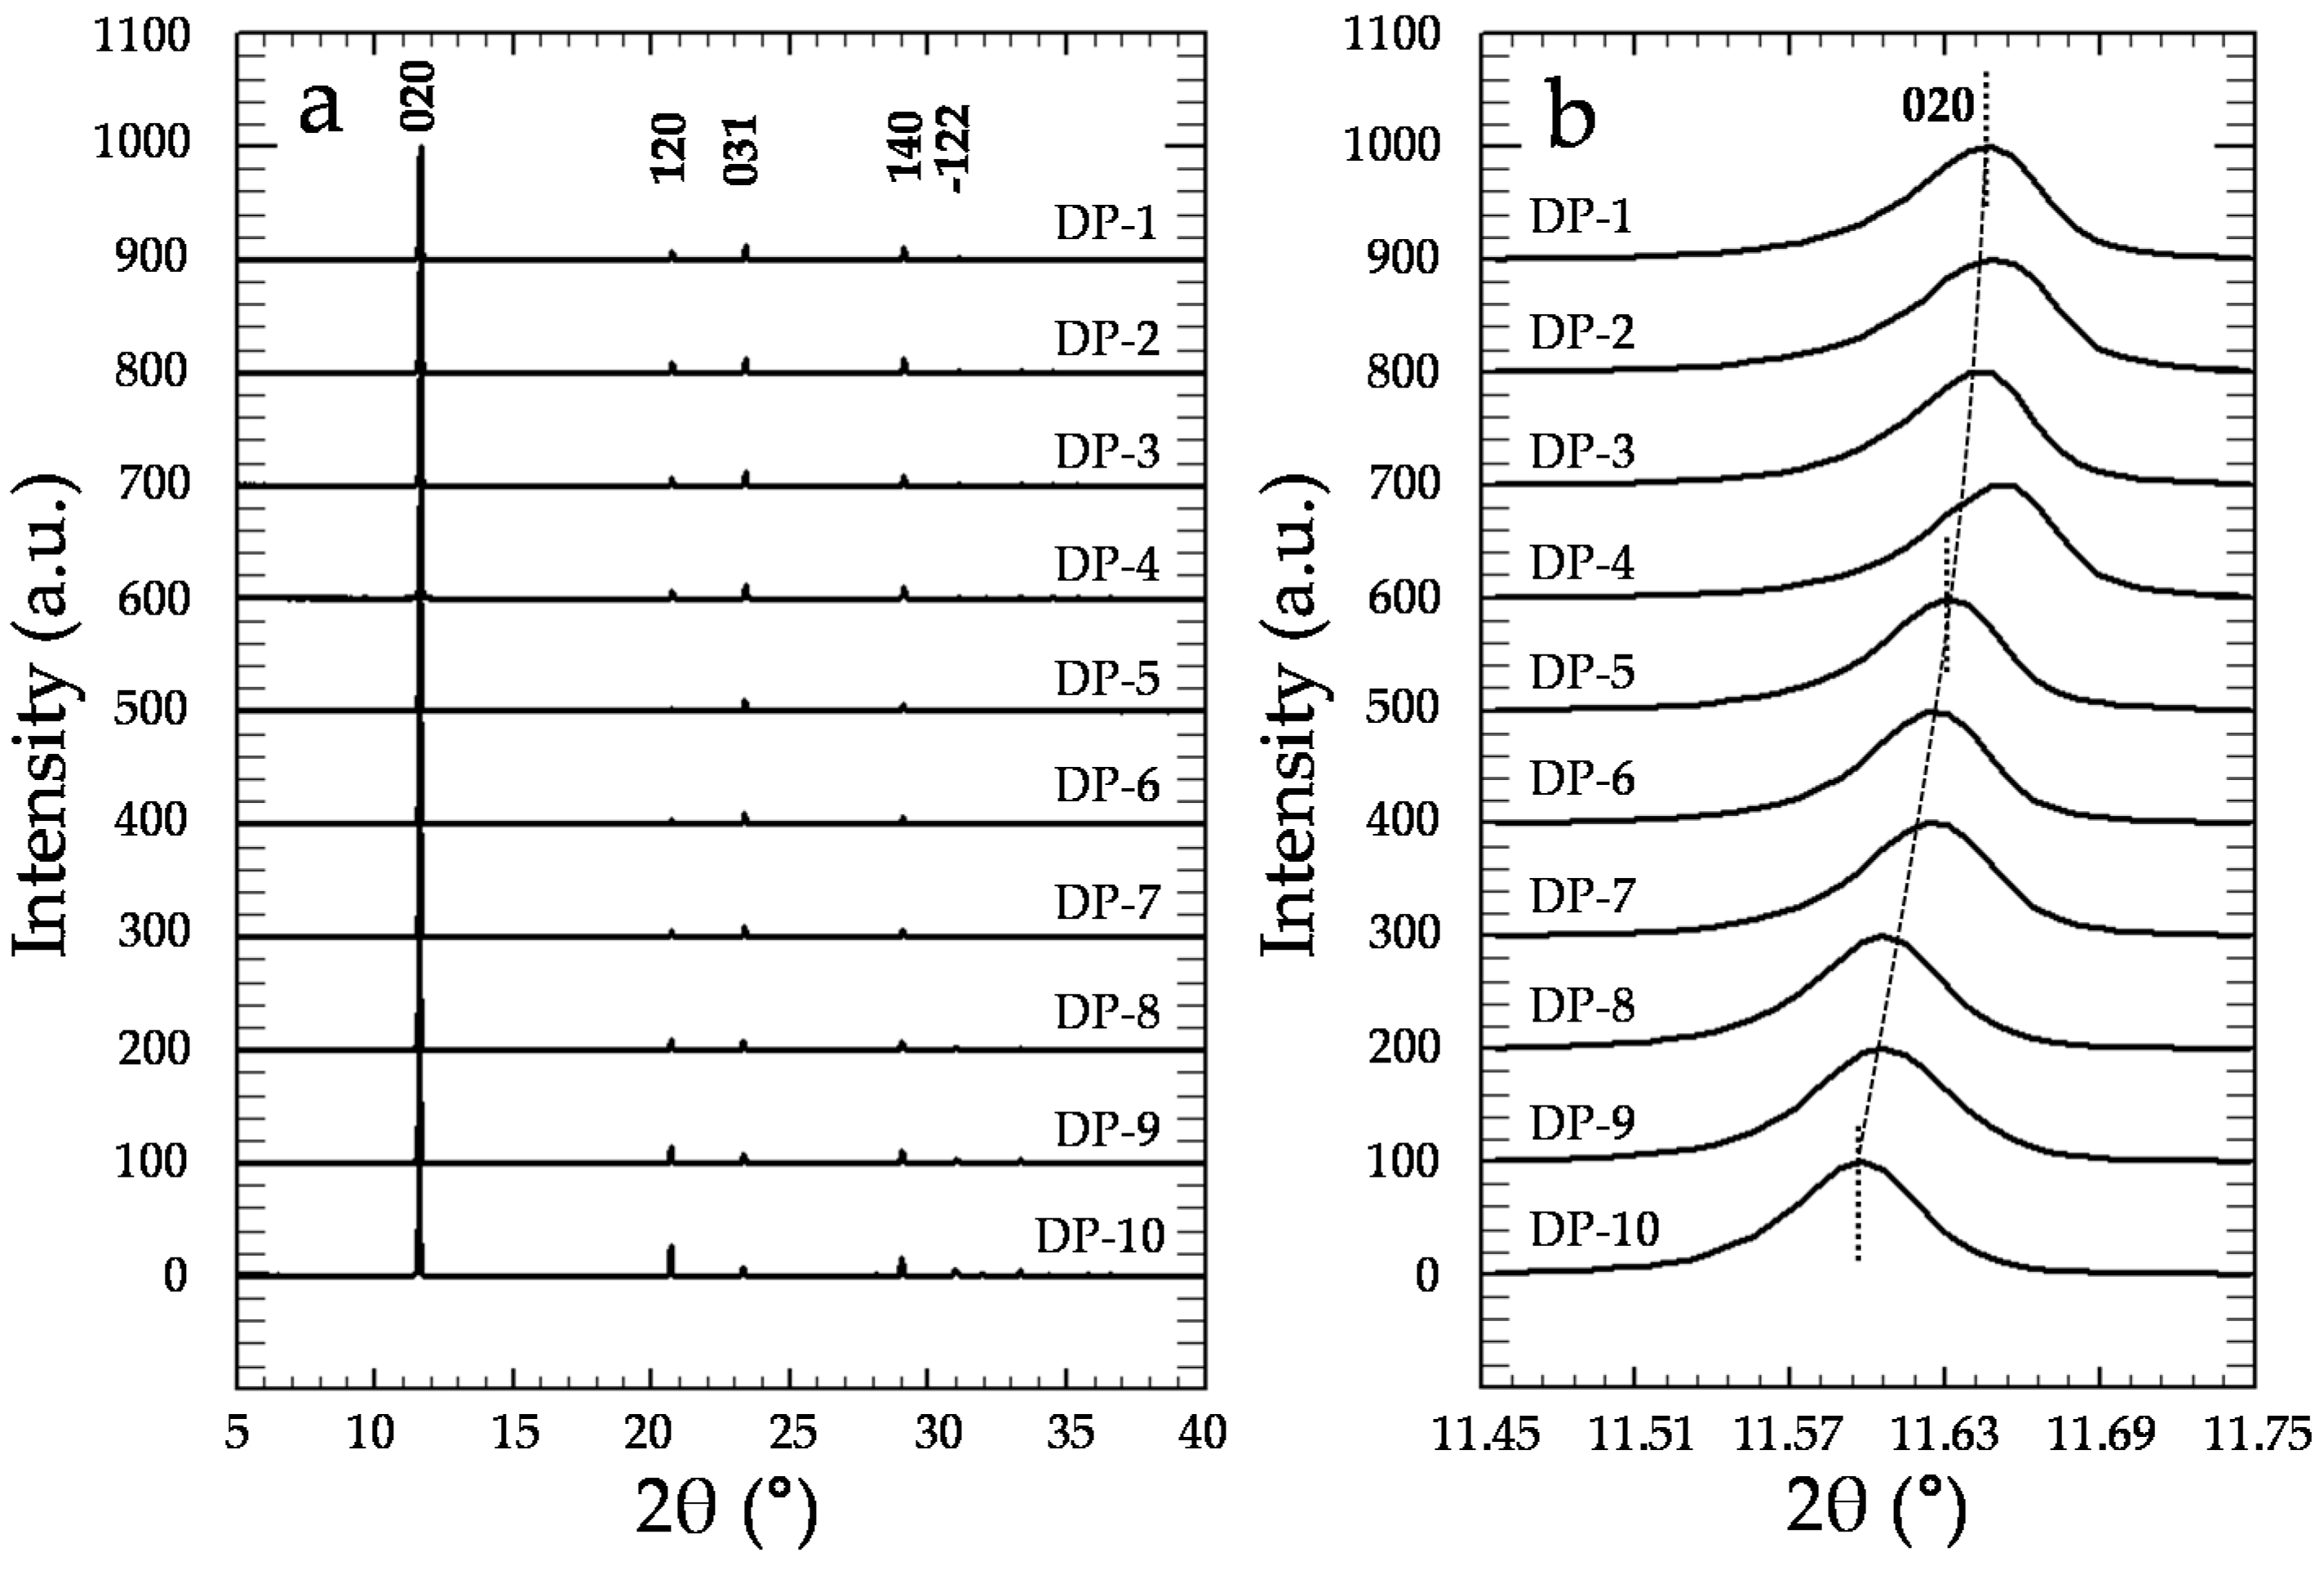
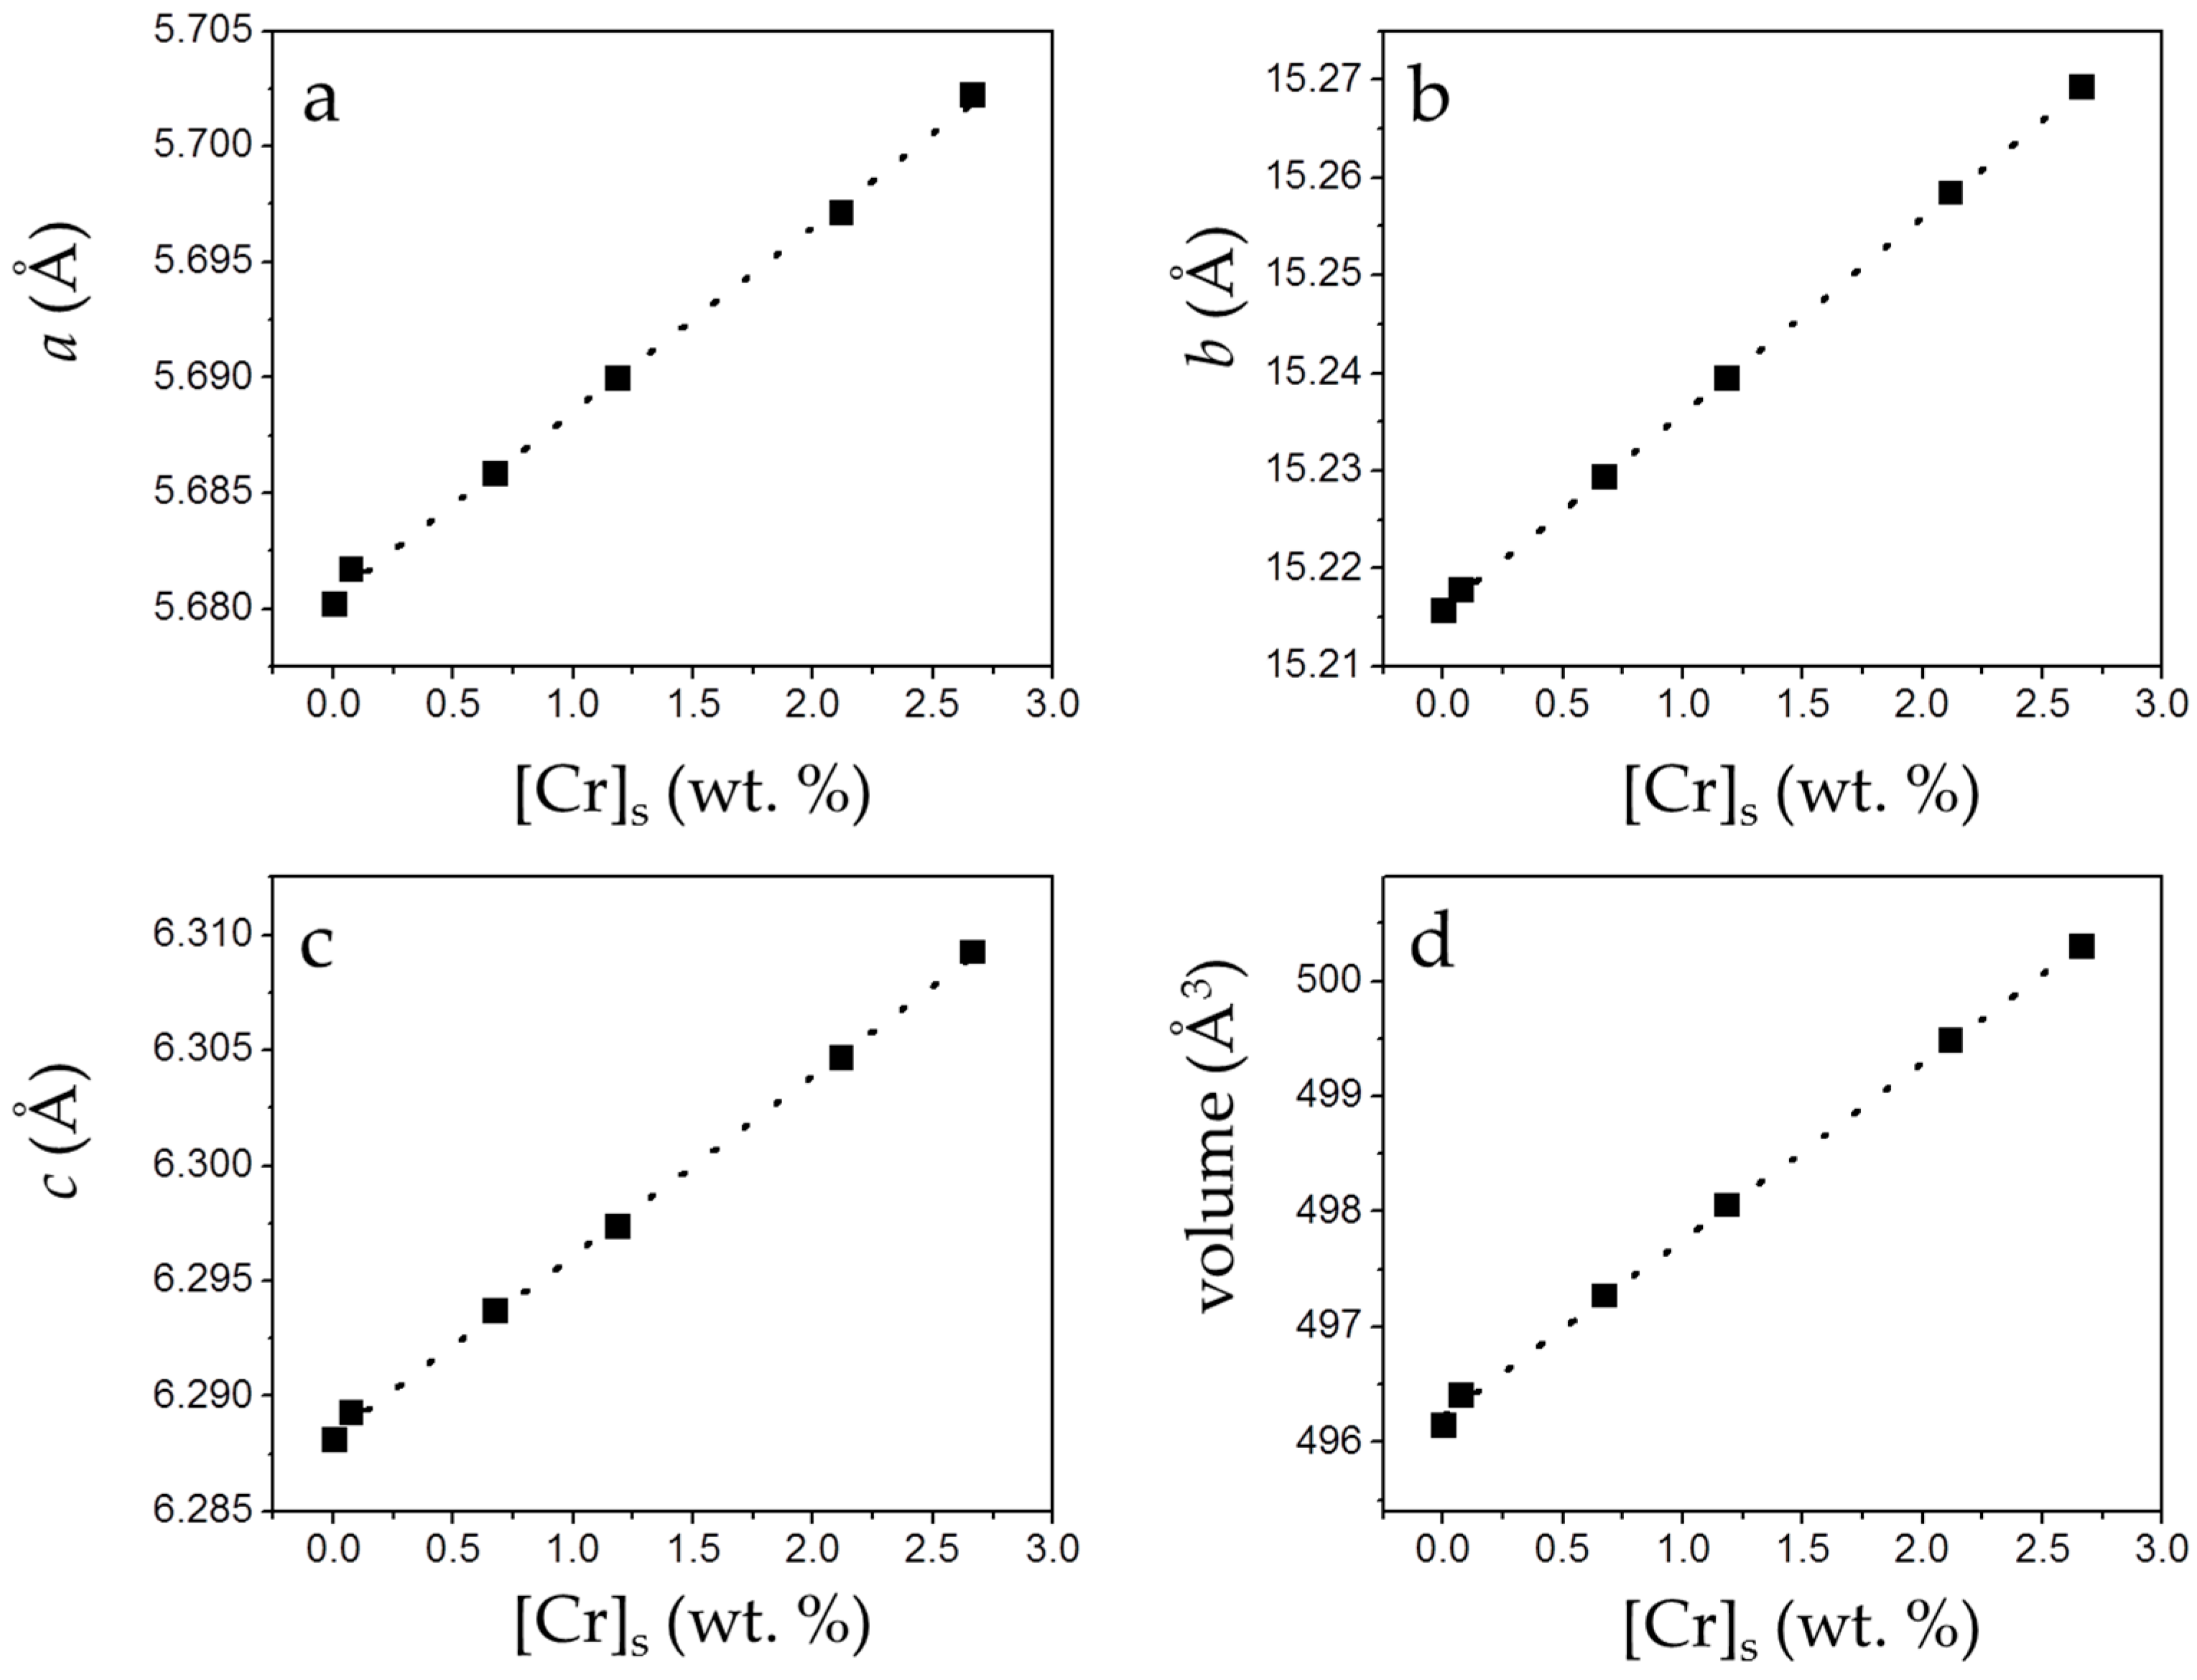
42− in the layered structure of gypsum. This assumption is additionally supported by the results of the XRD analysis. In all isomorphic substitutions, the difference in size between the substituting ions leads to an increase of the unit cell parameters as the concentration of the larger ion (chromate in the present case) increases in the crystal structure [
28,
29]. This is indirectly reflected by the shift towards lower 2θ values observed in specific, relevant peaks in the diffraction diagrams of the precipitates as [Cr]
s in the solid increases (
Figure 6b and
Table S1). Le Bail refinements also reveal the enlargement of the unit cell parameters and the expansion of the unit cell volume, which are most probably a consequence of the substitution of SO
42− by CrO
42−. The plot of the refined cell parameters (
Figure 7) shows a linear correlation between cell parameters and the amount of chromium present in the crystal lattice, in agreement with Vegard’s Law [
30].
When one anion substitutes another in a crystal structure, the amount of substitution depends to a great extent on the size and shape of the involved anionic groups. CrO
42− and SO
42− share a tetrahedron-like geometry and show a similar size. The isomorphic substitution of sulfate and chromate is not uncommon in mineral phases. For instance, the solid solution between barite (BaSO
4) and BaCrO
4 is assumed to be ideal [
31], which means that both phases are end-members of a complete solid solution [
32]. Other sulfate minerals like ettringite [
17,
33] or jarosite [
34] can also incorporate small amounts of CrO
42− substituting SO
42−.
Although the similarity in the size and shape of two anions points to their isomorphic subtitution in a mineral structure as being possible, the degree of substitution and, therefore, the ability of a certain mineral to trap a foreign element via coprecipitation is the result of a variety of physico-chemical factors. One key factor is the difference of solubility between the end-members of the solid solution. In solid solution-aqueous solution (SS-AS) systems, distribution coefficients, D, are frequently used to express the partitioning of an ion between an aqueous solution and a solid phase. In the system considered here, the partition coefficient of (CrO
42−) between the aqueous solution and the solid phase Ca(SO
4(1−x)CrO
4(x))·2H
2O can be defined by:
where
and
are the mole fractions of the end-members in the solid phase and
a(CrO
42−) is the activity of chromate in the aqueous solution.
At thermodynamic equilibrium and assuming an ideal solid solution, the partition coefficient (Deq) is defined by the ratio between the solubility product of gypsum and a calcium chromate dihydrate phase, isoestructural with the gypsum structure. Although the solubility of this phase is unknown, it should be necessarily higher than that of the stable form of the calcium chromate dihydrate, which is orthorhombic and over three orders of magnitude more soluble than gypsum. By considering this solubility, a maximum distribution coefficient Deq < 0.001 can be estimated. Such a small partition coefficient means that the tendency of the CrO42- ion to incorporate into the solid phase during the precipitation of a Ca(SO4(1−x)CrO4(x))·2H2O solid solution is extremely low.
On the other hand, experimental studies have shown that the distribution coefficient also depends on kinetic factors, such as supersaturation levels, and that the “effective” distribution coefficients can largely differ from the equilibrium values. As has been profusely shown by Prieto
et al. [
35,
36,
37], at high supersaturations there is less chance for thermodynamically based selectivity effects to be exerted. For instance, Fernández-González
et al. [
32] studied the formation of the solid solution between BaSO
4 and BaCrO
4, showing that at high levels of supersaturation with respect to the less soluble end-member BaSO
4, the effective distribution coefficients (D
eff) for CrO
42− reached values very close to 1, even though the D
eq = 0.42. In the system under consideration here the D
eff for CrO
42− has a value < 0.05. Although in this case this parameter is increased due to the effect of the high supersaturations used, a very marked preferential partitioning of SO
42− towards the solid phase still occurs.
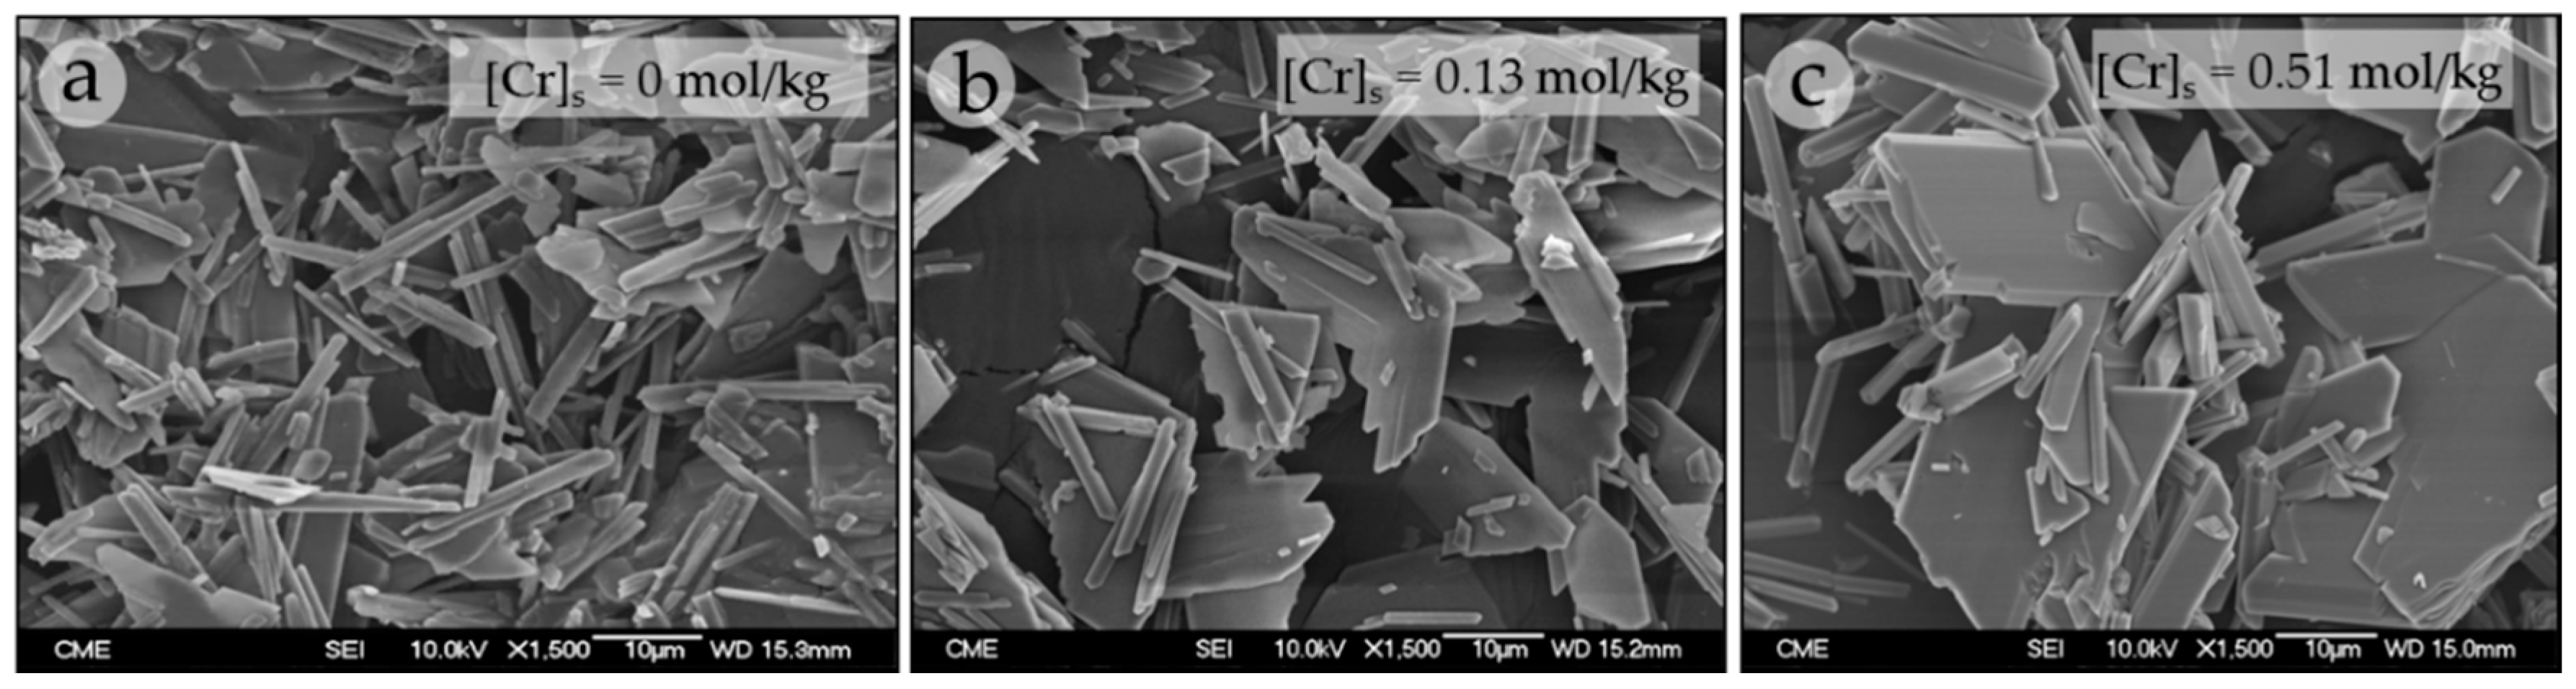
The results obtained in the precipitation experiments indicate that the presence of chromate in the aqueous solution exerts an important role in the precipitation process of gypsum. This effect is revealed by both the lengthening of t
w and a decrease of the amount of recovered precipitate as [CrO
42−]
aq increases. These results clearly point to an inhibitory effect of chromate on the nucleation of gypsum. This effect is also supported by the SEM images, which clearly reveal changes in both size and habit of the gypsum crystals. The larger size of the crystals formed in the presence of increasing amounts of chromate is consistent with moderate kinetics of nucleation which, in turn, can only be ascribed to an inhibitory effect of this anion, since the supersaturation with respect to gypsum was similar in all the experiments. Indeed, according to the nucleation theory ([
20], and references therein), smaller and numerous crystals are frequently the result of catastrophic nucleation events, whereas scarcer and larger crystals are formed under nucleation-restricted conditions. On the other hand, changes in crystal habit are also frequently explained by a selective sorption of the additive on certain faces of a crystal. When this is the case, the inhibitory effect is more intense on those specific faces, which will grow more slowly. The resulting effect is the modification of the crystal habit. In the gypsum crystals, the transition from crystals with a needle-like habit elongated along the c-axis to plate-like crystals with {010} as the dominant form could be tentatively explained by a selective sorption of CrO
42− on specific gypsum surfaces.
Finally, the results demonstrate that although gypsum can incorporate chromate into its structure, the substitution of SO
42− by CrO
42− in the gypsum structure detected in the precipitates reaches a maximum value as low as ~8%, even under the most favorable physicochemical conditions for CrO
42− incorporation (high supersaturation with respect to gypsum and high concentration of chromate in the solution). Such conditions are far from those prevailing in natural environments and, consequently, coprecipitation with gypsum cannot be regarded as an effective method for the removal of chromate from soil and groundwaters. Other sulfate minerals like barite have proved to be much more effective at chromate sequestration. This said, it is important to keep in mind that gypsum is a very abundant a mineral, at any rate much more abundant than barite, and as pointed out by Prieto
et al. (2013) [
37] for aqueous solution-solid solution reactions, the equilibrium end-point depends on the specific initial amounts of solid and liquid as well as the solubility of the respective end-members and the degree of ideality of the solid solution.


