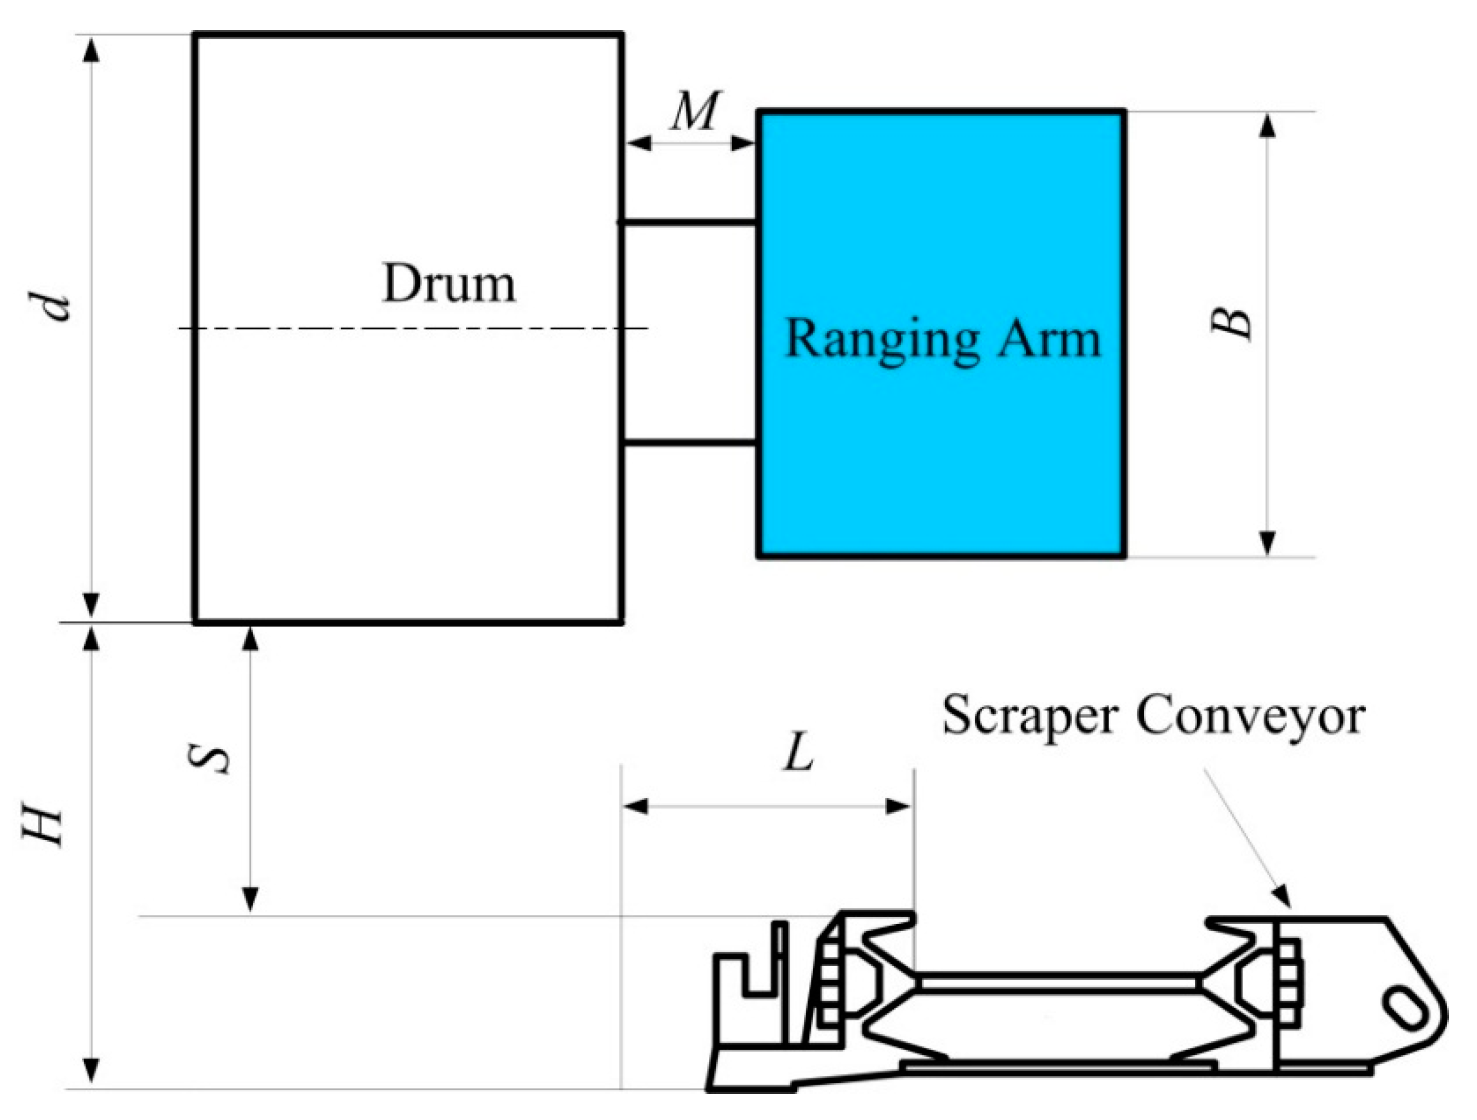
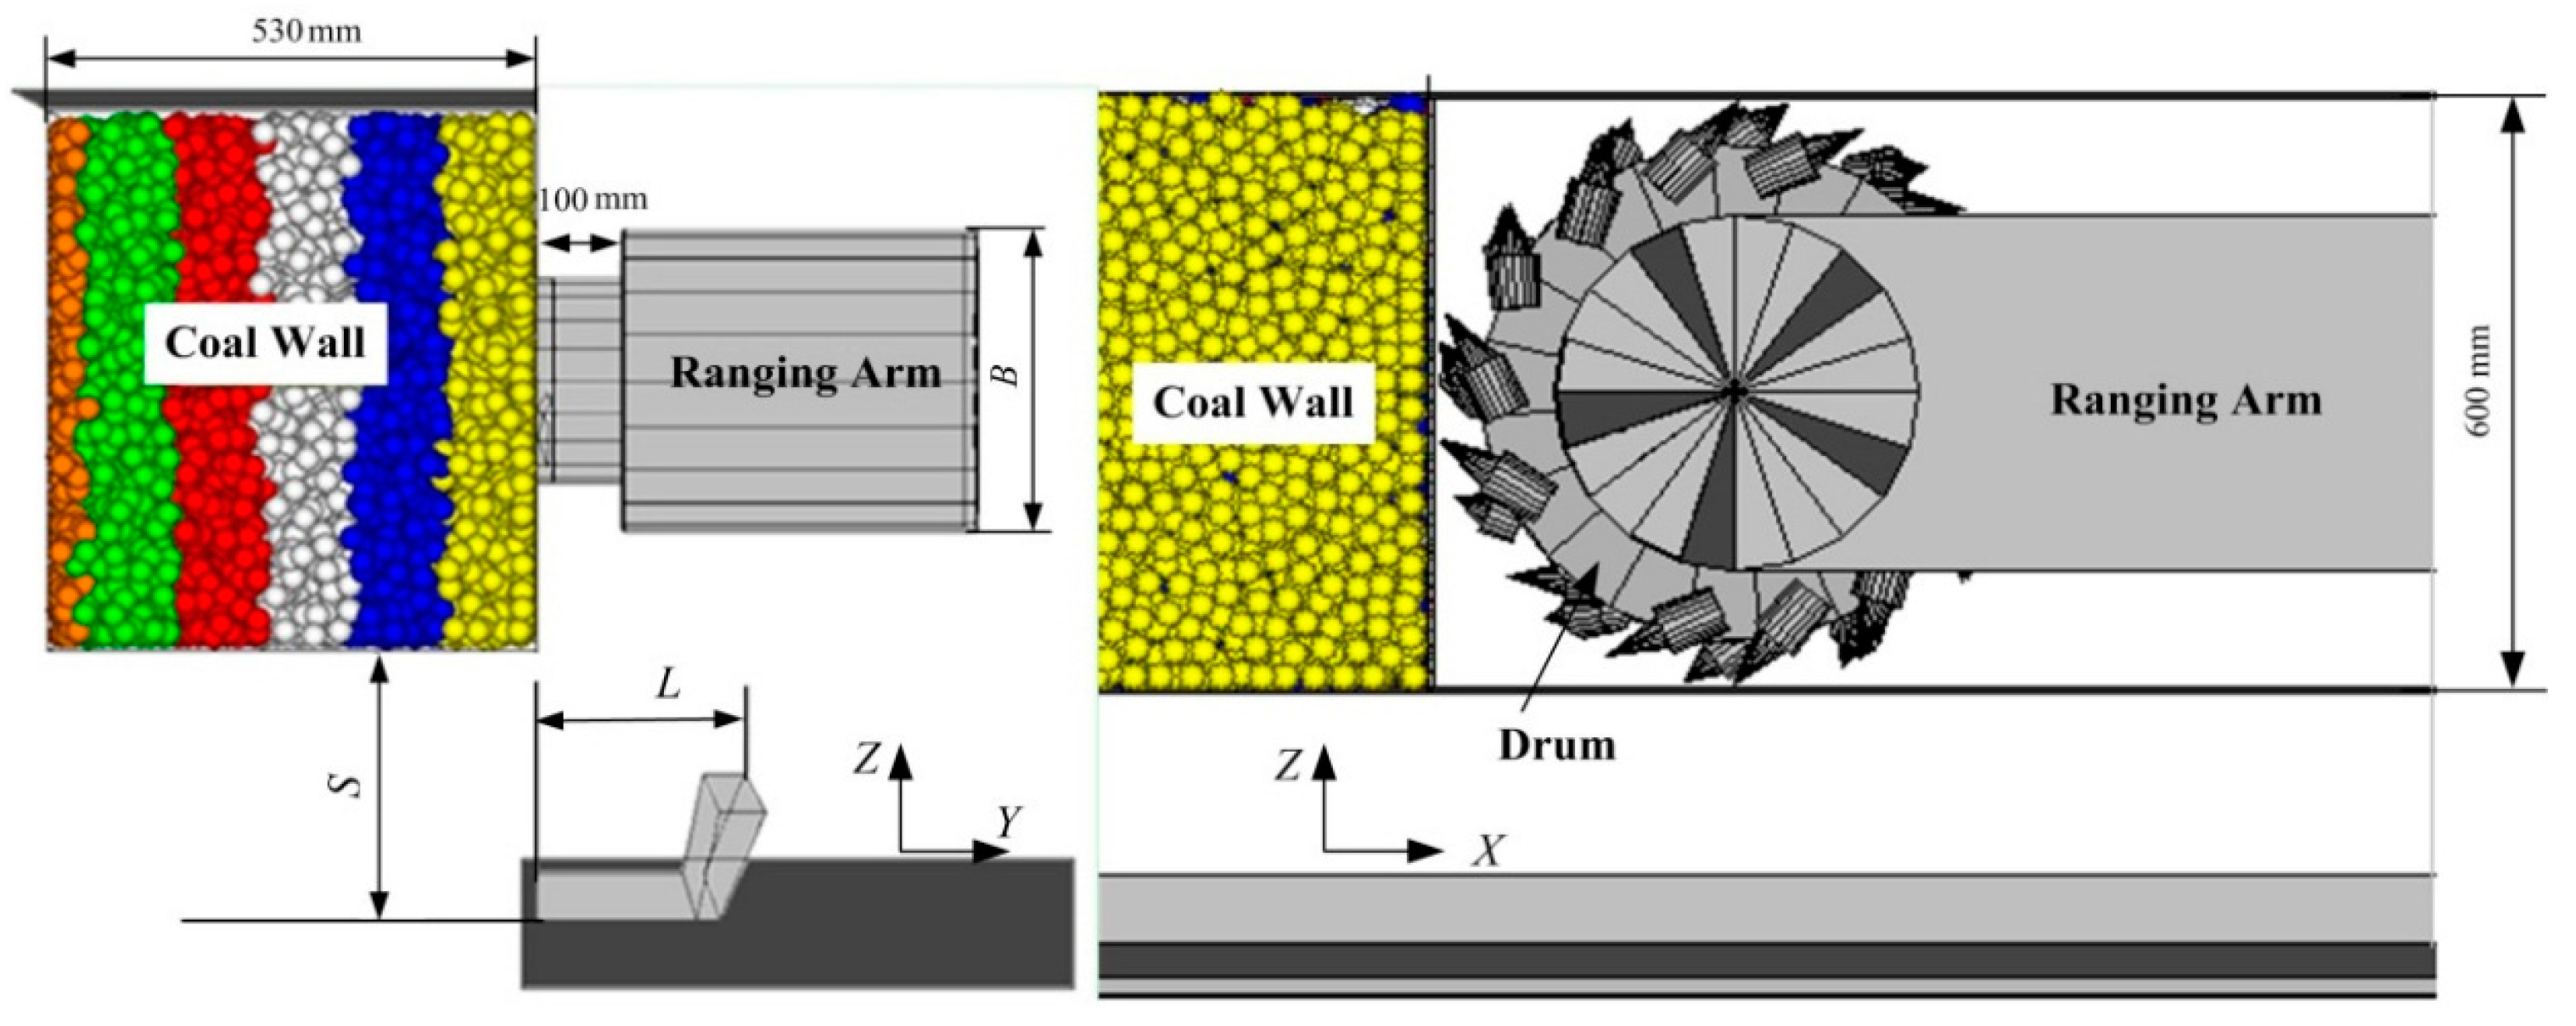
4.1. Effects of the Distance Between the Coal Wall and the Scraper Conveyor Middle Groove on the Drum Coal Loading Performance
To investigate the conveying performance influenced by the height of the drum bottom
S in the middle groove of the scraper conveyor, the loading rate was simulated under different rotation speed and pulling speed combinations. The
S values were −120, −60, 0, 60, 120 and 180 mm. In the simulations,
B and
L are 350 and 250 mm, respectively.
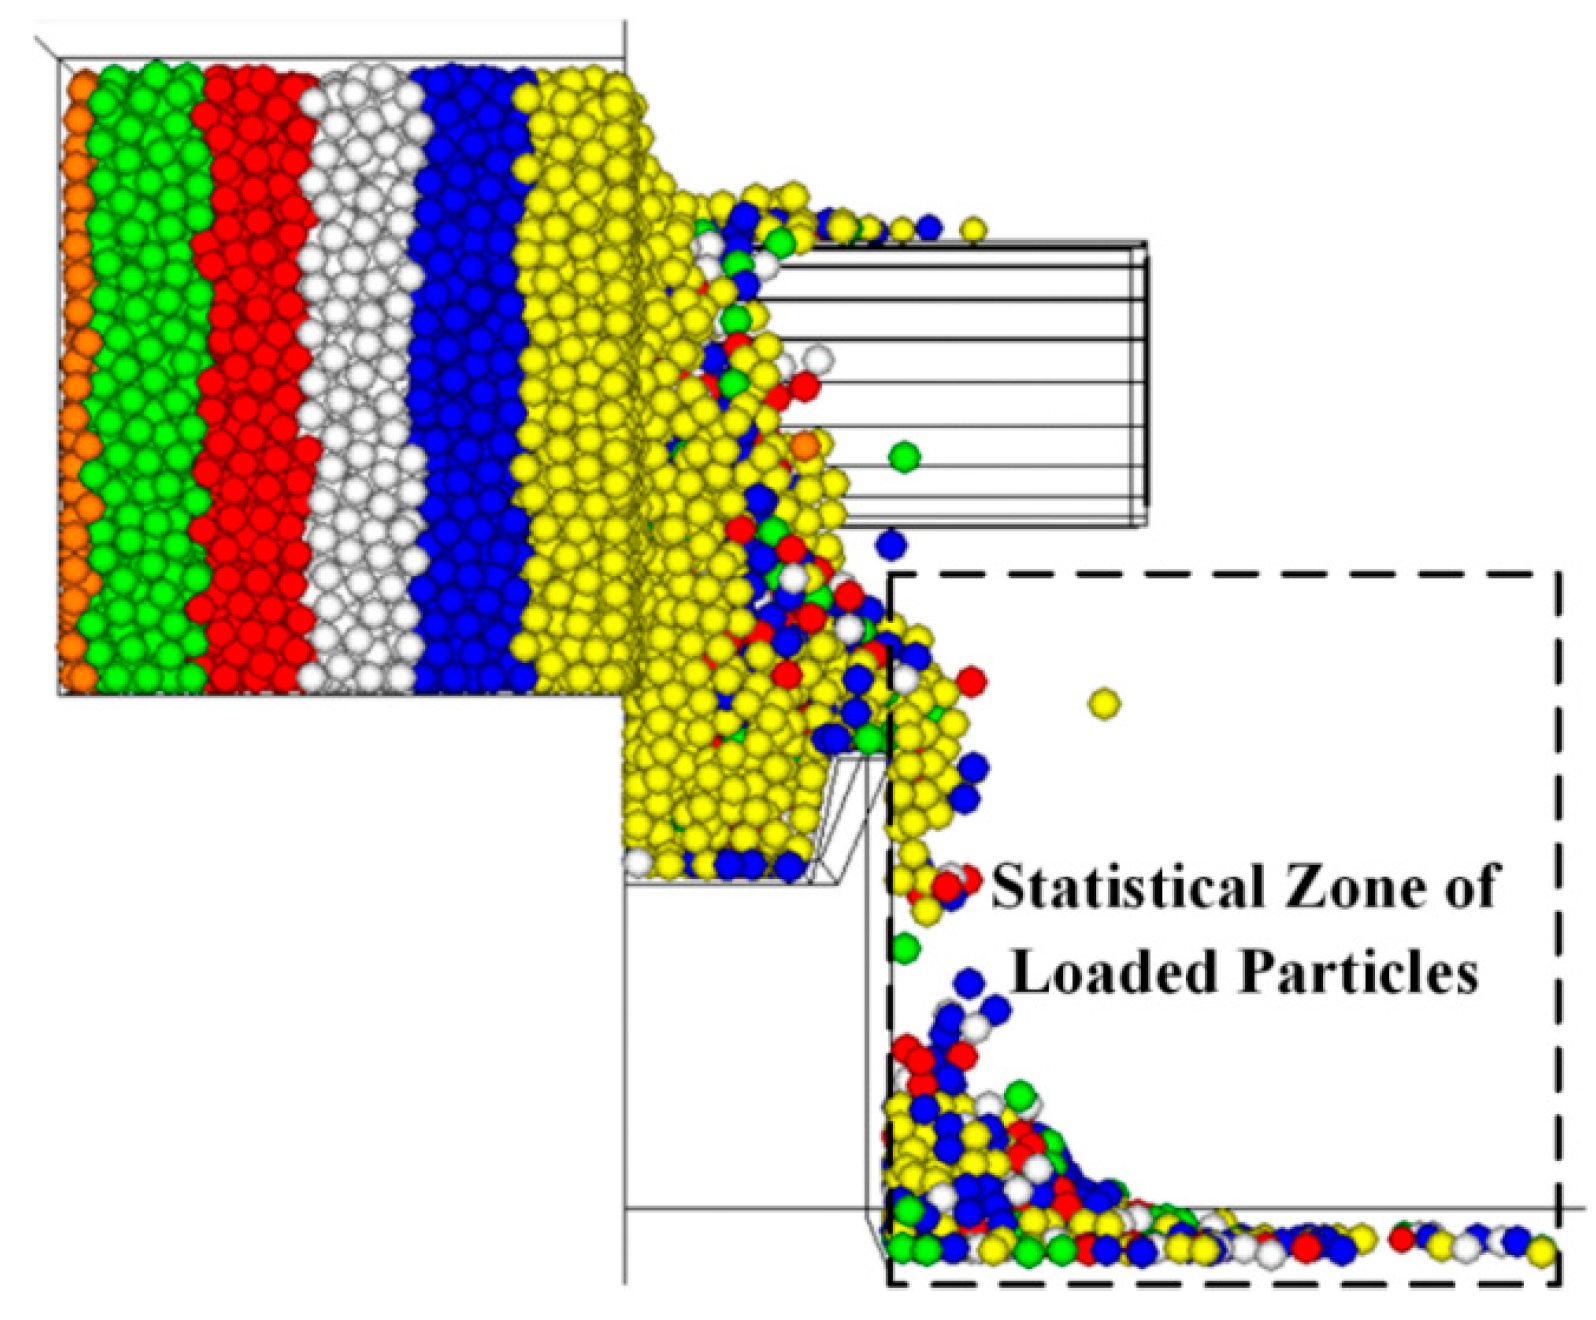
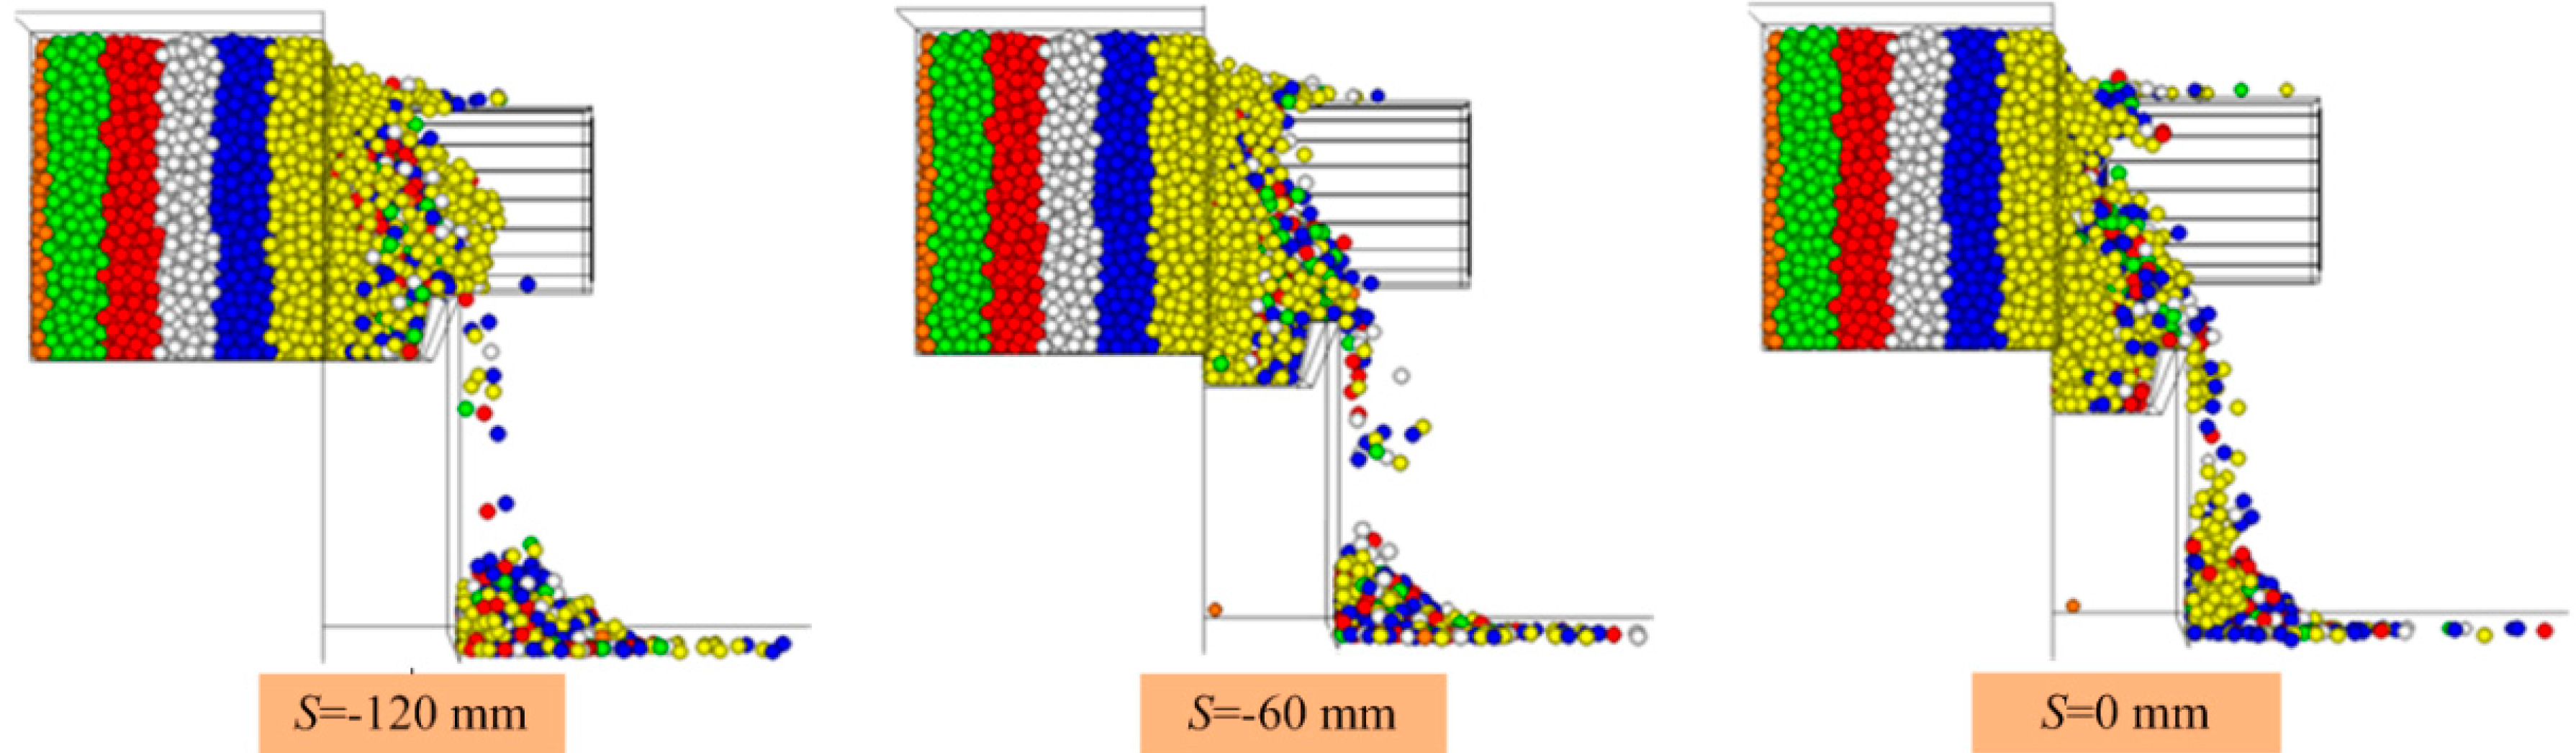
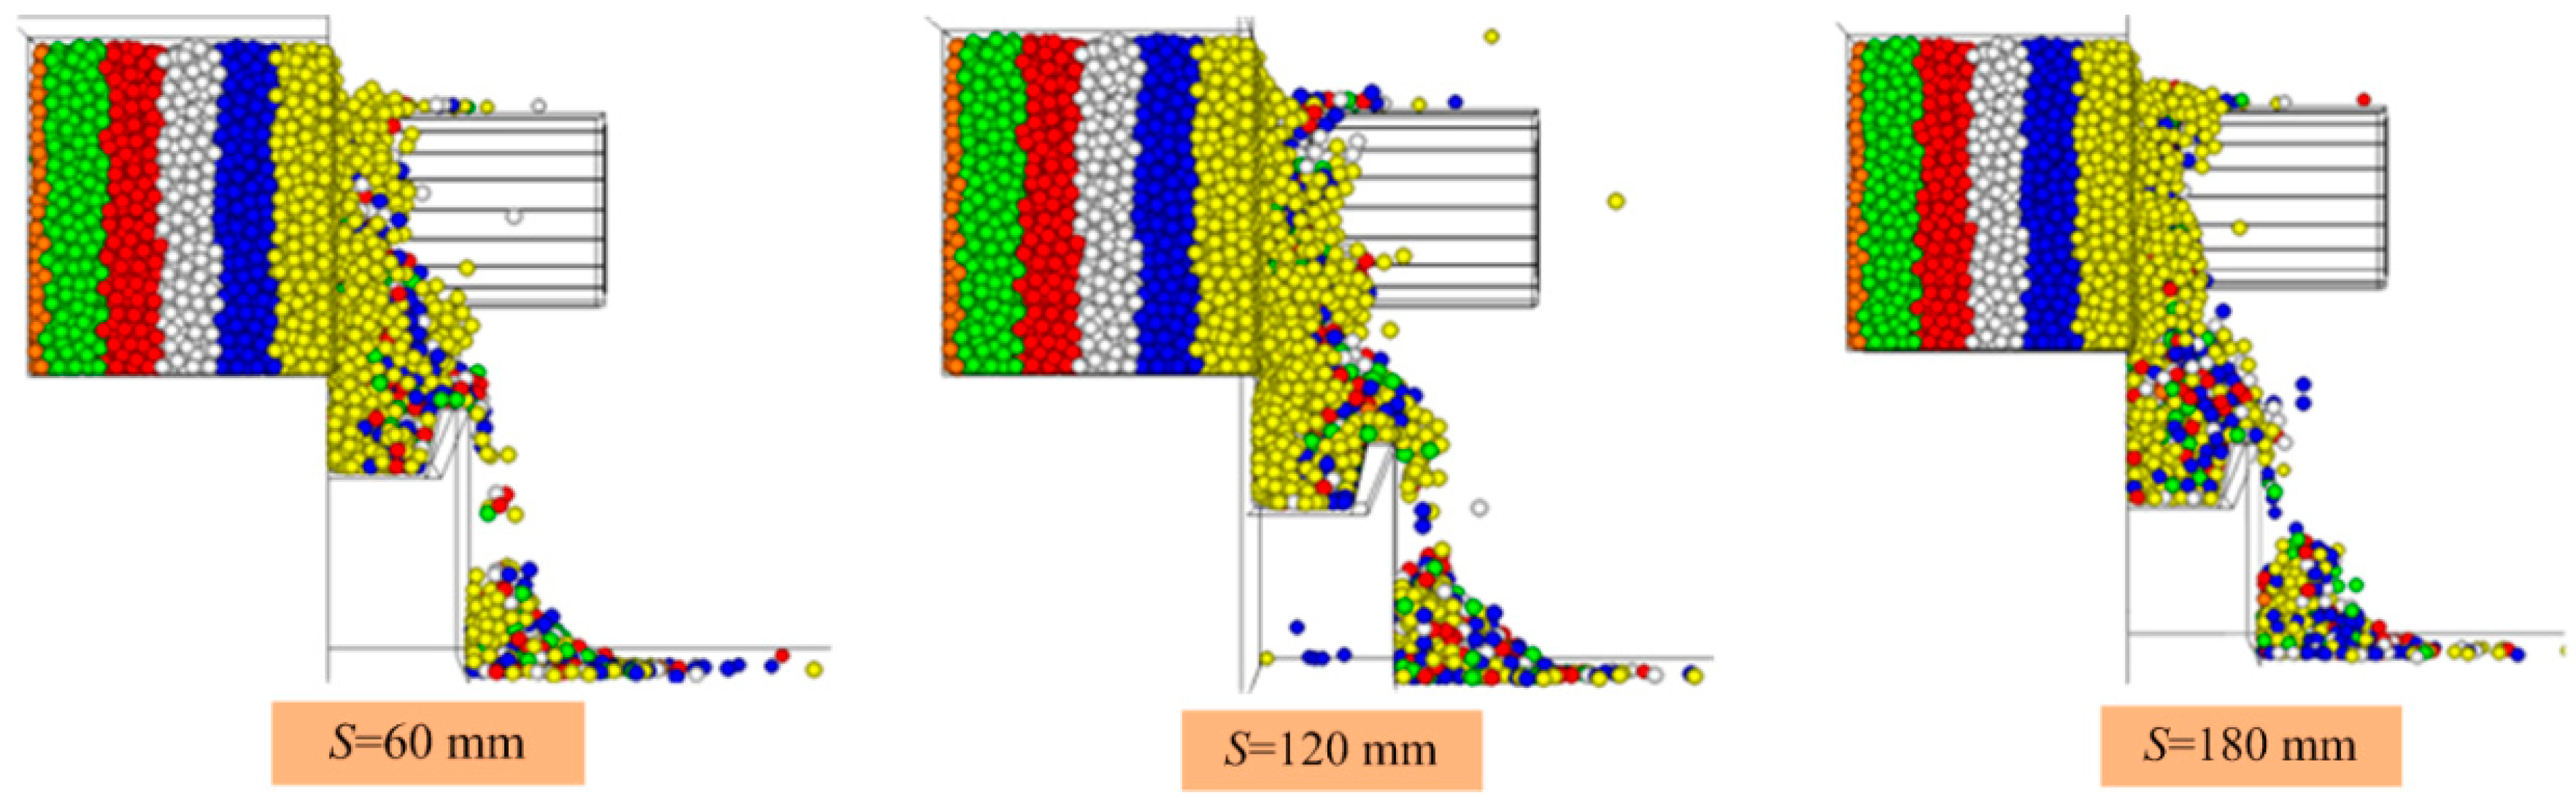
Figure 7 demonstrates the simulation result when the speed is 2 m/min and the rotation speed is 60 r/min.
As indicated in
Figure 7, the number of yellow and blue particles was the highest, white particles took second place, followed by red and green particles, and orange particles almost did not exist. It was illustrated that the closer the particles were to the inner position, the more difficult it was to be conveyed out. The accumulation surface was primarily composed of yellow particles, especially the space between the scraper conveyor and the coal wall. This is because the coal wall was cut from inside to outside by the pick, and the yellow particles were the closest to the shearer; thus, they were the last ones to be cut and conveyed in each rotation of the drum. Additionally, a few of the particles were ejected to the upside of the ranging arm, which was accorded with the practical results. Then, the effectiveness of the DEM was verified again. However, there were no significant differences in the number of loaded particles under the six different conditions (
Figure 7). The key reason for this was that a few of the particles were conveyed to the statistical area whereas most of the particles were accumulated between the scraper conveyor and the coal wall. The simulation results for different
S values were obtained in 18 seconds, and the statistical results are provided in
Table 1.
Figure 7.
Simulation results for different S values.
Figure 7.
Simulation results for different S values.
Table 1.
Simulation statistical results for different S values.
Table 1.
Simulation statistical results for different S values.
| Hauling Speed (m/min) | Rotation Speed (r/min) | Vane Helix Angle (°) | S Value (mm) | Particle Accumulation Mass (kg) | Particle Loading Rate (%) |
|---|
| 2 | 60 | 21 | −120 | 14.34 | 23.73 |
| 2 | 60 | 21 | −60 | 13.98 | 22.55 |
| 2 | 60 | 21 | 0 | 12.28 | 20.13 |
| 2 | 60 | 21 | 60 | 12.44 | 20.41 |
| 2 | 60 | 21 | 120 | 15.38 | 26.23 |
| 2 | 60 | 21 | 180 | 15.247 | 26.17 |
| 2 | 90 | 21 | −120 | 14.97 | 24.45 |
| 2 | 90 | 21 | −60 | 13.66 | 22.57 |
| 2 | 90 | 21 | 0 | 12.55 | 20.60 |
| 2 | 90 | 21 | 60 | 14.43 | 24.02 |
| 2 | 90 | 21 | 120 | 16.67 | 28.45 |
| 2 | 90 | 21 | 180 | 16.58 | 28.28 |
| 2 | 90 | 15 | −120 | 13.35 | 22.00 |
| 2 | 90 | 15 | −60 | 11.83 | 19.33 |
| 2 | 120 | 15 | −120 | 17.55 | 29.01 |
| 2 | 120 | 15 | −60 | 16.01 | 27.13 |
| 2 | 120 | 15 | 0 | 16.78 | 28.24 |
| 2 | 120 | 15 | 60 | 16.67 | 27.86 |
| 2 | 120 | 15 | 120 | 19.05 | 31.31 |
| 2 | 120 | 15 | 180 | 19.34 | 31.77 |
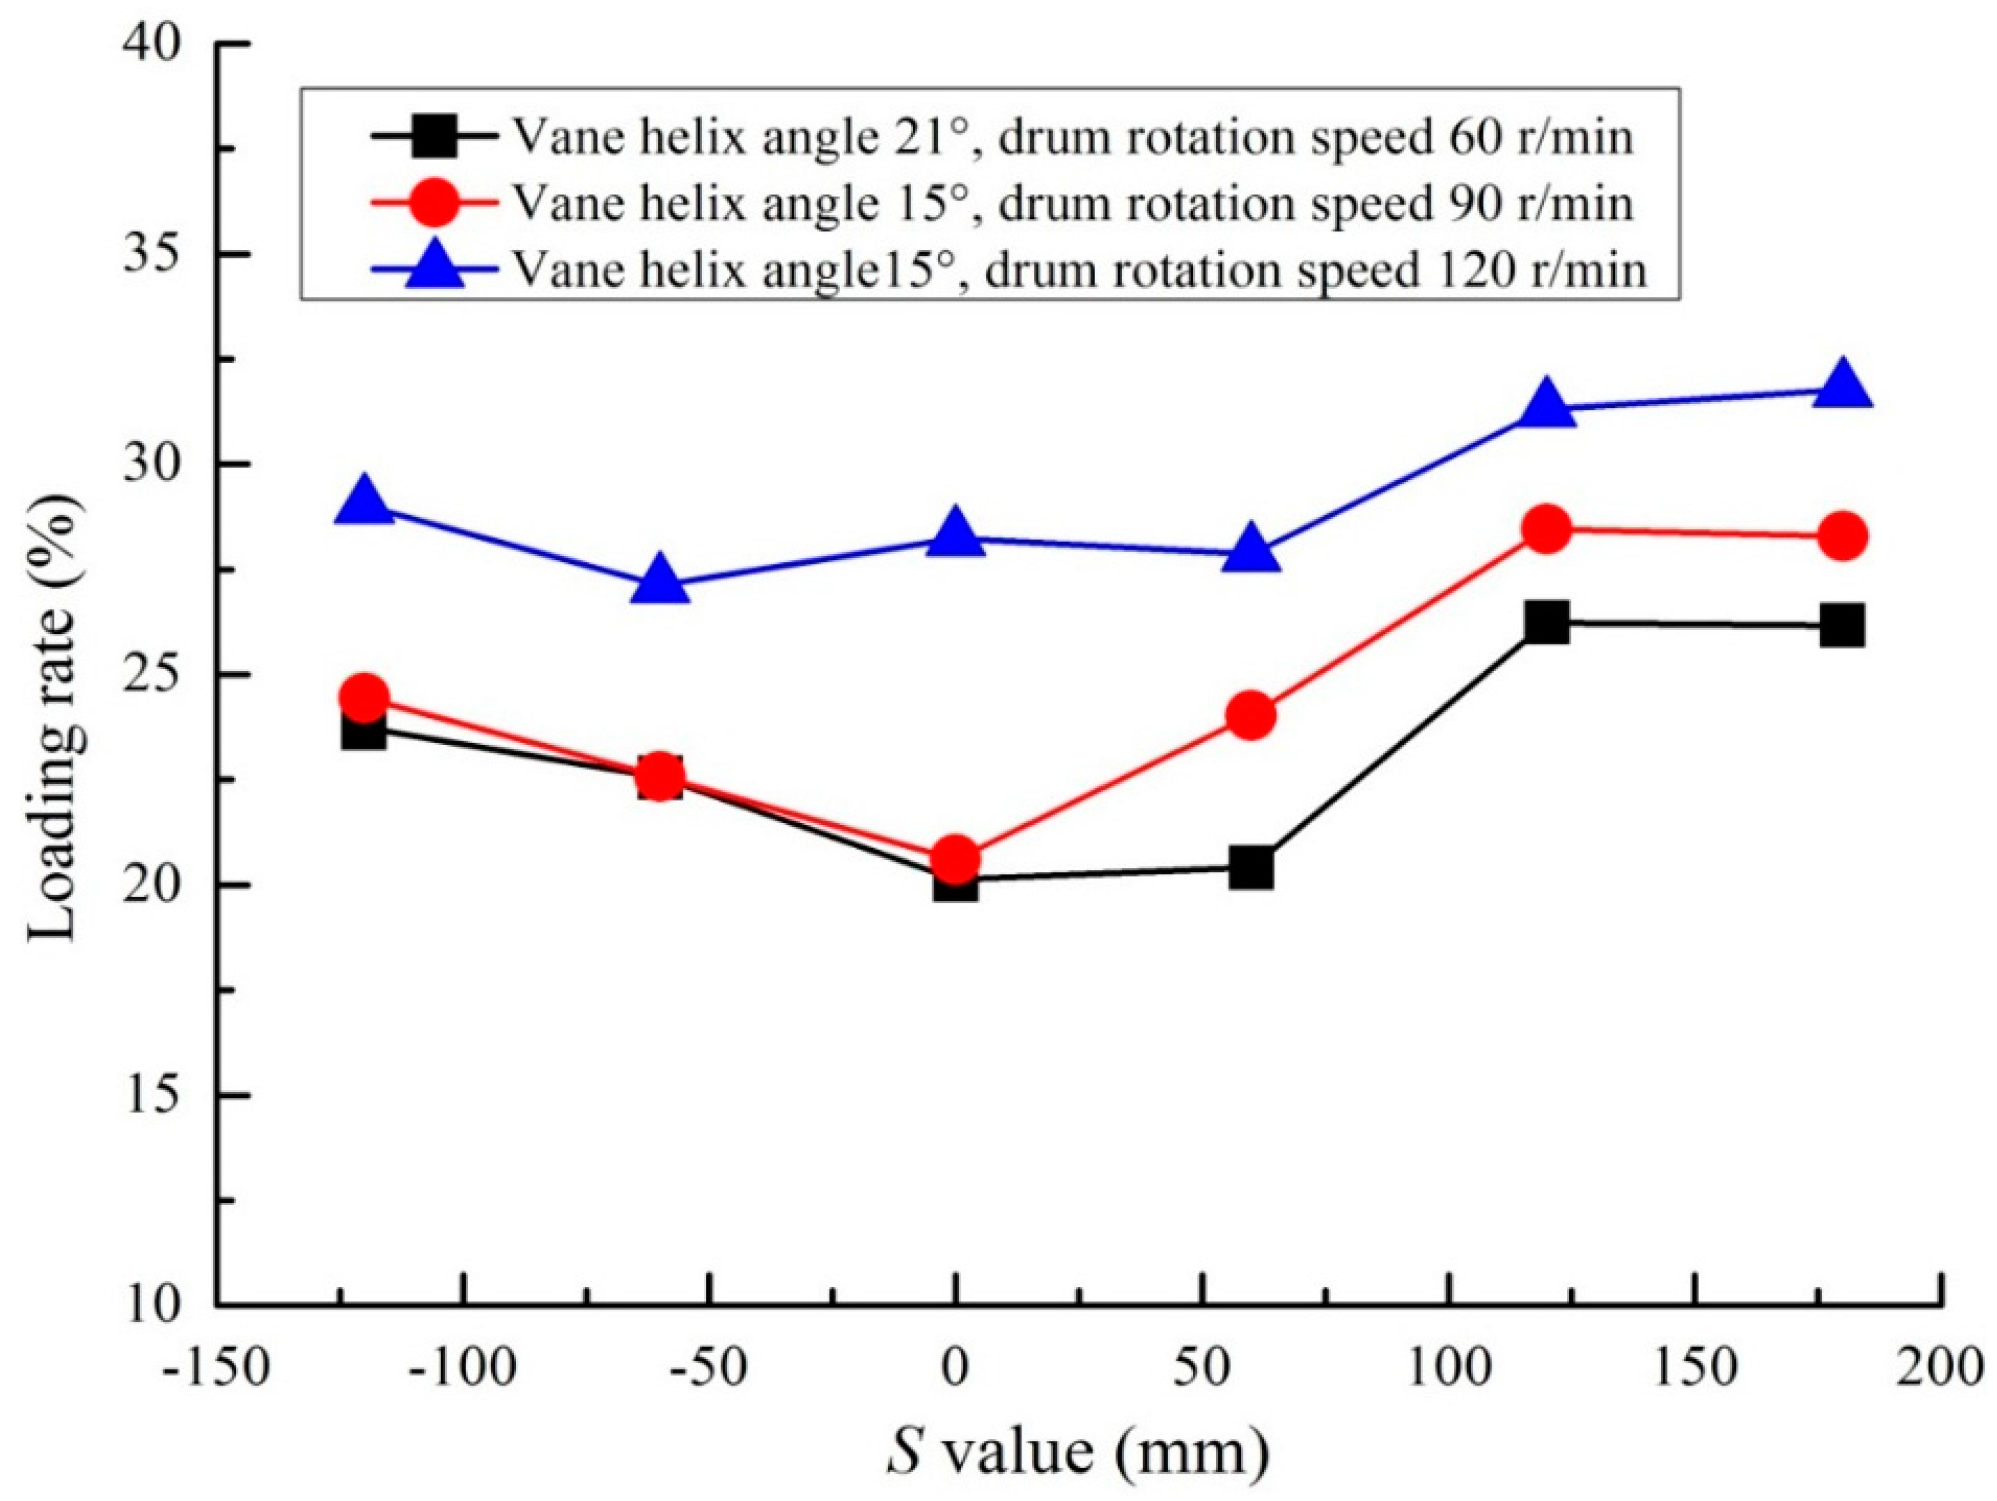
The loading rate first increased and then decreased with an increase in
S (
Figure 8 and
Table 1). If
S reached a certain value, the loading rate would remain constant. First, the
L value was larger, and most of the coal particles could not load in the statistical area with the action of the drum. Then, they were accumulated in the region between the coal wall and the scraper conveyor, which was known as the
L area in the study. When
S was −120 mm, the motion traces of the ejection particles were impeded by the accumulated particles and remained in the
L area. At that point, there were no obstacles on both sides of the
L area, and the coal particles then accumulated naturally to a modest peak. Because of the gravitational attraction, the particles slid on both positions. A portion of them slid to the drum and moved again under the activity of the vane, and another part slid to the statistical area, thus improving the coal loading rate.
Subsequently, with an increase in the relative height of the drum, the blockade effect on the ejected particles was weakened. As the wall height on the left continually increased, the amount of particles needed to be increased to reach the accumulated balance in the L area. Within a certain wall height, the accumulated particles were intended to play a leading role, which reduced the amount of particles in the loading area and led to a decrease in the loading rate.
Lastly, the blockade effect on the ejected particles continued to decrease as the
S value increased. Additionally, the accumulation angle gradually increased to a maximum, which illustrated that the number of accumulated particles had reached a stable state. Thus, the quantity of particles that were loaded in the statistical area increased. The axial and tangential velocities of the particles after coming in contact with the vane depended on the drum rotation and the vane helix angle [
27]. In the simulation, the vane helix angle and the drum rotation were 21° and 60 r/min, respectively, and the particles' axial velocity and tangential velocity were 18.16 m/min and 22.45 m/min, respectively. When the helix angle was 21° and the drum rotation was 90 r/min, the axial velocity and the tangential velocity of the particles were 27.2 and 33.76 m/min, respectively. When the helix angle decreased to 15° and the drum rotation increased to 120 r/min, the axial velocity and the tangential velocity of the particles were 29.5 and 29.47 m/min, respectively. When the axial velocity reached the above values, the particles were not directly loaded in the statistical area but in the
L area, and they were even ejected from the top of the drum. The loading rate was essentially the same when
S was 120 and 180 mm because the same number of particles was needed to balance the accumulation, which caused the same amount of particles to be loaded into the loading area.
Figure 8.
Variations in the particle mean loading rate for various S values.
Figure 8.
Variations in the particle mean loading rate for various S values.
As indicated in
Figure 8, when the vane helix angle was 15° and the rotation speed was 120 r/min, the loading rate was greater than that when the vane helix angle was 21° and the rotation speed was 90 r/min. This is primarily because the cutting depth used in the simulation was less than the maximum theoretical value. Compared with the theoretical analysis, a smaller tangential velocity and a larger axial velocity were obtained in the DEM simulation.
Additionally, when S ≤ 0 mm and the helix angle was 21°, the loading rate was essentially the same as when the rotation speed was 90 and 60 r/min. This result primarily occurred because the movement of the particle output was blocked by the accumulated particles in the L area. Moreover, the particles were ejected to both sides of the drum and accumulated behind the ranging arm. Furthermore, these particles were stopped due to the larger thickness and lower height of the ranging arm, thus they could not enter the L area, which resulted in the same loading rate as when S ≤ 0 mm. However, when the S value continued to increase (S ≥ 0), the loading rate was greater when the rotation speed was 90 r/min compared to when the rotation speed was 60 r/min. The distance between the bottom surface of the L area and the ranging arm increased with an increase in the height of the ranging arm, and this distance was larger than the height of the particles naturally accumulated on the rear of the drum. There was a length of 100 mm between the coal wall and the ranging arm, and a large number of particles, which belonged to the L area, entered this field. If the height of the accumulated particles in this area exceeded the natural accumulation height, then the particles would slide to the statistical areas; hence, the loading rate was greater when the rotation speed was 90 r/min compared to that of 60 r/min.
It can be understood from the above research that the loading rate would be smaller without considering the ranging arm and the distance L, when it exists. In the simulation, the loading rate reached a minimum value when the drum bottom had the same height as that of the middle groove of the scraper conveyor. The coal loading was improved to a certain extent by increasing the S value or the drum rotation speed on the premise that the cutting depth was smaller than the theoretical upper limit value.
4.2. Effects of the Distance Between the Coal Wall and the Middle Groove of the Scraper Conveyor on the Drum Coal Loading Performance
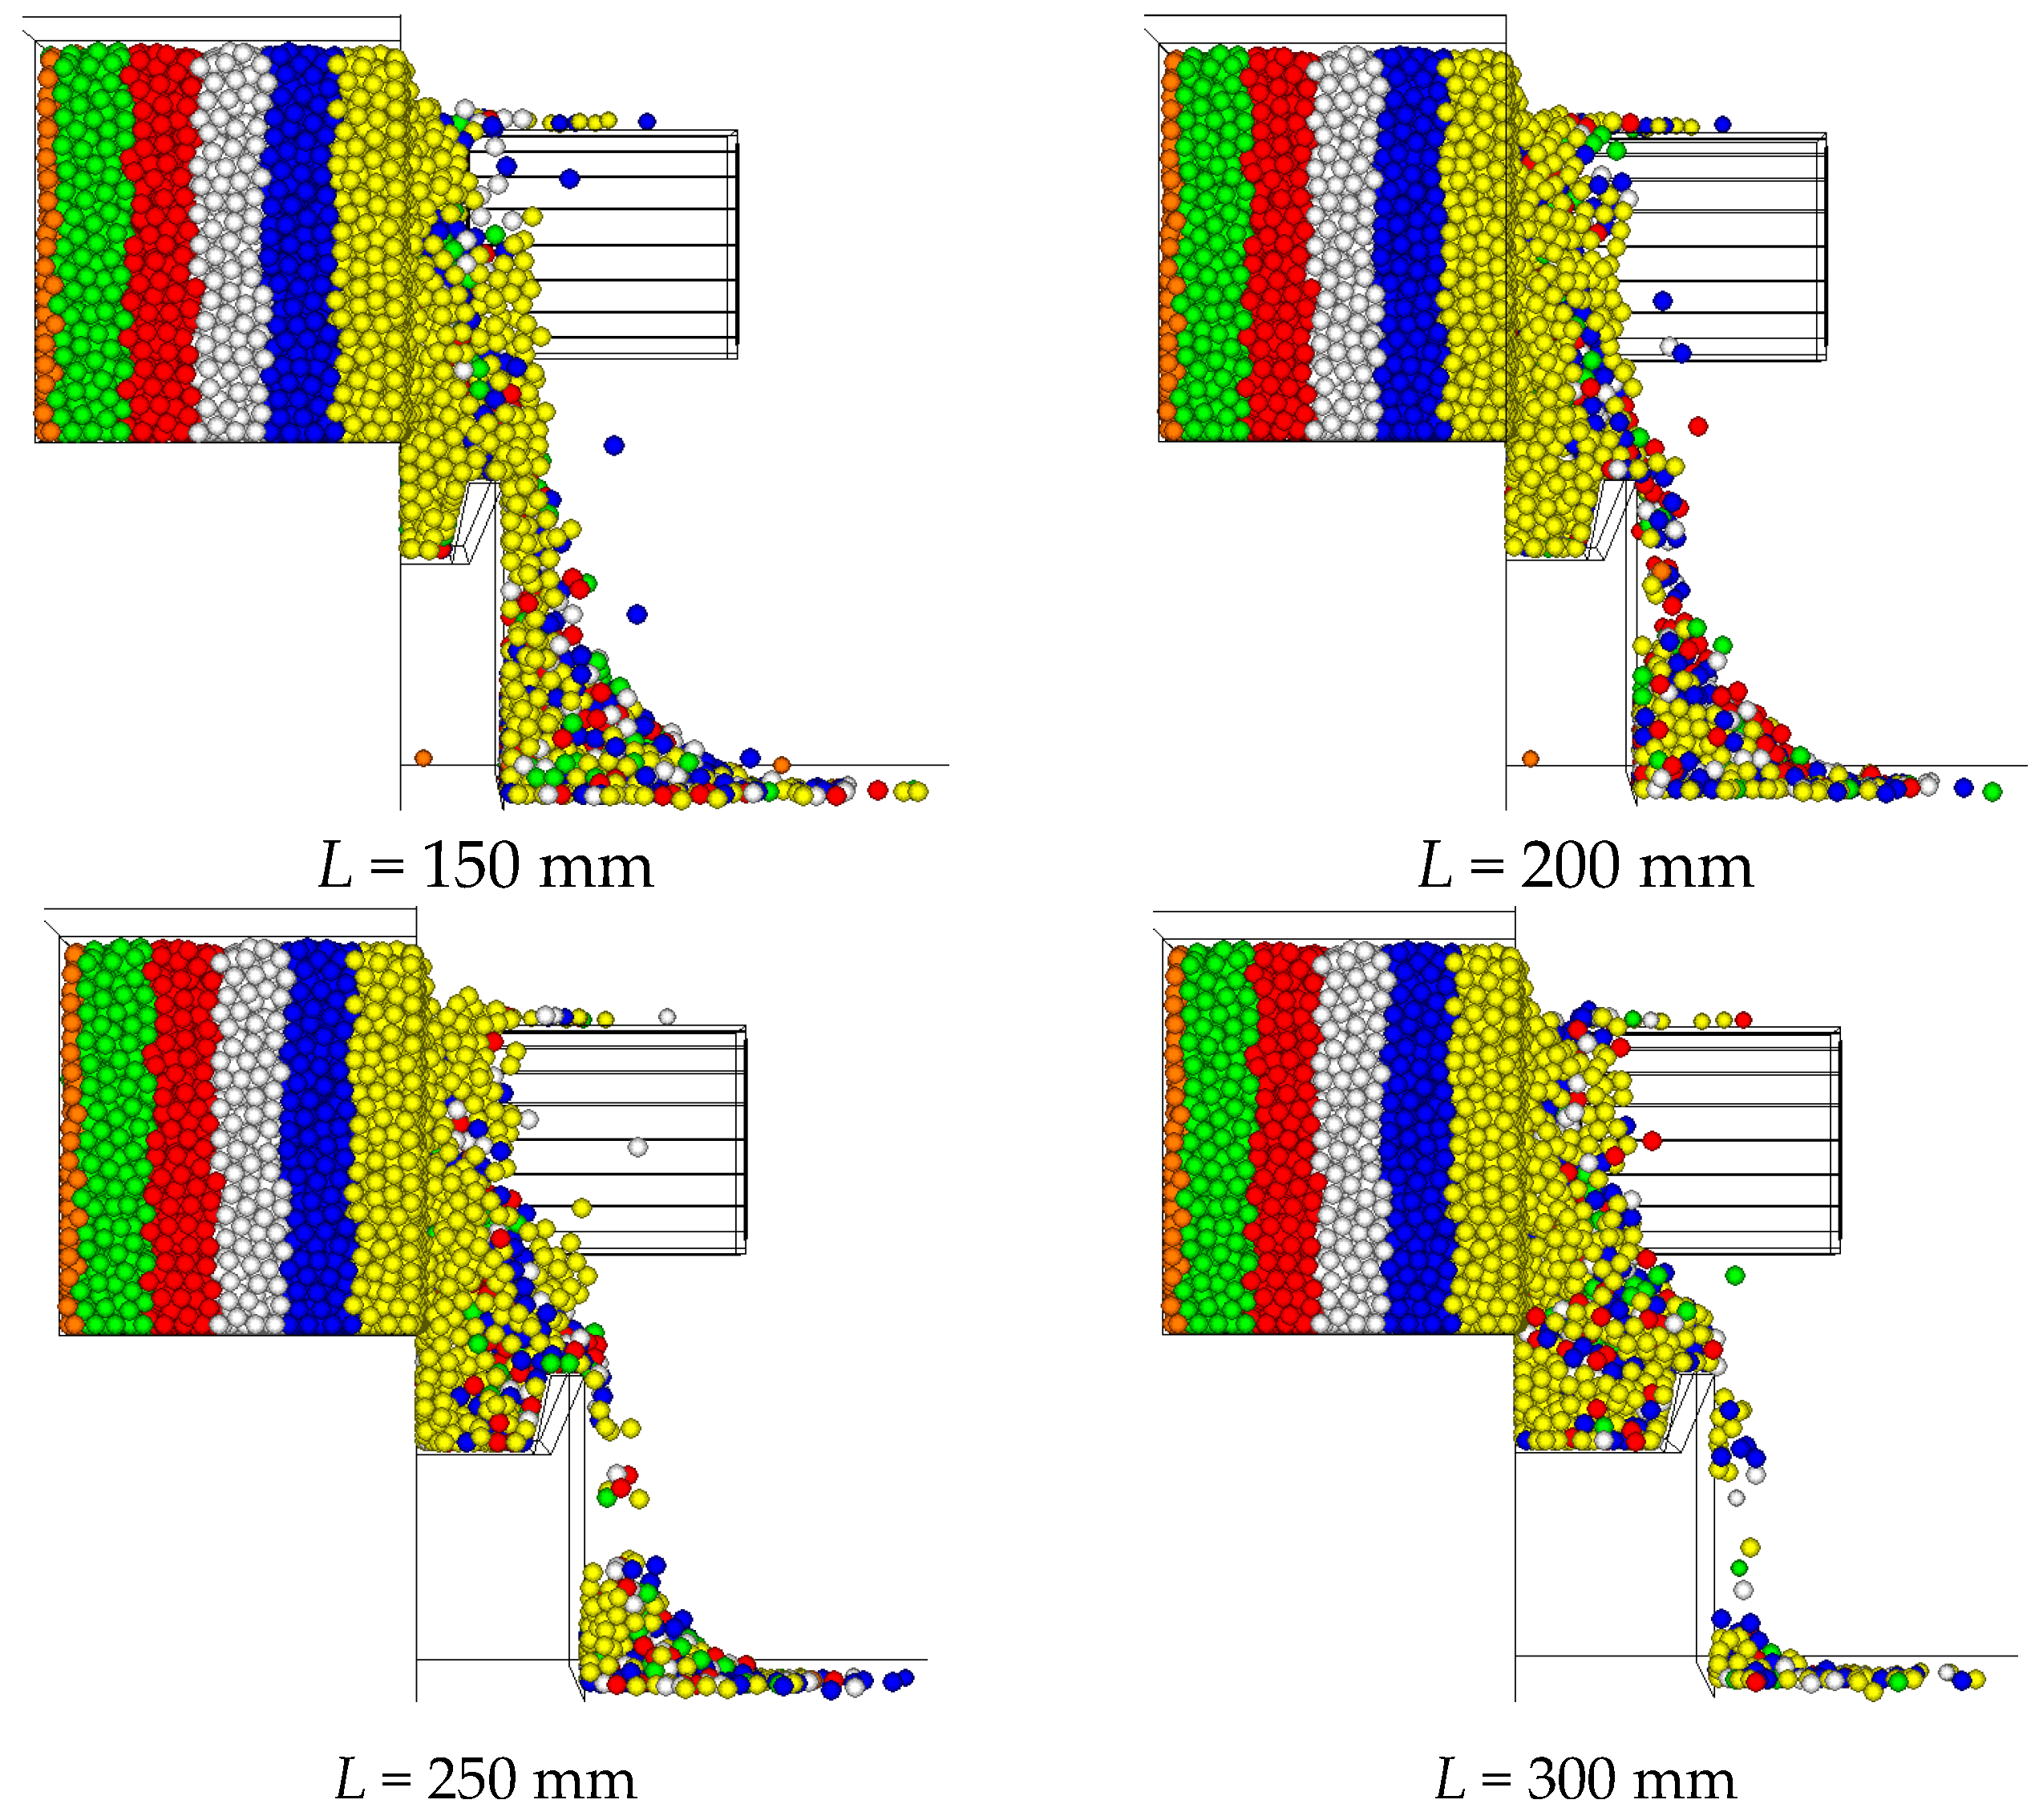
Based on the above research, due to the accumulated coal in the L area after being outputted from the drum, the actual quantity of the coal loading decreased, and the following output performance was blocked, thus negatively impacting the coal loading performance. This result indicates that it is necessary to consider the influence of L on the coal loading rate in the design of the scraper conveyor and the drum. Thus, the influence of L on the coal loading rate was simulated and analyzed using the PFC3D software. In the simulations, S = 60 mm and B = 350 mm, and the L values were 150, 200, 250 and 300 mm where the rotation speed was 60 r/min and the pulling speed was 2 m/min. The simulation results were obtained in 18 s.
In
Figure 9, the loaded particles are mostly yellow, with a few white and red, which illustrated that the inner particles were hard to output, even if the distance between the coal wall and the middle groove of the scraper conveyor was varied. As seen from the accumulated particles figure, the surface of the
L area is covered in yellow. With an increase in the
L value, the amount of particles loaded in the statistical area clearly decreased. The simulation statistical results for different
L values are provided in
Table 2, and the time was 18 s.
Figure 9.
Simulation results for different L values.
Figure 9.
Simulation results for different L values.
Table 2.
Simulation statistical results for different L values.
Table 2.
Simulation statistical results for different L values.
| L Value (mm) | Particle Mean Velocity in X-Direction (m/s) | Particle Mean Velocity in Y-Direction (m/s) | Particle Mean Velocity in Z-Direction (m/s) | Particle Accumulated Mass (kg) | Particle Loading Rate (%) |
|---|
| 150 | 0.0124 | 0.0102 | 0.0202 | 42.93 | 52.67 |
| 200 | 0.0121 | 0.0098 | 0.0139 | 26.71 | 38.61 |
| 250 | 0.0111 | 0.0082 | 0.0124 | 12.44 | 20.41 |
| 300 | 0.0114 | 0.0078 | 0.0096 | 4.32 | 7.54 |
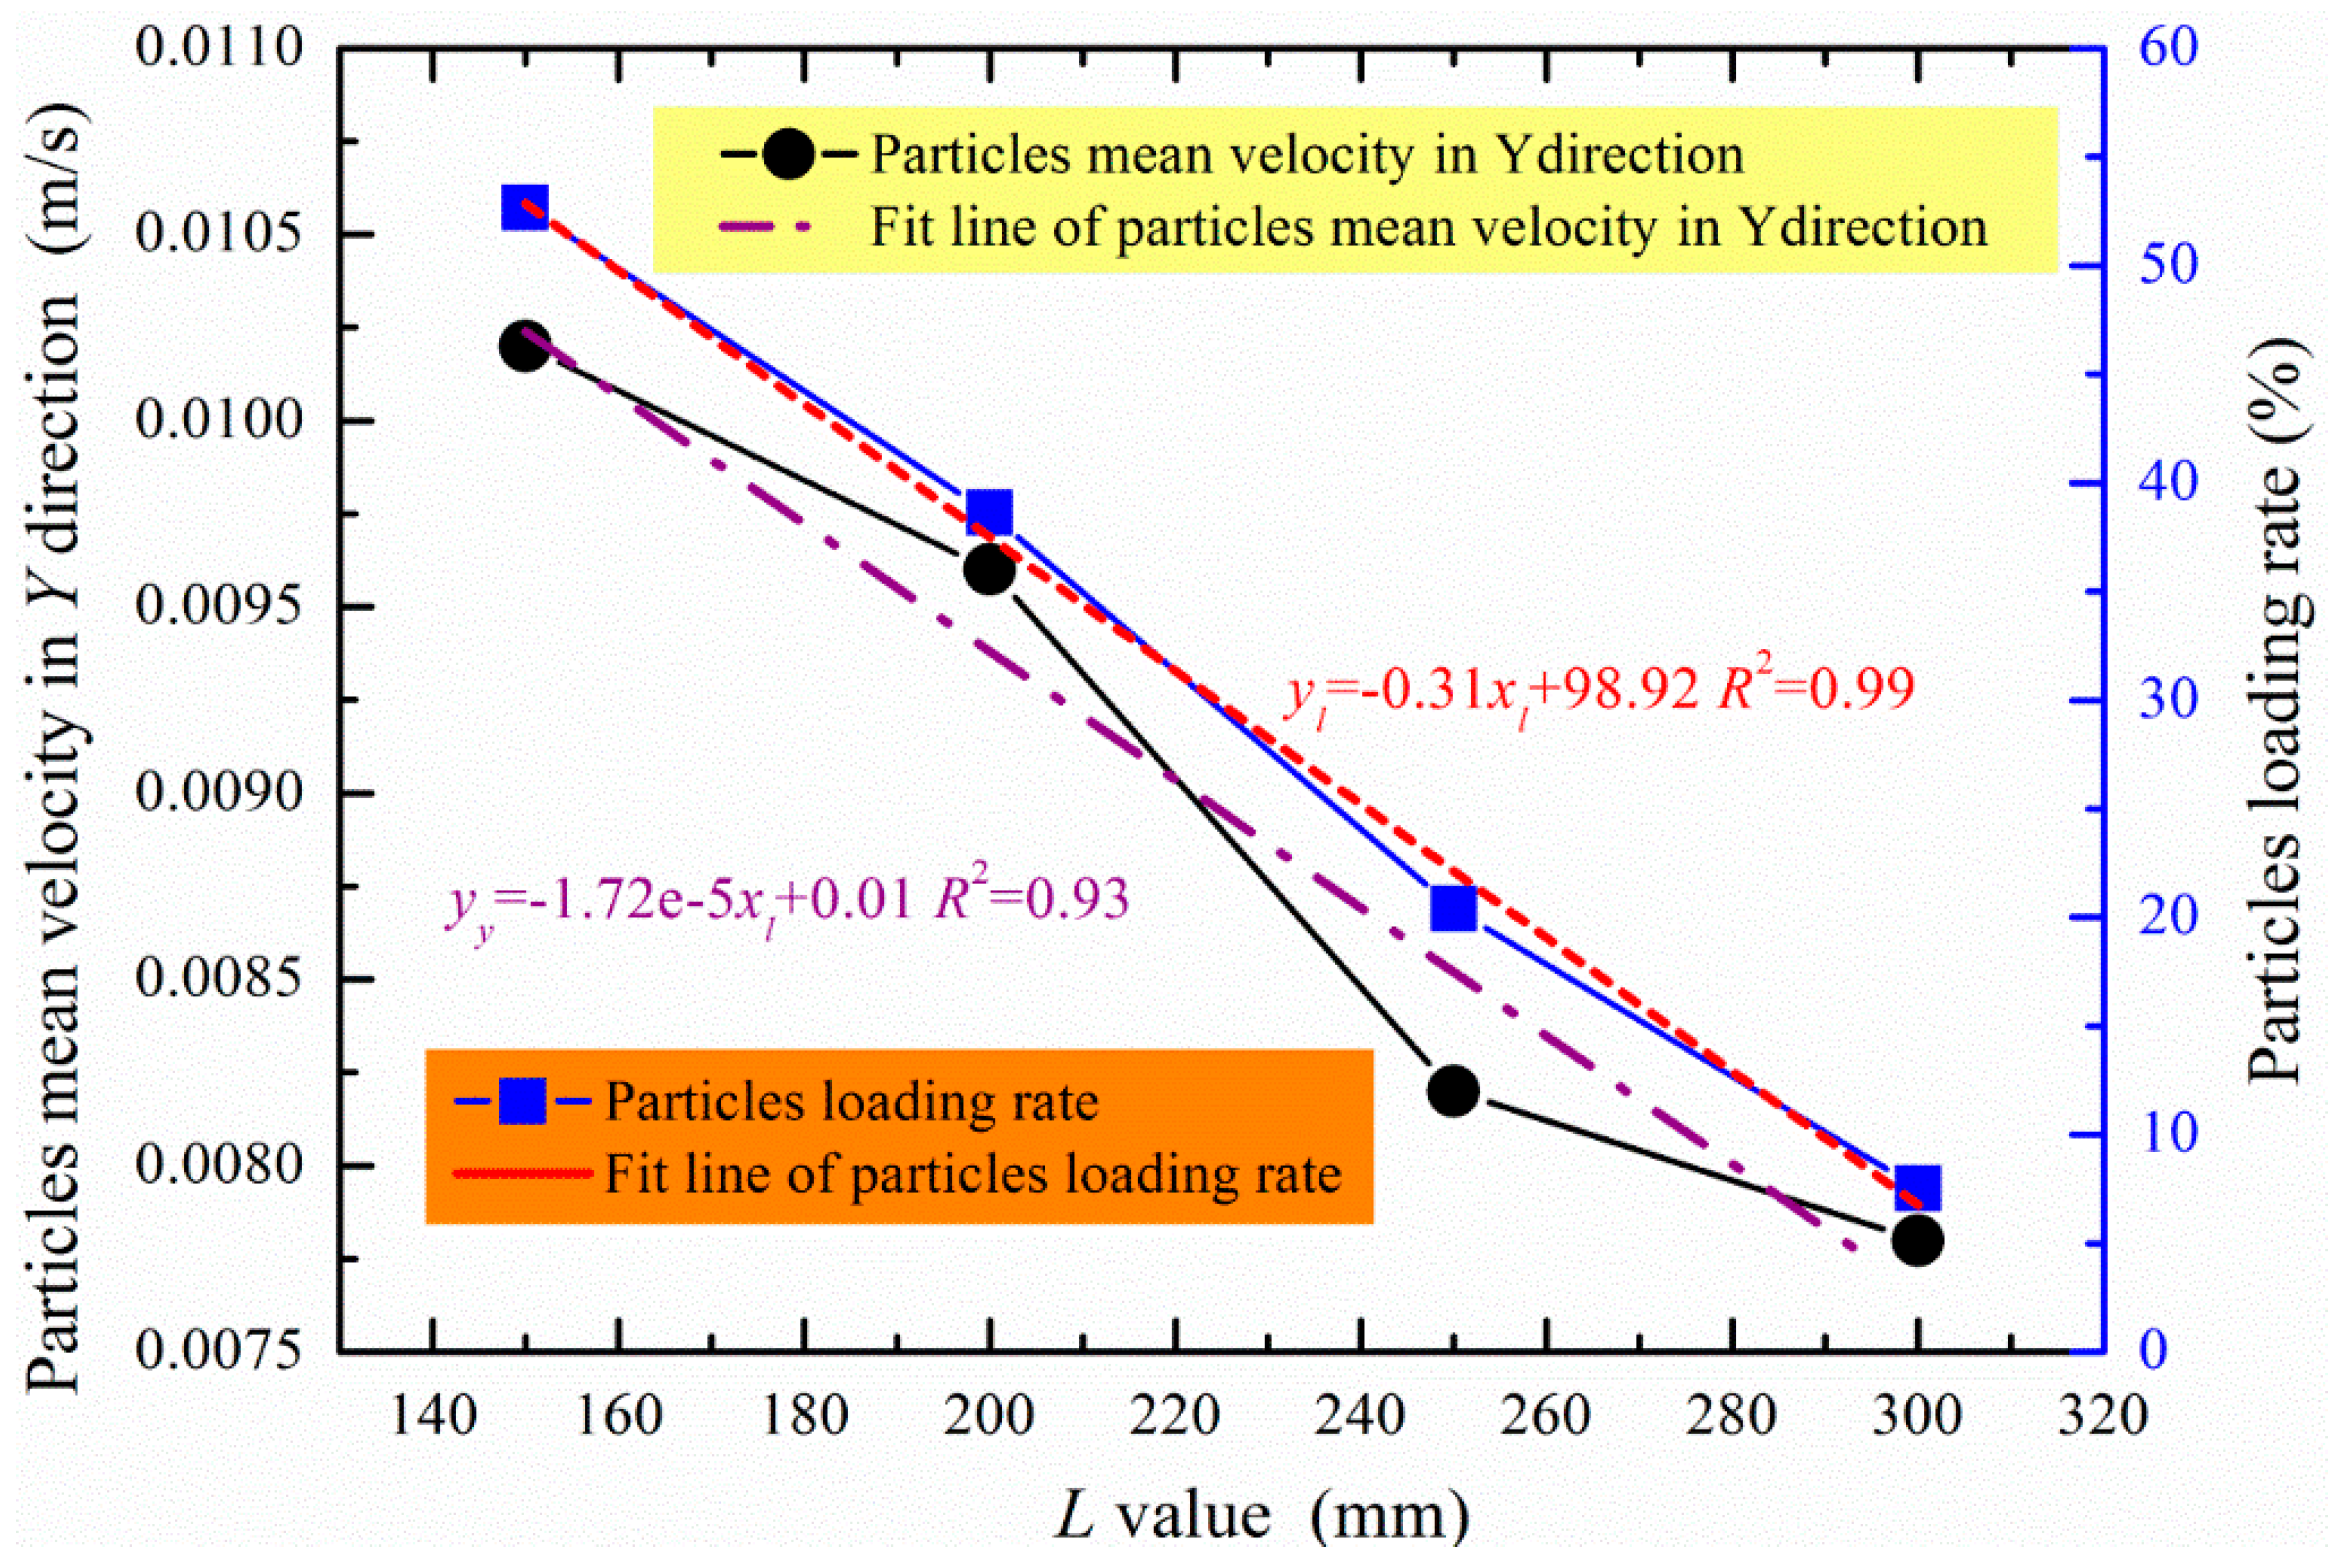
The mean velocity in the
Y and
Z directions, the accumulated mass of the loaded particles, and the loading rate decreased with an increase in the
L value (
Table 2). The mean velocity in the
X direction was less affected by the
L value, and the trend was not obvious. The variation in the particle mean velocity in the
Y direction and the particle loading rate for different
L values can be analyzed based on
Table 2, and the trend is illustrated in
Figure 10. The particle loading rate decreased linearly with a decrease in the
L value. The relationship between the average velocity in the
Y direction and the
L values had a similar trend; however, it was not an obvious linear trend compared with the relationship between the loading rate and the
L values, which is because the particles should pass the
L area first and then load in the statistical area. The movement in the
Y direction was complex due to the existing
L area. Compared with the loading rate for an
L value of 150 and 300 mm, it was determined that the loading rate was significantly influenced by the distance between the coal wall and the middle groove of the scraper conveyor, and the loading rate reduced 3% for a 10 mm increase in the
L value. Thus, the
L value should be minimized in the design of the scraper conveyor and the shearer.
Figure 10.
Variations in the particle’s Y direction mean velocity and the particle loading rate for different L values.
Figure 10.
Variations in the particle’s Y direction mean velocity and the particle loading rate for different L values.
4.3. Effects of the Thickness of the Ranging Arm on the Drum Coal Loading Performance
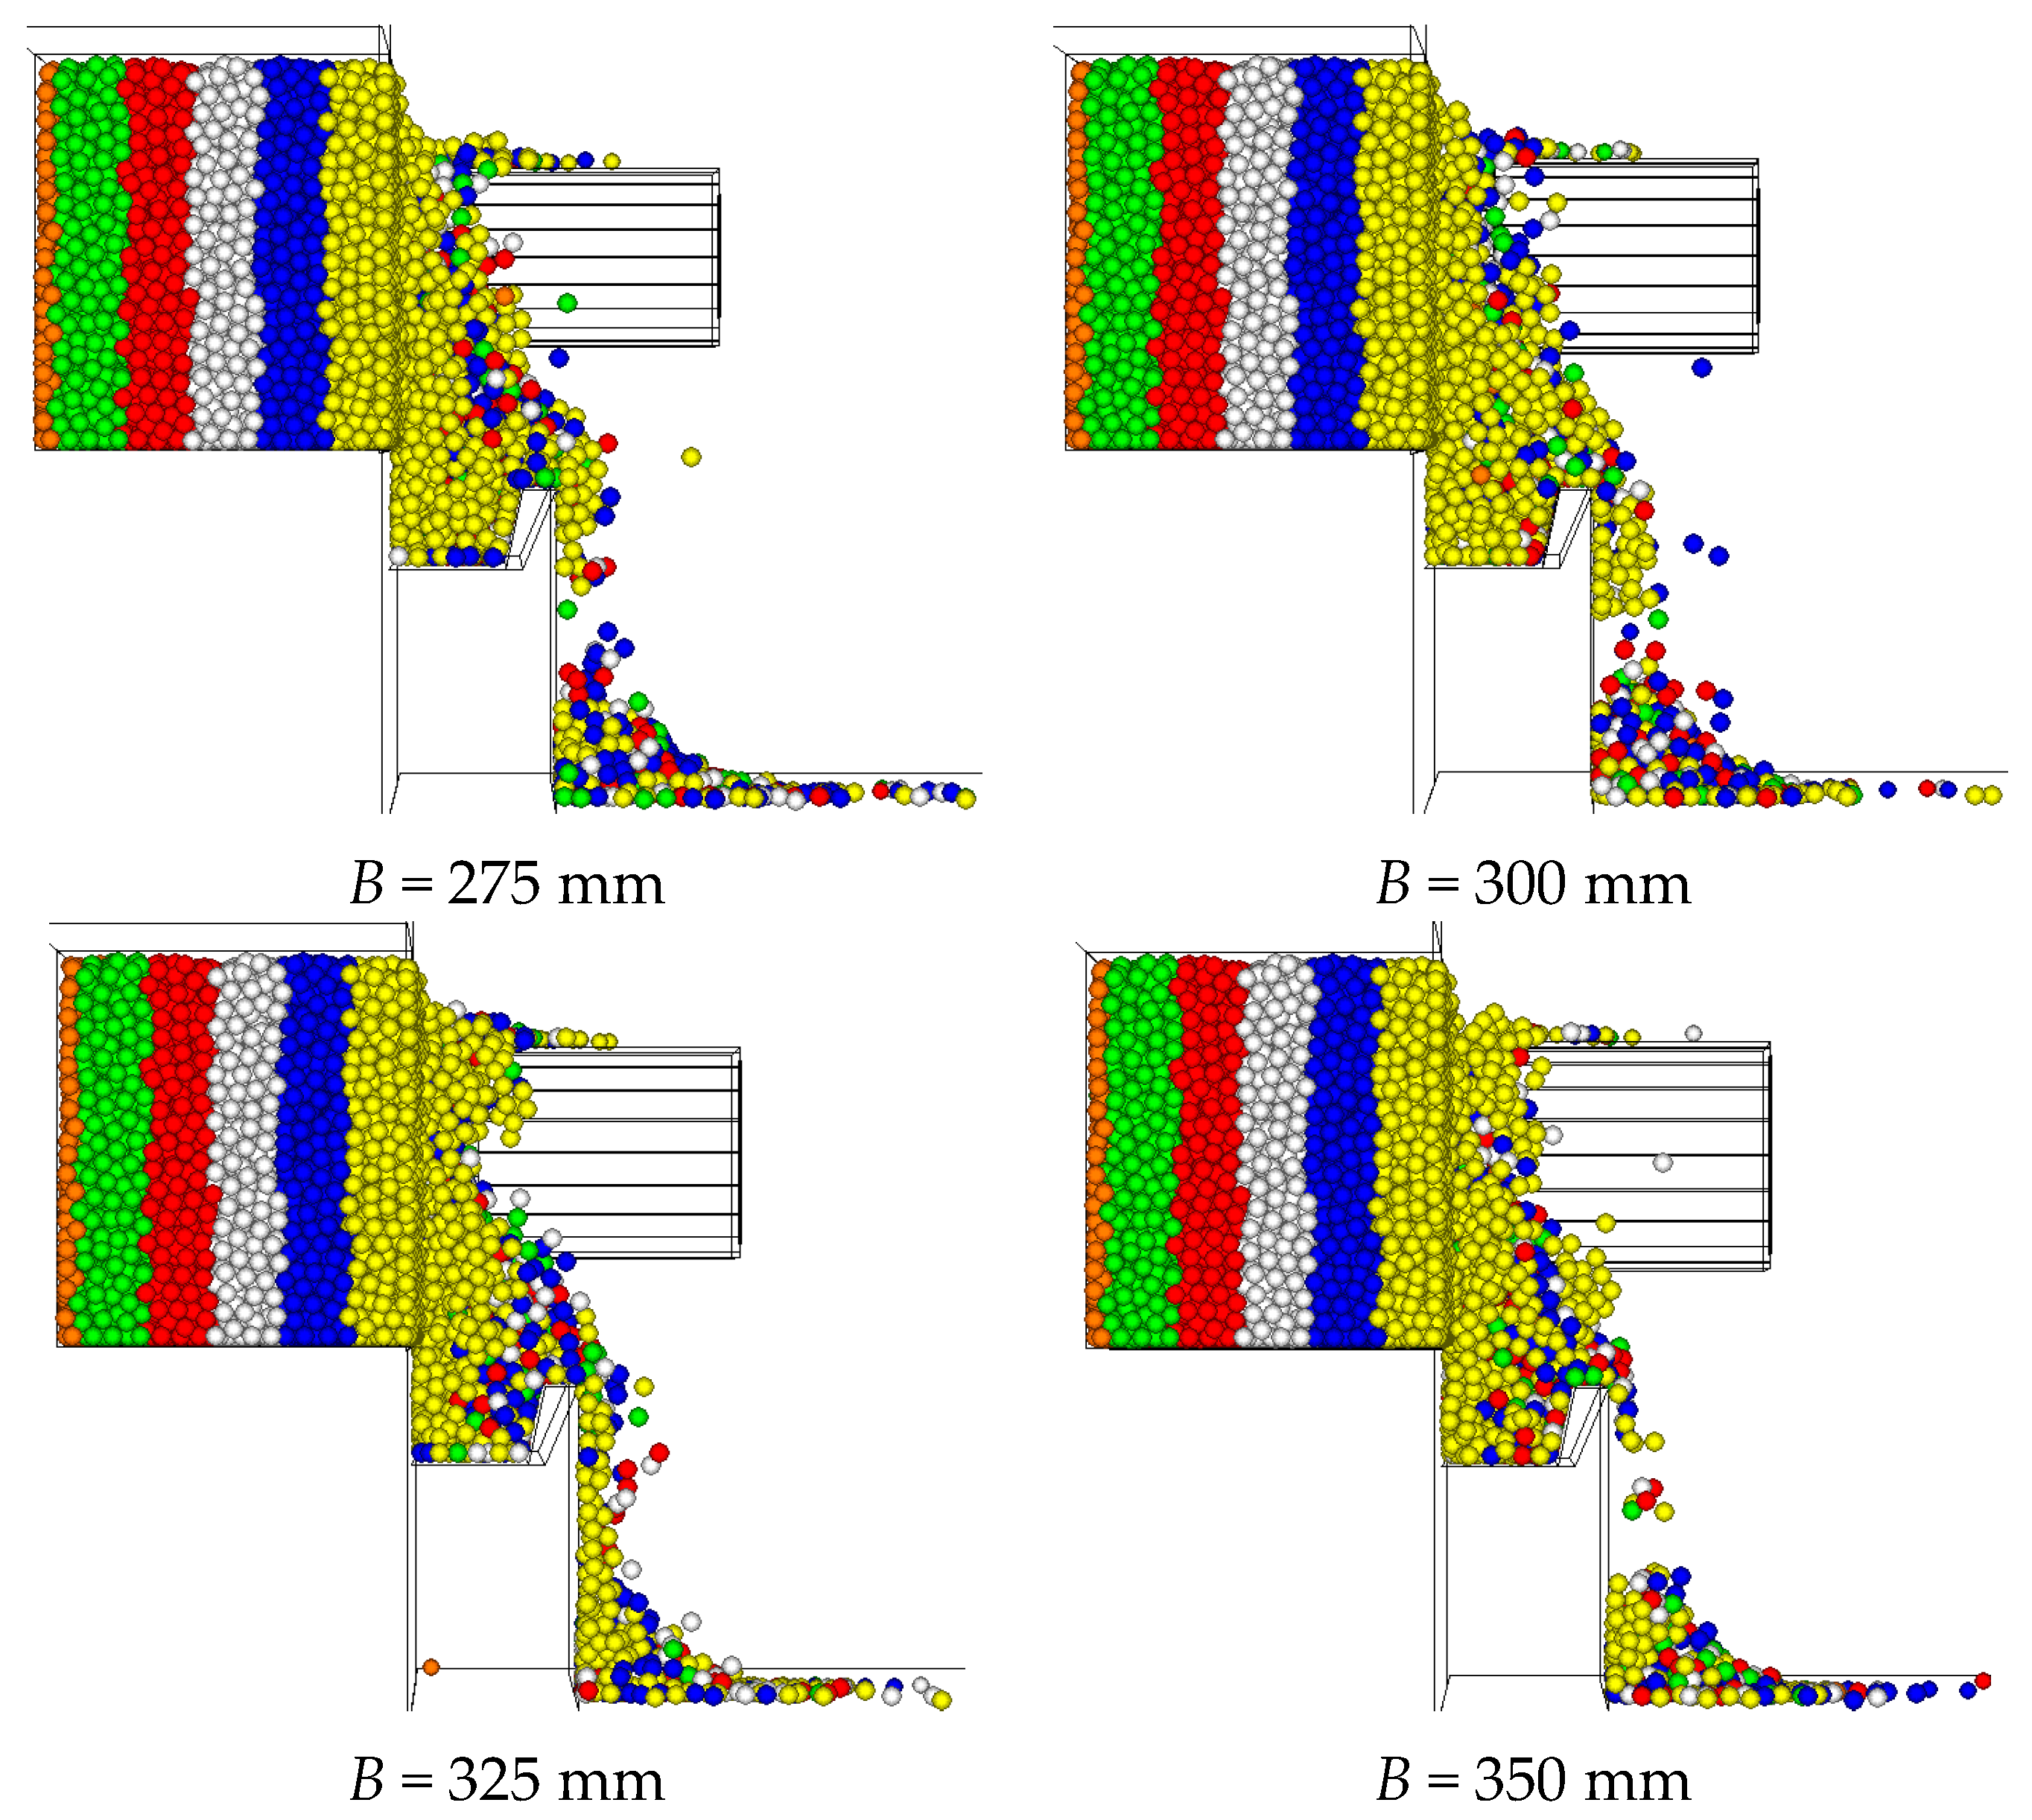
The particle outputs could be blocked by the ranging arm, and the particles were more likely to be blocked by a thicker ranging arm, which would cause a decrease in the loading rate. Thus, the particle output of the drum was studied using the established simulation model for different thicknesses of the ranging arm (275, 300, 325 and 350 mm) (
Figure 11). In these simulations,
S was 60 mm, and
L was 260 mm. When the rotation speed was 60 r/min and the pulling speed was 2 m/min, the surface of the
L area was primarily covered with yellow particles. When the thickness of the ranging arm B was 275 and 300 mm, red, green, blue and white particles appeared in the statistical area, and the red, green, and blue particles were evenly distributed. When
B was 325 and 350 mm, the particles in the statistical area were primarily yellow, with a few other colors. This result indicated that the drum had a strong conveying capacity because the
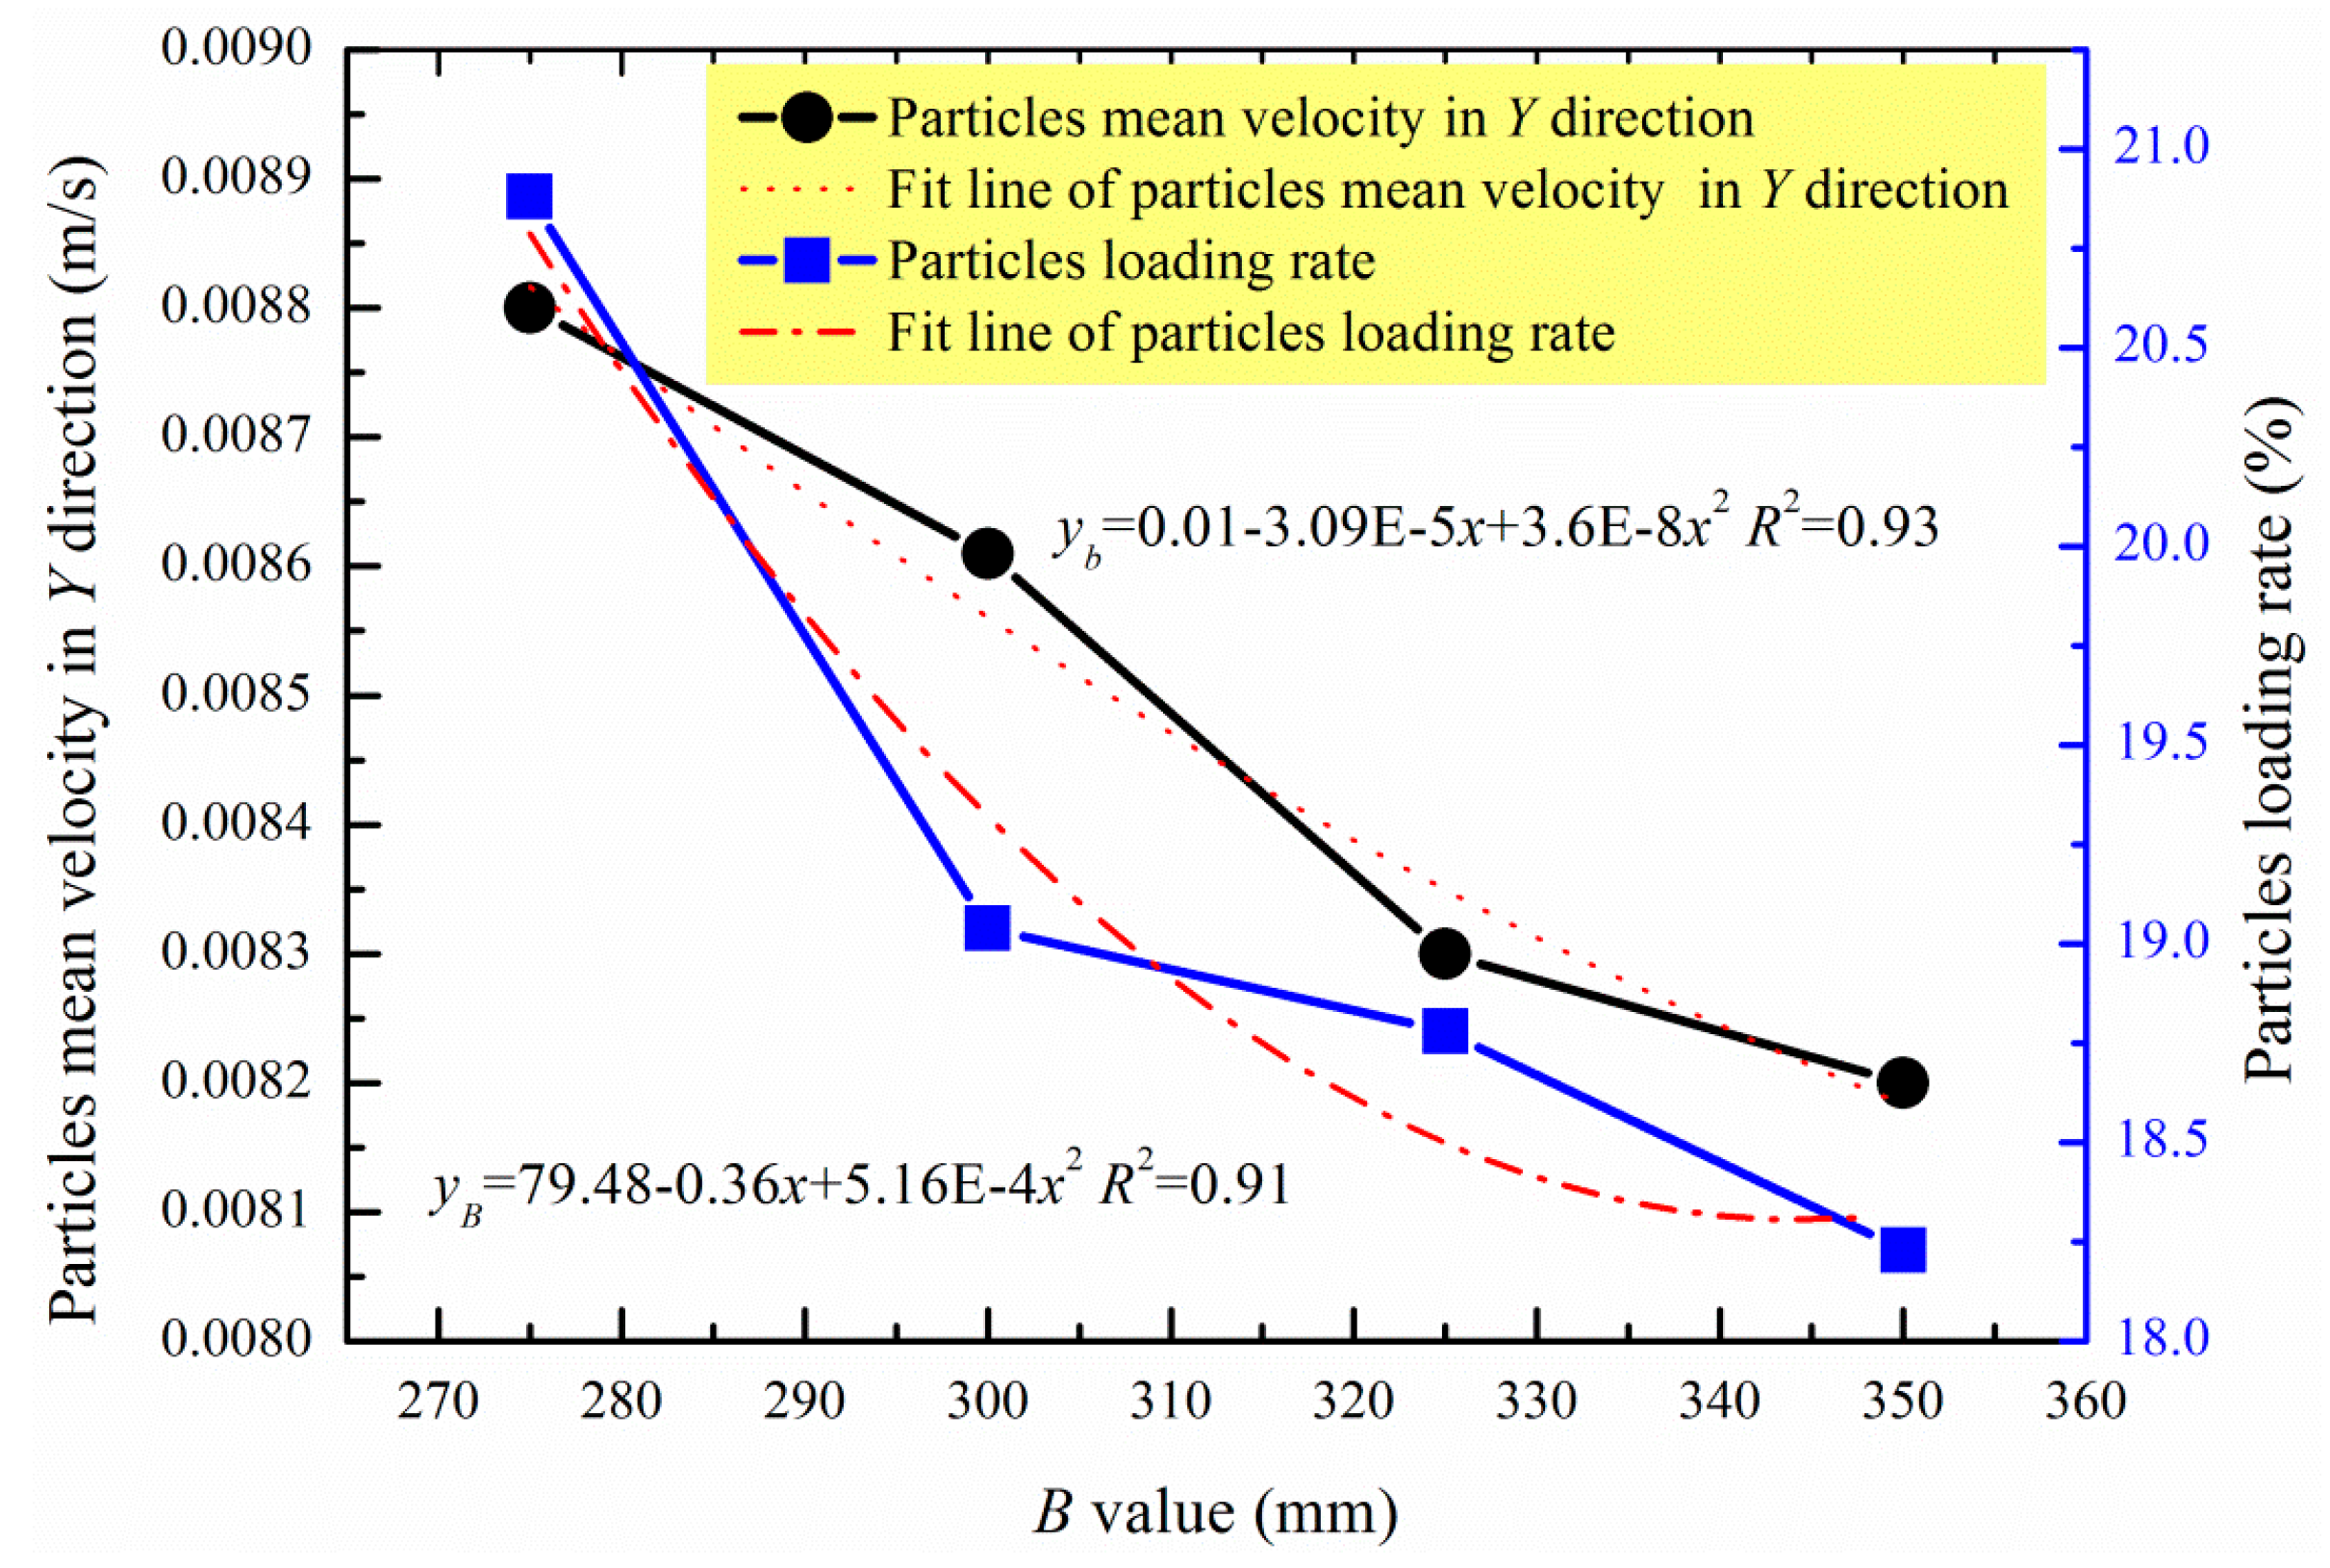
B was a smaller value. Furthermore, we determined that the mean velocity in the
Y direction and the loading rate exhibited a general tendency to decrease with an increasing
B value when the rotation speed was 60 r/min and the pulling speed was 2 m/min (
Table 3). The mean velocity in the
X and
Z directions had no significant relationship with the thickness of the ranging arm. The variations in the particle
Y direction mean velocity and the particle loading rate for different
B values are provided in
Figure 12. From the fitted curves, the mean velocity in the
Y direction and the loading rate decreased as a quadratic function with an increase in the
B value, but there was a large difference between them. This result occurred because the
L value was greater in the simulation; thus, the particles could not be directly conveyed to the statistical area and entered the
L area first. Along with the different blockages of the ranging arm, the change in the mean velocity in the
Y direction was complicated; however, it was similar to the trends of the loading rate.
Figure 11.
Simulation results for different B values.
Figure 11.
Simulation results for different B values.
Table 3.
Simulation statistical results for different B values.
Table 3.
Simulation statistical results for different B values.
| B Value (mm) | Particle Mean Velocity in X-Direction (m/s) | Particle Mean Velocity in Y-Direction (m/s) | Particle Mean Velocity in Z-Direction (m/s) | Particle Accumulated Mass (kg) | Particle Loading Rate (%) |
|---|
| 275 | 0.0109 | 0.0088 | 0.0108 | 14.41 | 20.88 |
| 300 | 0.012 | 0.0086 | 0.0138 | 13.3 | 19.04 |
| 325 | 0.0122 | 0.0083 | 0.0108 | 10.95 | 18.78 |
| 350 | 0.0118 | 0.0082 | 0.0121 | 10.84 | 18.23 |
Figure 12.
Variations in the particles’ Y direction mean velocity and the particle loading rate for different B values.
Figure 12.
Variations in the particles’ Y direction mean velocity and the particle loading rate for different B values.
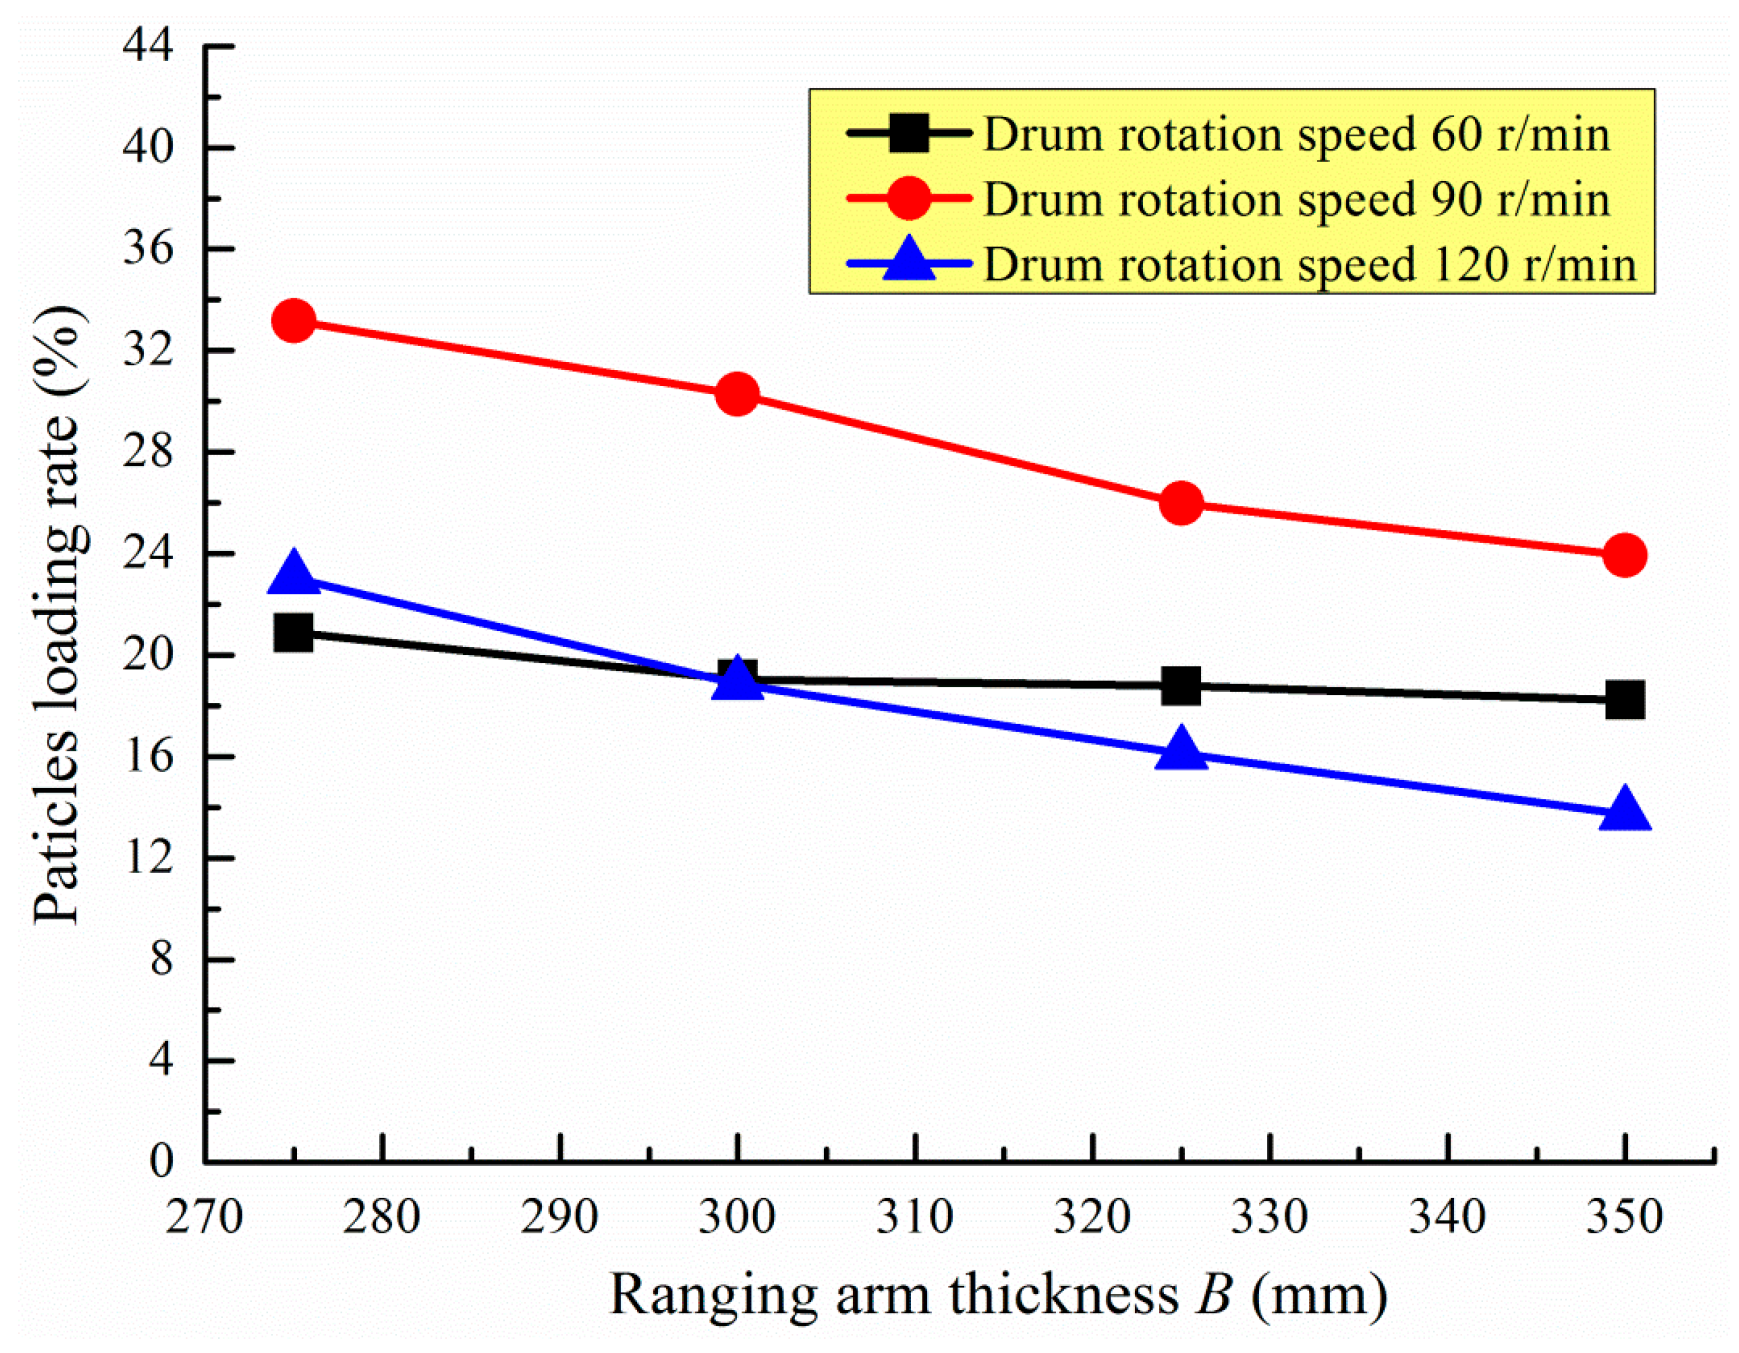
In previous studies, for a greater drum rotation speed, the ejection effect of the vane on the particles was more evident. Additionally, in certain cases, for a higher position of the particles on the exit of the drum, the blockage became worse with an increase in the thickness of the ranging arm. To confirm this theory and study the influence of the thickness of the ranging arm on the loading rate for different rotation speeds, an additional study was conducted using the DEM. The results are provided in
Table 4 and
Figure 13, which illustrate that the loading rate decreased with an increase in the thickness of the ranging arm. As indicated in
Figure 13, the rate of decrease of the loading rate was similar for 90 and 120 r/min, whereas the loading rate changed slightly for 60 r/min. If the rotation speed was slower, the particles would slide to the
L area directly along the ranging arm due to the lower exit, smaller contact area with the ranging arm, and softer collision.
With the increase in the rotation speed, the exit velocity and the particle height increased as well as the blockage area of the ranging arm on the particles. Thus, the loading rate considerably decreased with the increase of the thickness of the ranging arm when the rotation speed was 90 and 120 r/min. Additionally, when the thickness of the ranging arm was small, the loading rate was higher for a rotation speed of 120 r/min than that for 60 r/min. With an increase in the thickness of the ranging arm, the resulting trend changes. In other words, the loading rate was lower for the 120 r/min rotation speed compared with the rotation speed of 60 r/min. Even when the rotation speed was 120 r/min, the amount of particle output was lower than it was for 60 r/min. A few of the particles could still pass the L area and load into the statistical area when the ranging arm was thinner, which was caused by the higher output speed. The loading rate clearly decreased with an increase in the thickness of the ranging arm because the blockage of the ranging arm became significant.
Table 4.
Influence of the thickness of the ranging arm on the particle loading rate for different rotation speeds.
Table 4.
Influence of the thickness of the ranging arm on the particle loading rate for different rotation speeds.
| Hauling Speed (m/min) | Rotation Speed (r/min) | Vane Helix Angle (°) | B Value (mm) | Particle Accumulated Mass (kg) | Particle Loading Rate (%) |
|---|
| 2 | 60 | 21 | 275 | 14.41 | 20.88 |
| 2 | 60 | 21 | 300 | 13.30 | 19.04 |
| 2 | 60 | 21 | 325 | 10.95 | 18.78 |
| 2 | 60 | 21 | 350 | 10.84 | 18.23 |
| 2 | 90 | 21 | 275 | 20.10 | 33.16 |
| 2 | 90 | 21 | 300 | 17.82 | 30.27 |
| 2 | 90 | 21 | 325 | 16.01 | 25.98 |
| 2 | 90 | 21 | 350 | 14.12 | 23.92 |
| 2 | 120 | 21 | 275 | 13.60 | 23.04 |
| 2 | 120 | 21 | 300 | 11.21 | 18.86 |
| 2 | 120 | 21 | 325 | 9.79 | 16.11 |
| 2 | 120 | 21 | 350 | 8.44 | 13.73 |
Figure 13.
Variations in the particle loading rate with the thickness of the ranging arm B for different rotation speeds.
Figure 13.
Variations in the particle loading rate with the thickness of the ranging arm B for different rotation speeds.
It can be concluded from the above analysis that the loading rate decreased with an increase in the thickness of the ranging arm within a small range when a lower rotation speed was used. Furthermore, the loading rate was significantly influenced by the thickness of the ranging arm when a higher rotation speed was used, especially when significant ejecting occurred. Thus, the thickness of the ranging arm should be reduced as much as possible in the design of the shearer.


