The Adsorption of n-Octanohydroxamate Collector on Cu and Fe Oxide Minerals Investigated by Static Secondary Ion Mass Spectrometry

Abstract
:1. Introduction

2. Results and Discussion
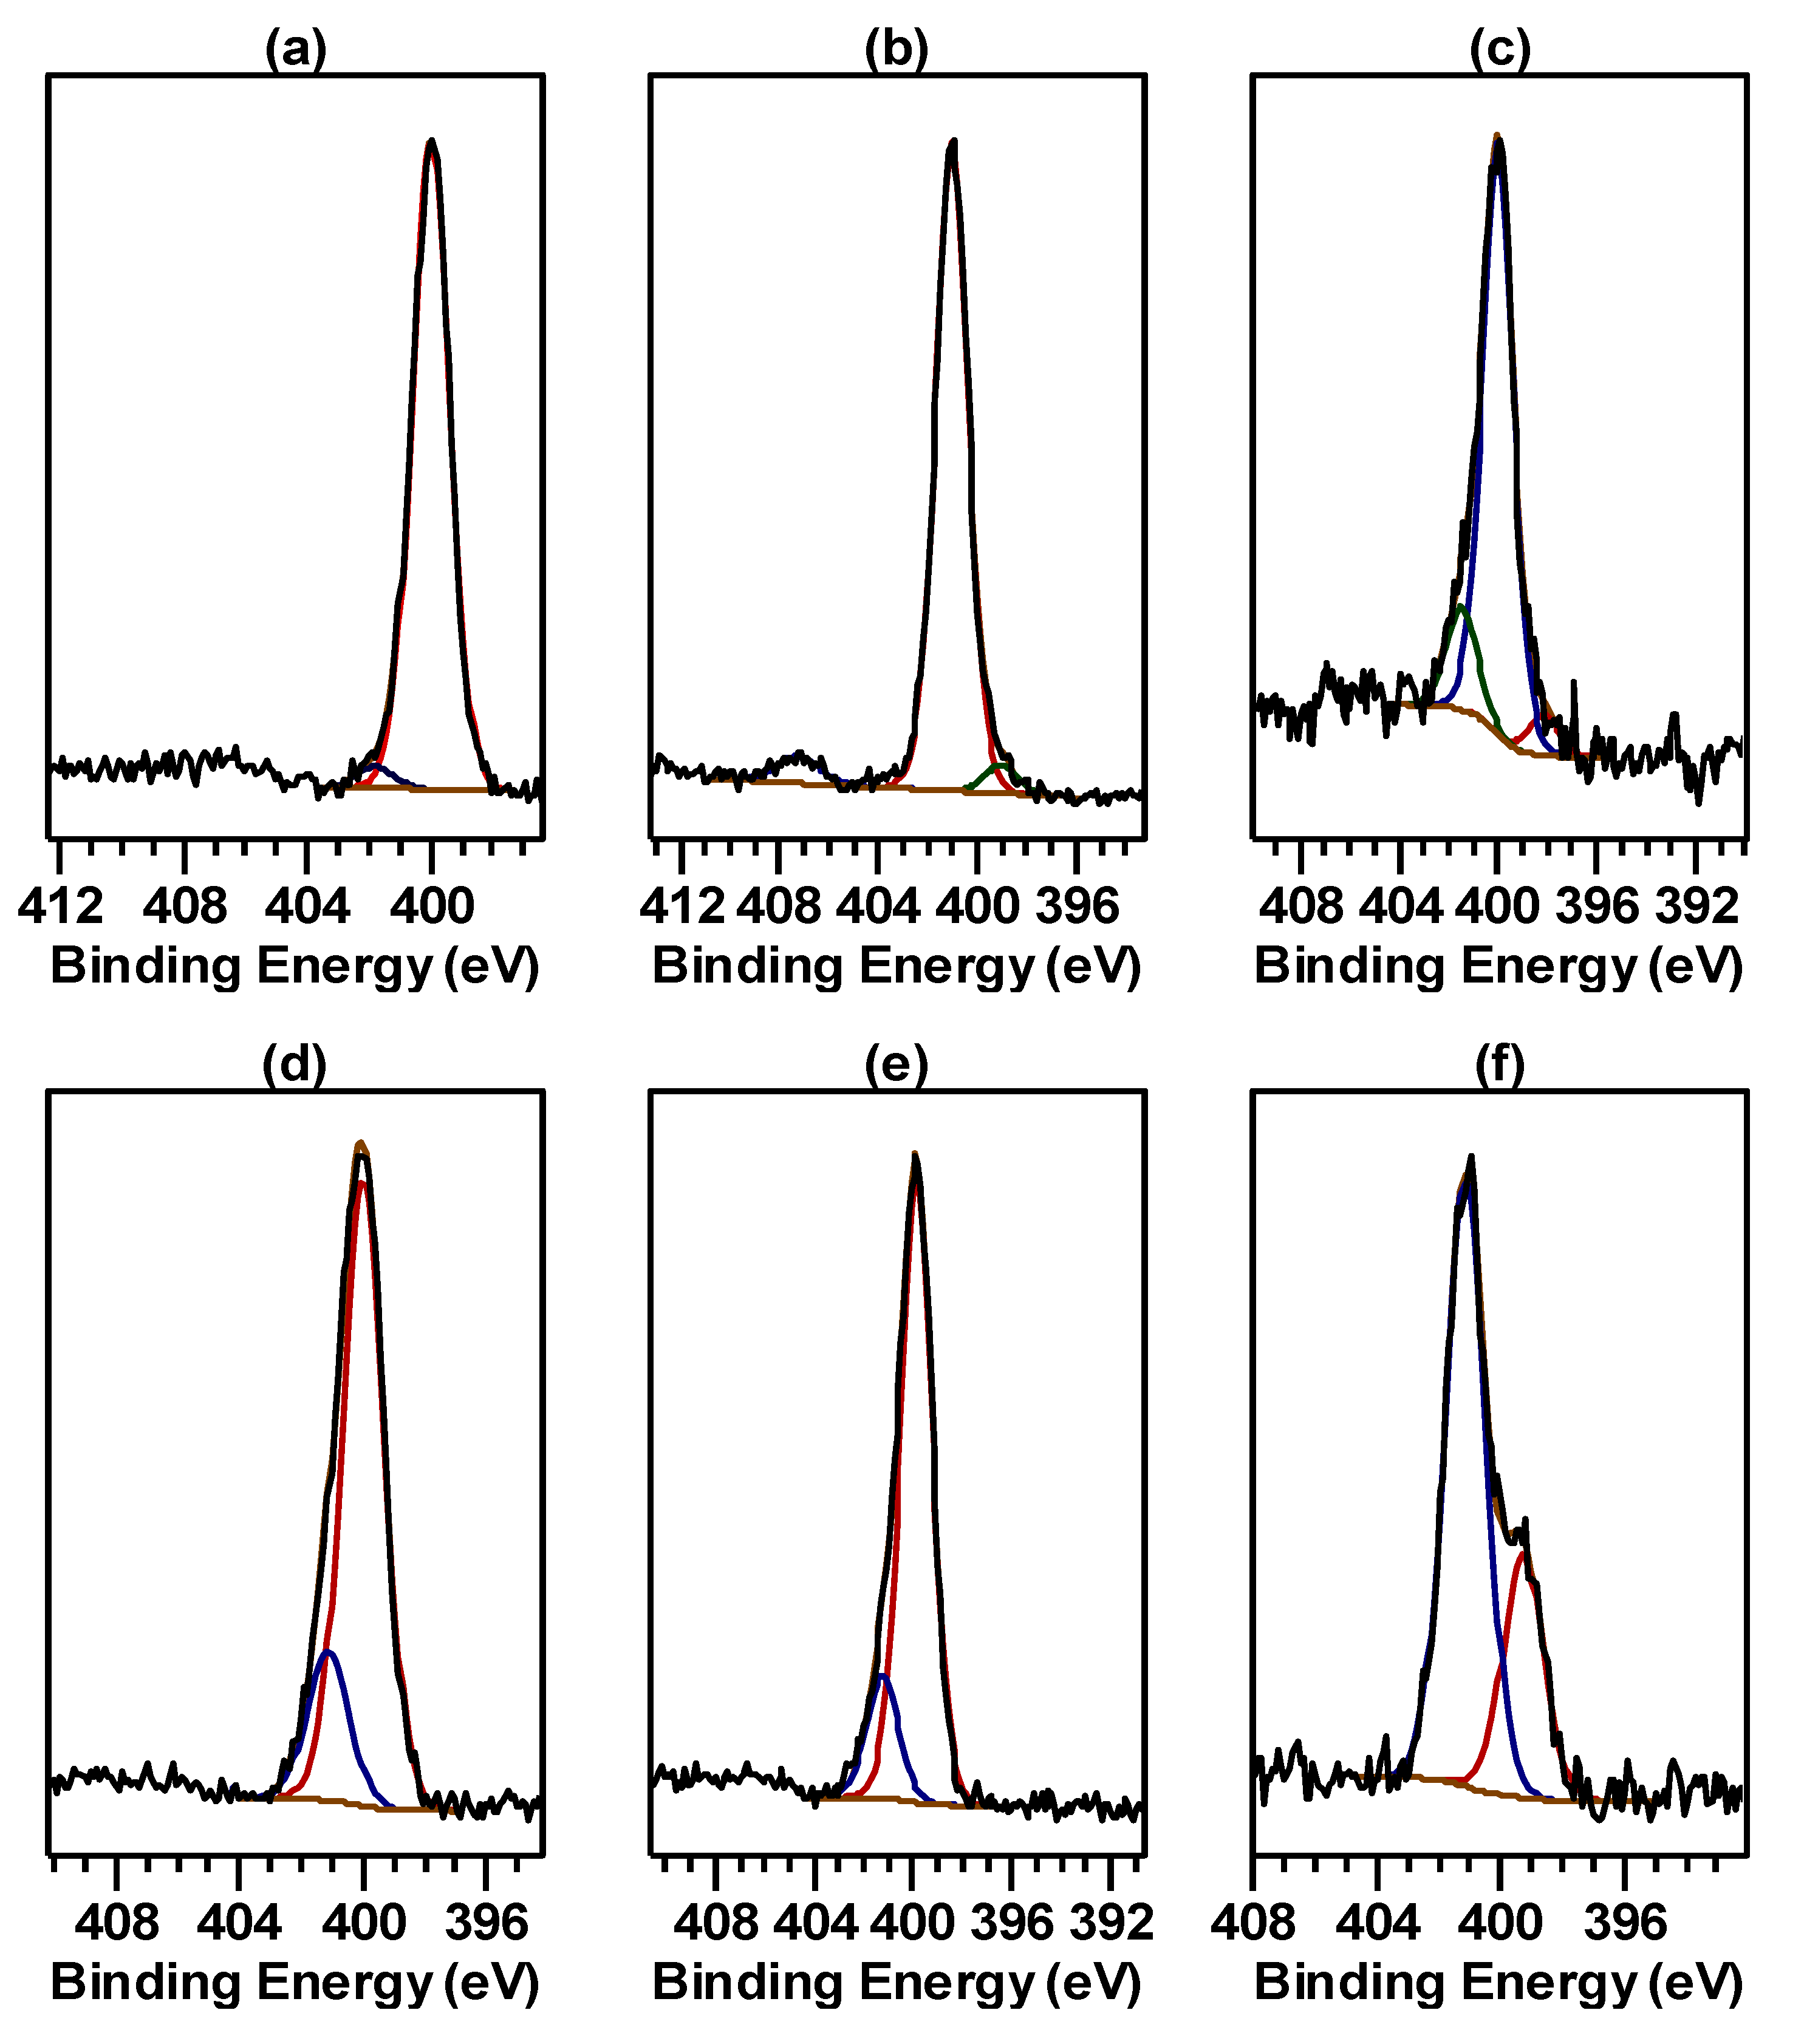
2.1. X-ray Photoelectron Spectra of Cu Hydroximate and Fe Hydroxamate
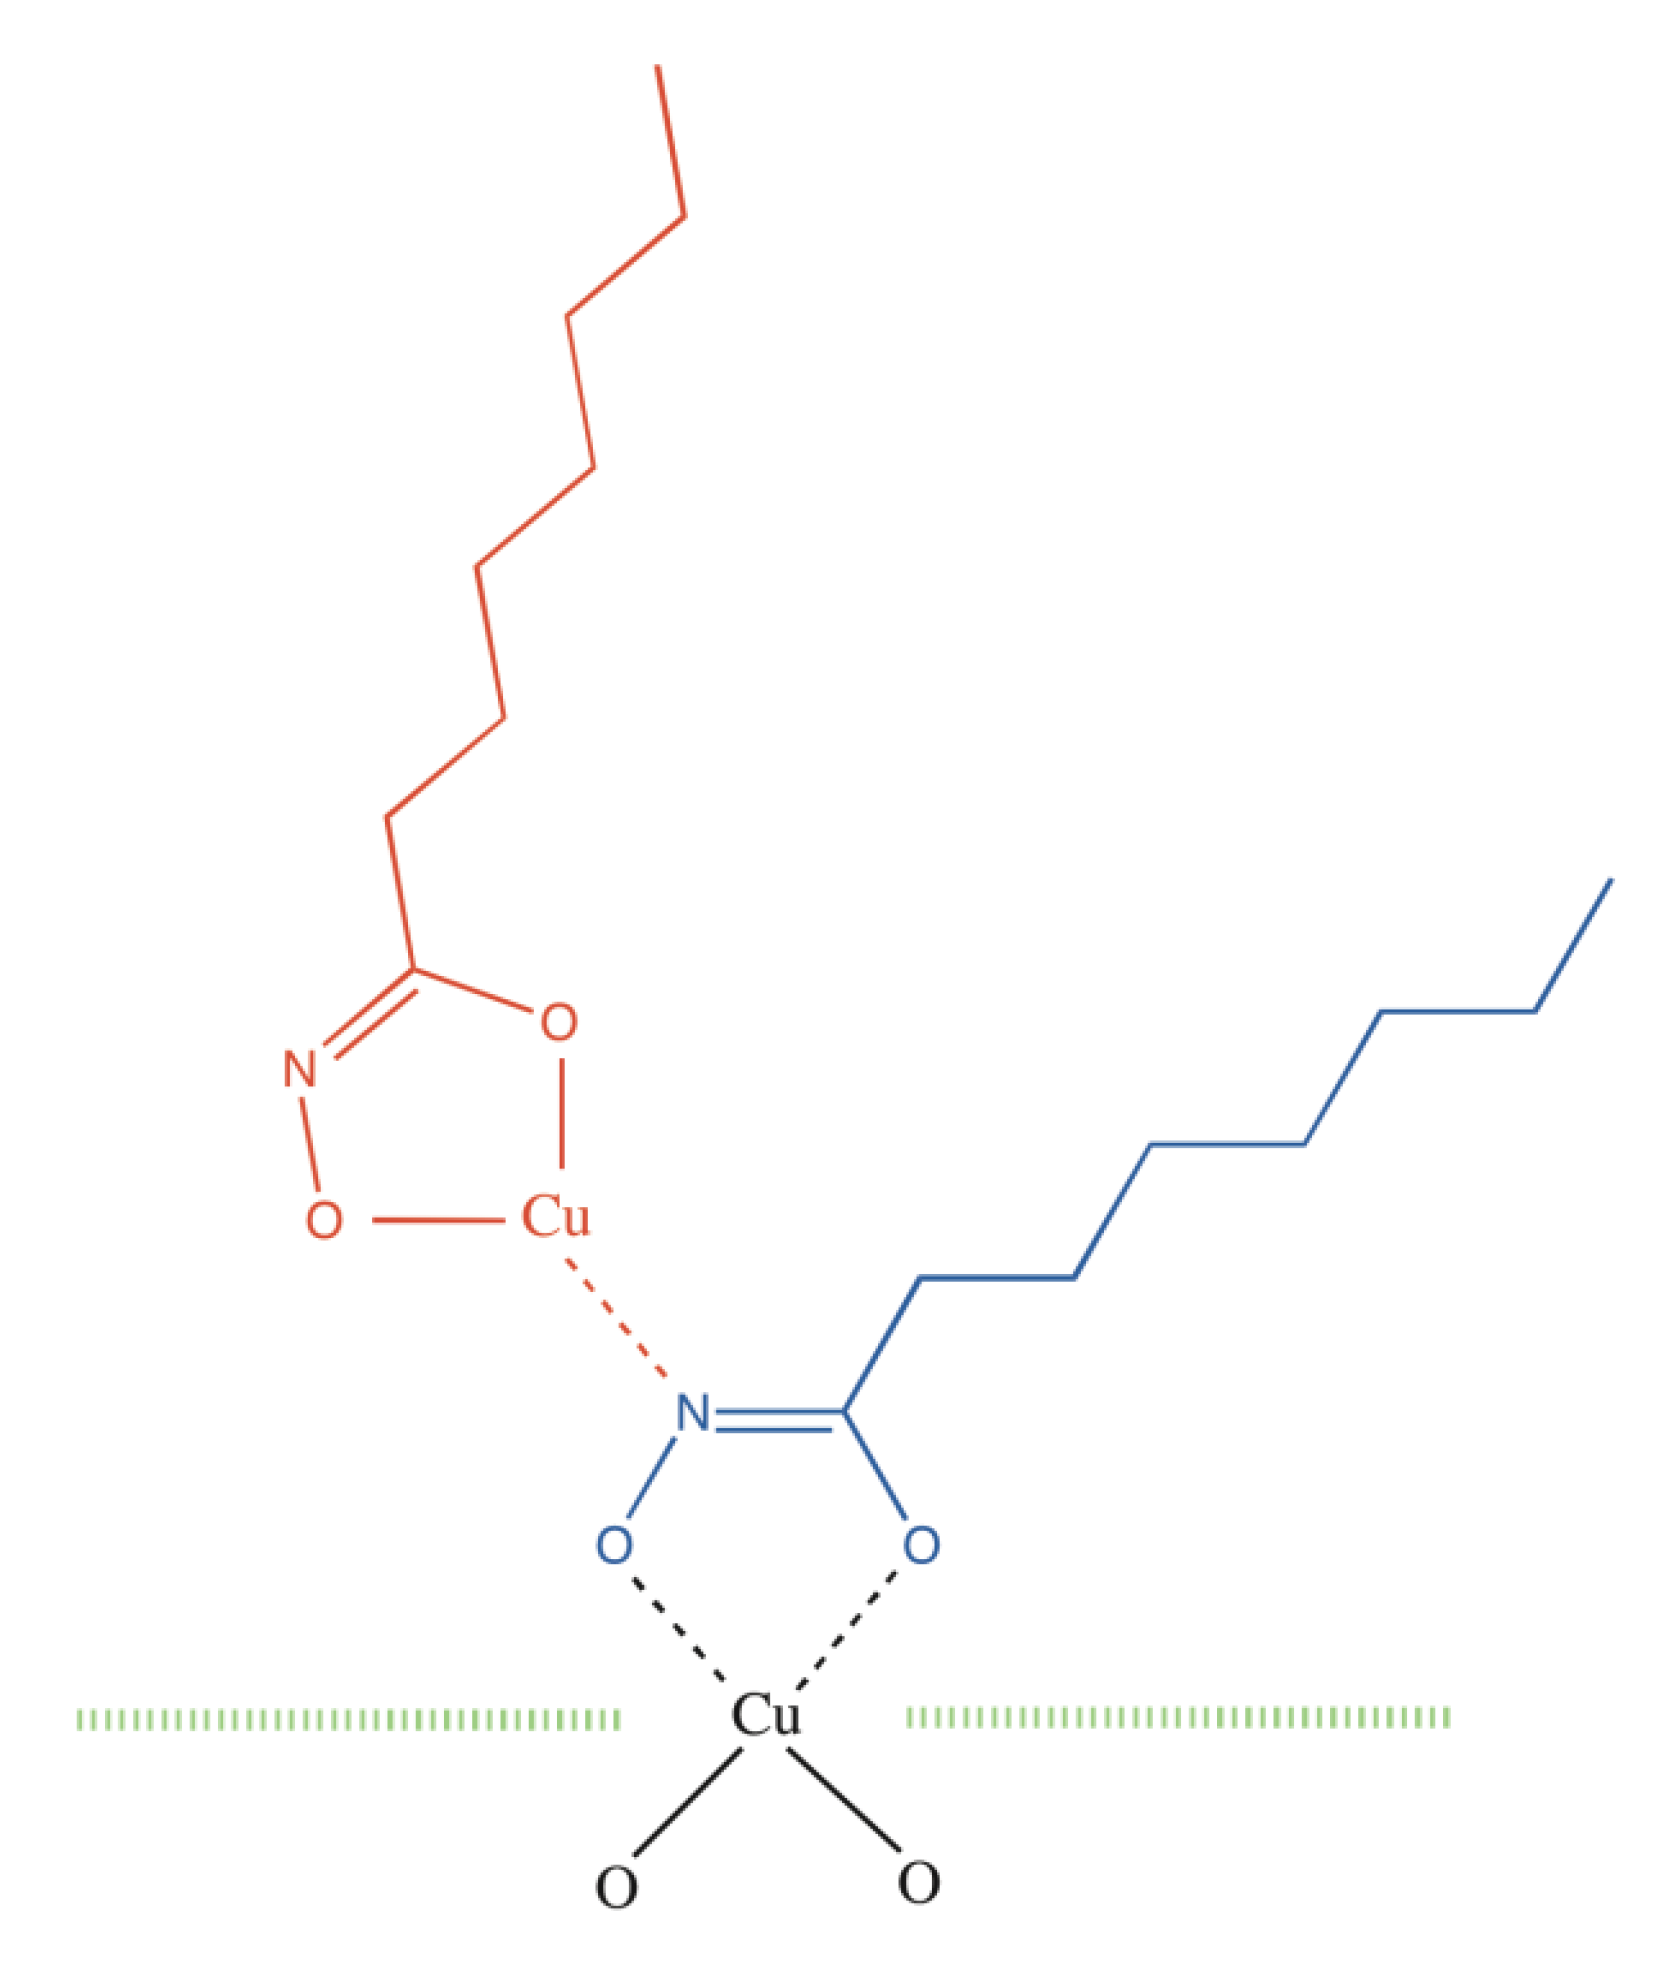
2.1.1. Cu Hydroximate XPS
2.1.2. Fe Hydroxamate XPS
2.2. Static Secondary Ion Mass Spectra of Cu Hydroximate and Fe Hydroxamate
2.2.1. Cu Hydroximate ToF-SIMS


| Ion | Mass (amu) | Cu hydroximate observed m/z range | Cu hydroximate abundance (rel. Cu) | Cu hydroximate abundance (rel. organic) | Cu metal Observed m/z range | Cu metal abundance (rel. Cu) | Cu metal abundance (rel. organic) |
|---|---|---|---|---|---|---|---|
| 39K+ | 38.9637 | - | - | - | 38.964–38.965 | 12 ± 7 | 3.5 ± 2 |
| 40Ca+ | 39.9626 | - | - | - | 39.961–39.962 | 33 ± 6 | 9 ± 1.5 |
| 63Cu+ | 62.9296 | 62.920–62.932 | 1,000 | 350 ± 140 | 62.924–62.927 | 1000 | 275 ± 20 |
| C5H11+ | 71.086 | 71.083–71.088 | 2.9 ± 0.7 | 1 | 71.089–71.092 | 3.6 ± 0.4 | 1 |
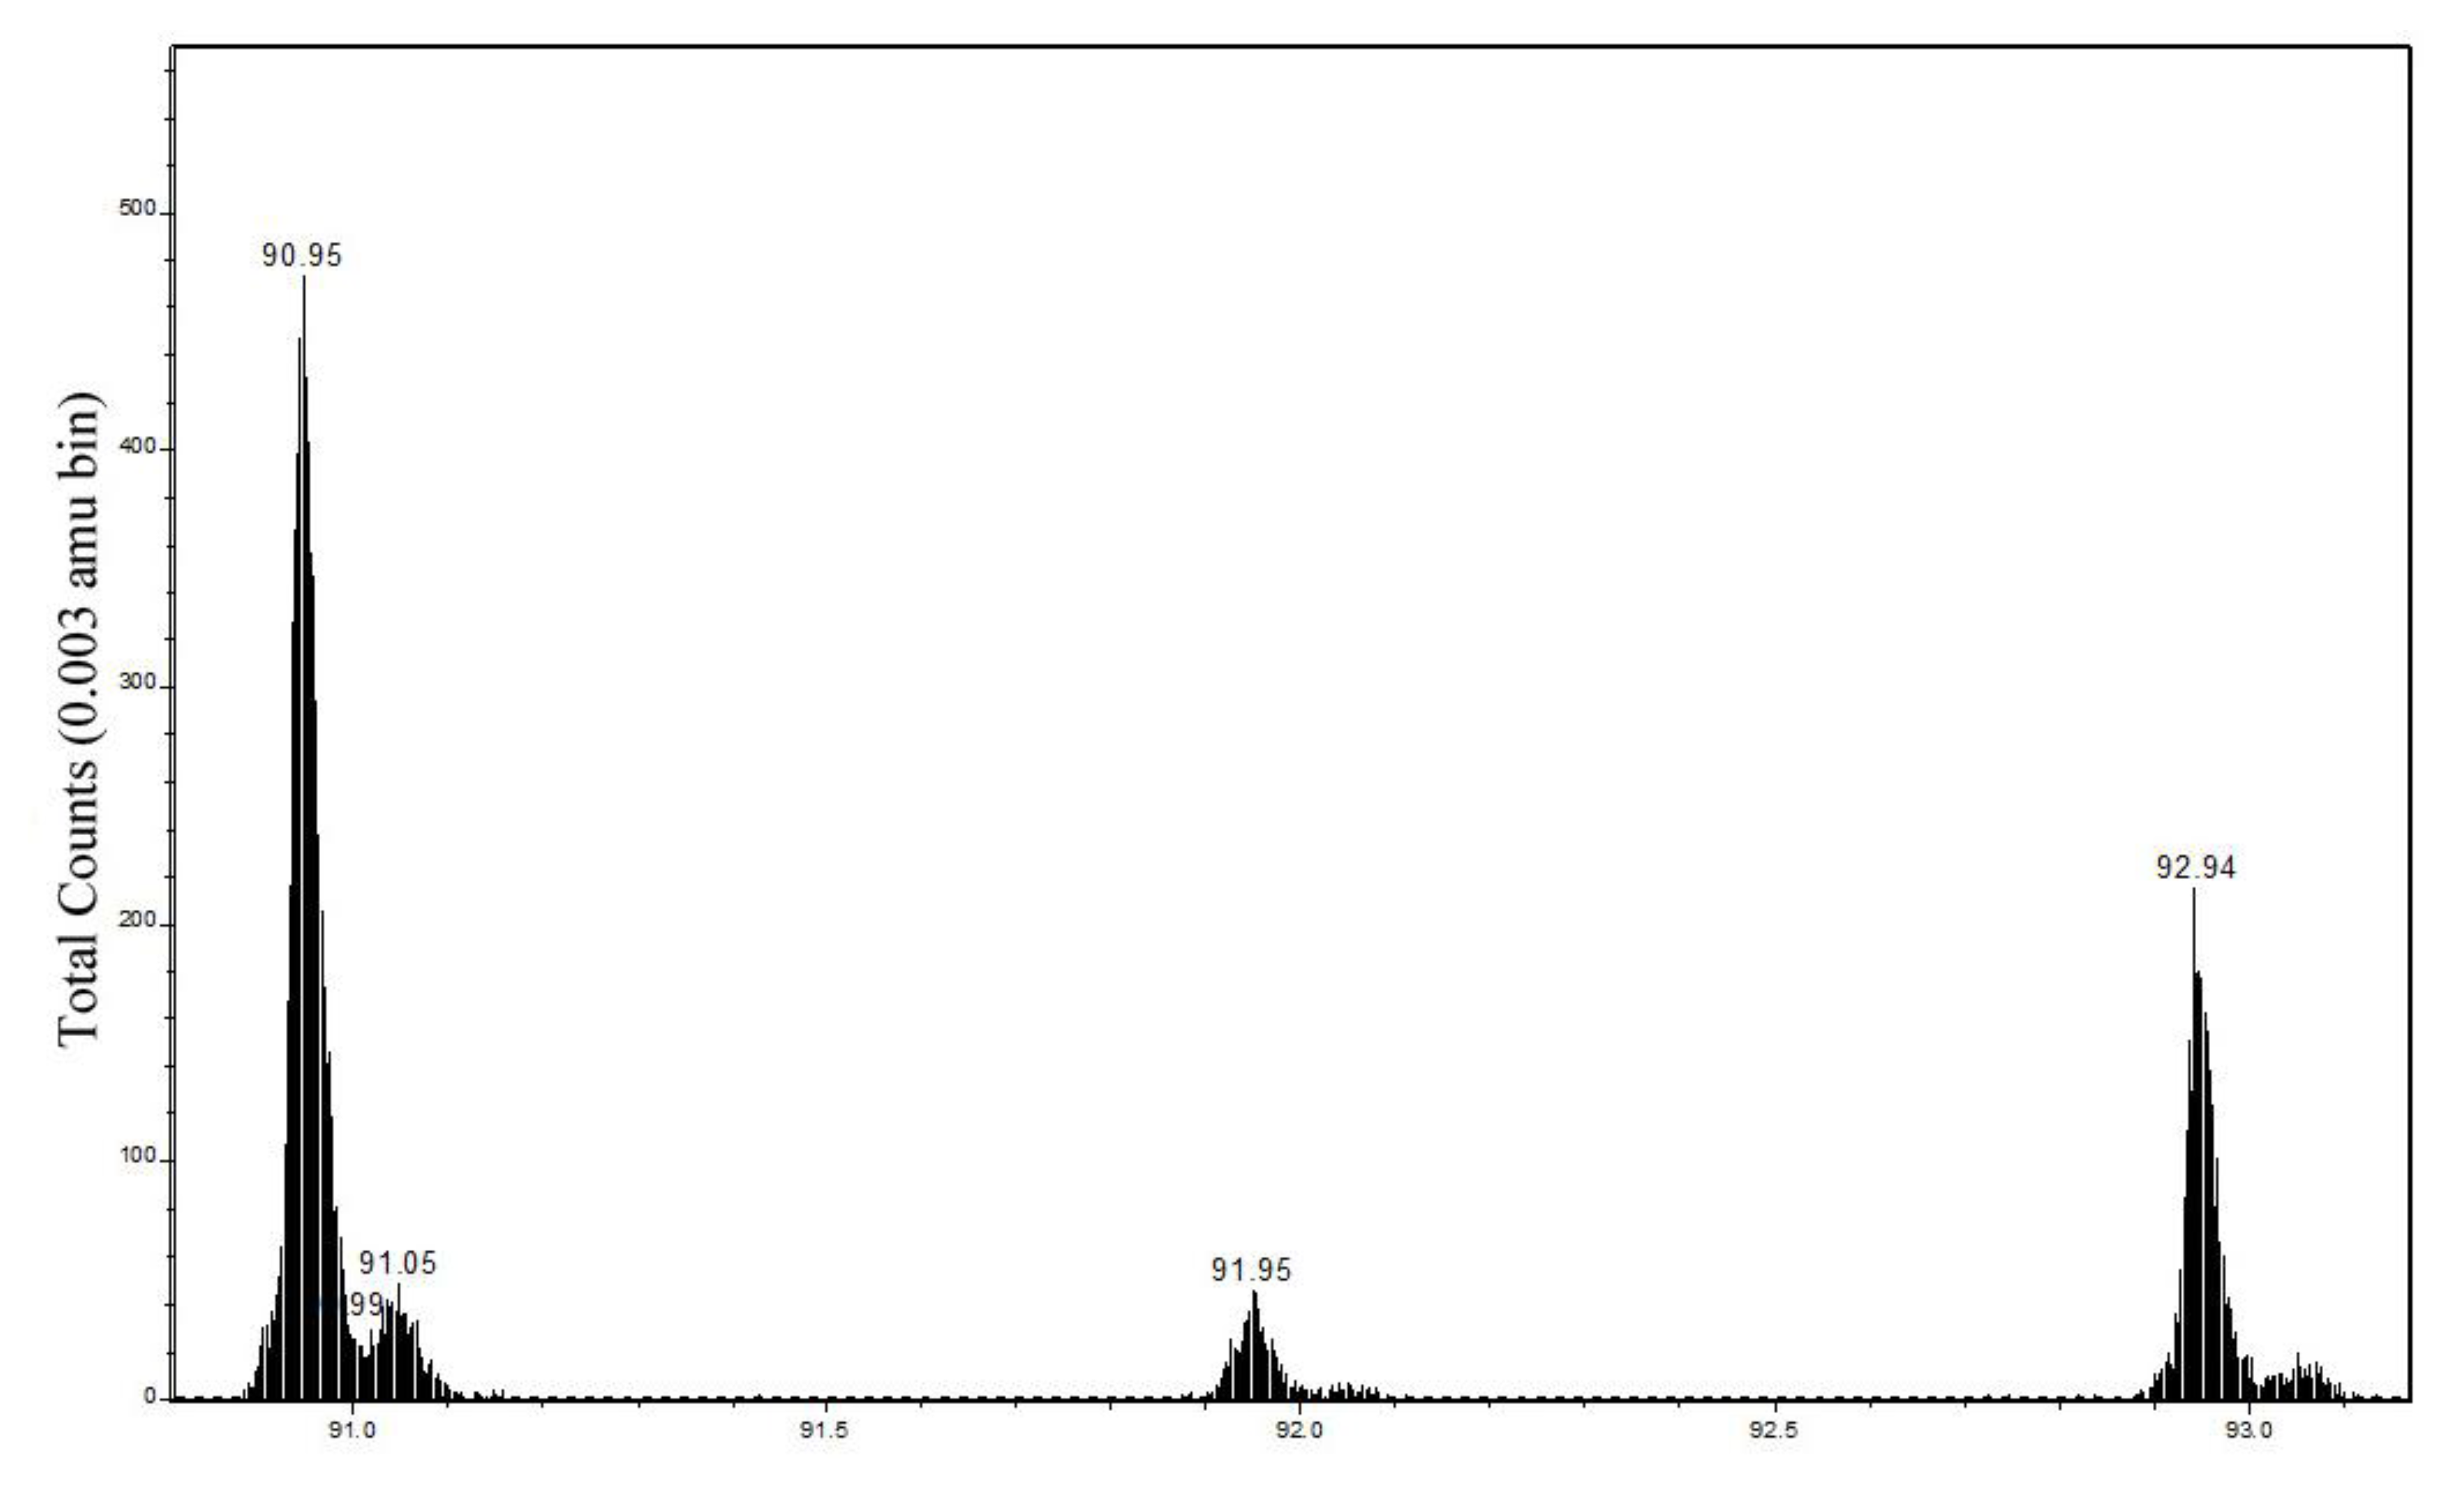
| 63CuNCH2+ | 90.949 | 90.951–90.961 | 47 ± 4 | 18 ± 5 | 90.954–90.957 | 36 ± 2 | 10 ± 1 |
| 63CuC2H4+ | 90.962 | ||||||
| 63CuNC2H4+ | 104.964 | 104.964–104.974 | 10 ± 1 | 3.5 ± 1.5 | 104.969–104.973 | 6.1 ± 0.5 | 1.9 ± 0.3 |
| 63CuC3H6+ | 104.977 | ||||||
| 63CuNC3H6+ | 118.981 | 118.975–118.986 | 8.5 ± 0.5 | 3.5 ± 0.5 | 118.982–118.987 | 5.1 ± 0.2 | 1.45 ± 0.1 |
| 63CuC4H8+ | 118.994 | ||||||
| 63CuONC2H3+ | 119.951 | ~119.97 | <1 | <1 | ~119.98 | <1 | <1 |
| 63CuOC3H5+ | 119.964 | ||||||
| 63CuO2NCH2+ | 122.939 | ~122.96 | <1 | <1 | ~122.95 | <1 | <1 |
| 63CuO2C2H4+ | 122.951 | ||||||
| (hydroxamic acid)+ | 159.126 | 159.012–159.021 | 0.38 ± 0.03 | 0.16 ± 0.02 | 159.140–159.151 | 5 ± 4 | 1.1 ± 1 |
| 63Cu− | 62.9296 | 62.928–62.933 | 10 | 7.5 ± 4 | 62.930–62.932 | 10 | 1.8 ± 0.2 |
| 63CuH− | 63.9374 | 63.944–63.947 | 15 ± 0.5 | 12 ± 5 | 63.937–63.951 | 3 ± 1.5 | 3 ± 1.3 |
| C3H3O2− | 71.0133 | 71.017–71.022 | 2 ± 1 | 1 | 71.017–71.018 | 5 ± 1 | 1 |
| C4H9O− | 73.065 | 73.067–73.072 | 0.7 ± 0.2 | 0.7 ± 0.4 | 73.054–73.072 | 0.4 ± 0.05 | 0.07 ± 0.02 |
| 63CuONCH− | 105.935 | 105.939–105.944 | 6 ± 1 | 4.4 ± 2 | 105.940–105.943 | 6.8 ± 0.5 | 1.2 ± 0.2 |
| 63CuOC2H3− | 105.948 | ||||||
| 63CuO2NCH− | 121.930 | 121.934–121.939 | 10 ± 2 | 8.7 ± 3 | 121.937–121.938 | 14.5 ± 1 | 2.4 ± 0.2 |
| 63CuO2C2H3− | 121.943 | ||||||
| 63CuONC3H2− | 130.943 | 130.936–130.942 | 7 ± 0.8 | 6 ± 1.5 | 130.937–130.940 | 7.5 ± 0.5 | 1.2 ± 0.1 |
| 63CuOC4H4− | 130.956 | ||||||
| 63CuO2NC3H2− | 146.938 | 146.933–146.939 | 26 ± 5 | 24 ± 6 | 146.934–146.937 | 32 ± 2 | 5.5 ± 0.6 |
| 63CuO2C4H4− | 146.951 | ||||||
| (hydroxamic acid−H)− | 158.118 | 158.111–158.123 | 0.21 ± 0.01 | 0.20 ± 0.01 | 158.119–158.129 | 0.6 ± 0.1 | 0.10 ± 0.02 |
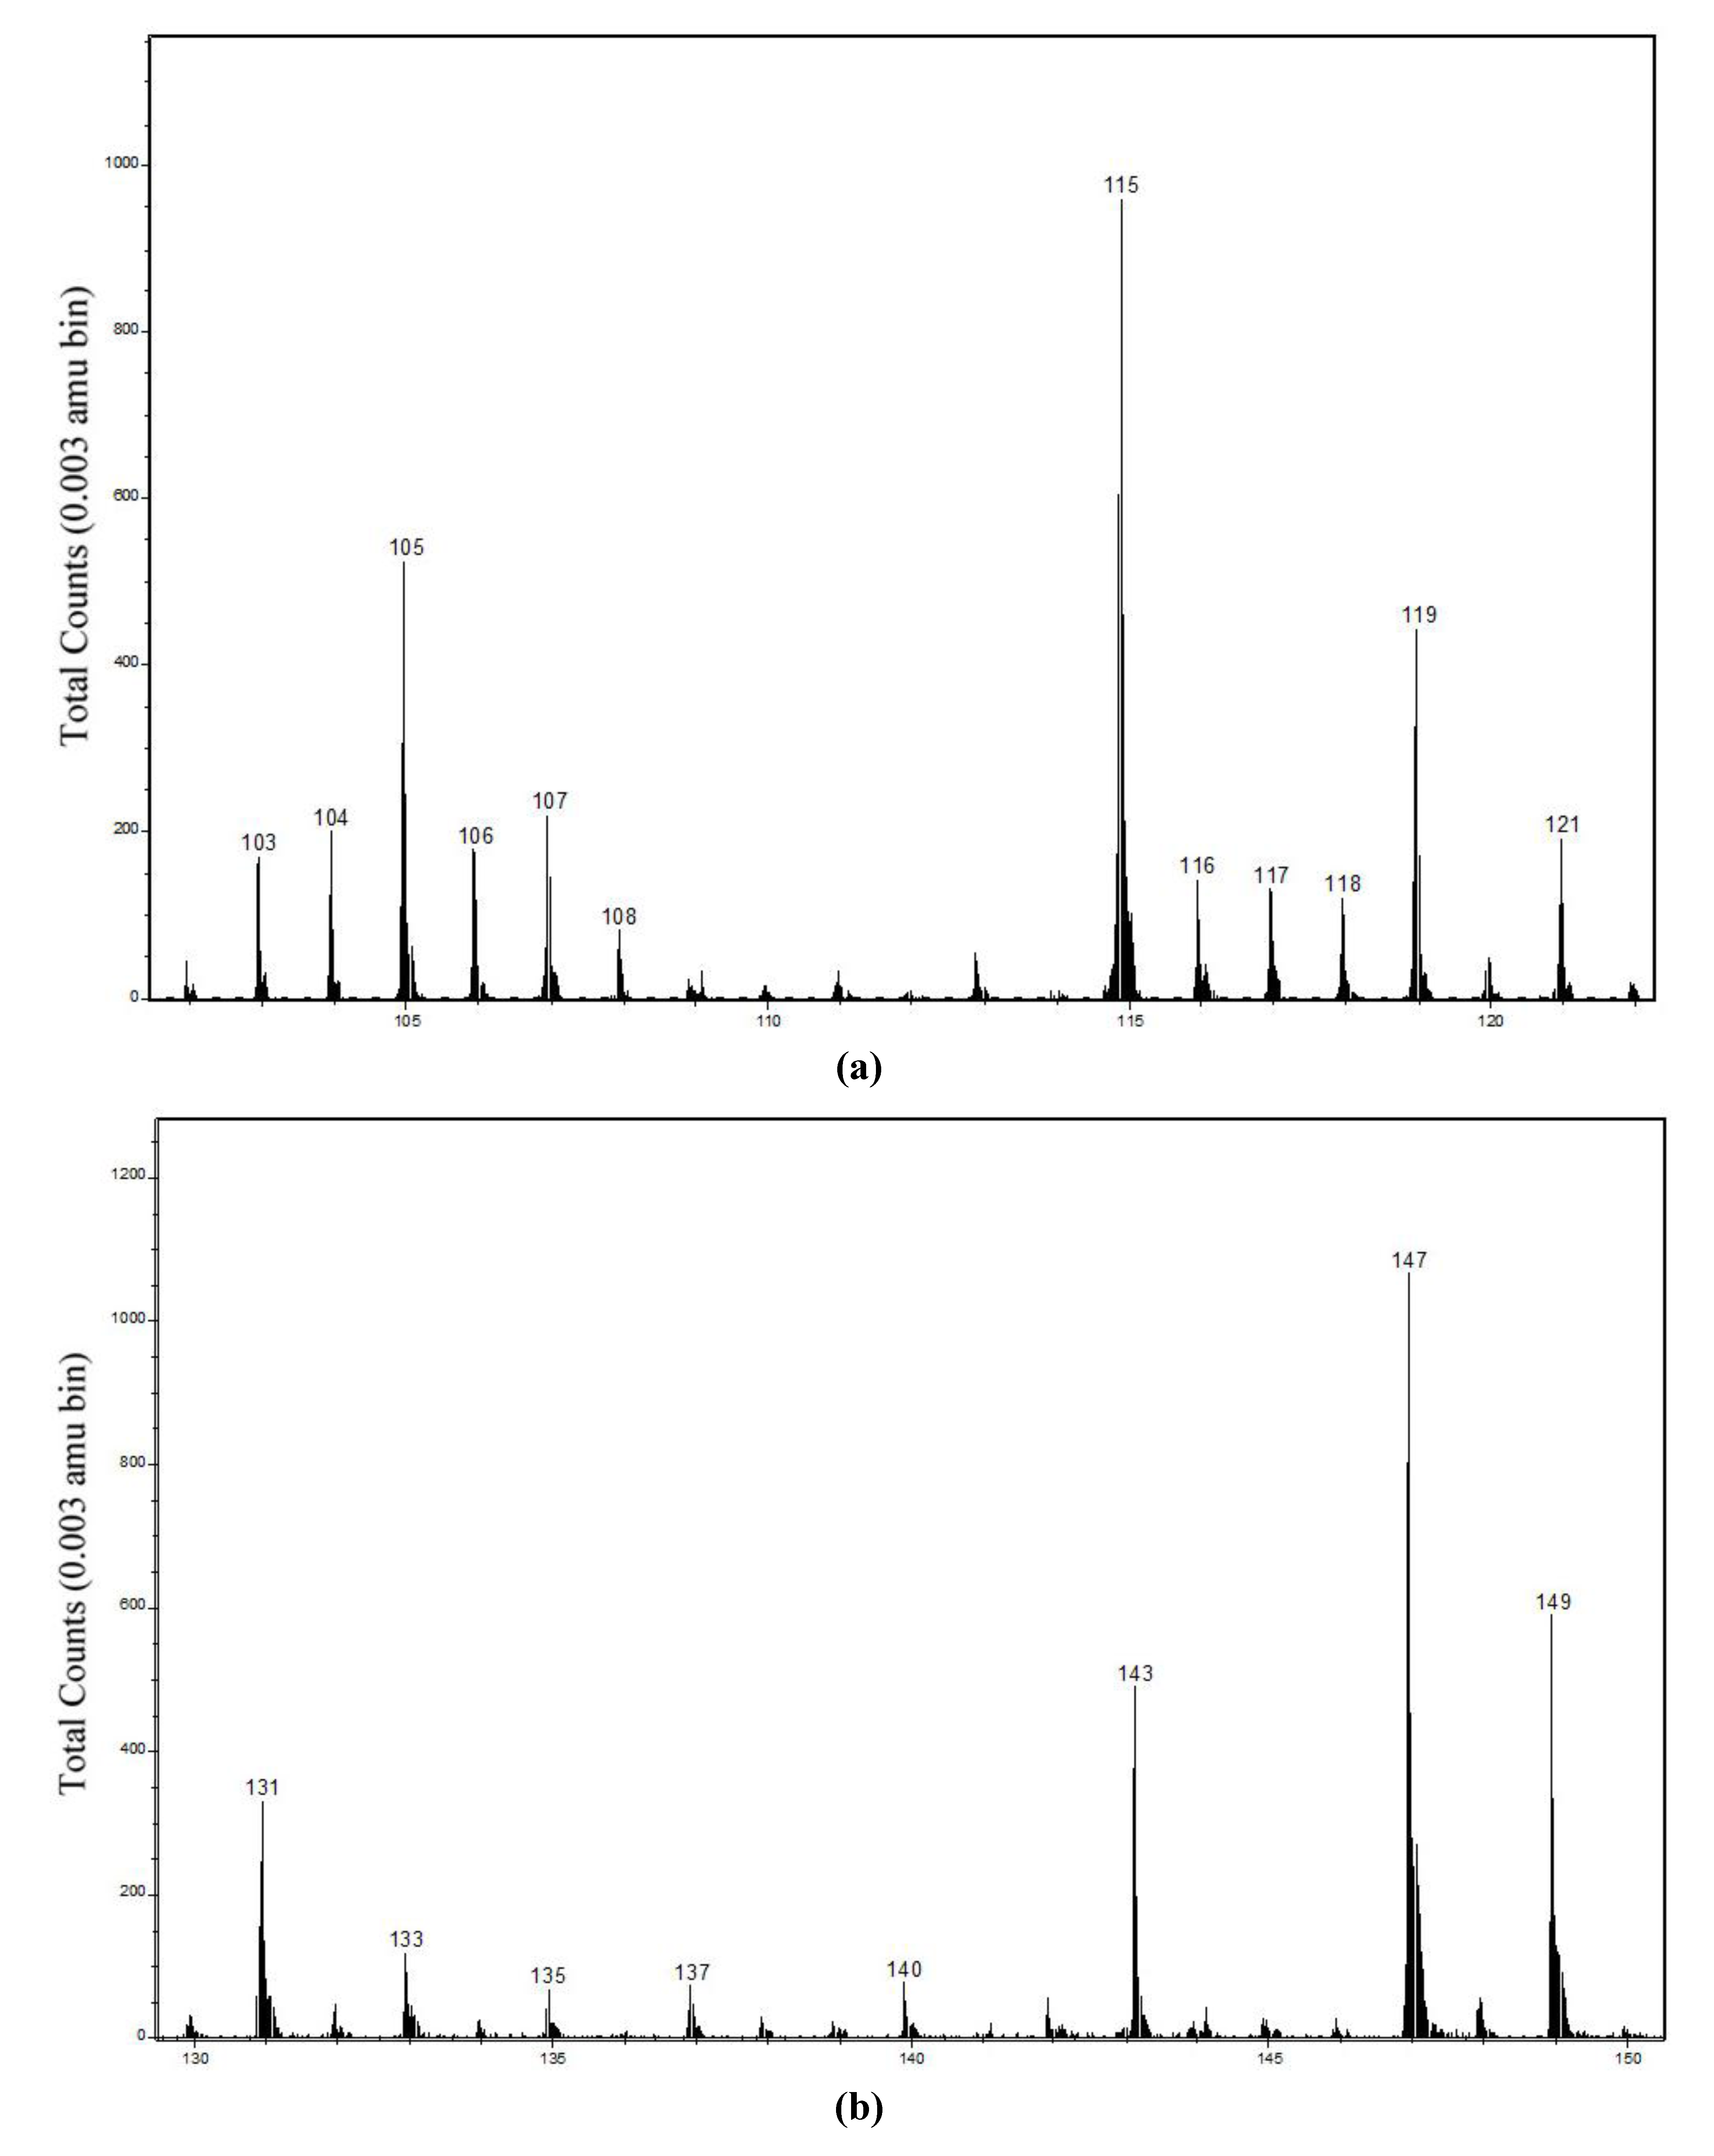
2.2.2. Fe Hydroxamate ToF-SIMS
| Ion | Mass (amu) | Fe hydroxamate Observed m/z range | Fe hydrox-amate Abundance (rel. Fe) | Fe hydrox-amate Abundance (rel. organic) | Magnetite Observed m/z range | Magnetite Abundance (rel. Fe) | Magnetite Abundance (rel. organic) |
|---|---|---|---|---|---|---|---|
| 39K+ | 38.9637 | - | - | - | 38.960-38.963 | 130 ± 45 | 145 ± 60 |
| 40Ca+ | 39.9626 | - | - | - | 39.954-39.960 | 156 ± 20 | 180 ± 45 |
| 56Fe+ | 55.9349 | 55.930–55.936 | 1000 | 675 ± 60 | 55.920–55.930 | 1000 | 1080 ± 100 |
| C4H9+ | 57.0704 | 57.071–57.072 | 158 ± 17 | 100 | 57.070–57.072 | 94 ± 9 | 100 |
| C5H11+ | 71.086 | 71.079–71.085 | 4.1 ± 0.5 | 4.1 ± 0.5 | 71.088–71.090 | 37 ± 3 | 40 ± 4.3 |
| 56FeNCH2+ | 70.946 | 70.953–70.959 | 41.5 ± 2.4 | 29.5 ± 1.5 | 70.945–70.954 | 16.8 ± 2.8 | 17.3 ± 3 |
| 56FeC2H4+ | 70.958 | ||||||
| 56FeNC2H4+ | 84.961 | 84.967–84.972 | 10.6 ± 0.8 | 10.6 ± 0.8 | 84.958–84.968 | 9 ± 0.8 | 9.5 ± 1.3 |
| 56FeC3H6+ | 84.974 | ||||||
| 56FeNC3H6+ | 96.961 | 96.965–96.970 | 12.6 ± 1.2 | 12.7 ± 1.2 | 96.959–96.968 | 12.8 ± 1.5 | 12.6 ± 2.5 |
| 56FeC4H8+ | 96.974 | ||||||
| 56FeONC2H3+ | 112.956 | 112.954–112.959 | 6.8 ± 0.8 | 6.8 ± 0.8 | 112.966–112.982 | 4 ± 0.8 | 4.3 ± 1.1 |
| 56FeOC3H4+ | 112.969 | ||||||
| 56FeO2NCH2+ | 115.943 | 115.937–115.941 | 8.3 ± 1 | 8.3 ± 1 | 115.933–115.939 | 1.4 ± 0.5 | 1.55 ± 0.65 |
| 56FeO2C2H4+ | 115.956 | ||||||
| (hydroxamic acid)+ | 159.126 | no peak | - | - | 159.137–159.141 | 82 ± 50 | 75 ± 44 |
| 56Fe− | 55.9349 | 55.929–55.937 | 3.4 ± 0.2 | 3.3 ± 0.7 | 55.927–55.932 | 3.1 ± 0.7 | 1.2 ± 0.3 |
| 56FeH− | 56.9427 | 56.936–56.945 | 10 | 9.6 ± 1.6 | 56.935–56.940 | 10 | 4.2 ± 0.9 |
| C2H2O2− | 58.005 | 57.994–58.000 | 10.8 ± 1.8 | 10 | 58.005–58.009 | 24 ± 7 | 10 |
| C3H3O2− | 71.0133 | 71.016–71.023 | 5.6 ± 1.2 | 4.5 ± 1.1 | 71.017–71.021 | 24 ± 7 | 10 ± 0.7 |
| 56FeONCH− | 98.941 | 98.938–98.950 | 24.5 ± 5.5 | 23.1 ± 1.7 | 98.948–98.952 | 5.6 ± 1.7 | 2.3 ± 0.3 |
| 56FeOC2H3− | 98.953 | ||||||
| 56FeO2NC− | 113.928 | 113.920–113.938 | 55 ± 11 | 49 ± 1.6 | 113.931–113.944 | 7 ± 2.6 | 2.7 ± 0.6 |
| 56FeO2C2H2− | 113.941 | ||||||
| 56FeO2NCH− | 114.936 | 114.931–114.948 | 91 ± 20 | 86 ± 7 | 114.940–114.952 | 9.3 ± 3.2 | 3.8 ± 0.7 |
| 56FeO2C2H3− | 114.949 | ||||||
| 56FeO2NC3H2− | 139.944 | 139.938–139.945 | 35 ± 6 | 36 ± 5 | 139.933–139.952 | 2.2 ± 1 | 0.8 ± 0.3 |
| 56FeO2C4H4− | 139.956 | ||||||
| (hydroxamic acid − H)− | 158.118 | 158.106–158.126 | 6.1 ± 1 | 5.9 ± 0.6 | 158.115–158.129 | 7.5 ± 2.4 | 2.7 ± 0.8 |
2.3. X-ray Photoelectron Spectra of Conditioned Cu and Fe Oxide Surfaces
2.3.1. Conditioned Cu Metal and Cu Mineral XPS
2.3.2. Conditioned Magnetite XPS
2.4. Static Secondary Ion Mass Spectra of Conditioned Cu and Fe Oxide Surfaces
2.4.1. Conditioned Cu Metal ToF-SIMS
| Peak m/z | Oxide surface/normalisation | |||||
|---|---|---|---|---|---|---|
| Cu metal/ | Cu metal/ | Malachite/ | Malachite/ | Pseudomalachite/ | Pseudomalachite/ | |
| Cu | organic | Cu | organic | Cu | organic | |
| +90.9 | 23% L | 44% L | 6% L | 39% H | 11% L | 17% H |
| +104.9 | 39% L | 46% L | 13% L | 43% H | 16% L | 17% H |
| +118.9 | 40% L | 59% L | 18% L | 29% H | 24% L | 11% L |
| −105.9 | 13% H | 73% L | 20% L | 57% L | 5% L | 53% L |
| −121.9 | 45% H | 72% L | 1% H | 55% L | 50% H | 39% L |
| −130.9 | 7% H | 80% L | 21% L | 63% L | 3% L | 58% L |
| −146.9 | 23% H | 77% L | 16% L | 65% L | 8% H | 57% L |
2.4.2. Conditioned Malachite and Pseudomalachite ToF-SIMS
| Ion | Mass (amu) | Malachite Observed m/z range | Malachite Abundance (rel. Cu) | Malachite Abundance (rel. organic) | Pseudo-malachite Observed m/z range | Pseudo-malachite Abundance (rel. Cu) | Pseudo-malachite Abundance (rel. organic) |
|---|---|---|---|---|---|---|---|
| 31P | 30.974 | - | - | - | 30.969–30.974 | 0.25 ± 0.1 | 0.1 ± 0.05 |
| 39K+ | 38.9637 | 38.963–38.965 | 15 ± 3 | 12 ± 6 | 38.961–38.966 | 22 ± 6 | 11.5 ± 3 |
| 40Ca+ | 39.9626 | 39.958–39.961 | 39 ± 4 | 22 ± 8 | 39.959–39.965 | 40 ± 15 | 18 ± 6 |
| 63Cu+ | 62.9296 | 62.919–62.926 | 1000 | 550 ± 160 | 62.923–62.933 | 1000 | 485 ± 90 |
| C5H11+ | 71.086 | 71.084–71.090 | 2 ± 0.6 | 1 | 71.087–71.091 | 2 ± 0.5 | 1 |
| 63CuNCH2+ | 90.949 | 90.951–90.957 | 44 ± 2 | 25 ± 8 | 90.953–90.961 | 42 ± 3.5 | 21 ± 4 |
| 63CuC2H4+ | 90.962 | ||||||
| 63CuNC2H4+ | 104.964 | 104.963–104.970 | 8.7 ± 0.6 | 5 ± 1.5 | 104.967–104.974 | 8.4 ± 0.6 | 4.1 ± 0.8 |
| 63CuC3H6+ | 104.977 | ||||||
| 63CuNC3H6+ | 118.981 | 118.973–118.986 | 7 ± 1.5 | 4.5 ± 1.5 | 118.982–118.988 | 6.5 ± 1 | 3.1 ± 0.7 |
| 63CuC4H8+ | 118.994 | ||||||
| (hydroxamic acid)+ | 159.126 | 159.148–159.156 | 2.5 ± 1.5 | 2.4 ± 1.7 | 159.136–159.156 | 2 ± 1.6 | 1 ± 0.8 |
| 31P− | 30.974 | - | - | - | 30.972–30.973 | 3 ± 2 | 1 ± 0.7 |
| 63Cu− | 62.9296 | 62.928–62.933 | 10 | 3.6 ± 0.7 | 62.928–62.931 | 10 | 4 ± 1.4 |
| PO2− | 62.964 | - | - | - | 62.965–62.967 | 19 ± 11 | 5.6 ± 2.3 |
| C3H3O2− | 71.0133 | 71.014–71.021 | 2.8 ± 0.5 | 1 | 71.014–71.023 | 2.8 ± 1 | 1 |
| 63CuONCH− | 105.935 | 105.940–105.949 | 4.8 ± 0.6 | 1.9 ± 0.3 | 105.943–105.948 | 5.7 ± 1.5 | 2.05 ± 0.25 |
| 63CuOC2H3− | 105.948 | ||||||
| 63CuO2NCH− | 121.930 | 121.936–121.945 | 10.1 ± 1.4 | 3.9 ± 0.9 | 121.941–121.947 | 15 ± 3.5 | 5.3 ± 1.2 |
| 63CuO2C2H3− | 121.943 | ||||||
| 63CuONC3H2− | 130.943 | 130.936–130.946 | 5.5 ± 1 | 2.2 ± 0.8 | 130.942–130.949 | 6.8 ± 1 | 2.5 ± 0.6 |
| 63CuOC4H4− | 130.956 | ||||||
| 63CuO2NC3H2− | 146.938 | 146.931–146.946 | 21.8 ± 2.5 | 8.5 ± 2 | 146.940–146.948 | 28 ± 5 | 10.3 ± 2.2 |
| 63CuO2C4H4− | 146.951 | ||||||
| (hydroxamic acid − H)− | 158.118 | 158.119–158.126 | 0.55 ± 0.15 | 0.22 ± 0.08 | 158.128–158.139 | 0.9 ± 0.2 | 0.4 ± 0.1 |
2.4.3. Conditioned Magnetite ToF-SIMS
| Peak m/z | Normalisation | |
|---|---|---|
| Fe | Organic | |
| +70.9 | 60% L | 41% L |
| +84.9 | 15% L | 10% L |
| +96.9 | 2% H | 1% L |
| +112.9 | 41% L | 37% L |
| +115.9 | 83% L | 81% L |
| −98.9 | 77% L | 90% L |
| −113.9 | 87% L | 94% L |
| −114.9 | 90% L | 54% L |
| −139.9 | 94% L | 98% L |
3. Experimental Details
3.1. Materials and Surfaces Characterised
3.2. X-ray Photoelectron Spectroscopy
3.3. Static SIMS
4. Conclusions
Acknowledgments
References
- Hope, G.A.; Woods, R.; Buckley, A.N.; White, J.M.; McLean, J. Spectroscopic characterisation of n-octanohydroxamic acid and potassium hydrogen n-octanohydroxamate. Inorg. Chim. Acta 2010, 363, 935–943. [Google Scholar] [CrossRef]
- Liu, W.; Wang, B.; Dai, S.; Ma, A.; Wei, D. Current application and development prospect of hydroxamic acid in flotation. Non-Ferr. Min. Metall. 2006, 22, 25–27. [Google Scholar]
- Parker, G.K.; Hope, G.A.; Woods, R.; Numprasanthai, A.; Buckley, A.N.; McLean, J. Investigation of n-octanohydroxamate reagent interaction with the surface of oxide copper minerals and copper metal. In Separation Technologies for Minerals, Coal, and Earth Resources; Young, C.A., Luttrell, G.H., Eds.; SME Inc.: Englewood, CO, USA, 2012; pp. 497–508. [Google Scholar]
- Parker, G.K.; Buckley, A.N.; Woods, R.; Hope, G.A. The interaction of the flotation reagent, n-octanohydroxamate, with sulfide minerals. Miner. Eng. 2012, 36–38, 81–90. [Google Scholar] [CrossRef]
- Cui, J.; Hope, G.A.; Buckley, A.N. Spectroscopic investigation of the interaction of hydroxamate with bastnaesite (cerium) and rare earth oxides. Miner. Eng. 2012, 36–38, 91–99. [Google Scholar] [CrossRef]
- Vickerman, J.C. Molecular SIMS—A journey from single crystal to biological surface studies. Surf. Sci. 2009, 603, 1926–1936. [Google Scholar]
- Goh, S.W.; Buckley, A.N.; Lamb, R.N.; Woods, R. The ability of static secondary ion mass spectrometry to discriminate submonolayer from multilayer adsorption of thiol collectors. Miner. Eng. 2006, 19, 571–581. [Google Scholar] [CrossRef]
- Hope, G.A.; Woods, R.; Parker, G.K.; Buckley, A.N.; McLean, J. Spectroscopic characterisation of copper acetohydroxamate and copper n-octanohydroxamate. Inorg. Chim. Acta 2011, 365, 65–70. [Google Scholar]
- Folkers, J.P.; Gorman, C.B.; Laibinis, P.E.; Buchholz, S.; Whitesides, G.M.; Nuzzo, R.G. Self-assembled monolayers of long-chain hydroxamic acids on the native oxides of metals. Langmuir 1995, 11, 813–824. [Google Scholar] [CrossRef]
- Keszthelyi, T.; Paszti, Z.; Rigo, T.; Hakkel, O.; Telegdi, J.; Guczi, L. Investigation of solid surfaces modified by Langmuir-Blodgett monolayers using sum-frequency vibrational spectroscopy and X-ray photoelectron spectroscopy. J. Phys. Chem. B 2006, 110, 8701–8714. [Google Scholar]
- Failes, T.W.; Hambley, T.W. Crystal structures of tris(hydroxamato) complexes of iron(III). Aust. J. Chem. 2000, 53, 879–881. [Google Scholar] [CrossRef]
- Hope, G.A.; Buckley, A.N.; Parker, G.K.; Numprasanthi, A.; Woods, R.; McLean, J. The interaction of n-octanohydroxamate with chrysocolla and oxide copper surfaces. Miner. Eng. 2012, 36–38, 2–11. [Google Scholar]
- Fuerstenau, D.W.; Pradip. Mineral flotation with hydroxamate collectors. In Reagents in the Minerals Industry; Jones, M.J., Oblatt, R., Eds.; Institution of Mining Metallurgy: London, UK, 1984; pp. 161–168. [Google Scholar]
- King, A.; Henkel, T.; Rost, D.; Lyon, I.C. Determination of relative sensitivity factors during secondary ion sputtering of silicate glasses by Au+, Au2+ and Au3+ ions. Rapid Commun. Mass Spectrom. 2010, 24, 15–20. [Google Scholar]
- Green, F.M.; Gilmore, I.S.; Seah, M.P. TOF-SIMS: Accurate mass scale calibration. J. Am. Soc. Mass Spectrom. 2006, 17, 514–523. [Google Scholar]
© 2012 by the authors; licensee MDPI, Basel, Switzerland. This article is an open-access article distributed under the terms and conditions of the Creative Commons Attribution license (http://creativecommons.org/licenses/by/3.0/).
Share and Cite
Buckley, A.N.; Denman, J.A.; Hope, G.A. The Adsorption of n-Octanohydroxamate Collector on Cu and Fe Oxide Minerals Investigated by Static Secondary Ion Mass Spectrometry. Minerals 2012, 2, 493-515. https://doi.org/10.3390/min2040493
Buckley AN, Denman JA, Hope GA. The Adsorption of n-Octanohydroxamate Collector on Cu and Fe Oxide Minerals Investigated by Static Secondary Ion Mass Spectrometry. Minerals. 2012; 2(4):493-515. https://doi.org/10.3390/min2040493
Chicago/Turabian StyleBuckley, Alan N., John A. Denman, and Gregory A. Hope. 2012. "The Adsorption of n-Octanohydroxamate Collector on Cu and Fe Oxide Minerals Investigated by Static Secondary Ion Mass Spectrometry" Minerals 2, no. 4: 493-515. https://doi.org/10.3390/min2040493