Article

State of Health Estimation of Li-ion Batteries with Regeneration Phenomena: A Similar Rest Time-Based Prognostic Framework

1
School of Reliability and Systems Engineering, Beihang University, Beijing 100191, China
2
IVHM Centre, Cranfield University, Cranfield MK43 0AL, UK
3
Science and Technology on Reliability and Environmental Engineering Laboratory, Beijing 100191, China
*
Author to whom correspondence should be addressed.
Symmetry 2017, 9(1), 4; https://doi.org/10.3390/sym9010004
Submission received: 31 October 2016 / Revised: 17 December 2016 / Accepted: 21 December 2016 / Published: 24 December 2016
(This article belongs to the Special Issue Symmetry in Systems Design and Analysis)

Abstract

:
State of health (SOH) prediction in Li-ion batteries plays an important role in intelligent battery management systems (BMS). However, the existence of capacity regeneration phenomena remains a great challenge for accurately predicting the battery SOH. This paper proposes a novel prognostic framework to predict the regeneration phenomena of the current battery using the data of a historical battery. The global degradation trend and regeneration phenomena (characterized by regeneration amplitude and regeneration cycle number) of the current battery are extracted from its raw SOH time series. Moreover, regeneration information of the historical battery derived from corresponding raw SOH data is utilized in this framework. The global degradation trend and regeneration phenomena of the current battery are predicted, and then the prediction results are integrated together to calculate the overall SOH prediction values. Particle swarm optimization (PSO) is employed to obtain an appropriate regeneration threshold for the historical battery. Gaussian process (GP) model is adopted to predict the global degradation trend, and linear models are utilized to predict the regeneration amplitude and the cycle number of each regeneration region. The proposed framework is validated using experimental data from the degradation tests of Li-ion batteries. The results demonstrate that both the global degradation trend and the regeneration phenomena of the testing batteries can be well predicted. Moreover, compared with the published methods, more accurate SOH prediction results can be obtained under this framework.

1. Introduction

Due to high efficiency and energy density, wide temperature range, low self-discharge rate and relatively long cycle life, Li-ion batteries have been widely used in various applications, such as hybrid and electric vehicles, trams, satellite, cell phones and laptops [1]. To ensure the performance and reliability of Li-ion batteries, the battery management system (BMS) has two core tasks: estimate the state-of-charge (SOC) and the state-of-health (SOH) [2,3]. SOC is the percentage of the remaining charge to the battery’s current maximum capacity [4], while SOH is the ability of a battery to provide its nominal capacity over its service lifetime [5]. Thus far, many robust and accurate approaches to estimate SOC have been studied [2,6,7,8]. However, the development of the SOH estimation methods is still much more challenging problem.
The capacity degradation is the result of various processes and their interactions, such as chemical side reactions or loss of conductivity [1,9,10]. Therefore, it is difficult to monitor the internal state of a battery in real time and to establish an accurate physics-based model. In recent years, data-driven approaches have become a popular direction because they can achieve health state prognostics based only on monitoring parameters and testing data samples [11]. That is to say, it does not need to explicitly model complex electrochemical reaction and related principles. In the literature, many data-driven methods, such as auto-regressive model [12], particle filter (PF) [13,14], Gaussian process regression [15], Wiener process [16], relevance vector machine (RVM) [17], Bayesian approach [18], support vector machine (SVM) [19] and neural networks [20,21], have been used for battery SOH and remaining useful life (RUL) prediction in various applications. In these applications, because capacity is available for online monitoring with low cost, it becomes the most common used health indicator of battery SOH. However, the existence of capacity regeneration phenomena remains a big challenge for SOH prediction [22].
Researchers have indicated that reaction products in batteries may dissipate during the rest time and lead to charge regeneration. Some researchers have approximately described the law of capacity regeneration by the empirical model of charge regeneration [16,23,24]. However, the mechanism of charge regeneration and capacity regeneration may be quite different. Because self-recharge phenomenon just needs about 10 min to become steady, while the appearance of obvious capacity regeneration needs around 2 h of rest-time [25]. Therefore, the short relaxation of 10 min will not lead to the increase of battery capacity. Some researchers have assumed that capacity regeneration has certain regularity over time [25]. Liu [15] has predicted SOH regeneration and degradation based on a combination of two Gaussian progress function regression models. He [26] has decoupled local regeneration and global degradation with wavelet and predicted them respectively. However, capacity regeneration phenomenon is related to the rest time which is determined by practical application demands [25]. It is hard to accurately predict the regeneration phenomenon without considering rest time. Some researchers have treated the capacity regeneration as uncertainty (unpredictable disturbance). Olivares [27] and Orchard [28] have provided some approaches to detect the regeneration phenomenon and predicted SOH by isolating the effects of regeneration. Qin [29] has predicted the global degradation trend directly using the raw SOH data by improving the robustness of a prediction algorithm. Although these approaches can capture and predict the global degradation trend of batteries, they have failed to predict the regeneration phenomenon. Therefore, the SOH prediction errors around these related cycles are large. In recent years, it has been noted that there is a close relationship between the regeneration phenomenon and the rest time [16,25]. There are two possible ways of modeling the relationship between them. One way is to add an extra hardware to record the rest time during each charge-discharge cycle and establish the model of regeneration phenomenon and the rest time directly. The advantage of this approach is that it can predict the regeneration phenomenon even when this type of battery is used in the current scenario for the first time; the drawback is that the added extra hardware will increase the size and the cost of BMS. Another way is to indirectly consider the effects of the rest time by using the SOH data of a historical battery whose status (working time and rest time) is similar to the current battery. The advantage of this method is that it does not need a rest-time-recording hardware; the disadvantage is that it requires the degradation data of a historical battery. By comparing their advantages and disadvantages, designers can make a choice from the two approaches based on the actual demand.
The first approach is described in our previous work [30]. In this paper, the second approach called a similar rest time-based prognostic framework (SRTPF) is proposed. This framework is composed of extraction phase and prediction phase. In extraction phase, after giving the regeneration threshold value of the current battery, regeneration amplitude series, regeneration cycle number series and global degradation series of the current battery can be extracted from the raw SOH data. Particle swarm optimization (PSO) algorithm is adopted to determine the threshold value of the historical battery. Regeneration amplitude series and regeneration cycle number series of the historical battery are extracted from the raw SOH data of the historical battery. After that, in prediction phase, the above three series of the current battery are predicted and integrated to calculate the final SOH prediction values. In addition, Gaussian process (GP) model is used for the prediction of the global degradation trend. Linear models are adopted to predict regeneration amplitude series and regeneration cycle number series. Finally, the effectiveness of the proposed prognostic framework is validated using the NASA battery datasets.
The remainder of this paper is organized as follows: In Section 2, the related optimization model and prediction model are introduced. The proposed similar rest time-based prognostic framework is described in detail in Section 3. The effectiveness of the proposed framework is demonstrated via battery SOH prediction using NASA datasets in Section 4. Finally, the conclusion is provided in Section 5.

2. Related Work

2.1. PSO Algorithm

In 1995, PSO algorithm was first proposed by Kennedy and Eberhart [31]. The main thought is to find an optimal solution via fitness function(s). The velocities and positions of particles are updated by [12,32]:
v i k + 1 = w v i k + c 1 r 1 ( p b e s t i k x i k ) + c 2 r 2 ( g b e s t k x i k )
x i k + 1 = x i k + v i k + 1
where v i k and x i k are the velocity and position of particle i at iteration k , x i k denotes the position of particle i at iteration k , p b e s t i k is the individual optimal solution of particle i after k iterations, g b e s t k is the global optimal solution after k iterations, w denotes the inertia weight coefficient, r 1 and r 2 are two random numbers uniformly distributed between 0 and 1, and c 1 and c 2 are positive acceleration constants.

2.2. Gaussian Process Model

Gaussian process (GP) model is a flexible nonparametric model. It has been widely applied to multi-step-ahead predictions in time series analysis [26,33]. A GP model is completely specified by the mean function m ( x ) and the covariance function k ( x , x ) , where m ( x ) and k ( x , x ) are described as follows:
m ( x ) = E ( f ( x ) )
k ( x , x ) = cov ( f ( x ) , f ( x ) ) = E [ ( f ( x ) m ( x ) ) ( f ( x ) m ( x ) ) ]
The GP regression function is expressed as
f ( x ) ~ G P ( m ( x ) , k ( x , x ) )
It is common to utilize a mean function of m ( x ) = 0 , since GP is flexible enough to model the mean arbitrarily well [34]. In addition, the squared exponential covariance function applied in SOH prognostics is as follows:
k ( x , x ) = σ f 2 exp ( 1 2 l 2 ( x x ) 2 )
where σ f 2 controls the vertical scale of this function, and l is the length-scale parameter and governs the speed of the correlation decrease as the input data distance increases.
For training dataset D = { ( x i , y i ) | i = 1 , 2 , , N } , the target y i is described by
y i = f ( x i ) + ε i ,   i = 1 , , N
where ε i ~ N ( 0 , σ 2 ) , i = 1 , , N . For new input x * , the prior distribution of the GP is described as
[ y f * ] ~ N ( 0 , [ K ( X , X ) + σ n 2 I k T ( x * , X ) k ( x * , X ) k ( x * , x * ) ] )
where k ( x * , X ) = [ k ( x * , x 1 ) , k ( x * , x 2 ) , , k ( x * , x N ) ] . The posterior distribution of x * is
f * | X , y , x * ~ N ( f ¯ * , cov ( f * ) )
where
f ¯ * = k ( x * , X ) [ K ( X , X ) + σ n 2 I ] 1 y
cov ( f * ) = k ( x * , x * ) k ( x * , X ) [ K ( X , X ) + σ n 2 I ] 1 k T ( x * , X )

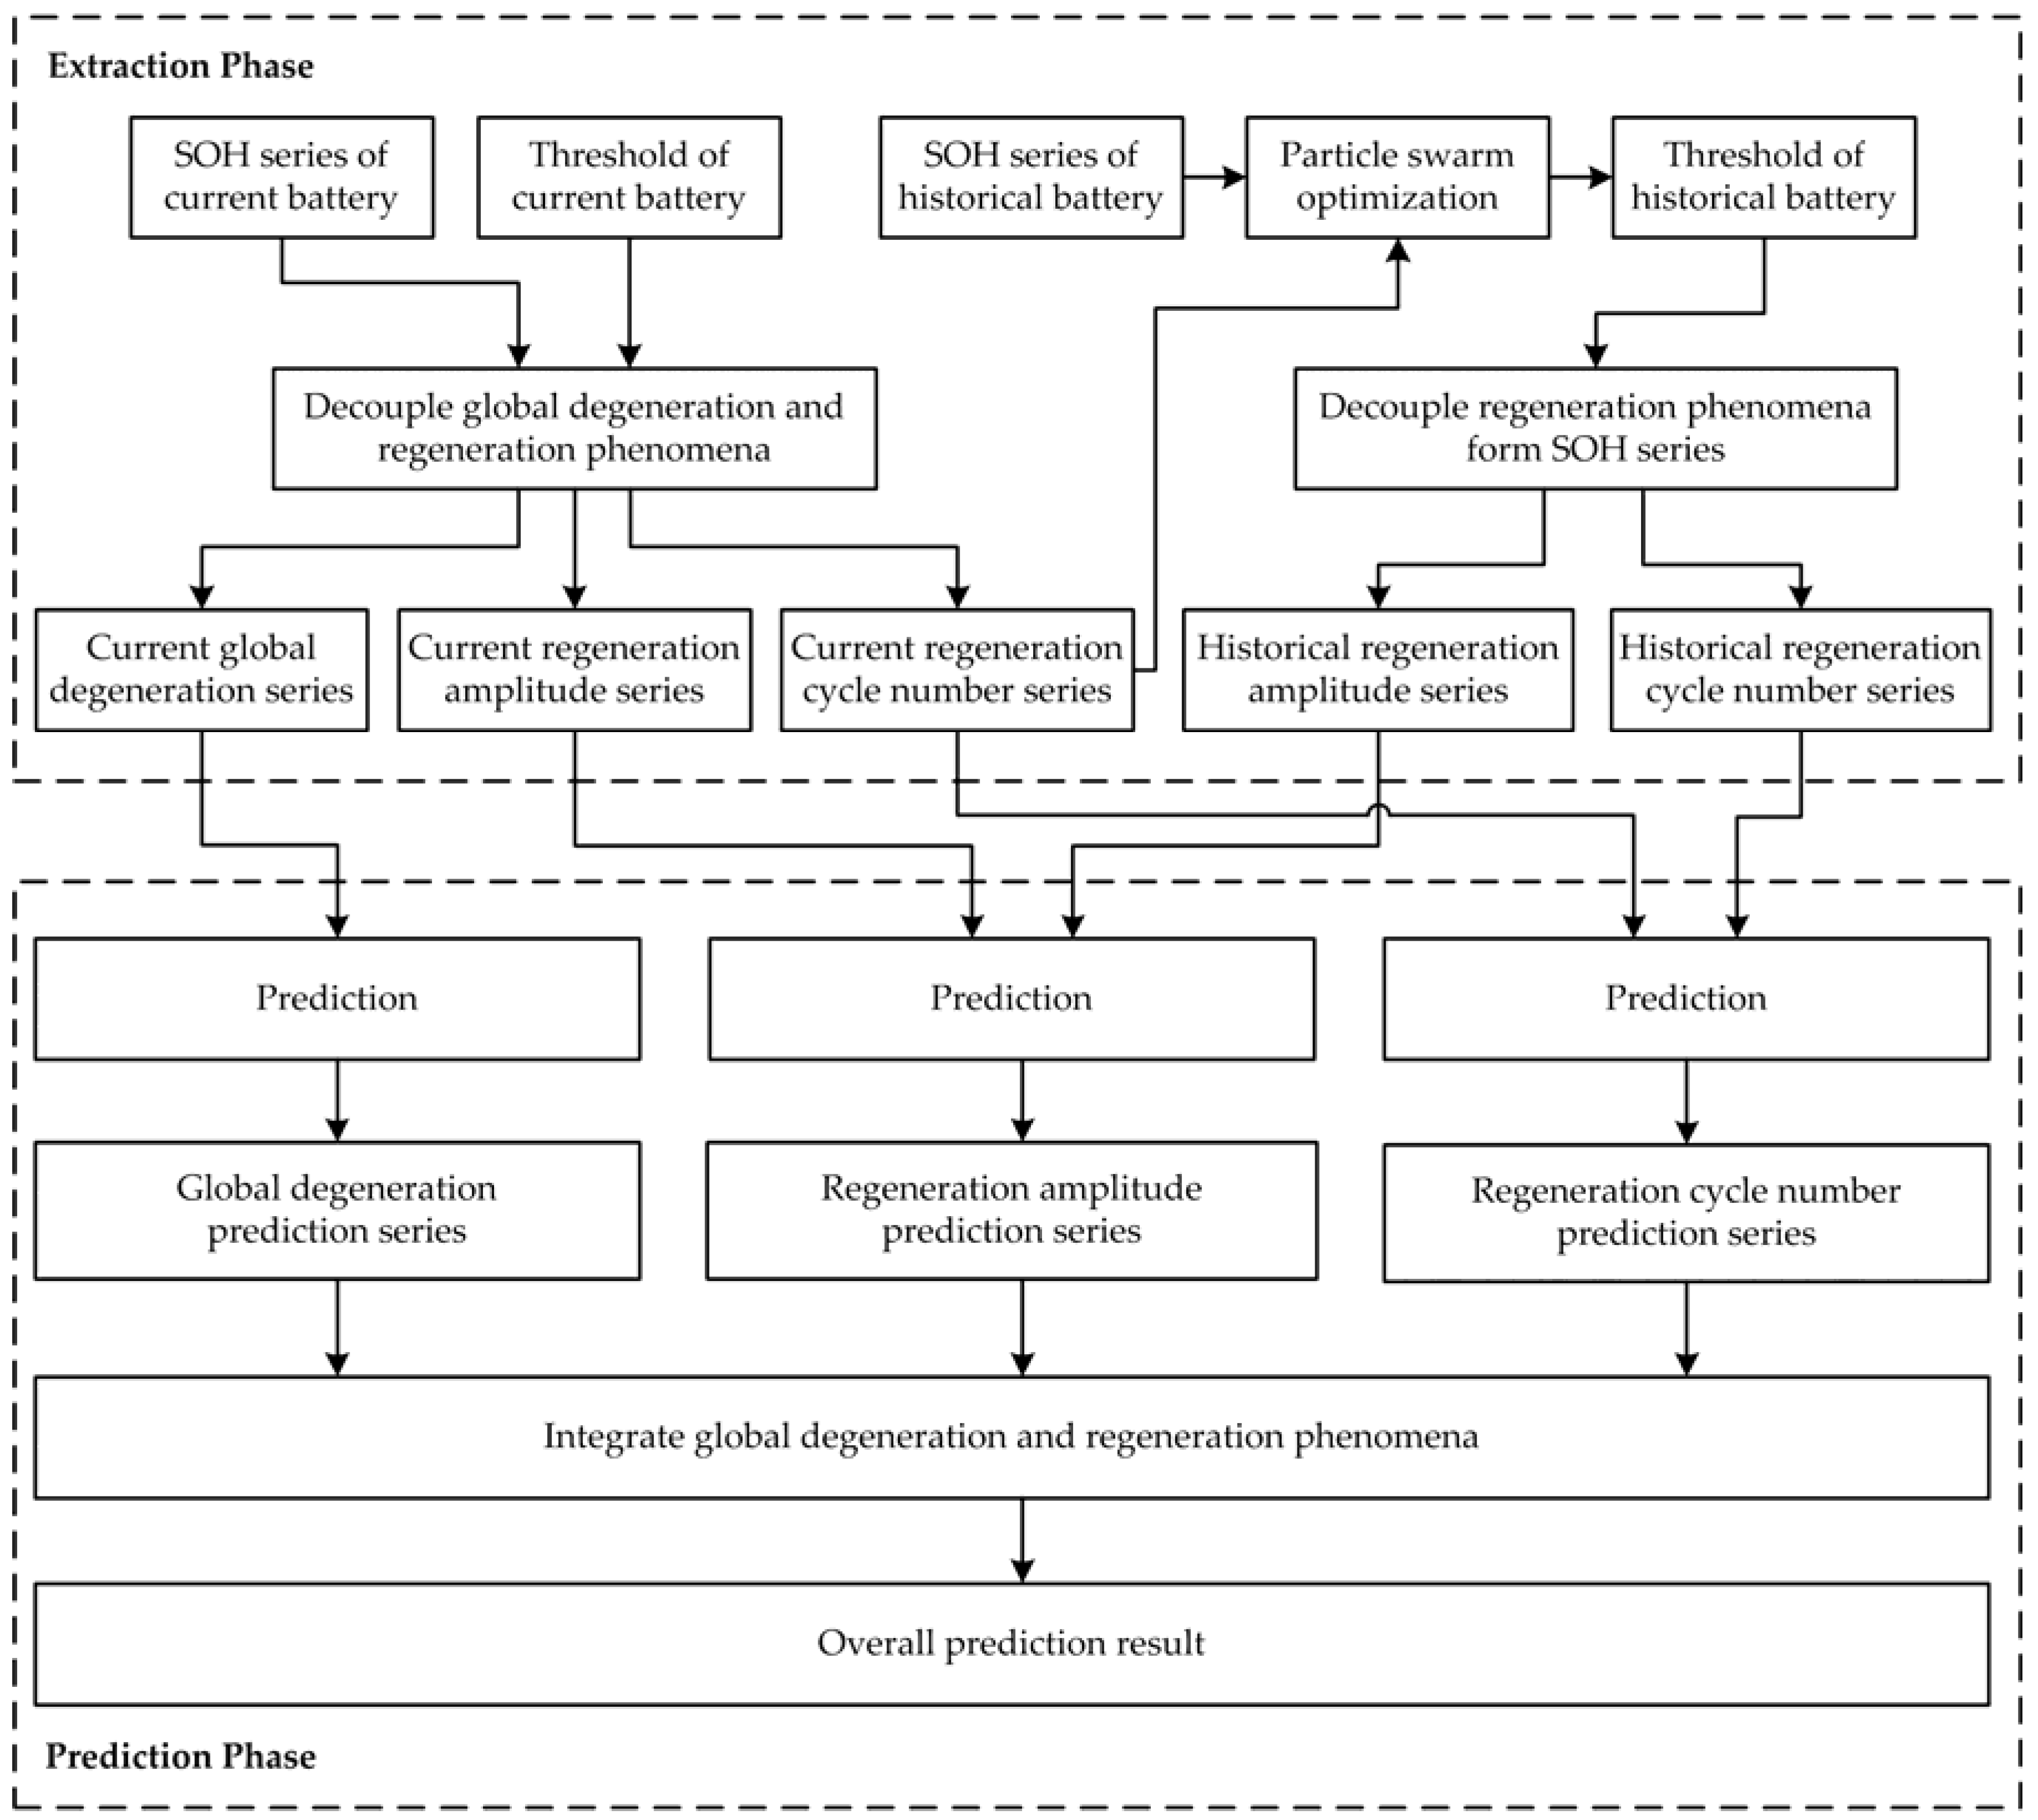
3. The Proposed Framework

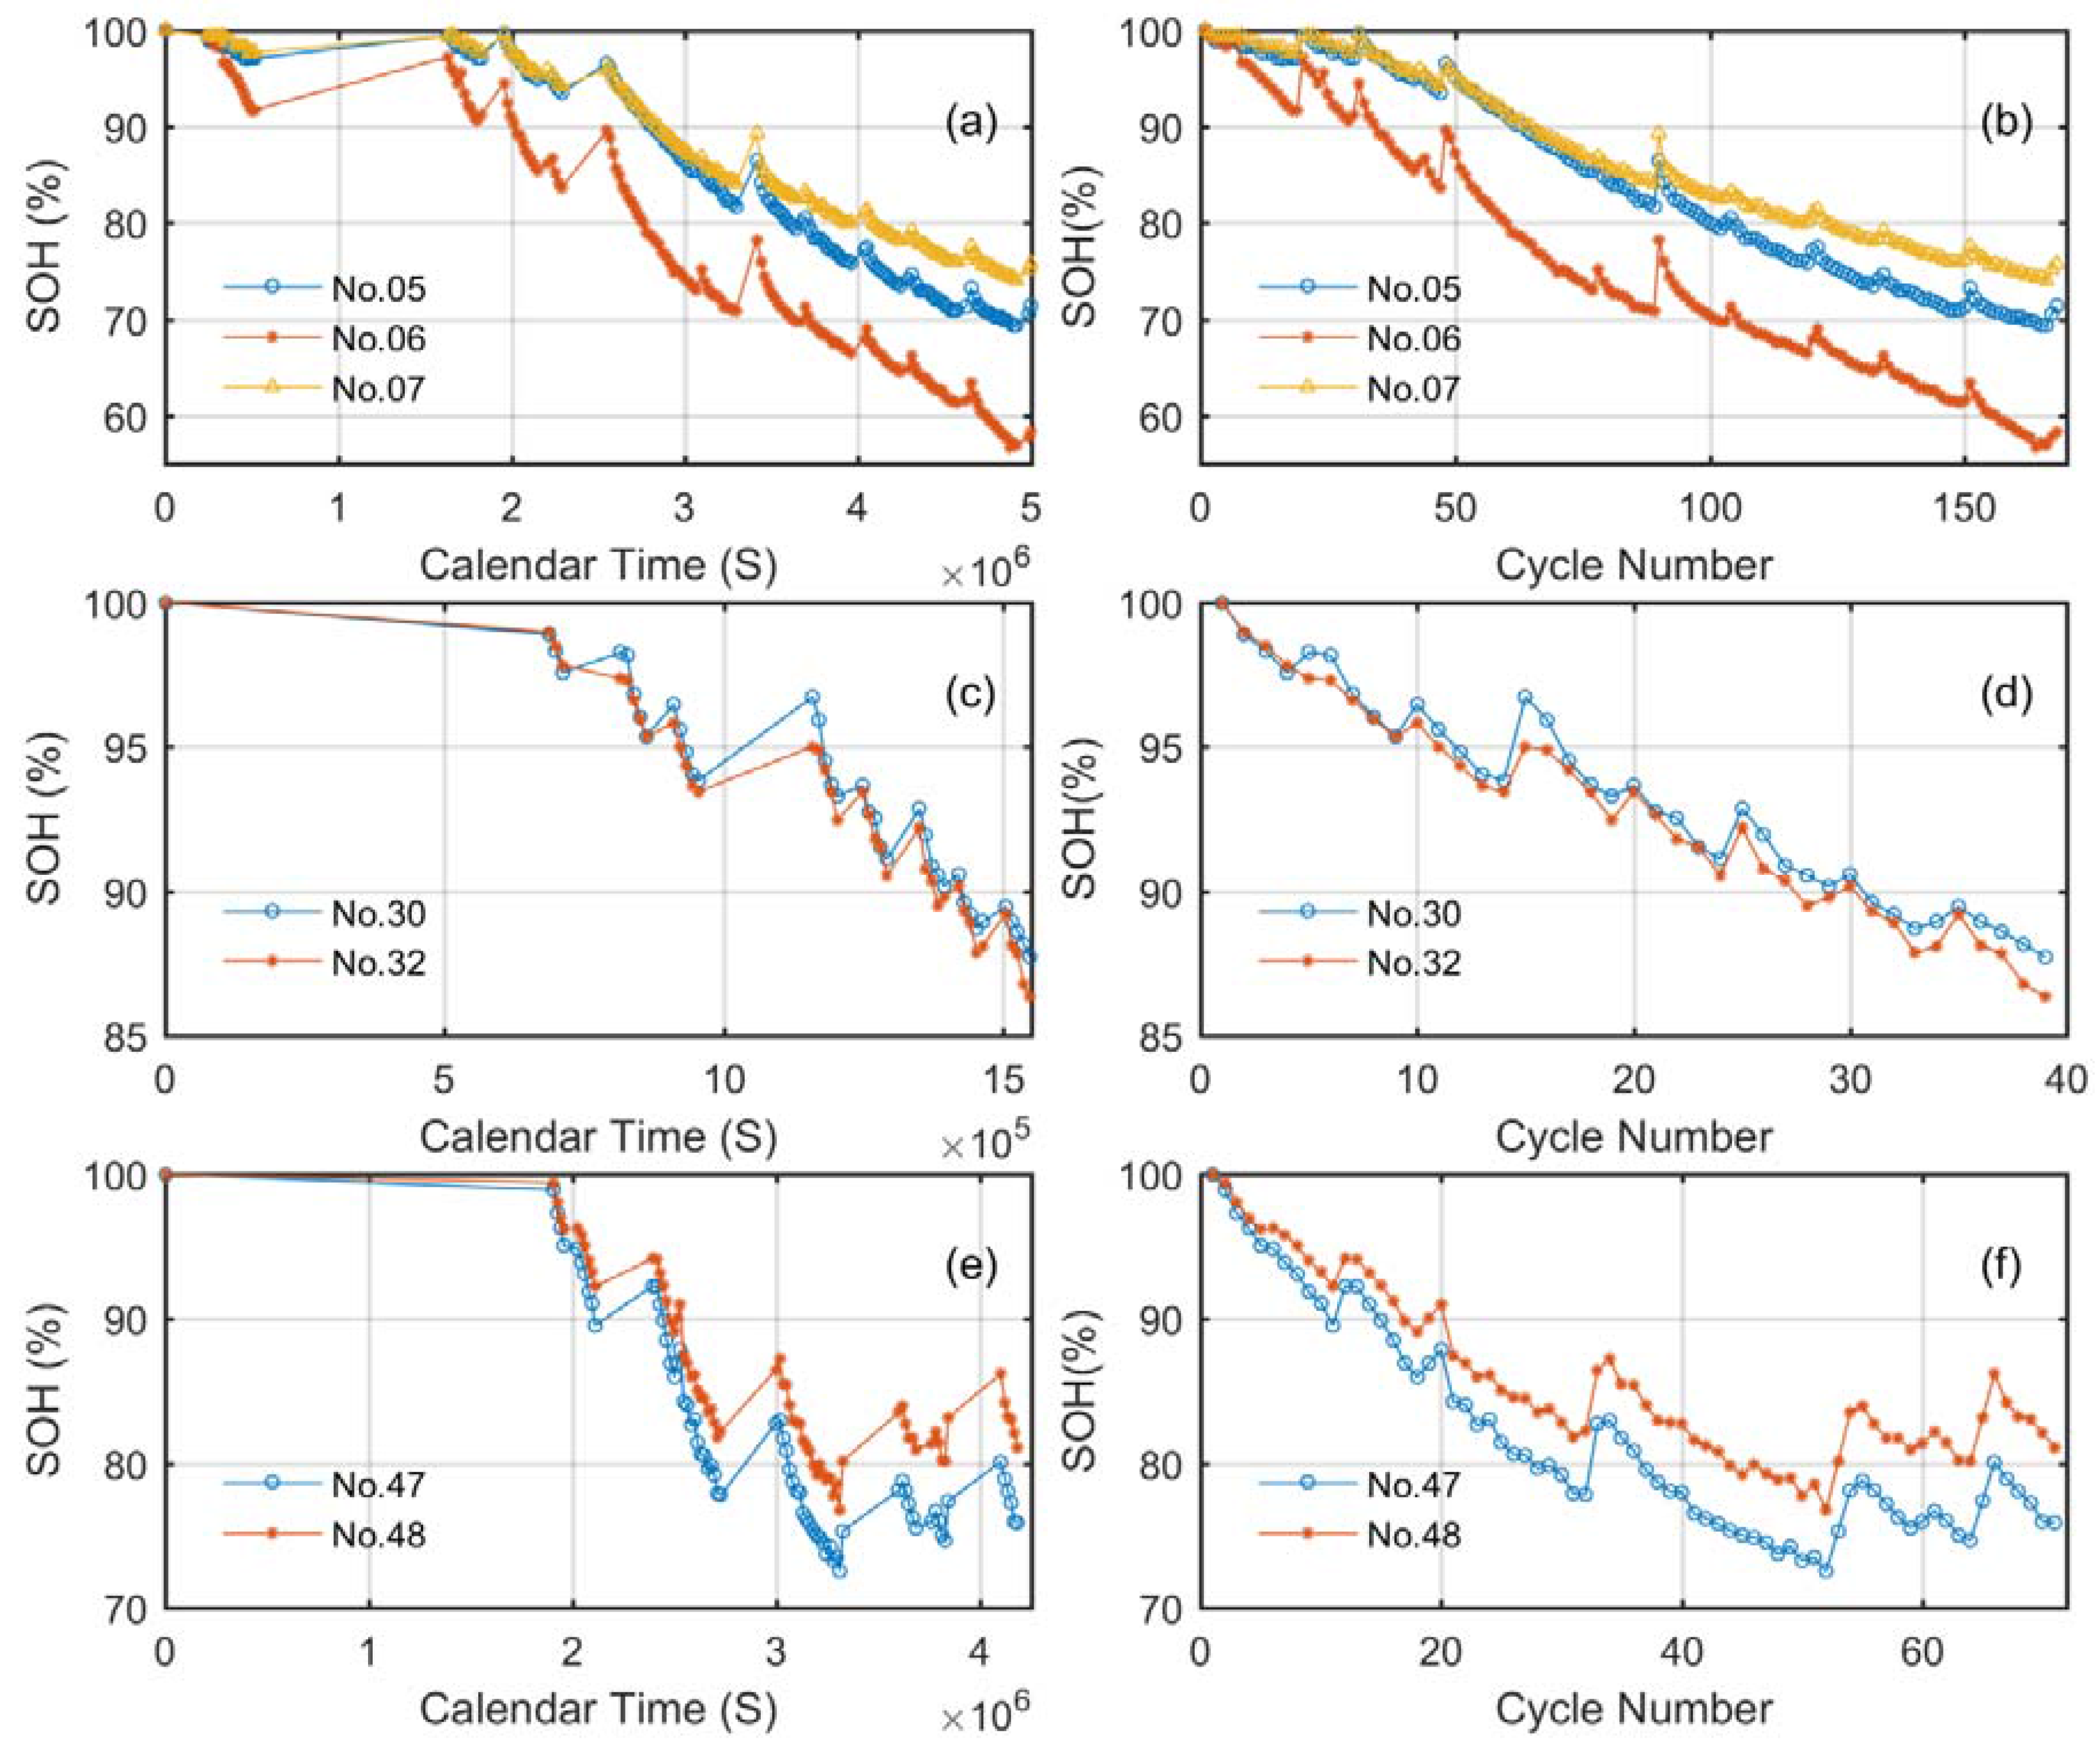
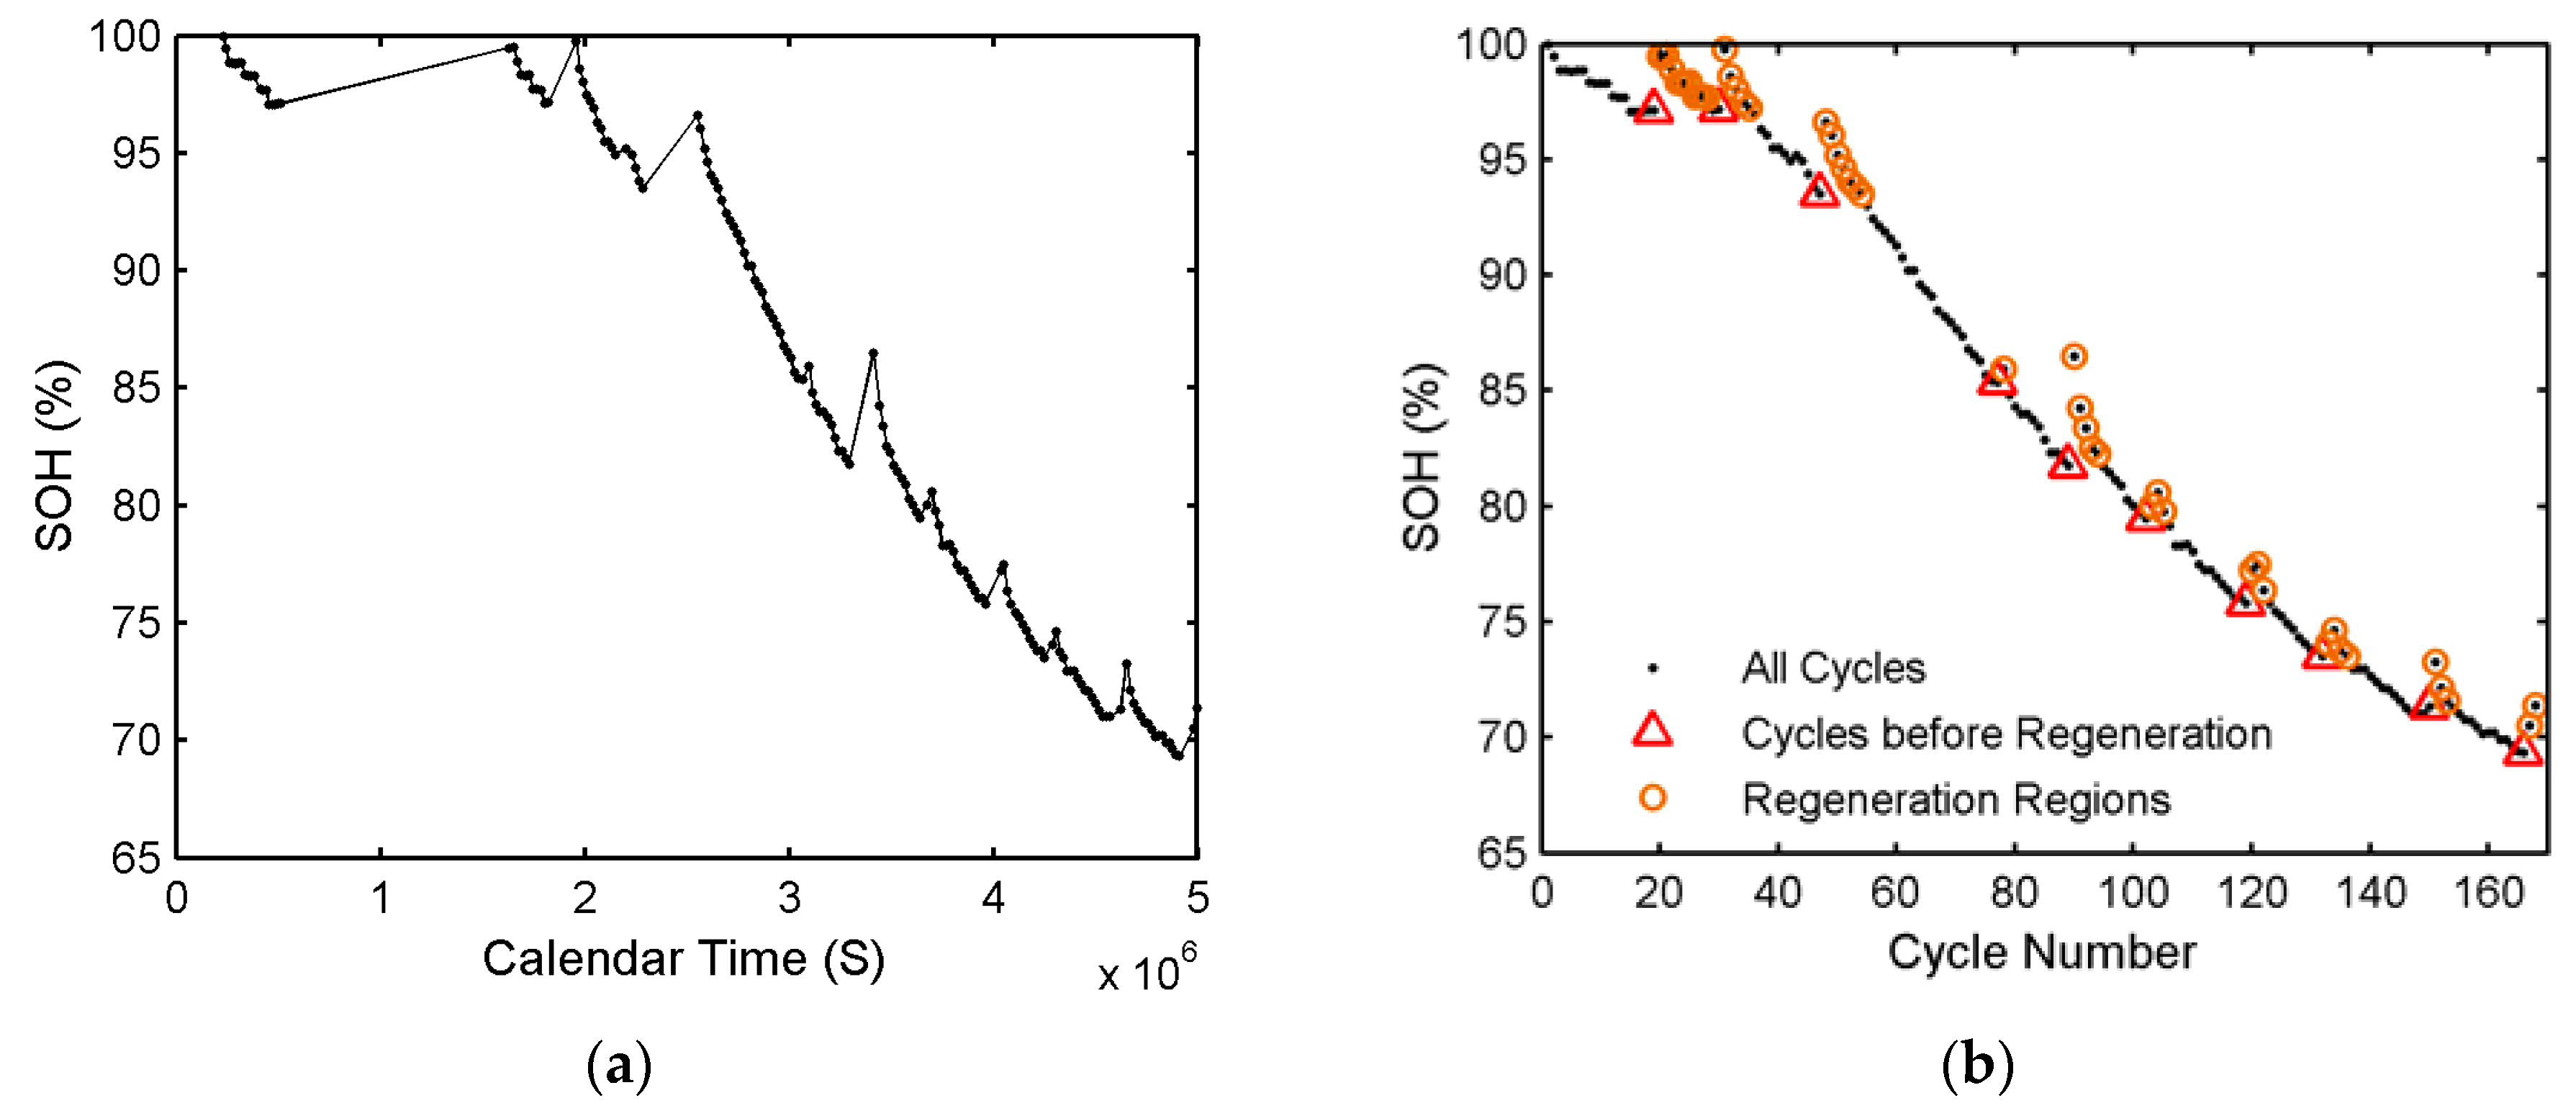
3.1. The Regeneration Phenomenon

In this paper, capacity is used to indicate the SOH of Li-ion batteries. It can be obtained by integrating the current over time. The relationship between SOH and capacity can be described as
S O H = C i C 0 × 100 %
where C i is the capacity value of charge-discharge cycle i and C 0 is the initial value of capacity without degradation.
Figure 1 shows the battery SOH degradation data (Battery No. 05 from NASA PCoE Center, Moffett Field, CA, USA). Figure 1a illustrates the change of SOH over calendar time. It is noted that the value of SOH has increased when the interval between two cycles is relatively large. It demonstrates that capacity regeneration is obvious when the battery has a long rest time. Figure 1b presents the relationship between SOH and the cycle number. It is observed that after obvious regeneration appearance, SOH degradation rate of the next several cycles is much faster than before. Therefore, it is meaningful to analyze the effects of capacity regeneration and global degradation separately. We call the cycle with a significant capacity increase as “regeneration cycle” and the previous one cycle as “the cycle before regeneration”. Compared with the cycle before regeneration, the SOH values of the next several cycles have increased. In this article, we call these cycles as “regeneration region” and the difference between the maximum SOH value in a regeneration region and the SOH value at the cycle before regeneration as “regeneration amplitude”. Moreover, we call the number of cycles in each regeneration region as “regeneration cycle number” and the cycle except regeneration regions as “global cycle”. These definitions are directly used below and illustrated in Figure 1b.

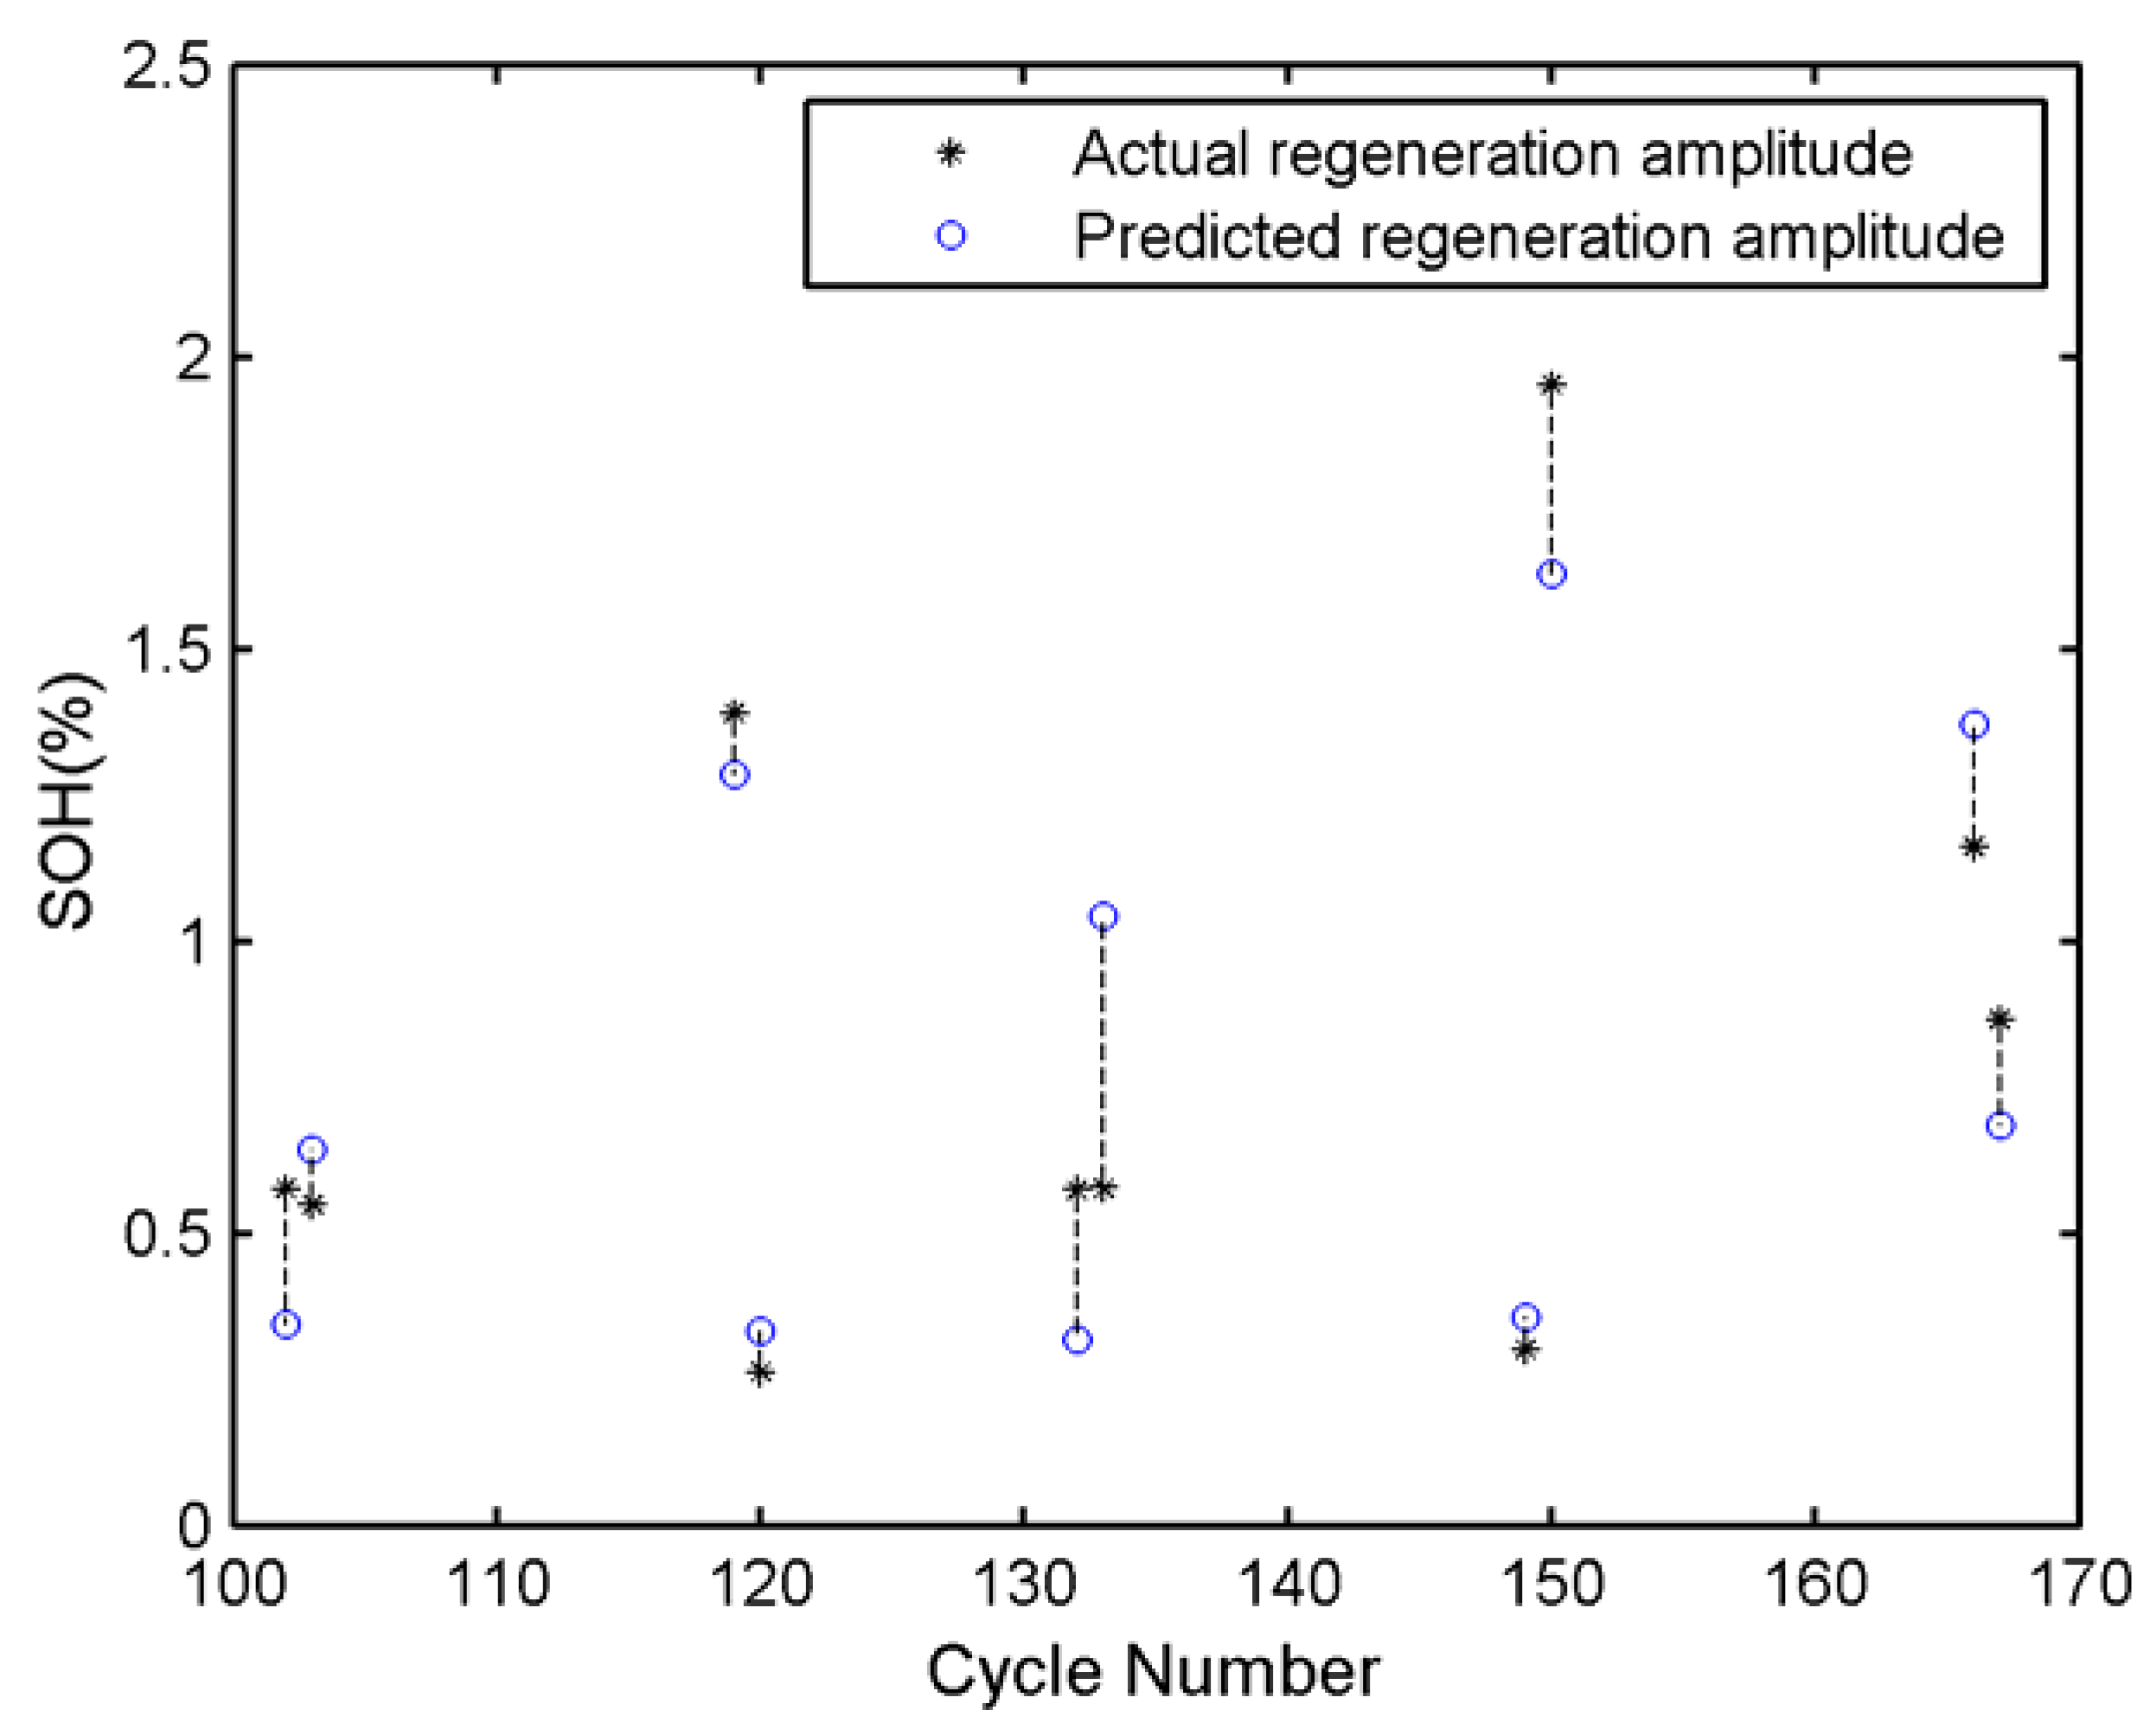
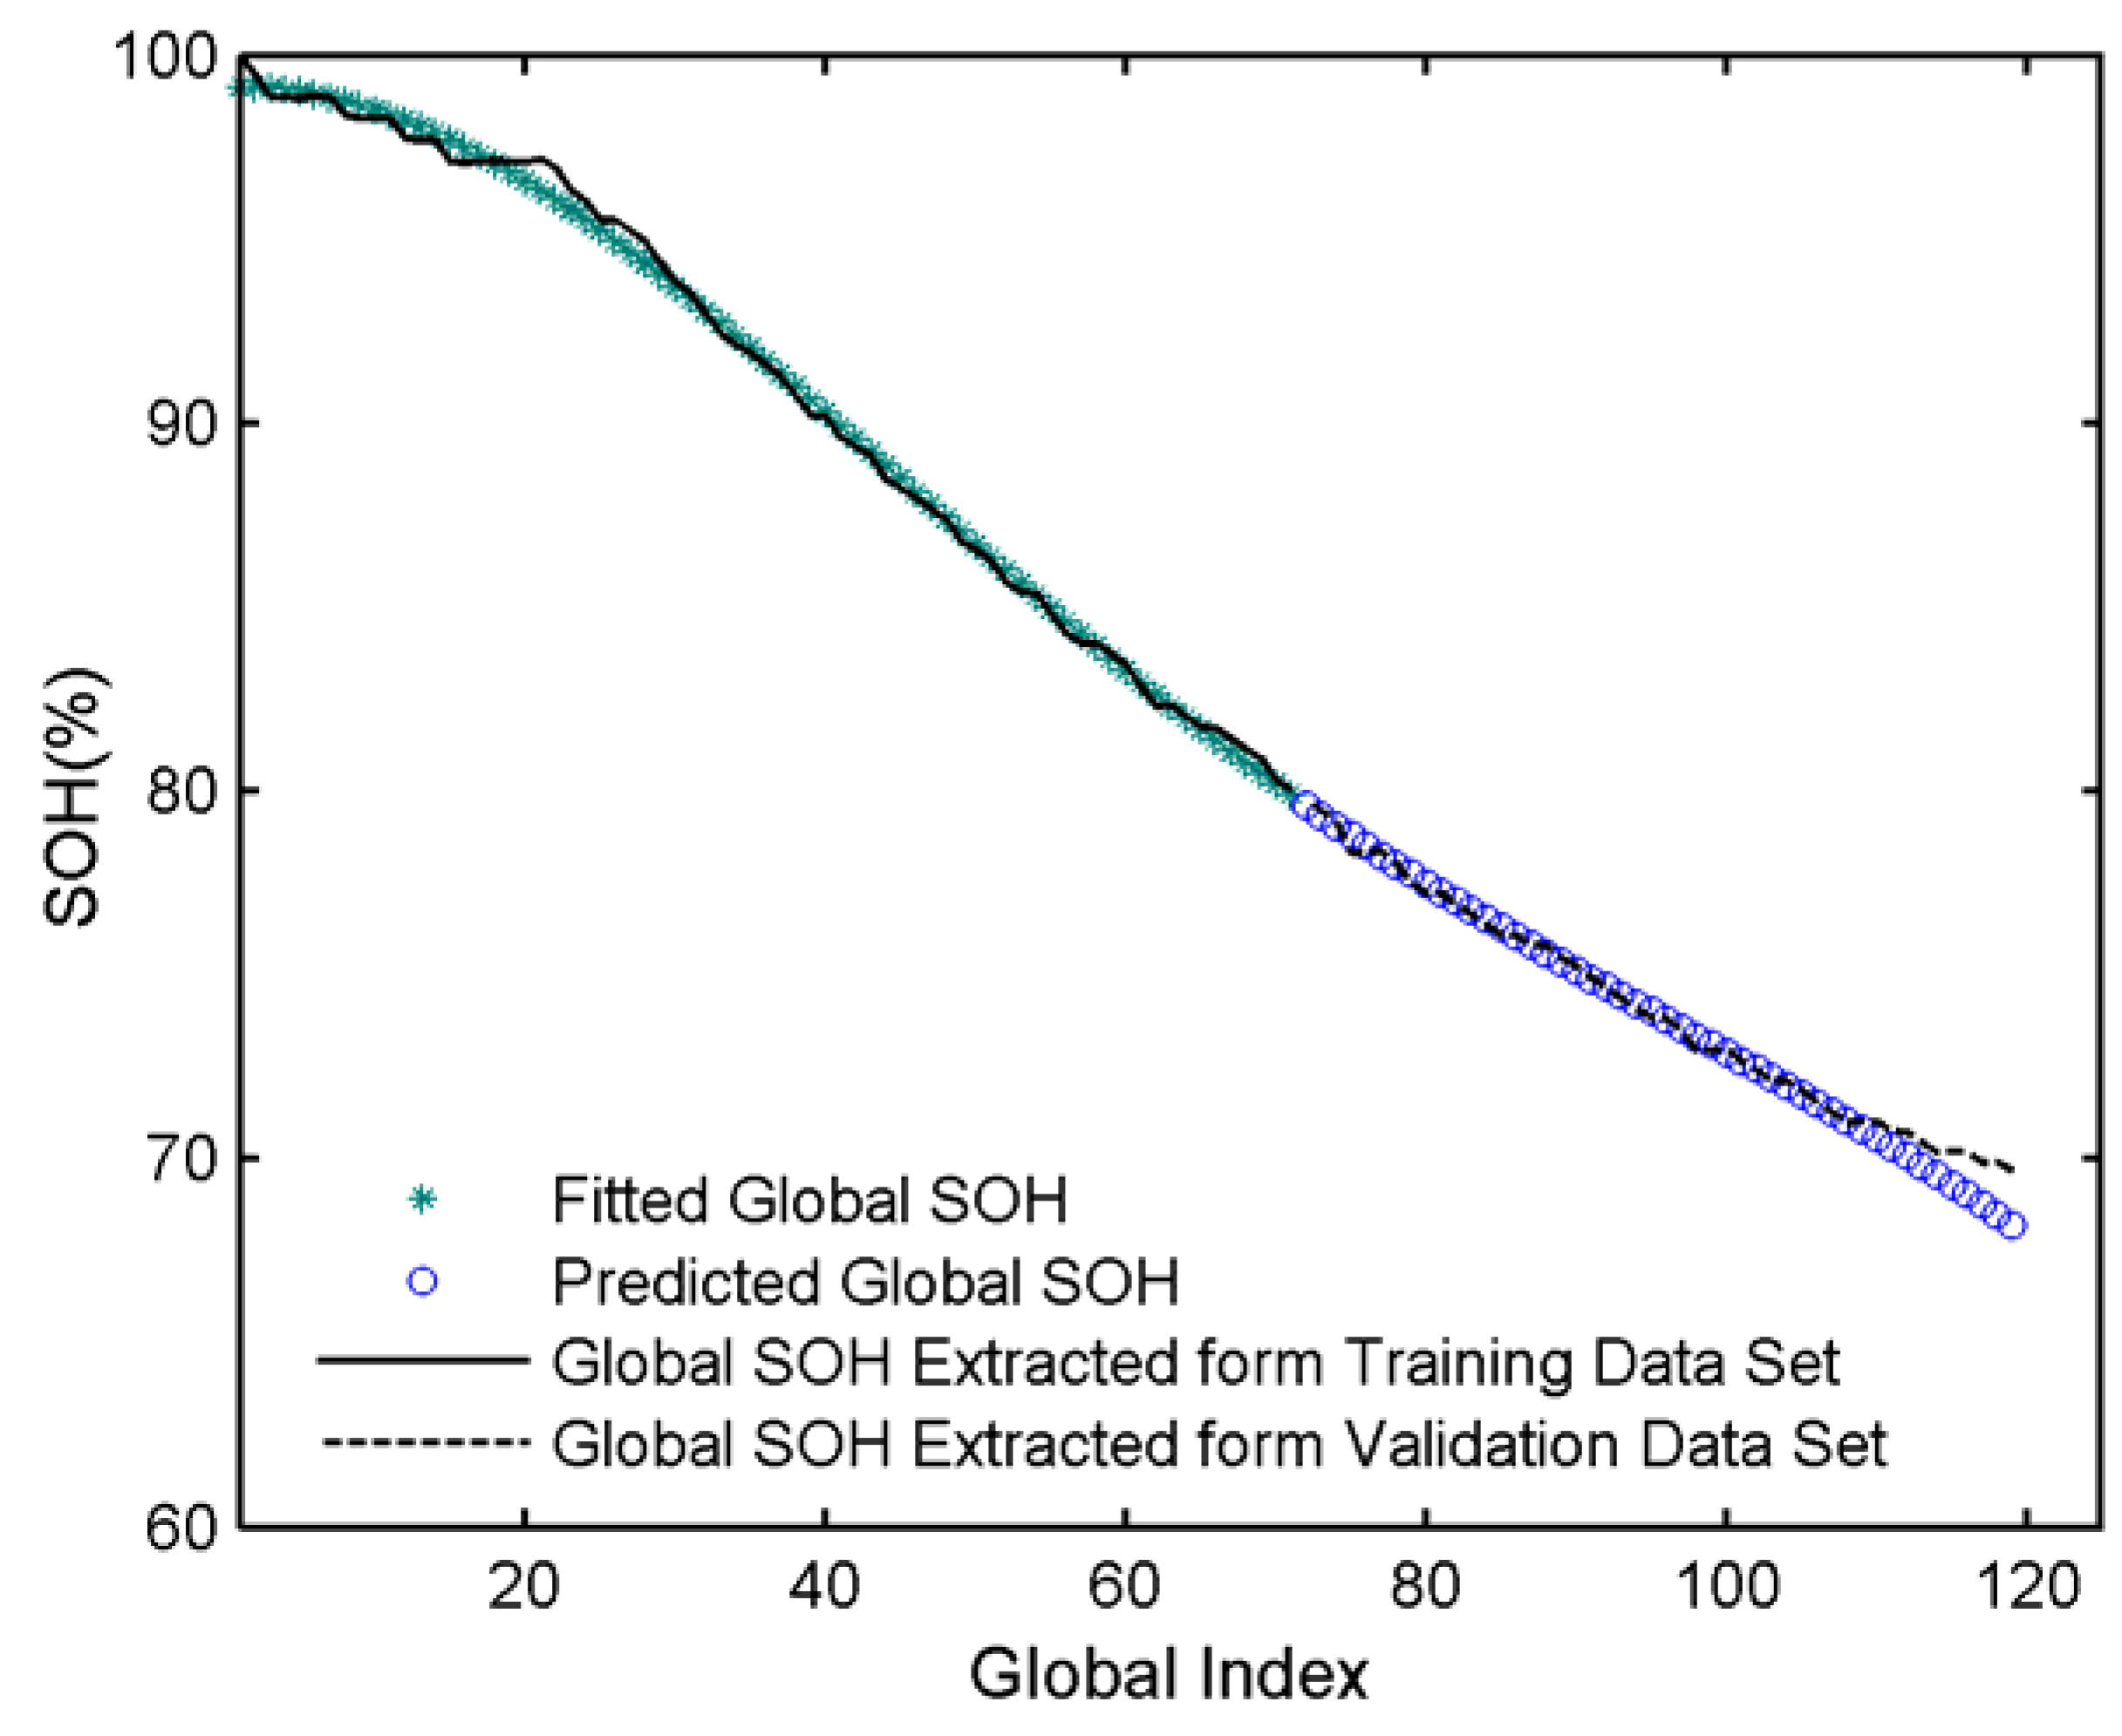
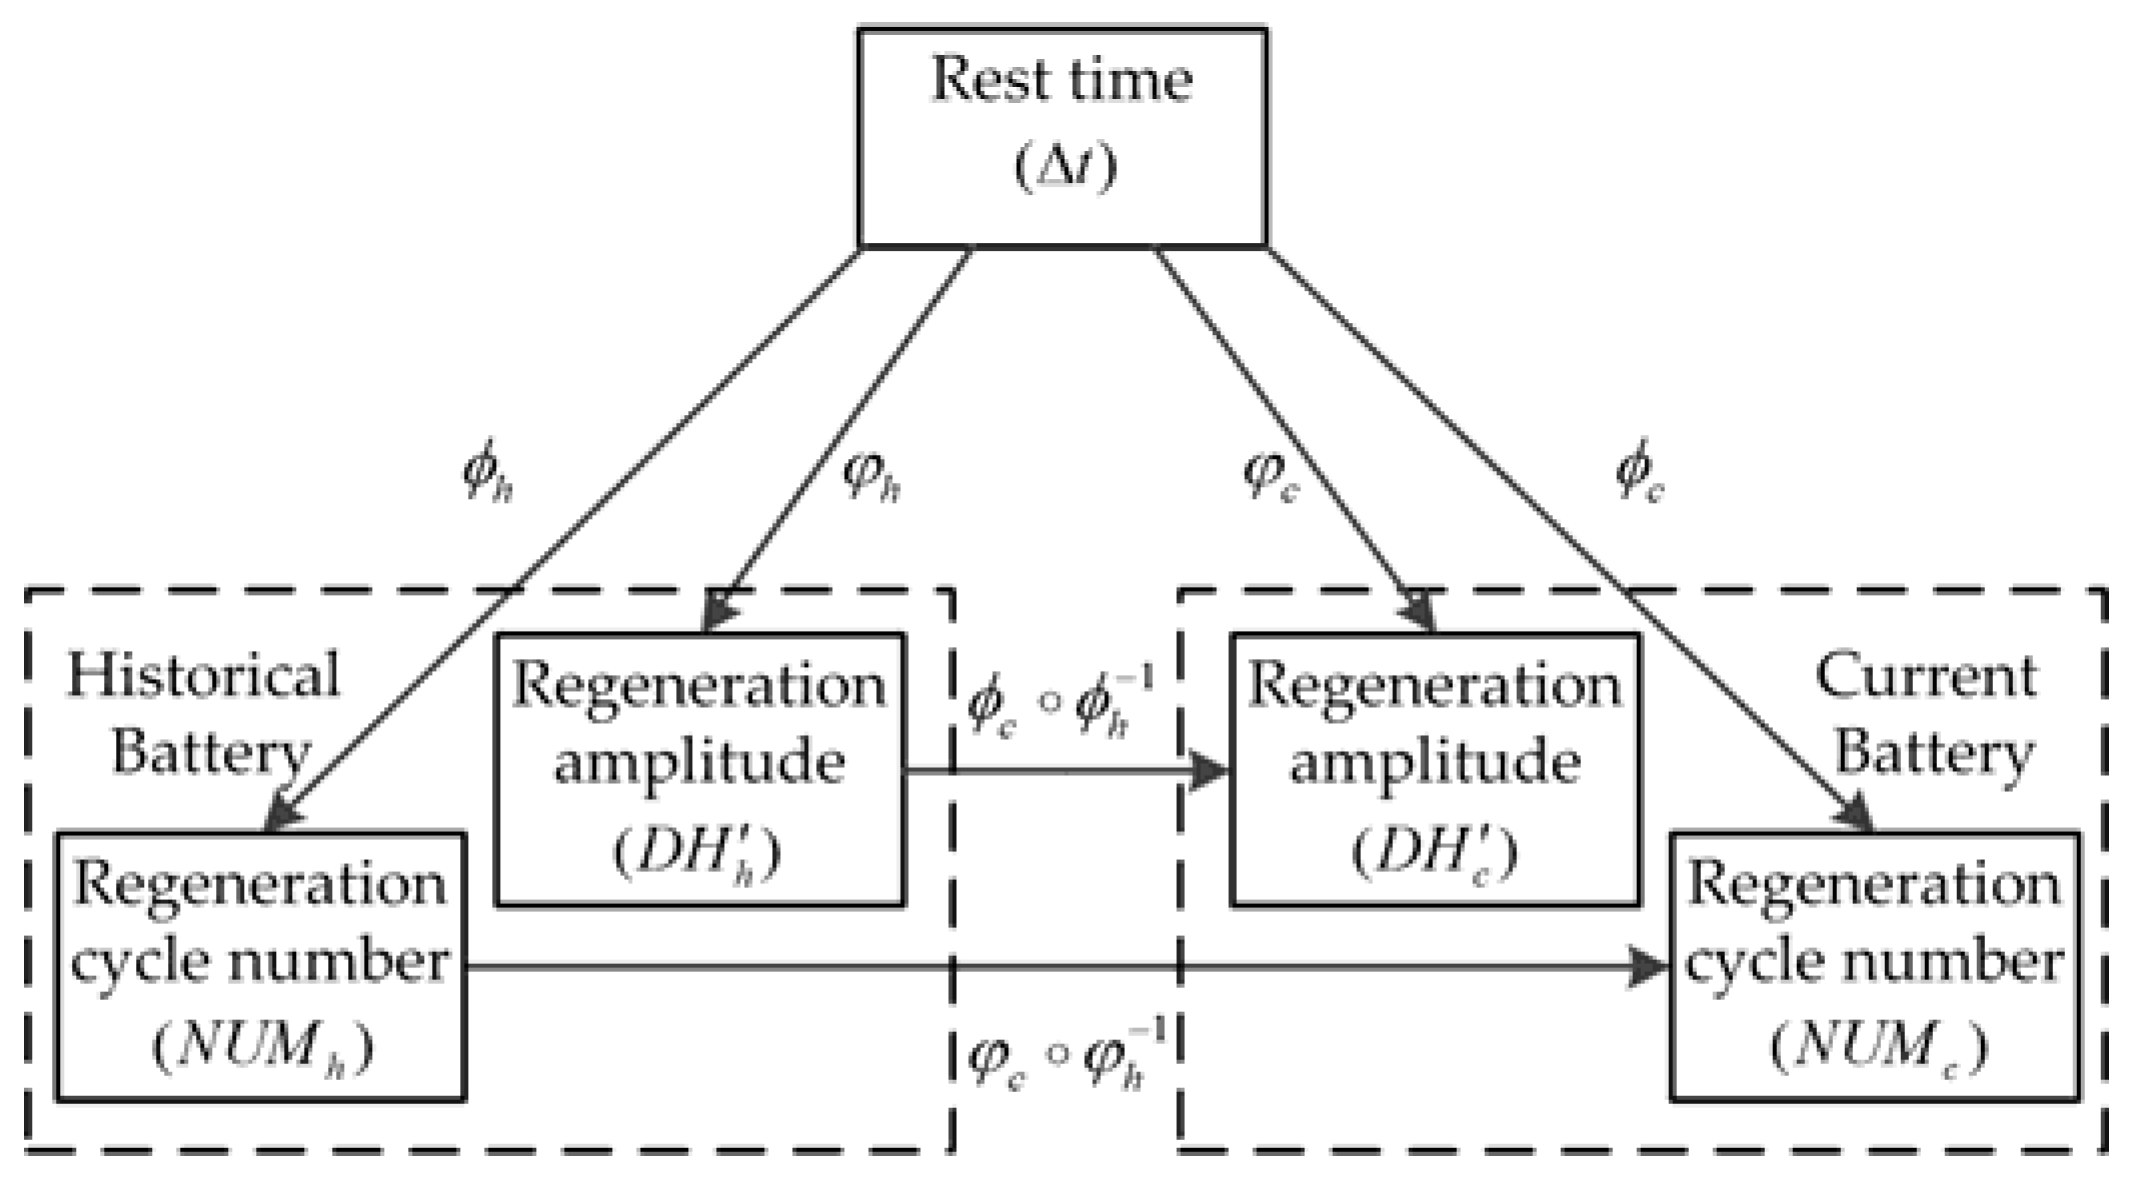
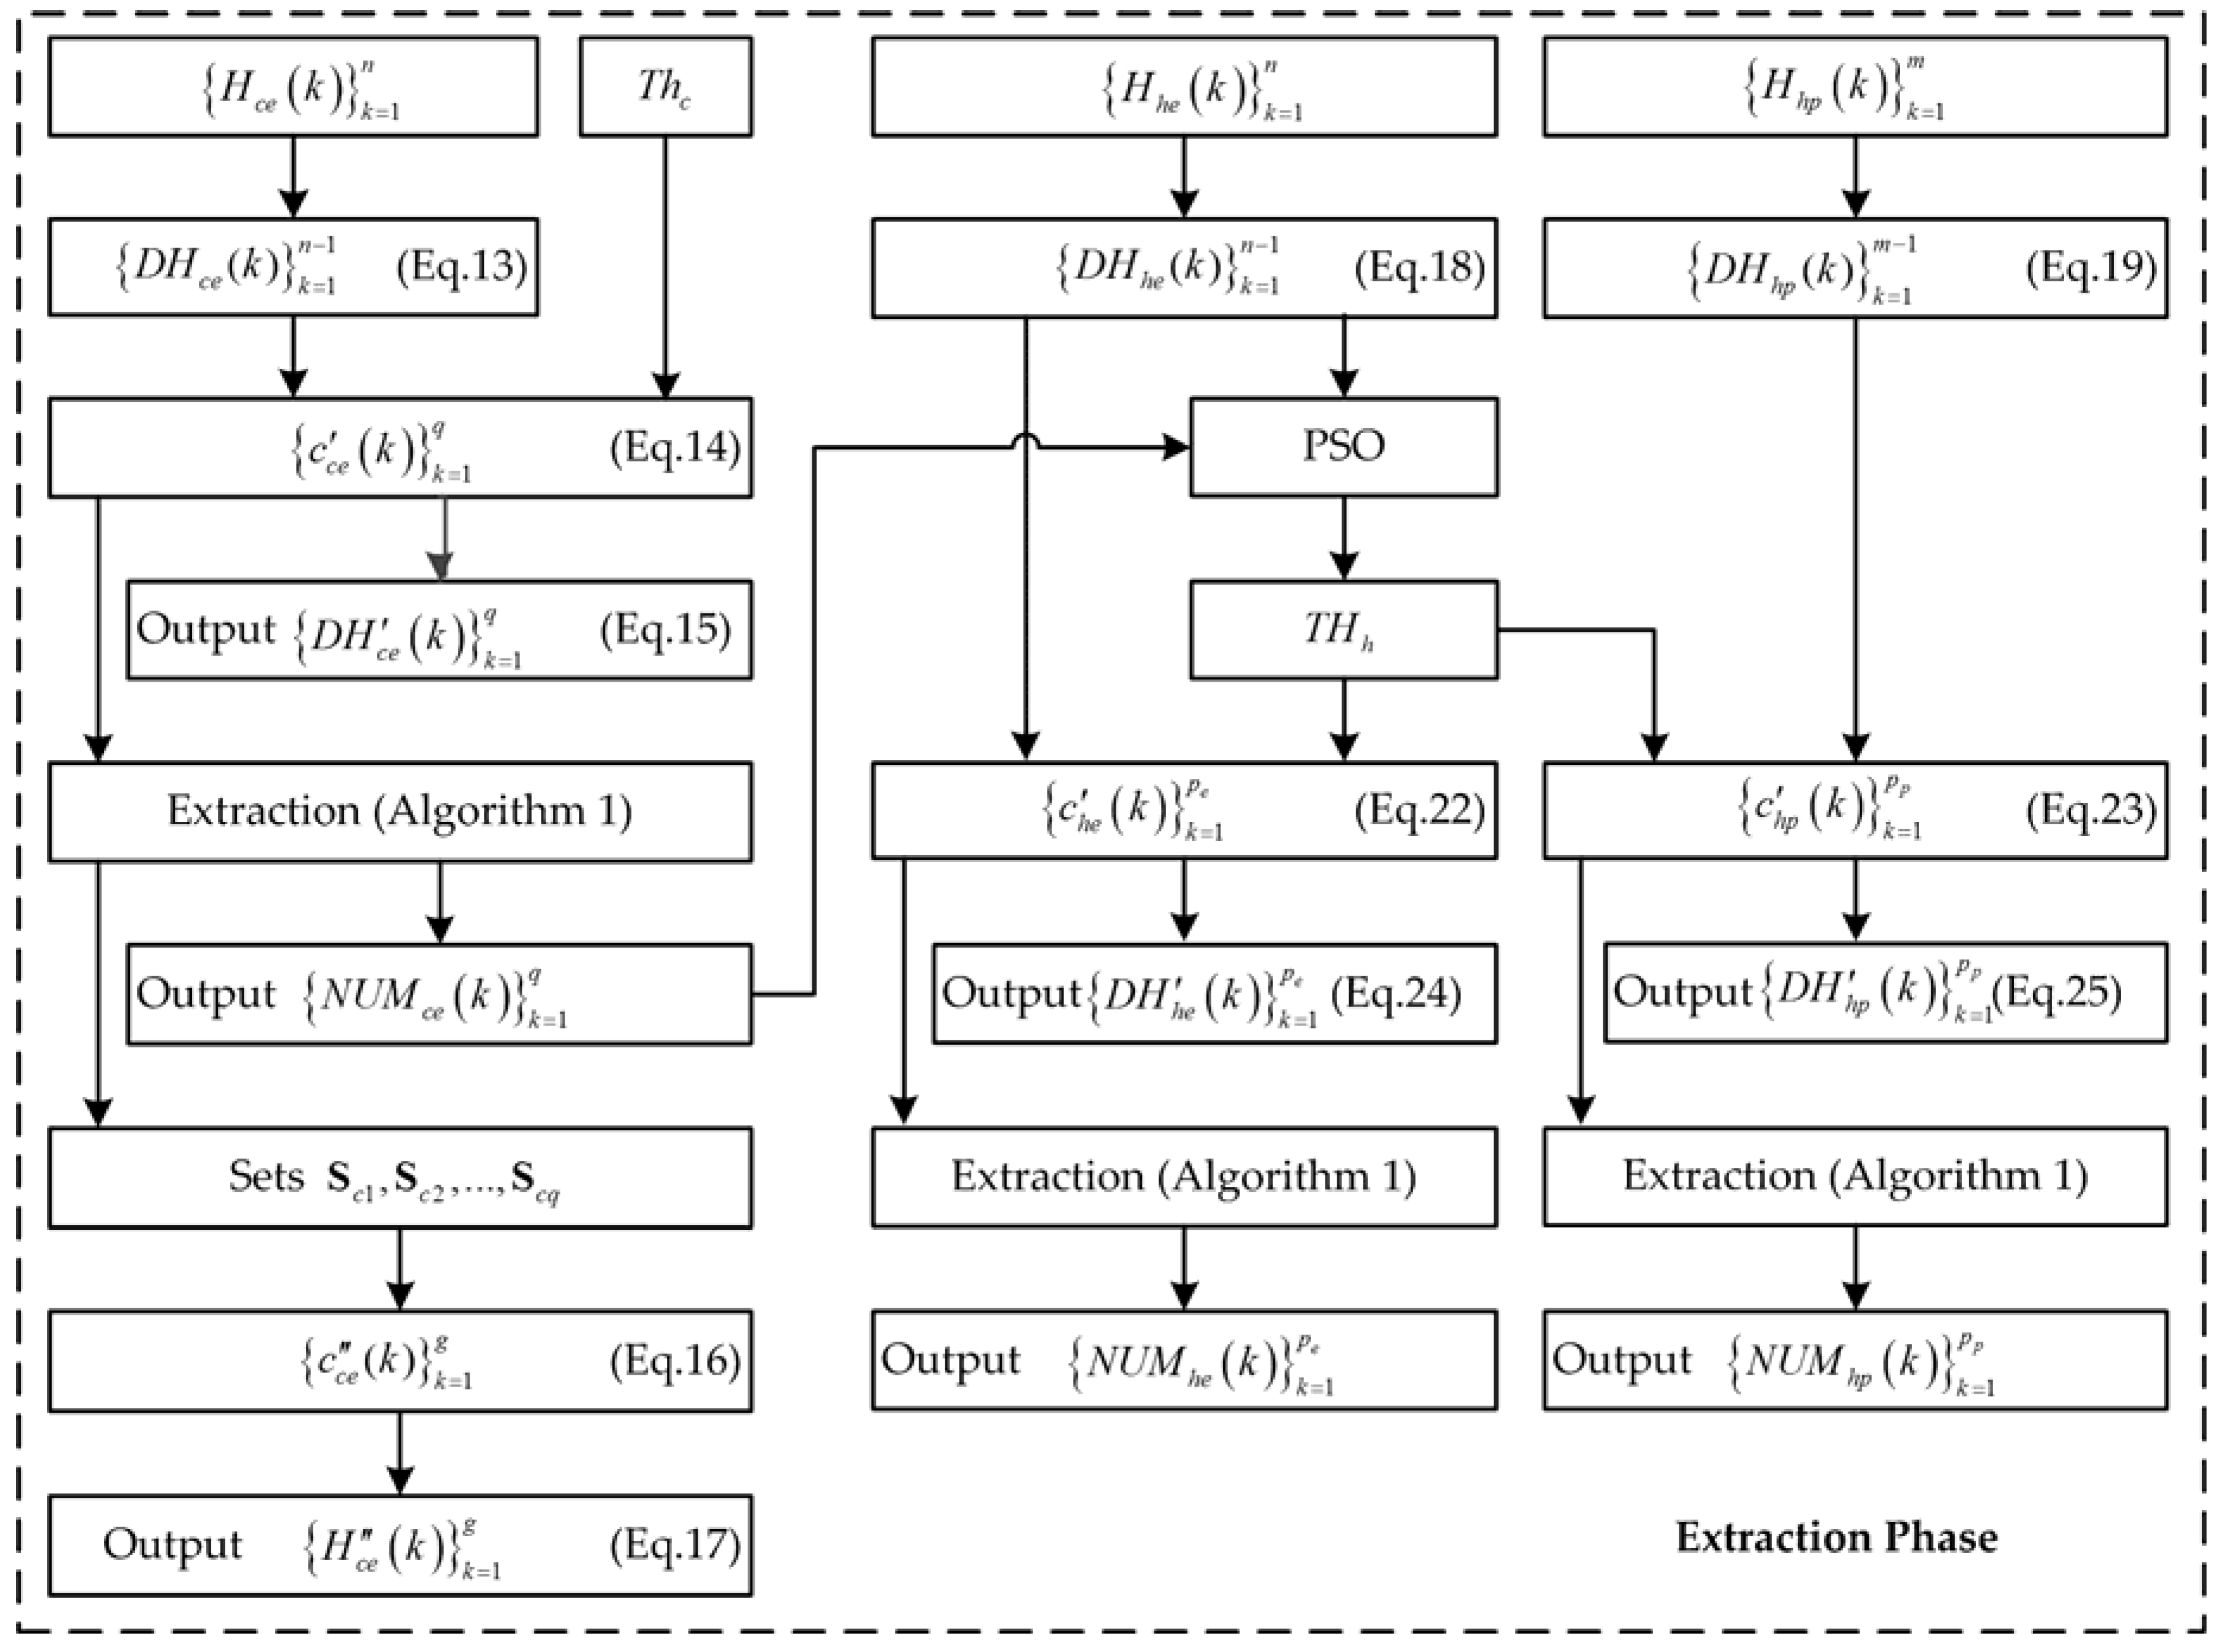
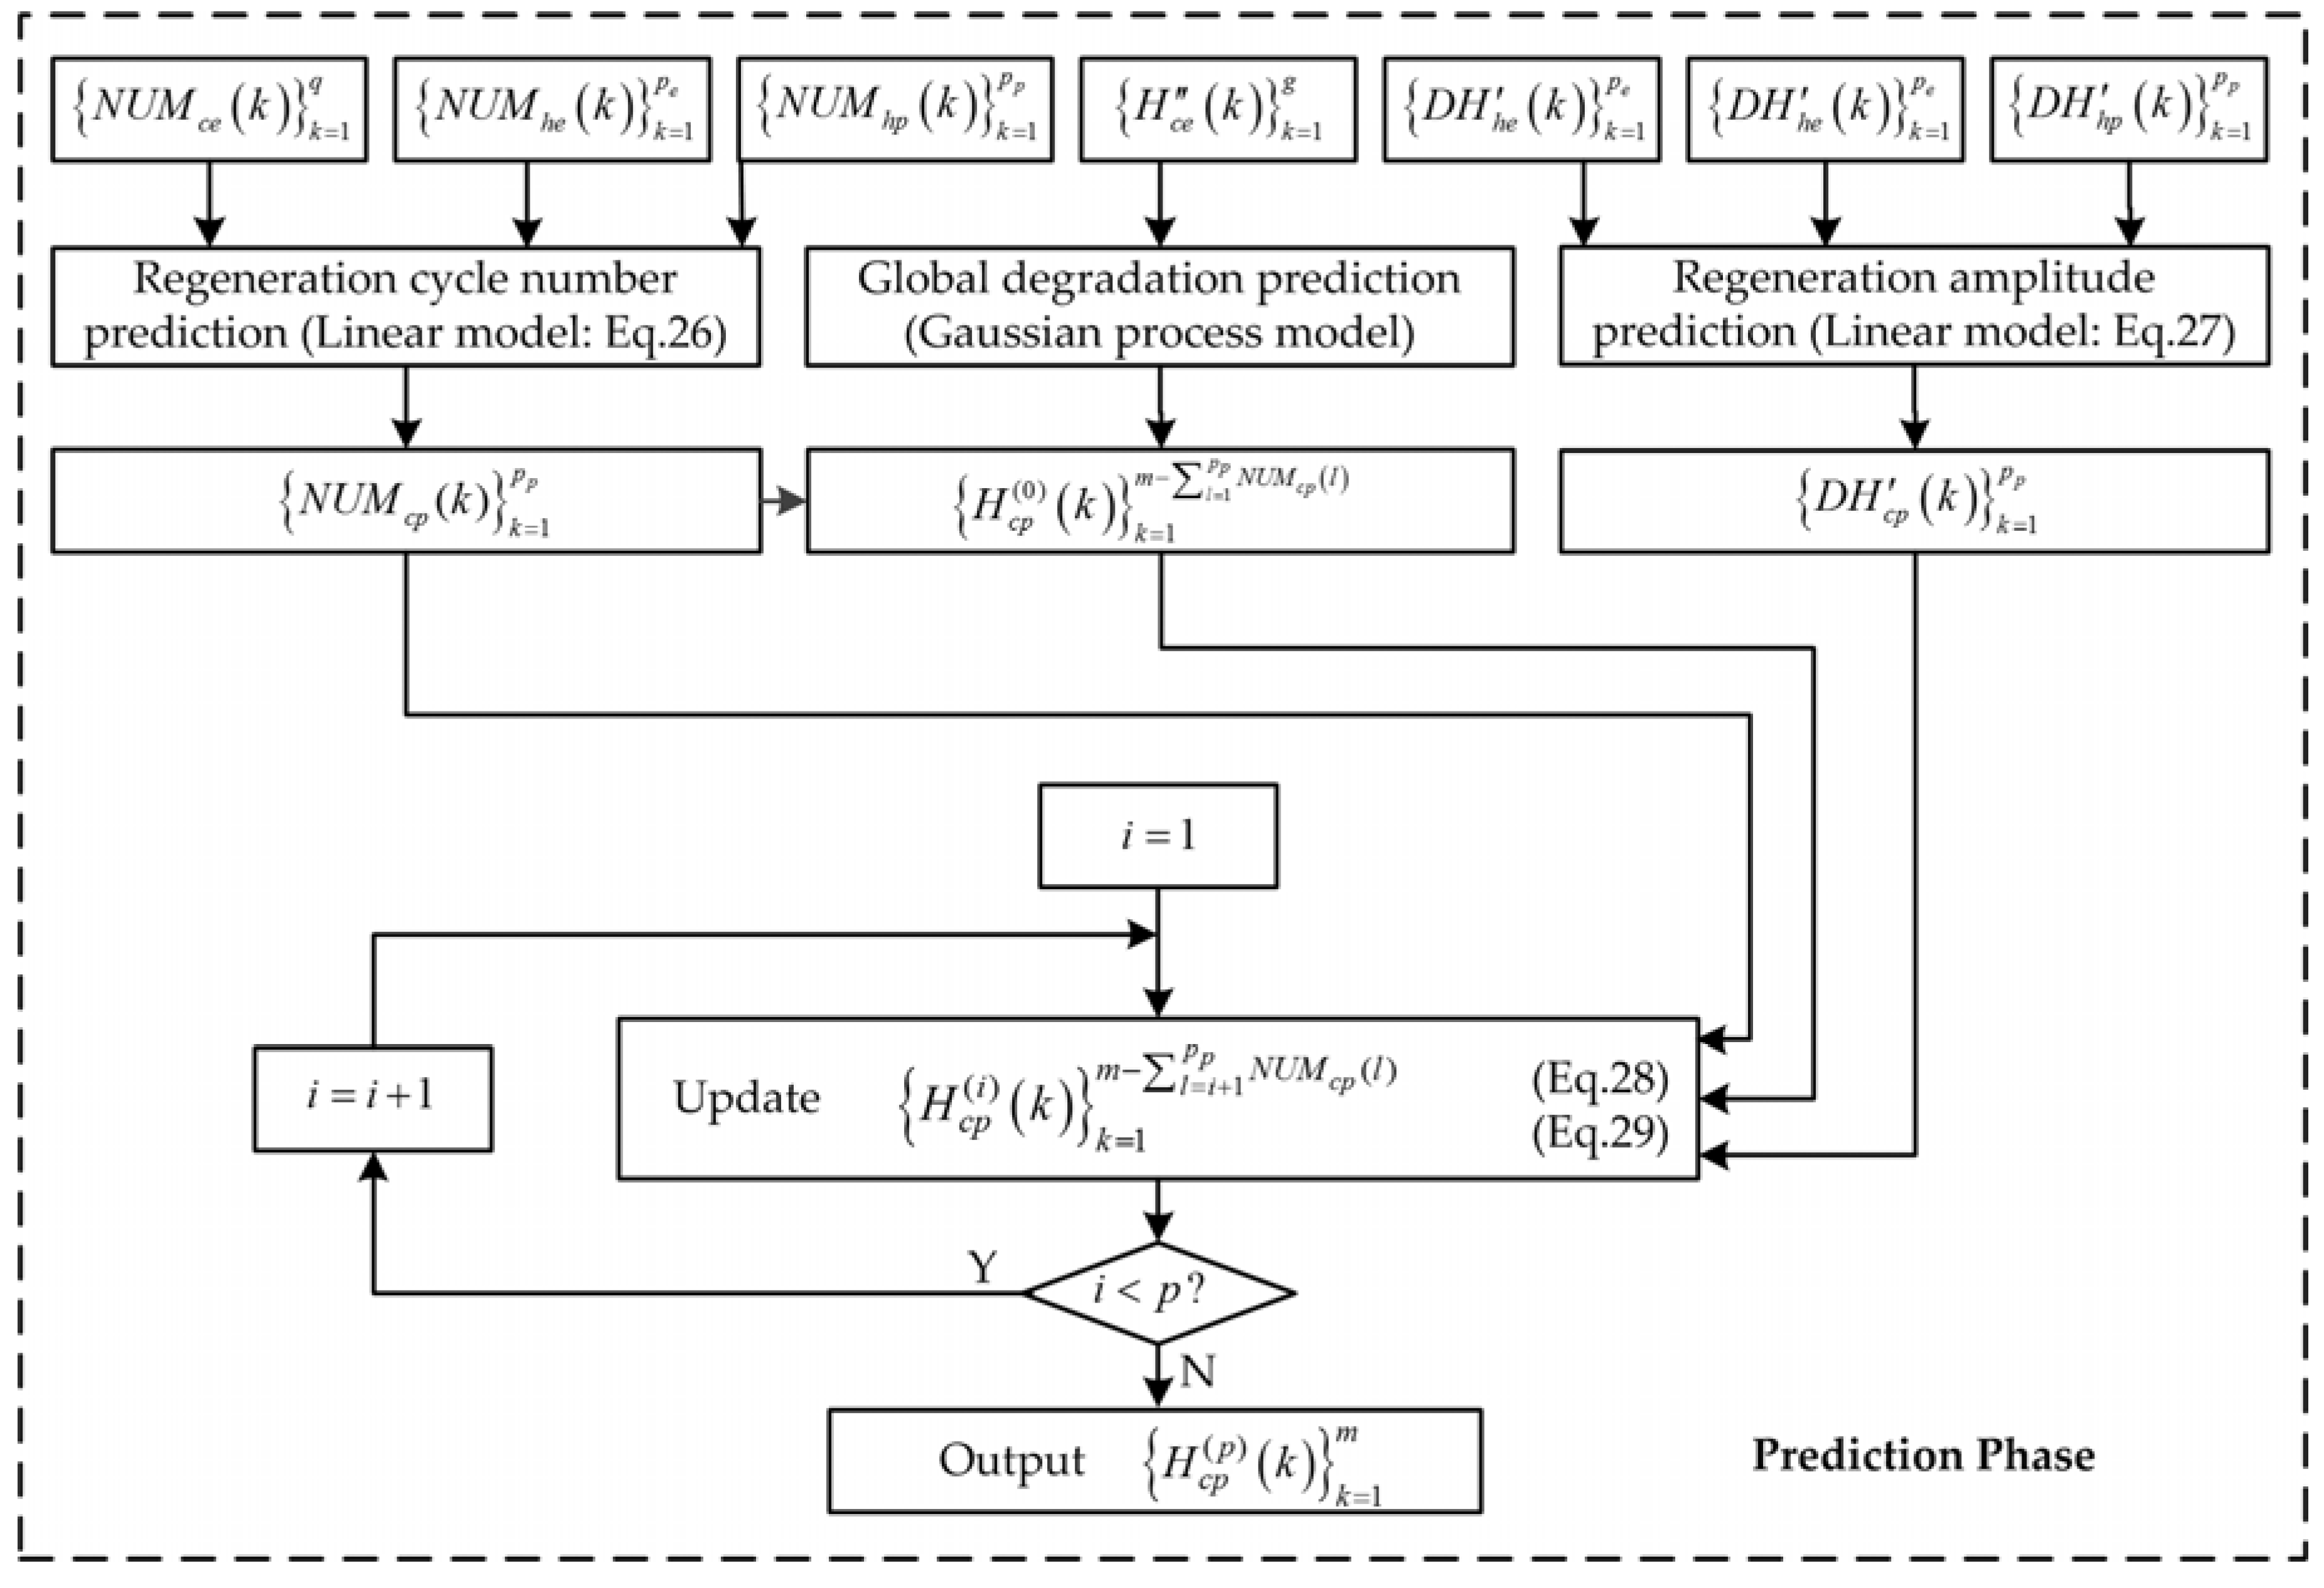
3.2. Similar Rest Time-Based Prognostics Strategy

It has been noticed that long time rest will lead to battery capacity regeneration [16,25,35]. Our aim is to decouple the global degradation and regeneration from battery SOH, predict them, and integrate their results together to get the overall SOH prediction results. In this article, the influences of rest time to capacity regeneration are characterized by regeneration amplitude and regeneration cycle number. As shown in Figure 2, ϕ is the mapping between the rest time and the regeneration cycle number, and φ is the mapping between the rest time and the regeneration amplitude. The different working conditions and the individual difference of the current and historical batteries result in the differences of the mappings of the two batteries, which are distinguished by the subscripts c and h, respectively. When the rest time of the current battery is unavailable, the relationship of the regeneration of the current and historical batteries can be associated by mappings ϕ c ϕ h 1 and φ c φ h 1 .
The schematic of similar rest time-based prognostic framework is shown in Figure 3. This framework contains extraction phase and prediction phase. In the extraction phase, SOH series of current battery and SOH series of historical battery can be obtained by capacity monitoring during the usage of the current and historical batteries. The regeneration threshold of the current battery is given by considering the magnitude of noises. Then, the global degradation trend and regeneration phenomena (regeneration amplitude and regeneration cycle number) of the current battery can be decoupled. Based on the similarity between the current and historical batteries, the threshold of the historical battery can be determined automatically by PSO. After that, the regeneration phenomena of the historical battery can be decoupled with this threshold. In the prediction phase, the global SOH degradation series, regeneration amplitude series and regeneration cycle number series are predicted, and then integrated together to get the overall prediction results.
The extraction phase is described in detail in Figure 4, where { H c e ( k ) } k = 1 n is the SOH time series of the current battery from cycle 1 to cycle n, which is used to extract the global degradation and regeneration information. To avoid the influence of noises, we consider that capacity regeneration phenomenon has happened only when the value of the increased capacity between two cycles are no less than T h c . In other words, T h c is the regeneration threshold of the current battery. Because the purpose of setting the threshold is to separate regeneration phenomena from noises, when the noise is stronger (or weaker), the value of T h c should be larger (or lower) accordingly. We suggest that T h c can be set as three to five times of the median of the SOH fluctuations caused by noises. Similarly, { H h ( k ) } k = 1 n + m is the SOH time series of the historical battery from cycle 1 to cycle (n + m). The data of the first n cycles are mainly used to obtain the value of T h h and they are denoted as { H h e ( k ) } k = 1 n . The following m cycles of the historical battery are used as the reference to predict the regeneration information of the current battery, denoted as { H h p ( k ) } k = 1 m . Series { H c e ( k ) } k = 1 n , { H h e ( k ) } k = 1 n and { H h p ( k ) } k = 1 m can be obtained by capacity monitoring during the usage of the battery. In addition, cycle number series are denoted as { c e ( k ) } k = 1 n = { 1 , 2 , , n } and { c p ( k ) } k = 1 m = { n + 1 , n + 2 , , n + m } .
{ D H c e ( k ) } k = 1 n 1 is the forward difference series of SOH, where D H c e ( k ) is the SOH increment between cycle k and k + 1 and it is computed as
D H c e ( k ) = H c e ( k + 1 ) H c e ( k )
When the SOH of cycle (k + 1) is much better than that of cycle k, there may be significant capacity regeneration during this period. Then the cycle before regeneration can be put into set C c e .
C c e = { k | D H c e ( k ) > T h c , 1 k n 1 }
It is assumed that C c e contains q elements, which means that obvious regeneration of the current battery has appeared q times. We sort the elements of C c e in ascending order and get a new series { c c e ( k ) } k = 1 q . The values of regeneration from cycle c c e ( k ) to cycle ( c c e ( k ) + 1 ) are described by
D H c e ( k ) = D H c e ( c c e ( k ) )
The algorithm to extract regeneration region sets and regeneration cycle number series is as Algorithm 1.
Algorithm 1 Extraction of regeneration region sets and regeneration cycle number series
 1:  Input: { c ( k ) } k = 1 w ; { H ( k ) } k = 1 v
 2:  for i = 1 to w do
 3:    set j = 1
 4:    while( c ( i ) + j v ) and ( H ( c ( i ) + j ) H ( c ( i ) ) 0 ) do
 5:      put cycle number c ( i ) + j into set S i
 6:       j = j + 1
 7:    end while
 8:  end for
 9:  for i = 1 to w 1 do
 10:    for j = i + 1 to w do
 11:       S i = S i S j
 12:    end for
 13:     N U M ( i ) = | S i |
 14:  end for
 15:   N U M ( w ) = | S w |
 16:  Output: sets S 1 , S 2 , , S w (may need)
        series { N U M ( w ) } k = 1 w ;
The proposed Algorithm 1 can be called repeatedly in the extraction phase for different inputs. For example, when the algorithm is called at the first time, the input will be w = q , { c ( k ) } k = 1 w = { c c e ( k ) } k = 1 q ; v = n , { H ( k ) } k = 1 v = { H c e ( k ) } k = 1 n . The output will be S c i = S i ( i = 1 , 2 , , q ) ; { N U M c e ( w ) } k = 1 q = { N U M ( w ) } k = 1 w .
All the cycle number of global degradation is denoted by set C c e , which can be expressed as
C c e = C e i = 1 q S c i
By sorting the g elements of C c e in ascending order we can get series { c c e ( k ) } k = 1 g . With series { c c e ( k ) } k = 1 g , the global degradation of SOH can be described by
H c e ( k ) = H c e ( c c e ( k ) )
Similarly, elements in SOH forward difference series of the historical battery { D H h e ( k ) } k = 1 n 1 , { D H h p ( k ) } k = 1 m 1 are shown as:
D H h e ( k ) = H h e ( k + 1 ) H h e ( k )
D H h p ( k ) = H h p ( k + 1 ) H h p ( k )
To obtain similar regeneration information from the historical battery, PSO algorithm is adopted to identify the value of the regeneration threshold T h h from the historical battery. Moreover, the range of T h h is given as T h h [ 0.1 * T h c , 10 * T h c ] . The fitness functions are described by
F 1 = a | q p | + b | k = 1 q N U M c e ( k ) k = 1 p N U M h e ( k ) |
F 2 = | x i k T h c |
where q is the number of regeneration regions of the current battery and p is the number of regeneration regions of the historical battery within the first n cycles. N U M c e ( k ) is the regeneration cycle number of the current battery in the kth regeneration region. N U M h e ( k ) is the regeneration cycle number of the historical battery in the kth regeneration region. p and { N U M h e ( k ) } k = 1 p can be obtained by extracting regeneration information of the historical battery with PSO algorithm and Algorithm 1. x i k is the particle of PSO algorithm. If the minimum value of F 1 can be obtained from different particles, the particle which makes the value of F 2 minimum is the optimal solution.
The set C h e and set C h p denote the cycle before regeneration of the historical battery and they are expressed as follows:
C h e = { k | D H h e ( k ) > T h h , 1 k n 1 }
C h p = { k | D H h p ( k n ) > T h h , n + 1 k n + m 1 }
It is assumed that the number of the element of set C h e and set C h p are p e and p p , respectively. After sorting the elements of C h e and C h p in ascending order, we can obtain series { c h e ( k ) } k = 1 p e and { c h p ( k ) } k = 1 p p . Thus, regeneration amplitude series { D H h e ( k ) } k = 1 p e and { D H h p ( k ) } k = 1 p p can be written as
D H h e ( k ) = D H h e ( c h e ( k ) )
D H h p ( k ) = D H h p ( c h p ( k ) )
By calling Algorithm 1 in the extraction phrase, the regeneration cycle number series { N U M h e ( k ) } k = 1 p e and { N U M h p ( k ) } k = 1 p p can be obtained.
The process of prediction phase is shown in Figure 5. Based on the regeneration cycle number prediction algorithm, the series { N U M c p ( k ) } k = 1 p p can be predicted. In addition, based on the regeneration amplitude prediction algorithm, the series { D H c p ( k ) } k = 1 p p can be obtained. Taking global SOH degradation series { H c e ( k ) } k = 1 g as the training samples, the ( m l = 1 p p N U M c p ( l ) ) steps’ global SOH prediction values can be calculated and written as { H c p ( 0 ) ( k ) } k = 1 m l = 1 p p N U M c p ( l ) .
In this article, the working time profiles of the current and historical batteries are similar. Moreover, it is assumed that the relationship of capacity regeneration between two batteries is linear. This means that ϕ c ϕ h 1 and φ c φ h 1 are constants. The regeneration cycle number series { N U M c p ( k ) } k = 1 p p can be predicted by linear model and the elements are described by
N U M c p ( k ) = [ N U M h p ( k ) i = 1 q N U M c e ( i ) i = 1 p e N U M h e ( i ) + 1 2 ]
where [   ] is the symbol of floor function. Similarly, the elements of { D H c p ( k ) } k = 1 p p can be predicted as
D H c p ( k ) = D H h p ( k ) ( i = 1 q D H c e ( i ) i = 1 p e D H h e ( i ) )
In addition, Gaussian process model described in Section 2.2 is used in global degradation prediction.
After all prediction processes, the predicted SOH values of each regeneration region are inserted into the global regeneration series. Then the final SOH prediction values of all cycles are estimated. The SOH series of the ith regeneration region is { R H c p ( i ) ( k ) } k = 1 N U M c p ( i ) . Based on the assumption that SOH linearly degrades in the regeneration regions, the value of the element R H c p ( i ) ( k ) can be calculated by
R H c p ( i ) ( k ) = H c p ( i 1 ) ( c h p ( i ) n ) + D H c p ( i ) N U M c p ( i ) ( N U M c p ( i ) k + 1 )
Series { H c p ( i ) ( k ) } k = 1 m l = i + 1 p p N U M c p ( l ) is updated by
{ H c p ( i ) ( k ) } k = 1 m l = i + 1 p p N U M c p ( l ) = { H c p ( i 1 ) ( 1 ) , , H c p ( i 1 ) ( c h p ( i ) n ) , R H c p ( i ) ( 1 ) , , R H c p ( i ) ( N U M c p ( i ) ) , H c p ( i 1 ) ( c h p ( i ) n + 1 ) , H c p ( i 1 ) ( m l = i p p N U M c p ( l ) ) }

4. Case Studies with NASA Data

4.1. Battery Data Set

The Li-ion battery capacity degradation data adopted to conduct the experiments of SOH prediction are obtained from the data repository of the NASA Ame’s Prognostics Center of Excellence (PCoE) [36]. In the battery prognostics testbed, 18,650 sized Li-ion batteries were run through three operational profiles (charge, discharge, and impedance) at ambient temperature of 4, 24 and 43 °C. Repeated charge and discharge of the batteries resulted in accelerated aging. Charging was performed using a 1.5 A constant current (CC) until the battery voltage of 4.2 V was reached, then in a constant voltage (CV) mode until the current dropped to 20 mA. Discharge was carried out at three constant levels of current (1 A, 2 A, and 4 A) until the discharge voltage fell to 2.2, 2.5 and 2.7 V, respectively. The experimental parameters of the batteries are summarized in Table 1. Detailed information about the testbed can be found in [24].
Based on Equation (12), SOH can be easily calculated by the experimental capacity data. Figure 6 illustrates the trajectory of SOH for these batteries. It can be noted that the SOH time series presents obvious regeneration phenomena after long time rest. Moreover, the SOH degradation rate in regeneration regions is much faster than in other cycles. In addition, although the degradation rate varies with different end of discharge voltage, after similar long time rest, their capacity regeneration phenomena are similar. Therefore, it is meaningful to extract the similar regeneration information by using the available data of another battery to establish the prediction model of the current battery.

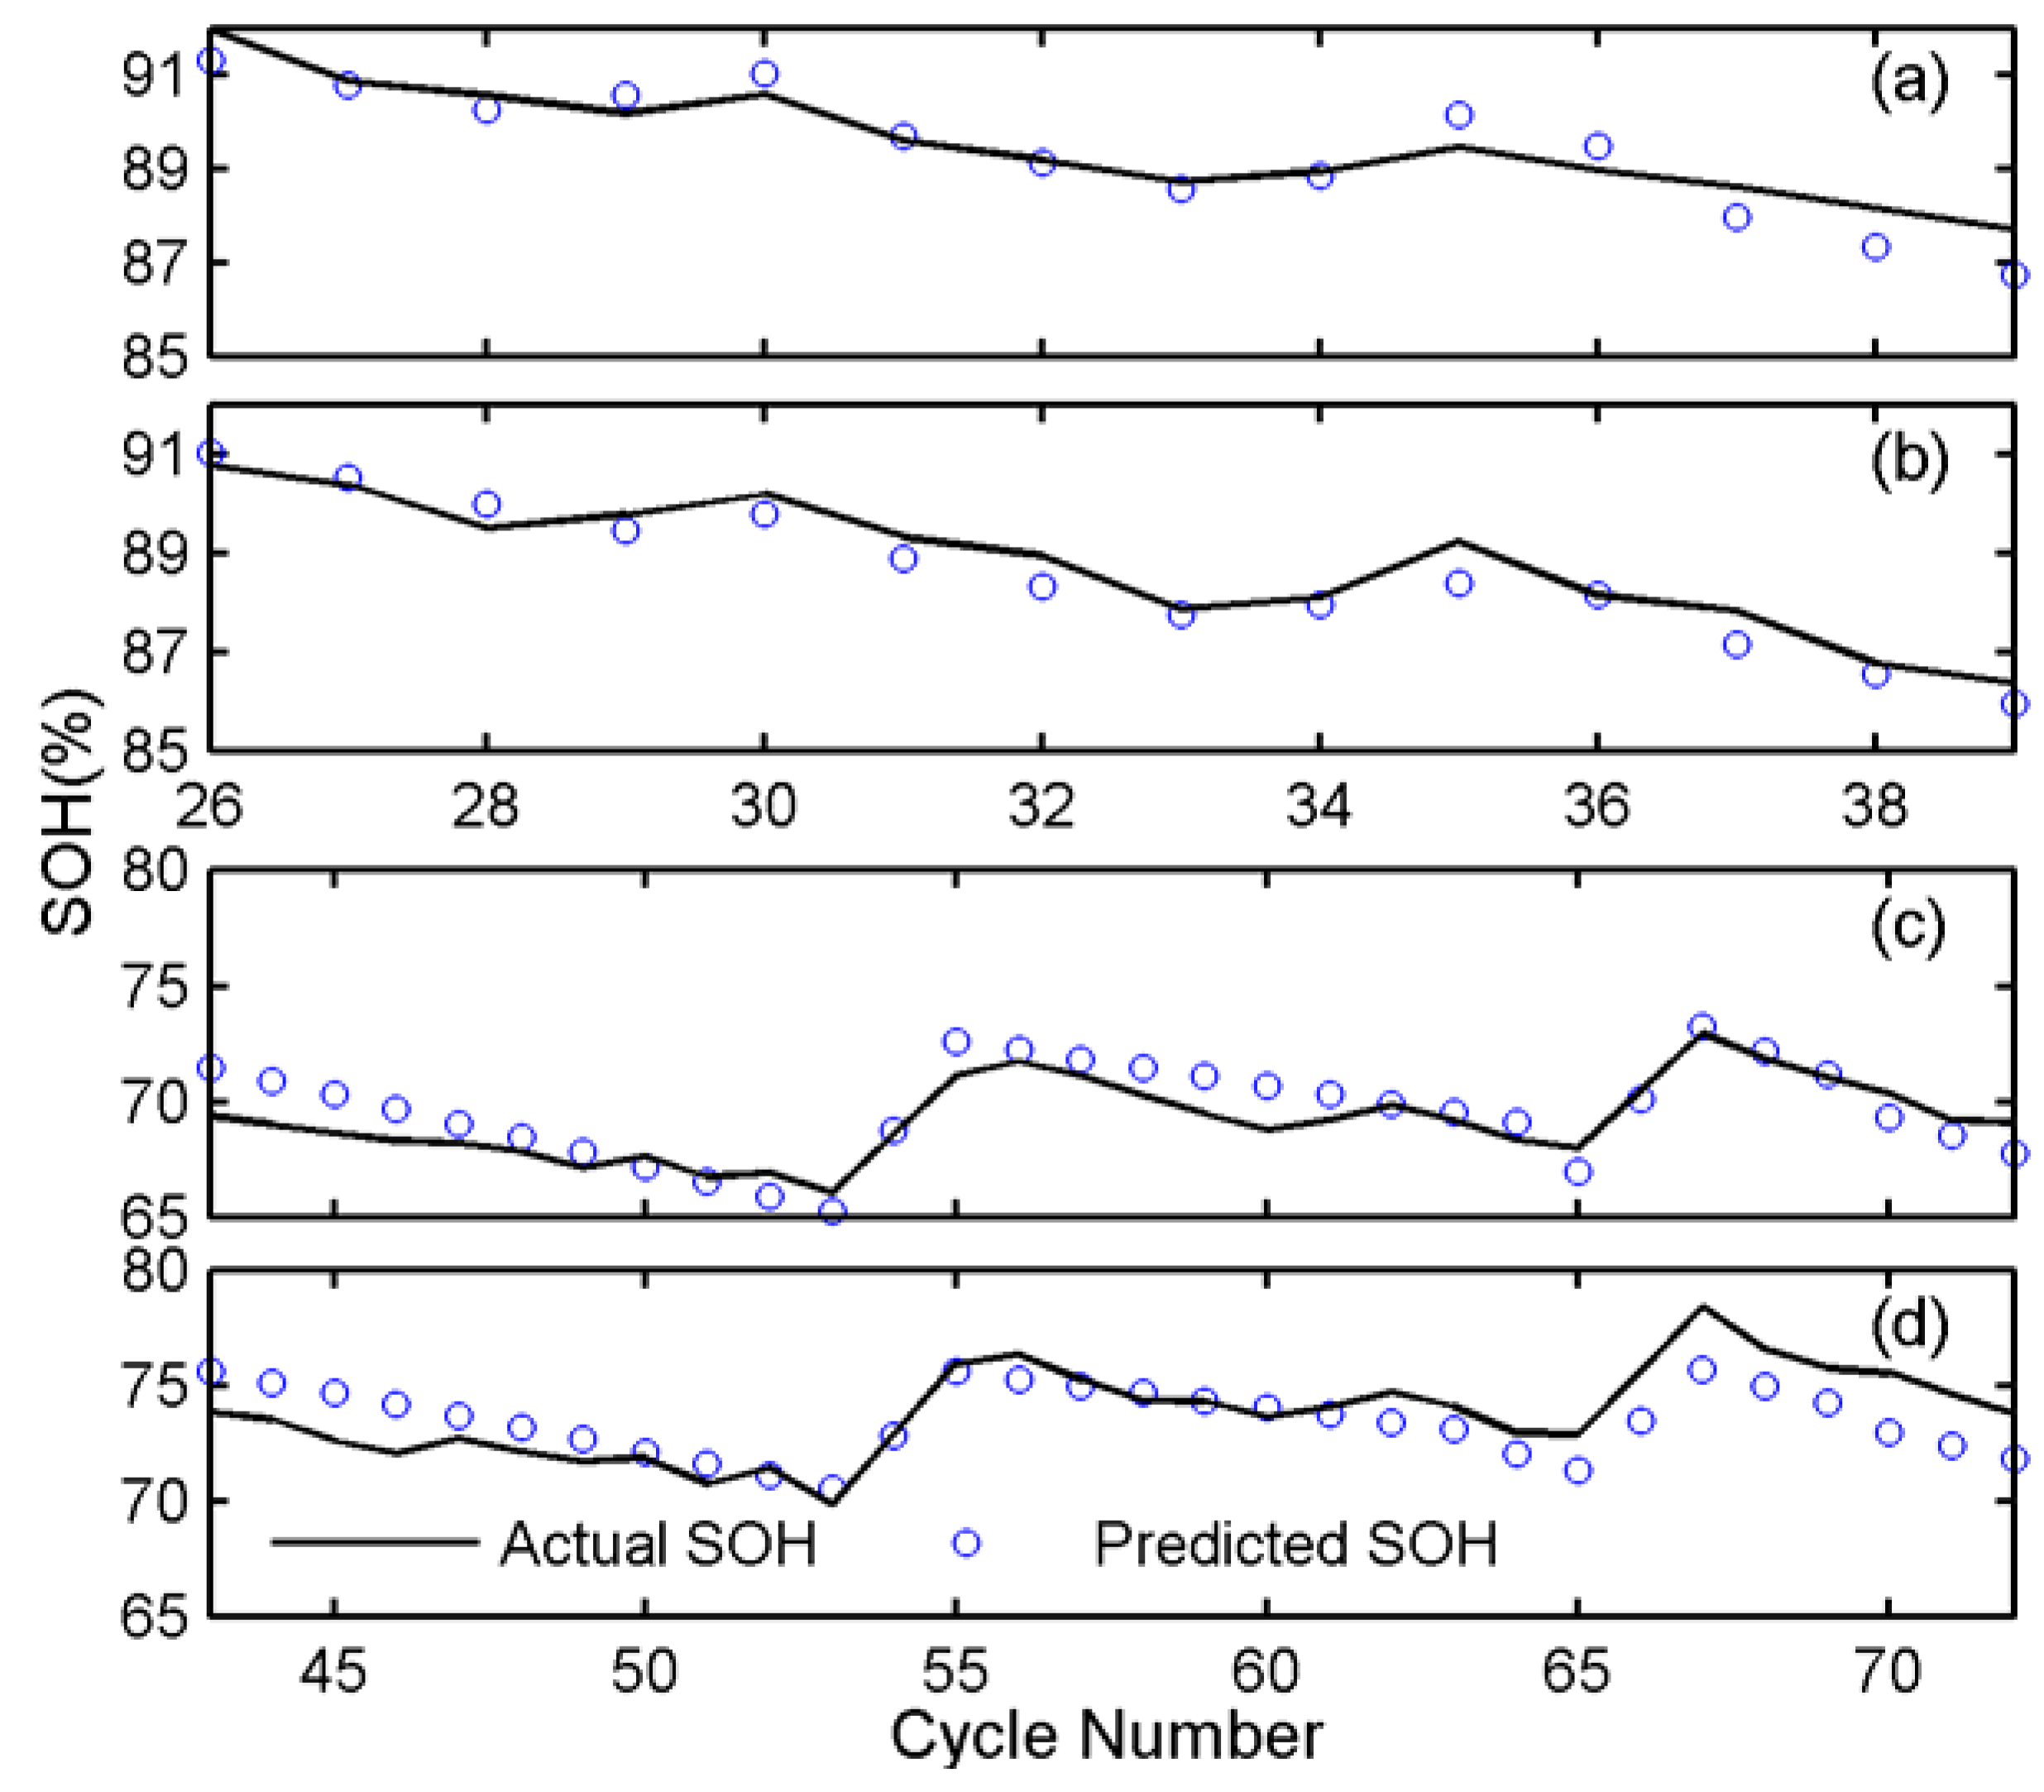
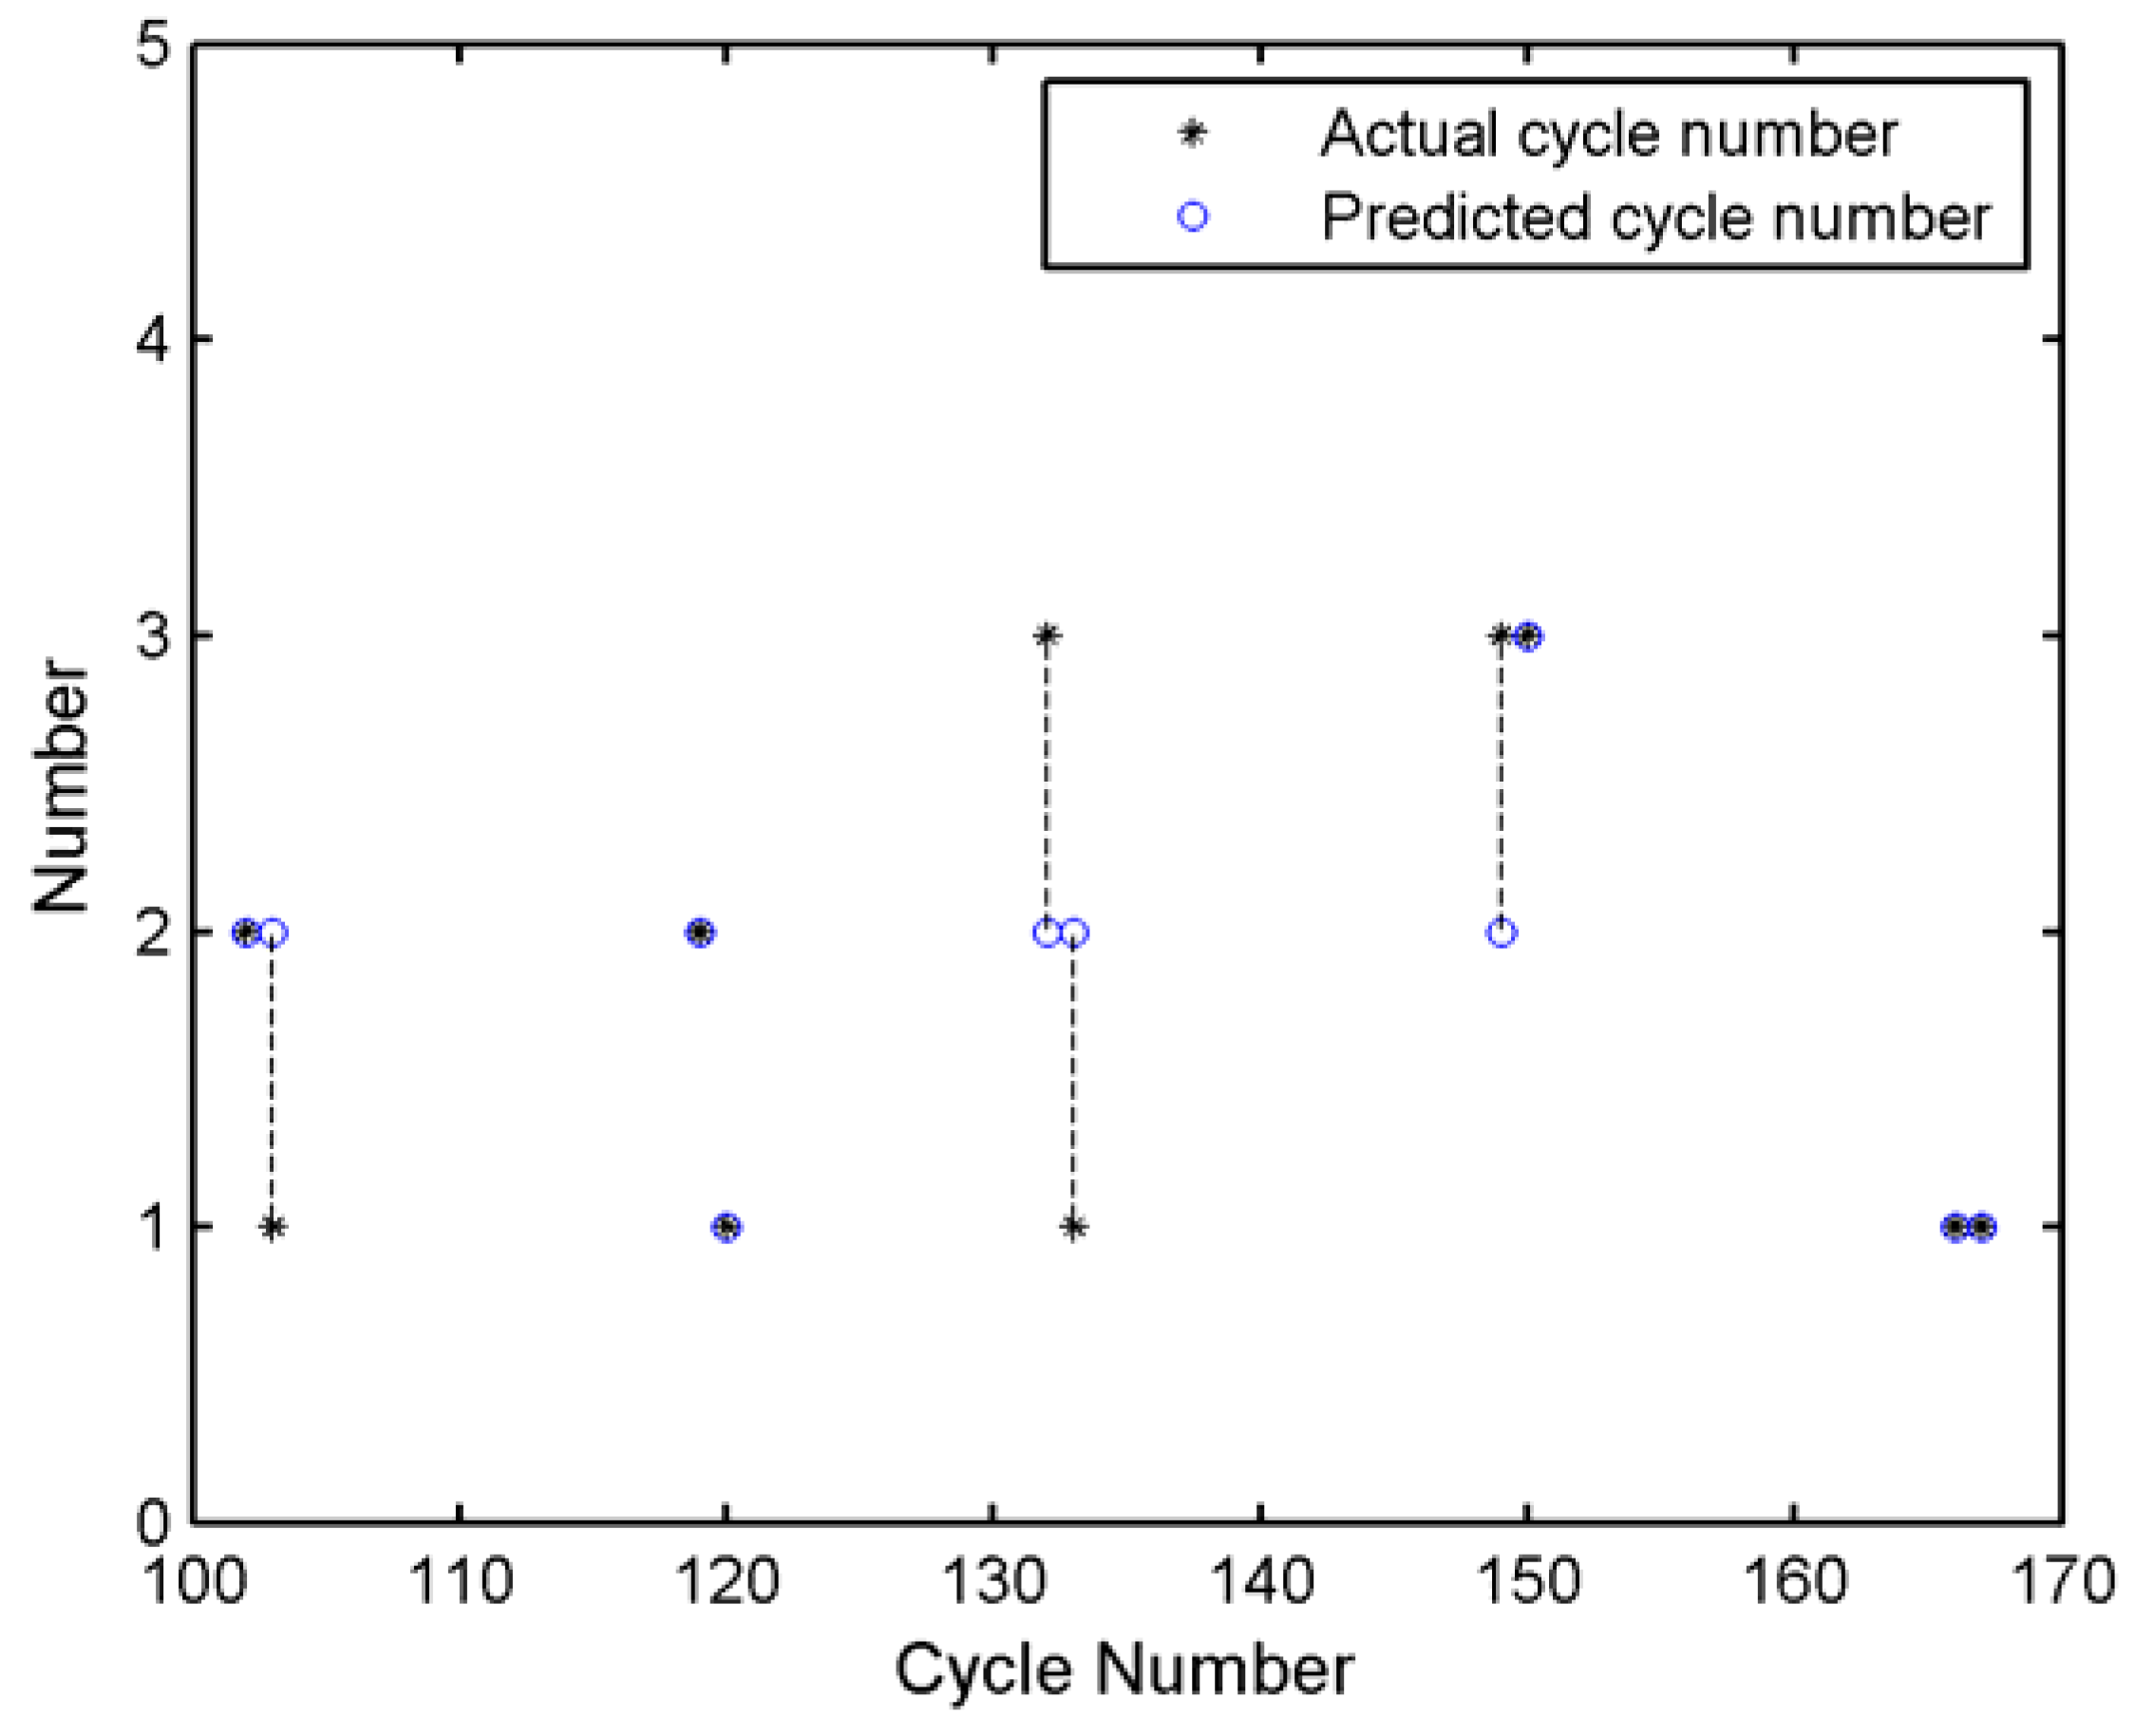
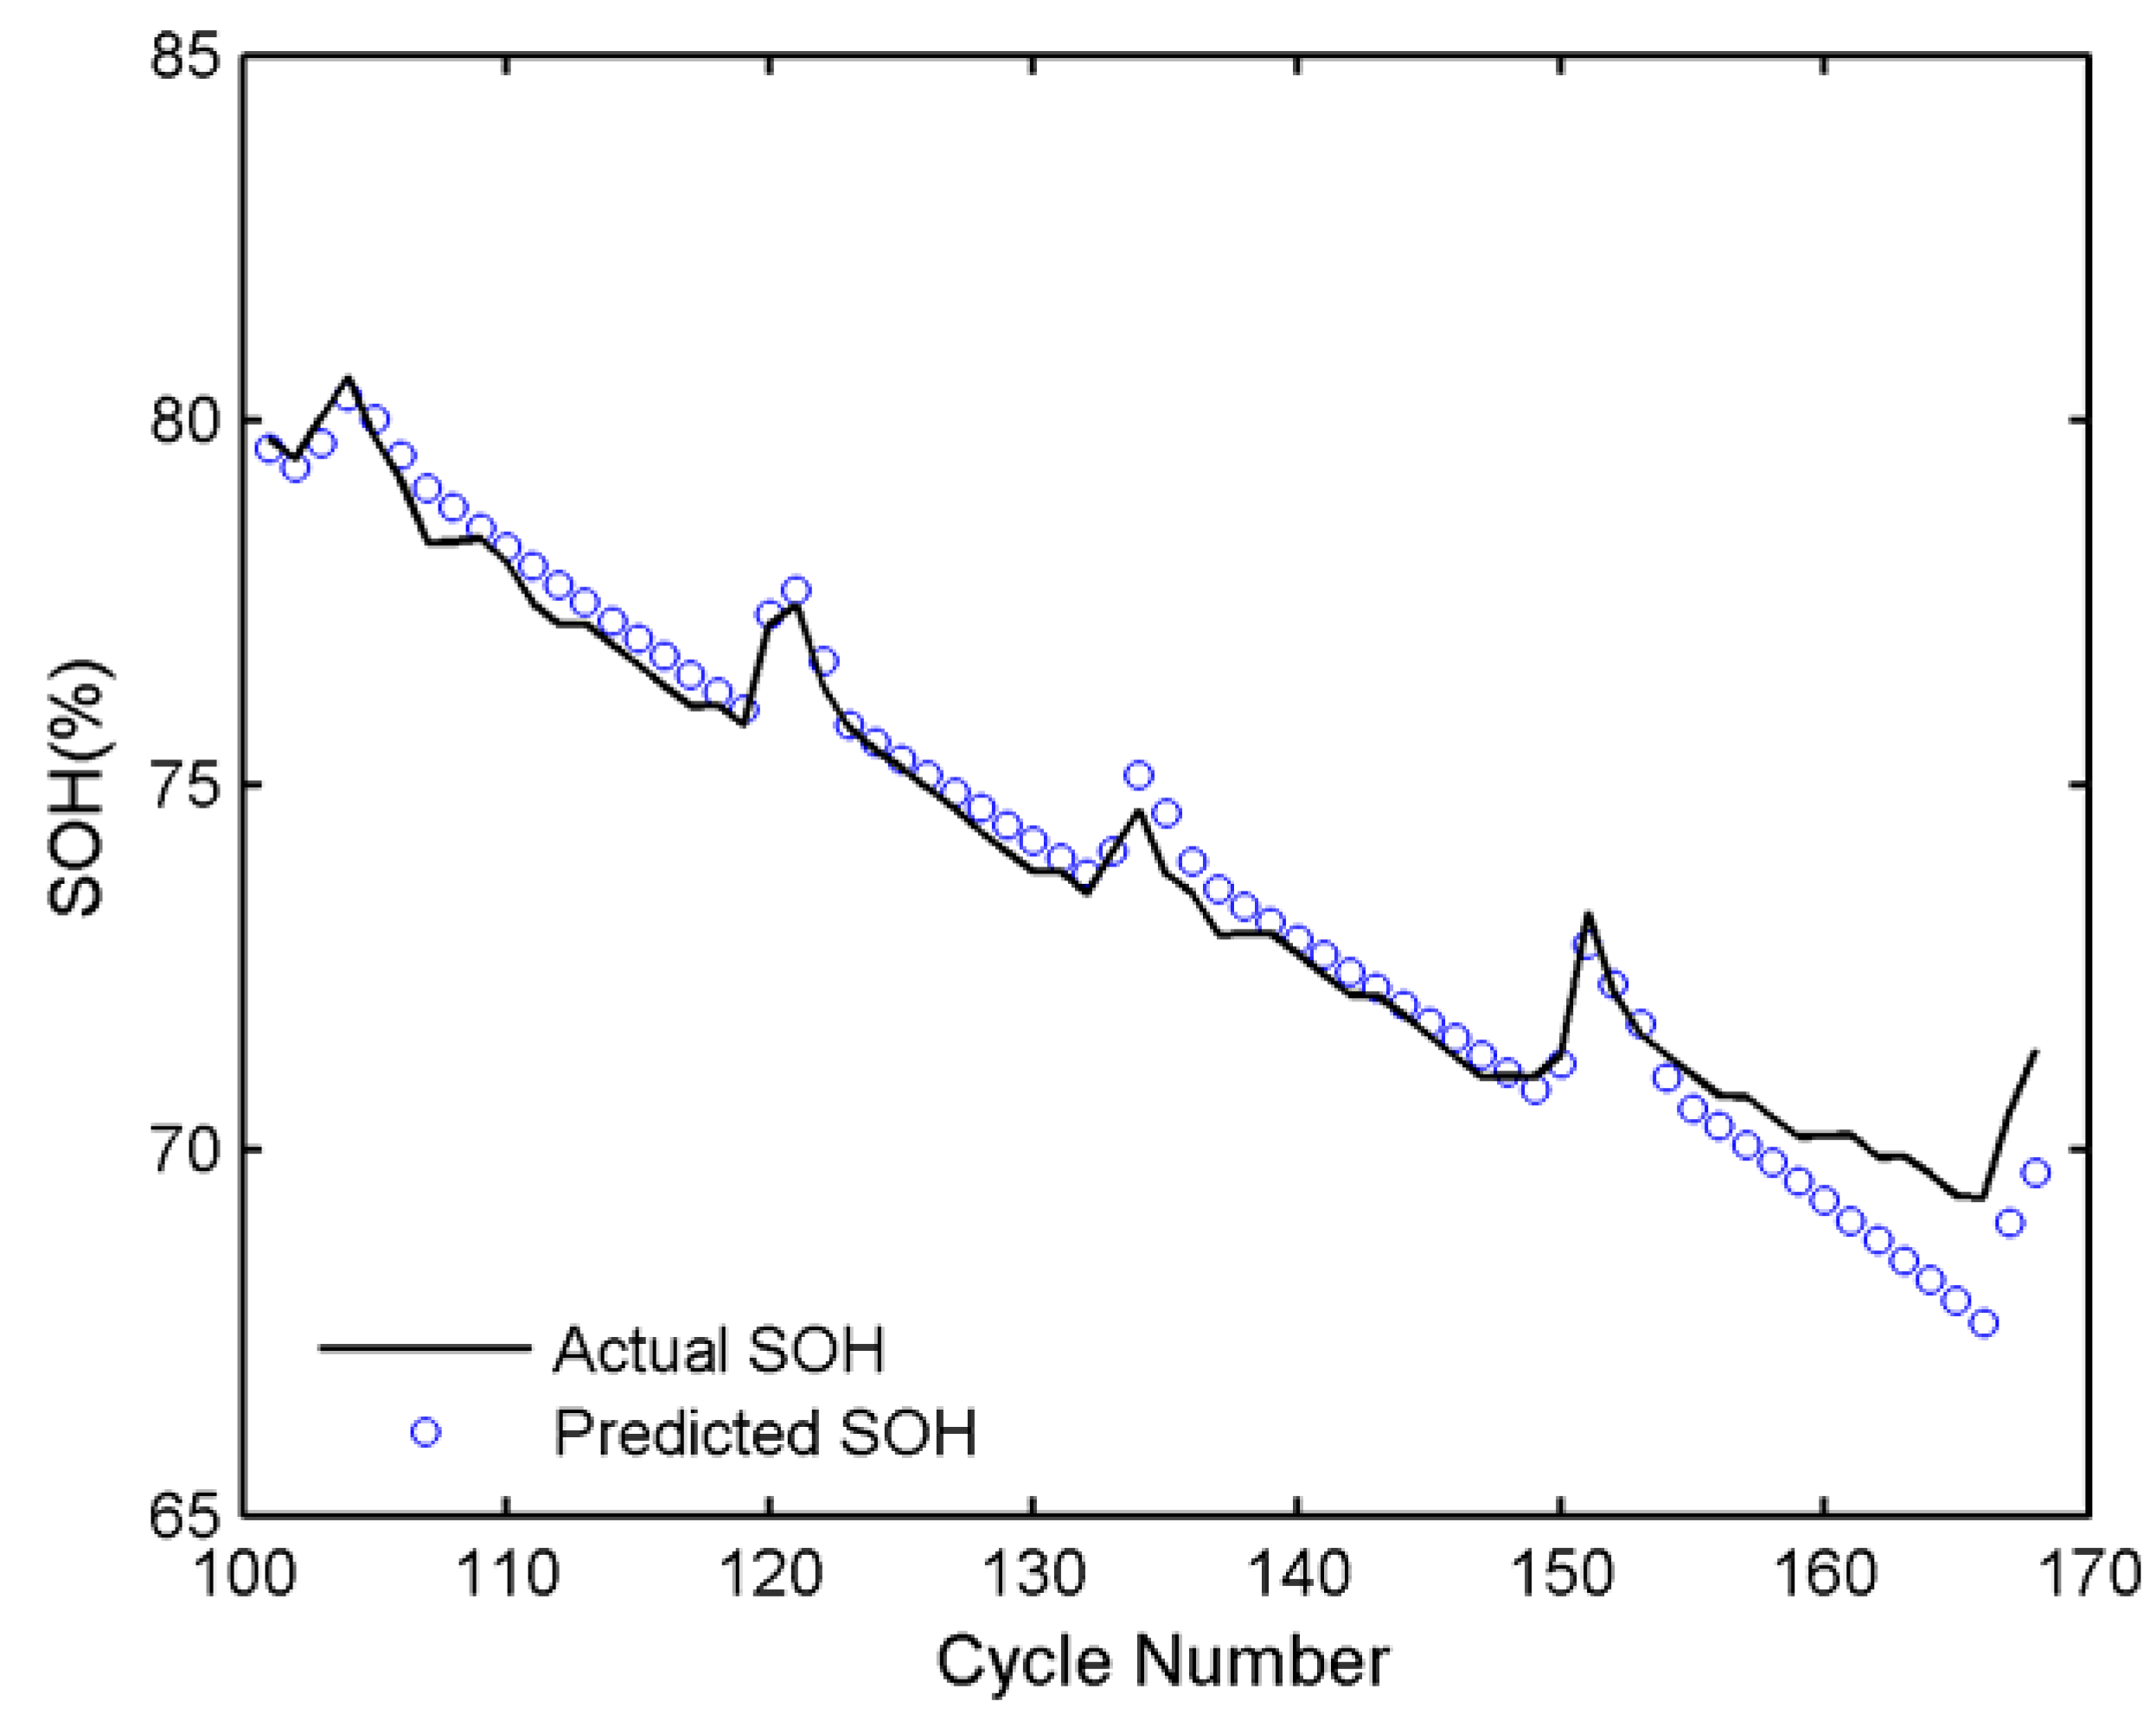
4.2. Prediction and Comparison

In this article, the rules of the batteries No. 05, No. 06 and No. 07 are alternatively changed to validate the effectiveness of the proposed method. Specifically, in the first group, battery No. 05 is considered as the current battery and battery No. 07 is assumed as the historical battery. In the second group, battery No. 06 is considered the current battery and battery No. 05 is assumed as the historical battery. In the third group, battery No. 07 is considered as the current battery and battery No. 06 is assumed as the historical battery.
For the first group, SOH values of the first 100 cycles of battery No. 05 and all SOH values of battery No. 07 are utilized as the inputs of this framework (n = 100, m = 68). In addition, the regeneration threshold is set at 0.1% ( T h c = 0.1 % ). In the PSO algorithm, the parameters of fitness function F 1 are given as a = 0.8 and b = 0.2. The regeneration influences of the current and historical batteries are shown in Figure 7.
From Figure 7, in the 100 training samples, it is noted that the regeneration regions of the historical battery and the current battery are all accurately extracted. It indicates that under this proposed framework, the value of the regeneration threshold determined by PSO algorithm is appropriate.
The regeneration cycle number and the regeneration amplitude of the current battery are predicted by Equations (26) and (27), respectively. The predicted cycle number and the actual regeneration cycle number of each regeneration region are shown in Figure 8, while the predicted regeneration amplitude and the actual regeneration amplitude are shown in Figure 9. It is noted that the maximum value of prediction errors of the regeneration cycle number is equal to one cycle and the predicted values of the regeneration amplitude are rather close to the corresponding actual values. It demonstrates that it is effective to use linear models to predict regeneration cycle number and regeneration amplitude in this proposed framework.
The curves of global SOH degradation of battery No. 05 are illustrated in Figure 10. Compared with the curves in Figure 6, they are smoother and have fewer fluctuations. GP model is used to predict global SOH degradation of the current battery. The prediction results of the global SOH degradation are also shown in Figure 10. It can be noted that the predicted global SOH results are very close to the real validation data. This is because after decoupling from regeneration, global SOH degradation trend is smoother and easier to be accurately predicted.
The final SOH prediction results are obtained by integrating the prediction results of regeneration and global degradation, as shown in Figure 11. It is clear that based on this framework, the predicted values of SOH is close to the actual values. In addition, the regeneration values of cycles in the regeneration regions are also well predicted and the prediction error around these cycles is relatively small.
The prediction steps of the other two groups are the same as the first one. To quantitatively describe the effectiveness of the proposed method, mean absolute percentage error (MAPE) and root mean square error (RMSE) are taken as the criteria to evaluate the performance of different prognostic methods.
RMSE = 1 N i = 1 N ( y i y ^ i ) 2
MAPE = 1 N i = 1 N | y i y ^ i y i | × 100 %
Table 2 presents the comparison results of the performance of nine methods for batteries No. 05, No. 06 and No. 07. The prediction errors of the published methods are from References [15,26,29]. It is obvious that the prediction performance of the proposed SRTPF is much better than that of the eight published methods. More specifically, the lowest prediction MAPE on batteries No. 05, No. 06, No. 07 among the eight published methods are 0.82%, 2.28% and 1.02%, respectively, while the counterparts of this proposed framework are 0.62%, 1.41% and 0.76%, respectively. Similarly, for prediction RMSE, we can conclude that the proposed SRTPF can obtain the lowest values for all the three batteries. There are two possible reasons for the excellent prediction performance of SRTPF. The first reason is that this framework can well predict the regeneration information. The second reason is that global SOH degradation trend without the effects of regeneration becomes smoother and easier to be predicted.

4.3. Prediction with Various Operation Conditions

To further validate the effectiveness of the SRTPF method, SOH degradation of batteries under different temperatures and operation currents are predicted in this subsection. The BMS has thermal management module like fan and electric heater to do the cooling control and heating control [37]. That is to say, under a certain scenario, the temperature around the battery is almost constant. Similarly, the discharge current of the battery can be considered as a constant under a certain scenario. For example, Han [38] has pointed out that a typical driving cycle for a pure EV can be similarly expressed by constant current cycles. Therefore, the key point lies in the validation of this method under various operating ambient temperatures and with different discharge current levels. The following two scenarios are selected to validate the effectiveness of SRTPF.
Scenario 1: For batteries No. 30 and No. 32, the ambient temperature is 43 °C and the discharge current is 4 A.
Scenario 2: For batteries No. 47 and No. 48, the ambient temperature is 4 °C and the discharge current is 1 A.
In each scenario, the two batteries are taken as the current and historical batteries alternatively, and the prediction results are illustrated in Figure 12. From the figure, it is noted that the predicted SOH values and the actual values are very close. It means that the proposed method can be well used in different temperatures and operation currents.

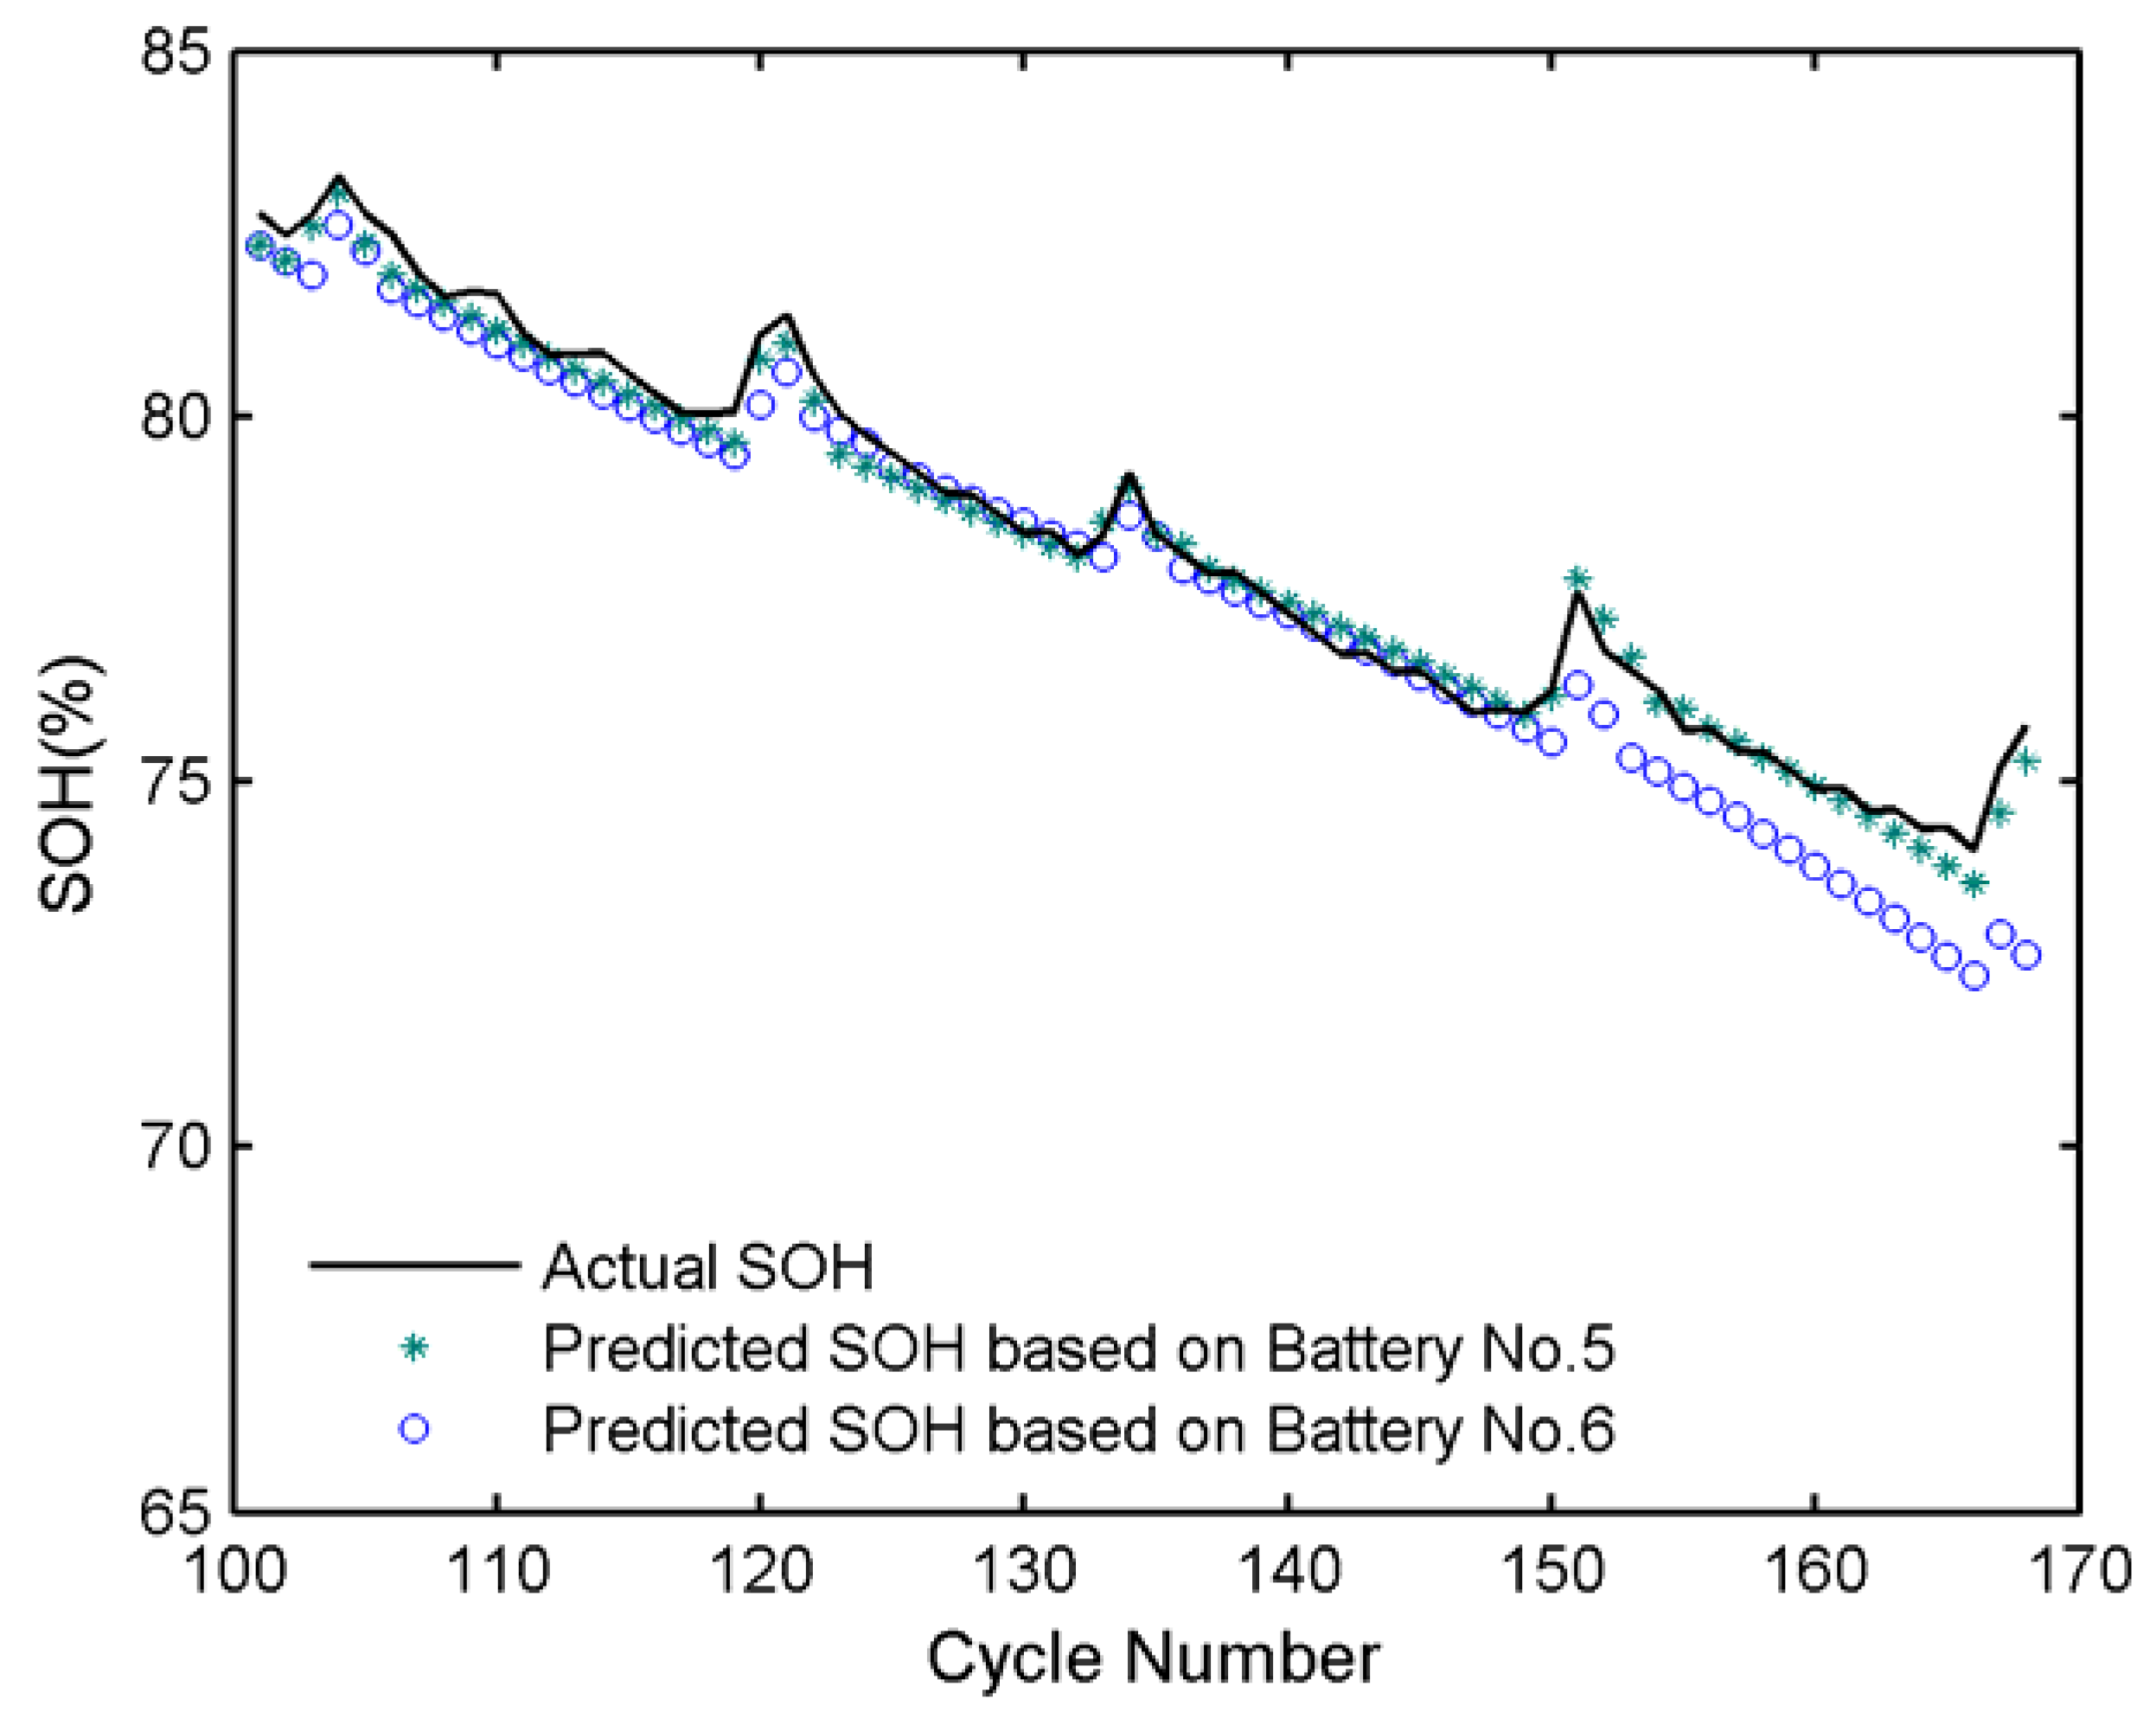
4.4. Prediction with Two or More Historical Batteries

The proposed similar rest time-based prognostic framework can realize the prediction of capacity regeneration of the current battery depending only on the degradation SOH data of one historical battery. This is meaningful when the available data sets of historical batteries are not many. It is noteworthy that the first fitness function of PSO (Equation (21)) is used for finding the regeneration threshold of the historical battery to obtain the most similar regenerate regions of the current battery. The second fitness function of PSO (Equation (22)) is to ensure that the threshold difference of the current and historical batteries is the minimum. Therefore, in the same scenario, when there are two or more available historical batteries have similar rest time to the current battery, the second fitness function F 2 can also be used to select a more similar degradation trajectory to the current battery from them. Then, the capacity data set of this historical battery can be adopted to predict the SOH of the current battery under this framework.
To validate the effectiveness of the historical battery selection based on similarity of degradation trajectory, battery No. 07 is considered as the current battery and batteries No. 05 and No. 06 are assumed as the historical batteries. The values of the parameters are set to the same selected values in Section 4.2. As shown in Table 3, when battery No. 05 is considered as the historical battery, the value of fitness function F 2 is 0; when battery No. 06 is considered as the historical battery, the value of fitness function F 2 is 0.75%. Therefore, compared with battery No. 06, the regeneration phenomenon of battery No. 05 is more similar to that of battery No. 07.
The prediction results of battery No. 07 are illustrated in Figure 13. It is noted that the predicted SOH degradation curve of battery No. 07 by using the data of battery No. 05 is closer to the actual curve than by using the data of battery No. 06. As shown in Table 2, when battery No. 05 is considered as the historical battery, the prediction MAPE and RMSE are 0.30% and 0.28%, which are respectively less than 0.76% and 0.83% calculated by considering battery No. 06 as the historical battery. The prediction results can demonstrate that the proposed method can automatically choose a more similar trajectory to predict the regeneration phenomena of the current battery.

5. Conclusions and Future Work

To obtain more accurate prediction results of battery SOH with capacity regeneration phenomenon, we have proposed a similar rest time-based prognostic framework, in which the regeneration information of a historical battery is used. Based on this framework, regeneration phenomenon and global degradation are decoupled. The two parts are predicted separately and finally integrated together to obtain the overall SOH degradation results. PSO is utilized to determine the threshold of capacity regeneration of the historical battery. Moreover, GP model is used to predict the global SOH degradation trend; linear models are utilized to predict the regeneration cycle number and the regeneration amplitude.
The results of case studies demonstrate that both the global degradation trend and the regeneration phenomena of the testing batteries can be well predicted under different temperatures and discharge currents. Moreover, this proposed framework can obtain more accurate prediction results of battery SOH than the published methods. In addition, when two or more historical batteries are available, the fitness function of PSO can be used to choose a more similar trajectory from them to predict the regeneration phenomena of the current battery.
In future research, additional evaluations need to be conducted on other Li-ion batteries under more complex operating conditions. In addition, more effort should be focused on improving the adaptability of the proposed method.

Acknowledgments

This work was supported by the National Natural Science Foundation of China (NSFC: 61304218) and the China Scholarship Council.

Author Contributions

Shengkui Zeng conceived the framework and structured the whole paper; Taichun Qin performed the experiments and wrote the paper; Jianbin Guo analyzed the data; and Zakwan Skaf checked the results.

Conflicts of Interest

The authors declare no conflict of interest.

References

  1. Berecibar, M.; Gandiaga, I.; Villarreal, I.; Omar, N.; Van Mierlo, J.; Van den Bossche, P. Critical review of state of health estimation methods of Li-ion batteries for real applications. Renew. Sust. Energ. Rev. 2016, 56, 572–587. [Google Scholar] [CrossRef]
  2. Ting, T.O.; Man, K.L.; Lim, E.G.; Leach, M. Tuning of Kalman Filter Parameters via Genetic Algorithm for State-of-Charge Estimation in Battery Management System. Sci. World J. 2014, 2014, 176052. [Google Scholar] [CrossRef] [PubMed]
  3. Torai, S.; Nakagomi, M.; Yoshitake, S.; Yamaguchi, S.; Oyama, N. State-of-health estimation of LiFePO4/graphite batteries based on a model using differential capacity. J. Power Sources 2016, 306, 62–69. [Google Scholar] [CrossRef]
  4. Sepasi, S.; Roose, L.R.; Matsuura, M.M. Extended Kalman Filter with a Fuzzy Method for Accurate Battery Pack State of Charge Estimation. Energies 2015, 8, 5217–5233. [Google Scholar] [CrossRef]
  5. Nejad, S.; Gladwin, D.T.; Stone, D.A. A systematic review of lumped-parameter equivalent circuit models for real-time estimation of lithium-ion battery states. J. Power Sources 2016, 316, 183–196. [Google Scholar] [CrossRef]
  6. Aung, H.; Low, K.S.; Goh, S.T. State-of-Charge Estimation of Lithium-Ion Battery Using Square Root Spherical Unscented Kalman Filter (Sqrt-UKFST) in Nanosatellite. IEEE Trans. Power Electron. 2015, 30, 4774–4783. [Google Scholar] [CrossRef]
  7. Zhang, C.P.; Wang, L.Y.; Li, X.; Chen, W.; Yin, G.G.; Jiang, J.C. Robust and Adaptive Estimation of State of Charge for Lithium-Ion Batteries. IEEE Trans. Ind. Electron. 2015, 62, 4948–4957. [Google Scholar] [CrossRef]
  8. Yu, Z.H.; Huai, R.T.; Xiao, L.J. State-of-Charge Estimation for Lithium-Ion Batteries Using a Kalman Filter Based on Local Linearization. Energies 2015, 8, 7854–7873. [Google Scholar] [CrossRef]
  9. Hendricks, C.; Williard, N.; Mathew, S.; Pecht, M. A failure modes, mechanisms, and effects analysis (FMMEA) of lithium-ion batteries. J. Power Sources 2015, 297, 113–120. [Google Scholar] [CrossRef]
  10. Li, Y.; Yang, J.; Song, J. Microscale characterization of coupled degradation mechanism of graded materials in lithium batteries of electric vehicles. Renew. Sust. Energ. Rev. 2015, 50, 1445–1461. [Google Scholar] [CrossRef]
  11. Liu, D.T.; Xie, W.; Liao, H.T.; Peng, Y. An Integrated Probabilistic Approach to Lithium-Ion Battery Remaining Useful Life Estimation. IEEE Trans. Instrum. Meas. 2015, 64, 660–670. [Google Scholar]
  12. Long, B.; Xian, W.M.; Jiang, L.; Liu, Z. An improved autoregressive model by particle swarm optimization for prognostics of lithium-ion batteries. Microelectron. Reliab. 2013, 53, 821–831. [Google Scholar] [CrossRef]
  13. Saha, B.; Goebel, K.; Poll, S.; Christophersen, J. Prognostics Methods for Battery Health Monitoring Using a Bayesian Framework. IEEE Trans. Instrum. Meas. 2009, 58, 291–296. [Google Scholar] [CrossRef]
  14. Miao, Q.; Xie, L.; Cui, H.J.; Liang, W.; Pecht, M. Remaining useful life prediction of lithium-ion battery with unscented particle filter technique. Microelectron. Reliab. 2013, 53, 805–810. [Google Scholar] [CrossRef]
  15. Liu, D.T.; Pang, J.Y.; Zhou, J.B.; Peng, Y.; Pecht, M. Prognostics for state of health estimation of lithium-ion batteries based on combination Gaussian process functional regression. Microelectron. Reliab. 2013, 53, 832–839. [Google Scholar] [CrossRef]
  16. Tang, S.; Yu, C.; Wang, X.; Guo, X.; Si, X. Remaining Useful Life Prediction of Lithium-Ion Batteries Based on the Wiener Process with Measurement Error. Energies 2014, 7, 520–547. [Google Scholar] [CrossRef]
  17. Widodo, A.; Shim, M.C.; Caesarendra, W.; Yang, B.S. Intelligent prognostics for battery health monitoring based on sample entropy. Expert Syst. Appl. 2011, 38, 11763–11769. [Google Scholar] [CrossRef]
  18. Guo, J.; Li, Z.J.; Pecht, M. A Bayesian approach for Li-Ion battery capacity fade modeling and cycles to failure prognostics. J. Power Sources 2015, 281, 173–184. [Google Scholar] [CrossRef]
  19. Klass, V.; Behm, M.; Lindbergh, G. A support vector machine-based state-of-health estimation method for lithium-ion batteries under electric vehicle operation. J. Power Sources 2014, 270, 262–272. [Google Scholar] [CrossRef]
  20. Liu, D.T.; Wang, H.; Peng, Y.; Xie, W.; Liao, H.T. Satellite Lithium-Ion Battery Remaining Cycle Life Prediction with Novel Indirect Health Indicator Extraction. Energies 2013, 6, 3654–3668. [Google Scholar] [CrossRef]
  21. Chen, C.C.; Zhang, B.; Vachtsevanos, G. Prediction of Machine Health Condition Using Neuro-Fuzzy and Bayesian Algorithms. IEEE Trans. Instrum. Meas. 2012, 61, 297–306. [Google Scholar] [CrossRef]
  22. Wu, L.F.; Fu, X.H.; Guan, Y. Review of the Remaining Useful Life Prognostics of Vehicle Lithium-Ion Batteries Using Data-Driven Methodologies. Appl. Sci. 2016, 6, 166. [Google Scholar] [CrossRef]
  23. Jin, G.; Matthews, D.E.; Zhou, Z. A Bayesian framework for on-line degradation assessment and residual life prediction of secondary batteries in spacecraft. Reliab. Eng. Syst. Saf. 2013, 113, 7–20. [Google Scholar] [CrossRef]
  24. Saha, B.; Goebel, K. Modeling Li-ion battery capacity depletion in a particle filtering framework. In Proceedings of Annual Conference of the Prognostics and Health Management Society, San Diego, CA, USA, 27 September–1 October 2009; pp. 1–10.
  25. Eddahech, A.; Briat, O.; Vinassa, J.-M. Lithium-ion battery performance improvement based on capacity recovery exploitation. Electrochim. Acta 2013, 114, 750–757. [Google Scholar] [CrossRef]
  26. He, Y.J.; Shen, J.N.; Shen, J.F.; Ma, Z.F. State of health estimation of lithium-ion batteries: A multiscale Gaussian process regression modeling approach. AICHE J. 2015, 61, 1589–1600. [Google Scholar] [CrossRef]
  27. Olivares, B.E.; Cerda Munoz, M.A.; Orchard, M.E.; Silva, J.F. Particle-Filtering-Based Prognosis Framework for Energy Storage Devices With a Statistical Characterization of State-of-Health Regeneration Phenomena. IEEE Trans. Instrum. Meas. 2013, 62, 364–376. [Google Scholar] [CrossRef]
  28. Orchard, M.E.; Lacalle, M.S.; Olivares, B.E.; Silva, J.F.; Palma-Behnke, R.; Estevez, P.A.; Severino, B.; Calderon-Munoz, W.; Cortes-Carmona, M. Information-Theoretic Measures and Sequential Monte Carlo Methods for Detection of Regeneration Phenomena in the Degradation of Lithium-Ion Battery Cells. IEEE Trans. Reliab. 2015, 64, 701–709. [Google Scholar] [CrossRef]
  29. Qin, T.C.; Zeng, S.K.; Guo, J.B. Robust prognostics for state of health estimation of lithium-ion batteries based on an improved PSO-SVR model. Microelectron. Reliab. 2015, 55, 1280–1284. [Google Scholar] [CrossRef]
  30. Qin, T.C.; Zeng, S.K.; Guo, J.B.; Skaf, Z.W. A Rest Time-Based Prognostic Framework for State of Health Estimation of Lithium-Ion Batteries with Regeneration Phenomena. Energies 2016, 9, 896. [Google Scholar] [CrossRef]
  31. Kennedy, J.; Eberhart, R. Particle swarm optimization. In Proceedings of IEEE International Conference on Neural Networks, Perth, Australia, 27 November–1 December 1995; pp. 1942–1948.
  32. Trelea, I.C. The particle swarm optimization algorithm: convergence analysis and parameter selection. Inf. Process. Lett. 2003, 85, 317–325. [Google Scholar] [CrossRef]
  33. Brahim-Belhouari, S.; Bermak, A. Gaussian process for nonstationary time series prediction. Comput. Stat. Data Anal. 2004, 47, 705–712. [Google Scholar] [CrossRef]
  34. Murphy, K.P. Machine Learning: A Probabilistic Perspective; MIT press: Cambridge, MA, USA, 2012. [Google Scholar]
  35. He, W.; Williard, N.; Osterman, M.; Pecht, M. Prognostics of lithium-ion batteries based on Dempster-Shafer theory and the Bayesian Monte Carlo method. J. Power Sources 2011, 196, 10314–10321. [Google Scholar] [CrossRef]
  36. Saha, B.; Goebel, K. Battery Data Set; National Aeronautics and Space Adminstration (NASA) Ames Prognostics Data Repository: Moffett Field, CA, USA, 2007.
  37. Lu, L.; Han, X.; Li, J.; Hua, J.; Ouyang, M. A review on the key issues for lithium-ion battery management in electric vehicles. J. Power Sources 2013, 226, 272–288. [Google Scholar] [CrossRef]
  38. Han, X.B.; Ouyang, M.G.; Lu, L.G.; Li, J.Q. A comparative study of commercial lithium ion battery cycle life in electric vehicle: Capacity loss estimation. J. Power Sources 2014, 268, 658–669. [Google Scholar] [CrossRef]
Figure 1. The experimental degradation data: (a) with calendar time; and (b) with cycle number.
Symmetry 09 00004 g001
Figure 2. Mappings between current and historical batteries.
Symmetry 09 00004 g002
Figure 3. Schematic of similar rest time-based prognostic framework.
Symmetry 09 00004 g003
Figure 4. Detailed description of extraction phase.
Symmetry 09 00004 g004
Figure 5. Detailed description of prediction phase.
Symmetry 09 00004 g005
Figure 6. State of health (SOH) values over time: (a) batteries No. 05, No. 06 and No. 07 with calendar time; (b) batteries No. 05, No. 06 and No. 07 with cycle number; (c) batteries No. 30 and No. 32 with calendar time; (d) batteries No. 30 and No. 32 with cycle number; (e) batteries No. 47 and No. 48 with calendar time; and (f) batteries No. 47 and No. 48 with cycle number.
Symmetry 09 00004 g006
Figure 7. The extraction of regeneration information: (a) current battery (No. 05); and (b) historical battery (No. 07).
Symmetry 09 00004 g007
Figure 8. The actual cycle number and predicted cycle number of each regeneration region.
Symmetry 09 00004 g008
Figure 9. The actual regeneration amplitude and predicted regeneration amplitude.
Symmetry 09 00004 g009
Figure 10. Prediction results of global SOH degradation.
Symmetry 09 00004 g010
Figure 11. Overall prediction results of SOH.
Symmetry 09 00004 g011
Figure 12. Prediction results of SOH: (a) battery No. 30 is the current battery and battery No. 32 is the historical battery; (b) battery No. 32 is the current battery and battery No. 30 is the historical battery; (c) battery No. 47 is the current battery and battery No. 48 is the historical battery; and (d) battery No. 48 is the current battery and battery No. 47 is the historical battery.
Symmetry 09 00004 g012
Figure 13. Prediction results of battery No. 07.
Symmetry 09 00004 g013
Table 1. Discharging parameters of the batteries.
Battery IDTemperature (°C)Discharge Current (A)End of Discharge Voltage (V)
No. 052422.7
No. 062422.5
No. 072422.2
No. 304342.2
No. 324342.7
No. 47412.5
No. 48412.7
Table 2. Comparison of different prognostic methods for batteries No. 05, No. 06 and No. 07.
Battery No.050607
Error CriteriaMAPE (%)RMSEMAPE (%)RMSEMAPE (%)RMSE
LGPFR 123.01.7110.306.901.901.59
QGPFR 11.901.507.705.125.405.52
C-LGPFR 11.601.3610.206.861.701.73
C-QGPFR 12.101.8029.020.442.602.69
SMK-GPR 21.651.3810.607.081.911.88
P-MGPR 21.551.362.962.121.091.14
SE-MGPR 21.381.202.932.111.021.07
IPSO-SVR 30.820.752.281.661.020.97
SRTPF0.620.611.411.250.760.83
1 Results of these methods are from Reference [15]; 2 Results of these methods are from Reference [26]; 3 Results of these methods are from Reference [29].
Table 3. Prediction errors with different historical batteries.
Historical Battery No.F2 (%)MAPE (%)RMSE
0500.300.28
060.750.760.83

