Deep Learning-Based Image Segmentation for Al-La Alloy Microscopic Images
by
 ,
,
Boyuan Ma
1,2, 
Xiaojuan Ban
1,2,*,
Haiyou Huang
3,*,
Yulian Chen
1,2,
Wanbo Liu
3 and
Yonghong Zhi
4 1
School of Computer and Communication Engineering, University of Science and Technology Beijing, Xueyuan Road 30, Haidian District, Beijing 100083, China
2
Beijing Key Laboratory of Knowledge Engineering for Materials Science, Xueyuan Road 30, Haidian District, Beijing 100083, China
3
Institute for Advanced Materials and Technology, University of Science and Technology Beijing, Xueyuan Road 30, Haidian District, Beijing 100083, China
4
Mechanical and Electrical Design and Research Institute of Shanxi Province, Shengli Street 228, Xinghualing District, Taiyuan 030009, Shanxi, China
*
Authors to whom correspondence should be addressed.
Symmetry 2018, 10(4), 107; https://doi.org/10.3390/sym10040107
Submission received: 24 March 2018
/
Revised: 2 April 2018
/
Accepted: 3 April 2018
/
Published: 13 April 2018
(This article belongs to the Special Issue Symmetry in Cooperative Applications III)
Abstract
:Quantitative analysis through image processing is a key step to gain information regarding the microstructure of materials. In this paper, we develop a deep learning-based method to address the task of image segmentation for microscopic images using an Al–La alloy. Our work makes three key contributions. (1) We train a deep convolutional neural network based on DeepLab to achieve image segmentation and have significant results. (2) We adopt a local processing method based on symmetric overlap-tile strategy which makes it possible to analyze the microscopic images with high resolution. Additionally, it achieves seamless segmentation. (3) We apply symmetric rectification to enhance the accuracy of results with 3D information. Experimental results showed that our method outperforms existing segmentation methods.
1. Introduction
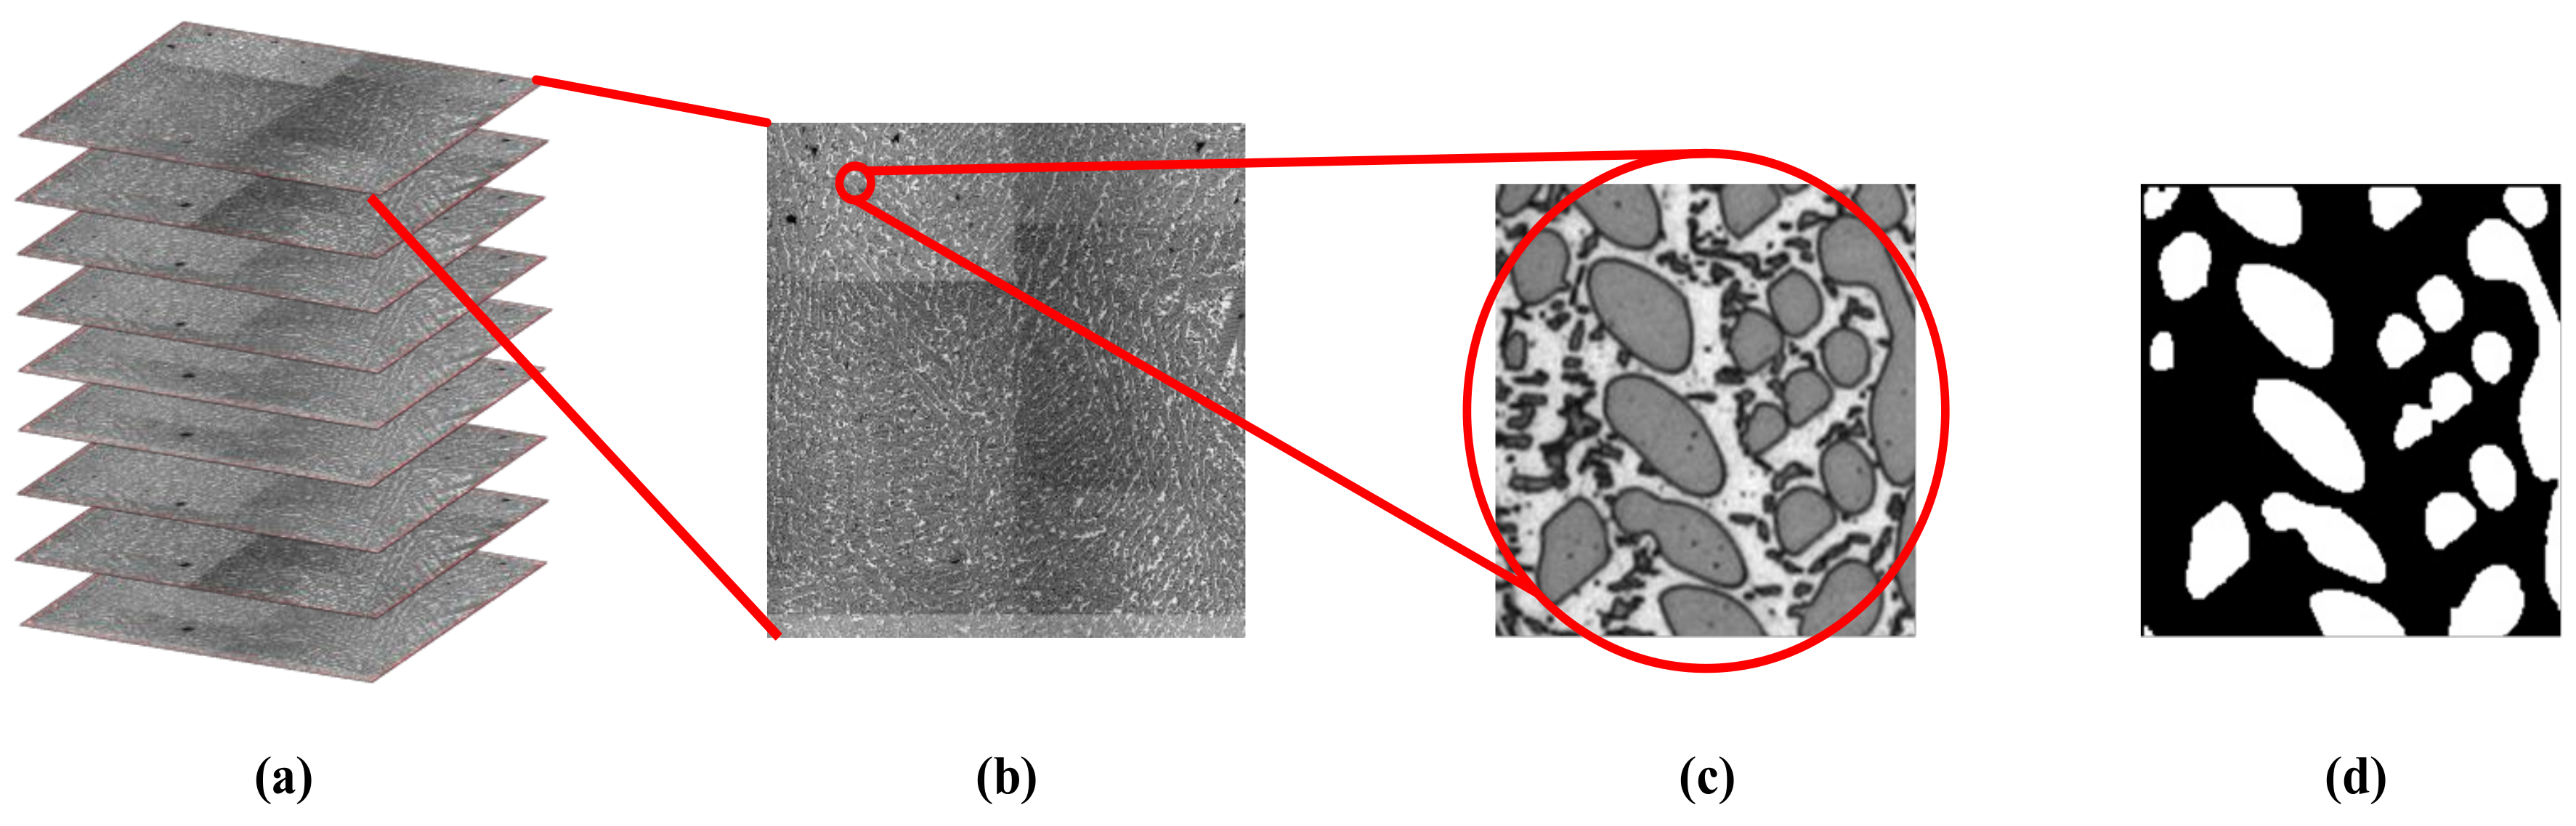
The quantitative analysis of microstructures is essential in the control the properties and performances of metals or alloys [1,2]. An important step in this process is microscopic image processing [3] which is used to extract significant information in a microstructure [4]. A sample of dendritic microstructure in a hypereutectic Al–La 35 wt % alloy is shown in Figure 1; (c) is the original image and (d) is manual segmentation result for (c) with the white regions representing the Al11La3 dendrites or the region of interest (ROI); with the black regions representing the background (eutectic phase of α-Al+Al11La3). The traditional fully manual operations to extract the ROI are accurate; however, it is also time-consuming and laborious. Therefore, quick and accurate image segmentation for Al–La alloy’s microscopic imaging is an urgent problem yet to be solved.
Image segmentation in microscopic image processing is a highly challenging problem for several reasons. First, the microstructure of many samples is highly complex [5]. For example, there are hundreds of substructures with different shapes and sizes (e.g., “dendritic structure” in Al–La alloy [6], “grains” in polycrystalline iron [2], or “cells” in biomaterials [7], etc.) which must be accurately segmented in each image. Second, as shown in Figure 1b,c, numerous microscopic images contain observable contaminations. These noises are formed during sample preparation, image acquisition, or other processes, and result in an obstacle in the process of image segmentation. Third, most microstructures observed by serial sections retain consistency in shape and topology (adjacency relations) in different sections, as shown in Figure 1a. It can be challenging to model and incorporate such domain knowledge in the segmentation method. Fourth, microscopic images usually have high resolution which increases demand for an efficient high speed image segmentation method which requires less memory space.
Many image segmentation methods can be categorized into two classes: 2D image process methods that extract the ROI directly and tracking-based methods that incorporate 3D information between slices as domain knowledge. Many existing 2D methods segment images independently such as Otsu [8], Adaptive Threshold [9], watershed [10,11], graph cut [12,13], K-means [14], and deep convolution neural networks (DCNN) [15]. Among those published works, DCNN has the highest performance on image segmentation tasks. Motivated by the advances in image classification using convolutional networks [16,17,18], many researchers have proposed variations of networks to solve the image segmentation problem [19,20,21,22,23,24]. DeepLab [24] is currently a state of the art network that has the highest performance on benchmark datasets [25,26]. However, like the traditional 2D image processing methods, DeepLab does not incorporate consistency between slices as domain knowledge to enhance result performance. Additionally, benchmarks [25,26] have a lower resolution compared with microscopic images: the highest resolution of M. Everingham et al. [25] was 500 × 486, and that of X. Chen et al. [26] was 2048 × 1024. In contrast, the resolution of Figure 1b is 3200 × 3200, which is too large to train a network with limited GPU memory resources. L.C. Chen et al. [24] down-sampled the images by a factor of two because the objects in X. Chen et al. [26] were too large. Unfortunately, there are many finely detailed dendrite structures in Figure 1b to which the down-sample process cannot be applied.
Tracking-based methods have been developed for image segmentation in image sequences. A. Alatan et al. [27] proposed an analysis model for fusing motion, color, and intensity change information. However, this mode concentrated on video sequences in which the camera parameters are fixed and moving objects can be observed in the still background. Although 3D microscopic images are complicated, the microscope can adjust luminance and focal length for each slice during the image acquisition process. Additionally, in this application, the objects are large dendrites and the background includes both the white base and tiny dendrites. Therefore, the objects and the backgrounds are both moving or changing along the border which will inevitably cause errors in the motion analysis. A. Doulamis et al. [28] proposed a content-based segmentation algorithm oriented to stereoscopic sequences. This research established a scheme to fuse depth and color information as sufficient descriptors to achieve image segmentation. However, the depth map estimation and occlusion compensation were calculated in a binocular camera system (two camera viewpoints). Although the microscopic images were captured with only one microscope, no depth information was captured in this application. Feng [29] proposed an interactive segmentation method based on breakpoint detection, but this proposal requires considerable time for manual refinement and cannot be applied to microscopic images with high resolution and numerous slices. Waggoner [30] presented a 3D propagative method based on graph cut theory; however, the model was unable to detect an emergent dendrite structure. In addition, as the slice’s resolution increased, memory consumption and computational time grew exponentially.
In this work, we have proposed a deep learning-based image segmentation method for Al–La alloy microscopic images. Our algorithm presents three contributions:
- (1)
- A deep learning network used to segment microscopic images. Attributable to data enhancement and network training, it achieves the highest accuracy (93.09% in pixel accuracy) compared to some traditional methods. Additionally, it only consumes 17.553 s per slice which could be beneficial to practical applications.
- (2)
- A symmetric overlap-tile strategy for deep learning-based image segmentation. The strategy could eliminate under-segmentation errors along the boundary of dendrites which is currently inevitable when using the base DeepLab network in simple local processing. Additionally, this strategy makes it possible to segment high resolution images with limited GPU resources.
- (3)
- A symmetric rectification method which analyzes 3D information to yield more precise results. Given the complexity of serial sections, it cannot apply the image fusion method often applied to video sequences. However, we have designed a symmetric image fusion method which is suitable to 3D material slices. It rectifies the segmentation mask by analyzing the masks of neighboring slices. Experimental results indicate that it could eliminate contaminations which form during the sample preparation process.
The remainder of this paper is organized as follows: In Section 2, we provide a description of the DeepLab network, the overlap-tile strategy, and symmetric rectification. In Section 3, we present experiments on different segmentation methods to show the effectiveness of the proposed approach. We conclude the paper in Section 4.
2. Proposed Method
2.1. Overview of the Proposed Method
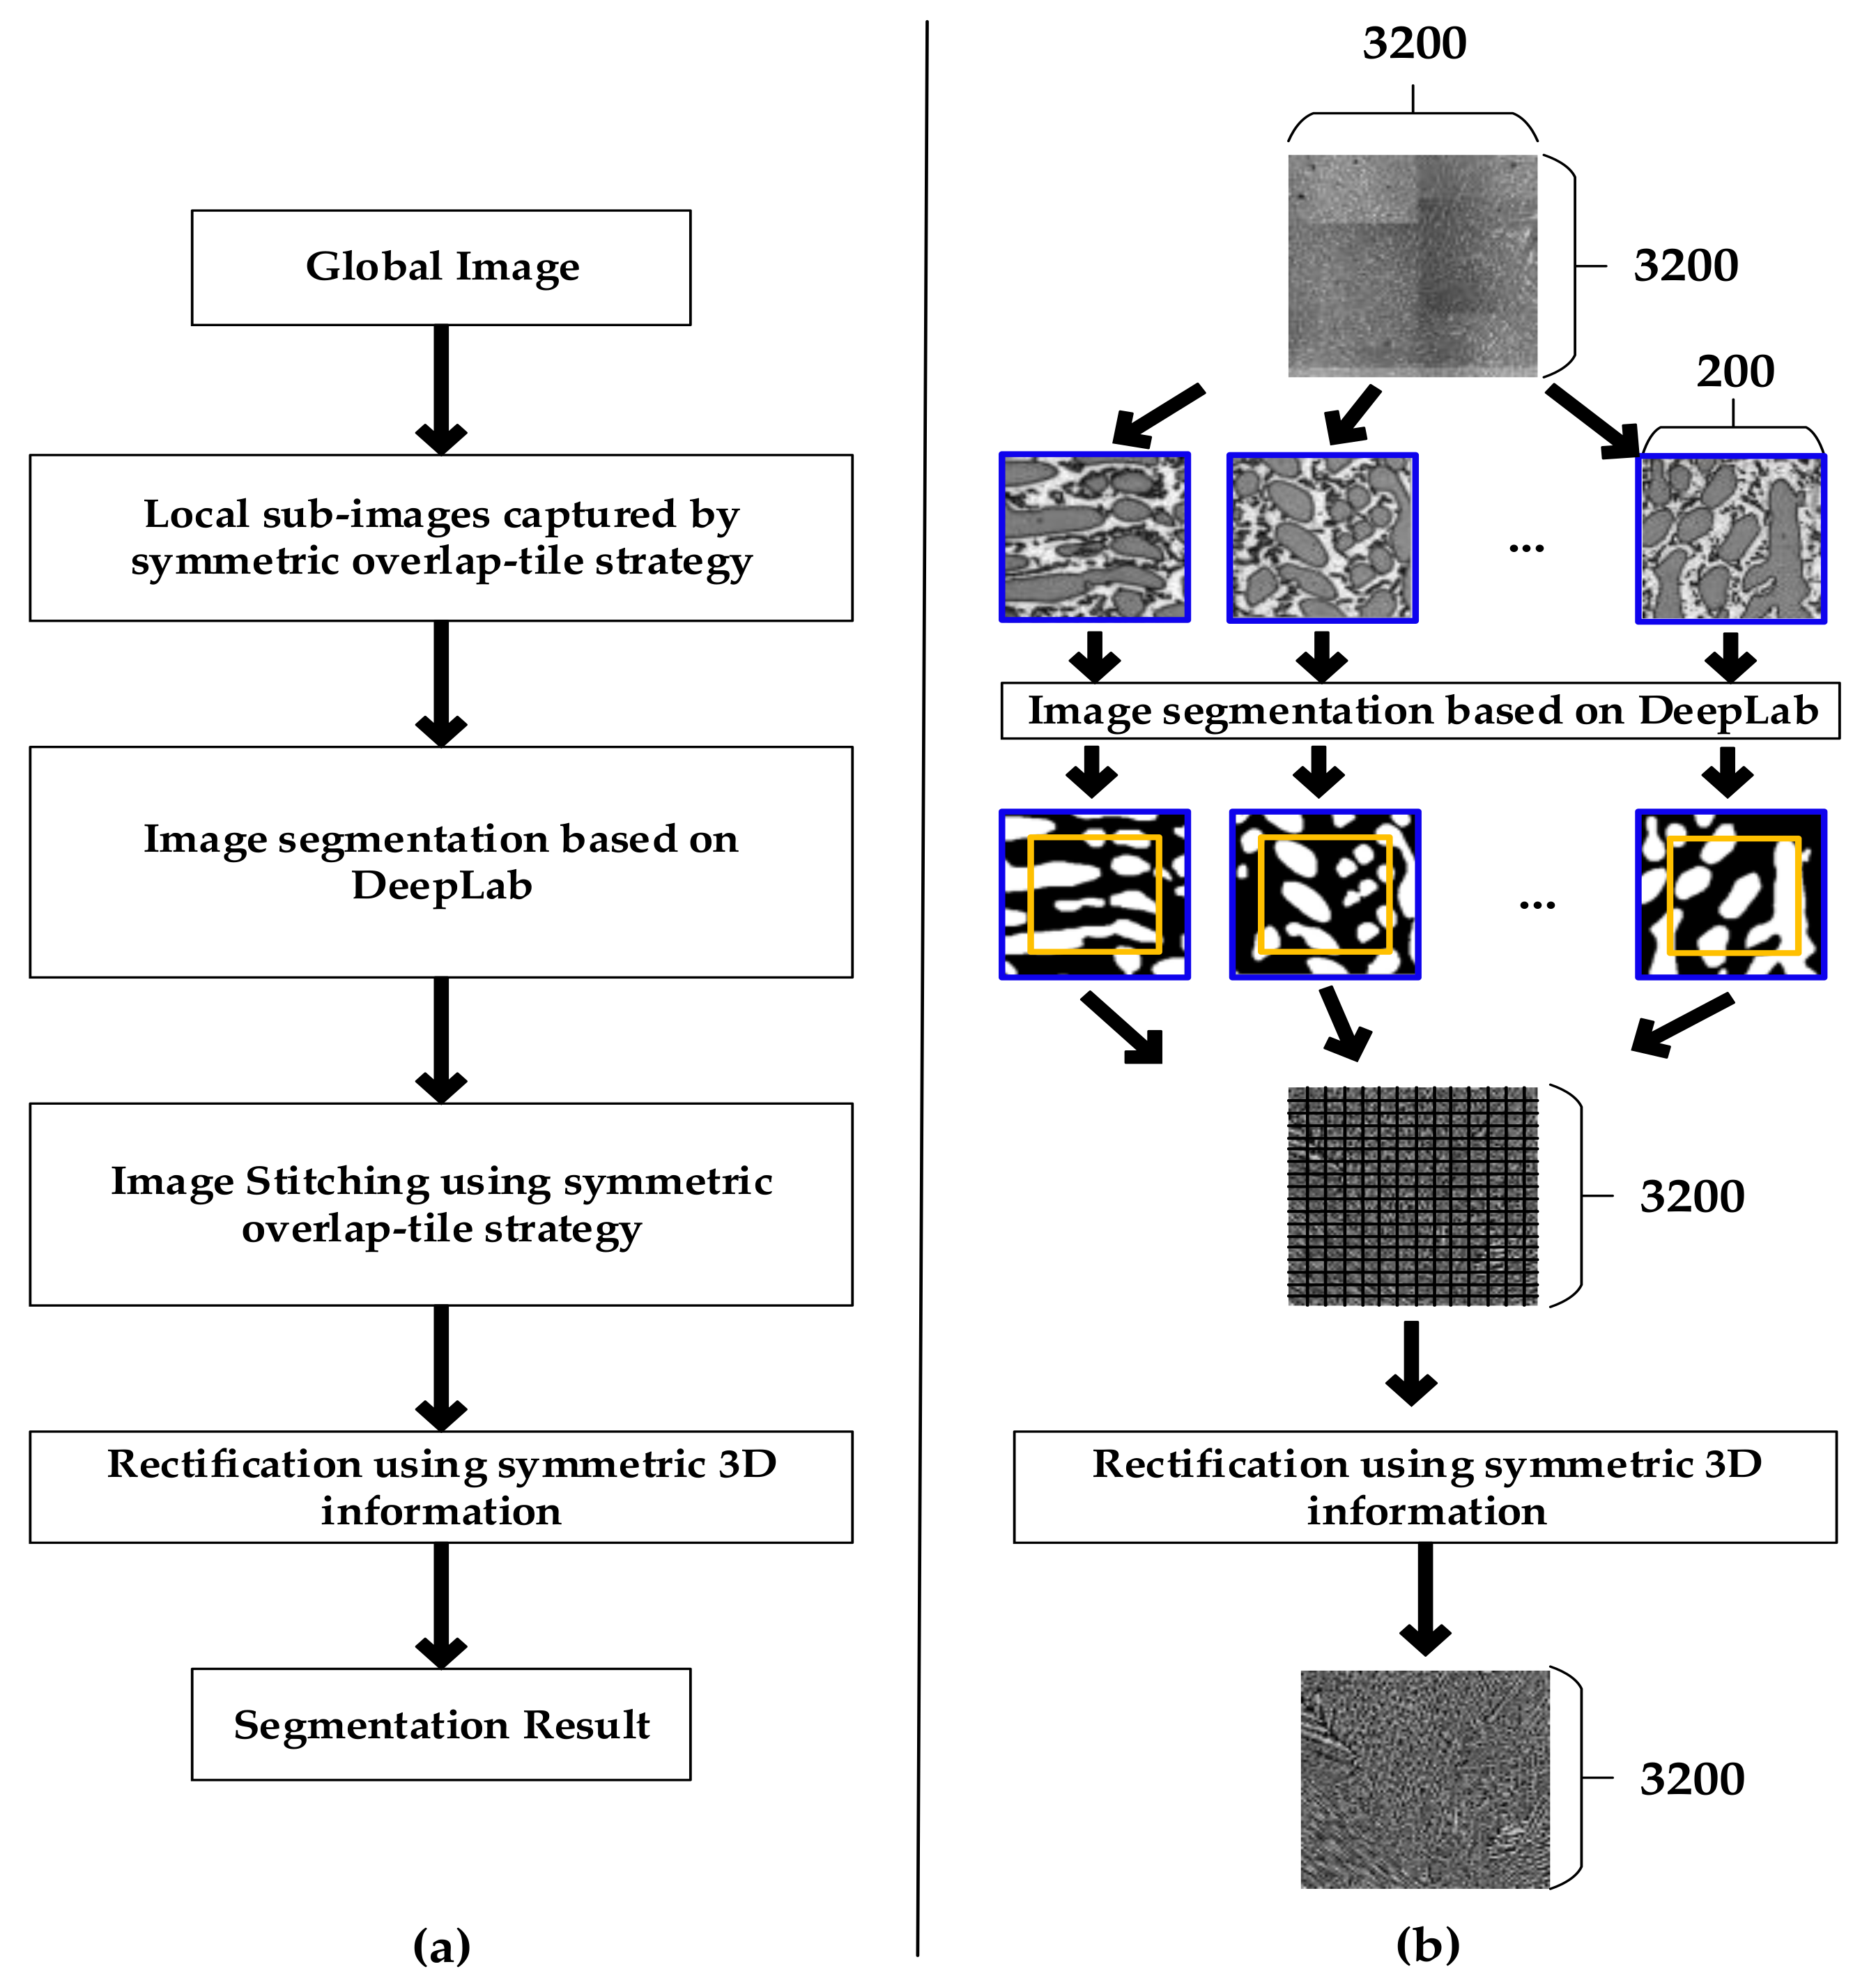
Figure 2 shows an overall flowchart of the proposed image segmentation method. Firstly, considering the limit of GPU resources, we clipped the high resolution global image into sub-images based on the symmetric overlap-tile strategy. Secondly, we applied DeepLab to segment local sub-images. Thirdly, we stitched the segmentation results by using the symmetric overlap-tile strategy. Finally, we used symmetric rectification to further enhance the performance of our results.
2.2. Image Segmentation Based on DeepLab
DeepLab [24] is currently a state of the art network associated with the highest performance in the task of image segmentation. It is built upon the ResNet-101 [18] and modifies its architecture in two key aspects.
- Atrous Convolution
It removes the downsampling operator from the last maximum pooling layers of DCNNs and instead upsamples the filters in subsequent convolutional layers. Use of this technology allows the network to recover full resolution feature maps; it also allows DeepLab to effectively enlarge the field of view of filters without increasing the number of parameters or the amount of computation.
- Atrous Spatial Pyramid Pooling (ASPP)
It has developed a computationally efficient scheme of resampling a given feature layer at multiple rates prior to convolution. This amounts to probing the original image with multiple filters that have complementary effective fields of view, thus capturing the objects as well as useful image context at multiple scales.
Detailed explanations of the configuration of DeepLab are shown in Table 1.
The DeepLab model consists of 100 convolutional layers, 1 max pooling layers and ASPP architecture in six convolutional groups. The group name, kernels, number of blocks, feature map size and stride are explained in Table 1.
“Conv” represents the traditional convolutional layer used in the deep convolutional network. The max-pooling layer and convolutional layer with 2 × 2 stride can provide a kind of subsampling. Considering that the feature map resolution of 200 × 200 is reduced to that of 25 × 25 by going through the first three groups, Atrous Conv is an improved convolutional filter that would not decrease the dimension of feature map, as mentioned above.
Bottleneck building with shortcut connection are key components in Conv_2~Conv_6. It has been established that these buildings can gain accuracy from considerably increased depths [18].
All hidden layers are equipped with the rectification (ReLU [16]) non-linearity, described in Equation (1). In equation, x and f is the input and output of neuron respectively.
In Conv_6, the method used ASPP architecture that can improve the DCNN’s ability to successfully handle both large and small objects.
The loss function is the sum of cross-entropy terms for each spatial position in the DCNN output map (subsampled by eight compared to the original image). All positions and labels are equally weighted in the overall loss function. Our targets are the ground truth labels (subsampled by eight).
2.3. Symmetic Overlap-Tile Strategy for Seamless Segmentation
Unfortunately, as a result of the limitation of GPU resources, microscopic images with high resolutions could not be applied to the deep convolution neural network either in the training or testing process.
A common way to face this problem is known as “divide and conquer” which recursively breaks down a problem into two or more sub-problems of the same type until these become simple enough to be solved directly. The solutions to the sub-problems are then combined to give a solution to the original problem. Using this approach, we split one image with high resolution into N small size sub-images as inputs to train and test the deep convolution neural network.
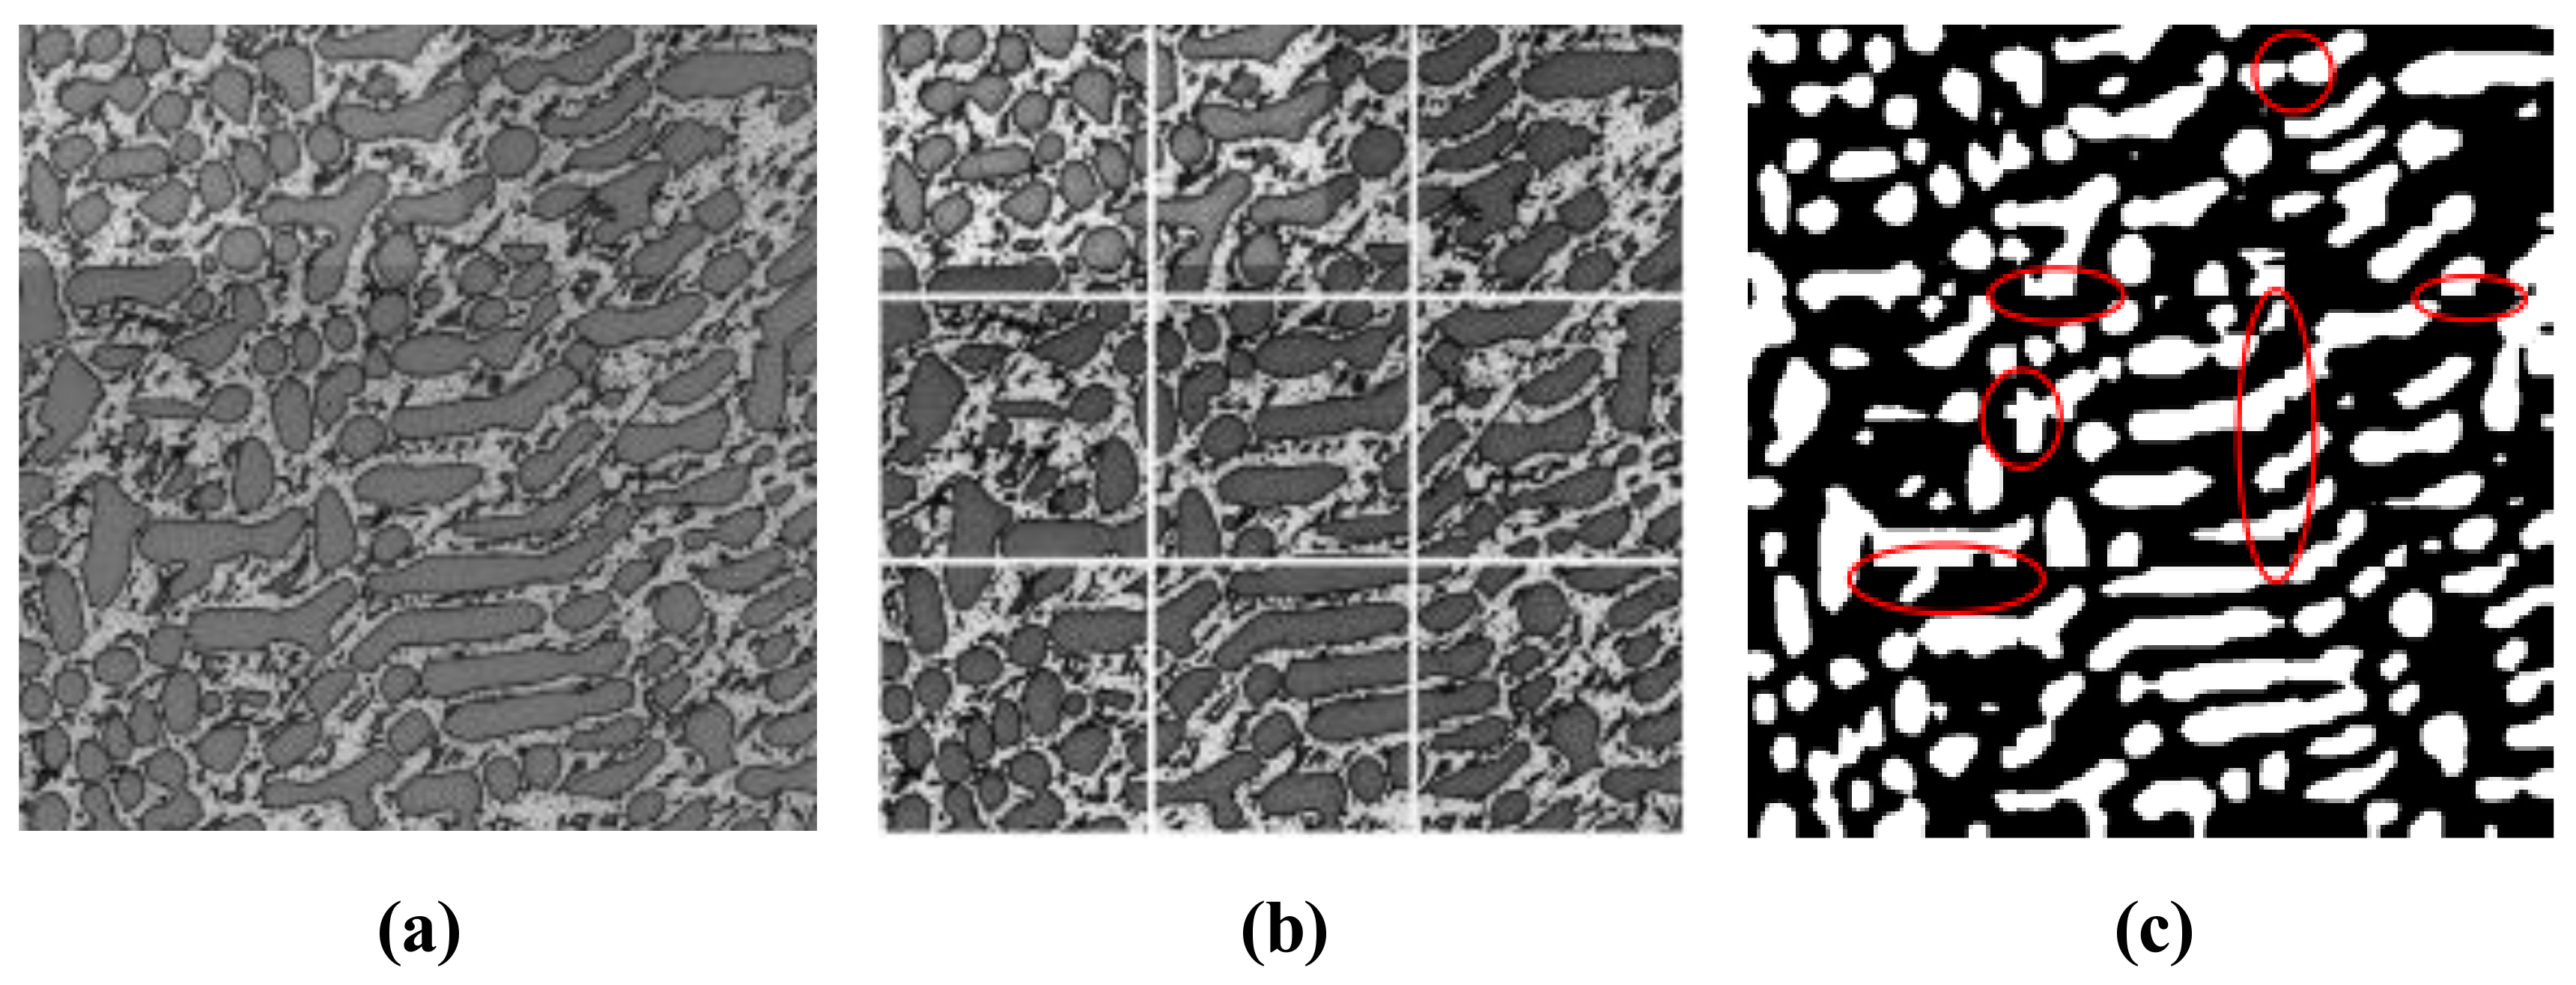
However, as shown in Figure 3 with red circles, by applying simple local processing, we found that there were some under-segmentation errors at the edge of sub-images. The structures were too small in the sub-images; as a result, they were considered noise during the process of segmentation.
In this paper, we introduce the symmetric overlap-tile strategy into the local processing method to solve the problem of under-segmentation at the edges of sub-images. The symmetric overlap-tile strategy was proposed by O. Ronneberger et al. [20], as shown in Figure 4. It referred this technology to a part of network so that the sizes of input and output were not the same for both the training and testing dataset. However, DeepLab is an end-to-end system in which the size of the input is equivalent to that of the output. Therefore, in this paper, we refer to this technology as a pre-processing method that only applied to the testing dataset.
As shown in Figure 4, we used the image area within the blue lines as the input of the deep conventional network. After inference, we obtained a segmentation mask the same size as that of the input; however, we only achieved a segmentation result within the yellow lines. By repeating this process, we explicitly ignored the segmentation in the region between the yellow and blue lines in which may exist under-segmentation errors.
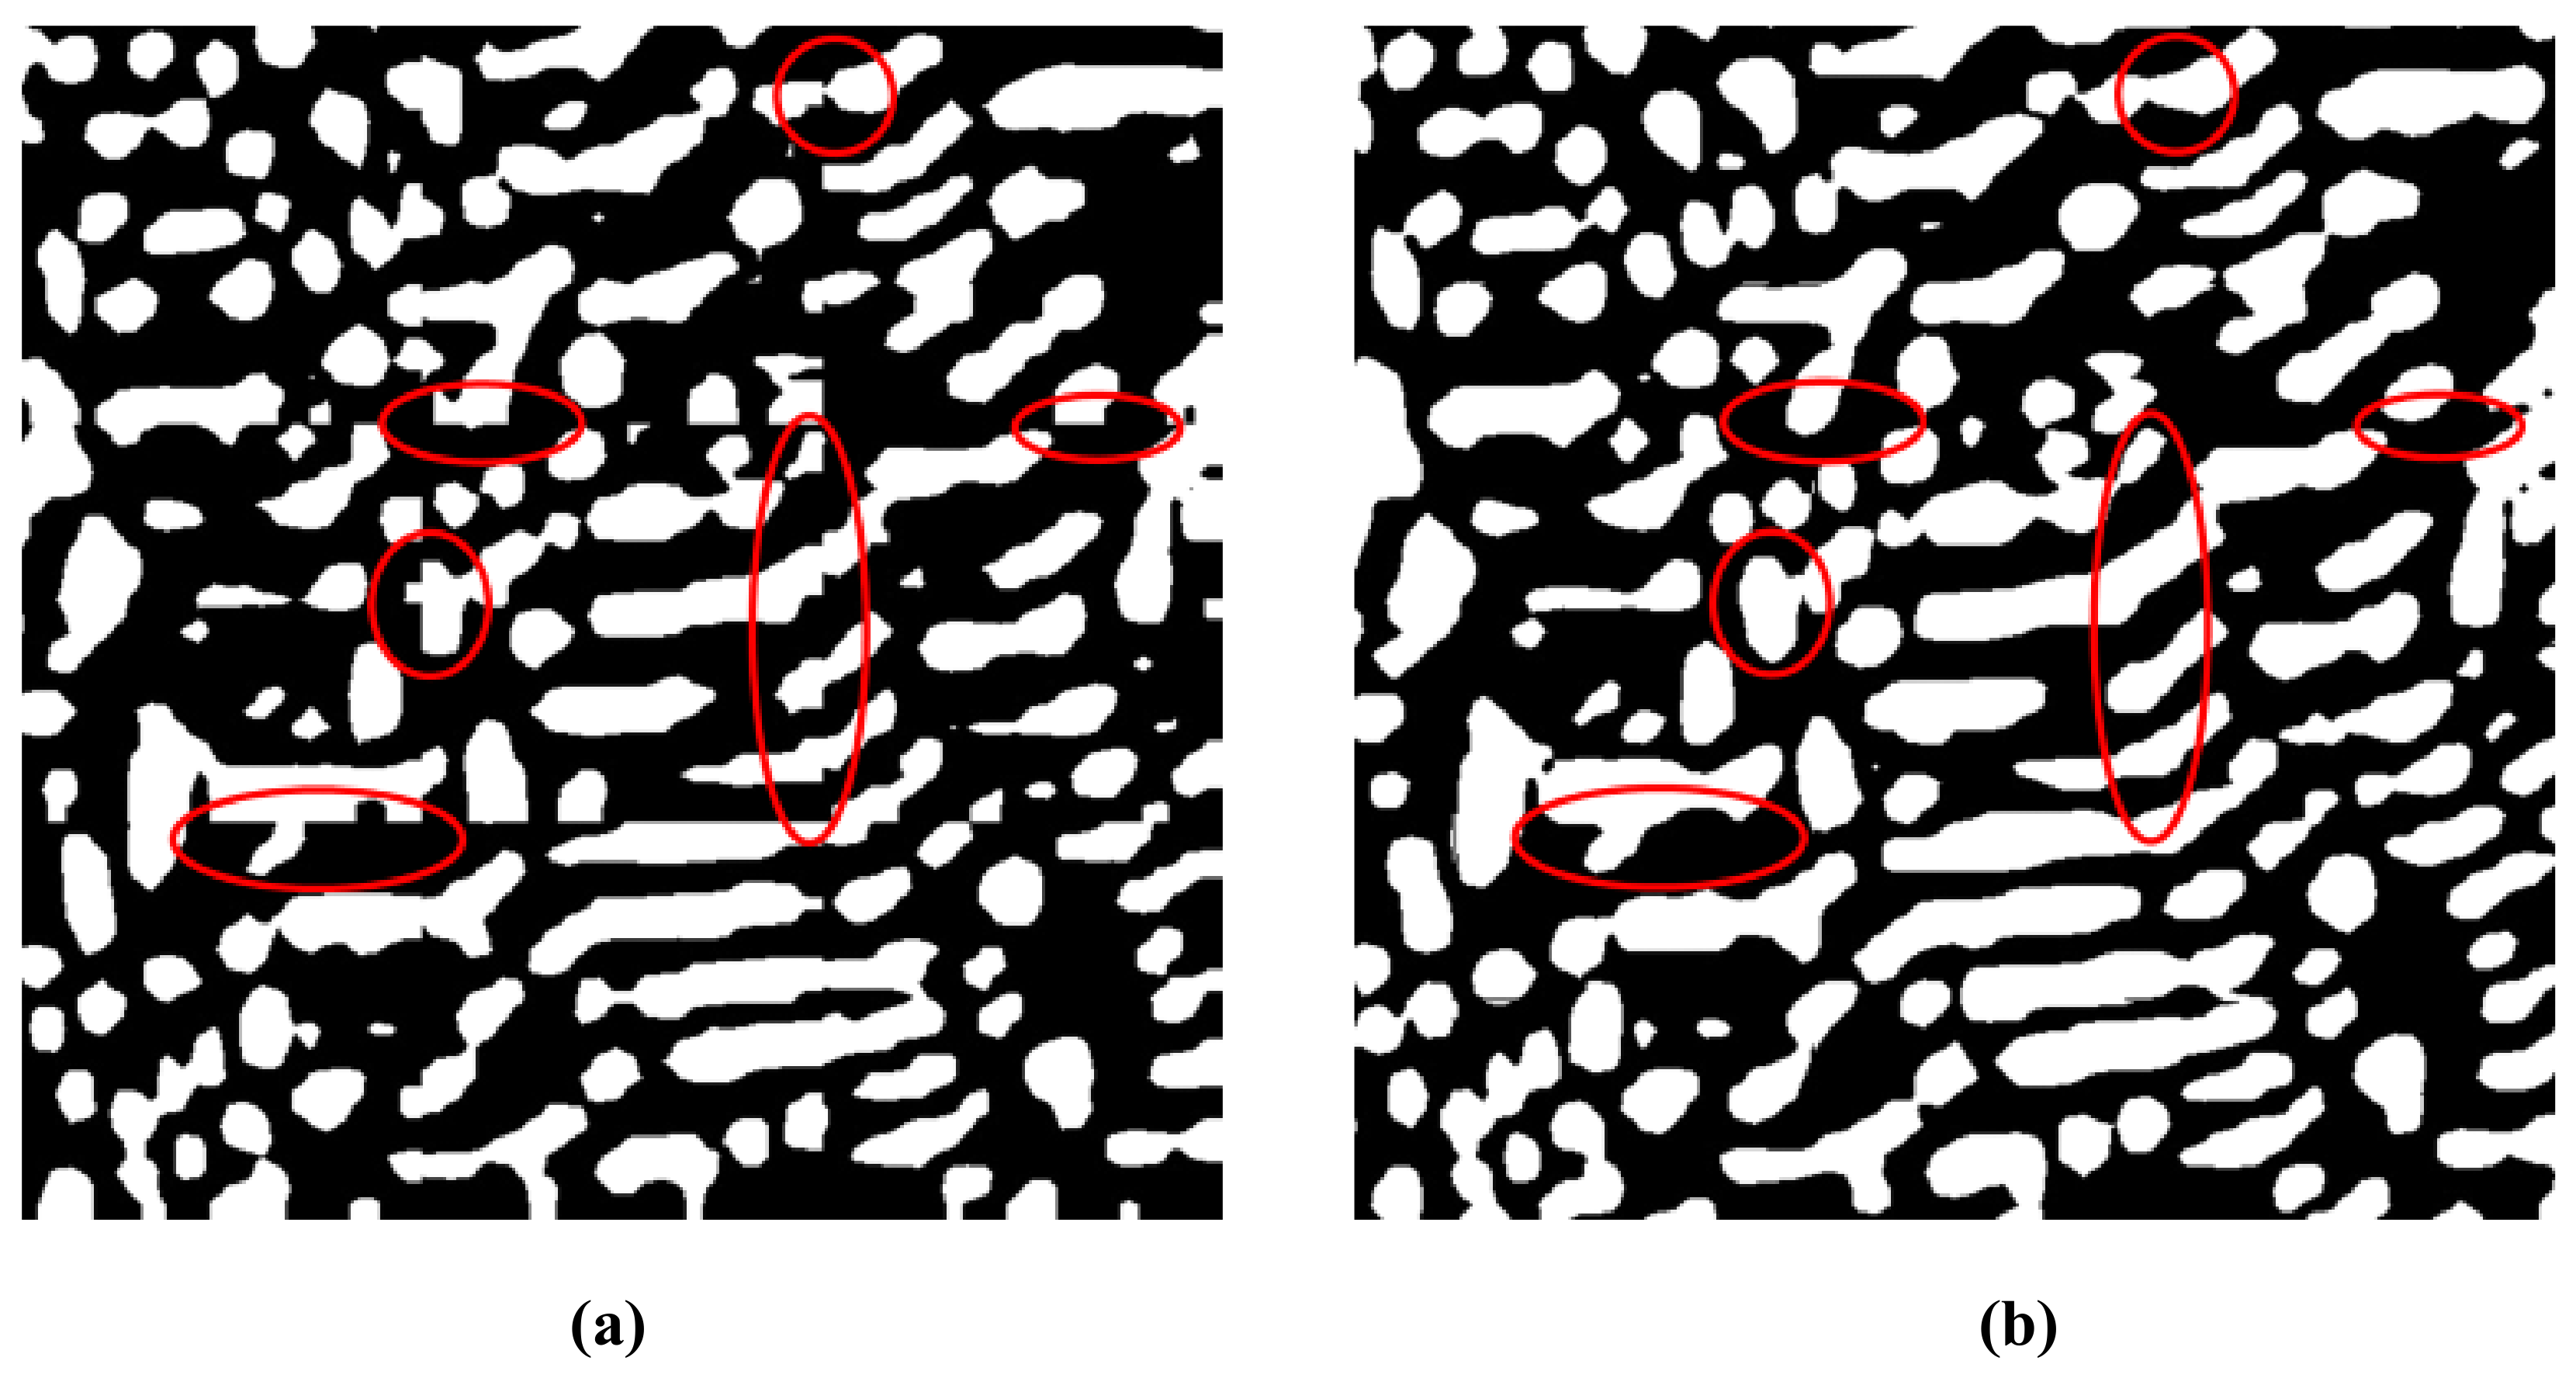
A comparison of simple local processing and local processing based on symmetric overlap-tile strategy is shown in Figure 5. Clearly, local processing based on the overlap-tile strategy can remove the under-segmentation error phenomenon effectively. Simultaneously, efficient local processing using the symmetric overlap-tile strategy makes it possible to analyze high resolution microscopic images.
2.4. Symmetric Rectification Considering 3D Information
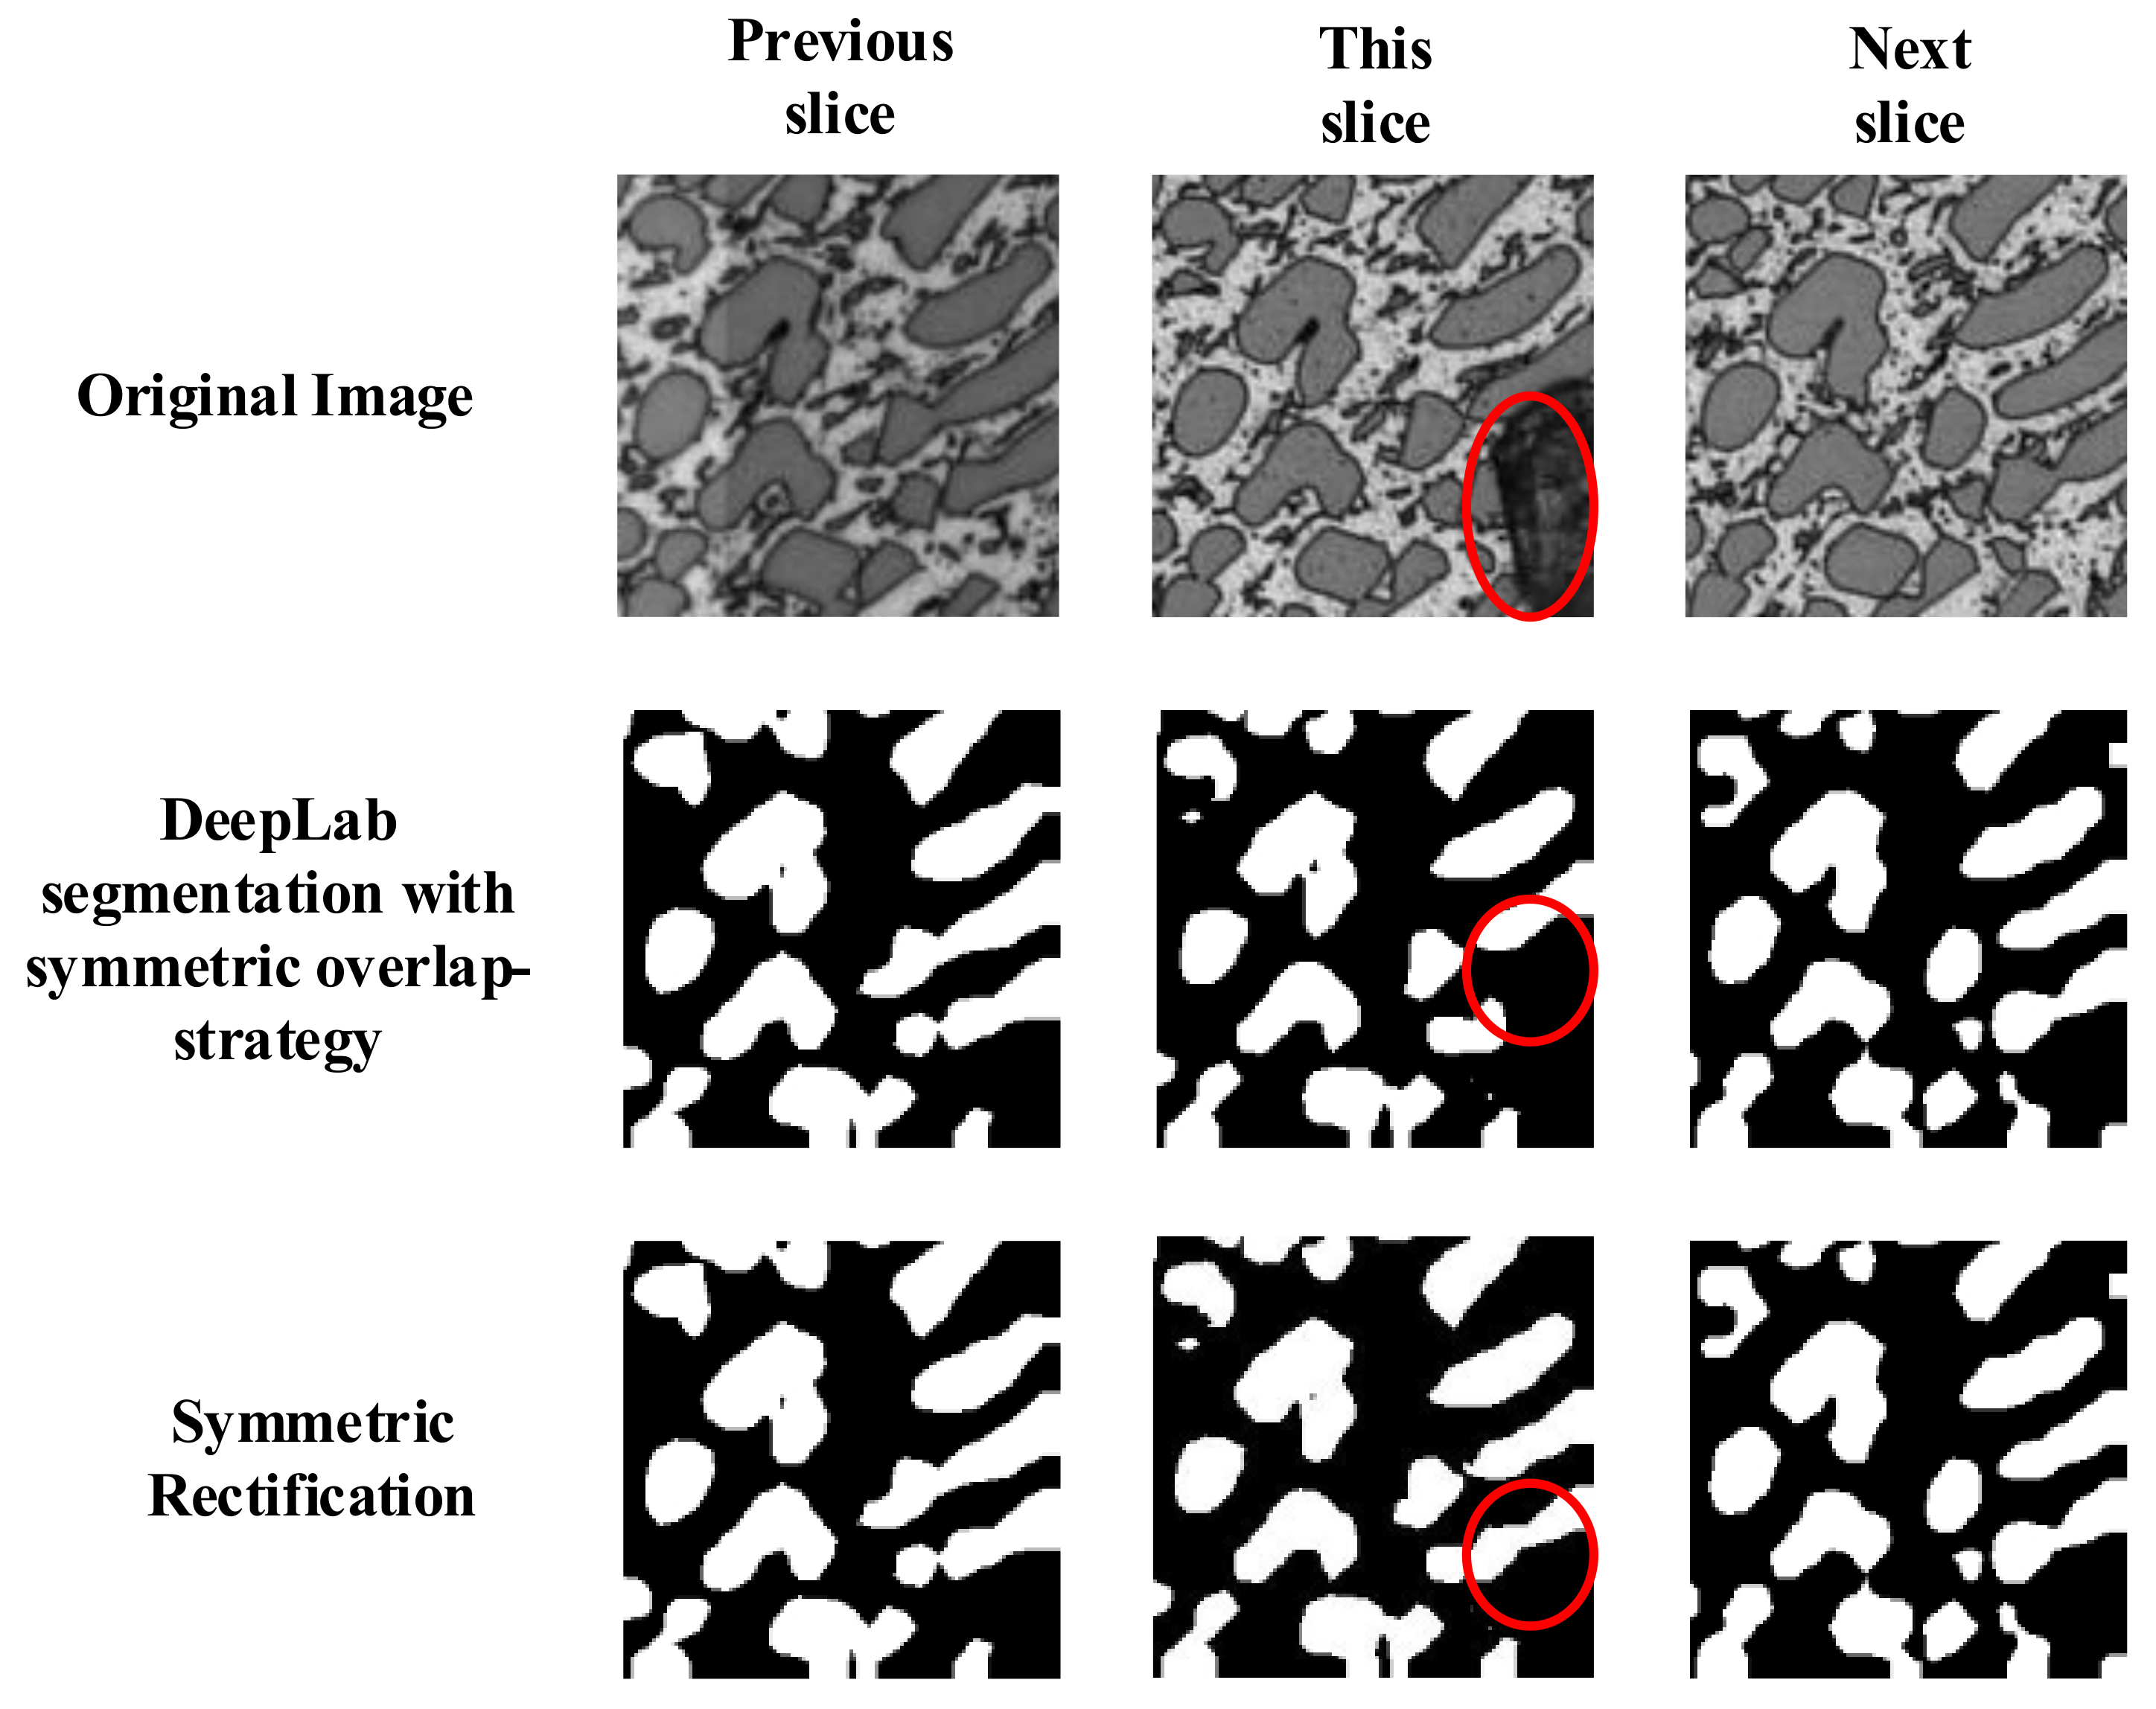
Some contaminations were formed during the process of sample preparation which could not be segmented correctly by the deep convolution neural network, as shown in Figure 6 with red circles.
Serial section is a common way to produce a stack of microscopic images. Section thickness of microscopic images is often thin enough to produce two highly similar neighboring slices. According to this as well as Figure 6, this could be rectified by the output mask of the previous mask and the last mask. Therefore, we propose a symmetric rectification method to recover the under-segmentation errors caused by contaminations, as described in Equation (2).
where 0 represents the background and 1 represents the object. represents the pixels in the target slice which need to be rectified. and represents the pixels at the same location in the previous slice and the next slice. According to Equation (2), we used the segmentation result of the previous and the next slices to rectify the segmentation of the target slice. As shown in Figure 6, the contaminations could be recovered by this process. This rectification could enhance result performance and eliminate under-segmentation errors caused by contaminations.
3. Implementation and Results
3.1. Experimental Data and Environment
In this study, we used a stack of microscopic images of Al–La alloy as a dataset. Since the field of view captured by a microscope is relatively smaller than the size of the large specimen, we stitched together six small images to form a large microscopic image (one slice) with high resolution (3200 × 3200 pixels). As shown in Figure 1, the dataset included nine slices with two classes; all slices were produced by this method. Among all the slices, six slices were used for training and the other three slices were used for testing purposes. Considering the limited resources of the device, we cut one slice into 256 small images (200 × 200 pixels) which was big enough to contain the detail of one dendrite structure. Traditional data augmentation only considers clip and translation process and rarely handles the rotation process [16,17,18] as it is usually concentrated on the objects in the nature scene. However, rotation of samples is most commonly observed by microscope. Therefore, given data augmentation and the homogeneous property of the material, we applied rotation and flip processes to the original image. After cutting and augmentation of the slices, 12,288 images (200 × 200 pixels) were used for training.
3.2. Netowork Training
We initialized the weights as in X. Glorot et al. [34] and trained all nets from scratch and adopted batch normalization (BN) [35] after each convolution and before activation. All hidden layers were equipped with the rectification (ReLU [16]) non-linearity. The learning rate started from 0.025 and was divided by 10 when the error plateaued; the models were trained for up to 60 × 104 iterations. We used a weight decay of 0.0001 and a momentum of 0.9. The training was regularized by weight decay (the L2 penalty multiplier set to 0.0005) and dropout regularization (dropout ratio set to 0.5). Drop out [16] forced the network to learn more robust features which are useful in conjunction with many different random subsets of the other neurons. This technique could prevent the system from becoming over-fitted.
We applied a histogram equalization to the images in order to eliminate the influence of illumination. Our loss function was the sum of cross-entropy terms for each spatial position in the CNN output map (subsampled by eight compared to the original image). All positions and labels were equally weighted in the overall loss function. Our targets were the ground truth labels (subsampled by eight). We optimized the objective function with respect to the weights at all network layers by the standard SGD [16] with a mini-batch size of 10. Additionally, we did not use CRF [24] in post-processing.
The deep convolutional network’s training and testing were performed on a system using Intel® Core™ i7-6900K CPU @ 3.50 GHz (8 cores) with 32 GB of RAM and NVIDIA GeForce GTX 1080Ti (3584 Cuda cores) with a graphics memory of 11 GB [36].
3.3. Testing of the Proposed DeepLab-Based Segementation
For performance evaluation, we obtained manual ground truth segmentation of all slices for the dataset provided by materials scientists. The ground truth segmentation was obtained by morphology segmentation using ImageJ software [37], commonly used in microscopic image processing. However, it required two weeks for careful manual refinement. To objectively and precisely evaluate the accuracy of all segmentation methods, we took the pixel accuracy as the evaluation criterion. It is defined as:
where is the number of pixels of class i predicted to belong to class j, and is the total number of pixels of class i.
3.3.1. Image Segmentation by the Proposed Method
We modified the framework of DeepLab by considering symmetric 3D information and reported the evaluation results in Table 2. In this table, we show the comparisons of the DeepLab based on simple local processing, DeepLab based on symmetric overlap-tile strategy, and DeepLab based on symmetric overlap-tile strategy and 3D symmetric rectification. Experiments showed that these methods could enhance accuracy compared to the traditional DeepLab. The performance of image segmentation is essential for 3D reconstruction and 3D information characterization. Therefore, any improvement of segmentation for material science is important.
As shown in Section 2.3 and Section 2.4, the symmetric overlap-tile strategy could achieve seamless segmentation which is essential for intuitive evaluation, as shown in Figure 5. The 3D symmetric rectification method could eliminate the under-segmentation caused by contaminations formed in sample preparation.
Additionally, the symmetric overlap-tile strategy and rectification only had linear time complexity, so that the process has only a small delay compared to simple local processing.
We tested the pixel accuracy in the training set which was 91.80%. The experiment showed that our system did not over-fit due to drop out and L2 penalty.
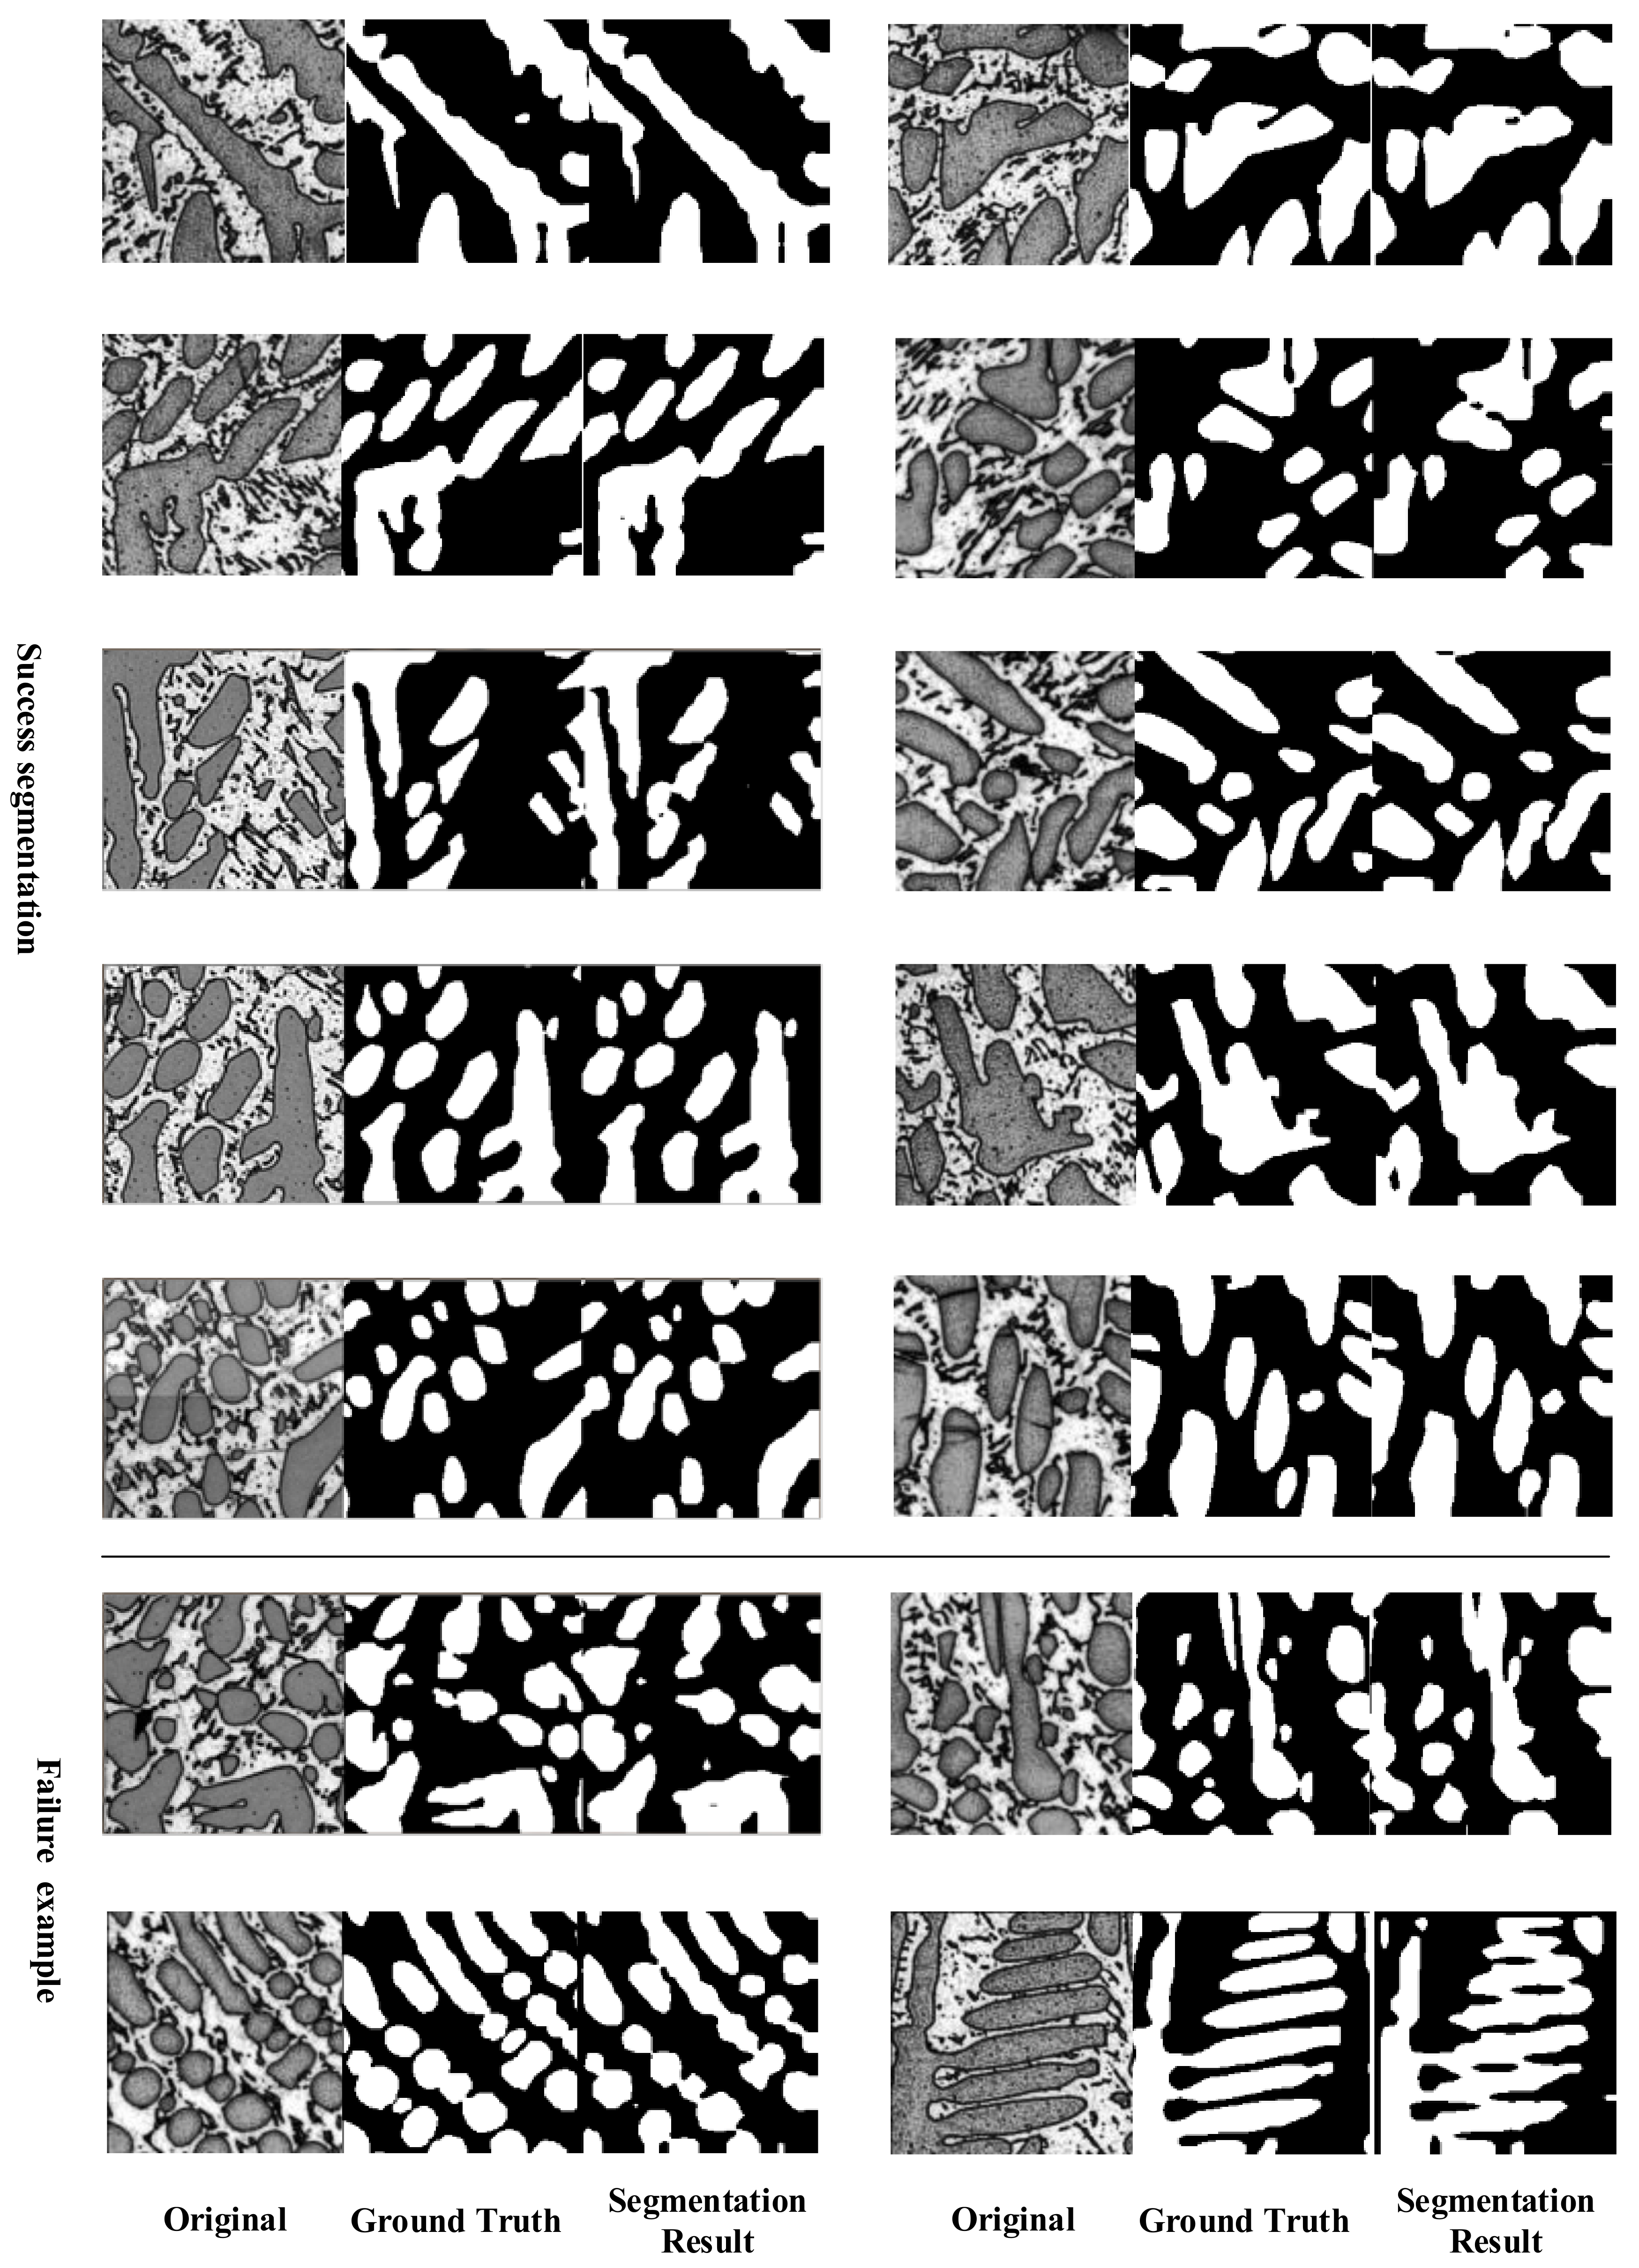
Combined with the symmetric overlap-tile strategy and 3D symmetric rectification, we visualize the results of segmentation in Appendix A, Figure A1. Additionally, this contains some failure examples in which the structures were very close and could not be correctly segmented by the method.
3.3.2. Comparison of the Proposed Method with Previous Methods
In Table 3, we show the comparisons of the proposed method with previous segmentation methods such as Otsu [8], Adaptive Threshold (with mean kernel and Gaussian kernel) [9], Watershed [10,11], Graph-Cut [12,13], and K-Means [14]. All experiments were conducted by the system with the configuration setup described in Section 3.2.
For fair comparison, we used three testing slices as benchmarks and calculate pixel accuracy in the original size (3200 × 3200 pixels), mentioned in Section 3.1. In addition, the ground truth segmentation was obtained by morphology segmentation using ImageJ software [37] which is commonly used in microscopic image processing. However, considerable time was required for careful manual refinement. All experiments were performed on the system with the same configuration as in Section 3.2. As shown in Table 3, Graph-Cut had the highest performance among all traditional methods; however, its time consumption was 360 s per slice as a result of the interactive nature of this algorithm (90 s for manual object/background careful selection and 270 s for computer calculation) which is not suitable for practical application. These traditional methods only consider the information in one slice; our algorithm shows more precise results because it combines 3D information between slices as domain knowledge. In conclusion, our method outperforms the previous methods in pixel accuracy (3).
Attributed to the fast computational power of GPU, the inference time of DCNN is almost the same as traditional methods which may favor real-time processing.
4. Conclusions
In this paper, we proposed a novel deep learning-based image segmentation for Al–La alloy microscopic images using symmetric 3D information. In short, our method yields three contributions: (1) We trained an image segmentation network based on DeepLab architecture and yield precise results. (2) We applied a symmetric overlap-tile strategy for local processing which made it possible to segment high resolution images. (3) We employed symmetric rectification after the segmentation of the deep convolutional network which could enhance the accuracy of result by using 3D information. Experiments showed that the proposed method achieved the highest accuracy compared to the current state of the art method.
One limitation of our method is that it does not segment well when two dendrite structures are close together. Our team will work on this problem in subsequent work. Additionally, we will consider merging 3D information in the architecture of networks.
Acknowledgments
The authors acknowledge the financial support from the National Key Research and Development Program of China (No. 2016YFB0700500), and the National Science Foundation of China (No. 61572075, No. 61702036), and Fundamental Research Funds for the Central Universities (No. FRF-TP-17-012A1), and China Postdoctoral Science Foundation (No. 2017M620619).
Author Contributions
Boyuan Ma conceived the algorithm framework and wrote the paper; Yulian Chen and Yonghong Zhi performed the program experiments; Wanbo Liu contributed the data; all work was done under the guidance of Xiaojuan Ban and Haiyou Huang.
Conflicts of Interest
The authors declare no conflict of interest.
Appendix A
Figure A1.
Segmentation result with success and failure example.

References
- Dursun, T.; Soutis, C. Recent developments in advanced aircraft aluminium alloys. Mater. Des. 2014, 56, 862–871. [Google Scholar] [CrossRef]
- Hu, J.; Shi, Y.N.; Sauvage, X. Grain boundary stability governs hardening and softening in extremely fine nanograined metals. Science 2017, 355, 1292–1296. [Google Scholar] [CrossRef] [PubMed]
- Sonka, M.; Hlavac, V.; Boyle, R. Image Processing, Analysis, and Machine Vision, 4th ed.; Cengage Learning: Stamford, CT, USA, 2014; ISBN 1133593607. [Google Scholar]
- Lewis, A.C.; Howe, D. Future Directions in 3D Materials Science: Outlook from the First International Conference on 3D Materials Science. JOM 2014, 66, 670–673. [Google Scholar] [CrossRef]
- Almsick, M.V. Microscope Image Processing; Elsevier: New York, NY, USA, 2017; pp. 635–653. [Google Scholar]
- Hong, Z.Y.; Dong, W.Z. Formation mechanism of the discontinuous dendrite structure in Al-La alloys. J. Univ. Sci. Technol. Beijing 2009, 31, 1132–1137. [Google Scholar]
- D’Amore, A.; Stella, J.A.; Wagner, W.R. Characterization of the complete fiber network topology of planar fibrous tissues and scaffolds. Biomaterials 2010, 31, 5345–5354. [Google Scholar] [CrossRef] [PubMed]
- Vala, M.H.J.; Baxi, A. A review on Otsu image segmentation algorithm. Int. J. Adv. Res. Comput. Eng. Technol. 2013, 2, 387–389. [Google Scholar]
- Dewan, M.A.A.; Ahmad, M.O.; Swamy, M.N.S. Tracking biological cells in time-lapse microscopy: An adaptive technique combining motion and topological features. IEEE Trans. Biomed. Eng. 2011, 58, 1637–1647. [Google Scholar] [CrossRef] [PubMed]
- Meyer, F.; Beucher, S. Morphological segmentation. J. Vis. Commun. Image Represent. 1990, 1, 21–46. [Google Scholar] [CrossRef]
- Tarabalka, Y.; Chanussot, J.; Benediktsson, J.A. Segmentation and classification of hyperspectral images using watershed transformation. Pattern Recognit. 2010, 43, 2367–2379. [Google Scholar] [CrossRef]
- Birkbeck, N.; Cobzas, D.; Jagersand, M. An Interactive Graph Cut Method for Brain Tumor Segmentation. In Proceedings of the Applications of Computer Vision (WACV), Snowbird, UT, USA, 7–8 December 2009. [Google Scholar]
- Shi, J.; Jitendra, M. Normalized cuts and image segmentation. IEEE Trans. Pattern Anal. Mach. Intell. 2000, 22, 888–905. [Google Scholar]
- Jain, A.K. Data clustering: 50 years beyond K-means. Pattern Recognit. Lett. 2010, 31, 651–666. [Google Scholar] [CrossRef]
- Jonathan, L.; Shelhamer, E.; Darrell, T. Fully convolutional networks for semantic segmentation. IEEE Trans. Pattern Anal. Mach. Intell. 2017, 39, 640–651. [Google Scholar]
- Krizhevsky, A.; Sutskever, I.; Hinton, G.E. ImageNet Classification with Deep Convolutional Neural Networks. In Proceedings of the Advances in Neural Information Processing Systems, Lake Tahoe, NV, USA, 3–8 December 2012. [Google Scholar]
- Simonyan, K.; Zisserman, A. Very Deep Convolutional Networks for Large-Scale Image Recognition. In Proceedings of the ICLR 2015, San Diego, CA, USA, 7–9 May 2015. [Google Scholar]
- He, K.; Zhang, X.; Ren, S. Deep Residual Learning for Image Recognition. In Proceedings of the IEEE Conference on Computer Vision and Pattern Recognition, Las Vegas, NV, USA, 27–30 June 2016. [Google Scholar]
- Noh, H.; Hong, S.; Han, B. Learning Deconvolution Network for Semantic Segmentation. In Proceedings of the IEEE International Conference on Computer Vision, Santiago, Chile, 13–16 December 2015. [Google Scholar]
- Ronneberger, O.; Fischer, P.; Brox, T. U-net: Convolutional Networks for Biomedical Image Segmentation. In Proceedings of the International Conference on Medical Image Computing and Computer-Assisted Intervention, Munich, Germany, 5–9 October 2015. [Google Scholar]
- Zhao, H.; Shi, J.; Qi, X. Pyramid scene parsing network. arXiv, 2016; arXiv:1612.01105. [Google Scholar]
- Liu, W.; Rabinovich, A.; Berg, A.C. Parsenet: Looking wider to see better. arXiv, 2015; arXiv:1506.04579. [Google Scholar]
- Yu, F.; Koltun, V. Multi-scale context aggregation by dilated convolutions. arXiv, 2015; arXiv:1511.07122. [Google Scholar]
- Chen, L.C.; Papandreou, G.; Kokkinos, I.; Murphy, K.; Yuille, A.L. DeepLab: Semantic Image Segmentation with Deep Convolutional Nets, Atrous Convolution, and Fully Connected CRFs. IEEE Trans. Pattern Anal. Mach. Intell. 2018, 40, 834–848. [Google Scholar] [CrossRef] [PubMed]
- Everingham, M.; Eslami, S.M.A.; Van Gool, L. The pascal visual object classes challenge: A retrospective. Int. J. Comput. Vis. 2015, 111, 98–136. [Google Scholar] [CrossRef]
- Chen, X.; Mottaghi, R.; Liu, X.; Fidler, S.; Urtasun, R.; Yuille, A. Detect What you Can: Detecting and Representing Objects Using Holistic Models and Body Parts. In Proceedings of the IEEE Conference on Computer Vision and Pattern Recognition, Columbus, OH, USA, 27–29 June 2016. [Google Scholar]
- Alatan, A.; Aydin. Image sequence analysis for emerging interactive multimedia services-the European COST 211 framework. IEEE Trans. Circuits Syst. Video Technol. 1998, 8, 802–813. [Google Scholar] [CrossRef] [Green Version]
- Doulamis, A.; Doulamis, N.; Ntalianis, K.; Kollias, S. Efficient unsupervised content-based segmentation in stereoscopic video sequences. Int. J. Artif. Intell. Tools 2000, 9, 277–303. [Google Scholar] [CrossRef]
- Feng, M.; Wang, Y.; Wang, H. Reconstruction of three-dimensional grain structure in polycrystalline iron via an interactive segmentation method. Int. J. Miner. Metall. Mater. 2017, 24, 257–263. [Google Scholar] [CrossRef]
- Waggoner, J.; Zhou, Y.; Simmons, J. 3D Materials image segmentation by 2D propagation: A graph-cut approach considering homomorphism. IEEE Trans. Image Process. 2013, 22, 5282–5293. [Google Scholar] [CrossRef] [PubMed]
- Python Language Reference. Available online: http://www.python.org (accessed on 8 January 2018).
- Tensorflow. Available online: http://www.tensorfly.cn/ (accessed on 8 January 2018).
- Laganière, R. OpenCV 3 Computer Vision Application Programming Cookbook, 3rd ed.; Packt Publishing Ltd: Birmingham, UK, 2017; ISBN 178649715. [Google Scholar]
- Glorot, X.; Bengio, Y. Understanding the Difficulty of Training Deep Feedforward Neural Networks. In Proceedings of the Thirteenth International Conference on Artificial Intelligence and Statistics, Sardinia, Italy, 13–15 May 2010. [Google Scholar]
- Ioffe, S.; Szegedy, C. Batch Normalization: Accelerating Deep Network Training by Reducing Internal Covariate Shift. In Proceedings of the International Conference on Machine Learning, Lille, France, 6–11 July 2015. [Google Scholar]
- Geforce GTX 1080Ti. Available online: https://www.nvidia.com/en-us/geforce/products/10series/geforce-gtx-1080-ti/ (accessed on 8 January 2018).
- Schindelin, J.; Arganda-Carreras, I.; Frise, E.; Kaynig, V.; Longair, M.; Pietzsch, T. Fiji: An open-source platform for biological-image analysis. Nat. Methods 2012, 9, 676. [Google Scholar] [CrossRef] [PubMed]
Figure 1.
Microscopic images of AL–La alloy. (a) Stack of serial sections (nine slices or images) for Al–La alloy with an interval of one micrometer. For clarity, we painted the edges of the slices red; (b) one of slice with resolution of 3200 × 3200; (c) Details of micrograph with resolution of 200 × 200; (d) Manual segmentation for (c).

Figure 2.
Flowchart of the proposed method. (a) Flowchart of technology; (b) Flowchart of image.

Figure 3.
Segmentation result of simple local propagation method. (a) Original image; (b) Split strategy of simple local processing represented by gridlines; (c) Segmentation result with under-segmentation problems represented by red circles.
Figure 3.
Segmentation result of simple local propagation method. (a) Original image; (b) Split strategy of simple local processing represented by gridlines; (c) Segmentation result with under-segmentation problems represented by red circles.

Figure 4.
Symmetric overlap-tile strategy for seamless segmentation of arbitrary large images. Result of segmentation within the yellow lines requires image data within the blue lines as input. Missing input data is extrapolated by mirroring. Solid lines refer to the first segmentation and dashed line refers to the second segmentation. By repeating this process, an entire segmentation mask will be obtained for each slice.
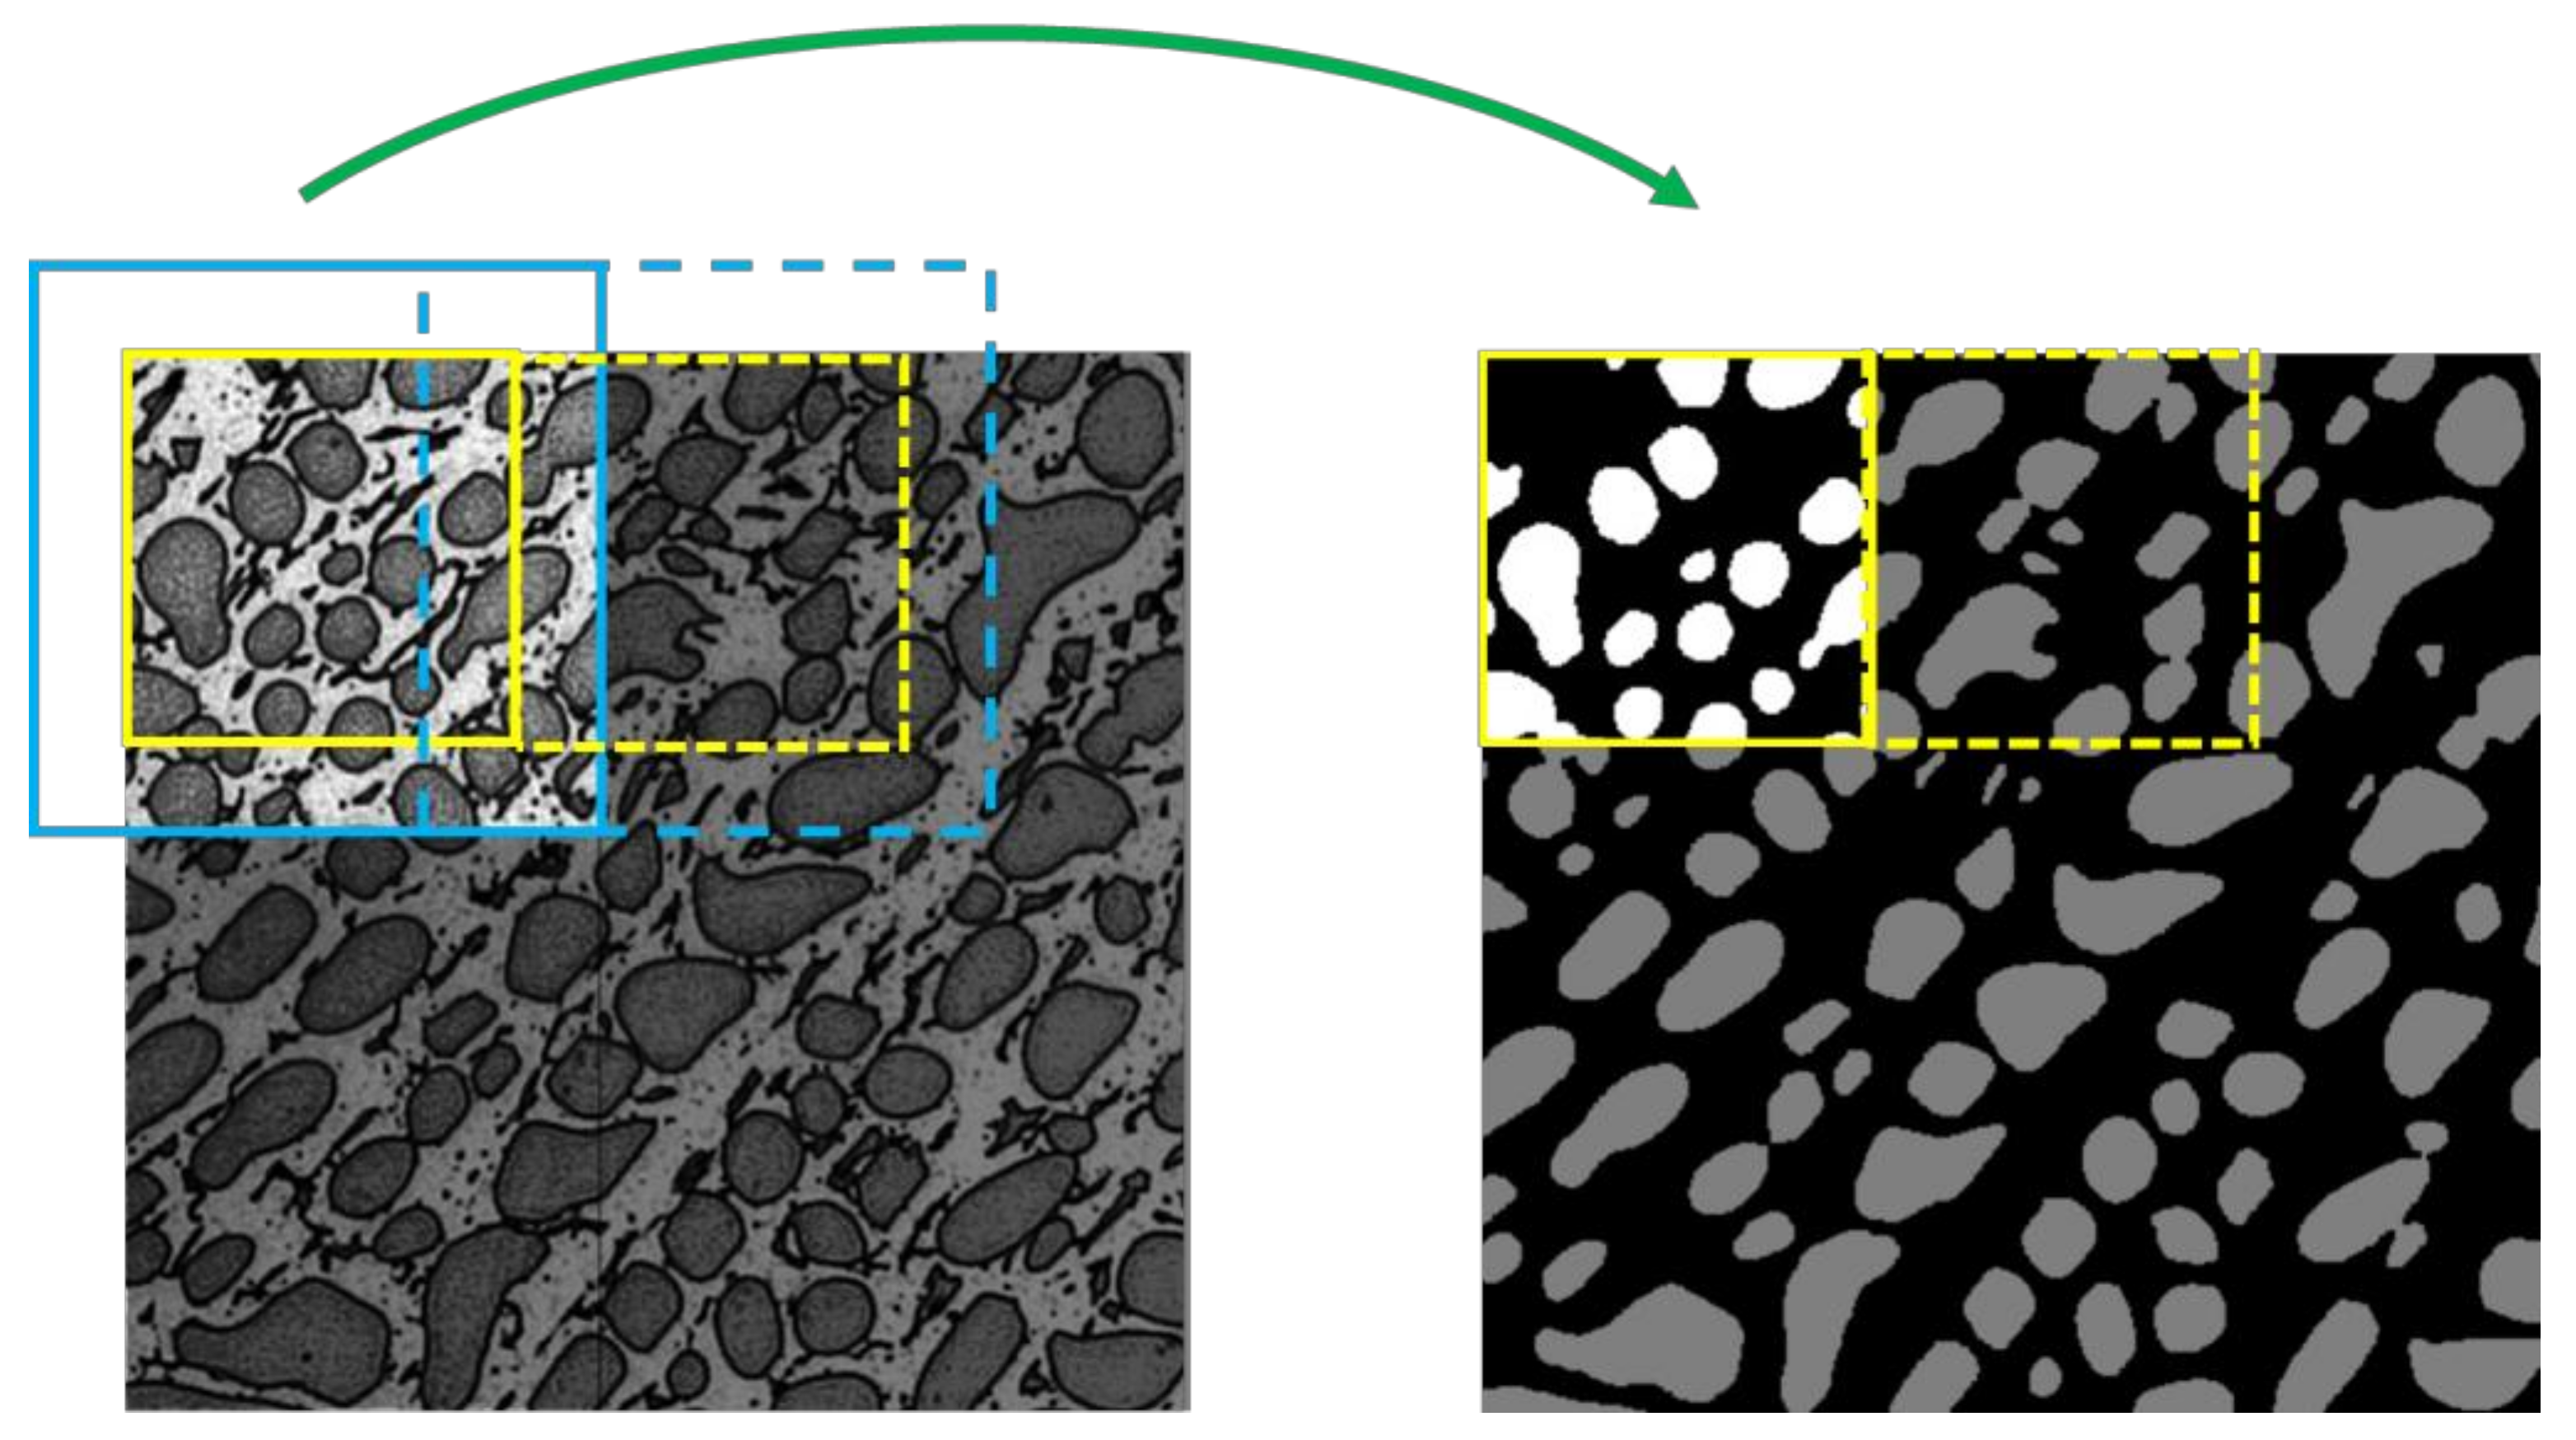
Figure 5.
The comparison of simple local processing and local processing based on symmetric overlap-tile strategy. (a) Segmentation result of simple local processing; (b) Segmentation result of local processing based on overlap-tile strategy.
Figure 5.
The comparison of simple local processing and local processing based on symmetric overlap-tile strategy. (a) Segmentation result of simple local processing; (b) Segmentation result of local processing based on overlap-tile strategy.

Figure 6.
Symmetric rectification could eliminate the effect of contamination.

Table 1.
Configuration of the DeepLab used in the proposed method.
| Group Name | Kernels | No. of Blocks | Feature Map Resolution(Height × Width) | No. of Stride | |
|---|---|---|---|---|---|
| Type | Dimension | ||||
| Image Input | 1 | 200 × 200 | None | ||
| Conv_1 | Conv | 7 × 7 × 64 | 1 | 100 × 100 | 2 × 2 |
| Conv_2 | Max Pool | 3 × 3 | 1 | 50 × 50 | 2 × 2 |
| Conv | 1 × 1 × 64 | 3 | 1 × 1 | ||
| Conv | 3 × 3 × 64 | 1 × 1 | |||
| Conv | 1 × 1 × 256 | 1 × 1 | |||
| Conv_3 | Conv | 1 × 1 × 128 | 4 | 25 × 25 | 1 × 1 (2 × 2 in first block) |
| Conv | 3 × 3 × 128 | 1 × 1 | |||
| Conv | 1 × 1 × 512 | 1 × 1 | |||
| Conv_4 | Atrous Conv, rate = 2 | 1 × 1 × 256 | 23 | 25 × 25 | 1 × 1 |
| Atrous Conv, rate = 2 | 3 × 3 × 256 | 25 × 25 | 1 × 1 | ||
| Atrous Conv, rate = 2 | 1 × 1 × 1024 | 25 × 25 | 1 × 1 | ||
| Conv_5 | Atrous Conv, rate = 4 | 1 × 1 × 512 | 3 | 25 × 25 | 1 × 1 |
| Atrous Conv, rate = 4 | 3 × 3 × 512 | 25 × 25 | 1 × 1 | ||
| Atrous Conv, rate = 4 | 1 × 1 × 2048 | 25 × 25 | 1 × 1 | ||
| Conv_6 (ASPP) | Atrous Conv, rate = 6 | 3 × 3 × 2 | 1 | 25 × 25 | 1 × 1 |
| Atrous Conv, rate = 12 | 3 × 3 × 2 | 1 | 25 × 25 | 1 × 1 | |
| Atrous Conv, rate = 18 | 3 × 3 × 2 | 1 | 25 × 25 | 1 × 1 | |
| Atrous Conv, rate = 24 | 3 × 3 × 2 | 1 | 25 × 25 | 1 × 1 | |
| Softmax | 1 | 25 × 25 | None | ||
| Output Layer | Billiner Interpolation by 8 | 1 | 200 × 200 | None | |
Table 2.
Image segmentation by the proposed method.
| Rank | Simple Local Processing | Symmetric Overlap-Tile Strategy | 3D Symmetric Rectification | Pixel Accuracy (%) | Inference Time per Slice (s) |
|---|---|---|---|---|---|
| 1 | √ | 91.96 ± 0.11% | 14.026 | ||
| 2 | √ | 92.45 ± 0.15% | 17.553 | ||
| 3 | √ | √ | 93.09 ± 0.06% | 17.553 |
Table 3.
Comparison of the proposed method with previous methods.
| Rank | Method | Pixel Accuracy (%) | Inference Time (s) |
|---|---|---|---|
| 1 | Ground Truth | 100.00% | 100,800 |
| 2 | Our method | 93.09 ± 0.06% | 17.553 |
| 3 | Graph-Cut | 87.14 ± 1.03% | 360 |
| 4 | Watershed | 87.13 ± 0.55% | 12.260 |
| 5 | K-Means | 65.68 ± 6.14% | 13.315 |
| 6 | Otsu | 65.43 ± 7.47% | 0.072 |
| 7 | Adaptive Mean | 56.69 ± 1.09% | 0.081 |
| 8 | Adaptive Gaussian | 56.37 ± 1.04% | 0.109 |
© 2018 by the authors. Licensee MDPI, Basel, Switzerland. This article is an open access article distributed under the terms and conditions of the Creative Commons Attribution (CC BY) license (http://creativecommons.org/licenses/by/4.0/).
Share and Cite
MDPI and ACS Style
Ma, B.; Ban, X.; Huang, H.; Chen, Y.; Liu, W.; Zhi, Y. Deep Learning-Based Image Segmentation for Al-La Alloy Microscopic Images. Symmetry 2018, 10, 107. https://doi.org/10.3390/sym10040107
AMA Style
Ma B, Ban X, Huang H, Chen Y, Liu W, Zhi Y. Deep Learning-Based Image Segmentation for Al-La Alloy Microscopic Images. Symmetry. 2018; 10(4):107. https://doi.org/10.3390/sym10040107
Chicago/Turabian StyleMa, Boyuan, Xiaojuan Ban, Haiyou Huang, Yulian Chen, Wanbo Liu, and Yonghong Zhi. 2018. "Deep Learning-Based Image Segmentation for Al-La Alloy Microscopic Images" Symmetry 10, no. 4: 107. https://doi.org/10.3390/sym10040107
Note that from the first issue of 2016, this journal uses article numbers instead of page numbers. See further details here.