Article

Predicting Sustainable Farm Performance—Using Hybrid Structural Equation Modelling with an Artificial Neural Network Approach

by
Naeem Hayat
1,
Abdullah Al Mamun
2,*,
Noorul Azwin Md Nasir
1,
Ganeshsree Selvachandran
2,
Noorshella Binti Che Nawi
2 and
Quek Shio Gai
2
1
Faculty of Entrepreneurship and Business, Universiti Malaysia Kelantan, Pengkalan Chepa, Kota Bharu 16100, Malaysia
2
Faculty of Business and Management, UCSI University, Cheras, Kuala Lumpur 56000, Malaysia
*
Author to whom correspondence should be addressed.
Land 2020, 9(9), 289; https://doi.org/10.3390/land9090289
Submission received: 23 July 2020 / Revised: 18 August 2020 / Accepted: 19 August 2020 / Published: 22 August 2020

Abstract

:
The adoption of innovative technology has always been a complex issue. The agriculture sectors of developing countries are following unsustainable farming policies. The currently adopted intensive farming practices need to replace with conservative agriculture practices (CAPs). However, the adoption of CAPs has remained low since its emergence and reports have suggested that the use of CAPs is scant for sustainable farm performance. This article aims to study three scenarios: Firstly, the influence of personal and CAPs level factors on the intention to adopt CAPs; secondly, the influence intention to adopt CAPs, facilitating conditions and voluntariness of use on the actual use of CAPs; and thirdly, the impact of the actual use of CAPs on sustainable farm performance. This study is based on survey data collected by structured interviews of rice farmers in rural Pakistan, which consists of 336 samples. The final analysis is performed using two methods: (1) a well-established and conventional way of Partial Least Squares Structural Equation Modeling (PLS-SEM) using Smart PLS 3.0, and (2) a frontier technology of computing using an artificial neural network (ANN), which is generated through a deep learning algorithm to achieve maximum possible accuracy. The results reveal that profit orientation and environment attitude as behavioural inclination significantly predicts the intention to adopt CAPs. The perception of effort expectancy can significantly predict the intention to adopt CAPs. Low intention to adopt CAPs caused by the low-level trust on extension, low-performance expectancy, and low social influence for the CAPs. The adoption of CAPs is affected by facilitating conditions, voluntary use of CAPs, and the intention to adopt CAPs. Lastly, the use of CAPs can positively and significantly forecast the perception of sustainable farm performance. Thus, it is concluded that right policies are required to enhance the farmers’ trust on extension and promote social and performance expectation for CAPs. Besides, policy recommendations can be made for sustainable agriculture development in developing and developed countries.

1. Introduction

The consistent rise of the global population and global warming have impacted agriculture production. The current agriculture practices are unsustainable because of land degradation and the decline in agricultural productivity, which are threats to the current and future social and economic well-being of the world population [1]. Massive adoption of intensive farming practices can cause land degradation and environmental hazards, besides reducing soil efficiency [2].
Soil fertility has reduced over time, and rising world temperatures have motivated farmers to find alternatives for existing intensive farming practices [3]. The world agriculture productivity can be enhanced using conservative agriculture practices (CAPs) that can reduce greenhouse gases emission, produce enough food, and improve the farmers’ income [4]. CAPs are a set of farming practices promoted by governments and non-governmental development agencies [5]. CAPs are knowledge-driven, and require particular skills and motivation to be used [6]. Working with CAPs requires acceptance from the farming community with a participatory mindset. The adoption of CAPs at the global level is low [7].
Collective action can achieve the sustainable development goals (SDGs) for zero hunger (SDG2), responsible food production and consumption (SDG12), climate action (SDG13), and life of land (SDG15) [4]. It is predicted that the world food system can accomplish the goals set by SDGs by the year 2050 by incorporating the change in farmers’ attitudes towards alternative paths of farming and considering the environment as an integral part of the agriculture system. The economic development of the globe has a considerable cost to the environment [8]. Farmers are agricultural entrepreneurs and rational business decision-makers [5]. The adoption of CAPs is a decision influenced by multiple personal and psychological factors [8]. Moreover, the adoption of CAPs is an integral part of the developmental policy for agriculture policy [9].

Agriculture in Pakistan

Pakistan’s economy demonstrates a dualistic economic structure in which an increasingly modern urban and industrial economy can co-exist with a relatively traditional rural agricultural-based economy [10]. Infrastructure and services in urban areas are generally well-developed. However, those in the rural areas are left behind as the average income and consumption levels of urban residents are significantly higher than most rural residents [11]. However, agriculture remains the dominant economic sector with a contribution of 21.4% to the country’s GDP, and it provides food to the country [12]. Realising the reduction in agriculture produce and enhancement needed due to climatic issues, Pakistan developed vision 2025 to change the current agriculture production system for sustainable food security [13]. Pakistan’s agriculture productivity uses inorganic fertiliser, pesticides, and mechanisation that cause greenhouse gases (GHG) emissions [14]. The agriculture contribution to the country’s GHG emission is about 44%, which is more than agriculture’s contribution to the country’s GDP [13].
Pakistan is well-known for its rice production, and Punjab contributes 58% from the 6 million tons of rice production in a year [11]. Moreover, Pakistan is the fourth leading rice exporter in the world [10]. CAPs adoption is quite low in Pakistan, with only 600 thousand acres of total cultivable land [7], which is less than 1% of the land in the country. Over the last two decades, Pakistan has been exposed to climatic changes, floods, and droughts [15]. The existing farming system causes a high risk of climatic changes that undermine livelihoods and local food security. The adoption of CAPs requires support from local agents and institutions for the benefit of the local community [4]. In agriculture, farmers are decision-makers, and they have an individual personal capacity that influences their intention to adopt CAPs [8]. Furthermore, CAPs have specific associated perceived characteristics that influence farmers’ intention to adopt CAPs, along with farmers’ personal features [16].
Agriculture is becoming unsustainable due to the heavy relicensing of intensive farming practices [17]. The global food system needs a sustainable solution to address the increasing food demand while reducing GHG emissions. The low adoption of CAPs has led this study to investigate farmers’ personal capacities and CAPs characteristics affecting their intention to adopt CAPs [8]. Moreover, the role intention and perceived availability of support were also explored for CAPs. Most importantly, how the use of CAPs leads to sustainable farm performance being achieved was explored.
This study addresses three research questions: (1) how does the intention to adopt CAPs develop among the rice farmers? (2) what are the factors that promote the actual uptake of CAPs? Furthermore, (3) to what extent does the use of CAPs affect sustainable farm performance? We find no study that utilises the personal capacities and perception of CAPs characteristics among farmers enabling the CAPs adoption. There is a lack of studies on the intention to adopt and use CAPs using the theory of planned behaviour (TPB) and the technology adoption model (TAM).
This study explored the adoption of CAPs through the lens of the unified theory of acceptance of use of technology (UTAUT) by extending the psychological inclinations that led to the intention to adopt CAPs. Additionally, this study determined how the adoption of CAPs led to sustainable farm performance amongst the farmers.

2. Literature Review

2.1. Conservative Agriculture Practices and Adoption

Although CAPs have been proposed to enable sustainable farming practices since early 1900s, the CAPs only attained popularity after the 1990s [7]. A comprehensive list of CAPs was endorsed by UNFAO (Food and Agriculture Organization of the United Nations) to achieve the sustainability of global agriculture [4]. The CAPs are based on the idea of low land disturbances and the reduction of high GHG emissions from agriculture [2]. No-till and direct seeding were the earlier CAPs practiced in early 1930 in the USA [4]. In 1990, farmers and researchers had tested CAPs in the USA, as recommended by the World Bank, FAO, and other global agencies, in order to achieve sustainable global agriculture [7]. Essentially, CAPs are based on three principles: (1) reducing soil disturbances and biomass that can enhance soil fertility, (2) achieving higher farm productivity, and (3) increasing farmers’ income [4]. The most frequent citied CAPs are no-tillage, land levelling, direct seeding, bio-fertiliser, natural pesticides, crop rotation, legume crops, intercropping, and cover crops [18]. The present adoption of CAPs is promoted by the economic incentives of providing subsidy, financial assistance, and credit availability [19]. No-till derives from CAP based on the idea of zero or low soil disturbance that minimizes GHGs emission triggered by land disruption during farming [7]. Land levelling, on the other hand, helps to attain smooth cropland that facilitates better irrigation, apart from reducing water wastage by up to 30% [10]. Direct seeding enables agronomic and economic benefits for both the farm and farmers, mainly because direct seeding is linked with no-till [18]. Bio-fertilizer or composting refers to a natural substitute to inorganic fertilizer that empowers the soil with biotic, thus enriching soil fertility [4]. Bio-fertiliser made from natural organic wastes or manure is knowledge-driven [18]. Crop rotation, wherein crops are changed at the farm [7], can nurture the necessary micro-organisms in the soil and enhance soil fertility [18]. Crop rotation also minimizes the use of inorganic fertilizer and pesticides. Legume cropping serves as crop rotation and enriches soil fertility by acting as green manure for the soil [4]. Intercropping is unique in a way, whereby two crops are sowed simultaneously in the farm [7]. This not only helps balance soil nutrients, but also keeps the land covered while harvesting the crop [4]. Intercropping promotes soil diversity and use of fertilizers [18]. The adoption of CAPs at the global level remains low, and farmers, unfortunately, have halted practicing CAPs after the discontinuation of subsidies or financial assistance [20].

2.2. Factors Affecting the Adoption of CAPs

Innovation adoption is complex and mainly based on many personal factors of the adoptees [21]. Farmers’ social and psychological factors are critical to achieving the continuous adoption of CAPs [8]. Economic, social, and psychological factors were studied to understand the adoption of CAPs [22]. Moreover, the adoption of CAPs is discussed with the theory of reasoned action (TRA), theory of planned behaviour (TPB), technology adoption model (TAM), and diffusion of innovation (DOI) [23]. Economic based studies studied the adoption by referring to farmers’ personal factors of age, gender, farm-land, education, capital with the social factors of farmer NGO (non-governmental organisation) membership, and access to credit [24]. Adoption is considered as a psychosocial process, which is studied with the factors of attitude, social norm, and perceived behavioural control in influencing the intention to adopt CAPs [25]. Few studies affirm that the stance of technology adoption can estimate the adoption based on the characteristics of CAPs, such as the ease of use, usefulness or relative advantage, complexity, and compatibility. CAPs adoption is a case of innovation adoption based on the adoptees’ personal capacities and perception of CAPs characteristics associated with adoptees’ personal factors for the intention to adopt and use CAPs [1]. Based on these highlights, this study used the following factors to evaluate the intention and adoption of CAPs.

2.2.1. Farmer Innovativeness (FIN)

Individual innovativeness describes the likelihood of an individual to adopt the innovation earlier than others [26]. Individuals with a higher level of innovativeness can become change agents and facilitate others to adopt the technology [21]. The use of individual innovativeness can enhance the predictive power of the dominant technology acceptance models. Moreover, individual differences play an essential role in the adoption of technology [21]. An individual having the innovativeness trait seeks more information than others. Taking an information processing view individual with an innovativeness trait develops the intention to adopt the technology earlier than the others [21]. Farmers’ innovativeness defined as the degree of farmers’ willingness to change their current adopted practices with a new practice [26]. Personal willingness motivates the use of new farming practices based on personal experimentation attitudes towards new technology and practices.

2.2.2. Trust on Extension (TOE)

Trust is a complex construct that utilised in many levels between people and institutions. Information source credibility plays a vital role in the formation of trust and intention to adopt or purchase a new technology [27]. Communication theory suggests that trust in the messenger can improve the message’s trustworthiness [28]. Agriculture extension services are run by the state-run agencies in developing countries, which are considered the essential source of information for the farmers to adopt new farming practices [29]. This study used the concept of trust on extension because the farmers’ readiness depends on extension services, and their willingness not based on having power over other farmers [30]. Farmers refer to extension services for advice, and their decision is personal and not controlled by the extension staff [28].

2.2.3. Profit Orientation (POT)

Profit is the prime objective of business activities. Engagement of profit orientation enables business owners to perform business activities according to their best interests [31]. A farmer is a business individual with valuable consideration for the farming business. Farming creates multiple values that can increase the profits of the farming business [28]. Profit orientation enables a farmer to engage in activities that empower them and improve farm yield and income [1]. For this study, we define farmer profit orientation as the degree of consideration towards retaining profits while adopting new farming methods and practices [31]. Profit-seeking is natural because farmers work for profit for their family and business. However, some farmers have set higher profit objectives as they are more inclined to have higher profits, and they are less concerned about the environment and food consumers [32].

2.2.4. Environmental Attitude (ENA)

Farming is about engaging with the environment. Farmers follow and read about weather patterns to get involved in farming practices [33]. The concern for the environment is natural for farmers. Their concern for the environment is because it is essential to humans; therefore, we need to reduce the harmful effects of humans on the environment [34]. We conceptualise environment attitude as a personal inclination and consistent behaviour to engage in pro-environmental actions according to the internal realisation that it is vital to preserve the environment and resolve the imbalance created by humans [35]. Farmers must think of the environment as a critical factor of production for their farming practices. Environment attitude enables the farmers to give appropriate importance to the environment and pursue collective action from others as well [36].

2.2.5. Risk-Taking Attitude (RTA)

The perception of risk varies between individuals depending on their risk attitude. It is normal for a human to take risks. Individual risk-taking attitude helps to gauge the risk behaviour of an individual [37]. Moreover, risk management based on the perception of risk and risk-taking attitude [38]. We conceptualise a risk-taking attitude as an orientation to take or avoid risk-taking as a predisposition that evolves and remains persistent [37]. Farming is a unique business, where most of the decisions made by the farmer regarding risks arising from production, price, personal factors, policy, or the environment [5]. Adopting a new farming practice is a risky decision, and not all farmers would accept new farming practices [38].

2.2.6. Performance Expectancy (PEX)

Technology adoption by the users is associated with the perception of expected performance on a technology. The expectation of performance is the degree of perceived positive outcomes from the use of technology. Venkatesh et al. [39] proposed the concept of performance expectancy based on the earlier conceptualisation of perceived usefulness from the technology adoption model (TAM) and the conceptualisation of relative advantage from the diffusion of innovation (DOI). Performance expectancy is a robust predictor of the intention to adopt in voluntary and mandatory working conditions [40]. Moreover, individuals’ age and education have a significant effect on their intention to adopt the innovation [41]. We conceptualise CAPs performance expectancy as the degree of believing by a farmer that using CAPs can enhance farm performance [39]. The perception of CAPs performance expectation varies based on the personal characteristics of prospective users.

2.2.7. Effort Expectancy (EEX)

Innovation can reduce efforts to perform tasks with current or existing practices. Effort expectancy perceived as a reduction in efforts to perform the same task with an innovative or new technology [21]. Venkatesh et al. [39] proposed the concept of effort expectancy that centred on the earlier conceptualisation of perceived ease of use from TAM and the conceptualisation of complexity from DOI. Effort expectancy can reduce efforts in performing a task besides being a significant feature in establishing the intention to adopt an innovation or technology [21]. Effort expectancy reduces the perceived efforts or creates efficiency for the prospective users. Effort expectancy is defined as the degree of ease associated with the use of CAPs [39]. Ease of use or achievement of efficiency is different among prospective users based on their personal characteristics.

2.2.8. Social Influence (SIN)

Societal norms and societal artefacts influence a human as a social being. Social norms and social influence help to change behaviours as well as have an impact on the intention to adopt a technology [40]. Individual decision-making is greatly influenced by the significant people around him or her. Venkatesh et al. [39] propose the concept of social influence, which derived from the previous conceptualisation of subjective norm in the theory of reasoned action (TRA), TAM, and the concept of the image from DOI. The adoption of new technology or practice is a decision that is greatly influenced by societal norms or societal artefacts around the individual [40]. We define social influence as the degree to which individuals perceive that the noteworthy people around them wanted them to use CAPs [39]. Farmers’ family members, peers, and fellow farmers may influence them to adopt innovative farming practices [28]. However, the perception of social influence varies among individuals according to their characteristics.

2.2.9. Facilitating Condition (FCN)

Technology adoption is complex and requires technical and personal support to develop the intention to adopt [21]. The perception of support boosts the intention to adopt a technology or change behaviour. Venkatesh et al. [39] define the concept of facilitating conditions from other conceptualisations of perceived behavioural control involving TRA and the concept of compatibility involving DOI. The perception of facilitating conditions impacts the adoption or use of technology [41]. Effort expectancy is not a part of the model, and the perception of facilitating conditions motivates the intention to adopt a technology [39]. We operationalize facilitating conditions as perceived beliefs held by farmers that organised technical support is available for using the CAPs [39]. The perception of accessibility and support to use CAPs and available advice can encourage farmers to use CAPs [42].

2.2.10. Voluntariness of Use (VOU)

A free choice to adopt the technology influences the adoptees. The perception of personal choice may lead to adoption or non-adoption. An individual with a higher perception of voluntariness to use technology may only use the technology as a personal choice [39] and have the perception that mandated facilitation is not available. The obligatory use of technology may lead to non-adoption, as some users are not willing to comply with the organised authorizing use of a technology [39]. The study defines voluntariness of use as using CAPs is not mandatory, and a personal choice [43]. The perception of voluntariness of use affects the adoption of technology with varying degree, and individuals’ perception about technology associated features plays an essential role in the adoption of a technology or practice.

2.2.11. Intention to Adopt CAPs (ITA)

The intention is a mindful provocation or inclination to get involved in a particular behaviour execution and reflected as the willingness to behave in a particular prescribed manner [44]. The theory of planned behaviour has three communally exclusive independent causes for the development of intention to adopt specific behaviour or change in behaviour, namely the attitude towards behaviour, the subjective norm for the behaviour, and perceived behavioural controls [39]. Moreover, UTAUT defines intention as an outcome of the technology’s perceived performance expectancy, effort expectancy, and social influence. Furthermore, the intention defined as the subjective probability of an individual’s action or behaviour [44]. Behavioural intention defined as the willingness to adopt technology over time [39]. Therefore, behaviour intention is different from the desire and self-prediction to use technology. We operationalise behavioural intention as the willingness to adopt CAPs over time by farmers [39]. The intention is a well-known proximate of behaviour or adoption as well [39].

2.2.12. Use of CAPs (UOC)

Adoption behaviours or actual usage of technology is the outcome of intention as predicted by TPB [44]. For this study, the use of CAPs was the actual uptake of CAPs among the farmers with varying degrees of adoption intensity [40].

2.2.13. Sustainable Farm Performance

Sustainable farm performance is the collective perceived performance of CAPs for the environment, yield, and financial aspect of farming after using CAPs [4]. CAPs reduce the negative impacts of farming, including the use of inorganic fertiliser and GHG emissions. We operationalise farm environment performance as a perceived reduction of inorganic fertiliser, pesticides, and other factors that increase GHG emissions [45]. Moreover, CAPs usage enhances farm productivity. We operationalise farm yield performance as perceived improvement in farm production and the enhancement of rice productivity per hectare as perceived by farmers [10]. Furthermore, CAPs usage improves the financial outcome of the farm, reduces the cost, and improves farm productivity. We operationalise the farm’s financial performance as perceived reduction cost of farm inputs and the improvement in the farm’s financial performance as perceived by farmers [45].

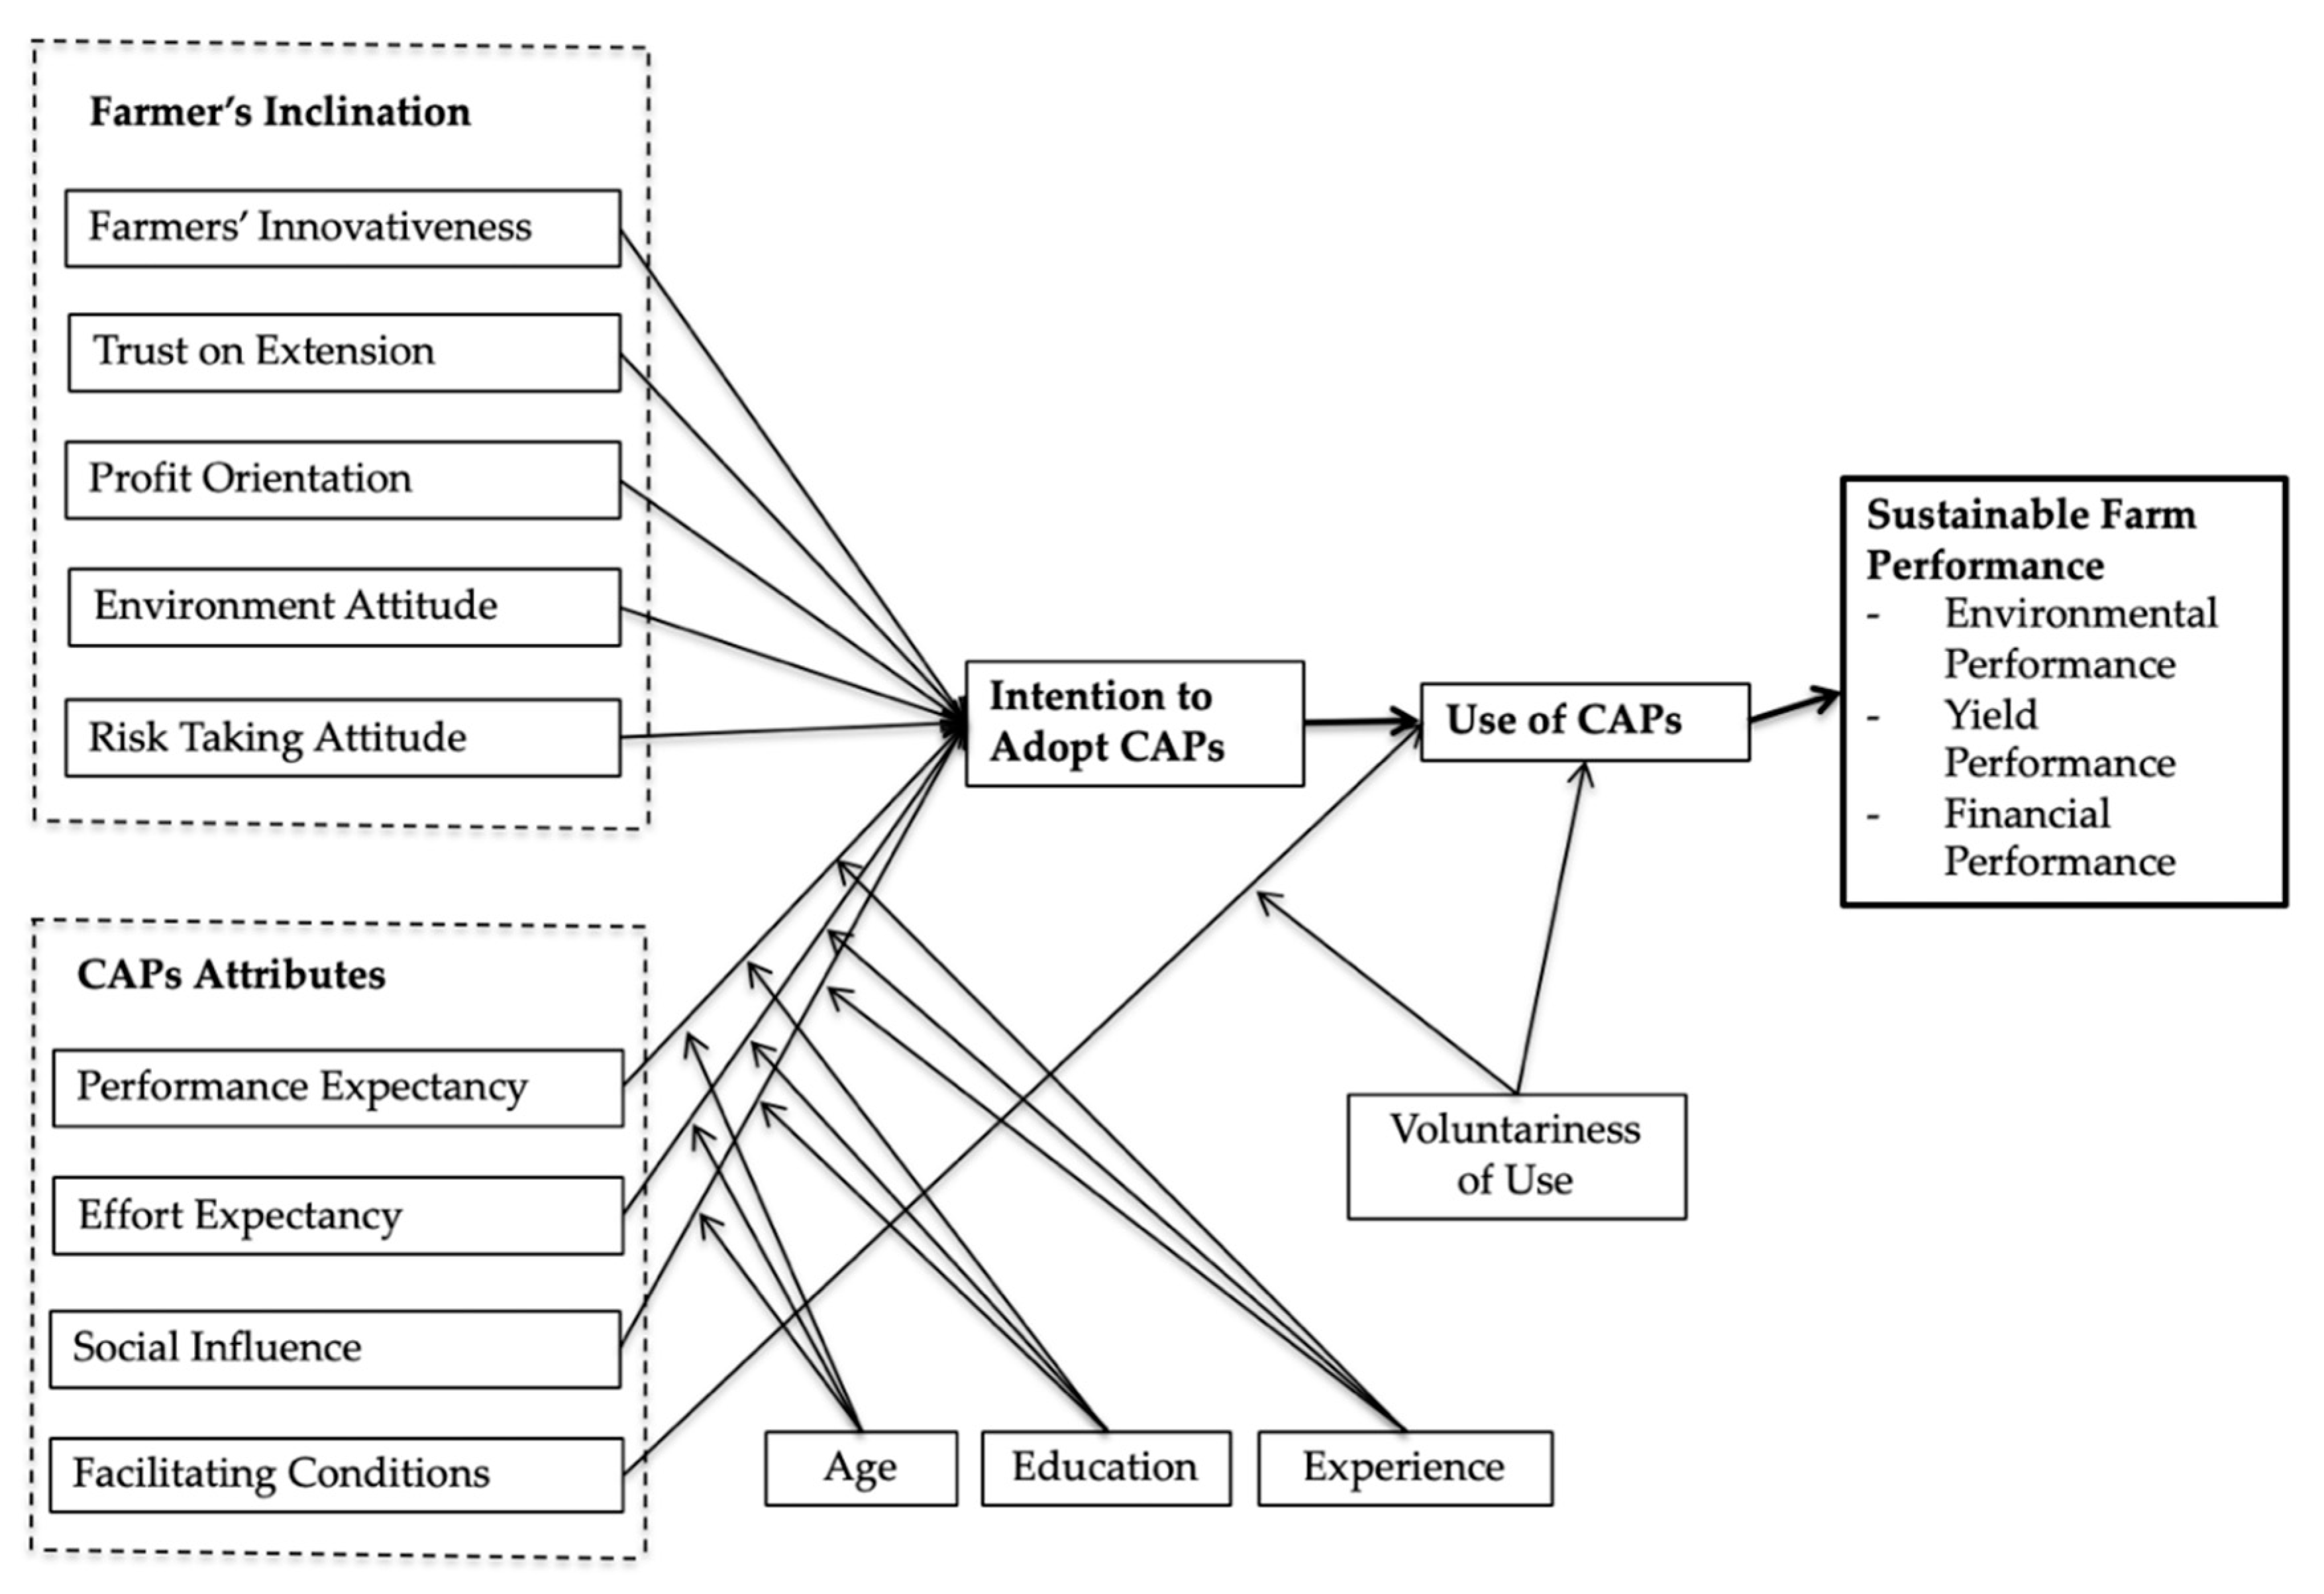
2.3. Hypotheses Development

2.3.1. Farmer’s Inclination and Intention to Adopt CAPs

Farmers’ inclinations to engage in novel and non-repetitive activities is regarded as the personal innovativeness of individuals. Pino et al. [46] revealed that the personal innovativeness amongst Italian farmers had positively and significantly developed their intention to adopt CAPs. Likewise, Aubert et al. [16] stated that farmers’ innovativeness had significantly estimated the adoption of CAPs among Canadian farmers.
Hypothesis 1 (H1).
Farmers’ innovativeness has a significantly positive effect on the intention to adopt CAPs among rice farmers.
Extension services are the prime source of information for farmers [7]. Farmers’ trust in extension services is essential in the adoption of new agricultural technologies [28]. Moreover, Ali et al. [10] revealed the importance of trust in extension among Pakistani farmers for the adoption of land levelling. Turyahikayo and Kamagara [29] highlight the importance of trust in the adoption of agriculture technologies by Uganda farmers. Wossen et al. [47] found that the extension services among Ethiopian farmers had positively influenced the intention to adopt CAPs. Meanwhile, Walisinghe et al. [33] reported that the extension services received by farmers had a positive impact on the adoption of CAPs.
Hypothesis 2 (H2).
Trust on extension has a significantly positive effect on the intention to adopt CAPs among rice farmers.
Farmers’ acceptance of new agricultural technologies is highly associated with the improvement of farm profitability [32]. Farmers are business individuals who own a business in farming with the prime objective on profitability. Mariano, Villano, and Fleming [48] revealed that farmers who had profit orientation were more interested in adopting CAPs in the Philippines. Nonetheless, Tosakana et al. [32] reported a significantly negative effect of farmers’ profit orientation on the adoption of CAPs. As such, this study proposes a significantly positive effect of farmers’ profit orientation on the intention to adopt CAPs.
Hypothesis 3 (H3).
Profit orientation has a significantly positive effect on the intention to adopt CAPs among rice farmers.
An individual environment attitude is the commitment of individuals to indulge in environmental protective actions. It is an internal realisation and determination to work on preserving and resolving damaging effects on the environment [35]. Moreover, Trivedi et al. [35] asserted that the effect of environment orientation had a significantly positive impact on the intention to adopt CAPs. Similarly, Ma and Abdulai [1] reported a significantly positive effect of farmers’ environment attitude on the adoption of CAPs among Chinese farmers. Hence, this study proposes a significantly positive effect of farmers’ environmental attitude on the intention to adopt CAPs.
Hypothesis 4 (H4).
Environment attitude has a significantly positive effect on the intention to adopt CAPs among rice farmers.
Risk-taking attitude is the general tendency of an individual to take a risk in their general daily life. In general, a risk-taking attitude enhances the tendency to adopt new technology and practice among technology adopters [21]. Mariano et al. [48] described that rice farmers in the Philippines with an aversive risk attitude were least interested in adopting CAPs. Gao et al. [17] claimed that Chinese farmers with a risk-taking attitude were more inclined to adopt CAPs. Farmers who were inclined to take risks were also inclined to adopt CAPs [28]. Therefore, we hypothesise the following:
Hypothesis 5 (H5).
Risk-taking attitude has a significantly positive effect on the intention to adopt CAPs among rice farmers.

2.3.2. CAPs Attributes and Intention to Adopt CAPs

New technology and innovation can improve performance. CAPs are innovative farming practices that promote farms’ production and profitability [4]. Furthermore, Gao et al. [17] who had tested the farmers’ data from China, reported that the perceived usefulness of CAPs significantly explained the intention of the adoption. Tey et al. [22] postulated that CAPs had a negative impact on the intention to adopt CAPs. Meanwhile, Adnan et al. [23] claimed that perceived usefulness towards CAPs was insignificant among rice farmers in Malaysia. We suggest the following hypothesis:
Hypothesis 6 (H6).
CAPs’ performance expectancy has a significantly positive effect on the intention to adopt CAPs among rice farmers.
It perceived that CAPs could help farmers by reducing the amount of effort and work involved in performing farming tasks [9]. Recent work suggested that CAPs are associated with ease of use. Gao et al. [17] conducted a study on 676 farmers from China and found that the perceived ease of use for CAPs had a significant impact on the intention to adopt CAPs. Therefore, we suggest the following hypothesis:
Hypothesis 7 (H7).
The effort expectancy of CAPs has a significantly positive effect on the intention to adopt CAPs among rice farmers.
Social influence plays a vital role in the adoption of an innovation. Current empirical work suggested that the intention to adopt CAPs positively facilitated by social influence. Borges et al. [24] confirmed that social norms had significantly explained the intention of CAPs adoption among Brazilian farmers. Meanwhile, Adnan et al. [23] reported that paddy farmers in Malaysia were influenced by social norms for their intention to adopt CAPs. Therefore, we propose the following hypothesis:
Hypothesis 8 (H8).
The social influence of CAPs has a significantly positive effect on the intention to adopt CAPs among rice farmers.

2.3.3. Impacts of Facilitating Conditions, the Voluntariness of Use, and Intention to Adopt CAPs

A facilitating condition is the perception of the availability of support for the use of technology. This facilitating condition is available in the form of guidance or specialised instructions on the technology. Lalani et al. [49], discuss the role of perceived behavioural control that affects the use of CAPs among Mozambique farmers. The effect of perceived behavioural control on the use of CAPs was significantly positive. Ebrahimi, Bijani, and Sadighi [50] explored the technology adoption for sustainability of agriculture in Iran and reported that the effect of compatibility on the use of technology was significantly positive.
Hypothesis 9 (H9).
Facilitating conditions of CAPs have a significantly positive effect on the use of CAPs among rice farmers.
Generally, technology adoption is a voluntary choice for adoptees. Voluntariness on the use of technology affects the adoption of technology [39]. The personal voluntariness of use impacts agriculture technology adoption. Aubert et al. [16] reported a significantly negative impact of the voluntariness of use on the adoption of precision agriculture technologies.
Hypothesis 10 (H10).
Farmers’ voluntariness of use has a significantly positive effect on the use of CAPs among rice farmers.
The use of CAPs positively and significantly influenced by the intention to adopt CAPs among Malaysian vegetable farmers. Tey et al. [22] documented the impact of ITA CAPs on the use of CAPs. Ebrahimi [50] reported that ITA CAPs could positively and significantly control the actual adoption.
Hypothesis 11 (H11).
Intention to adopt CAPs has a significantly positive effect on the use of CAPs among rice farmers.

2.3.4. Impact of Facilitating Conditions, the Voluntariness of Use, and Intention to Adopt CAPs

The use of CAPs is advantageous to the farms’ soil for economic and environmental benefits [14]. CAPs based on the notion of using the farm-land with low disturbance for sowing and harvesting [18]. CAPs enable cost-saving by reducing water consumption and labour [9]. It is evident that farmers can benefit the soil, reduce the cost, and have higher economic returns [4]. The use of CAPs can save up to 40–60% in water irrigation, and the farms’ yield can be improved by 30–35% with proper advice from the extension services [20]. There are fewer pest attacks when using CAPs compared to using the traditional rice cropping system [10].
Ahmad et al. [14] stated that the adoption of CAPs has a positive impact on farms’ yield and income, as described by Pakistan farmers. The impact of the use of CAPs on rice yield and farm income was significantly positive [10]. The above discussion leads to the next hypothesis:
Hypothesis 12 (H12).
The use of CAPs among rice farmers has a significantly positive effect on sustainable farm performance.

2.3.5. Moderation Effect of Farmers’ Age

Farmers’ personal factors of age, gender, and education can influence the adoption of CAPs. An empirical work reported the impact of farmers’ age on the intention to adopt CAPs [20,22]. Moreover, CAPs performance expectancy, effort expectancy, and social influence can affect the intention to adopt CAPs. However, the role of farmers’ age on the intention to adopt CAPs is inconsistent. Several studies reported that the effect of age on the intention to adopt CAPs was positive [37], and a few studies reported the negative impact of age [1,47]. Age has an inconsistent effect that moderates the relationship of performance expectancy, effort expectancy, and social influence. Thus, we hypothesise the following:
Hypothesis 1M (H1M).
The relationship between CAPs’ performance expectancy and intention to use CAPs is moderated by farmers’ age.
Hypothesis 2M (H2M).
The relationship between CAPs’ effort expectancy and intention to use CAPs is moderated by farmers’ age.
Hypothesis 3M (H3M).
The relationship between CAPs’ social influence and intention to use CAPs is moderated by farmers’ age.

2.3.6. Moderation Effect of Farmers’ Education

Farmers’ personal characteristics can influence the intention to adopt CAPs. Similarly, we predicted that the perception of CAPs characteristics is different from the farmers’ personal characteristics. For example, farmers’ education shows a positive and negative significant effect on the intention to adopt CAPs. Wossen et al. [47] reported the positive and significant effect of education on the intention to adopt CAPs among the Ethiopian farmers. Likewise, Ma and Abdulai [1] reported a positive and significant effect of education on the intention to adopt climate-friendly farming practices among the small landholder farmers from China. Walisinghe et al. [33] reported an insignificant and negative effect of farmers’ education on the intention to use CAPs. Moreover, Tey et al. [22] revealed a negative effect of education on the intention to adopt CAPs. These studies reported inconsistent impacts of farmers’ education in moderating the relationship of performance expectancy, effort expectancy, and social influence for the intention to adopt CAPs. The literature, as mentioned above, allows us to hypothesise the following:
Hypothesis 4M (H4M).
The relationship between CAPs’ performance expectancy and intention to use CAPs is moderated by farmers’ education.
Hypothesis 5M (H5M).
The relationship between CAPs’ effort expectancy and intention to use CAPs is moderated by farmers’ education.
Hypothesis 6M (H6M).
The relationship between CAPs’ social influence and intention to use CAPs is moderated by farmers’ education.

2.3.7. Moderation Effect of Farmers’ Experience

Farmers’ experience plays a vital role in the formation of the intention to adopt CAPs. Khatri-Chhetri et al. [3] studied 346 farmers from India and reported that farmers with more working experience were more highly influenced to adopt CAPs. However, Tey et al. [22] reported a negative and insignificant effect of the farming experience of Malaysian farmers on their intention to adopt CAPs. Furthermore, Zhou et al. [19] revealed a negative and insignificant effect of farming experience on the intention to adopt CAPs among Chinese farmers. The inconsistent impacts of farmers’ farming experience can moderate the relationship of performance expectancy, effort expectancy, and social influence on the intention to adopt CAPs. Therefore, this study hypothesises the following:
Hypothesis 7M (H7M).
The relationship between CAPs’ performance expectancy and intention to use CAPs is moderated by farmers’ experience.
Hypothesis 8M (H8M).
The relationship between CAPs’ effort expectancy and intention to use CAPs is moderated by farmers’ experience.
Hypothesis 9M (H9M).
The relationship between CAPs’ social influence and intention to use CAPs is moderated by farmers’ experience.

2.3.8. Moderation for Voluntariness of Use and Facilitating Conditions on the Use of CAPs

Farmers having a higher perception of facilitating conditions for CAPs consider CAPs adoption as being obligatory. The lack of facilitating conditions associated with the perception that the CAPs adoption as voluntary [49]. Venkatesh et al. [39] suggest that increasing facilitating conditions can reduce the perception that adoption is voluntary, and increasing facilitating conditions perceived that adoption becomes obligatory. Thus, this study proposes the moderation of FCN on the VOU for the use of CAPs.
Hypothesis 10M (H10M).
The relationship between CAPs facilitating conditions and use of CAPs is moderated by farmers’ voluntariness of use.
All associations hypothesised and tested are presented in Figure 1 below:

3. Research Methodology

3.1. Study Area and Context

The primary data for this study were collected from the rice-wheat irrigated area of Punjab, Pakistan. The central part of Punjab in Pakistan is rather well-known for its traditional rice-cultivation area that yields the finest quality of rice in the world [12]. About more than half of the rice cultivation of Pakistan is performed in this particular area. Punjab is the heart of Pakistani agriculture sector and represents 73% of the cropland in Pakistan [13]. These lands are the most fertile plains with groundwater and irrigation water available, thus making rice farming a natural choice for the farmers [12]. Although farmers around the area experience surge in rice yields due to a range of new varieties, the cost of rice production appears to be high due to water and labor costs [10]. Irri and basmati are the prime rice varieties cultivated in the study area.

3.2. Data Collection and Sample Selection

The sample size for this study was estimated by using G-Power 3.1 with the power of 0.95 and the effect size of 0.15. As a result, the required sample size was 189 with 13 predictors of the model [51]. The minimum threshold of 200 samples was needed for PLS-SEM [52]. The sampling frame for the study was derived from a list of farmers provided by the agriculture department of Punjab. The list contained the name and address of 10,700 farmers from four rice-producing districts. The stratified random sampling technique was applied to collect data from rice farmers in four districts of Punjab (Gujranwala, Gujrat, Sialkot, and Mandi Bahaudin (MB Din)). All the gathered data were compiled in MS Excel sheet and random numbers were extracted using the RAND command. To avoid any complications for non-response, 15 interviewers were trained to collect data from the farmers. They are undergraduate students of a private university in Punjab, who contacted 750 farmers. After obtaining permission to collect data from the respondents, data collection was performed from November 2019 to January 2020. The investigator received 370 completed surveys. After discarding incomplete and unusable surveys, the final analysis performed on 336 responses. The respondents were requested to sign the consent form as evidence of their permission to participate in the survey. The sample size was sufficient for SEM-ANN [53].

3.3. Research Instrument

This interview questions adapted from previously validated scales. Four items were adopted from Agarwal and Prasad [26] to estimate farmers’ innovativeness using two self-developed items. Trust on the extension was adapted from Dimitriadis and Kyrezis [30] and Slade et al. [27]. Profit orientation was evaluated with five items from Lapple [31]. The environmental attitude was evaluated with seven items from Trivedi et al. [35]. Farmers’ risk attitude gauged with four items from Lapple [31]. The items taken from Venkatesh et al. [39] for performance expectancy, effort expectancy, social influence, and facilitating conditions. Voluntariness of use evaluated with three items adapted from a study by Aubert et al. [16]. Intention to adopt CAPs taken from a study by Venkatesh et al. [39], and the adoption of CAPs adapted from Venkatesh et al. [40]. Sustainable farm performance estimated with the environmental, yield, and financial performance of the farm. The scale borrowed from the work of Yina [45] for environmental farm performance and financial farm performance. Farm yield performance estimated with items taken from Ali et al. [10].

3.4. Assessment of Common Method Variance (CMV)

Cross-sectional studies associated with common method variance (CMV); the criterion and predictor scale format should be different [54]. We utilised different scale format; for example, the criterion constructs measured with a seven-point Likert scale, and the constructs for all predictors measured with a five-point Likert scale [54]. Harman’s [55] one-factor test used to test the effect of CMV [54]. The single factor accounted for 15%, which is less than the recommended threshold of 50% in Harman’s one-factor test; thus, confirming the insignificant effect of CMV. Moreover, the suggested test was to evaluate the correlations among the latent study constructs, and the correlation of less than 0.9 specifies the absence of CMV [54]. We collected data for social desirability bias with a seven items scale, and tested the effect of latent marker construct on the endogenous constructs of the intention to adopt CAPs, use of CAPs, and sustainable farm performance [54]. The change in R2 was less than 0.01 for all endogenous constructs. The results indicate that common method bias is not a substantial issue in our study [54].

3.5. Multivariate Normality

The multivariate normality for the data performed with the online tool of Web Power [56]. The calculated Mardia’s multivariate skewness, kurtosis coefficient, and p-values reveal that the data have a non-normality issue, as the p-values were less than 0.05 [57].

3.6. Data Analysis Method

3.6.1. SmartPLS Analysis

An empirical analysis for the study model was executed with partial least squares structural equation modelling (PLS-SEM) using Smart-PLS software 3.1. PLS-SEM is a multivariate exploration device to estimate path models that have latent constructs [58]. PLS-SEM can work with small datasets and complex models with composites; in addition, it has no postulation of goodness-of-fit estimation compared to covariance-based SEM [52]. PLS-SEM data analysis has two-step procedures, where the first measurement is performed on the model to test the reliability and validity of study constructs [58]. The second stage is performed with structural model associations and examination of study hypotheses with significance levels by bootstrapping [52]. Model estimation is performed with r2, Q2, and effect size f2 that describe the path effect from exogenous construct to endogenous construct [58]. f2 and Q2 is evaluated with the guidance provided by Cohen [59].
Hierarchial component models can handle PLS-SEM [60]. PLS-SEM facilitates the structure of a multidimensional higher-order construct. Multiple methods can perform multiple hierarchical models in PLS-SEM. The repeated measure is known for its easiness and parsimony [60]. Moderation occurs when the input variable of the outcome variable depends on other variables [60]. We followed the two-stage approach, as it generates better statistical power results [58]. PLSpredict is recommended by Shmueli et al. [61] to verify the model’s critical endogenous construct and examine prediction errors. Prediction performance was evaluated by using the mean of Q2predict statistic for the verification with a w naïve yardstick designed by the PLSpredict method [61]. PLSpredict estimates the naïve benchmark in the linear regression model (LM). Then, a comparison between RMSE or MAE values for LM and PLS model verifies the explanatory power of two methods. Shmueli et al. [61] suggest that the PLS-SEM model lacks predictive power if the PLS-SEM model yields higher prediction errors than the LM benchmark. If the majority of the PLS-SEM analysis produces higher prediction errors than the LM benchmark, it shows the low predictive power of the PLS-SEM model. If only a small portion of the PLS-SEM analysis produces higher prediction errors than the LM benchmark, it indicates the medium power of PLS-SEM model. If there is no indicator in the PLS-SEM model on more errors than the LM benchmark, the PLS-SEM model has higher predictive power [61].
The importance-performance map analysis (IPMA) categorises the study predictor constructs into relatively high to low by importance and performance [52]. IPMA supports detecting the possible area of enhancements that requires consideration from managers and scholars. IPMA analysis is based on the total effect of the rescaled variables scores in the unstandardised arrangement [62]. Rescaling develops each latent variable score that is between 0 and 100. The mean value of the latent variable score represents the performance of the latent variable, where 0 represents the least important performance, and 100 represents the most important one in the performance of the endogenous construct [58].

3.6.2. Analysis Using Artificial Neural Network (ANN)

A frontier technology of computation called the artificial neural network (ANN), which was constructed based on a deep learning algorithm instead of human input (see details in Appendix A), had been employed in this present study. The ANN is based on the connecting input and output neurons with a hidden layer of neurons [63]. The ANN works well with complex models, while the hidden layer functions as the block-box [64]. Predictive accuracy evaluated with data training and testing, along with Root Mean Square Errors (RMSE) between the trained and tested data, as well as close values of RMSE, exhibited high predictive accuracy [53]. Sensitivity analysis was performed to examine the relative contribution of each exogenous construct [63]. Normalised importance displayed the importance of exogenous construct for the endogenous construct [53].

4. Data Analysis

4.1. Descriptive Statistics

Table 1 shows the profile of the study respondents. The majority of the study respondents were male (90.5%). The following are the results for age range: 21–29 years old (17.5%); 30–39 years old (29.7%); 40–49 years old (31.9%); 50–59 years old (16.6%); and 60 years old or above (4.4%). Only 9.8% of the respondents completed primary education or less, 27.5% of them have a high school education, 39.8% of them have college-level education, and 22.9% of them have university degree-level education. The following are the marital status of the respondents: single and never married (27%), married (56.8%), widow (12.7%), and divorcee (3.5%). The following are the farming experience levels of farmers: 1–4 years (4.7%), 5–10 years (22.8%), and the total number of farmers with 11-15 years of farming experience is 44.6%. A total of 55.6% of the farmers were non-government organisation (NGO) members, and the remaining were not a member of any NGO. The following are the results for the farmers’ district: Gujranwala (22.3%), Gujrat (25.6%), Sialkot (29.2%), and MB Din (22.9%).

4.2. Validity and Reliability

The reliabilities for the constructs reported the alpha (α), DG rho, and composite reliability (CR) are more than 0.696, 0.705, and 0.812, respectively [58]. The Cronbach’s alpha values for each construct are above the threshold of 0.60, and the minimum value of DG rho and CR is above 0.70 [52]. The results reported in Table 2. These results signify that the constructs are reliable and performed well for the next stage of analysis. The AVE for all items for each construct must be above 0.50 scores to achieve convergent validity in approving the uni-dimensionality for each construct [58]. The items reveal that the constructs have acceptable convergent validity (see Table 2). The item loading and cross-loading reported that the study construct has satisfactory discriminant validity (see Table A1). Furthermore, the Fornell-Larcker criterion [65] and Hetro-trait and mono-trait (HTMT) ratio were utilised for the discriminant validity of study constructs [66]. The Fornell-Larcker criterion should be less than 0.70 to provide evidence of construct discriminant validity [58]. The HTMT ratio needs to be less than 0.90 to establish discriminant validity for study constructs [66]. Table 3 shows that the study has evidence of discriminant validity.

4.3. Hierarchical Model

This study has a higher-order construct of the sustainable farm performance that is influenced by the first-order constructs. For this study, the second-order construct of sustainable farm performance was tested with repeated measures, as recommended by Hair et al. [60]. The hierarchical model results show a positive and significant effect from the first-order construct for the perceptions of environment farm performance, yield farm performance, and financial farm performance after adopting CAPs. Table 3 tabulates the results of the hierarchical model that sustainable farm performance displayed a significantly positive effect on the first-order construct of environmental farm performance (β = 0.333, p < 0.01), yield farm performance (β = 0.341, p < 0.01), and financial farm performance (β = 0.340, p < 0.01).

4.4. Path Analysis

After obtaining suitable validity and reliabilities from the structural assessment of the model, the next measurement assessment of the model employed to test the study hypotheses. The adjusted r2 value for the eight input variables (i.e., farmers’ innovativeness, trust on extension, profit orientation, environmental attitude, risk-taking attitude, performance expectancy, effort expectancy, and social influence) on the intention to adopt CAPs explains 30.9% of the change in the intention to adopt CAPs. The predictive relevance (Q2) value for this part of the model is 0.205, indicating medium predictive relevance [52]. The adjusted r2 value for three constructs (i.e., facilitating conditions, the voluntariness of use, and intention to adopt) on the use of CAPs explains 20.7% of the change in the actual use of CAPs among farmers. The predictive relevance (Q2) value for the part of the model is 0.183, indicating medium predictive relevance [52]. The adjusted r2 value for the use of CAPs on sustainable farm performance (SFP) explains 62.2% of the change in the intention to adopt CAPs. The predictive relevance (Q2) value for the part of the model is 0.488, indicating high predictive relevance [52].
Standardised path values, t-values, and significance level illustrated in Table 4. The path coefficient between FIN and ITA (β = −0.030, p = 0.301) indicates an insignificant and negative effect of the farmers’ innovativeness on the intention to adopt CAPs. The result is statistically insignificant, meaning it does not support H1. The path value for the TOE and ITA (β = 0.107, p = 0.103) shows the impact of trust on extension and intention to adopt CAPs. The result is insignificant but positive, thus providing no support for H2. The path between POT and ITA (β = 0.131, p = 0.022) shows the effect of profit orientation on the intention to adopt CAPs as positive and significant; it provides the evidence to support H3. The path coefficient for EA and ITA (β = 0.172, p = 0.013) shows a positive and significant effect; it provides evidence to support H4. The path coefficient for RTA on ITA (β = 0.005, p = 0.476) shows an insignificant and positive effect; it provides no evidence to support H5. The path coefficient for PEX on ITA (β = 0.020, p = 0.387) shows the effect of performance expectancy on the intention to adopt CAPs as positive but is statistically insignificant; it provides no support for H6. The path coefficient for EEX on ITA (β = 0.233, p = 0.000) shows a significant and positive effect of the effort expectancy on the intention to adopt CAPs; it provides support for H7. The path coefficient for SIN and ITA (β = 0.084, p = 0.059) shows a positive and significant effect of social influence on the intention to adopt CAPs; it provides no support for H8.
The path coefficient for FCN on UOC (β = 0.131, p < 0.01) shows a positive and statistically significant effect of facilitating conditions on the use of CAPs that supported H9. The path coefficient for VOU on UOC (β = 0.094, p = 0.032) shows a statistically significant and positive effect of the voluntariness of using CAPs on the use of CAPs that supported H10. The path coefficient for ITA and UOC (β = 0.267, p < 0.01) shows a positive and statistically significant effect of the intention to adopt CAPs on the use of CAPs that supported H11. The path coefficient for UOC and SFP (β = 0.789, p < 0.01) shows a positive and statistically significant effect of the use of CAPs on the sustainable farm performance that supported H12. Table 4 shows the results of path coefficients. The following are the results for Q2 predict statistics on the predictive power: −0.058 for the intention to adopt a CAPs model, −0.357 for the use of CAPs, and −0.779 for the sustainable farm performance construct. However, the comparison of RMSE and MAE shows the medium predictive power of the PLS-SEM model because some of the RMSE and MAE have higher values for the LM model than for the PLS-SEM model [61].

4.5. Moderating Effects

The moderating effect of the farmers’ age determined from the relationship between performance expectancy, effort expectancy, and social influence on the intention to adopt CAPs using hypotheses H1M, H2M, and H3M, respectively. The result reveals a moderating effect of age with performance expectancy for the intention to adopt CAPs (β = 0.054, CI min = −0.057, CI max = 0.156, p = 0.201) and provides no support for hypothesis H1M. The moderating effect of age on the effort expectancy for the intention to adopt CAPs shows no support (β = −0.020, CI min = −0.139, CI max = 0.086, p = 0.384) for hypothesis H2M. The result displays that age does not moderate the relationship between social influence and the intention to adopt CAPs (β = −0.039, CI min = −0.123, CI max = 0.075, p = 0.262); hence, hypothesis H3M is rejected. For hypothesis H4M, the effect of education and performance expectancy on the intention to adopt CAPs was evaluated. The result reveals that the moderation of education and performance expectancy does not affect the intention to adopt CAPs (β = 0.058, CI min = −0.037, CI max = 0.167, p = 0.172). For hypothesis H5M, the moderation of education and effort expectancy for the intention to adopt CAPs was examined. The outcome reveals (β = −0.044, CI min = −0.154, CI max = 0.071, p = 0.258) that the interactional effect of farmers’ education and effort expectancy for the intention to adopt CAPs is insignificant. For hypothesis H6M, the relationship between farmers’ education with the interaction of social influence and intention to adopt CAPs was assessed. The result show that (β = −0.038, CI min = −0.141, CI max = 0.051, p = 0.254) the farmers’ education and social influence on the intention to adoption CAPs behaviour have no moderation. For hypothesis H7M, the relationship between performance expectancy with farmers’ experience that moderates the intention to adopt CAPs was estimated. The result reveals (β = −0.232, CI min = −0.352, CI max = −0.117, p = 0.000) that intention to adopt CAPs is significantly moderated by farmers’ experience and performance expectancy. For hypothesis H8M, the relationship between the farmers’ experience and the interaction of effort expectancy for the intention to adopt CAPs assessed. The result shows that (β = 0.191, CI min = 0.084, CI max = 0.305, p = 0.002) the moderation of farmers’ experience and effort expectancy can affect the intention to adopt CAPs. For hypothesis H9M, the relationship between social influence and farmers’ experience that moderates the intention to adopt CAPs was estimated. The result reveals (β = 0.060, CI min = −0.052, CI max = 0.142, p = 0.159) that intention to adopt CAPs is insignificantly moderated by farmers’ experience and social influence. For hypothesis H10M, the relationship between facilitating conditions and the voluntariness of using CAPs that moderates the use of CAPs tested. The outcome shows (β = −0.164, CI min = −0.257, CI max = −0.082, p = 0.001) that intention to adopt CAPs is significantly moderated by facilitating conditions and the voluntariness of using CAPs. Table 5 shows the results of the moderating effect.

4.6. Importance-Performance Factors

Table 6 shows the outcomes of the importance-performance matrix. The results show that SIN is the most crucial factor in the performance of SFP (71.057), POT (70.231), and FCN (69.224). For the effect size of SFP, the most critical factor is UOC (0.871), followed by ITA (0.209), and FCN (0.137). Table 6 shows the results of IPMA.

4.7. Analysis from ANN

4.7.1. First Scenario

The ANN analysis was performed for three scenarios. For the first scenario, the endogenous construct is ITA, and the exogenous constructs are FIN, TOE, POT, ENA, RTA, PEX, EEX, and SIN. The predictive accuracy for the first ANN model had estimated the RMSE values for the training samples and the testing part of the sample. The SSE and RMSE values for the training and testing part shown in Table A2 (Appendix A). The small values of RMSE confirmed the high predictive accuracy of the model [64]. The relevancy of the prediction verified with the nonzero synaptic weights associated with the hidden neurons [63].
The sensitivity analysis performed contributed to eight exogenous constructs on the formulation of ITA for the first scenario. The normalised importance percentage had been based on the fraction of relative importance for each construct (see Table A2). The total contribution of input neurons to the endogenous construct (i.e., ITA) revealed that the PEX was the most contributing construct, followed by ENA, TOE, and FIN. The three least contributing factors were RTA, POT, and EEX, accordingly. The results are tabulated in Table A2.

4.7.2. Second Scenario

For the second scenario, the endogenous construct is UOC, and the exogenous constructs are FCN, ITA, and VOU. The predictive accuracy for the second part of the ANN model estimated the RMSE values for the training samples and the testing part of the sample. The SSE and RMSE values for the training and testing parts are shown in Table A3 (Appendix A). The small values of RMSE show the high predictive accuracy of the model [63]. The relevancy of the moderator prediction verified with the nonzero synaptic weights associated with the hidden neurons [64]. Associated sensitivity analysis evaluated the contribution of each factor on the formulation of UOC in the second scenario. The normalised importance percentage is based on the fraction of relative importance for each construct, as shown in Table A3. The total contribution of input neurons on the endogenous construct (i.e., UOC) reveals that FCN and ITA are the most contributing constructs. The results are depicted in Table A3.

4.7.3. Third Scenario

For the third scenario, the endogenous construct is SFP and the exogenous construct is UOC. The predictive accuracy for the third part of the ANN model estimated the RMSE values for the training samples and the testing part of the sample. SSE and RMSE values for the training and testing part are shown in Table A4. The small values of RMSE show the high predictive accuracy of the model [67]. The relevancy of the moderator prediction was verified with the nonzero.

5. Discussion

5.1. Formation of Intention to Use CAPs from Farmers’ Capacities

Five hypotheses were formulated to assess the effects of farmers’ inclinations of FIN, TOE, POT, ENA, and RTA on ITA CAPS. The study findings support that POT (f2 = 0.017) and ENA (f2 = 0.019) have a significant effect on the farmers’ intention to adopt CAPs, but the effect sizes are small [59]. However, the effect of FIN (f2 = 0.001), TOE (f2 = 0.010), and RTA (f2 = 0.000) was insignificant. Finding reveals that POT has a significant effect on the intention to adopt CAPs [48]. Moreover, results confirm that farmers’ ENA can significantly affect the intention to adopt CAPs [1,36]. The effect of FIN is insignificant. FIN’s effect on respondents is insignificant for ITA CAPs [26]. Similarly, TOE insignificantly affects ITA CAPs [29]. The effect of the low TOE is low and insignificant for the formation of the intention to adopt CAPs. RTA is insignificantly affecting ITA CAPs for the study respondents [17]. The low risk-taking attitude among farmers reduces ITA CAPs.

5.2. Formation of Intention to Use CAPs from CAPs Characteristics

In total, three hypotheses were proposed to evaluate the effects of CAPs level attributes of PEX, EEX, and SIN on ITA CAPS. The study findings reveal that PEX (f2 = 0.000), EEX (f2 = 0.045), and SIN (f2 = 0.008) have a different effect on the farmers’ intention to adopt CAPs. However, the small effect of EEX (f2 = 0.045) significantly affects the formation of ITA CAPs [23]. The effect of PEX is insignificant [22]. The result confirms that SIN has an insignificant effect on the intention to adopt CAPs [68].

5.3. Moderating Effect of Age, Education, and Experience on the Intention Formation to Use CAPs

Based on UTAUT, this study had hypothesised the moderating effects of farmers’ age, education, and experience on the relationships of ITA CAPs with PEX, EEX, and SIN. The effect size for the moderating influence of age and PEX on ITA CAPs is f2 = 0.002, moderating effect of age and EEX on ITA CAPs is f2 = 0.000, moderating effect of age and SIX on ITA CAPs is f2 = 0.001, moderating effect of farmers’ education and PEX on ITA CAPs is f2 = 0.003, moderating effect of farmers’ education and EEX on ITA CAPs is f2 = 0.002, moderating effect of farmers’ education and SIN on ITA CAPs is f2 = 0.001, and moderating effect of farmers’ experience and SIN on ITA CAPs is f2 = 0.003. The results reveal that H1M, H2M, H3M, H4M, H5M, H6M, and H9M have an insignificant effect. The result supports the moderating effect of the farmers’ experience on the effect of PEX (f2 = 0.036) on ITA CAPs, as suggested in H7M. The study provides support for H8M on the moderating effect of farmers’ experience on the effect of EEX (f2 = 0.032) on ITA CAPs. The use of ANN analysis had explored the hidden aspect of ITA from its exogenous constructs with the moderating effects of the farmers’ age, education, and farming experience. ITA significantly influenced by farmers’ age for FIN, TOE, POT, ENA, RTA, PEX, EEX, and SIN. Farmers with higher education and farming experience have more normalised importance for the exogenous constructs to ITA. Among the eight factors, PEX has the highest overall influence on ITA, followed by ENA, TOE, FIN, SIN, EEX, POT, and RTA.
The new understanding enables scholars to explore and predict the new direction of research based on the farmers’ personal characteristics that influence ITA. The result for RMSE, which is 0.931, is considered very accurate for the application due to the true values that are within this range {1,2,3,4,5}; thus, 0.931 is within the smallest detectable increment or decrement of 1. The second justifying reason is the nature of the data, which are from people’s subjective opinions. As a result, different people have different opinions for subjective descriptions, such as “agree” or “disagree”.

5.4. Use of CAPs

The effect of FCN on UOC was assessed in H9. The study findings show that FCN (f2 = 0.016) significantly affects the farmers’ behaviour and interest towards using CAPs [42]. Additionally, H10 had evaluated the impact of VOU on the use of CAPs and found that the effect of VOU (f2 = 0.009) significantly affected the formation of behaviour to use CAPs. Furthermore, H11 had assessed the impact of ITA CAPs on the use of CAPs and revealed that ITA CAPs (f2 = 0.067) significantly affected the use of CAPs [22,25]. The moderating effect of VOU and FCN on the use of CAPs evaluated in H10M. However, the moderating effect of VOU (f2 = 0.034) for the effect of FCN on the use of CAPs. The result shows that the availability of FCN reduces VOU and UOC. The findings in ANN analysis reveal the influence of ITA, FCN, and VOU on UOC. The normalised importance of ITA is more than FCN for different perceptions of VOU. The improved understanding of UOC charged to focus on ITA to improve the perception of FCN or VOU. Between the two factors, FCN has a higher overall influence on UOC than ITA. The results for ANN with RMSE of 0.764 were considered to be very accurate for this application due to the truth values from 1.0 to 5.0 and the increment of 0.2; thus, 0.764 is within the 4 increments out of 20.

5.5. Sustainable Farm Performance

The effect of the use of CAPs on SFP was assessed in H12. The findings show that UOC (f2 = 1.651) significantly affects SFP [1,10,14]. The study results reveal that CAPs have a sustainable impact on the farm. Therefore, these results can promote the adoption of CAPs and the sustainable future of agriculture. The third scenario evaluation of ANN reveals that SFP is well explained with UOC. The UOC provides three-tier benefits for the environment, yield, and financial level farm performance. The result for ANN reveals a RMSE of 0.644, which is considered very accurate for this application due to the truth values from 1.0 to 7.0 and the increment of 0.2; thus, 0.644 is within 4 increments out of 30.

6. Conclusions

This paper reported the effort to explain the influence on the use of CAPs on sustainable farm performance among Pakistani rice farmers. This paper investigated the development of the intention to adopt CAPs through farmer’s inclination factors with the attributes of CAPs using the UTAUT model. Additionally, it also explored the behaviour of CAPs usage affecting the adoption of CAPs, facilitating conditions, and farmers’ perceptions on the voluntariness of use. Moreover, it provided insights into sustainable farm performance from the use of CAPs. The results suggested that this framework has described the intention to adopt and use CAPs and sustainable farm performance.
At the end of this paper, a brief explanation of the policy implications is provided. First, we should recognise farmers’ attitudes towards the adoption of CAPs to enhance the adoption of CAPs and reduce the restrictive effects. Our study revealed that the success rate of the policy instruments in Pakistan is limited unless we can promote more positive attitudes towards CAPs. For instance, efforts to improve the performance expectancy and social influence for the use of CAPs have small effects when the farmers’ attitudes are unfavourable. The current extension staff in Pakistan has dealt with the technical details of the intensive farming practice, and there was a lack of effort towards implementing CAPs. Agriculture extension must incorporate CAPs in the literacy programmes that educate farmers on the use of CAPs to build their trust in the extension services. Although this study is useful, one should try to improve farmers’ attitudes towards these practices to influence farmers to adopt CAPs. This challenge needs more than technical help available from extension and peer farmers. The ease of use will never be very relevant. When more positive attitudes and various farmers’ attitudes need to be observed, variables such as mindfulness, hope, and association with local culture are important [69]. Furthermore, policy managers need to decrease the subsidy on inorganic fertilisers and use the same subsidy to enhance CAPs awareness and adoption [70]. This suggests that the subsidy should be given directly to the farmers to promote CAPs.
Although the practicality of agricultural, environmental programmes might motivate farmers to apply CAPs, they currently have not succeeded in improving farmers’ attitudes and internal motivations. The attitudes towards practices such as land levelling were promoted by the extension services and farmers then adopted them [10]. Awareness and observability can improve the motivation to adopt CAPs. Despite the land levelling subsidies provided by the government agencies, adoption seemed to remain at a low level. This highlights the challenges faced in raising awareness and executing programs for CAPs adoption. The extension role has to be enhanced, while farmers’ trust in the extension services demands improvement. Extension services refer to the cost for the public exchequer. The extension services should improve the knowledge and skills of the extension staff to assist farmers in implementing CAPs. Furthermore, farmers’ understanding of CAPs can enhance their intention to adopt CAPs. Extension staff should have skills in farm nutrient management, along with farm soil evaluations. These can reduce the unnecessary use of fertiliser and enhance farm productivity.
Some limitations and prospects for future work are worth mentioning. First, this study provides meaningful insights into the intention formation of farmers in adopting and using CAPs and sustainable farm performance. The use of farmer inclinations and UTAUT describes the underlying formation of the intention to adopt and use CAPs among farmers. Moreover, we suggest exploring the adoption of CAPs by incorporating the diffusion of innovation stages prescribed by Roger [21], such as awareness, initiation, and implementation for different CAPs. Second, the conclusions are drawn specifically for Pakistani rice farmers. Hence, the outcomes cannot be used to generalise the farming population of other countries and crops. However, the study model may be assessed using data gathered from other different countries. Third, the study outcomes revealed the use of the UTAUT model for agriculture on CAPs adoption. The use of UTAUT can enhance one’s understanding regarding technology adoption, along with its dynamic nature and effect of individual variances in light of technology adoption. The extension in UTAUT can enhance the predictive power of UTAUT. Additionally, the study findings suggest that the expectancies of technology need to be enhanced to garner better understanding of the intention formation of technology adoption and further use of the technology. The expectancies postulated by UTAUT can be applied to examine the use of technology (i.e., CAPs) [71].
The predictive-analytic (i.e., SEM-ANN) analysis for this study empowers us to explore ITA, UOC, and SFP with a relatively new approach [64]. This approach extends the existing literature on CAPs adoption with the farm level advantages for sustainable farm performance. The personal capacities and CAPs attributes can influence ITA in the normalised importance approach. This approach is different from the existing beta coefficient-based SEM analysis [67]. This new approach paves the way for a paradigm shift to focus on the non-linear causal relationship between the exogenous and endogenous constructs in having a moderator or mediator [63]. The non-linearity of the relationship describes the everyday phenomenon that mostly uses the linearity methods of analysis.
These issues have broader implications for the sustainability of agriculture based on the social and ecological system. Fulfilling the farmers’ knowledge gap towards CAPs can help them to adopt and implement CAPs for sustainable agriculture production. As a result, the world can move forward and achieve SDGs. Improving farmers’ environment attitudes and the provision of facilitating conditions can facilitate the achievement of a sustainable food system. Moreover, farmers need to incorporate their knowledge for the sustainability of the globe. These findings can help develop future adoption strategies to provide sustainable agriculture for the future.

Author Contributions

N.H., N.A.M.N. and N.B.C.N. focused on the conceptualisation, methodology, resources, and writing—original draft preparation, G.S. and Q.S.G. focused on the conceptualisation, methodology, and ANN analysis, A.A.M. focused on the conceptualisation, methodology, supervision, and writing—review and editing. All authors have read and agreed to the published version of the manuscript.

Funding

This research received no external funding.

Conflicts of Interest

The authors declare no conflict of interest.

Appendix A. Analysis Using Artificial Neural Network (ANN)

Appendix A.1. Preliminaries

ANN is based on the replication of the biological nerve cells of the human brain [20]. According to Samarasinghe [63], even a simple structure of ANN, such as a two-stage ANN, can deliver accurate results in many fields. In the system of a two-stage ANN, all x i , o k , and y j are called nodes, whereas all w i , k and v k , j are called synaptic weights [64]. In analogy to the growth of human neurons, all w i , k and v k , j start with a uniform value (or some trivial values given by the user), which increase or decrease in magnitude as the program learns about the relationship across all the variables in the data through the deep learning algorithm.
For its structure, ANN considers the complication associated with human decision-making, which works well with a non-compensatory manner for linear and non-linear datasets [63]. It has a considerable improvement compared to standalone SEM, which is only suitable for a linear relationship that generalises the complex relationship between the variables in the real world.
In this paper, we generated the two-stage ANN for the following three scenarios:
  • Prediction of the intention to use CAP through various criteria.
  • Prediction of the actual use of CAP through the intention to use CAP and other criteria.
  • Prediction of environmental performance, financial performance, and yield performance as a result of the actual use of CAP.
According to Radman and Abdelrahman (2004), all intermediate nodes o k in ANN are related to the input nodes x i by the following formula:
o k = α = 1 n w α , k x α   for   all   k = 1 , 2 , , m
All the output nodes y j in ANN are related to intermediate nodes o k by the following formula:
y j = r ( α = 1 m v α , j o α )   for   all   j = 1 , 2 , , p
where r(x) denotes the rounding up of x to the nearest value (such as the nearest integer or the nearest 0.2) in alliance with the format of the actual values in the dataset.
In all the three scenarios, all the synaptic weights w i , k and v k , j are thus to be deduced (i.e., “learned”) through the deep learning algorithm, such that the output from the ANN:
y 1 , y 2 , , y p
forms the most accurate predictions for the true values:
t 1 , t 2 , , t p .
across all the 336 input patterns in the dataset.
In the context of this application, p can be in different sizes. Thus, it has to be considered when justifying the errors between y = ( y 1 , y 2 , , y p ) and t = ( t 1 , t 2 , , t p ) , which represents a entire factor, such as “actual use of CAPs.”
The conventional measurement of “vector distance” between y and t, characterized by the formula = j = 1 p ( y j t j ) 2 , are not used as a measurement of error between y and t . This is because in the context of this paper, y 0 = ( 1.1 , 1.1 , , 1.1 10000   t e r m s ) is regarded as much closer to t 0 = ( 1.0 , 1.0 , , 1.0 10000   t e r m s ) compared to y 1 = (5) to t 1 = (1), simply because 1.1 is closer to 1.0 whereas 5.0 is further away from 1.0, even though the conventional formula d = j = 1 p ( y j t j ) 2 yields 10 for the former and 4 for the latter.
Thus, the error between y = ( y 1 , y 2 , , y p ) and t = ( t 1 , t 2 , , t p ) is calculated as follows:
E = 1 p j = 1 p ( y j t j ) 2
The accuracy across all the 336 inputs in the dataset is measured using two different formulas as highlighted below:
(a) 
Sum of Square of Errors (SSE)
SSE = ν N ( 1 p j = 1 p ( y ( ν ) j t ( ν ) j ) 2 )
(b) 
Root Mean Square Error (RMSE)
RMSE = 1 | N | ν N ( 1 p j = 1 p ( y ( ν ) j t ( ν ) j ) 2 )
where N denotes all the 336 input patterns of our dataset.
Furthermore, the measurement of percentage error is also considered unsuitable because the feedback from the questionnaires is not at the ratio level of measurement. For example, we cannot deduce that the feedback of “agree” (correspond to number 4) is twice as much as the feedback of “slightly agree” (correspond to number 2).
The average synaptic weight and relative sensitivity for each criterion of the input are also calculated for each of the three scenarios.
We now proceed to describe the structure of the ANN for the three scenarios.

Appendix A.2. Structure of the ANN for the First Scenario

In this scenario, the output is ITA which is reflected by the following four feedbacks from the questionnaire:
  • I plan to use CAPs during the next cropping season. (notation: A 1 )
  • CAPs are good to use. (notation: A 2 )
  • I am likely to use CAPs. (notation: A 3 )
  • I frequently thought about using CAPs. (notation: A 4 )
All these feedbacks have integer values from 1 to 5, representing the 5 possible outcomes as follows:
(1) for “not agree”, (2) for “slightly agree”, (3) for “partially agree”, (4) for “agree”, (5) for “strongly agree”.
As for the input, there are altogether eight factors: FIN, TOE, POT, ENA, RTA, PEX, EEX, and SIN.
FIN is reflected by the following five feedbacks from the questionnaire:
  • I like to experiment with new technologies. (notation: M 1 )
  • I like to try new things. (notation: M 2 )
  • I improvise the methods for solving problems frequently. (notation: M 3 )
  • I openly accept new ways of thinking. (notation: M 4 )
  • I am interested in using new ways of farming. (notation: M 5 )
TOE is reflected by the following five feedbacks from the questionnaire:
  • Agriculture extension services are important sources of information. (notation: N 1 )
  • Extension services are a trustworthy source of information related to farming practices. (notation: N 2 )
  • Extension services are a secure system of information for farmers. (notation: N 3 )
  • Extension services are dependable. (notation: N 4 )
  • Users can easily access extension services. (notation: N 5 )
POT is reflected by the following four feedbacks from the questionnaire:
  • It is important to receive the highest possible prices of agriculture products. (notation: P 1 )
  • It is essential to make the most substantial possible profit from our farming practices. (notation: P 2 )
  • It is essential to try new ways to increase profit. (notation: P 3 )
  • The profit margin keeps the interest in farming. (notation: P 4 )
ENA is reflected by the following five feedbacks from the questionnaire:
  • I am willing to reduce consumption to protect the environment. (notation: Q 1 )
  • I am interested in giving my money to help protect wild animals. (notation: Q 2 )
  • Significant political changes are required to protect the environment. (notation: Q 3 )
  • Significant social changes are required to protect the environment. (notation: Q 4 )
  • Humans are severely abusing the environment. (notation: Q 5 )
RTA is reflected by the following four feedbacks from the questionnaire:
  • Before applying different farming practices, the practices need to be tested on other farms. (notation: R 1 )
  • It is important to be attentive when adopting new farming ways. (notation: R 2 )
  • It is important to avoid risky options in farm decision-making. (notation: R 3 )
  • Farm investment decision requires careful consideration. (notation: R 4 )
PEX is reflected by the following four feedbacks from the questionnaire:
  • CAPs are useful in farming. (notation: S 1 )
  • Using CAPs permits farmers to accomplish tasks on time. (notation: S 2 )
  • Using CAPs helps to increase farm productivity. (notation: S 3 )
  • Overall, CAPs are effective farming practices. (notation: S 4 )
EEX is reflected by the following four feedbacks from the questionnaire:
  • It would be easy to become skilful in using CAPs. (notation: T 1 )
  • CAPs are easy to use. (notation: T 2 )
  • Learning to work with CAPs is easy. (notation: T 3 )
  • Working with CAPs is flexible. (notation: T 4
SIN is reflected by the following four feedbacks from the questionnaire:
  • Influencing people around think using CAPs is a must. (notation: U 1 )
  • The important people around me think that using CAPs is good. (notation: U 2 )
  • In general, support is available from the community to use CAPs. (notation: U 3 )
  • Using CAPs is associated with high profile farmers. (notation: U 4 )
Likewise, all these feedbacks have integer values from 1 to 5, representing the same kind of outcomes as the feedbacks for the input: 1 for “not agree”, 2 for “slightly agree”, 3 for “partially agree”, 4 for “agree”, 5 for “strongly agree”.
In addition, there are another four mediating factors as follows:
  • Age (notation: Λ 1 ): 1 = below 20, 2 = 20-29, 3 = 30-39, 4 = 40-49, 5 = 50-59, 6 = 60-69, 7 = 70 or over.
  • Formal schooling (notation: Λ 2 ): 1 = 1-5 years, 2 = 6-10 years, 3 = college degree, 4 = university degree.
  • Years of farming experience (notation: Λ 3 ): 1 = 1-4 years, 2 = 5-10 years, 3: 11-15 years, 4 = 16-20 years, 5 = above 20 years.
  • Years of CAPs farming experience (notation: Λ 4 ): 1 = 1-2 Years, 2 = 3-5 years, 3 = 6-10 years, 4 = above 10 years.
The information for each feedback needs to be fully preserved for every factor on concern. For instance, scoring 4 on B 1 and 2 on B 2 , will have the two numbers add up to 6, but that must be regarded as a distinct scenario from scoring 3 on both B 1 and B 2 , even if those latter numbers add up to 6 as well.
Therefore, take A = ( A 1 A 2 A 3 A 4 ) to represent all the feedbacks for ITA. Likewise, take M = ( M 1 M 2 M 3 M 4 M 5 ) , N = ( N 1 N 2 N 3 N 4 N 5 ) , P = ( P 1 P 2 P 3 P 4 ) , Q = ( Q 1 Q 2 Q 3 Q 4 Q 5 ) , R = ( R 1 R 2 R 3 R 4 ) , S = ( S 1 S 2 S 3 S 4 ) , T = ( T 1 T 2 T 3 T 4 ) , and U = ( U 1 U 2 U 3 U 4 ) , to represent all the feedbacks for FIN, TOE, POT, ENA, RTA, PEX, EEX, and SIN, respectively. We also denote Λ = ( Λ 1 Λ 2 Λ 3 Λ 4 ) for the four mediating factors.
Our aim in this scenario is to generate the best two-stage ANN using the deep learning algorithm to predict A from M , N , P , Q , R , S , T , U , and Λ . There is one extra input node that is always taken to be the constant 1.
Hence, there are 40 input nodes, x 1 to x 40 ; and four output nodes, y 1 to y 4 . The number of intermediate nodes is chosen to be 16 considering the calibre of our workstation as highlighted in Section 3.6; hence, we have o 1 to o 16 .

Appendix A.3. Structure of the ANN for the Second Scenario

In this scenario, UOC is directly described by γ , a number from 1.0 to 5.0 in the increment of 0.2 under the column of “Use_of_CAPs.”
FCN is reflected by the following five feedbacks from the questionnaire:
  • Your family thinks that you should practice environmentally friendly behaviour. (notation: F 1 )
  • Your friends think that you should practice environmentally friendly behaviour. (notation: F 2 )
  • You value the opinion and feelings of your family on your environmentally friendly behaviour. (notation: F 3 )
  • You value the opinion and feelings of your friends on your environmentally friendly behaviour. (notation: F 4 )
  • Your family thinks that you should consume environment-friendly products. (notation: F 5 )
The mediating factor of concern is the voluntariness of use (notation: V ), which is reflected by the following three feedbacks from the questionnaire:
  • You are motivated to practice an environmentally friendly lifestyle. (notation: V 1 )
  • Your personal philosophy is to do anything to practice an environmentally friendly lifestyle. (notation: V 2 )
  • You want to promote an environmentally friendly lifestyle for others. (notation: V 3 )
Like first scenario, all these feedbacks have integer values from 1 to 5.
As all the information for each feedback needs to be preserved as well, take F = ( F 1       F 2       F 3       F 4       F 5 ) to represent all the feedbacks for FCN, and take V = ( V 1       V 2       V 3 ) for the three mediating factors.
Our aim in this scenario is to generate the best two-stage ANN to predict γ from F , V , and A (see Appendix A.1) using the deep learning algorithm. There is one extra input node that is always taken to be the constant 1.
Hence there are 13 input nodes, x 1 to x 13 ; and 1 output node, y 1 . The number of intermediate nodes is chosen to be 16 considering the calibre of our workstation as highlighted in Section 3.6; hence, we have o 1 to o 16 .

Appendix A.4. Structure of the ANN for the Third Scenario

The environmental performance (EP) is reflected by the following six feedbacks from the questionnaire:
  • Usage of CAPs reduces the use of inorganic fertiliser in the farm. (notation: G 1 )
  • Usage of CAPs reduces water waste in the farm. (notation: G 2 )
  • Usage of CAPs reduces solid waste in the farm. (notation: G 3 )
  • Usage of CAPs decreases the consumption of pesticides in the farm. (notation: G 4 )
  • Usage of CAPs decreases the use of machines that run on petrol. (notation: G 5 )
  • Usage of CAPs decreases the frequency of accidents in the farm. (notation: G 6 )
The yield performance (YP) is reflected by the following six feedbacks from the questionnaire:
  • Usage of CAPs increases the rice yield per hectare. (notation: H 1 )
  • Usage of CAPs increases my farm’s income. (notation: H 2 )
  • Usage of CAPs improves farm’s fertility. (notation: H 3 )
  • Usage of CAPs restores farm’s nutrients. (notation: H 4 )
  • Usage of CAPs reduces soil erosion. (notation: H 5 )
  • Usage of CAPs improves soil aggregation for the farm. (notation: H 6 )
The financial performance (FP) is reflected by the following six feedbacks from the questionnaire:
  • Improve farm capacity utilisation. (notation: K 1 )
  • Decrease the water cost for farming. (notation: K 2 )
  • Decrease the labour cost for farming. (notation: K 3 )
  • Decrease the energy cost for farming. (notation: K 4 )
  • Improve the efficiency in the farm. (notation: K 5 )
  • Increase the farm’s profitability. (notation: K 6 )
All these feedbacks take a number from 1.0 to 7.0 inclusive, in the increment of 0.2.
As all the information for each feedback needs to be preserved as well, take G = ( G 1       G 2       G 3       G 4       G 5       G 6 ) to represent all the feedbacks for EP, take H = ( H 1       H 2       H 3       H 4       H 5       H 6 ) to represent all the feedbacks for YP, and take K = ( K 1       K 2       K 3       K 4       K 5       K 6 ) to represent all the feedbacks for FP.
Our aim in this scenario is to generate the best two-stage ANN to predict G , H , and K based on γ (see Appendix A.1) using the deep learning algorithm. There is one extra input node that is always taken to be the constant 1.
Hence, there are two input nodes, x 1 to x 2 ; and 18 output nodes, y 18 . The number of intermediate nodes is chosen to be 36 considering the calibre of our workstation as highlighted in Section 3.6; hence, we have o 1 to o 36 .

Appendix A.5. The Calibre of the Workstation

In harnessing the power of modern GPU computing for ANN’s deep learning algorithm, we used C++ (from visual studio community 2019) with CUDA extension (version 10.1) running on a dedicated workstation equipped with Nvidia RTX 2080 Ti (GPU) and AMD Ryzen Threadripper 3970X (CPU).
Table A1. Outer Loading and Cross Loadings.
FINTOEPOENARTAPEXEEXSINFCNVOUBIAUOCFSP
FIN-Item 10.8060.2730.3590.4130.2670.2670.0860.1990.2780.4310.2760.296−0.263
FIN-Item 20.7890.2900.2560.4000.3560.2750.3530.2240.3030.2390.2430.263−0.191
FIN-Item 30.8220.2390.2710.3030.3290.2940.3900.1240.2570.2180.1800.2980.019
FIN-Item 40.8090.2140.3460.4320.4590.2700.3770.1610.3020.1800.1190.2730.026
FIN-Item 50.0770.2170.3120.2270.4030.2640.369−0.092−0.0740.2700.1400.2600.125
TOE-Item 10.2480.7850.1690.3540.3930.2790.396−0.0450.0290.3130.1420.3030.152
TOE-Item 20.2600.7380.1700.2270.3120.3030.423−0.087−0.0470.3400.3430.2710.201
TOE-Item 30.1770.6850.2050.2720.3650.3060.3760.1230.3290.2940.2880.2510.094
TOE-Item 40.1850.7500.3590.3830.3520.2780.3680.0560.2830.2550.3890.1950.136
TOE-Item 50.3330.6850.2560.1370.3230.2310.3290.1410.2890.2780.3090.2590.240
POT-Item 10.3630.3320.8410.1060.3520.2310.6480.0900.4000.0420.2530.2870.097
POT-Item 20.3350.2950.7620.0920.4280.2730.6860.0880.4090.0930.2070.348−0.002
POT-Item 30.3050.2790.7060.1510.3080.0340.793−0.0270.3500.1050.2020.2530.098
POT-Item 40.3910.2720.6850.1670.4140.0390.7830.0700.4130.1120.3110.1910.046
ENA-Item 10.2150.3950.3520.6630.249−0.0330.2050.1250.3060.0820.3730.158−0.184
ENA-Item 20.2870.3640.2790.7920.4010.0720.2190.2220.4150.0690.3710.133−0.067
ENA-Item 30.4100.3910.2600.7080.4050.0740.158−0.2090.3390.3810.2240.0980.014
ENA-Item 40.2690.3650.2950.6510.1540.0990.142−0.2070.2530.3560.1960.0930.155
RTA-Item 10.2070.2700.3000.4370.6890.0010.2170.1550.2830.3380.1670.1030.165
RTA-Item 20.2100.2330.2610.3370.7650.3570.3330.2520.3000.2640.1910.431−0.012
RTA-Item 30.1990.2170.2480.3820.6920.1910.1030.1990.3250.2410.1760.2390.041
RTA-Item 40.1510.3370.2470.4410.7350.1680.0930.2240.3310.1940.1910.2180.221
PEX-Item 10.1630.2660.2570.1330.3250.7380.1800.1240.3650.2490.2910.1800.059
PEX-Item 20.1920.1900.2080.1400.2670.7730.2700.1610.1870.2390.3710.270−0.045
PEX-Item 30.3500.1890.1680.1170.2190.7530.218−0.0920.1570.1910.3240.3130.090
PEX-Item 40.2820.1570.3010.0500.3450.6980.191−0.0450.1570.2230.3410.3400.036
EEX-Item 10.2530.1080.3520.0220.4730.2640.648−0.0870.1400.2550.3620.2940.176
EEX-Item 20.1380.1130.1810.0830.5420.2370.6860.1230.1150.2960.2130.2550.041
EEX-Item 30.2920.1540.2190.3290.4650.3600.7930.0560.1420.3120.1720.2780.101
EEX-Item 40.2480.3210.1980.4100.4200.3650.7830.1410.4000.2800.1540.0420.062
SIN-Item 10.2600.3910.1610.3230.3670.3750.2050.8350.4090.3030.1870.0930.789
SIN-Item 20.1770.2410.1980.2430.3250.4540.2190.7430.3500.2640.2660.1050.110
SIN-Item 30.1850.2220.2290.3280.2370.4020.1580.8220.4130.2140.1200.1120.066
SIN-Item 40.3330.2900.1600.3340.4030.3940.1420.8240.3060.3680.1560.0820.072
FCN-Item 10.3630.3720.3070.3520.4170.3040.1300.2300.6230.2060.1950.069−0.263
FCN-Item 20.3350.3930.1920.3920.0480.3960.1400.2340.7750.2350.1910.381−0.191
FCN-Item 30.3050.3880.2110.3630.0460.3770.3870.2560.7250.2470.1190.3560.019
FCN-Item 40.3910.3840.1770.4560.0230.4710.3490.2620.6890.2740.1180.3380.026
FCN-Item 50.2150.4570.359−0.003−0.0220.4550.2590.2810.7730.4310.2310.2640.125
VOU-Item 10.2870.0640.2560.008−0.0180.2280.2860.2090.4000.7810.2810.2410.152
VOU-Item 20.4100.1010.2710.0620.0260.2510.3260.1560.4090.8190.2300.1940.201
VOU-Item 30.2690.1180.3460.0890.3580.2360.2490.2480.3500.7910.3280.2960.094
ITA-Item 10.2070.1190.3120.0080.3600.2030.3410.1710.4130.2960.8030.2630.136
ITA-Item 20.2100.0650.1690.0220.2850.1510.3620.2340.3060.2630.8490.2980.240
ITA-Item 30.1990.0860.1700.4760.2000.2120.3680.2250.4150.2980.8170.2730.097
ITA-Item 40.1510.3330.2050.4290.2380.4310.3450.2980.3390.2730.8700.260−0.002
UOC-Item 10.1630.3630.2310.3820.3570.3210.0940.2860.2530.2600.2641.0000.098
SFP-Item 10.1920.3390.1540.3570.3990.2580.1060.1500.2830.3030.2370.3520.931
SFP-Item 20.3500.3760.1390.3160.4340.2150.1550.1570.3000.2710.3600.2790.942
SFP-Item 30.2820.3660.2790.2790.3650.3120.1540.1540.3250.2510.3650.2600.943
SFP-Item 40.2530.2650.2870.2060.3890.3880.0830.1550.3310.1950.3750.2950.953
SFP-Item 50.1380.2410.2180.301−0.0660.3740.1100.1450.3650.2590.4540.3000.948
SFP-Item 60.2920.3820.2830.520−0.0380.3990.4500.1860.1870.2870.4020.2610.950
Fornell & Larker criterion
FIN0.801
TOE0.5050.730
POT0.3910.4190.751
ENA0.4810.5060.3680.709
RTA0.4840.4610.7210.6500.721
PEX0.4980.4810.4990.5510.4990.741
EEX0.4140.3640.4780.5370.4780.5820.730
SIN0.2990.2850.2860.2980.2680.4490.3590.807
FCN0.3780.4140.4050.4610.4050.4370.4510.3490.719
VOU0.3690.3540.3090.3670.3370.4460.3930.3560.3810.797
ITA0.2580.3520.3550.4220.3460.3710.4460.2950.4700.3390.835
UOC0.3540.3760.3580.3320.2340.4140.3450.3560.3180.2740.3931.00
SFP0.1660.7890.1900.049−0.0140.1800.1340.1450.1240.1020.1650.7890.952
HTMT Ratio table
FIN
TOE0.578
POT0.4820.544
ENA0.5900.6340.496
RTA0.6220.6150.5880.882
PEX0.6200.6250.7320.4960.685
EEX0.5160.4580.4820.7360.6800.806
SIN0.3510.3510.4620.3830.3870.5810.467
FCN0.4520.5230.3870.5820.5320.5660.6030.438
VOU0.5040.4630.4720.4900.4720.6160.5480.4640.504
ITA0.2900.4060.4460.5060.4390.4510.5500.3370.5810.434
UOC0.3830.4210.4160.3780.2730.4700.4190.3470.3550.3220.421
SFP0.1770.1730.2200.0770.1810.2020.1780.1540.1390.1210.1730.789
Note: FIN: Farmer’s Innovativeness; TOE: Trust on Extension; POT: Profit Orientation; ENA: Environmental Attitude; RTA: Risk-taking Attitude; PEX: Performance Expectation; EEX: Effort Expectancy; SIN: Social Influence; FCN: Facilitating Conditions; VOU: Voluntariness of Use; ITA: Intention to adopt CAPs; UOC: Use of CAPs; SFP: Sustainable Farm Performance.
Table A2. First Scenario.
FeedbackM1M2M3M4M5N1N2N3N4N5P1P2P3P4Q1Q2Q3Q4Q5R1
w a , b a b1234567891011121314151617181920
10.1500.044−0.233−0.024−0.0290.1310.108−0.039−0.0790.0380.1750.020−0.140−0.0190.0060.2590.030−0.0110.038−0.093
20.0890.041−0.068−0.0450.0440.0510.083−0.0050.010−0.0040.0160.0350.085−0.0360.0510.0980.060−0.031−0.0610.035
30.040−0.0430.0280.0450.0200.063−0.0180.0980.033−0.0600.0430.0040.091−0.003−0.0030.1230.000−0.0300.0210.031
40.1490.009−0.153−0.0300.0480.0750.135−0.071−0.0400.0430.174−0.020−0.038−0.0300.0510.1940.011−0.009−0.1430.058
50.090−0.0700.0350.0030.0040.0490.180−0.1030.065−0.0200.0050.0310.091−0.0280.0250.0400.0150.085−0.001−0.034
60.0860.026−0.053−0.0180.0300.0430.0830.030−0.0180.0080.0980.013−0.0380.0050.0080.0430.0900.0380.0200.028
70.103−0.013−0.061−0.0760.0500.1600.0730.061−0.086−0.0130.053−0.0400.128−0.0930.0830.1680.006−0.104−0.0200.118
80.083−0.034−0.031−0.003−0.0130.0800.150−0.0430.060−0.0350.0380.0100.110−0.0500.0180.1280.023−0.0130.0200.002
90.105−0.008−0.025−0.0350.0600.0380.095−0.0080.0050.0080.0800.005−0.0050.0100.0230.0930.035−0.003−0.0100.048
100.0480.002−0.018−0.0380.0300.0930.1100.0020.005−0.0280.0150.0380.090−0.0400.0530.0680.0650.0050.018−0.025
11−0.003−0.0130.0050.1030.0070.0380.0830.0250.013−0.0330.0400.0250.0930.005−0.0230.133−0.0800.045−0.0230.010
120.115−0.003−0.010−0.0700.0130.0250.123−0.0130.0130.0100.093−0.018−0.0080.0150.0430.0380.0600.0400.0100.023
130.068−0.0280.013−0.0100.0330.0550.0850.0200.023−0.0380.0250.0250.093−0.0330.0080.1000.040−0.0080.040−0.013
140.0950.007−0.0200.0350.015−0.0030.070−0.0230.0180.0430.0600.0100.0050.058−0.0200.070−0.0200.090−0.0430.010
150.040−0.003−0.0100.0100.0180.1000.0450.0300.023−0.0330.0130.0930.028−0.0250.0000.0350.100−0.0350.0550.038
160.0000.103−0.045−0.0330.0000.0780.1000.008−0.0450.0330.0280.0230.110−0.0330.0250.165−0.025−0.003−0.0350.020
FeedbackR2R3R4S1S2S3S4T1T2T3T4U1U2U3U4Λ1Λ2Λ3Λ41
w a , b a b2122232425262728293031323334353637383940
10.058−0.0780.105−0.1490.161−0.0730.193−0.0910.1250.0530.066−0.061−0.0690.1600.041−0.0690.1190.038−0.1680.284
20.078−0.0580.095−0.0450.108−0.0210.114−0.0760.0440.0540.059−0.024−0.0410.1030.040−0.0230.0730.046−0.0710.128
30.0530.0030.050−0.0300.028−0.0140.089−0.0280.1100.0300.0280.035−0.065−0.0200.133−0.0100.0430.015−0.0150.103
40.133−0.0880.153−0.0660.075−0.0640.210−0.1400.0460.0040.1300.008−0.0600.1140.038−0.0410.0880.011−0.0740.185
50.073−0.0150.0480.0180.088−0.0680.103−0.0130.0150.0380.043−0.0090.0110.0700.0280.0080.0330.065−0.1130.201
60.028−0.0550.085−0.0500.048−0.0180.128−0.0680.098−0.0490.1110.065−0.0450.0630.0180.0000.0580.023−0.0300.098
70.060−0.0150.118−0.1280.064−0.0640.0040.0640.1050.0330.0480.020−0.0500.0230.085−0.0080.0400.040−0.0460.123
80.043−0.0100.0300.0130.070−0.0530.128−0.0350.0180.0480.070−0.018−0.0650.0830.100−0.0250.0280.095−0.0900.115
90.043−0.0130.068−0.0180.058−0.0200.065−0.0100.060−0.0130.0730.058−0.0430.0230.068−0.0030.0330.023−0.0250.103
100.048−0.0400.0580.035−0.0050.0080.125−0.0330.0330.0580.043−0.0530.0150.0430.100−0.0150.0530.070−0.0950.113
110.0680.0500.060−0.0430.088−0.1000.130−0.0500.0450.0730.095−0.013−0.068−0.0230.180−0.008−0.0480.053−0.0180.123
120.010−0.0350.0800.0200.0300.0350.088−0.0600.0130.0080.1100.020−0.0100.108−0.023−0.0230.0700.053−0.1680.295
130.040−0.0030.0500.0080.025−0.0050.083−0.0050.0430.0480.038−0.033−0.0130.0730.0500.0030.0380.050−0.0530.120
140.0480.0080.085−0.0400.093−0.0330.105−0.013−0.023−0.0100.1200.050−0.0150.0580.007−0.0020.0230.043−0.0730.168
150.043−0.0350.0020.075−0.003−0.0050.090−0.0300.0980.0400.0200.000−0.0300.1080.008−0.0050.0700.038−0.0630.120
160.070−0.0350.113−0.0430.060−0.0800.113−0.0150.0680.0650.050−0.005−0.0580.1150.018−0.0150.0330.035−0.0330.110
Feedback v b , c b c12345678910111213141516
A110.0190.0880.1190.1310.325−0.6060.1940.375−0.263−0.0190.456−0.0940.275−0.231−0.0190.219
A220.081−0.2000.2060.300−0.2500.1380.188−0.0190.2310.0880.025−0.0630.125−0.1190.2690.013
A330.1880.200−0.2380.100−0.0440.1880.0310.213−0.2750.519−0.2940.1810.219−0.3250.344−0.025
A440.1380.175−0.1630.175−0.1060.2250.088−0.1060.2880.038−0.0310.175−0.2000.344−0.1560.156
Sample Size, N = 336
SSE = 291.25
RMSE = 0.931
Average Synaptic Weight = 0.01805
Relative Sensitivity of 8 Factors
FINTOEPOTENARTAPEXEEXSIN
0.7060.8320.6000.9190.5611.0000.6070.621
Table A3. Second Scenario.
FeedbackF1F2F3F4F5V1V2V3A1A2A3A41
w a , b a b1234567812345
10.090−0.0500.293−0.1600.190−0.0430.3270.0370.300−0.3420.325−0.0850.346
20.285−0.0810.149−0.3840.646−0.276−0.0580.3550.344−0.4550.623−0.1520.925
3−0.048−0.0500.360−0.5800.458−0.1450.1870.2030.454−0.5020.350−0.0260.288
40.0690.0450.1380.0240.1010.0070.1160.0910.135−0.0050.1470.0020.162
50.0770.0770.0540.0770.1000.0690.0920.0690.0920.0310.0920.0770.232
6−0.061−0.0320.234−0.0280.096−0.0210.2310.0640.154−0.0910.1840.0330.181
70.0410.0760.1150.0400.1090.0540.0910.0850.1250.0290.0920.0620.206
80.0770.0160.0880.0150.1280.0490.1040.0760.1130.0320.0940.0620.133
90.1150.0310.0460.1770.0170.0770.0770.0750.0850.0690.0770.0770.189
100.0300.0580.0960.0330.1150.0440.1080.0830.0920.0500.0770.0620.196
110.0520.0630.1040.0020.1170.0370.1040.0790.0990.0360.0880.0870.104
120.0770.0770.0770.0920.0770.0620.0690.0770.0770.0770.0770.0770.138
130.0580.0650.0850.0580.0880.0730.0810.0770.0770.0770.0770.0770.077
140.0770.0770.0770.0770.0770.0770.0770.0770.0770.0770.0770.0770.105
150.0560.0770.0850.0690.0770.0690.0920.0730.0920.0580.0790.0690.237
160.1400.0830.0800.1210.0520.191−0.0450.1330.0010.248−0.0550.1130.000
Feedback v b , c b c12345678
γ10.0190.0880.1190.1310.325−0.6060.1940.375
Feedback v b , c b c910111213141516
γ1−0.263−0.0190.456−0.0940.275−0.231−0.0190.219
Sample Size, n = 336
SSE = 196.04
RMSE = 0.764
Average Synaptic Weight = 0.08331
Relative Sensitivity of Two Factors
FCNITA
1.0000.809
Table A4. Third Scenario.
Feedbackγ1 Feedbackγ1 Feedbackγ1 Feedbackγ1 Feedbackγ1
w a , b a b12 w a , b a b12 w a , b a b12 w a , b a b12 w a , b a b12
10.6500.900 80.7000.700 150.7000.700 220.7000.700 290.7000.300
20.6501.100 90.7000.700 160.7000.700 230.6000.750 300.7000.700
30.6000.900 100.7000.700 170.7000.700 240.8000.650 310.7000.700
40.7000.700 110.7000.700 180.7000.700 250.7000.700 320.7000.700
50.7000.700 120.7000.700 190.7000.700 260.7000.700
60.7000.700 130.7000.700 200.7000.700 270.7000.700
70.7000.700 140.7000.700 210.7000.700 280.7000.300
Feedback v b , c b c123456789101112131415161718
G110.156−0.1250.0750.0600.0400.0360.0440.0420.0330.0330.0390.0390.0390.0390.0390.0390.0390.036
G220.0530.0280.0130.0750.0310.0490.0280.0360.0390.0390.0390.0390.0390.0390.0360.0330.0440.042
G330.0460.0310.0390.0380.0390.0390.0390.0280.0470.0390.0390.0500.0280.0390.0390.0390.0390.039
G440.0310.0470.0500.0310.0360.0390.0390.0390.0390.0390.0390.0390.0390.0390.0390.0390.0390.039
G550.0310.0470.0320.0460.0390.0390.0390.0390.0390.0390.0390.0390.0390.0390.0390.0390.0390.039
G660.0330.0440.0500.0280.0390.0390.0390.0500.0250.0420.0390.0390.0440.0360.0390.0330.0390.039
H170.0180.1110.0640.0130.0390.0390.0390.0420.0360.0390.0390.0390.0390.0390.0390.0390.0390.039
H280.0040.1500.181−0.1260.0420.0390.0390.0390.0390.0390.0390.0390.0390.0390.0390.0440.0330.033
H390.0000.2000.122−0.1190.0430.0400.0390.0360.0390.0390.0390.0390.0390.0390.0390.0390.0420.042
H4100.0250.1060.206−0.1170.0440.0310.0440.0360.0390.0360.0390.0390.0390.0390.0390.0390.0390.039
H5110.0330.0470.0360.0420.0390.0360.0400.0400.0390.0360.0390.0390.0390.0390.0390.0390.0390.039
H6120.0690.0610.0190.0580.0390.0390.0390.0390.0390.0390.0390.0390.0390.0390.0390.0280.0500.039
K1130.0580.0810.156−0.0690.0360.0330.0420.0360.0420.0360.0390.0390.0390.0390.0390.0360.0390.039
K2140.0330.0500.0310.0420.0390.0390.0390.0390.0390.0390.0390.0390.0390.0390.0390.0390.0390.039
K3150.0330.0470.0360.0390.0390.0390.0390.0390.0390.0390.0390.0390.0390.0390.0440.0330.0440.033
K4160.0190.1330.075−0.0190.0390.0390.0390.0360.0420.0390.0390.0390.0390.0390.0390.0360.0420.039
K517−0.0580.2360.175−0.008−0.036−0.0280.0390.0390.0390.0390.0390.0390.0390.0390.0360.0330.0440.042
K618−0.0170.1470.089−0.0140.0390.0390.0500.0360.0330.0360.0440.0420.0360.0330.0420.0390.0390.036
Feedback v b , c b c192021222324252627282930313233343536
G110.0390.0390.0390.089−0.0780.144−0.0220.033−0.1150.2150.210−0.1150.0640.0580.067−0.3170.0150.315
G220.0390.0390.0390.0390.0390.0390.0390.0390.0380.0380.0330.0440.0390.0360.068−0.0420.0380.053
G330.0360.0390.0360.0390.0390.0390.0390.0390.0360.0360.0330.0390.0330.0360.0000.1030.0040.026
G440.0390.0390.0390.0390.0390.0390.0330.0390.0380.0430.0330.0440.0390.0430.0210.0310.0400.018
G550.0390.0390.0390.0390.0390.0390.0330.0390.0460.0320.0330.0440.0390.0470.0080.0390.0420.017
G660.0390.0390.0330.0390.0390.0390.0360.0330.0500.0280.0330.0440.0440.0560.0060.0500.0280.017
H170.0390.0390.039−0.0110.156−0.0670.1000.0390.0830.033−0.0110.0440.0380.0170.0060.1040.0130.010
H280.0440.0390.039−0.0470.239−0.1420.1420.0390.111−0.042−0.0330.1030.038−0.0060.0190.1210.015−0.001
H390.0390.0330.039−0.0220.194−0.1000.1060.0390.0890.069−0.1420.1220.036−0.0190.0220.167−0.0180.004
H4100.0380.0360.042−0.0350.214−0.1190.1440.0190.106−0.036−0.0390.1080.0400.0220.0080.1210.019−0.019
H5110.0390.0390.0390.0390.0390.0390.0330.0390.0440.0330.0330.0440.0390.0420.0140.0670.029−0.001
H6120.0390.0390.0390.0390.0390.0390.0390.0390.0330.0310.0330.0390.0330.0420.0190.0750.0140.022
K1130.0390.0360.036−0.0170.161−0.0720.1030.0330.089−0.017−0.0560.1220.0390.0080.0220.1330.010−0.013
K2140.0390.0390.0390.0390.0390.0390.0330.0390.0360.0330.0330.0390.0330.0420.0250.0640.0290.010
K3150.0390.0390.0390.0390.0390.0390.0330.0390.0440.0330.0330.0440.0390.0420.0140.0670.029−0.001
K4160.0390.0390.0390.0110.100−0.0170.0720.0390.0670.053−0.0330.0640.0440.0190.0110.1140.003−0.008
K5170.0390.0390.0940.0420.042−0.0110.0420.0440.081−0.0250.0030.0720.0640.000−0.0470.2640.053−0.142
K6180.0390.0390.0390.0390.0390.0390.0330.0390.0670.0080.0110.0860.017−0.008−0.0140.1970.058−0.078
Sample Size, n = 336
SSE = 139.222
RMSE = 0.644
Average Synaptic Weight = 0.10461

References

  1. Ma, W.; Abdulai, A. IPM adoption, cooperative membership and farm economic performance: Insight from apple farmers in China. China Agric. Econ. Rev. 2018, 8, 2–21. [Google Scholar] [CrossRef] [Green Version]
  2. Lal, R. Sustainable intensification of china’s agroecosystems by conservation agriculture. Int. Soil Water Conserv. Res. 2018, 6, 1–12. [Google Scholar] [CrossRef]
  3. Khatri-Chhetri, A.; Aggarwal, P.K.; Joshi, P.K.; Vyas, S. Farmers’ prioritisation of climate-smart agriculture (CSA) technologies. Agric. Syst. 2017, 151, 184–191. [Google Scholar] [CrossRef]
  4. UNFAO (Food and Agriculture Organization of the United Nations). The Future of Food and Agriculture—Alternative Pathways to 2050. 2018. Available online: http://www.fao.org/3/CA1553EN/ca1553en.pdf (accessed on 6 August 2019).
  5. Morris, W.; Henley, A.; Dowell, D. Farm diversification, entrepreneurship and technology adoption: Analysis of upland farmers in wales. J. Rural Stud. 2017, 53, 132–143. [Google Scholar] [CrossRef] [Green Version]
  6. Price, L.L.; Palis, F.G. Bringing farmer knowledge and learning into agricultural research: How agricultural anthropologists transformed strategic research at the international rice research institute. Cult. Agric. Food Environ. 2016, 38, 123–130. [Google Scholar] [CrossRef]
  7. Kassam, A.; Friedrich, T.; Derpsch, R. Global spread of conservation agriculture. Int. J. Environ. Stud. 2018, 1–23. [Google Scholar] [CrossRef]
  8. Bukchin, S.; Kerret, D. Food for hope: The role of personal resources in farmers’ adoption of green technology. Sustainability 2018, 10. [Google Scholar] [CrossRef] [Green Version]
  9. Fisher, M.; Holden, S.T.; Thierfelder, C.; Katengeza, S.P. Awareness and adoption of conservation agriculture in Malawi: What difference can farmer-to-farmer extension make? Int. J. Agric. Sustain. 2018, 16, 310–325. [Google Scholar] [CrossRef]
  10. Ali, A.; Hussain, I.; Rahut, D.B.; Erenstein, O. Laser-land levelling adoption and its impact on water use, crop yields and household income: Empirical evidence from the rice-wheat system of Pakistan Punjab. Food Policy 2018, 77, 19–32. [Google Scholar] [CrossRef]
  11. MOF. Economic Survey of Pakistan 2018–19; MOF: Islamabad, Pakistan, 2019. [Google Scholar]
  12. Zulfiqar, F.; Thapa, G.B. Agricultural sustainability assessment at provincial level in Pakistan. Land Use Policy 2017, 68, 492–502. [Google Scholar] [CrossRef]
  13. GOP. Subsidies for Farmers; Agriculture Department: Punjab, Lahore, Pakistan, 2016. Available online: http://www.ofwm.agripunjab.gov.pk/info_subsidies (accessed on 20 August 2019).
  14. Ahmad, M.-u.-D.; Masih, I.; Giordano, M. Constraints and opportunities for water savings and increasing productivity through resource conservation technologies in Pakistan. Agric. Ecosyst. Environ. 2014, 187, 106–115. [Google Scholar] [CrossRef]
  15. Abid, M.; Ngaruiya, G.; Scheffran, J.; Zulfiqar, F. The role of social networks in agricultural adaptation to climate change: Implications for sustainable agriculture in Pakistan. Climate 2017, 5. [Google Scholar] [CrossRef] [Green Version]
  16. Aubert, B.A.; Schroeder, A.; Grimaudo, J. It as enabler of sustainable farming: An empirical analysis of farmers’ adoption decision of precision agriculture technology. Decis. Support Syst. 2012, 54, 510–520. [Google Scholar] [CrossRef] [Green Version]
  17. Gao, Y.; Zhang, X.; Lu, J.; Wu, L.; Yin, S. Adoption behaviour of green control techniques by family farms in China: Evidence from 676 family farms in Huang-Huai-hai plain. Crop Prot. 2017, 99, 76–84. [Google Scholar] [CrossRef]
  18. Wezel, A.; Casagrande, M.; Celette, F.; Vian, J.-F.; Ferrer, A.; Peigné, J. Agroecological practices for sustainable agriculture. A review. Agron. Sustain. Dev. 2014, 34, 1–20. [Google Scholar] [CrossRef] [Green Version]
  19. Zhou, Y.; Zhou, Q.; Gan, S.; Wang, L. Factors affecting farmers’ willingness to pay for adopting vegetable residue compost in north china. Acta Ecol. Sin. 2018, 38, 401–411. [Google Scholar] [CrossRef]
  20. D’Souza, A.; Mishra, A.K. Adoption and abandonment of partial conservation technologies in developing economies: The case of South Asia. Land Use Policy 2018, 70, 212–223. [Google Scholar] [CrossRef]
  21. Rogers, E.M. A prospective and retrospective look at the diffusion model. J. Health Commun. 2004, 9, 13–19. [Google Scholar] [CrossRef]
  22. Tey, Y.S.; Li, E.; Bruwer, J.; Abdullah, A.M.; Brindal, M.; Radam, A.; Ismail, M.M.; Darham, S. The relative importance of factors influencing the adoption of sustainable agricultural practices: A factor approach for Malaysian vegetable farmers. Sustain. Sci. 2014, 9, 17–29. [Google Scholar] [CrossRef]
  23. Adnan, N.; Nordin, S.M.; Abu Bakar, Z.B. Understanding and facilitating sustainable agricultural practice: A comprehensive analysis of adoption behaviour among Malaysian paddy farmers. Land Use Policy 2017, 68, 372–382. [Google Scholar] [CrossRef]
  24. Borges, J.A.R.; Tauer, L.W.; Lansink, A.G.J.M.O. Using the theory of planned behaviour to identify key beliefs underlying Brazilian cattle farmers’ intention to use improved natural grassland: A mimic modelling approach. Land Use Policy 2016, 55, 193–203. [Google Scholar] [CrossRef]
  25. Wautersa, E.; Bielders, C.; Poesen, J.; Govers, G.; Mathijs, E. Adoption of soil conservation practices in Belgium: An examination of the theory of planned behaviour in the agri-environmental domain. Land Use Policy 2010, 27, 86–94. [Google Scholar] [CrossRef]
  26. Agarwal, R.; Prasad, J. A conceptual and operational definition of personal innovativeness in the domain of information technology. Inf. Syst. Res. 1998, 9, 204–215. [Google Scholar] [CrossRef]
  27. Slade, E.L.; Dwivedi, Y.K.; Piercy, N.C.; Williams, M.D. Modelling consumers’ adoption intentions of remote mobile payments in the United Kingdom: Extending UTAUT with innovativeness, risk, and trust. Psychol. Mark. 2015, 32, 860–873. [Google Scholar] [CrossRef]
  28. Small, B.; Brown, P.; Munguia, O.M.D. Values, trust, and management in New Zealand agriculture. Int. J. Agric. Sustain. 2016, 14, 282–306. [Google Scholar] [CrossRef]
  29. Turyahikayo, W.; Kamagara, E. Trust, perception and effectiveness of extension services in Uganda: A case of National Agricultural Advisory Services (NAADS). J. Agric. Ext. Rural Dev. 2016, 8, 224–231. [Google Scholar]
  30. Dimitriadis, S.; Kyrezis, N. Linking trust to use intention for technology-enabled bank channels: The role of trusting intentions. Psychol. Mark. 2010, 27, 799–820. [Google Scholar] [CrossRef]
  31. Lapple, D. Comparing attitudes and characteristics of organic, former organic and conventional farmers: Evidence from Ireland. Renew. Agric. Food Syst. 2013, 28, 329–337. [Google Scholar] [CrossRef] [Green Version]
  32. Tosakana, N.S.P.; Van Tassell, L.W.; Wulfhorst, J.D.; Boll, J.; Mahler, R.; Brooks, E.S.; Kane, S. Determinants of the adoption of conservation practices by farmers in the northwest wheat and range region. J. Soil Water Conserv. 2010, 65, 404–412. [Google Scholar] [CrossRef] [Green Version]
  33. Walisinghe, B.R.; Ratnasiri, S.; Rohde, N.; Guest, R. Does agricultural extension promote technology adoption in Sri Lanka. Int. J. Soc. Econ. 2017, 44, 2173–2186. [Google Scholar] [CrossRef]
  34. Maichum, K.; Parichatnon, S.; Peng, K. Application of the extended theory of planned behavior model to investigate purchase intention of green products among Thai consumers. Sustainability 2016, 8, 1077–1092. [Google Scholar] [CrossRef] [Green Version]
  35. Trivedi, R.H.; Patel, J.D.; Acharya, N. Causality analysis of media influence on environmental attitude, intention and behaviours leading to green purchasing. J. Clean. Prod. 2018, 196, 11–22. [Google Scholar] [CrossRef] [Green Version]
  36. Zhang, L.; Li, X.; Yu, J.; Yao, X. Toward cleaner production: What drives farmers to adopt eco-friendly agricultural production? J. Clean. Prod. 2018, 184, 550–558. [Google Scholar] [CrossRef]
  37. Winsen, F.; Van de Mey, Y.; Lauwers, L.; Van Passel, S.; Vancauteren, M.; Wauters, E. Determinants of risk behaviour: Effects of perceived risks and risk attitude on farmer’s adoption of risk management strategies. J. Risk Res. 2016, 19, 56–78. [Google Scholar] [CrossRef]
  38. Brick, K.; Visser, M. Risk preferences, technology adoption and insurance uptake: A framed experiment. J. Econ. Behav. Organ. 2015, 118, 383–396. [Google Scholar] [CrossRef]
  39. Venkatesh, V.; Morris, M.G.; Davis, G.B.; Davis, F.D. User acceptance of information technology: Toward a unified view. MIS Q. 2003, 27, 425–478. [Google Scholar] [CrossRef] [Green Version]
  40. Venkatesh, V.; Thong, J.Y.L.; Xu, X. Consumer acceptance and use of information technology: Extending the unified theory of acceptance and use of technology. MIS Q. 2012, 36, 157–178. [Google Scholar] [CrossRef] [Green Version]
  41. Williams, M.; Rana, N.; Dwivedi, Y.K. The unified theory of acceptance and use of technology (UTAUT): A literature review. J. Enterp. Inf. Manag. 2015, 28, 443–488. [Google Scholar] [CrossRef] [Green Version]
  42. Mannan, S.; Nordin, S.M.; Rafik-Galea, S.; Rizal, A.R.A. The ironies of new innovation and the sunset industry: Diffusion and adoption. J. Rural Stud. 2017, 55, 316–322. [Google Scholar] [CrossRef]
  43. Moore, G.C.; Benbasat, I. Development of an instrument to measure the perceptions of adopting an information technology innovation. Inf. Syst. Res. 1991, 2, 192–222. [Google Scholar] [CrossRef]
  44. Ajzen. The theory of planned behaviour. Organ. Behav. Hum. Decis. Process. 1991, 50, 179–211. [Google Scholar] [CrossRef]
  45. Yina, L. Environmental innovation practices and performance: Moderating effect of resource commitment. J. Clean. Prod. 2014, 66, 450–458. [Google Scholar]
  46. Pino, G.; Toma, P.; Rizzo, C.; Miglietta, P.P.; Peluso, A.M.; Guido, G. Determinants of farmers’ intention to adopt water-saving measures: Evidence from Italy. Sustainability 2017, 9, 77. [Google Scholar] [CrossRef] [Green Version]
  47. Wossen, T.; Berger, T.; Mequaninte, T.; Alamirew, B. Social network effects on the adoption of sustainable natural resource management practices in Ethiopia. Int. J. Sustain. Dev. World Ecol. 2013, 20, 477–483. [Google Scholar] [CrossRef]
  48. Mariano, M.J.; Villano, R.; Fleming, E. Factors influencing farmers’ adoption of modern rice technologies and good management practices in the Philippines. Agric. Syst. 2012, 110, 41–53. [Google Scholar] [CrossRef]
  49. Lalani, B.; Dorward, P.; Holloway, G.; Wauters, E. Smallholder farmers’ motivations for using conservation agriculture and the roles of yield, labour and soil fertility in decision making. Agric. Syst. 2016, 146, 80–90. [Google Scholar] [CrossRef] [Green Version]
  50. Ebrahimi, S.E.; Bijani, M.; Sadighi, H. Adoption behaviour towards the use of nuclear technology in agriculture: A causal analysis. Technol. Soc. 2018. [Google Scholar] [CrossRef]
  51. Faul, F.; Erdfelder, E.; Lang, A.-G.; Buchner, A. G*power 3: A flexible statistical power analysis program for the social, behavioural, and biomedical sciences. Behav. Res. Methods 2007, 39, 175–191. [Google Scholar] [CrossRef]
  52. Chin, W.W. How to write up and report PLS analyses. In Handbook of Partial Least Squares; Vinzi, V.E., Chin, W.W., Henseler, J., Wang, H., Eds.; Springer: Berlin/Heidelberg, Germany, 2010. [Google Scholar]
  53. Liebana-Cabanillas, F.; Marinkovic, V.; de Luna, I.R.; Kalinic, Z. Predicting the determinants of mobile payment acceptance: A hybrid SEM-neural network approach. Technol. Forecast. Soc. Chang. 2018, 129, 117–130. [Google Scholar] [CrossRef]
  54. Podsakoff, P.M.; MacKenzie, S.B.; Lee, J.Y.; Podsakoff, N.P. Common method biases in behavioural research: A critical review of the literature and recommended remedies. J. Appl. Psychol. 2003, 88, 879–903. [Google Scholar] [CrossRef]
  55. Harman, H.H. Modern Factor Analysis; University of Chicago Press: Chicago, IL, USA, 1976. [Google Scholar]
  56. Peng, D.X.; Lai, F. Using partial least squares in operations management research: A practical guideline and summary of past research. J. Oper. Manag. 2012, 30, 467–480. [Google Scholar] [CrossRef]
  57. Cain, M.K.; Zhang, Z.; Yuan, K.-H. Univariate and multivariate skewness and kurtosis for measuring non-normality: Prevalence, influence, and estimation. Behav. Res. Methods 2017, 49, 1716–1735. [Google Scholar] [CrossRef] [PubMed]
  58. Hair, J.F.; Risher, J.J.; Sarstedt, M.; Ringle, C.M. When to use and how to report the results of PLS-SEM. Eur. Bus. Rev. 2019, 31, 2–24. [Google Scholar] [CrossRef]
  59. Cohen, J. Statistical Power Analysis for the Behavioral Sciences, 2nd ed.; Lawrence Earlbaum Associates: Hillsdale, NJ, USA, 1988. [Google Scholar]
  60. Hair, J.F.; Hult, G.T.M.; Ringle, C.M.; Sarstedt, M. A Primer on Partial Least Squares Structural Equation Modeling; Sage: Thousand Oaks, CA, USA, 2014. [Google Scholar]
  61. Shmueli, G.; Ray, S.; Velasquez Estrada, J.M.; Shatla, S.B. The elephant in the room: Evaluating the predictive performance of PLS models. J. Bus. Res. 2016, 69, 4552–4564. [Google Scholar] [CrossRef]
  62. Ringle, C.M.; Sarstedt, M. Gain more insight from your PLS-SEM results. The importance-performance map analysis. Ind. Manag. Data Syst. 2016, 116, 165–1886. [Google Scholar] [CrossRef]
  63. Samarasinghe, S. Neural Network for Applied sciences and Engineering: From Fundamentals to Complex Pattern Recognition; CRC Press: Boca Raton, FL, USA, 2006. [Google Scholar]
  64. Leong, L.Y.; Hew, T.S.; Ooi, K.B.; Chong, A.Y.-L. Predicting the antecedents of thrust in social commerce-A hybrid structural equation modeling with neural network approach. J. Bus. Res. 2020, 110, 24–40. [Google Scholar] [CrossRef]
  65. Fornell, C.; Larcker, D.F. Evaluating structural equation models with unobservable variables and measurement error. J. Mark. Res. 1981, 18, 39–50. [Google Scholar] [CrossRef]
  66. Henseler, J.; Ringle, C.M.; Sarstedt, M. A new criterion for assessing discriminant validity in variance-based structural equation modelling. J. Acad. Mark. Sci. 2015, 43, 115–135. [Google Scholar] [CrossRef] [Green Version]
  67. Leong, L.Y.; Hew, T.S.; Ooi, K.B.; Lee, V.H.; Hew, J.J. A hybrid SEM-neural network analysis of social media addiction. Expert Syst. Appl. 2019, 133, 296–316. [Google Scholar] [CrossRef]
  68. Werner, M.; Wauters, E.; Bijttebier, J.; Steinmann, H.-H.; Ruysschaert, G.; Knierim, A. Farm-level implementation of soil conservation measures: Farmers’ beliefs and intentions. Renew. Agric. Food Syst. 2017, 32, 524–537. [Google Scholar] [CrossRef]
  69. Wamsler, C.; Brink, E. Mindsets for sustainability: Exploring the link between mindfulness and sustainable climate adaptation. Ecol. Econ. 2018, 151, 55–61. [Google Scholar] [CrossRef]
  70. Smith, L.E.D.; Siciliano, G. A comprehensive review of constraints to improved management of fertilisers in china and the mitigation of diffuse water pollution from agriculture. Agric. Ecosyst. Environ. 2015, 209, 15–25. [Google Scholar] [CrossRef] [Green Version]
  71. Ibrahum, A.M.; Hassan, M.S.; Gusau, A.L. Factors influencing acceptance and use of ICT innovations by agribusinesses. J. Glob. Inf. Manag. 2018, 28, 113–134. [Google Scholar] [CrossRef] [Green Version]
Figure 1. Research Model.
Land 09 00289 g001
Table 1. Profile of the Respondents.
n% n%
Gender Age
Male30490.521–29 years of age5917.5
Female329.530–39 years of age10029.7
Total33610040–49 years of age10731.8
50–59 years of age5516.6
Education 60 and Above 154.4
Primary339.8Total336100
High School9227.5
College Degree13439.8Marital Status
University Degree7722.9Single 9127.0
Total336100Married19156.8
Widow4312.7
Farming Experience Divorcee113.5
1–4 Years164.7Total336100
5–10 Years7622.8
11–15 Years15044.6Location
16–20 Years9427.9Gujranwala7522.3
Total336100Gujrat8625.6
Sialkot9829.2
NGO Members MB Din7722.9
Yes18755.6Total336100
No14944.4
Total336100
Table 2. Reliability analysis.
VariablesNo. of ItemsCronbach’s AlphaDG RhoComposite ReliabilityAverage Variance ExtractedVariance Inflation Factor
Farmer innovativeness50.8630.8790.8990.6411.805
Trust on Extension50.7850.8040.8500.5321.772
Profit Orientation 40.7380.7430.8370.5641.567
Environmental Attitude50.7550.7760.8340.5032.353
Risk-taking Attitude40.6960.7050.8120.5202.217
Performance Expectancy 40.7300.7310.8300.5642.381
Effort Expectancy 40.7130.7320.8190.5331.878
Social Influence 40.8250.8450.8820.6511.441
Facilitating Conditions50.7670.7740.9670.8561.383
Voluntariness of Use30.7150.7200.8400.6361.251
Intention to Adopt CAPs40.8550.8570.9020.6981.350
Sustainable Farm performance180.9940.9440.9940.907-
Table 3. Hierarchical Model of sustainable farm performance.
Coefficientt-ValuesSig.Decision
Sub-Dimensions of Sustainable farm performance
ENP → SFP0.333296.430.000Supported
YDP → SFP0.341251.890.000Supported
FIP → SFP0.340259.420.000Supported
Note: ENP: Environmental Performance; YDP: Yield Performance; FIP: Financial Performance; SFP: Sustainable Farm Performance.
Table 4. Hypothesis testing.
HypothesisCoefficientt-ValuesSig.r2f2Q2Decision
H1FIN → ITA−0.0300.5220.301 0.001 Not Supported
H2TOE → ITA0.1071.2670.103 0.010 Not Supported
H3POT → ITA0.1312.0240.022 0.017 Supported
H4ENA → ITA0.1722.2230.013 0.019 Supported
H5RTA → ITA0.0050.0590.476 0.000 Not Supported
H6PEX → ITA0.0202.5200.387 0.000 Not Supported
H7EEX → ITA0.2334.9420.000 0.045 Supported
H8SIN → ITA0.0841.5670.0590.3500.0080.205Not Supported
H9FCN → UOC0.1314.9420.000 0.016 Supported
H10VOU → UOC0.0941.8520.032 0.009 Supported
H11ITA → UOC0.2674.8350.0000.2170.0670.183Supported
H12UOC → SFP0.78928.8180.0000.6231.6510.488Supported
Note: FIN: Farmer’s Innovativeness; TOE: Trust on Extension; POT: Profit Orientation; ENA: Environmental Attitude; RTA: Risk-taking Attitude; PEX: Performance Expectation; EEX: Effort Expectancy; SIN: Social Influence; FCN: Facilitating Conditions; VOU: Voluntariness of Use; ITA: Intention to adopt CAPs; UOC: Use of CAPs; SFP: Sustainable Farm Performance.
Table 5. Moderating Effect.
βCI-minCI-maxt-ValueSig.Decision
HM1: PEXxAGE → ITA0.054−0.0570.1560.8380.201No Moderation
HM2: EEXxAGE → ITA−0.020−0.1390.0810.2960.384No Moderation
HM3: SINxAGE → ITA−0.039−0.1230.0750.6380.262No Moderation
HM4: PEXxEDU → ITA0.058−0.0370.1670.9460.172No Moderation
HM5: EEXxEDU → ITA−0.044−0.1540.0710.6490.258No Moderation
HM6: SINxEDU → ITA−0.038−0.1410.0510.6640.254No Moderation
HM7: PEXxEXP → ITA−0.232−0.352−0.1173.3580.000Moderation
HM8: EEXxEXP → ITA0.1910.0840.3052.9540.002Moderation
HM9: SINxEXP → ITA0.060−0.0520.1420.9990.159No Moderation
HM10: FCVxVOU → UOC−0.164−0.257−0.0823.1850.001Moderation
Note: FIN: Farmer’s Innovativeness; TOE: Trust on Extension; POT: Profit Orientation; ENA: Environmental Attitude; RTA: Risk-taking Attitude; PEX: Performance Expectation; EEX: Effort Expectancy; SIN: Social Influence; FCN: Facilitating Conditions; VOU: Voluntariness of Use; ITA: Intention to adopt CAPs; UOC: Use of CAPs; SFP: Sustainable Farm Performance.
Table 6. Importance-Performance Matrix.
Target ConstructSFP
VariablesTotal EffectPerformanceVariablesTotal EffectPerformance
FIN−0.00767.218EEX0.06166.647
TOE0.02868.250SIN0.02171.057
POT0.03670.231FCN0.13769.224
ENA0.04668.657VOU0.08867.329
RTA0.00167.828ITA0.20961.895
PEX0.00565.025UOC0.87160.863
Note: FIN: Farmer’s Innovativeness; TOE: Trust on Extension; POT: Profit Orientation; ENA: Environmental Attitude; RTA: Risk-taking Attitude; PEX: Performance Expectation; EEX: Effort Expectancy; SIN: Social Influence; FCN: Facilitating Conditions; VOU: Voluntariness of Use; ITA: Intention to adopt CAPs; UOC: Use of CAPs; SFP: Sustainable Farm Performance.

