Bottom-Up Perspectives on the Re-Greening of the Sahel: An Evaluation of the Spatial Relationship between Soil and Water Conservation (SWC) and Tree-Cover in Burkina Faso

Abstract
:1. Introduction
2. Study Context
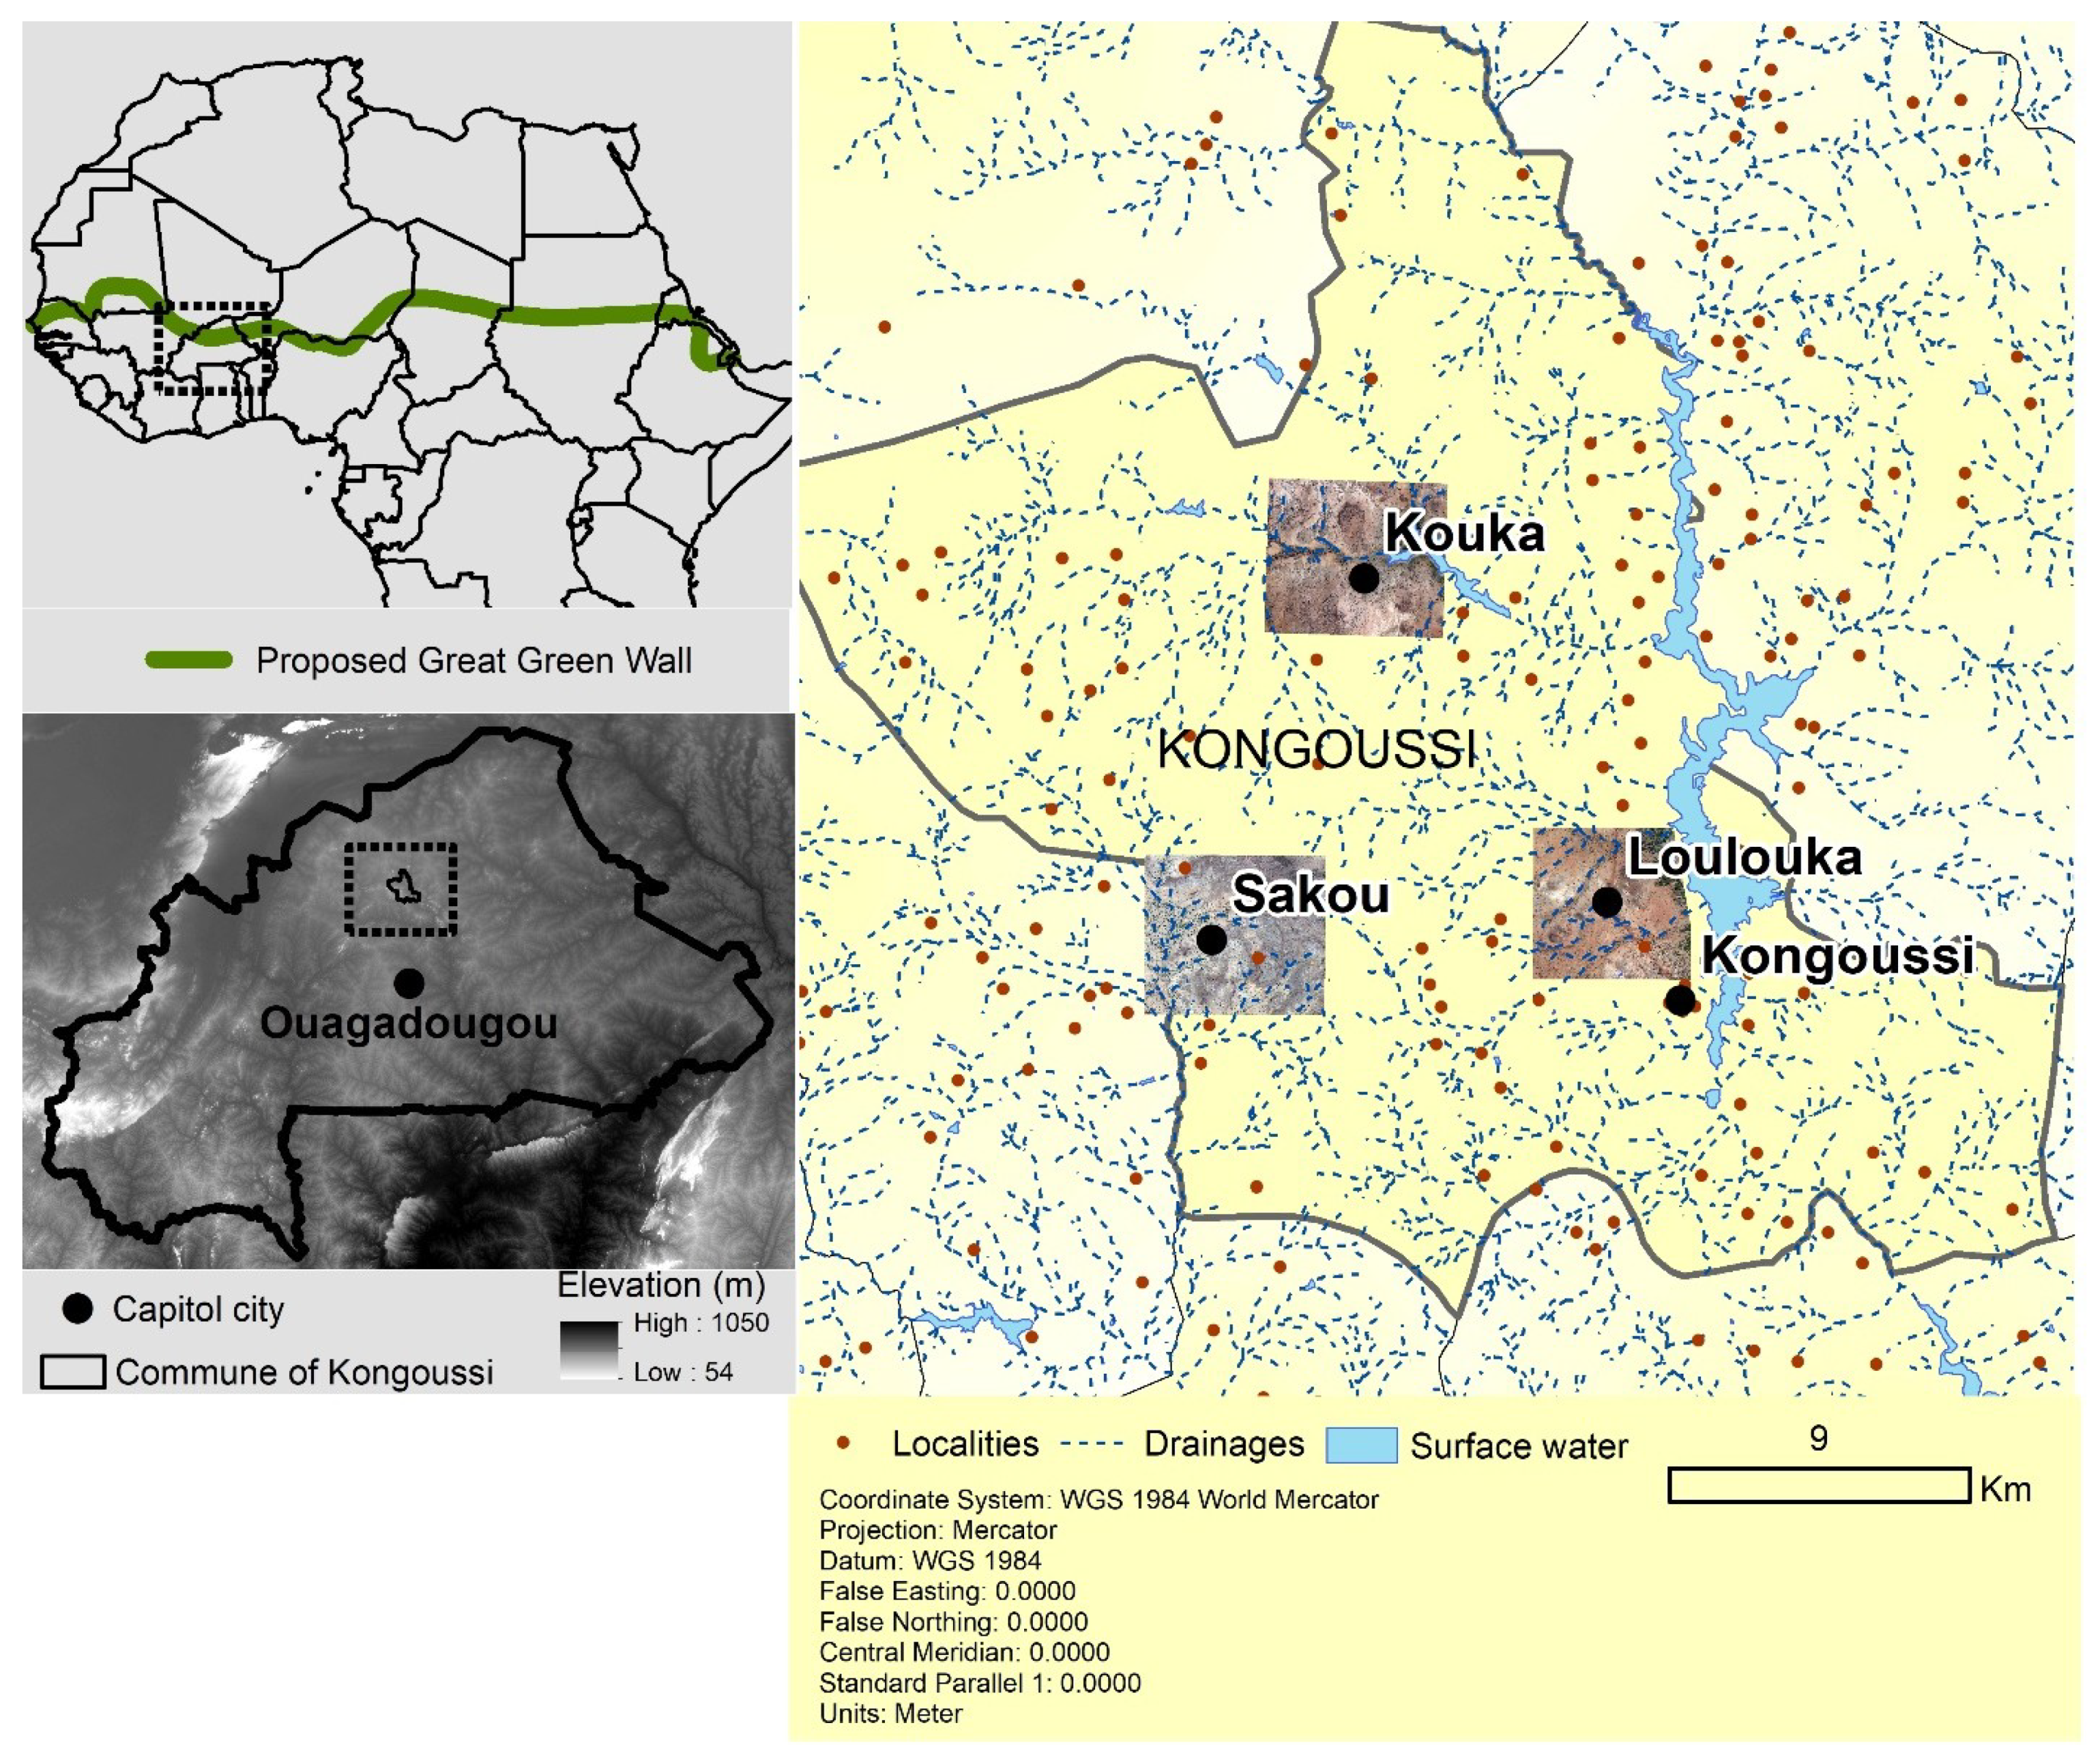
2.1. Regional Description
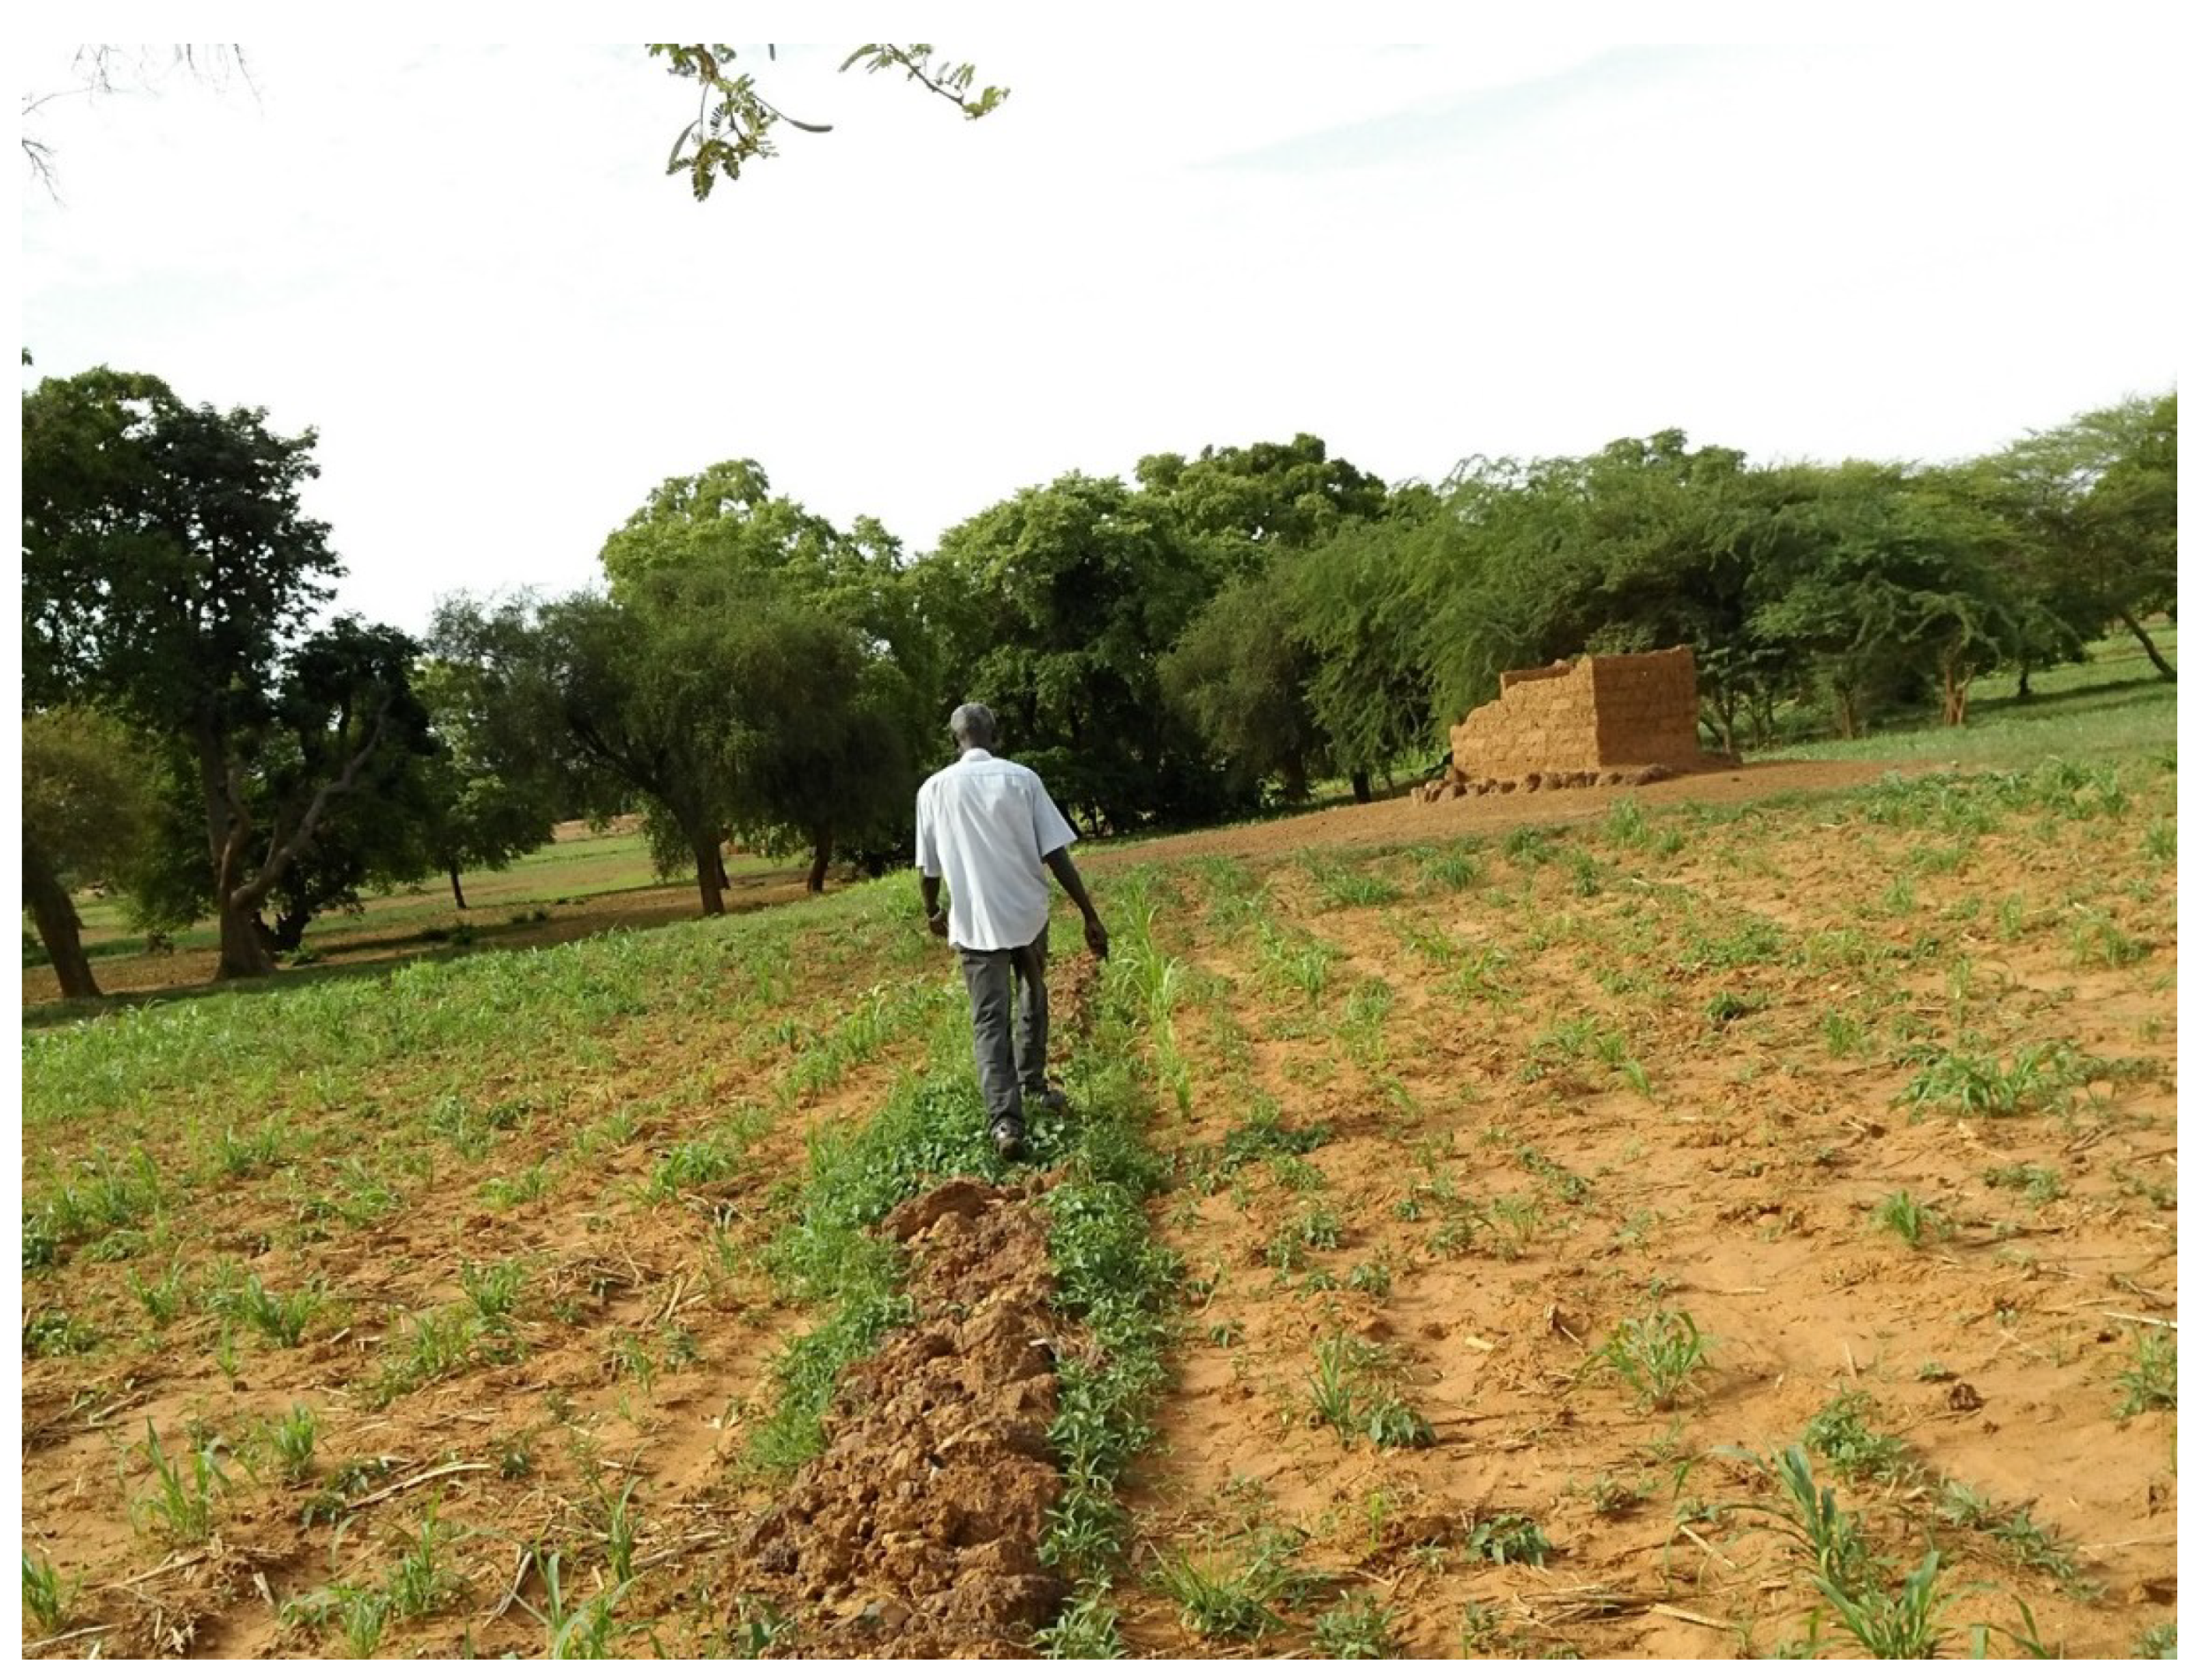
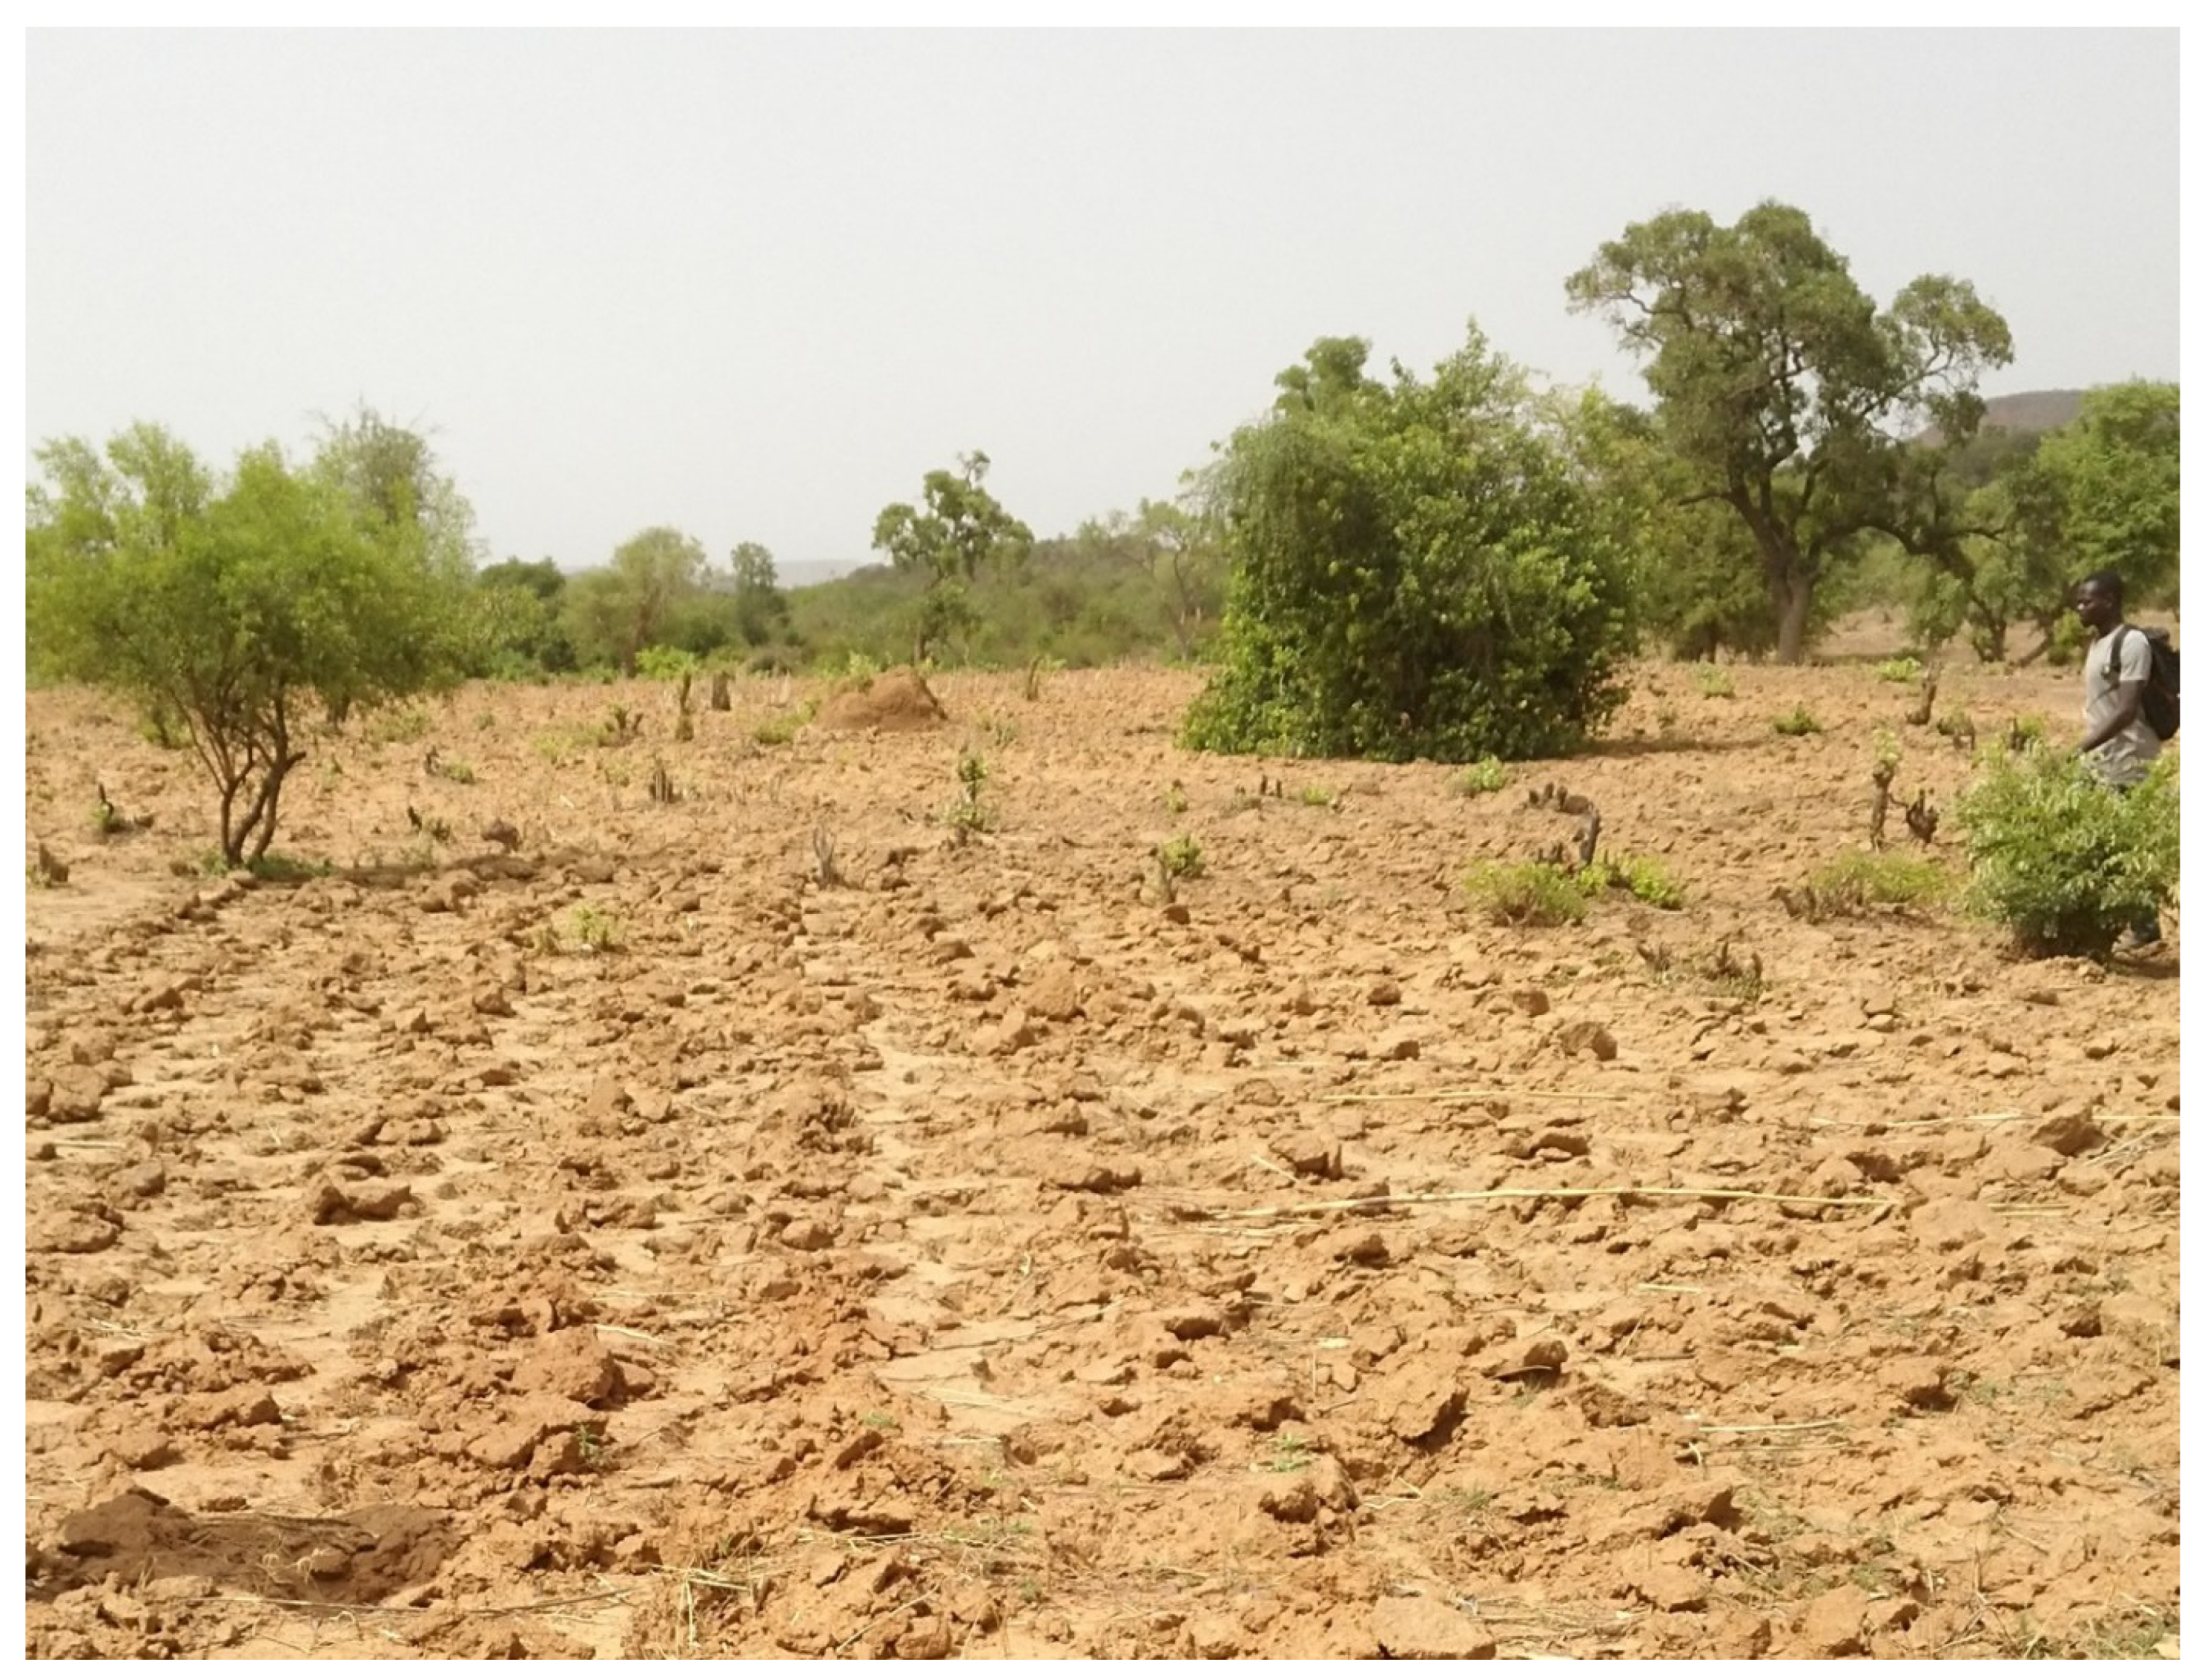
2.2. Soil and Water Conservation
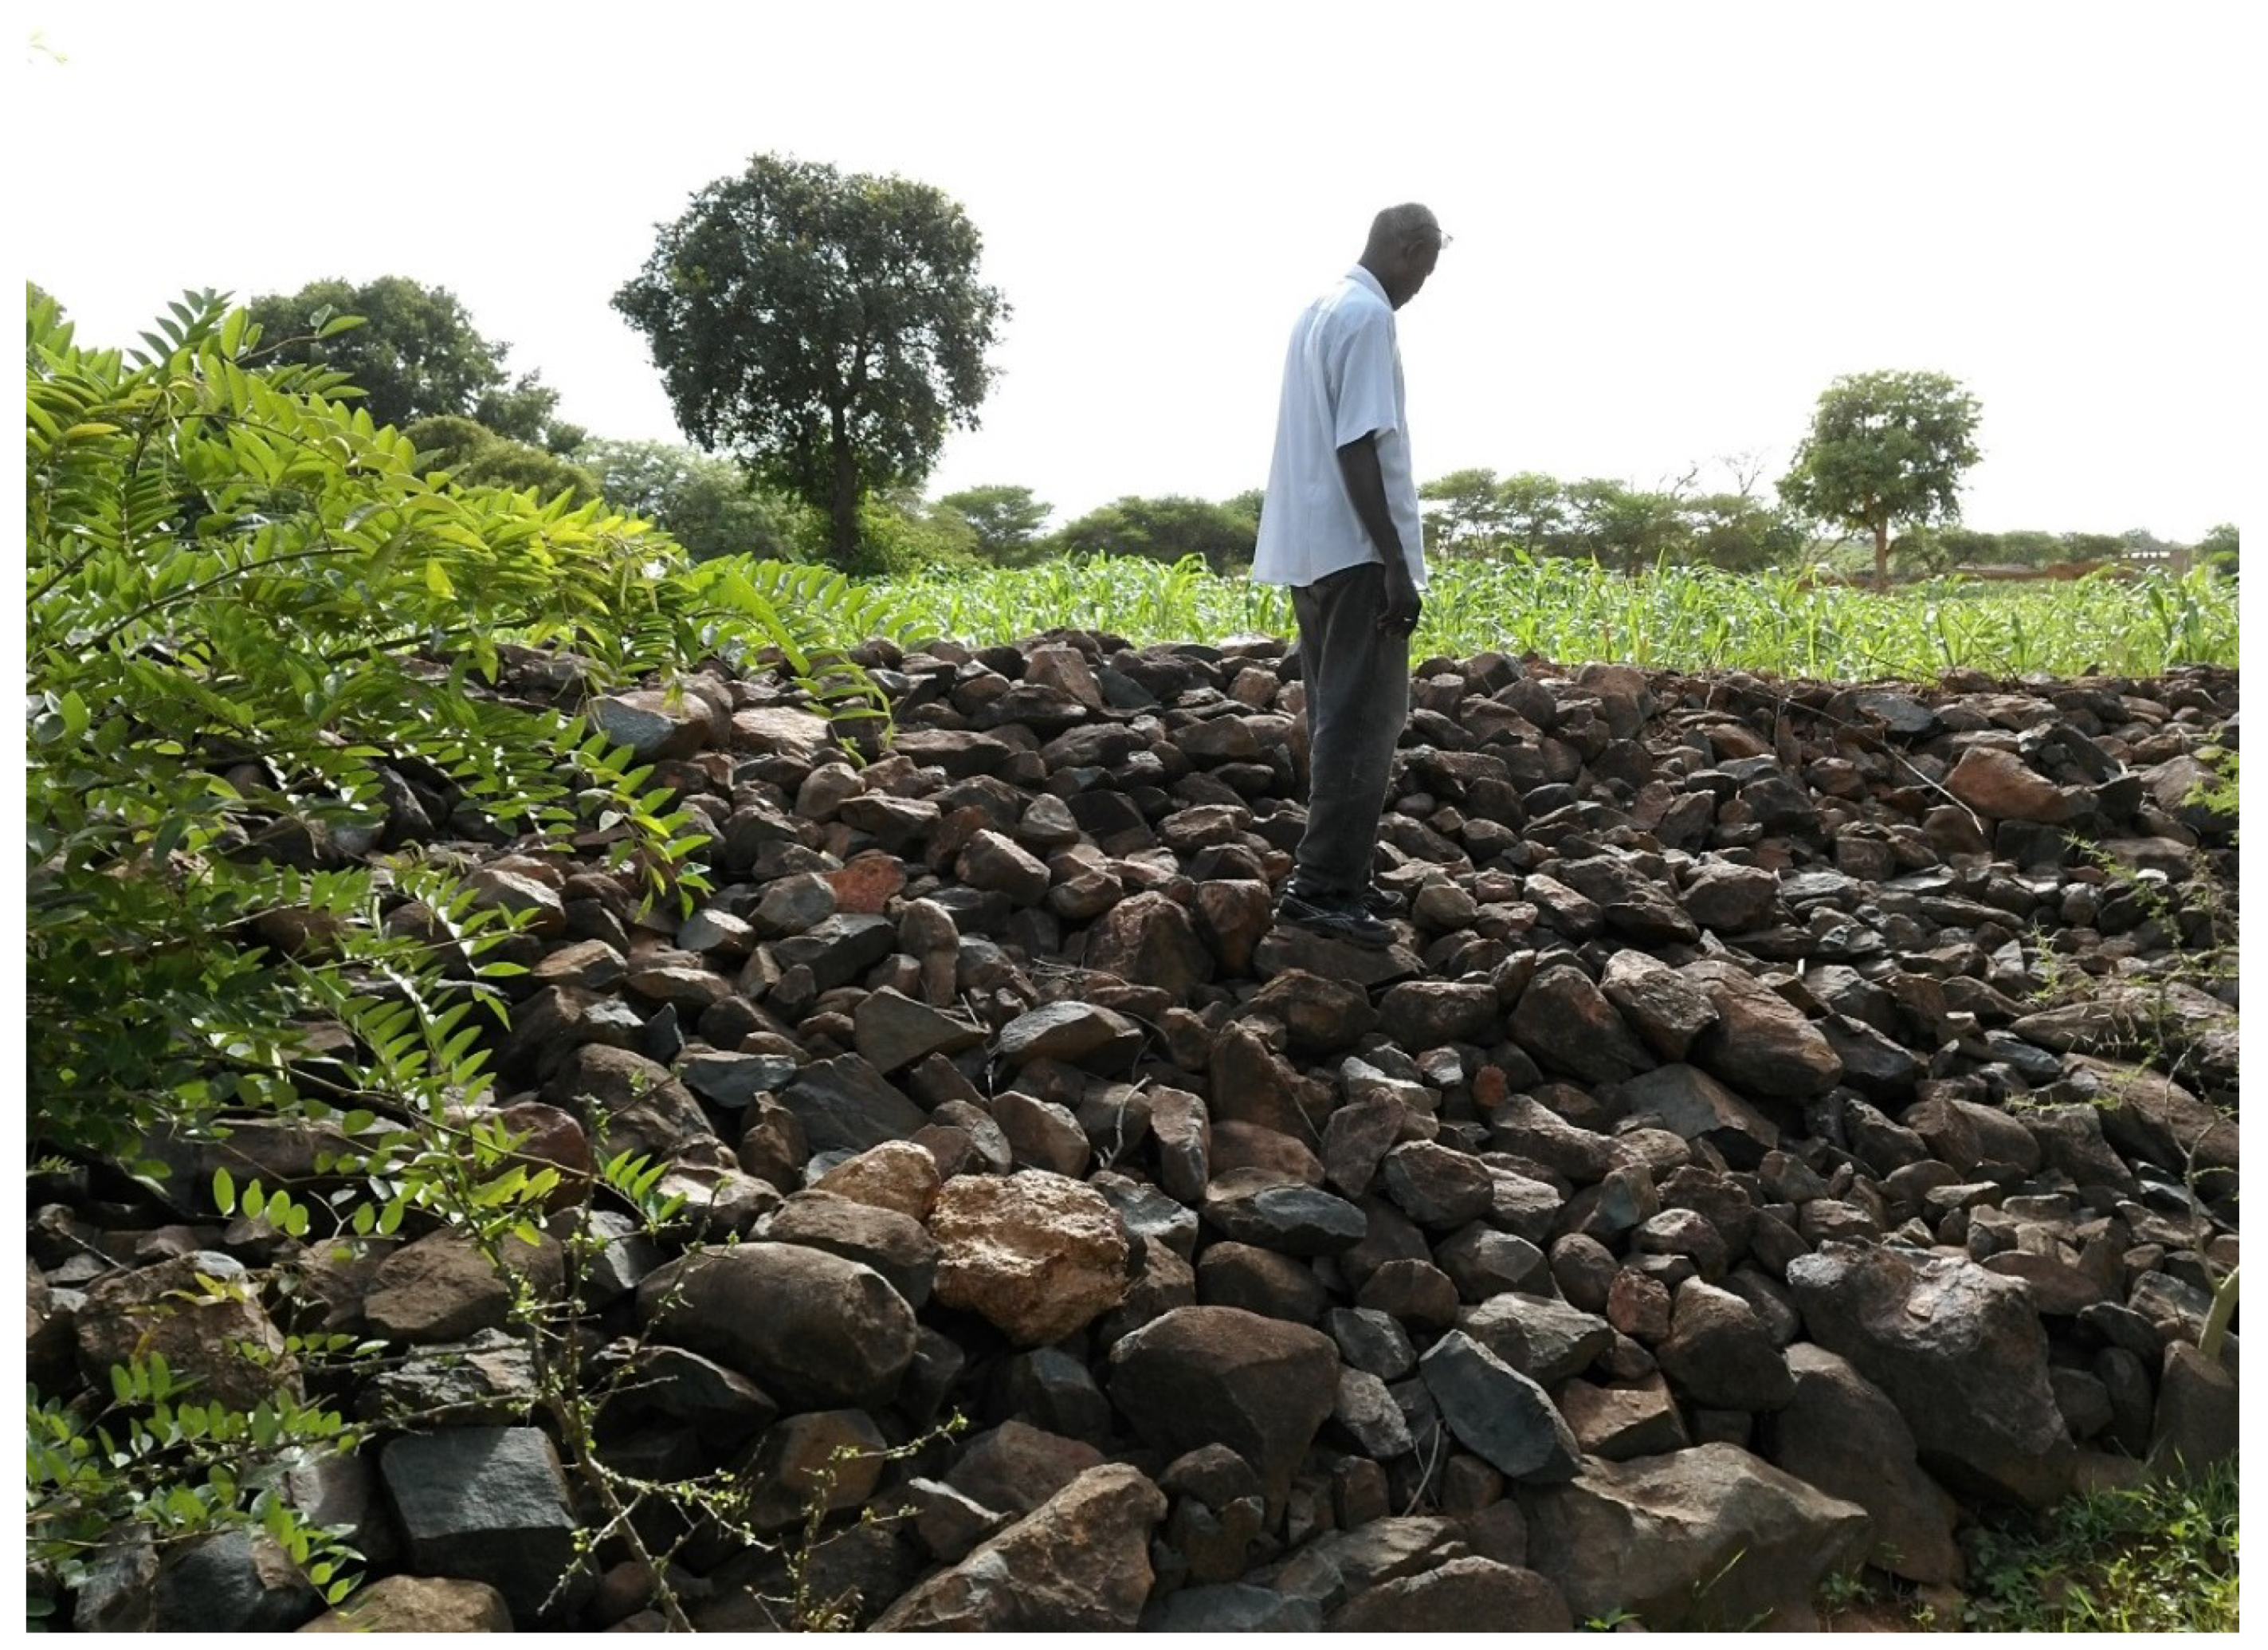
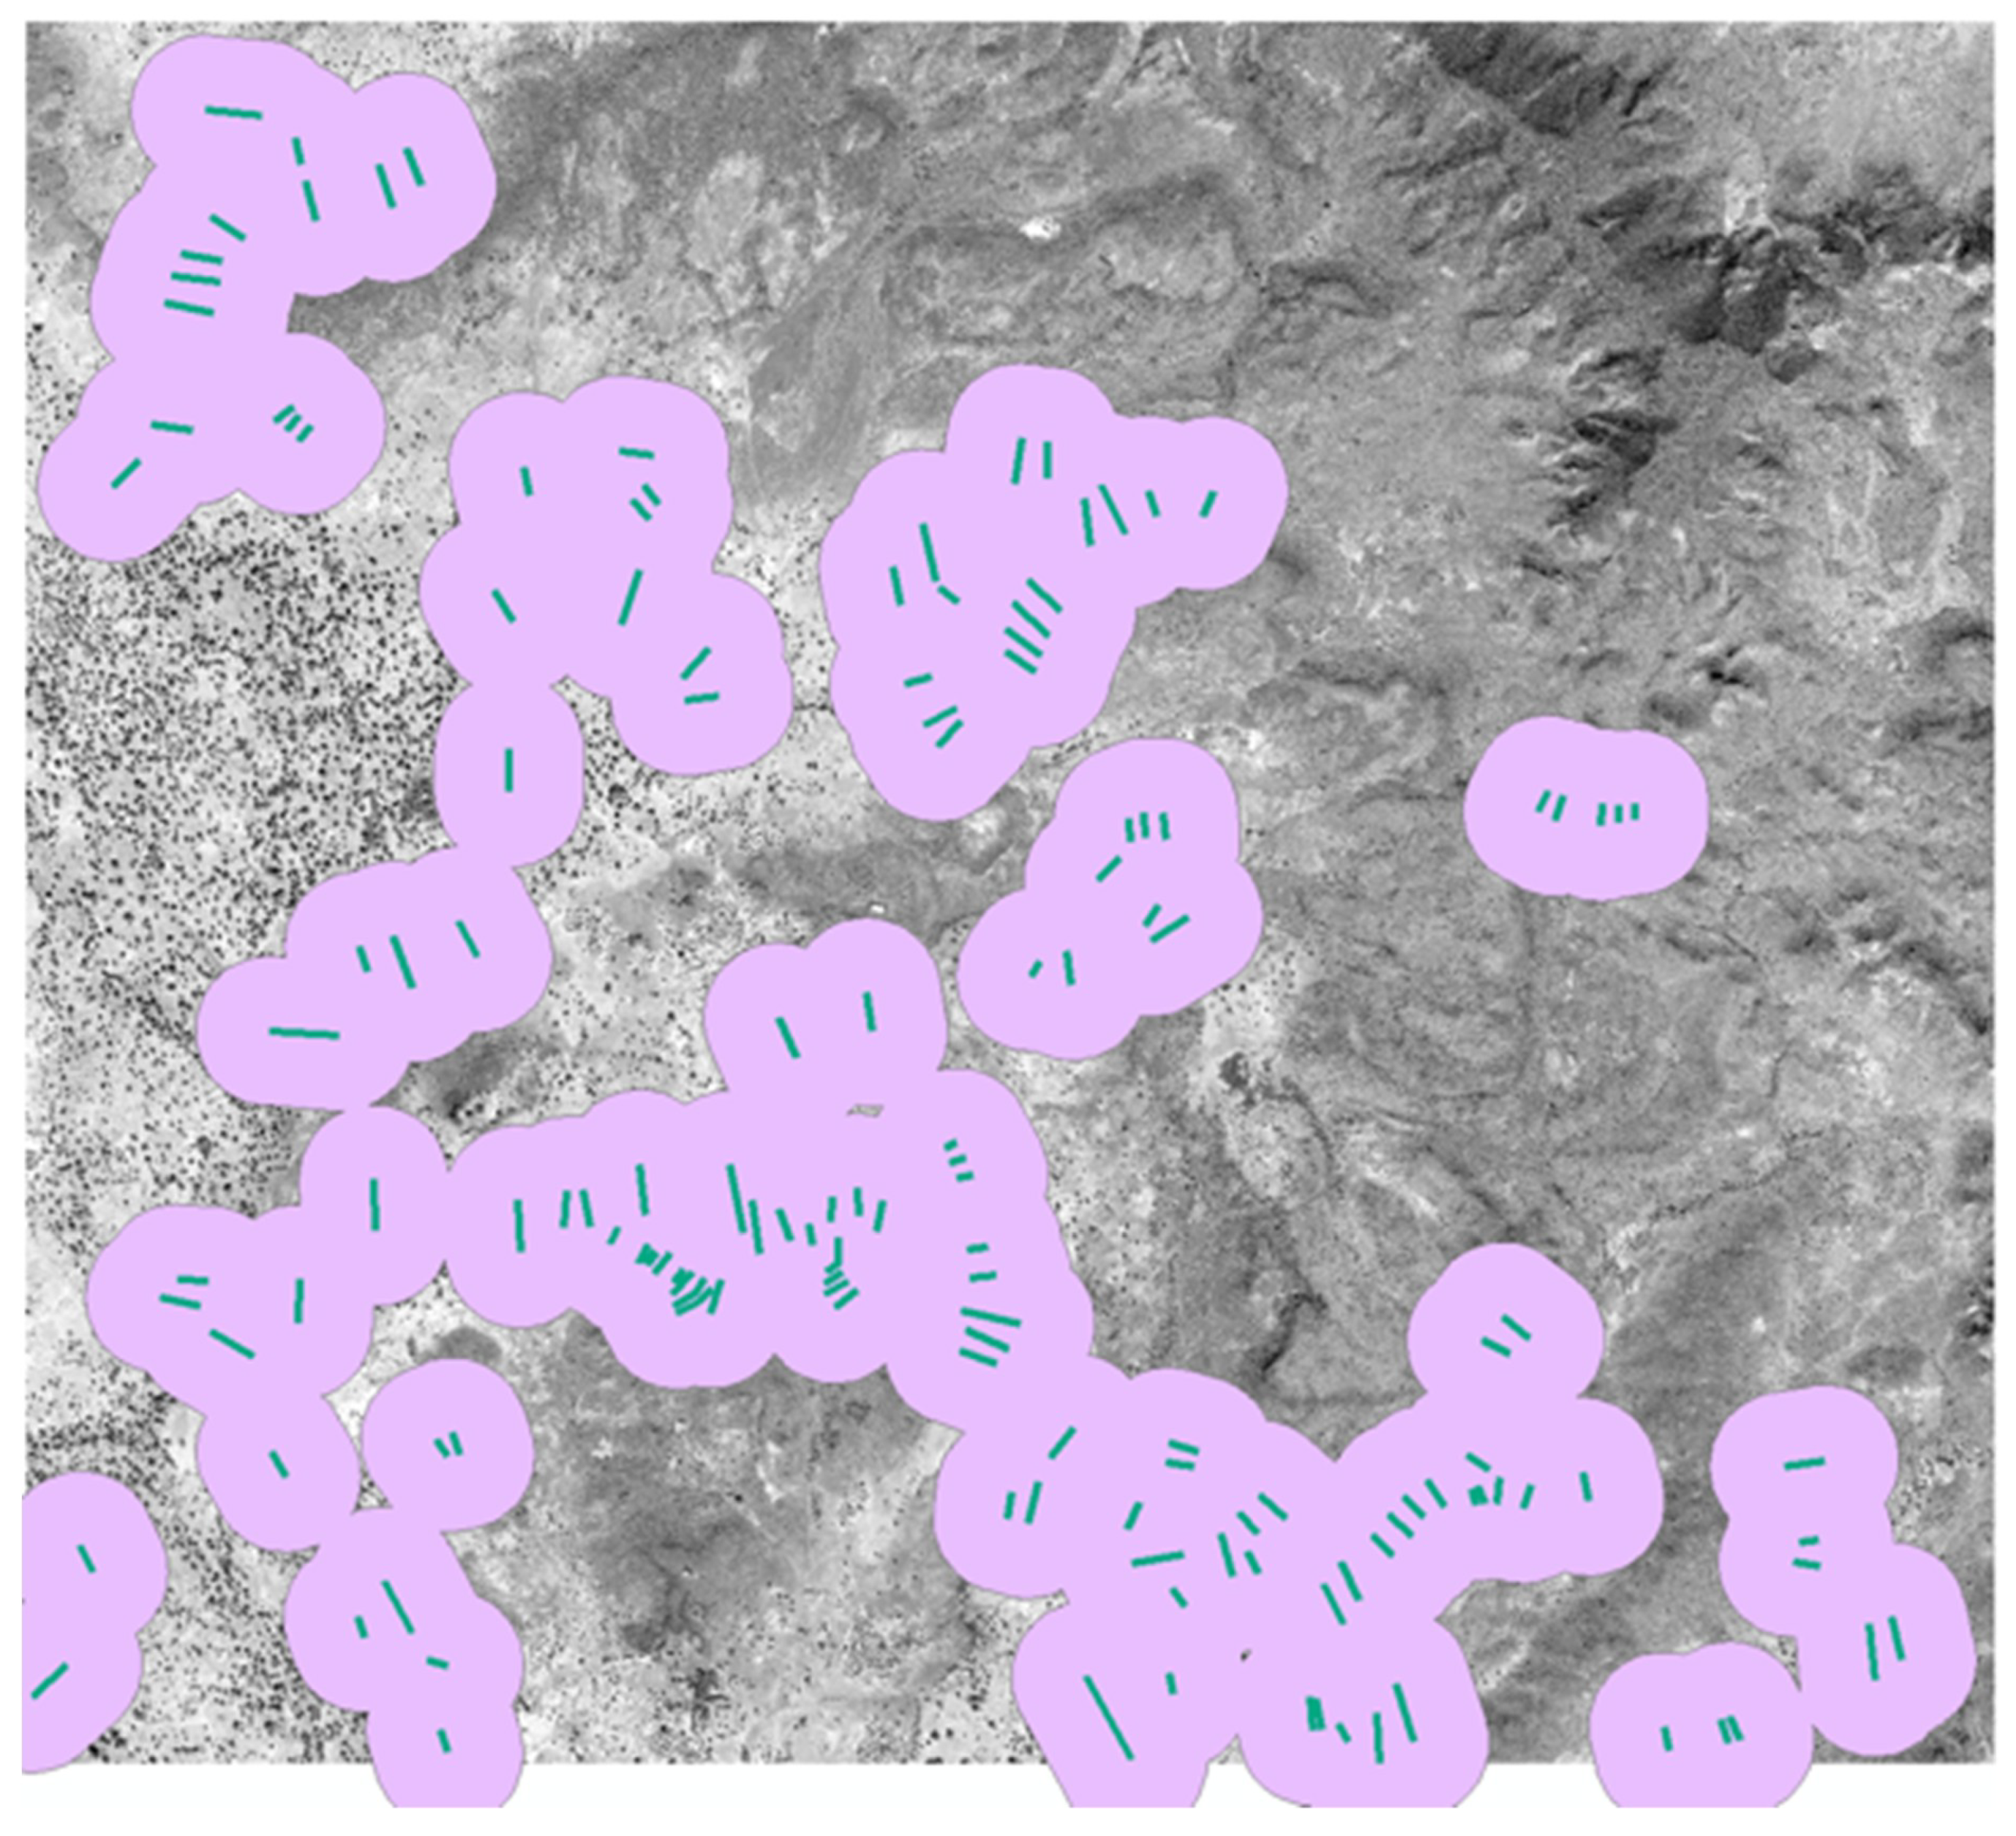
2.2.1. Semi-permeable Dams
2.2.2. Contour Stone Bunds
2.2.3. Zaï
2.2.4. Other SWC
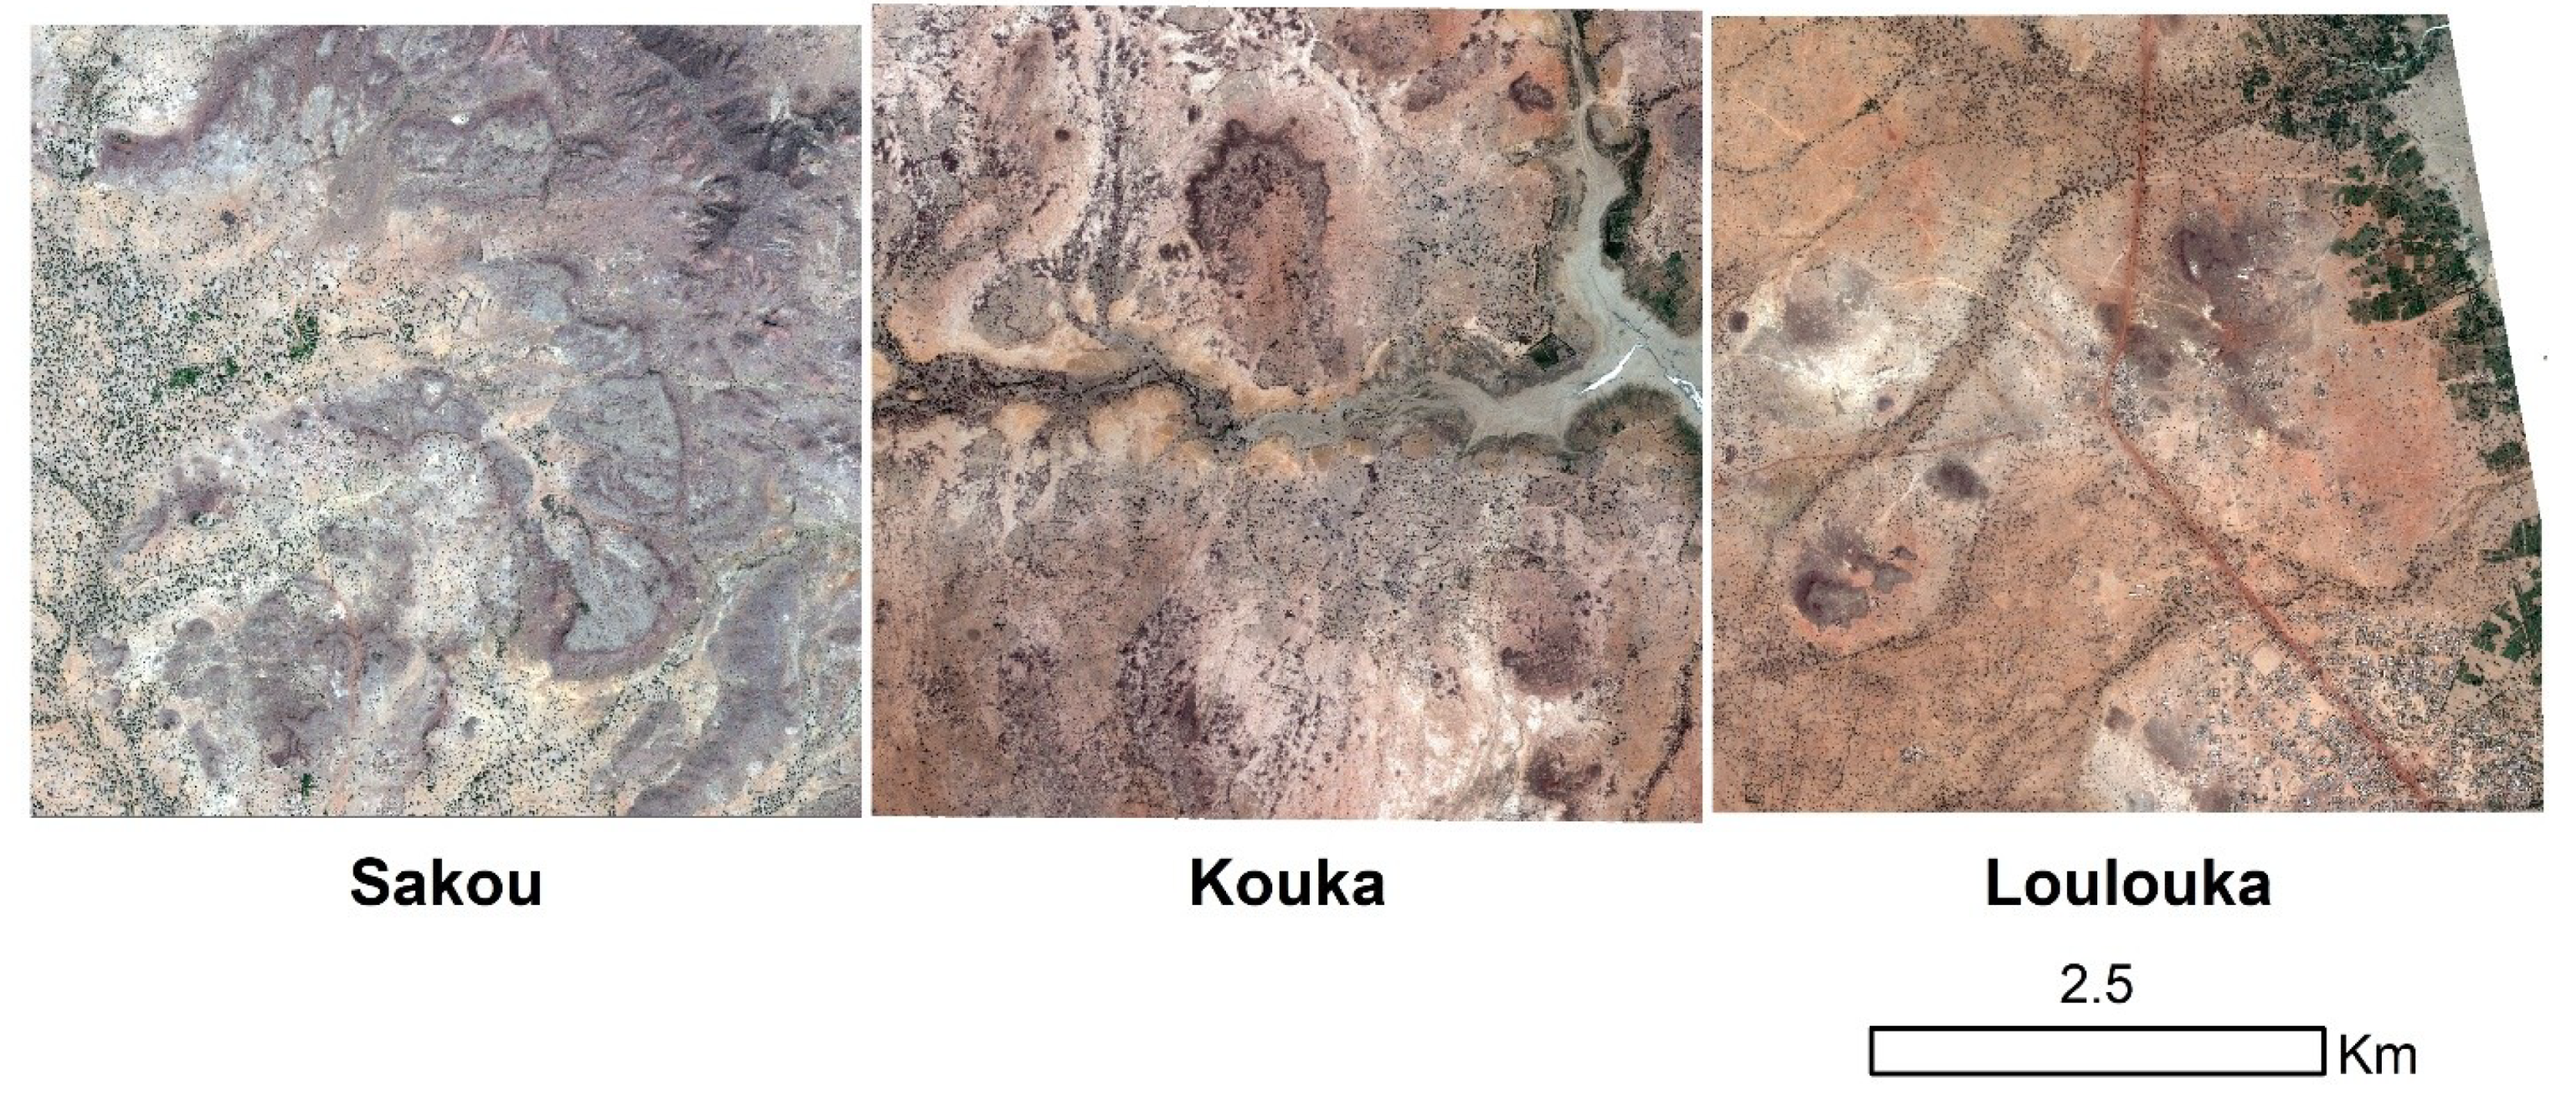
2.3. Study Sites
2.3.1. Sakou
2.3.2. Kouka
2.3.3. Loulouka
3. Materials and Methods
3.1. Datasets
3.1.1. Satellite Imagery
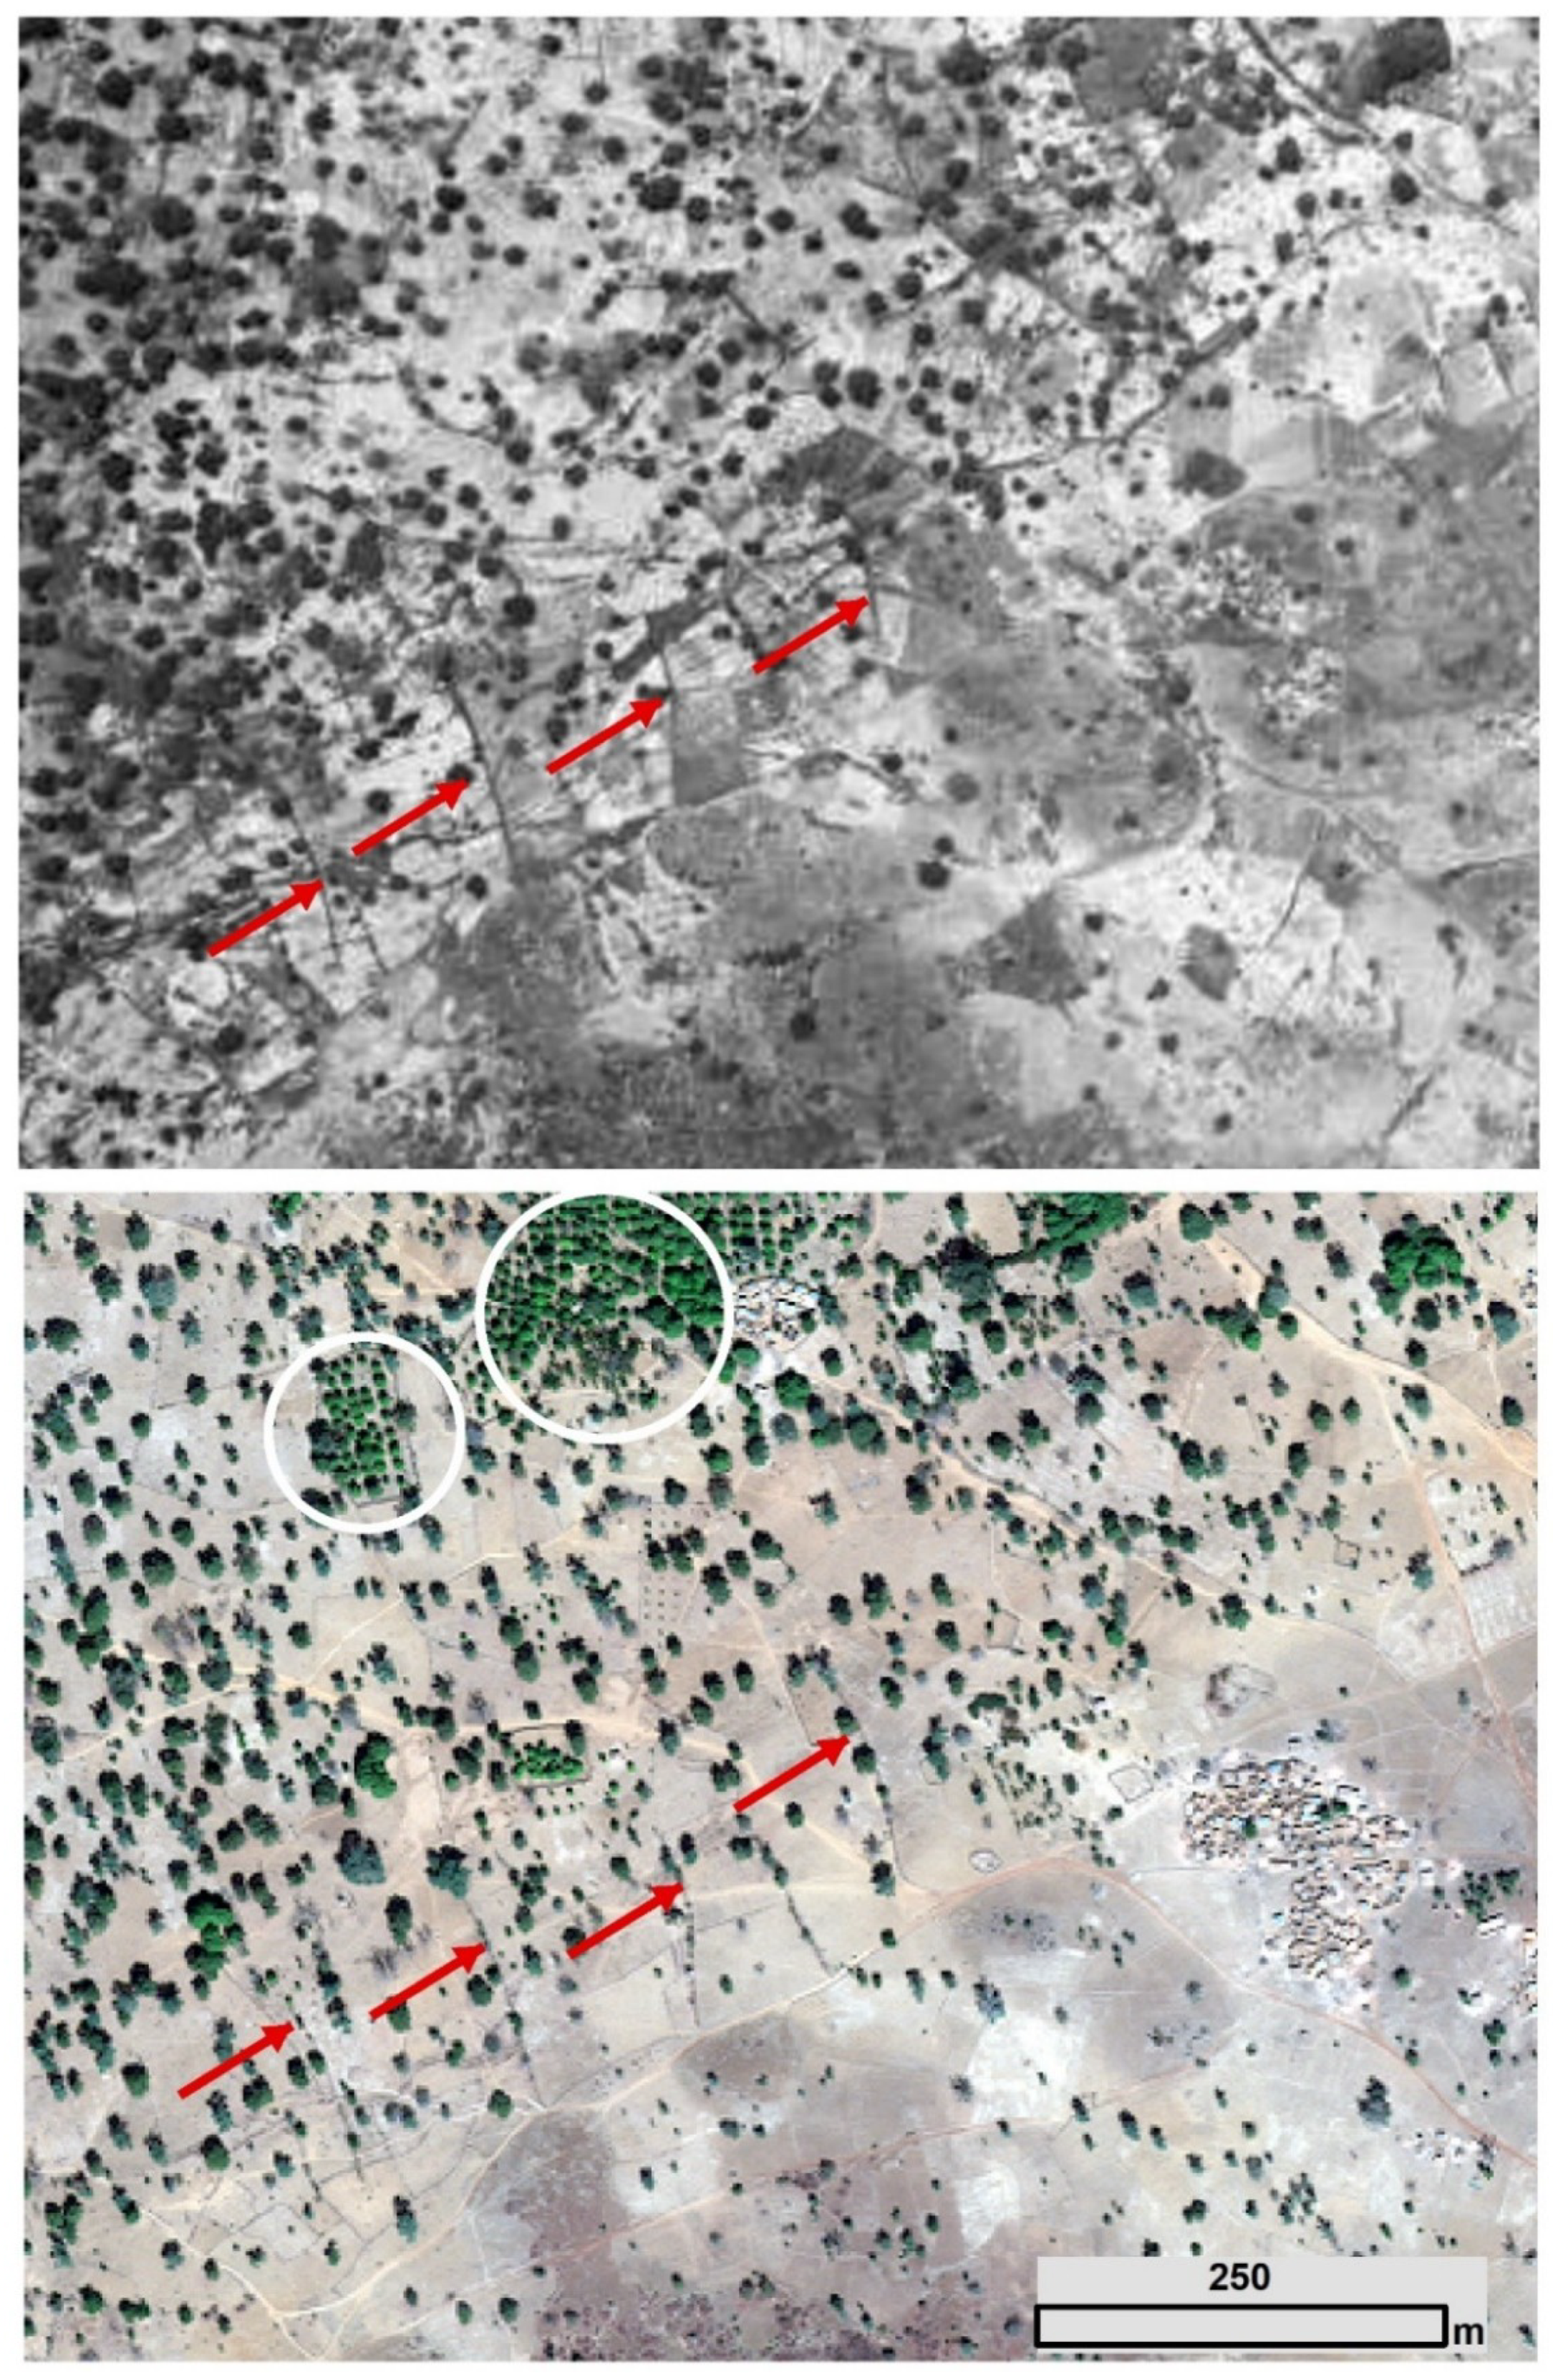
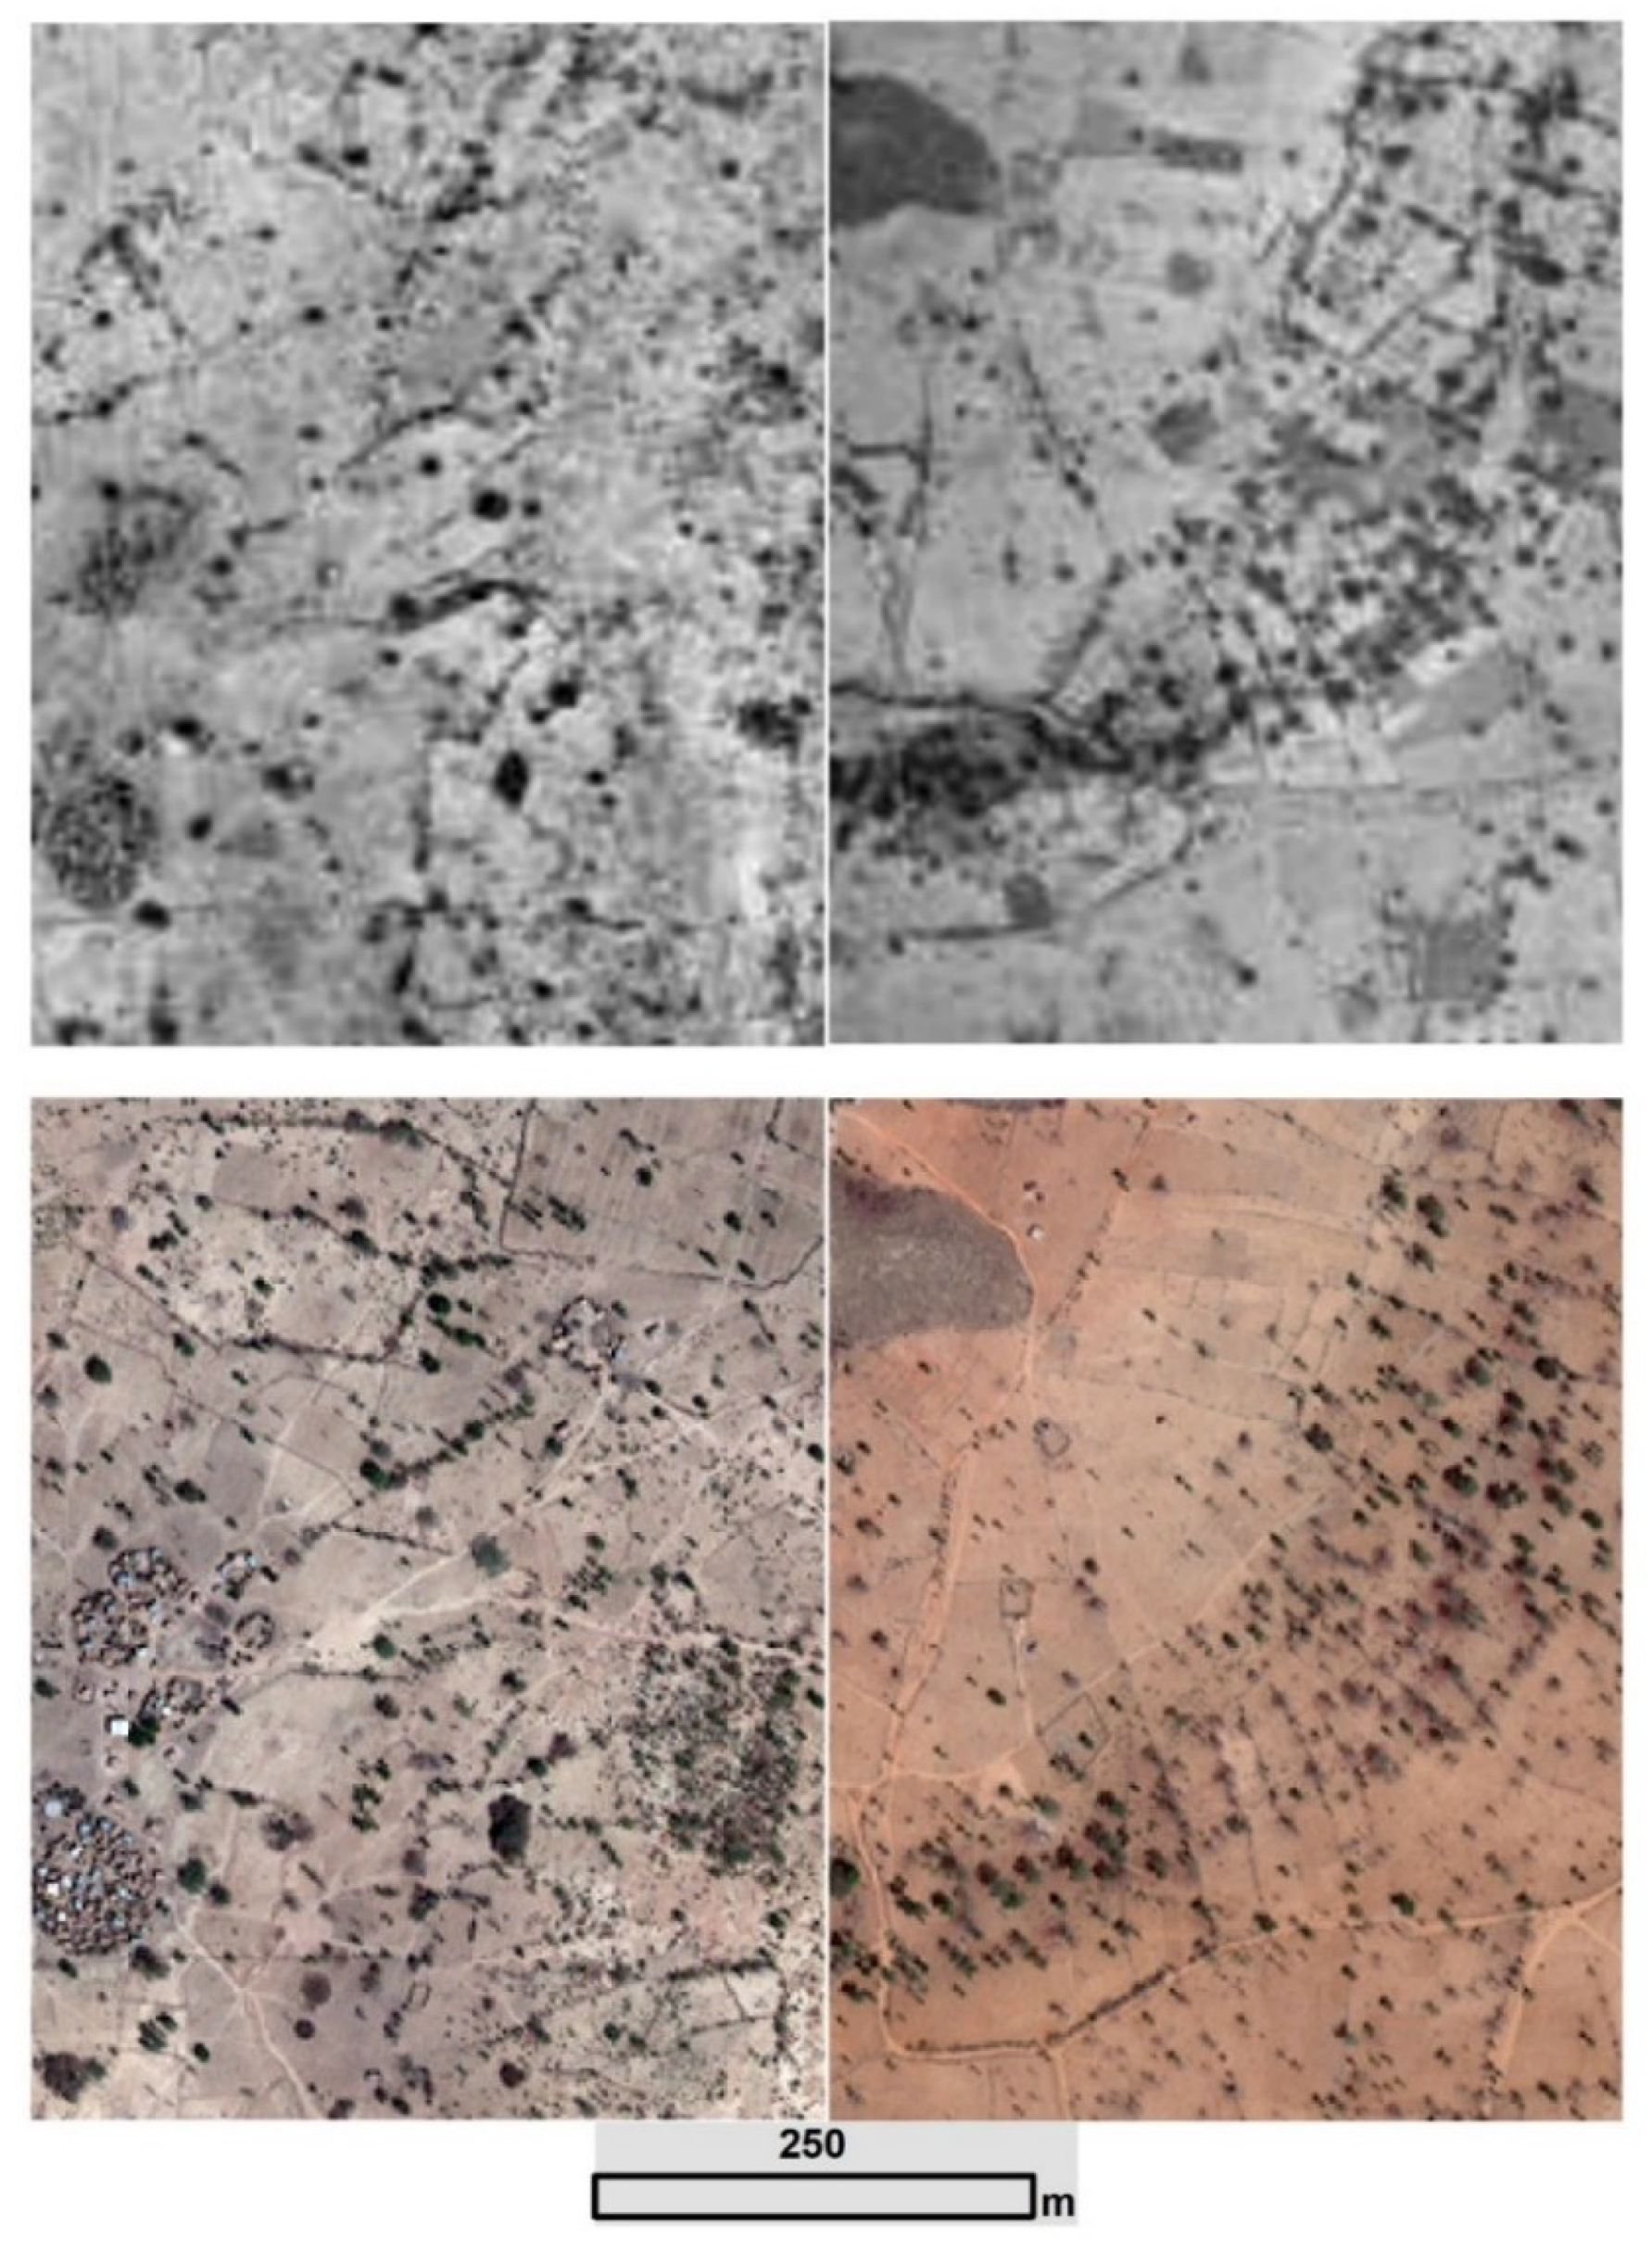
3.1.2. Archival Aerial Photographs
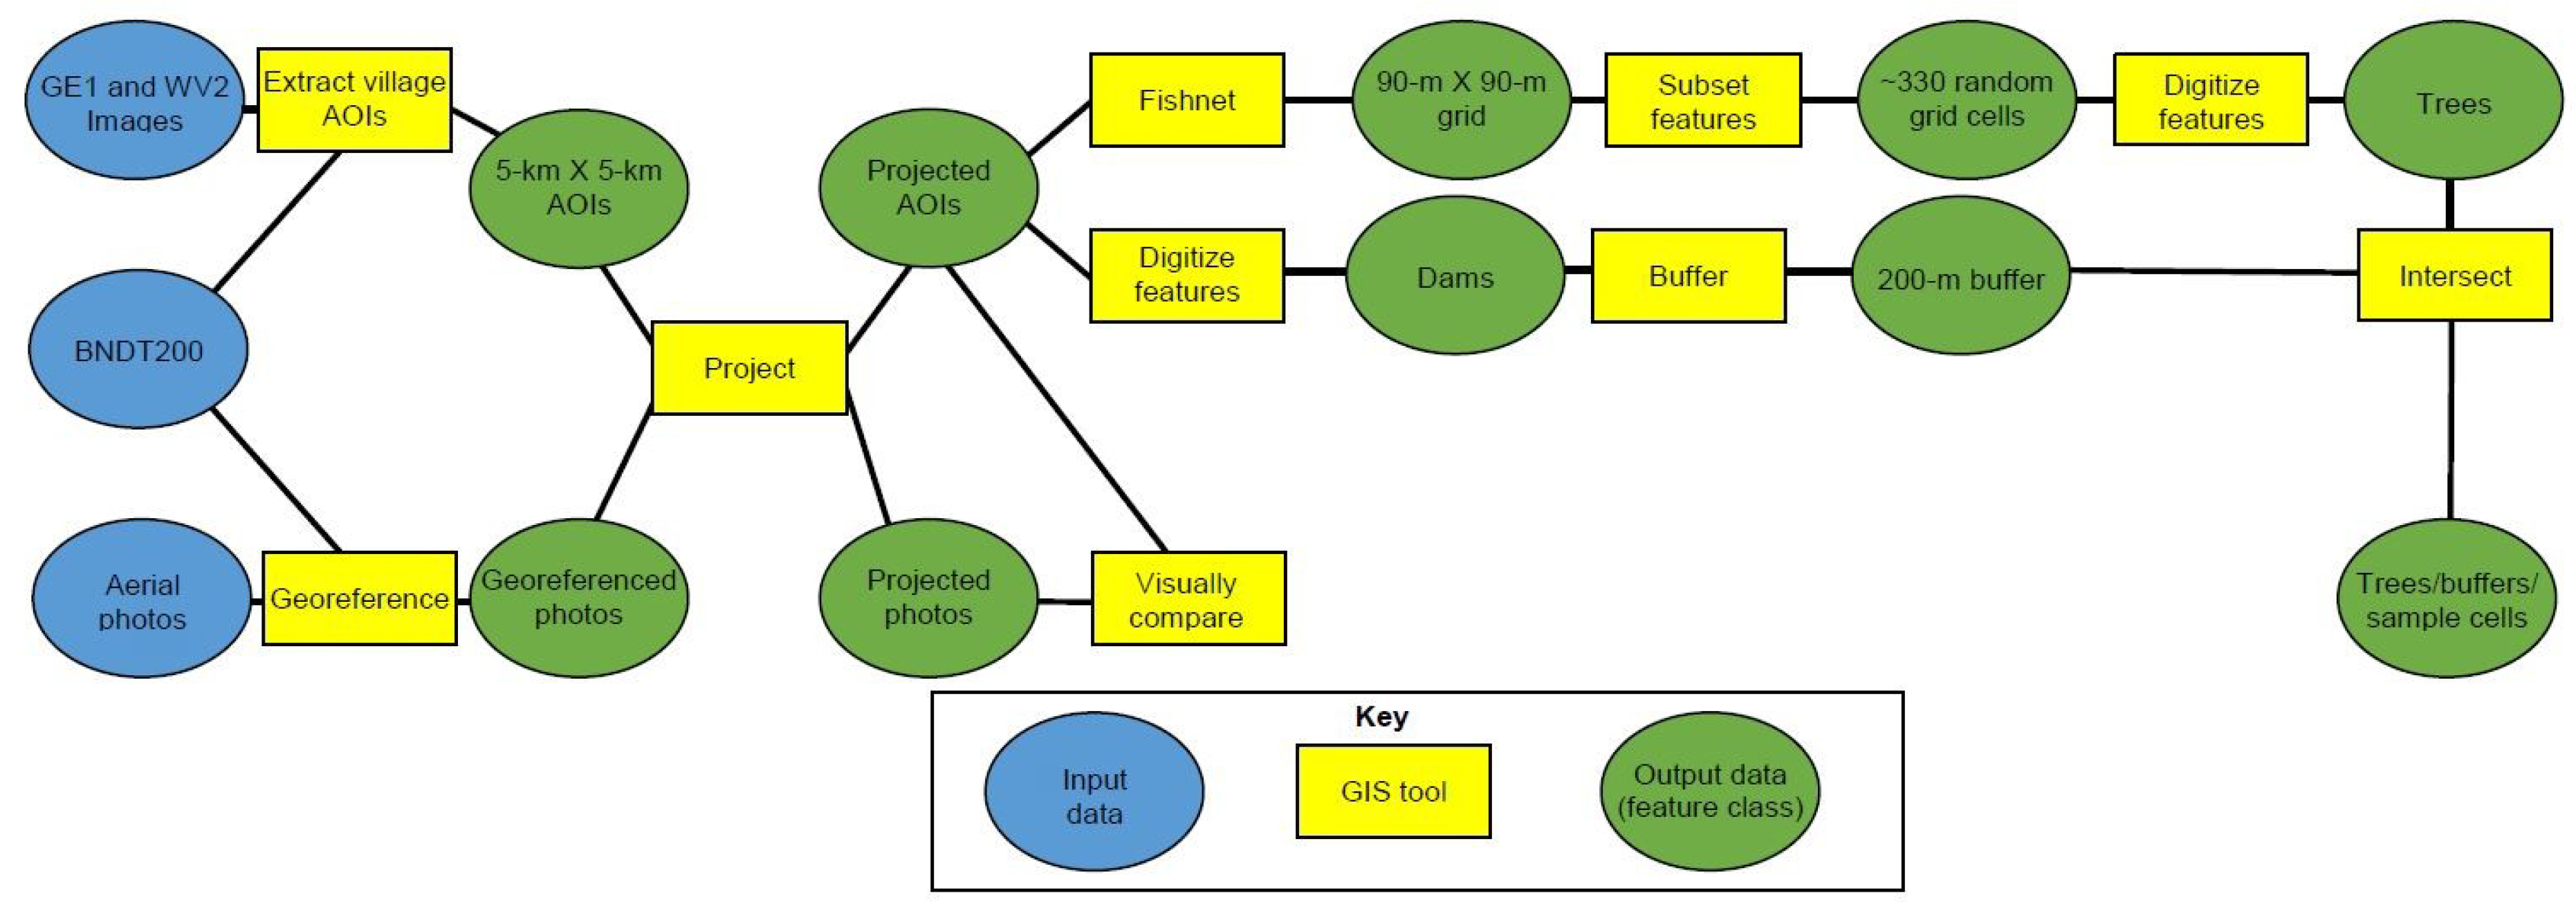
3.2. Methods
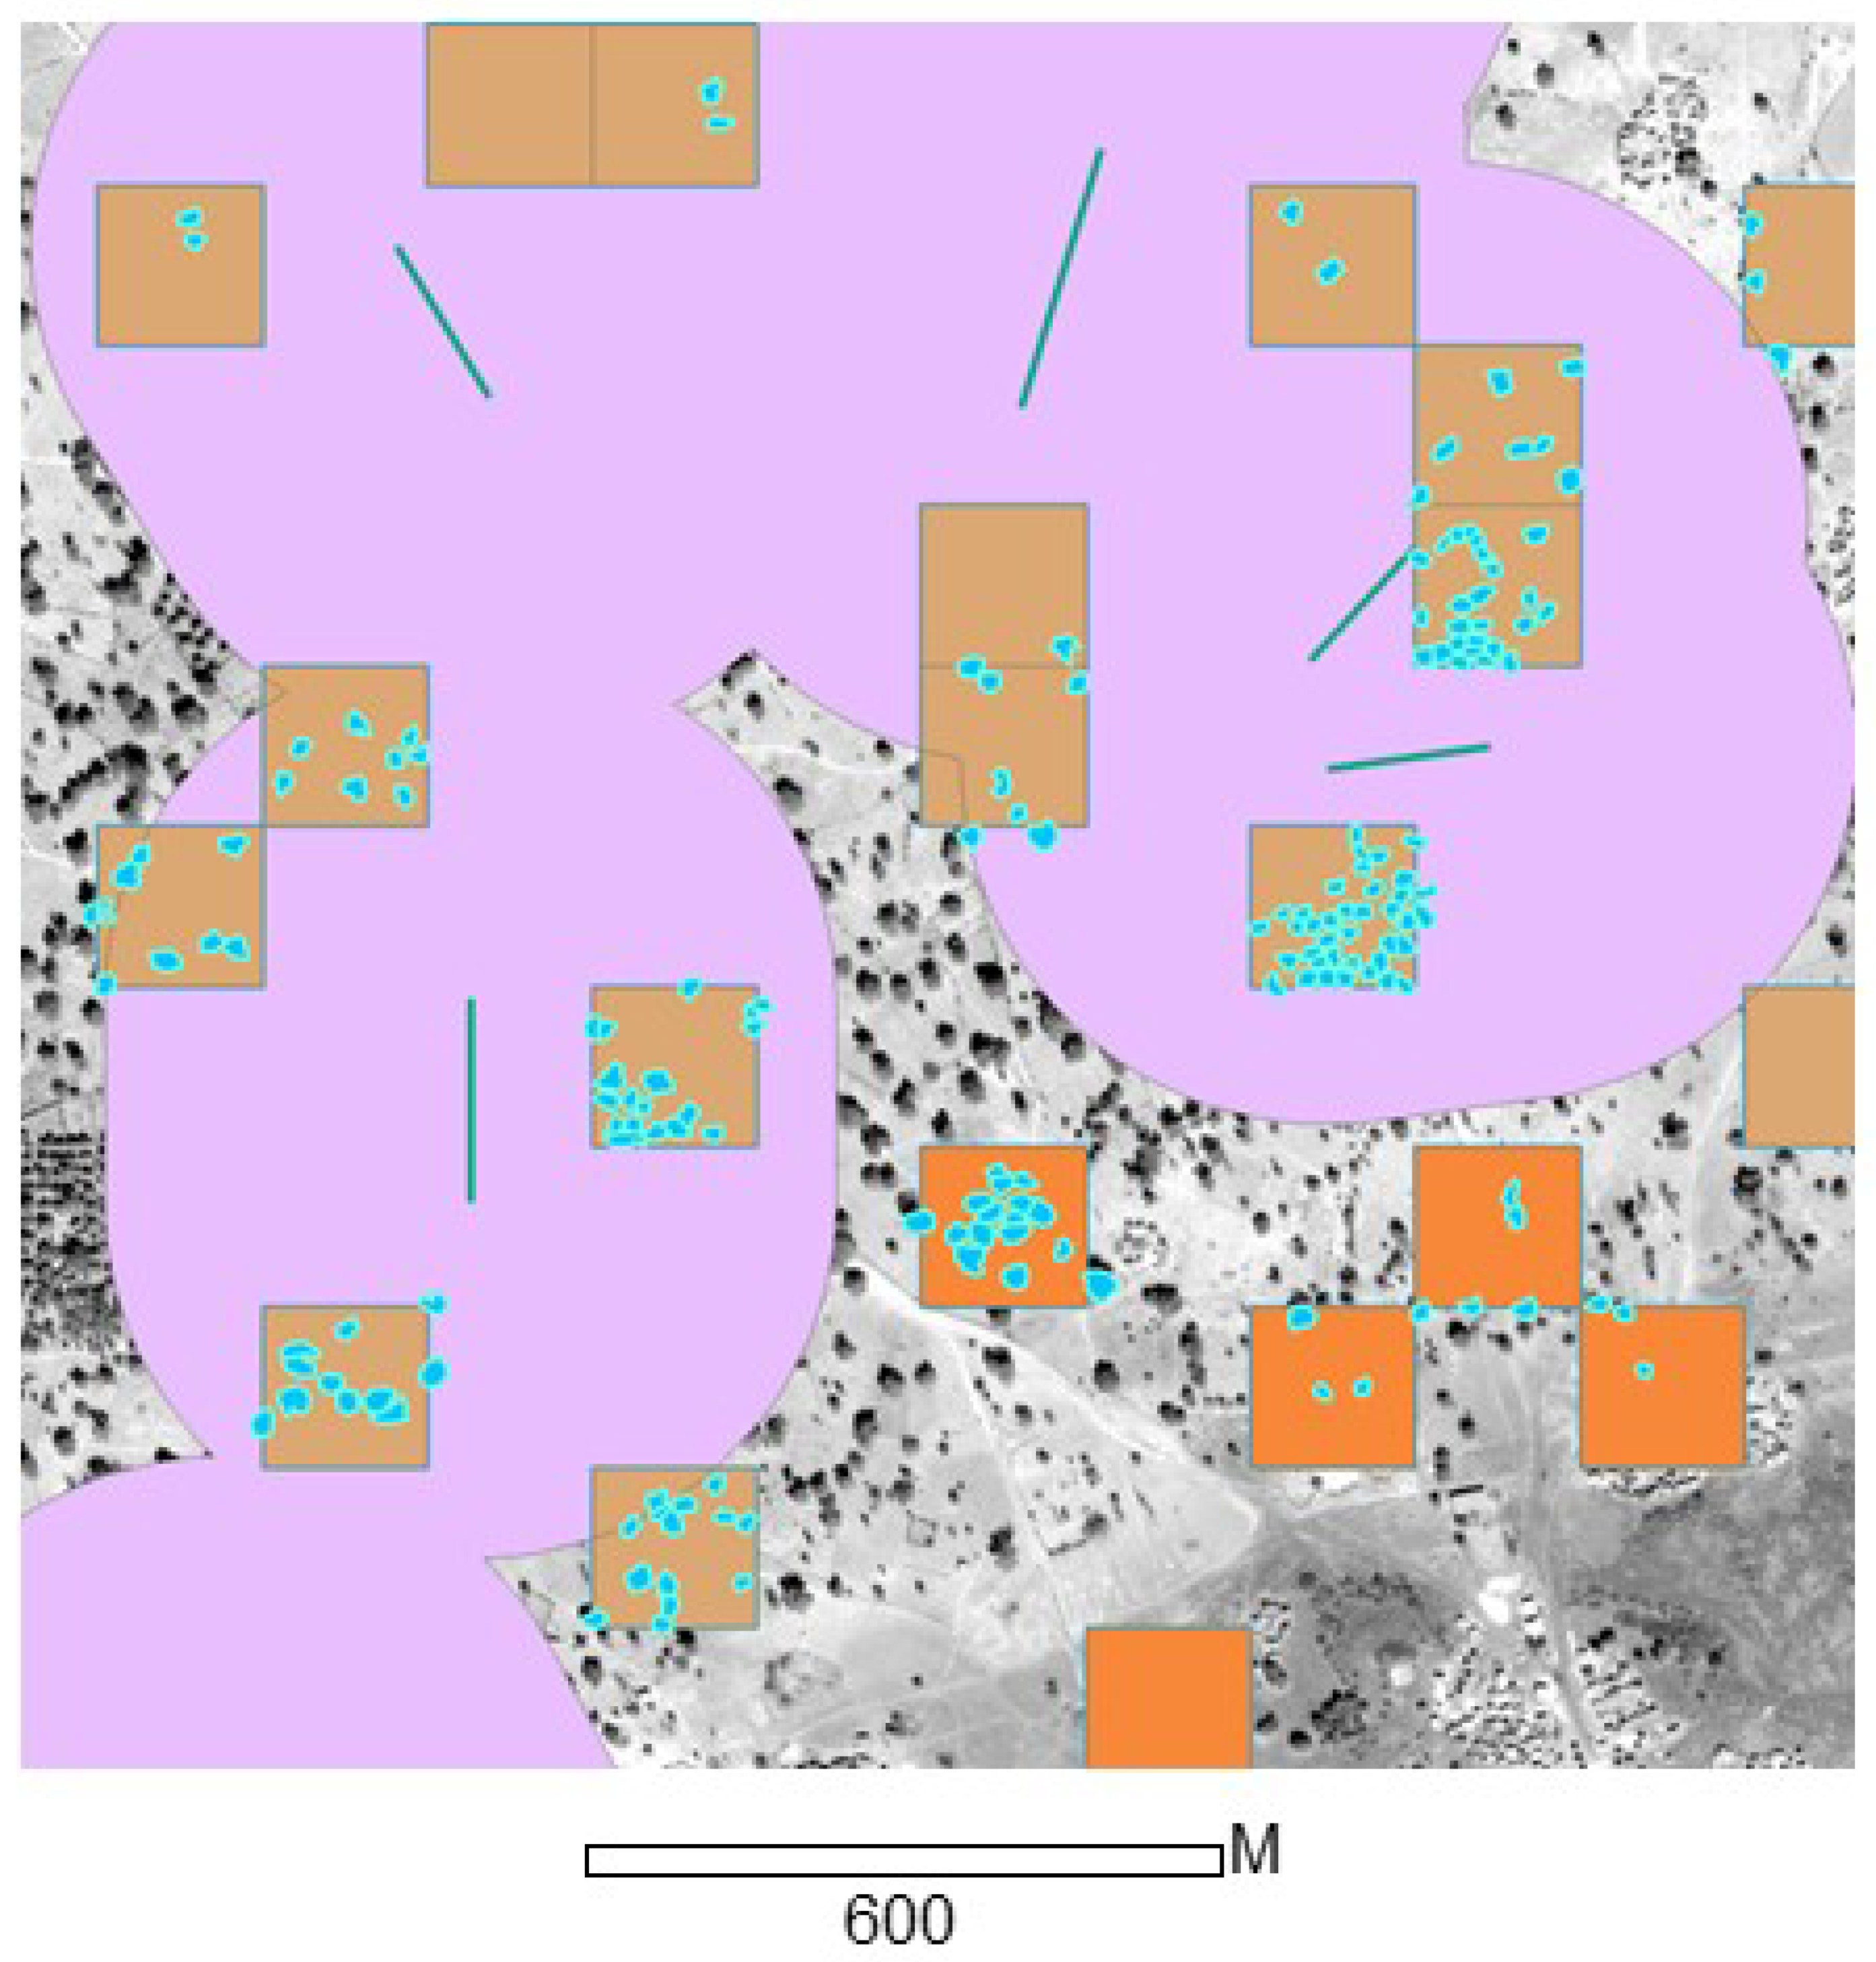
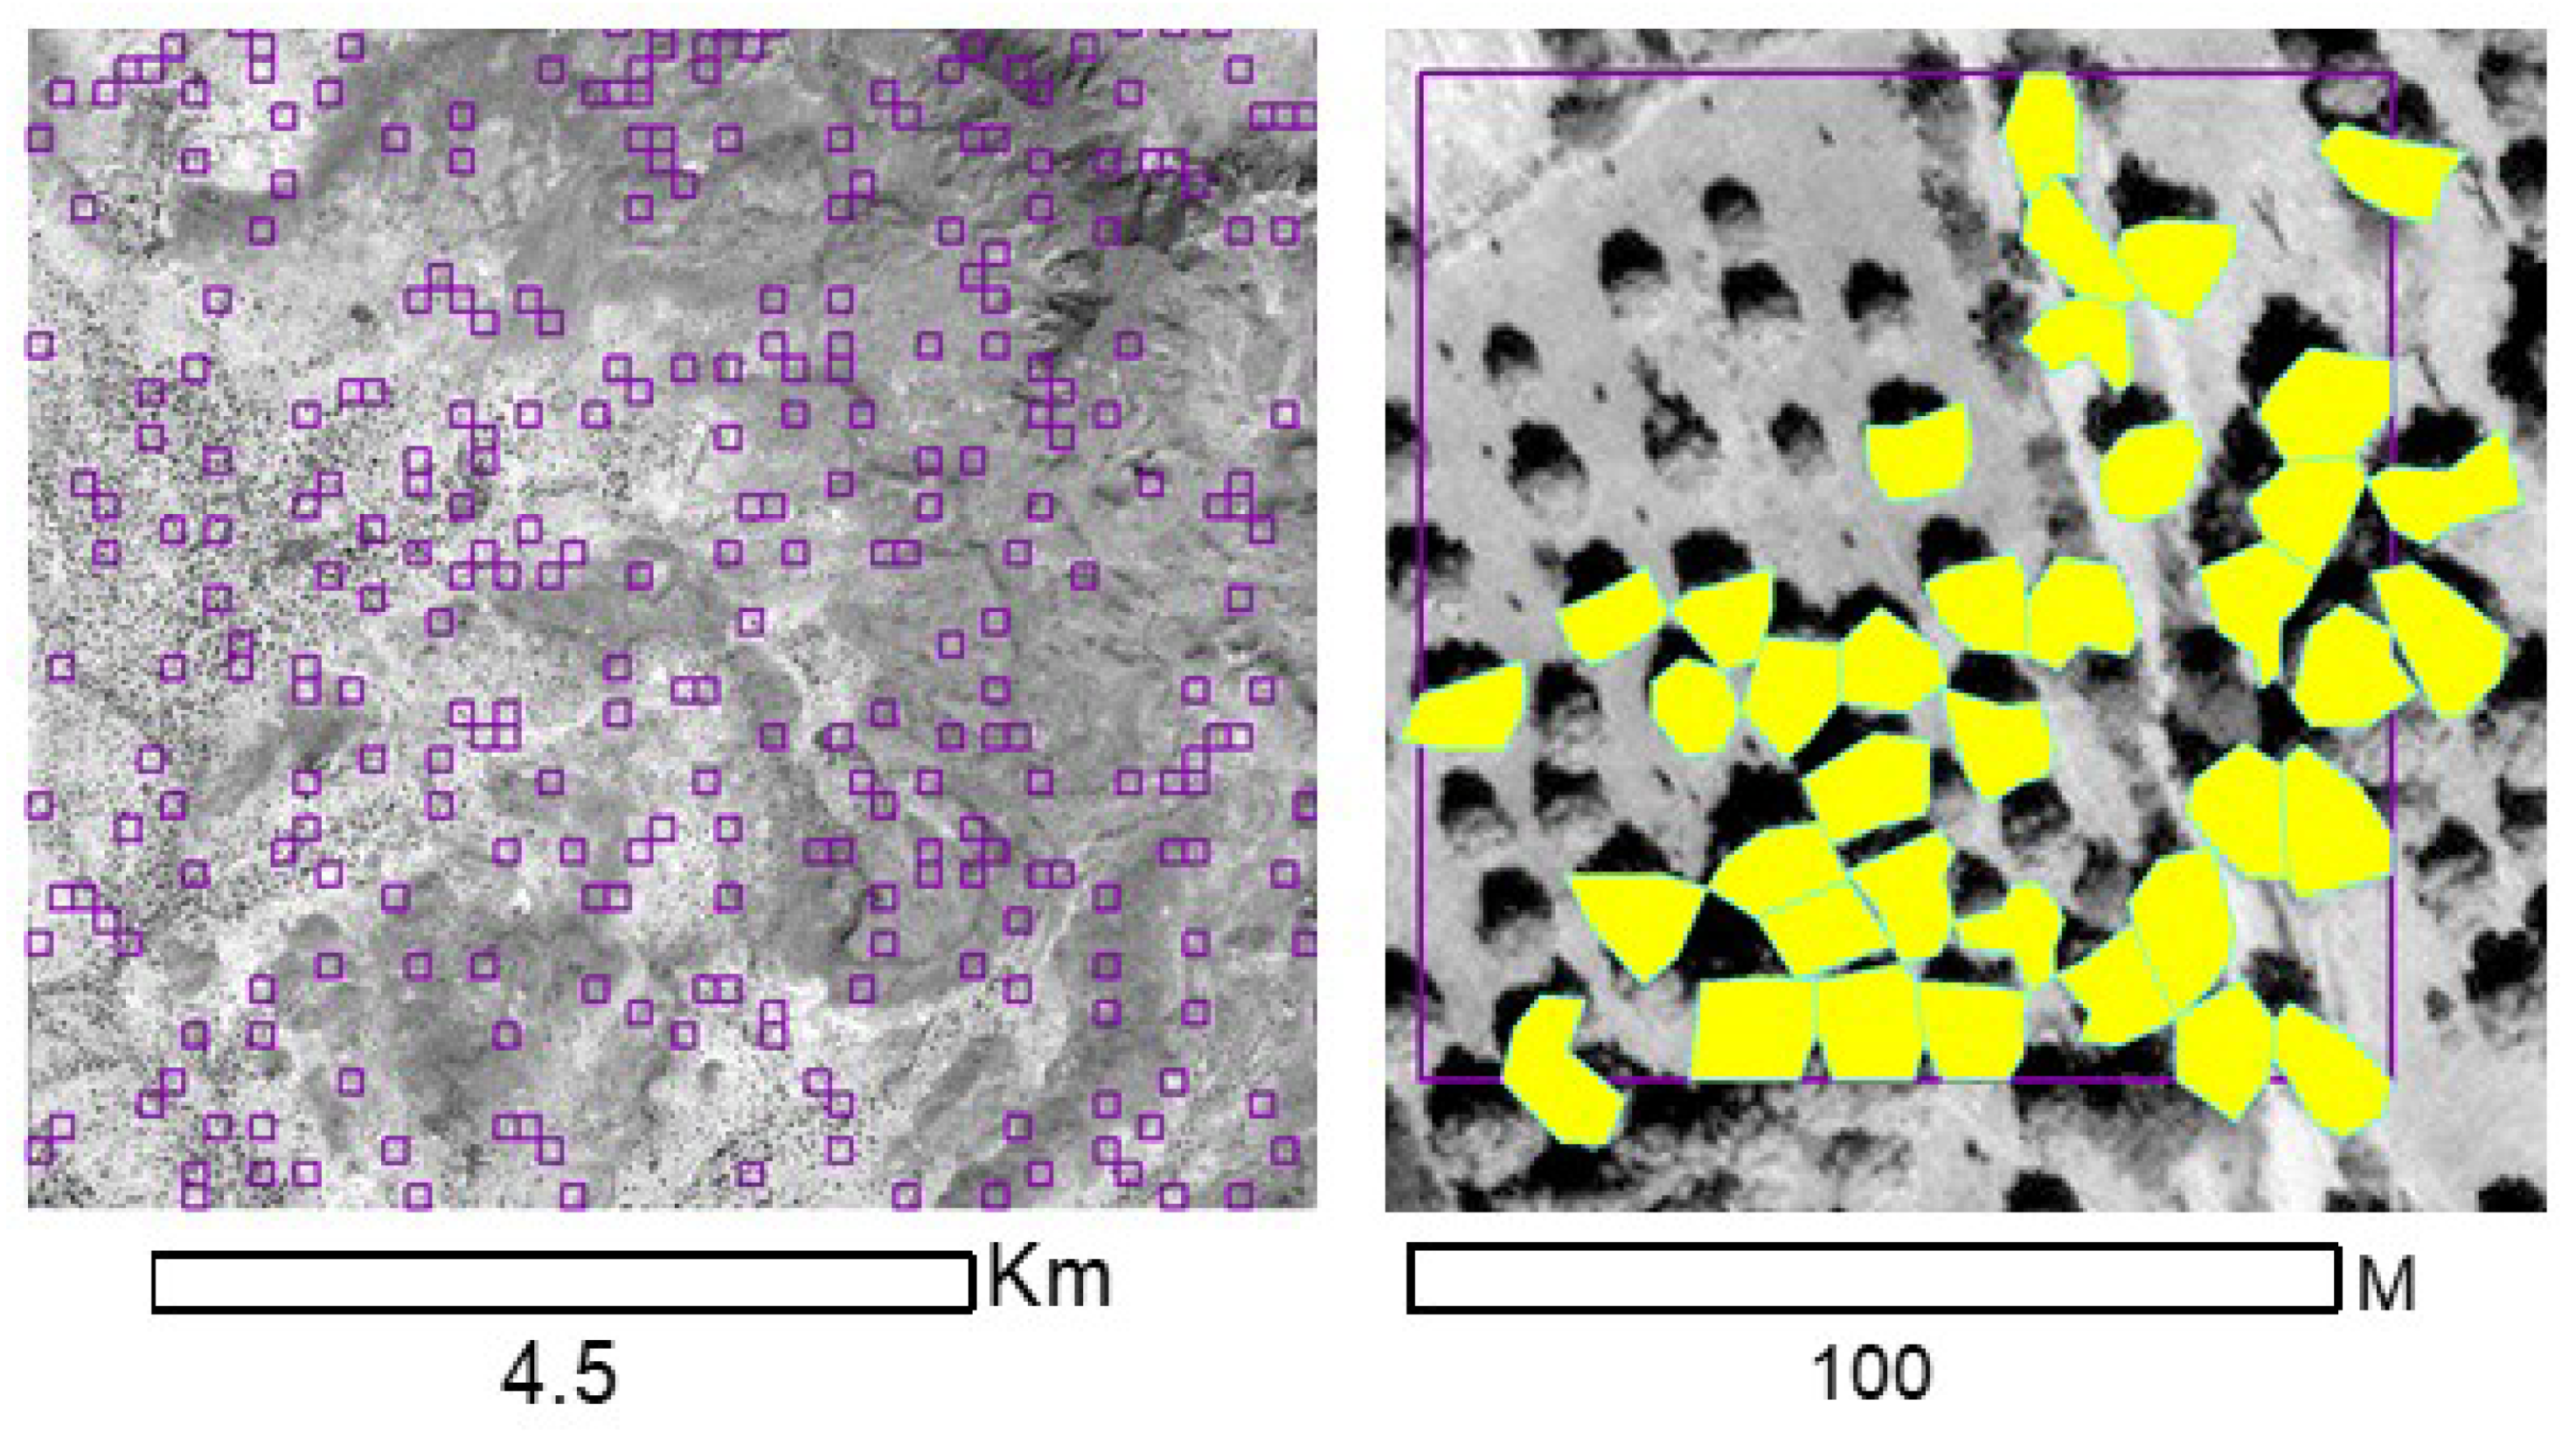
3.2.1. Digitizing SWC and Buffers
3.2.2. Digitizing Trees
3.2.3. Spatial Analysis
4. Results and Discussion
4.1. Results of Temporal Analysis
4.2. Results of Chi-Square Analysis
4.3. Limitations and Future Directions
5. Conclusions
Author Contributions
Funding
Acknowledgments
Conflicts of Interest
References
- United Nations Convention to Combat Desertification (UNCCD). The Great Green Wall: Hope for the Sahara and the Sahel; United Nations Convention to Combat Desertification: Bonn, Germany, 2016; p. 15. [Google Scholar]
- Ministère de l’Environnement et du Développement Durable. Stratégie et Plan d’Actions de l’Initiative Grande Muraille Verte au Burkina Faso; Gouvernement du Burkina Faso: Ouagadougou, Burkina Faso, 2012; p. 117. [Google Scholar]
- Goffner, D.; Sinare, H.; Gordon, L.J. The Great Green Wall for the Sahara and the Sahel Initiative as an opportunity to enhance resilience in Sahelian landscapes and livelihoods. Reg. Environ. Chang. 2019, 19, 1417–1428. [Google Scholar] [CrossRef] [Green Version]
- Marchal, J.-Y. Yatenga Nord Haute Volta: La Dynamique d’un Espace Rural Soudano-Sahelian; Office de la Recherche Scientifique et Technique Outre-Mer: Paris, France, 1983; p. 873. [Google Scholar]
- Herrmann, S.; Anyamba, A.; Tucker, C. Recent trends in vegetation dynamics in the African Sahel and their relationship to climate. Glob. Environ. Chang. 2005, 15, 394–404. [Google Scholar] [CrossRef]
- Reij, C.; Tappan, G.; Smale, M. Agroenvironmental Transformation in the Sahel: Another Kind of “Green Revolution"; International Food Policy Research Institute: Washington, DC, USA, 2009. [Google Scholar]
- Reij, C.; Tappan, G.; Belemvire, A. Changing land management practices and vegetation on the Central Plateau of Burkina Faso (1968–2002). J. Arid. Environ. 2005, 63, 642–659. [Google Scholar] [CrossRef]
- Olsson, L.; Eklundh, L.; Ardö, J. A recent greening of the Sahel—trends, patterns and potential causes. J. Arid. Environ. 2005, 63, 556–566. [Google Scholar] [CrossRef]
- Brandt, M.; Mbow, C.; Verger, A.; Samimi, C.; Fensholt, R.; Diouf, A.A.; Brt, M. Ground- and satellite-based evidence of the biophysical mechanisms behind the greening Sahel. Glob. Chang. Boil. 2015, 21, 1610–1620. [Google Scholar] [CrossRef] [PubMed] [Green Version]
- Kpadonou, R.A.B.; Owiyo, T.; Barbier, B.; Denton, F.; Rutabingwa, F.; Kiema, A. Advancing climate-smart-agriculture in developing drylands: Joint analysis of the adoption of multiple on-farm soil and water conservation technologies in West African Sahel. Land Use Policy 2017, 61, 196–207. [Google Scholar] [CrossRef]
- Zida, W.A.; Bationo, B.A.; Waaub, J.-P. Effects of Land-Use Practices on Woody Plant Cover Dynamics in Sahelian Agrosystems in Burkina Faso since the 1970s–1980s Droughts. Sustainability 2019, 11, 5908. [Google Scholar] [CrossRef] [Green Version]
- Sawadogo, H. Using soil and water conservation techniques to rehabilitate degraded lands in northwestern Burkina Faso. Int. J. Agric. Sustain. 2011, 9, 120–128. [Google Scholar] [CrossRef]
- Herrmann, S.; Diouf, A.A.; Sall, I. Beyond bioproductivity: Engaging local perspectives in land degradation monitoring and assessment. J. Arid. Environ. 2020, 173, 104002. [Google Scholar] [CrossRef]
- Herrmann, S.; Sall, I.; Sy, O. People and pixels in the Sahel: A study linking coarse-resolution remote sensing observations to land users′ perceptions of their changing environment in Senegal. Ecol. Soc. 2014, 19, 29. [Google Scholar] [CrossRef] [Green Version]
- Sendzimir, J.; Reij, C.P.; Magnuszewski, P. Rebuilding Resilience in the Sahel: Regreening in the Maradi and Zinder Regions of Niger. Ecol. Soc. 2011, 16, 1. [Google Scholar] [CrossRef] [Green Version]
- Charney, J.G. Dynamics of deserts and drought in the Sahel. Quart. J. Roy. Met. Soc. 1975, 101, 193–202. [Google Scholar] [CrossRef]
- Nana-Sinkam, S.C. Land and Environmental Degradation and Desertification in Africa; Food and Agriculture Organization: Rome, Italy, 1995. [Google Scholar]
- Swift, J. Desertification: Narratives, winners and losers. In The Lie of the Land: Challenging Received Wisdom on the African Environment; Leach, M., Mearns, R., Eds.; Heinemann: Portsmouth, NH, USA, 1996; pp. 73–90. [Google Scholar]
- Tucker, C.J.; Dregne, H.E.; Newcomb, W.W. Expansion and Contraction of the Sahara Desert from 1980 to 1990. Science 1991, 253, 299–300. [Google Scholar] [CrossRef] [PubMed]
- Mortimore, M. Changing paradigms for people-centred development in the Sahel. In The End of Desertification Disputing Environmental Change in the Drylands; Behnke, R.H., Mortimore, M., Eds.; Springer: New York, NY, USA, 2016; pp. 65–98. [Google Scholar]
- Ouedraogo, I.; Runge, J.; Eisenberg, J.; Barron, J.; Sawadogo-Kaboré, S. The Re-Greening of the Sahel: Natural Cyclicity or Human-Induced Change? Land 2014, 3, 1075–1090. [Google Scholar] [CrossRef]
- Mbow, C.; Brandt, M.; Ouedraogo, I.; De Leeuw, J.; Marshall, M. What four decades of earth observation tell us about land degradation in the sahel? Remote. Sens. 2015, 7, 4048–4067. [Google Scholar] [CrossRef] [Green Version]
- Atampugre, N. Behind the Lines of Stone: The Social Impact of a Soil and Water Conservation Project in the Sahel; Oxfam Publications: Oxford, UK, 1993; p. 192. [Google Scholar]
- Reij, C.; Thiombiano, T. Développement Rural et Environnement au Burkina Faso: La Réhabilitation de la Capacité Productive des Terroirs sur la Partie Nord du Plateau Central Entre 1980 et 2001; Vrije Universite: Amsterdam, The Netherlands, 2003; p. 82. [Google Scholar]
- Herrmann, S.; Hutchinson, C. The changing contexts of the desertification debate. J. Arid. Environ. 2005, 63, 538–555. [Google Scholar] [CrossRef]
- Belemviré, A. Impact de la Conservation de l’eau et des sols sur la Régénération Naturelle assistée; Etude Plateau Central: Ouagadougou, Burkina Faso, 2003; p. 26. [Google Scholar]
- Brandt, M.; Rasmussen, K.; Hiernaux, P.; Herrmann, S.; Tucker, C.J.; Tong, X.; Tian, F.; Mertz, O.; Kergoat, L.; Mbow, C.; et al. Reduction of tree cover in West African woodlands and promotion in semi-arid farmlands. Nat. Geosci. 2018, 11, 328–333. [Google Scholar] [CrossRef]
- Fensholt, R.; Rasmussen, K.; Kaspersen, P.S.; Huber, S.; Horion, S.; Swinnen, E. Assessing Land Degradation/Recovery in the African Sahel from Long-Term Earth Observation Based Primary Productivity and Precipitation Relationships. Remote. Sens. 2013, 5, 664–686. [Google Scholar] [CrossRef] [Green Version]
- Dardel, C.; Kergoat, L.; Hiernaux, P.; Mougin, E.; Grippa, M.; Tucker, C. Re-greening Sahel: 30years of remote sensing data and field observations (Mali, Niger). Remote. Sens. Environ. 2014, 140, 350–364. [Google Scholar] [CrossRef]
- Brandt, M.; Romankiewicz, C.; Spiekermann, R.; Samimi, C. Environmental change in time series—An interdisciplinary study in the Sahel of Mali and Senegal. J. Arid. Environ. 2014, 105, 52–63. [Google Scholar] [CrossRef]
- Batterbury, S.P.J. The political ecology of environmental management in semi-arid West Africa: Case studies from the Central Plateau, Burkina Faso. Ph.D. Thesis, Clark University, Worcester, MA, USA, 1997. [Google Scholar]
- Batterbury, S. Local environmental management, land degradation and the “Gestion des Terroirs” approach in West Africa: Policies and pitfalls. J. Int. Dev. 1998, 10, 871–989. [Google Scholar] [CrossRef]
- West, C.T. Documenting livelihood trajectories in the context of development interventions in northern Burkina Faso. J. Politi- Ecol. 2013, 20, 342–360. [Google Scholar] [CrossRef] [Green Version]
- West, C.T. Public and private responses to food insecurity: Complementarity in Burkina Faso. Cult. Agric. Food Environ. 2015, 37, 53–62. [Google Scholar] [CrossRef]
- Critchley, W. Looking after Our Land: Soil and Water Conservation in Dryland Africa; Graham, O., Ed.; Oxfam: Oxford, UK, 1991. [Google Scholar]
- Marchal, J.-Y. En Afrique des savanes, fractionnement des unités d’exploitation rurales ou chacun pour soi. Cahiers ORSTOM Séries des Sciences Humaines 1987, 23, 445–454. [Google Scholar]
- Ouedraogo, M.; Kaboré, V. The zaï: A traditional technique for the rehabilitation of degraded land in the Yatenga, Burkina Faso. In Sustaining the Soil: Indigenous Soil and Water Conservation in Africa; Reij, C., Scoones, I., Toulmin, C., Eds.; Earthscan: London, UK, 1997; pp. 80–84. [Google Scholar]
- Nyamekye, C.; Thiel, M.; Schönbrodt-Stitt, S.; Zoungrana, B.J.-B.; Amekudzi, L.K. Soil and Water Conservation in Burkina Faso, West Africa. Sustainability 2018, 10, 3182. [Google Scholar] [CrossRef] [Green Version]
- Reij, C.; Winterbottom, R. Scaling up Regreening: Six Steps to Success: A Practical Approach to Forest and Landscape Restoration; World Resources Institute: Washington, DC, USA, 2015. [Google Scholar]
- Reij, C.; Scoones, I.; Toulmin, C. (Eds.) Sustaining the Soil: Indigenous Soil and Water Conservation in Africa; Earthscan: London, UK, 1997. [Google Scholar]
- Bayala, J.; Sanou, J.; Teklehaimanot, Z.; Kalinganire, A.; Ouedraogo, S. Parklands for buffering climate risk and sustaining agricultural production in the Sahel of West Africa. Curr. Opin. Environ. Sustain. 2014, 6, 28–34. [Google Scholar] [CrossRef] [Green Version]
- West, C.T.; Moody, A.J.; Nébié, E.K.; Sanon, O. Ground-Truthing Sahelian Greening: Ethnographic and Spatial Evidence from Burkina Faso. Hum. Ecol. 2017, 45, 89–101. [Google Scholar] [CrossRef]
- West, C.T.; Somé, A.; Nebié, E.K. Famines are a thing of the past: Food security trends in Northern Burkina Faso. Hum. Organ. 2014, 73, 340–350. [Google Scholar] [CrossRef]
- West, C.T. Household extension and fragmentation: Investigating the socio-environmental dynamics of mossi domestic transitions. Hum. Ecol. 2010, 38, 363–376. [Google Scholar] [CrossRef]
- Institut Géographique du Burkina (IGB). Projet de Cartographie Topographique Numérique au Burkina Faso; IGB: Ouagadougou, Burkina Faso, 2014. [Google Scholar]
- United Nations Convention to Combat Desertification (UNCCD). The Global Land Outlook, West Africa Thematic Report; UNCCD: Bonn, Germany, 2019. [Google Scholar]

| Locality | Product | Scene ID | Acquisition Date | Bands - MS | Max Pixel Resolution (m2) |
|---|---|---|---|---|---|
| Sakou | WorldView–2 | 103001001D92A600 | 01–05–2013 | R, G, B, NIR | 0.53977 (PAN); 1.97 (MS) |
| Kouka | Geo Eye–1 | 1050410010266D00 | 03–10–2014 | R, G, B, NIR | 0.52997 (PAN); 1.97 (MS) |
| Loulouka | Geo Eye–1 | 1050410010266D00 | 03–10–2014 | R, G, B, NIR | 0.52997 (PAN); 1.97 (MS) |
| All | BNDT | -- | 2014 | -- | None - vector |
| All | IGB aerial photos | -- | 12-15-1992 | Panchromatic | ~0.25 (PAN) |
| Locality | Total Trees | Total Dams | Total Trees Inside Buffers (within Sample Grid Cells) | Total Area Treated by SWC (ha) |
|---|---|---|---|---|
| Sakou | 679 | 146 | 535 | 939 |
| Kouka | 198 | 50 | 55 | 487 |
| Loulouka | 330 | 51 | 66 | 545 |
| SWC Buffer | ||||||
|---|---|---|---|---|---|---|
| Locality | Yes | No | Total | |||
| Sakou a** | Trees | Yes | obs. | 77 | 32 | 109 |
| exp. | 51 | 58 | 109 | |||
| No | obs. | 65 | 130 | 195 | ||
| exp. | 91 | 104 | 195 | |||
| Total | 142 | 162 | 304 | |||
| Kouka b | Trees | Yes | obs. | 25 | 50 | 75 |
| exp. | 20 | 55 | 75 | |||
| No | obs. | 56 | 172 | 228 | ||
| exp. | 61 | 167 | 228 | |||
| Total | 81 | 222 | 303 | |||
| Loulouka c | Trees | Yes | obs. | 28 | 73 | 101 |
| exp. | 32 | 69 | 101 | |||
| No | obs. | 97 | 192 | 289 | ||
| exp. | 93 | 196 | 289 | |||
| Total | 125 | 265 | 390 | |||
| All d** | Trees | Yes | obs. | 130 | 155 | 712 |
| exp. | 100 | 186 | 712 | |||
| No | obs. | 218 | 494 | 285 | ||
| exp. | 249 | 464 | 285 | |||
| Total | 348 | 649 | 997 | |||
© 2020 by the authors. Licensee MDPI, Basel, Switzerland. This article is an open access article distributed under the terms and conditions of the Creative Commons Attribution (CC BY) license (http://creativecommons.org/licenses/by/4.0/).
Share and Cite
Thor West, C.; Benecky, S.; Karlsson, C.; Reiss, B.; Moody, A.J. Bottom-Up Perspectives on the Re-Greening of the Sahel: An Evaluation of the Spatial Relationship between Soil and Water Conservation (SWC) and Tree-Cover in Burkina Faso. Land 2020, 9, 208. https://doi.org/10.3390/land9060208
Thor West C, Benecky S, Karlsson C, Reiss B, Moody AJ. Bottom-Up Perspectives on the Re-Greening of the Sahel: An Evaluation of the Spatial Relationship between Soil and Water Conservation (SWC) and Tree-Cover in Burkina Faso. Land. 2020; 9(6):208. https://doi.org/10.3390/land9060208
Chicago/Turabian StyleThor West, Colin, Sarah Benecky, Cassandra Karlsson, Bella Reiss, and Aaron J. Moody. 2020. "Bottom-Up Perspectives on the Re-Greening of the Sahel: An Evaluation of the Spatial Relationship between Soil and Water Conservation (SWC) and Tree-Cover in Burkina Faso" Land 9, no. 6: 208. https://doi.org/10.3390/land9060208