Infiltration Capacity of Rain Gardens Using Full-Scale Test Method: Effect of Infiltration System on Groundwater Levels in Bergen, Norway


1
Department Resources & Environment, Geological Survey of Norway, P.O. Box 6315 Torgarden, 7491 Trondheim, Norway
2
Department Research Centre for Built Environment NoorderRuimte, Hanze University of Applied Sciences Groningen, Zernikeplein 7, P.O. Box 30030 Groningen, The Netherlands
3
Deltares, Daltonlaan 600, 3584 BK Utrecht Postbus, 85467 3508 AL Utrecht, The Netherlands
*
Author to whom correspondence should be addressed.
Land 2020, 9(12), 520; https://doi.org/10.3390/land9120520
Submission received: 14 November 2020
/
Revised: 8 December 2020
/
Accepted: 12 December 2020
/
Published: 15 December 2020
(This article belongs to the Special Issue Urban Ecosystem Services)
Abstract
:The rain gardens at Bryggen in Bergen, Western Norway, is designed to collect, retain, and infiltrate surface rainfall runoff water, recharge the groundwater, and replenish soil moisture. The hydraulic infiltration capacity of the Sustainable Drainage System (SuDS), here rain gardens, has been tested with small-scale and full-scale infiltration tests. Results show that infiltration capacity meets the requirement and is more than sufficient for infiltration in a cold climate. The results from small-scale test, 245–404 mm/h, shows lower infiltration rates than the full-scale infiltration test, with 510–1600 mm/h. As predicted, an immediate response of the full-scale infiltration test is shown on the groundwater monitoring in the wells located closest to the infiltration point (<30 m), with a ca. 2 days delayed response in the wells further away (75–100 m). Results show that there is sufficient capacity for a larger drainage area to be connected to the infiltration systems. This study contributes to the understanding of the dynamics of infiltration systems such as how a rain garden interacts with local, urban water cycle, both in the hydrological and hydrogeological aspects. The results from this study show that infiltration systems help to protect and preserve the organic rich cultural layers below, as well as help with testing and evaluating of the efficiency, i.e., SuDS may have multiple functions, not only storm water retention. The functionality is tested with water volumes of 40 m3 (600 L/min for 2 h and 10 min), comparable to a flash flood, which give an evaluation of the infiltration capacity of the system.
1. Introduction
Urbanization and climate change effect the water balance in our cities, resulting in challenges such as flooding, droughts, and heat stress. The implementation of Sustainable Drainage Systems (SuDS) or small-scale Nature-Based Solutions (NBS) can help to restore the water balance by capturing, retaining, treating, and infiltrating stormwater that runs off roofs and impermeable surfaces and potentially into the subsurface [1,2,3,4,5]. This will contribute to minimizing flooding, restoring groundwater levels, increasing soil moisture to alleviate drought impacts, and lowering temperatures by evapotranspiration to mitigate heat stress [2,6,7,8,9,10,11].
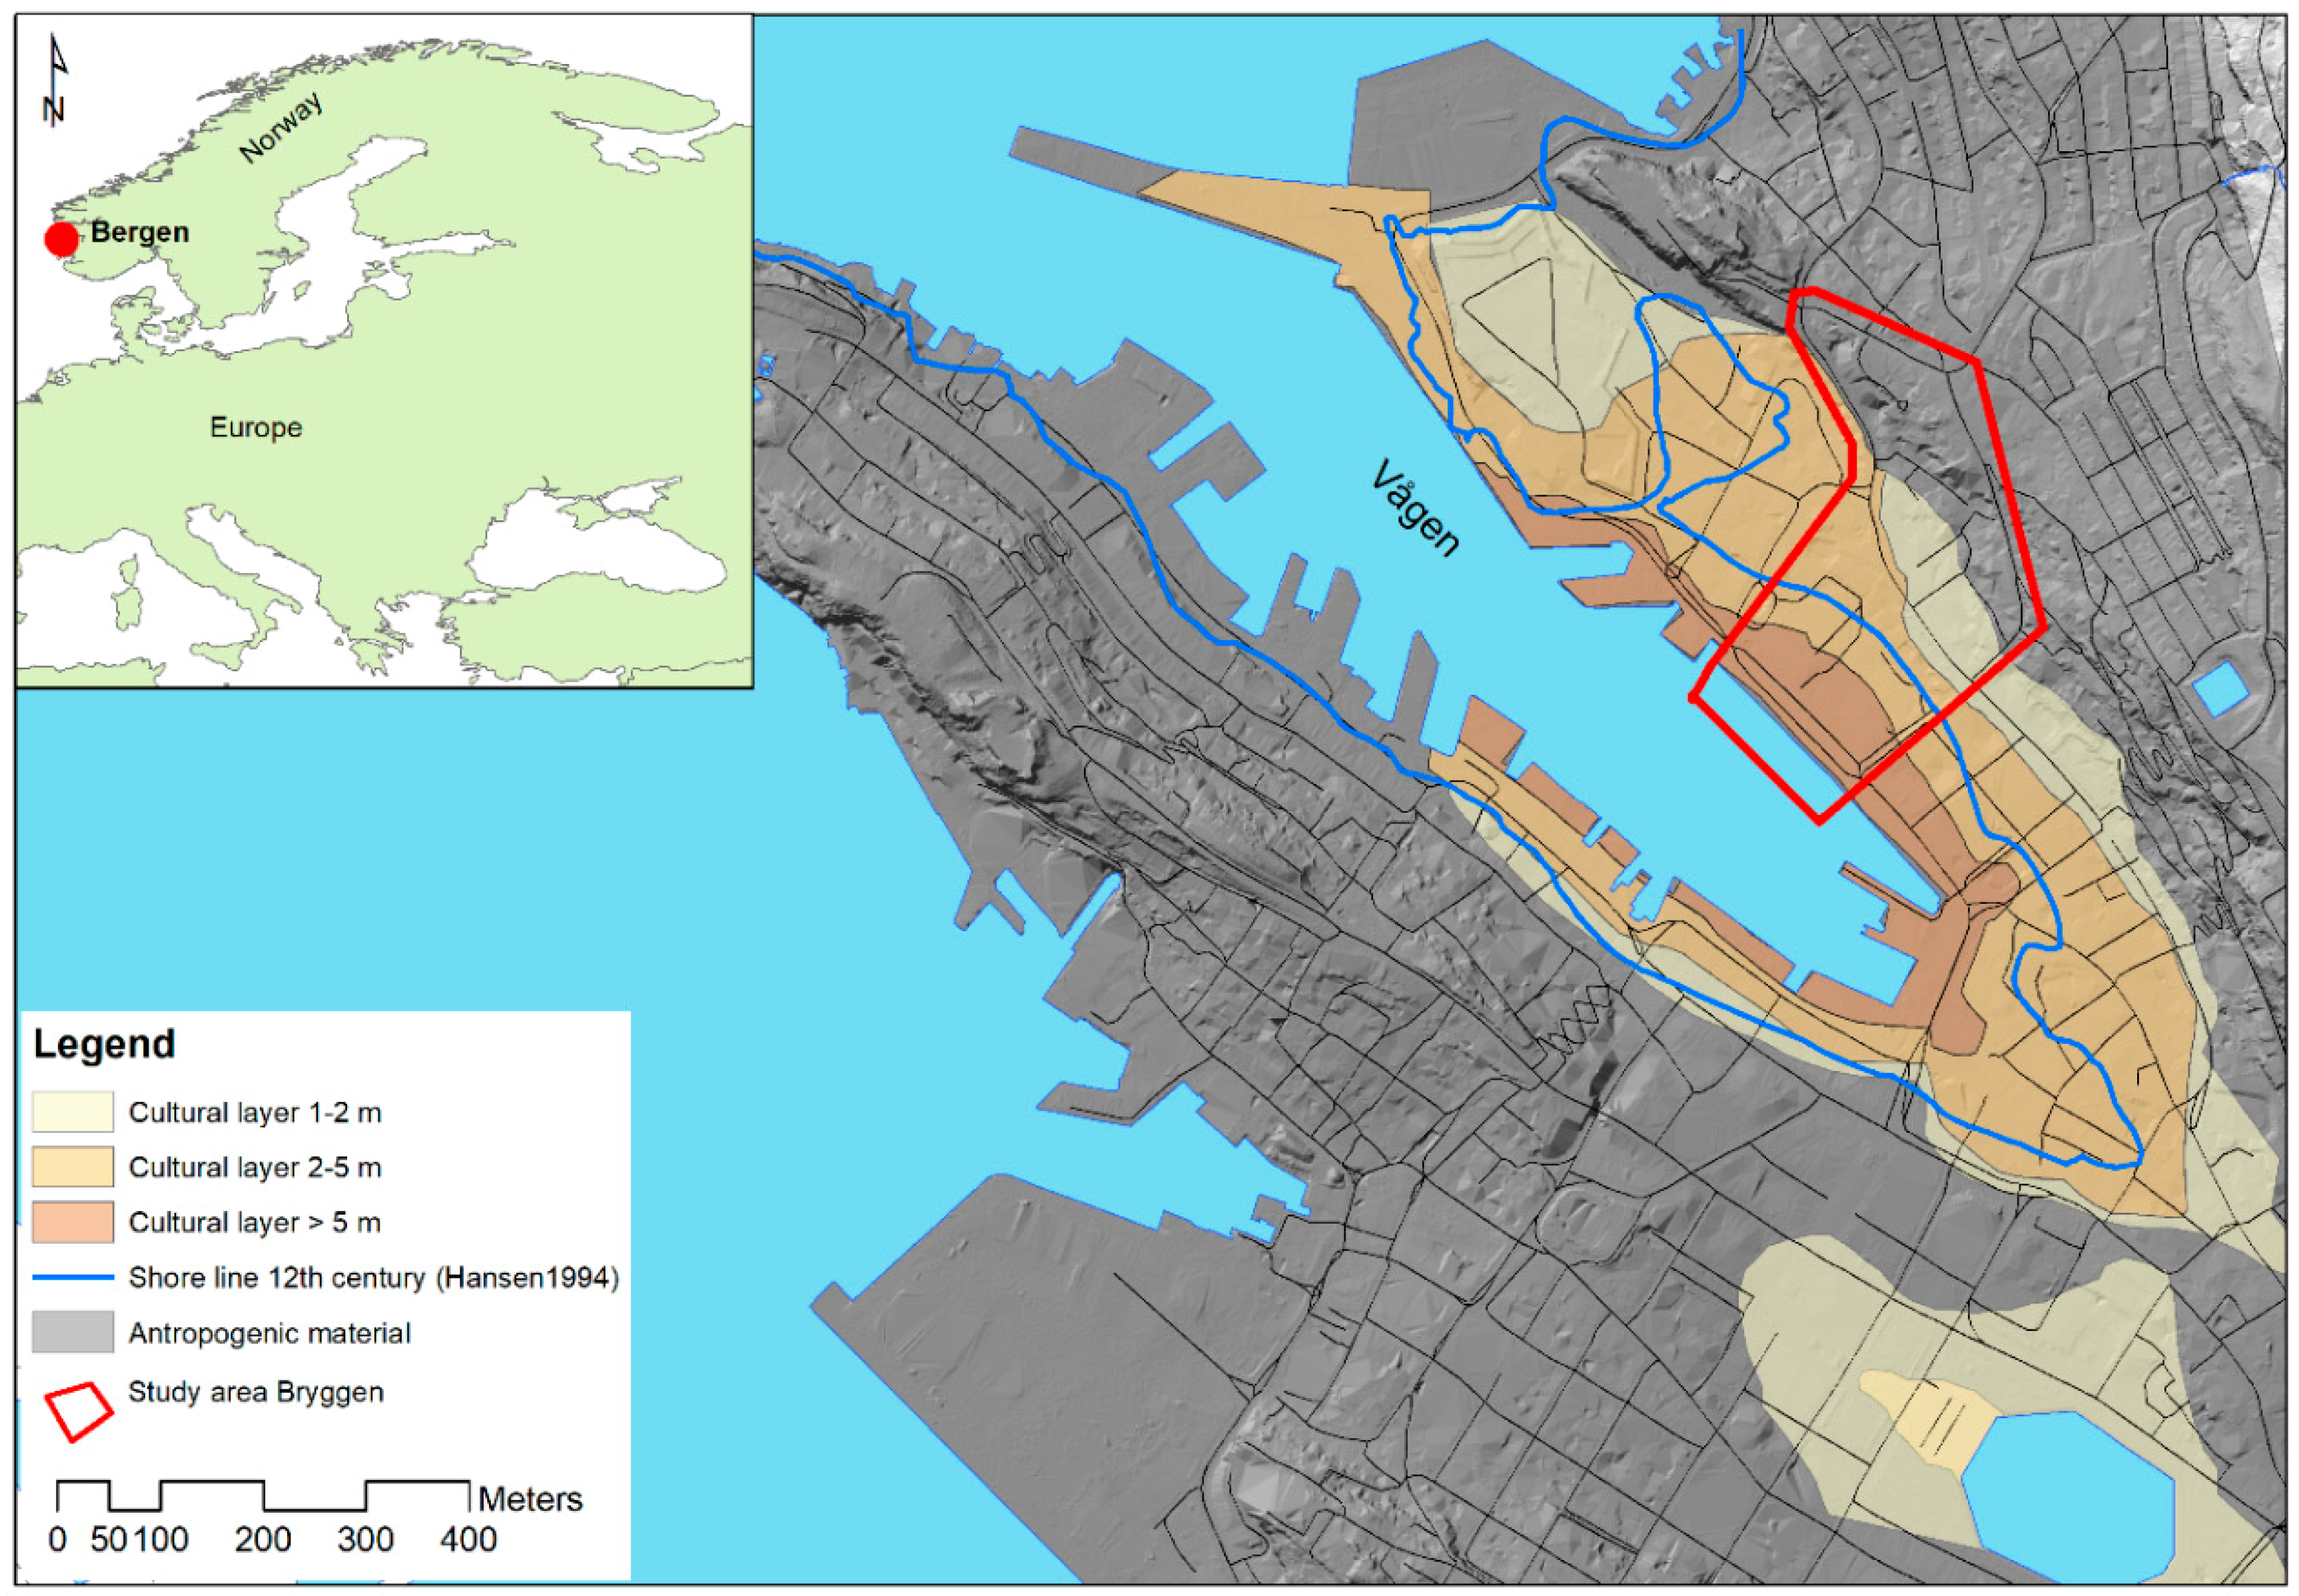
As Wakode et al. [12] point out, the urban water cycle is different from that in non-urban areas, where urbanization can influence natural groundwater recharge due to the restriction of infiltration by impermeable surfaces. Even though leakage from water-wastewater infrastructure is known to recharge the groundwater in cities [13,14] this was not substantial enough to recharge and stabilize the groundwater levels under the UNESCO World Heritage site Bryggen Wharf in Bergen, Western Norway (Figure 1) [15,16,17,18]. Therefore, the connected infiltration system at Bryggen was intentionally built for that purpose (Figure 1).
The sustainable infiltration and drainage system that has been implemented within the premises of the Bryggen is the largest in Norway (Figure 2). It was built with the purpose of raising and stabilizing the groundwater level and increasing the soil moisture in the cultural heritage layers in the ground below Bryggen [19,20,21,22]. The infiltration system has proven its effectiveness for raising the groundwater level to desired levels for preservation [16,22]. However, the infiltration system has not been full-scale tested for its infiltration capacity and interaction with the groundwater below. Such testing of SuDS is commonly executed with small-scale infiltrometer tests [23,24,25] and further upscaled in modeling tools. However, small-scale testing, such as Modified Phillipe–Dunne (MPD) infiltration tests, does not give a picture of the overfall infiltration capacity of the SuDS. Therefore, a full-scale methodology was first implemented for testing impermeable pavements [26,27] and further used for other infiltration systems such as rain gardens, swales etc. [28,29,30].
A full-scale infiltration capacity test at Bryggen will contribute to the understanding of the urban water cycle, by quantifying the hydraulic conductivity and infiltration capacity of SuDS, the connectivity to groundwater levels, and thus the overall effectiveness of this system in a larger hydrological and hydrogeological context. SuDS in cold climates require higher infiltration capacity than warm climates to maintain functionality below 0 °C [31,32]. Bryggen is a unique site due to its 35 boreholes with continuous measurements of groundwater level, soil moisture, oxygen content, and other parameters that are essential for the in situ preservation of the cultural heritages below surface. The subsurface data were continuously collected from 2007, gradually expanding with additional boreholes until 2015 and will continue monitoring onwards [19,21].
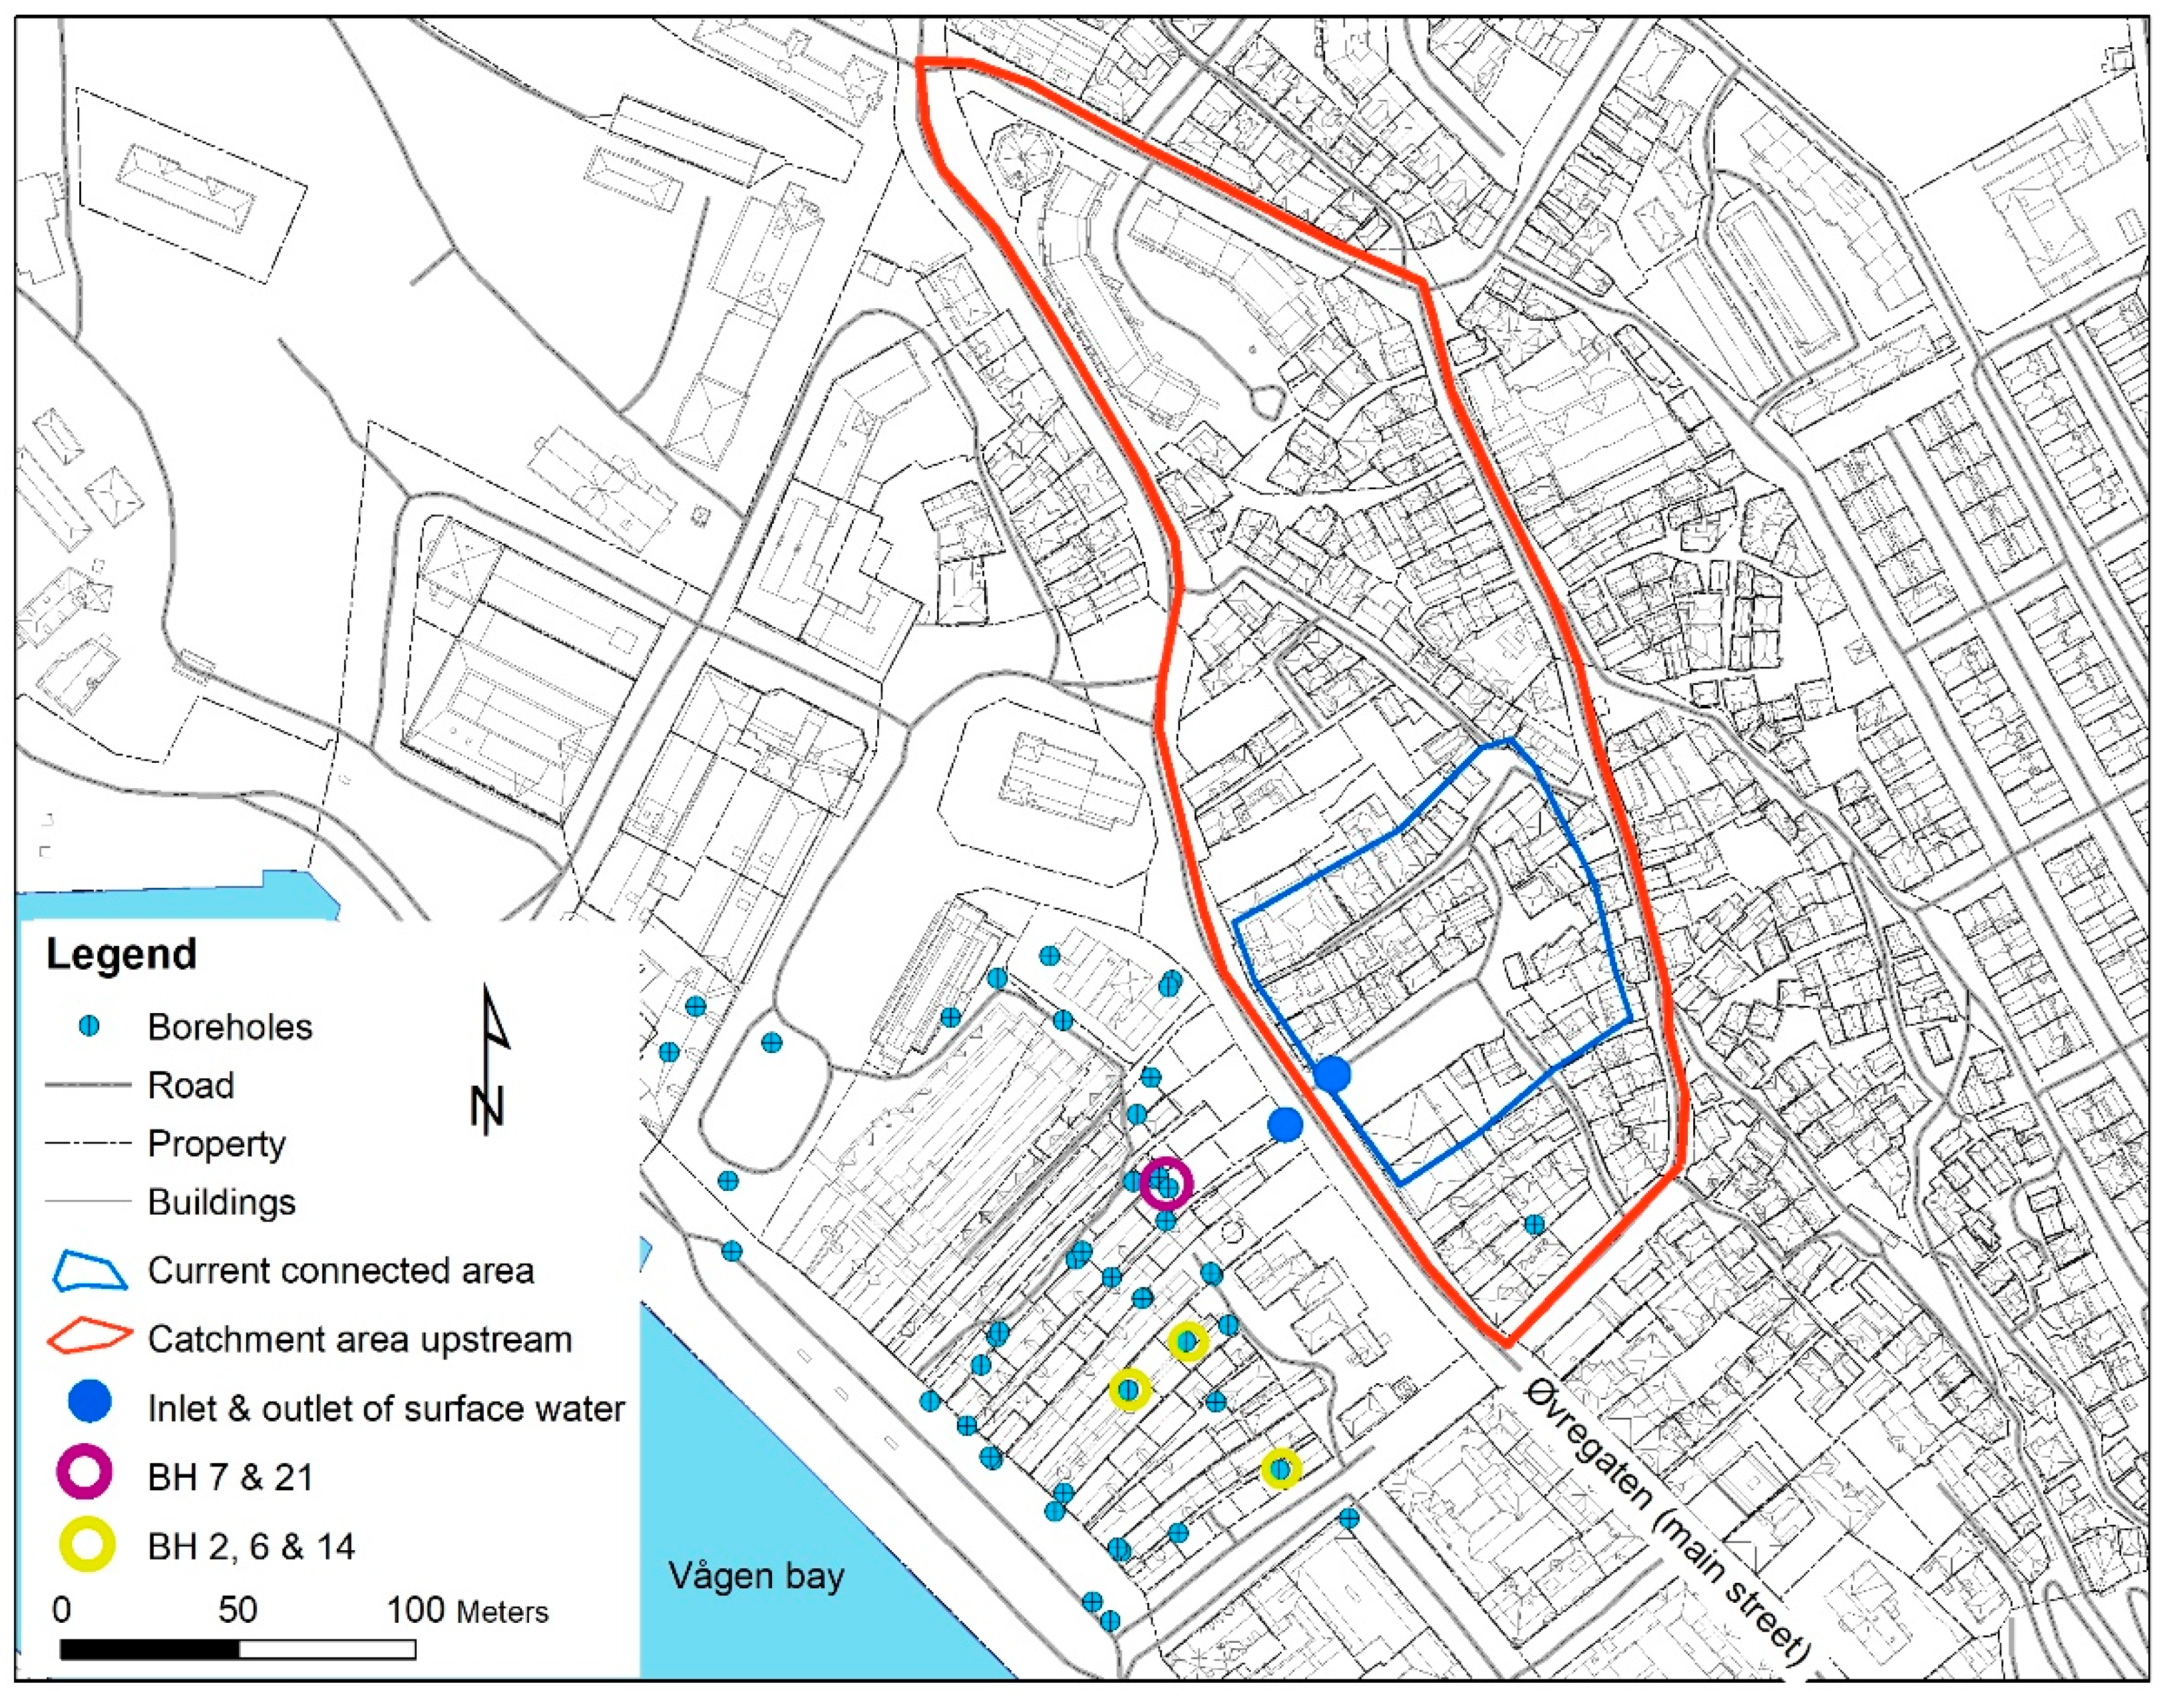
At present, only a limited part of the catchment area is connected to the infiltration systems (Figure 3). The municipality inquires if the capacity of the rain gardens is acceptable to connect the entire catchment area with stormwater from both roofs and streets to the system. Therefore, the rain gardens were assessed to determine if they work as designed, and if the infiltration capacity and the effectiveness is satisfactory to preserve the cultural layers and thereby enlarge the connected runoff area. The implementation of SuDS at locations where the infiltration of water is a challenge, such as on cultural layers, is a challenge for urban planners, water authorities, and other stakeholders in municipalities. This paper will describe the full-scale infiltration method [26,28] used for testing the hydraulic infiltration capacity of the rain gardens at Bryggen and the response on the groundwater level measured in several monitoring wells.
1.1. Study Area
The infiltration system at Bryggen Wharf is located in the Medieval City center of Bergen, the largest city on the west coast and second largest city in Norway (Figure 1). The average temperatures are 23.8 °C in summer and −4.7 °C in winter, giving an annual average temperature of 8.6 °C. During 61 years of data collected, only 17 winters had temperatures below 0 °C [33]. Bergen is one of the wettest places in Europe, with an annual precipitation of 2250 mm/year [33]. The topography is steep hillsides covered with forest vegetation on scares soil, down to flat laying formerly shorelines with thicker natural sediments and anthropogenic layers (Figure 1). The relief goes from 320 m above sea level to 1 m a.s.l. over a distance of 1 km. These natural conditions make surface runoff water abundant.
Bryggen is a Hanseatic Wharf where several of the buildings originate from 1702 [34]. The Medieval city, located along the shore of Vågen bay, is to a large degree built on anthropogenic waste including remains from city fires and industrial and household waste. These have accumulated into abundant anthropogenic cultural heritage layers rich on organic content that locally are more than 10 m thick [19,21]. The reduction of soil moisture or lowering of the groundwater level will introduce oxygen into the organic matter. This will accelerate the oxidation and disintegration of the organic material causing collapse and compaction of the organic layers in the subsurface [17,20]. Due to the slow decay causing damage to the Wharf, the Bryggen project was initiated in 2010 [17,20,21]. The abovementioned processes will further cause subsidence of the ground and damage on buildings and infrastructure [18,35].
The ground beneath Bryggen is characterized by a steeply sloping mountain side, with depth to bedrock from 2 to 12 m. The layers consist of up to 10 m of organic, anthropogenic deposit as described above, on top of beach sand and moraine of ca. 2 m thickness. The recharge of the groundwater is primarily by runoff from the uphill catchment area [16,36]. A 3D hydrogeological model of Bryggen and its subsurface has been made to understand the groundwater movement, hydrogeological characteristics of the subsurface layers and processes linked to water, or the lack of water [16,17,20,36].
A monitoring system was established in 2001, which was expanded in 2010 with a total of 35 monitoring wells [37]. Initially, this network of monitoring wells was placed to understand the complex flow system in the area and to identify the causes of the local groundwater levels and observed, increased subsidence rates [16,18,29,35]. An automated groundwater-monitoring system was installed in the wells, for high frequency of measurements. Some boreholes are dedicated to measuring parameters for archaeological purposes [17] while other boreholes are continuously monitored for groundwater levels [21], using equipment such as Schlumberger Micro diver DI 501 [38]. During the Bryggen project a strong link between the level and stability of the groundwater and the decay of the cultural layers was established [16,17,20,22,39]. Therefore, an infiltration system was installed in the ground in and around the Wharf to infiltrate as much surface water as possible into the ground (Figure 2) [18,29,40]. All measures at Bryggen, including monitoring wells and SuDS, were directed towards raising and stabilizing groundwater levels. The long-term goal for the area was to elevate groundwater levels to about 1 m below the surface [16].
1.2. The Rain Garden at Bryggen
The rain gardens in Bryggen are a bioretention system that allows runoff to temporarily pond in a shallow planted depression before filtering through vegetation, roots, and underlying soils for infiltration [2,3,41]. The rain gardens have the following primary functions: infiltration, storage, and purification. The catchment area, indicted in Figure 3, is upstream of the main street “Øvregaten” (Figure 3), which is salted during winter to reduce icing and traffic incidence. Plants in the rain gardens are not salt tolerant [29]. To avoid excess salt from the winter salting, water from the watershed is collected in a manhole on the other side of the street and brought in a pipeline underneath the main street to a manhole connected to the rain gardens, as indicated in Figure 2 and with blue points in Figure 3. The infiltration system has two inflow points from the catchment area: into the rain gardens and into the tank, as indicated in Figure 2. Figure 3 shows the current connected area for surface water (blue line) and the total upstream catchment area (red line) for the rain gardens and infiltration system.
2. Methods
The full-scale infiltration test was executed on 6 September 2017, with heavy rain that started the day before with a total of 30.5 mm rain fall [33]. Therefore, the soil was moist and the rain garden saturated with water (Table 1). The days 5th to 14th of September were wet with 28.2 mm precipitation on the 9th [33]. The additional contribution of water through precipitation is reflected in the results from the groundwater level monitoring.
The compartment B of the rain gardens has an area of 180 m2, a depth of 78 cm consisting of three layers: a filter medium consisting of sandy soil (38 cm, 60% soil and 40% sand), a drainage layer of sand and gravel (30 cm) and a bottom layer of silty sand (10 cm), with a nonwoven geotextile on top of intact cultural heritage layers (Figure 4). The average porosity is approximately 35%. The water storage capacity of the rain garden is designed for 30 cm above soil surface at deepest point, giving a storage volume of 54 m3 [29] (Figure 5). When this level is exceeded the water flows into an outlet and down to the swales below (Figure 2). The compartment A has the same construction and layering as B, but an area of 52 m2. The rain gardens are designed to have an infiltration capacity of 0.5 m/day for a rainfall event with intensity 35–50 mm/day (24-h storm) [28], assuming dry antecedent conditions.
In this study, the infiltration capacity of the rain gardens is compared with international guidelines, such as the FAWB in Australia [42], the MPCA in the USA [43,44], and the CIRIA in the UK [41]. The CIRIA SuDS manual [41] is regarded as the most relevant for Norwegian standards and conditions [45]. To evaluate whether the rain gardens at Bryggen qualifies according to the international guidelines, we compared the measured saturated hydraulic conductivity to both the design values and the measured infiltration capacities. Two infiltration tests were used: Modified Phillipe–Dunne (MPD) [23,24] and full-scale infiltration capacity method [26,27,28]. The full-scale infiltration capacity test was further correlated with continuous monitoring of the groundwater level in several boreholes (Figure 3).
Before and after the full-scale infiltration test soil samples were collected in the rain gardens, four in compartment A and four in B (Figure 2). The analysis was executed by Vannlaboratoriet Bergen Vann KF [46], where the samples were dried at 100 °C for four days. The samples were analyzed for soil moisture to document the start-up conditions for the full-scale test, and the effect infiltration has on soil moisture.
2.1. Modified Phillip-Dunne Infiltration (MPD) Method
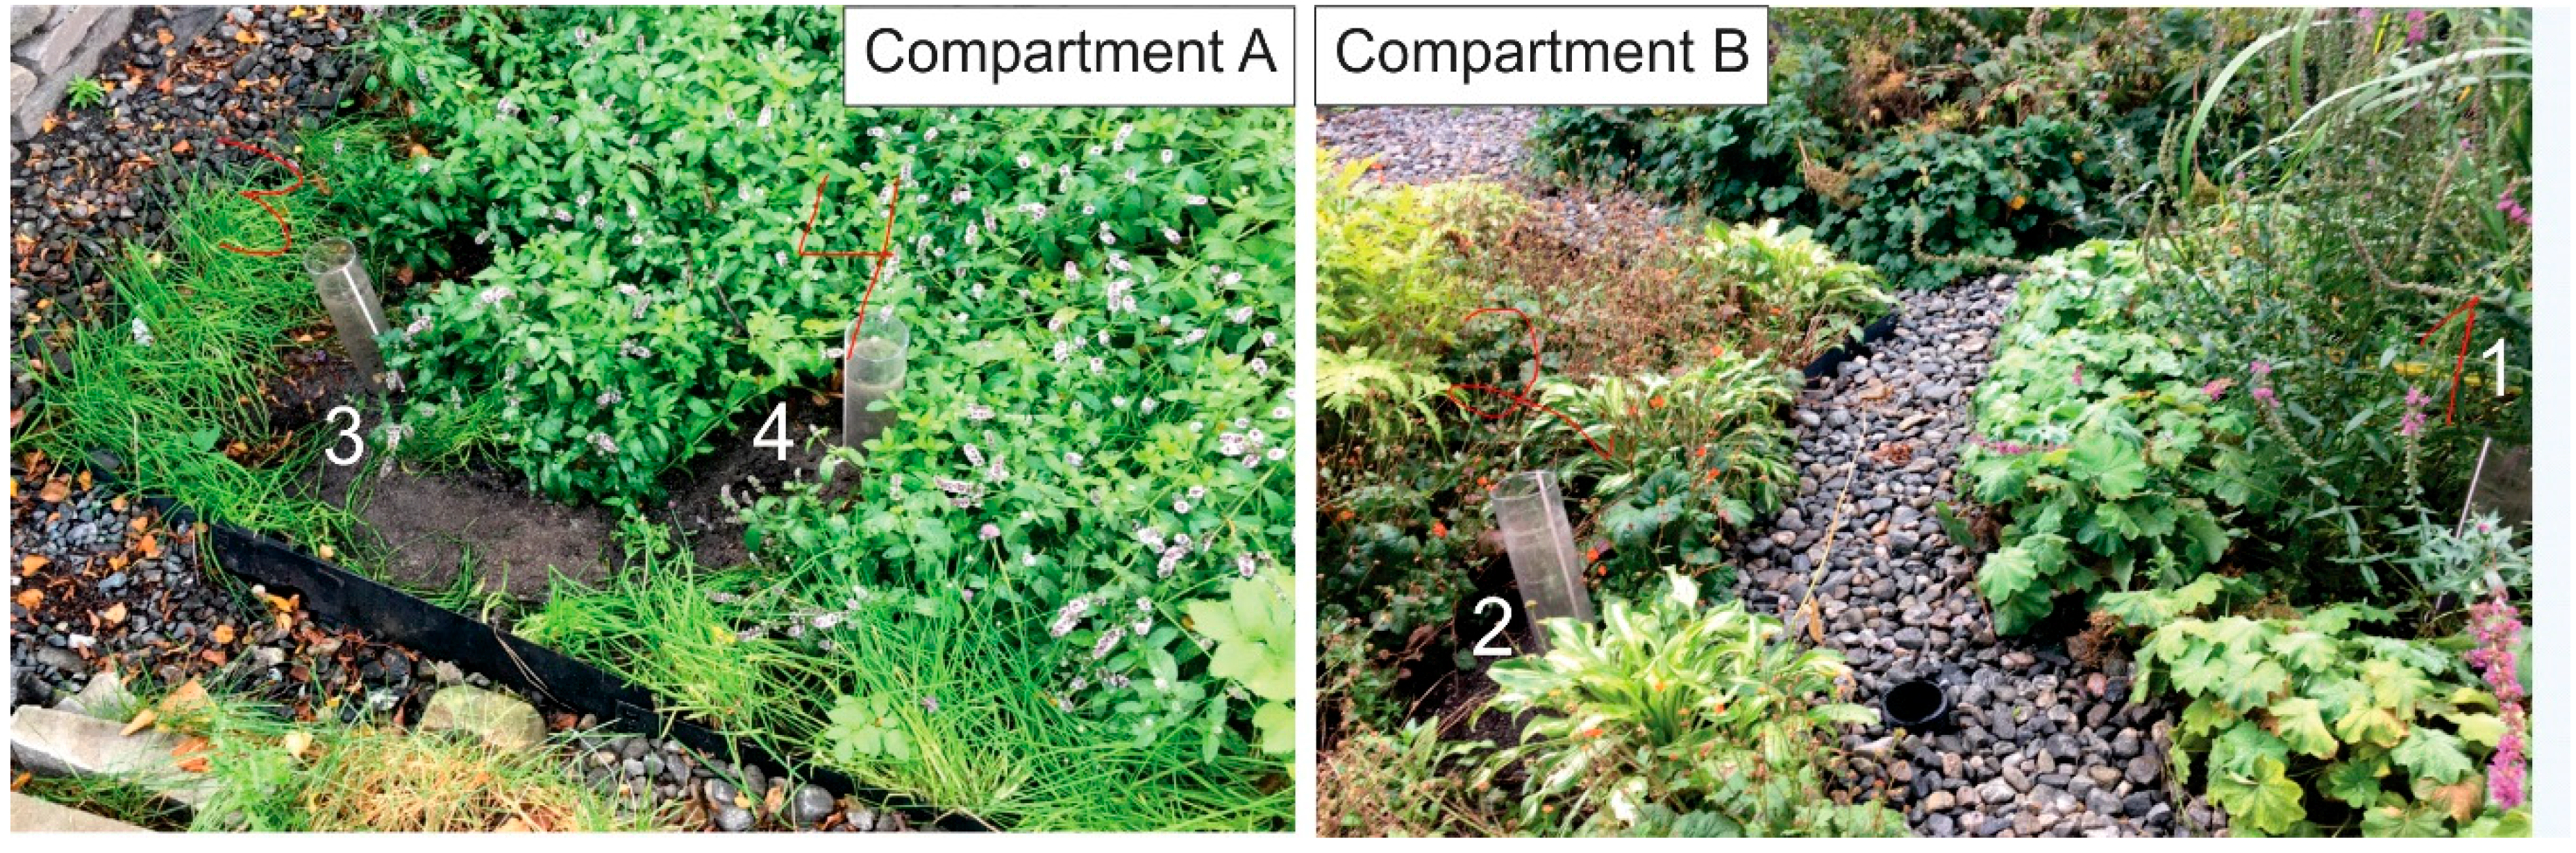
The Modified Philip–Dunne (MPD) infiltrometer test, which determines the infiltration capacity for saturated hydraulic conductivity [23,24], was executed at four different locations in compartment A and B in the rain garden. The principle for all small-scale infiltrometer tests is that rings or columns are sealed to the surface and filled with water to provide a positive water head. The column has a diameter of 10 cm and length of 50 cm. A measuring tape is attached to the outside of the column in order to measure the height of the water column, as shown in Figure 5. The time recorded for the water to infiltrate through the permeable surface area is used to estimate an average infiltration rate (usually in mm/h) for the test location. Both the constant head and the falling head methods can be utilized in these testing procedures [23,24,30]. These in-situ field methods are easy to facilitate and are time and cost efficient. An illustration of the MPD is given in Figure 5.
2.2. Full-Scale Infiltration Capacity Test at Bryggen
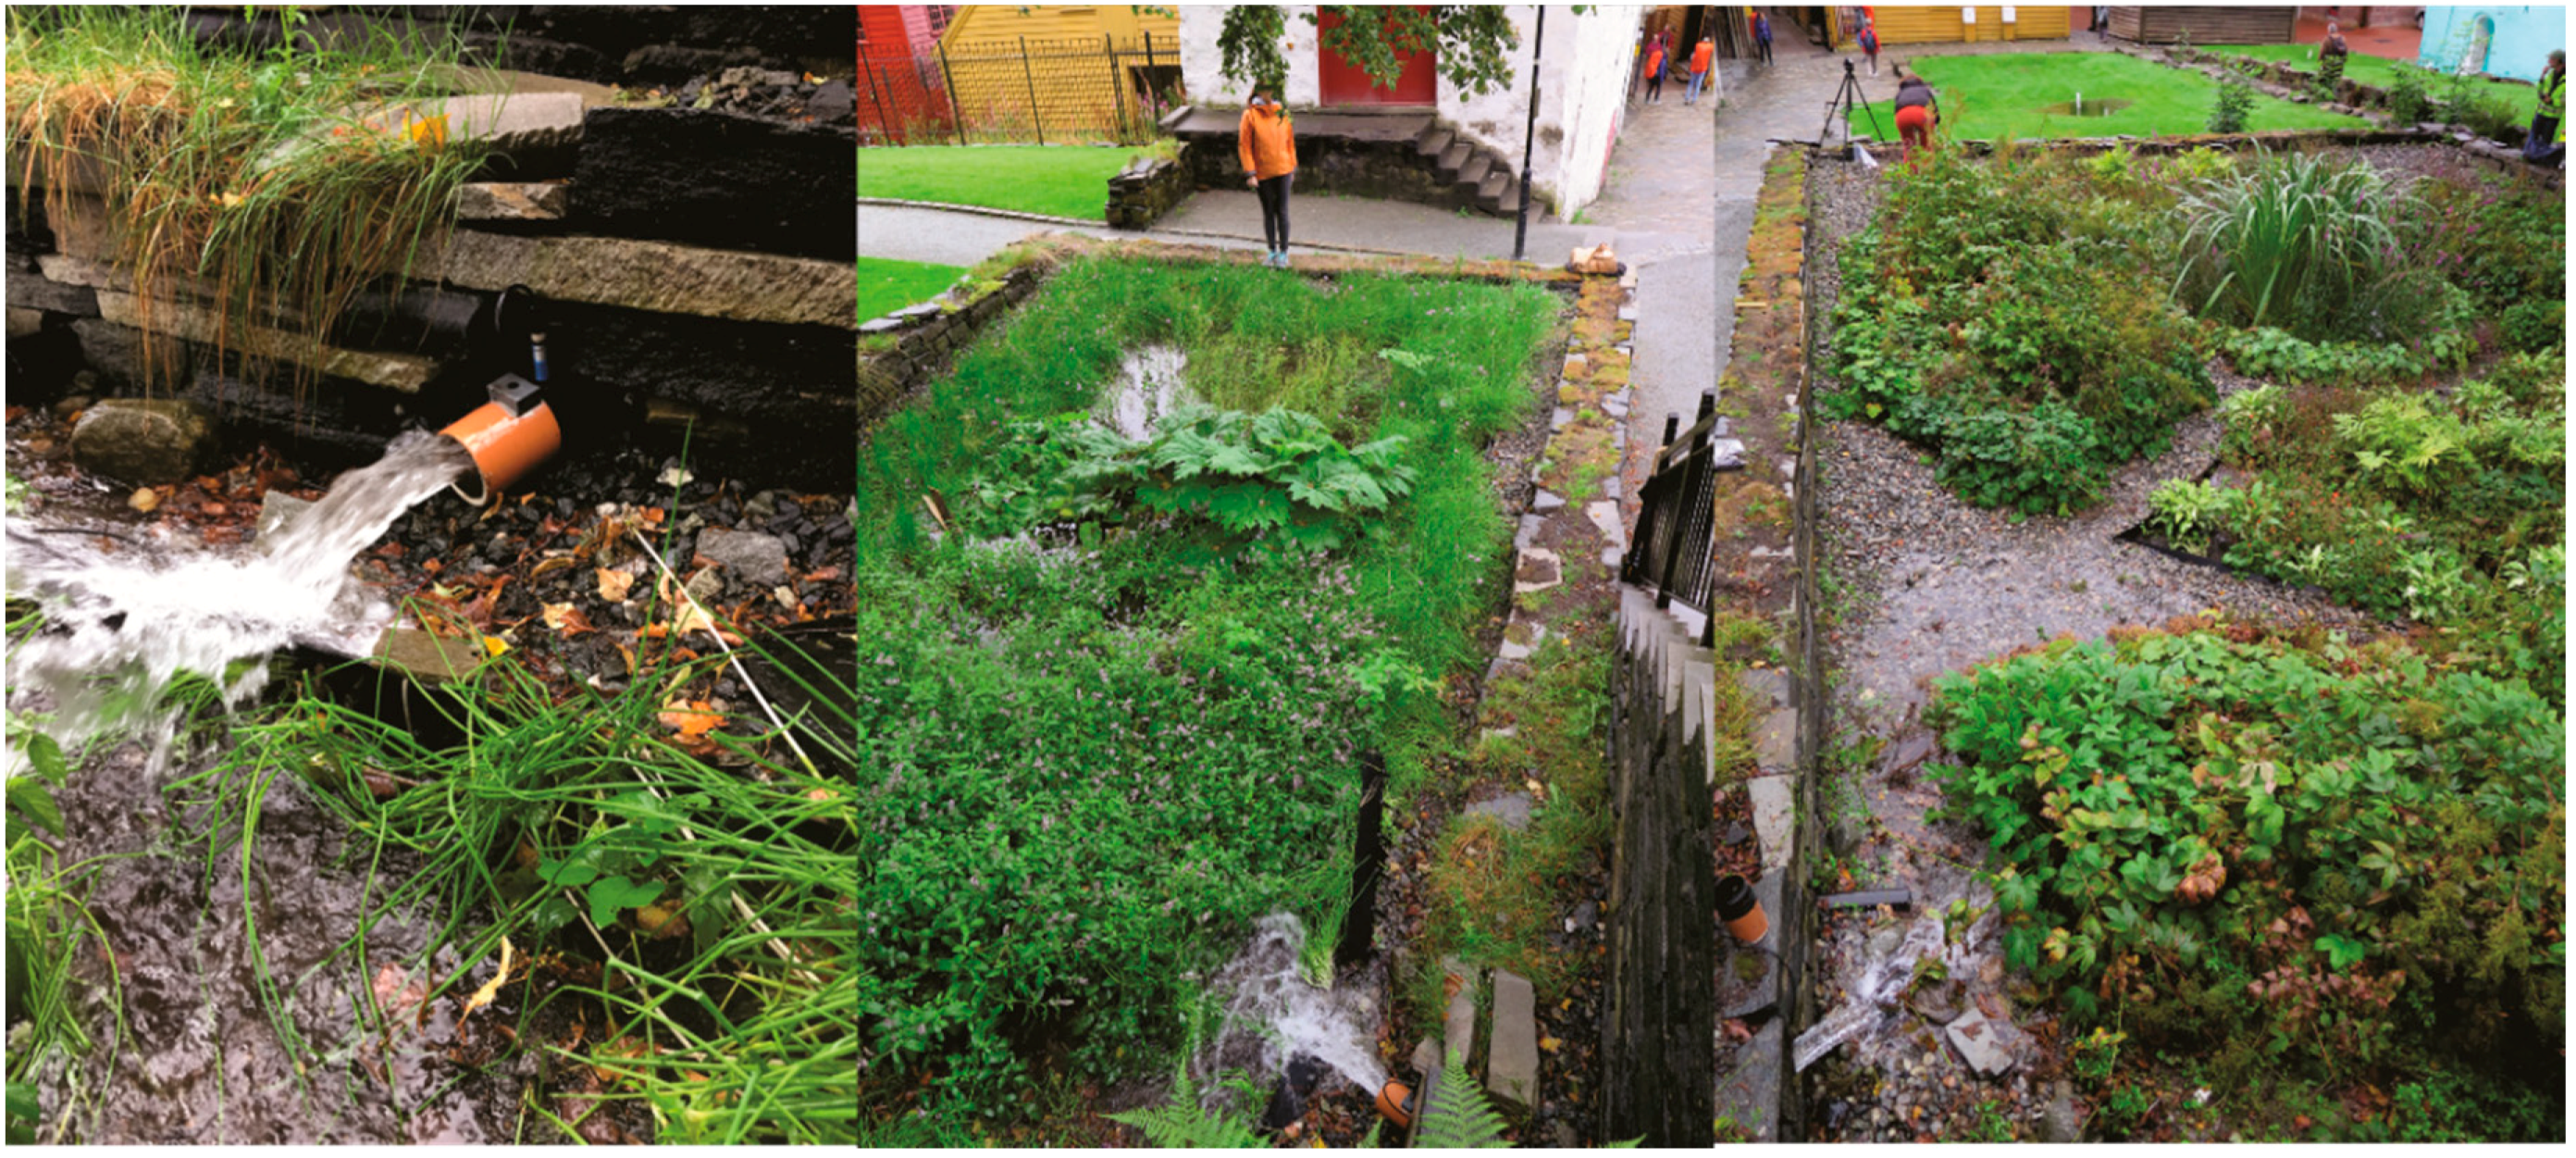
For the full-scale infiltration test at Bryggen, the total volume of the rain garden is flooded, and the emptying time is measured [26]. The water source was a fire hydrant, which held a constant water flow of ca. 600 L/minute for 2 h and 10 min (Figure 3 and Figure 6). The water influx was continuously measured by an in-line flowmeter, as shown in Figure 7. This translates to a total water volume of ca. 40 m3, which gives ca. 20,000 L/hour. The water was led through a drainage pipe under the street, Øvregaten, and into a manhole on top of the rain garden (Figure 7) where the water inflow was split into two, into compartment A on the left and compartment B on the right (Figure 2 and Figure 8). All outlets from rain gardens A and B were blocked during the infiltration test to prevent the bypass of water out of the gardens and thus force infiltration. The water influx was kept constant until the infiltration system was completely saturated and water became visible, forming a pond at the surface in both rain gardens and at the swales below (Figure 2, Figure 7 and Figure 8). The rain garden compartment A and B have a confined space which can be filled up to the water level of outflow without any additional restriction to prevent water leaving the rain gardens during the full-scale infiltration test. The maximum water depth at the deepest part of the rain gardens is ca. 30 cm, varying depths due to irregularities of the soil surface (Figure 4). The time from maximum ponded water height to complete infiltration was recorded for both rain garden A and B (Figure 6). To calculate the infiltration rate,
where K is the infiltration rate (cm/min), h = height of the water column (cm), and t = time (duration) of infiltration (min) [26,28]).
K = h/t
2.3. Continuous Monitoring of Groundwater Level in Boreholes
In the boreholes, the automated data collection is set at a frequency of 1 h, and the instrument has an accuracy of measuring the water height within 0.05% [34]. With this detailed measuring frequency, immediate and short-term effects are detectable [16], and therefore able to show the response of the full-scale infiltration capacity test. All loggers are calibrated for measuring depth relative to surface level, showing the correct groundwater level from surface level. The location of boreholes is shown in Figure 3, where the boreholes used in this study are marked.
3. Results and Discussion
3.1. Soil Moisture Results
The soil samples had a water content of 28–34% before the infiltration test was executed (Table 1). This saturated condition, ca. 30% water, is explained by the heavy rainfall the previous day. After the full-scale test, four soil samples were collected at the same locations show that the water saturation of the soil had increased to 40–56 percent (%) (Table 1). This is an increase in soil moisture of 12–22 percent (%). Preservation of the organic layers is dependent on the soil moist and prevention of oxygen access, as shown by Matthiesen et al. [17]. An increase in soil moisture by infiltration of water may affect the cultural layers below, by preventing exposure to oxygen. A study of repetitive full-scale testing by Boogaard and Lucke [30], on permeable pavements and swales, show that after refilling the storage volume a second time (simulating a stormwater event after a stormwater event) the infiltration capacity is reduced by 39% from unsaturated to saturated soil conditions. This shows that the infiltration of surface water with the aid of SuDS like rain gardens and swales will increase the soil moist, recharge the groundwater, and further contribute to preservation of the cultural layers below.
3.2. Small-Scale Results
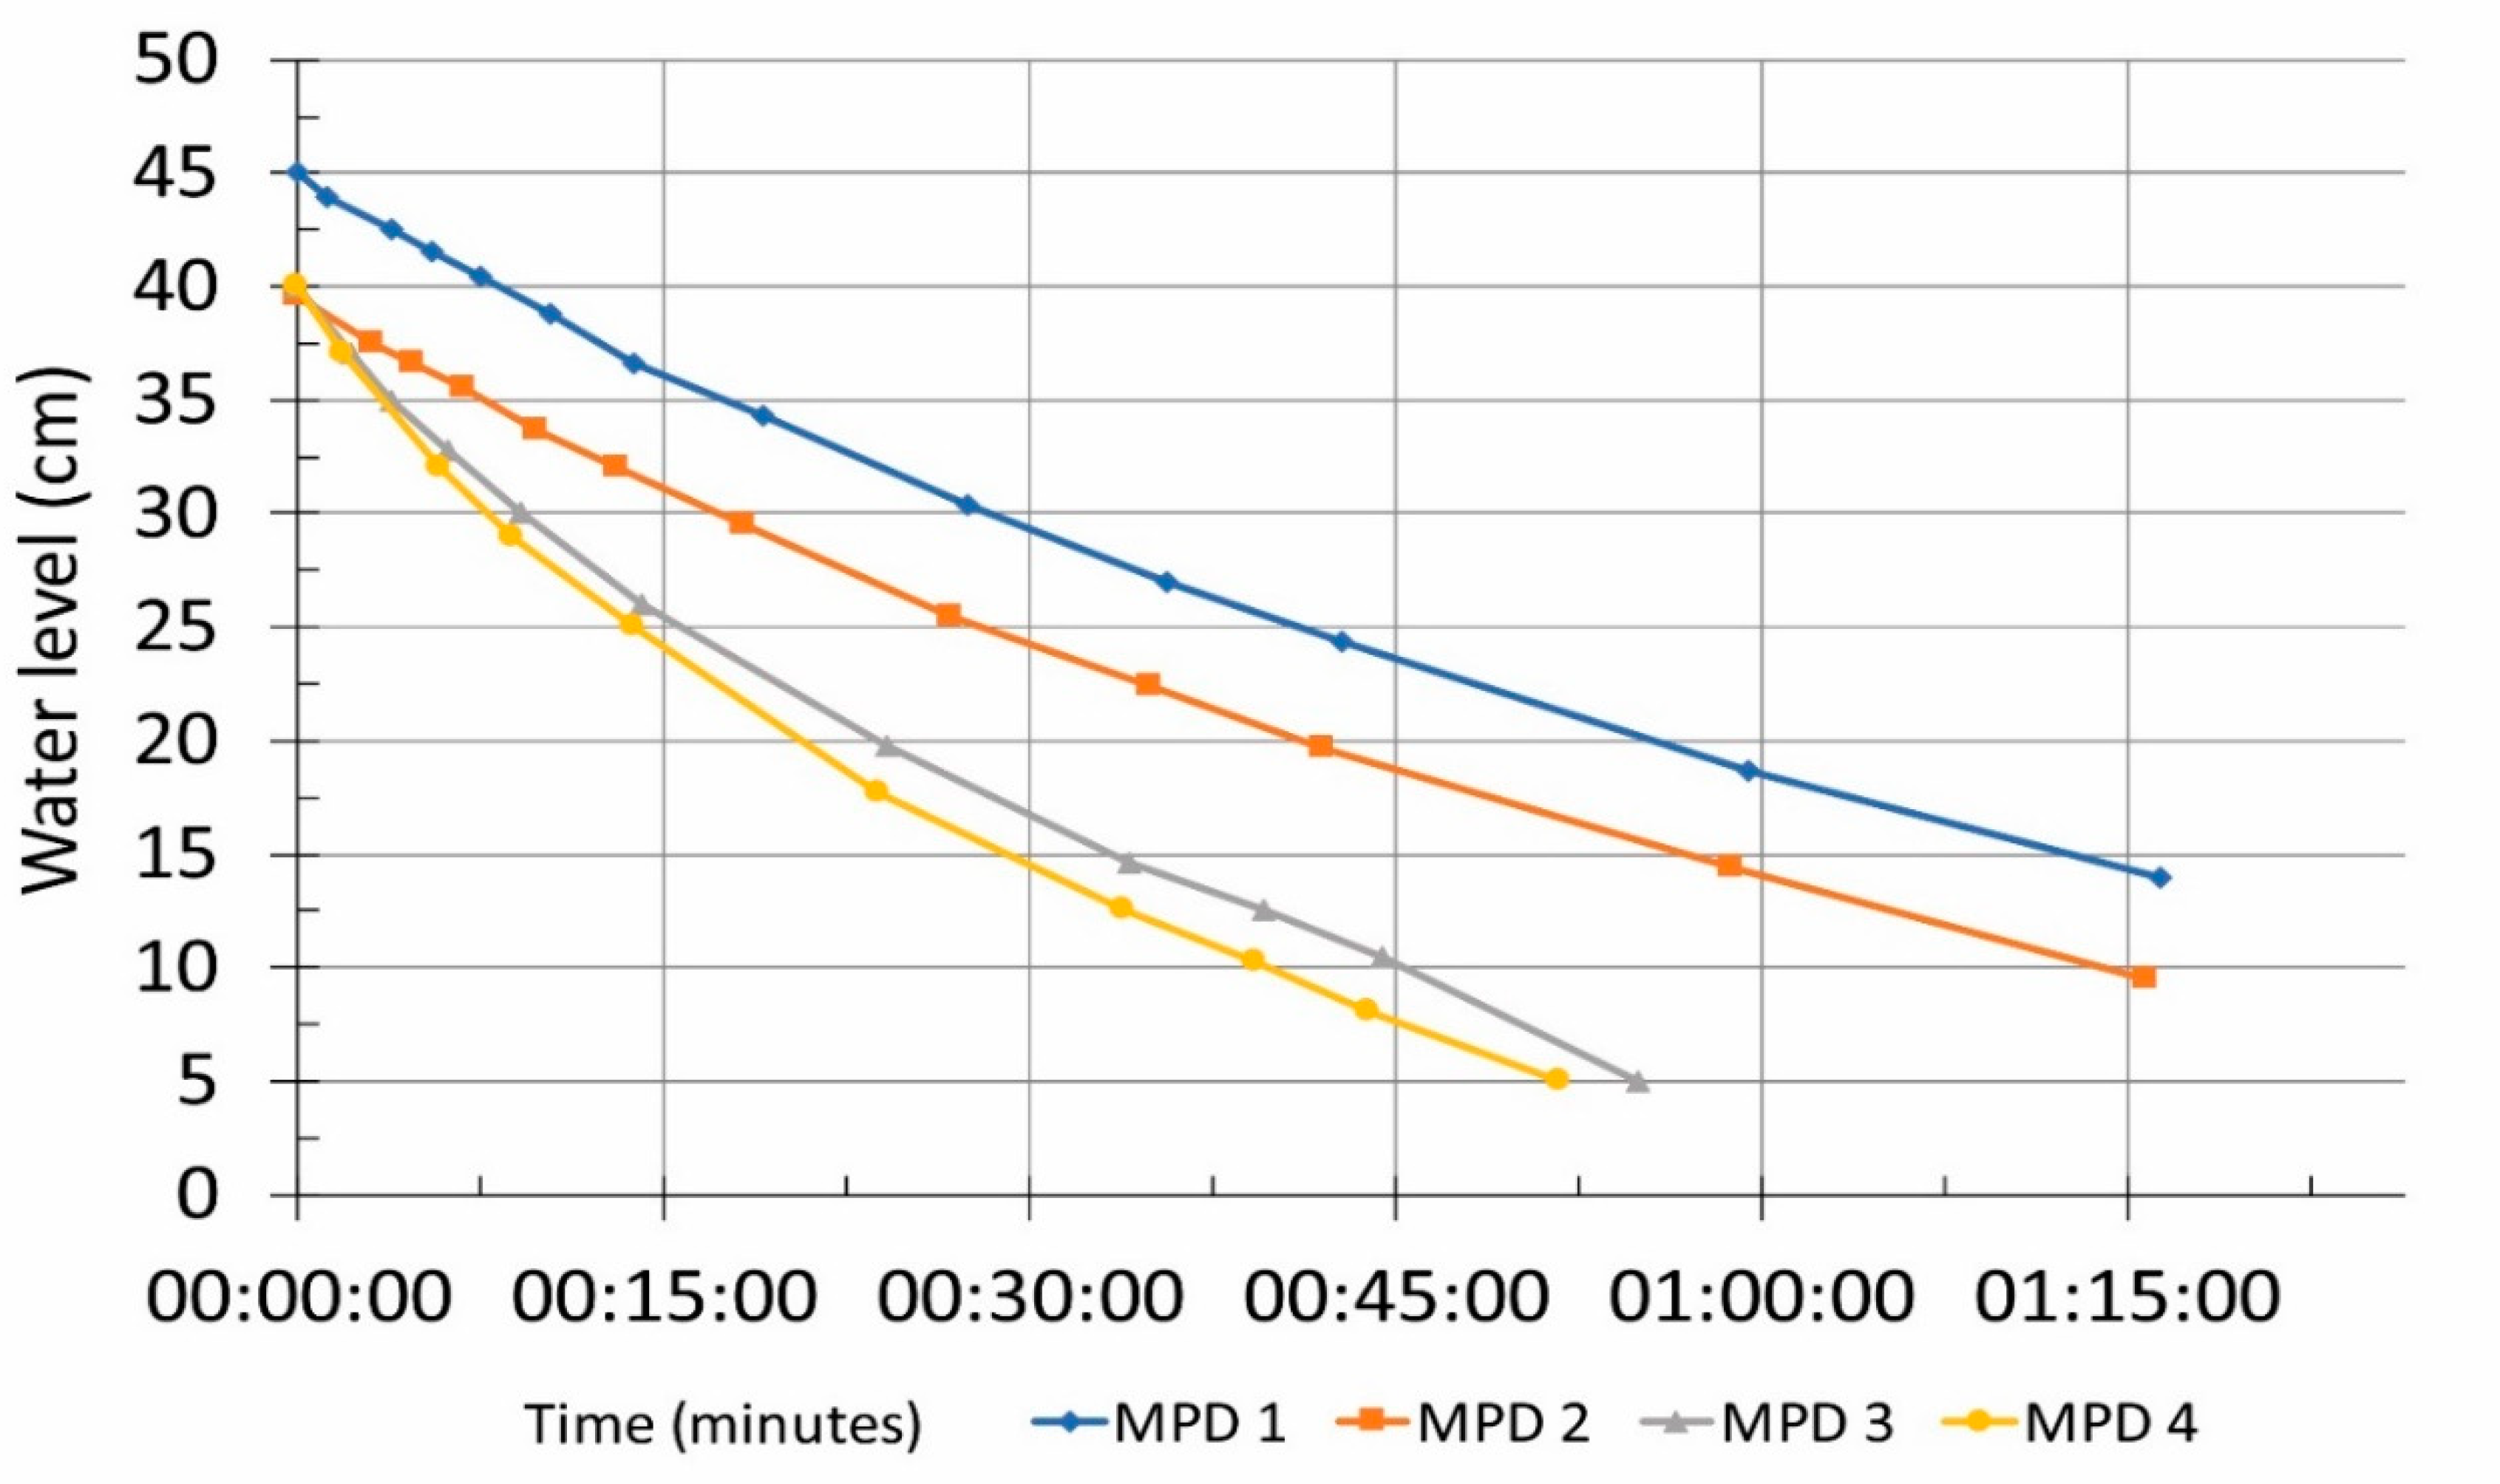
Four MPD infiltration tests were executed 8th of September 2017 in the rain gardens compartment A (tests 3 and 4) and compartment B (tests 1 and 2, Figure 9). The results of the small-scale infiltrometer tests MPD, summarized in Table 2, shows that the infiltration capacity is (1) 245 mm/h, (2) 241 mm/h, (3) 382 mm/h and (4) 404 mm/h (Figure 10). The small-scale infiltration tests verify that the rain gardens qualify according to the international guidelines for SuDS, demanding an infiltration capacity in the range of 100–300 m/h [41,42,43,44,45]. Field tests verify the infiltration capacity, which is a recommendation by the CIRIA guideline [41], due to local variation, if the SuDS is built according to design and possible clogging [41]. The MPD has a small surface, commonly 10 cm diameter (Figure 6 and Figure 9), where the variation of the heterogeneous soil layer has large influence on the measurements. Ahmed et al. [47] show in their study that for the MPD to be representative, a minimum of 20 tests on different locations should be executed to get a representative average. Unfortunately, only four MPDs are collected in this study and are not statistically representative for infiltration rates in the rain gardens. Since the MPD can be inaccurate because of heterogeneity of the filter soil [26,27], the small-scale tests were compared with a full-scale test (Table 2).
3.3. Full-Scale Results
The results from the full-scale infiltration test are given in Table 2. Based on ca. 30 cm ponding depth and drainage time, which constitutes infiltrating all visible water, the emptying time of the large compartment B was 11 min and 35 min for the smaller compartment A. The infiltration capacity is ca. 1600 mm/h for the large compartment (B) and 510 mm/h for the smaller compartment (A, Table 2). Therefore, both rain gardens A and B meet the minimum requirement of the international SuDS standards [41,42,43,44,45]. Both rain gardens have considerable infiltration capacity, and the capacity is larger than the amount of water coming from the presently connected watershed upstream. The infiltration time was considerably longer in the smaller rain garden A (Table 2). The total water volume for the full-scale test is of ca. 40 m3, which gives ca. 20,000 L/hour and is larger than any known return period of an extreme event [48].
3.4. Comparison between Small-Scale and Full-Scale Results
The hydraulic efficiency of SuDS such as rain gardens and swales rely on two main standards, which are infiltration and retention capacity [41,49]. The infiltration capacity is usually estimated by measuring the rate at which water infiltrates from small test pits, boreholes [50,51] or as ring infiltrometer tests [23,24,25,52]. International guidelines recommend a design that enables bioretention, such as rain gardens that can infiltrate stormwater at a rate of 100–300 mm/h. These guidelines are based on several factors such as the limited availability of space in urban areas, low native permeability of the soil, shallow groundwater tables, limited public health concerns, and often safety factors, such as mosquitoes and risk of drowning. The guidelines also take into consideration that the infiltration capacity of rain gardens may reduce over time by clogging [53,54,55]. Vegetation that is resistant to long inundation can prevent clogging of the topsoil, due to root canalling [42]. Further, the implemented SuDS should be tested for its infiltration capacity in the field [1,2,3,10,41].
The small-scale infiltration test methods are based on the infiltration rate through a very small area that is used to represent the total area of infiltration. Using such small areas for testing could potentially lead to erroneous results as studies have demonstrated a high degree of spatial variability between different infiltration measurements undertaken in the same area [26,27,28]. A study by Ahmed et al. [47], based on 722 small-scale infiltrations test using the MPD test in five large swales, shows that the hydraulic conductivity has a high spatial variability within the same swale. The full-scale infiltration test shows that both rain gardens have a much higher infiltration capacity than the results from the MDPs indicate (Table 2). The infiltration rate for the full-scale test is increased by a factor of 6.5 for the large compartment B and 0.8 for the smaller compartment A, compared to results from the small-scale tests. The difference between the large and small compartments may be explained by the coarser material on the surface of the larger and different plants in the smaller compartment (Figure 8 and Figure 9). This reflect the results by Boogaard et al. [26] and Lucke et al. [27] where small-scale (single ring) infiltration test only gives the local condition for the SuDS, independent whether a rain garden, swale or permeable pavement is being tested. Ahmed et al. [47] show that the infiltration capacity or permeability in swales can vary by a factor of 100, giving a large uncertainty if only one or a few small-scale tests are used for testing the infiltration capacity. The full-scale method will demonstrate the infiltration capacity compared to small-scale tests, which is especially important in cold climates [31,32].
3.5. Continuous Monitoring of Groundwater
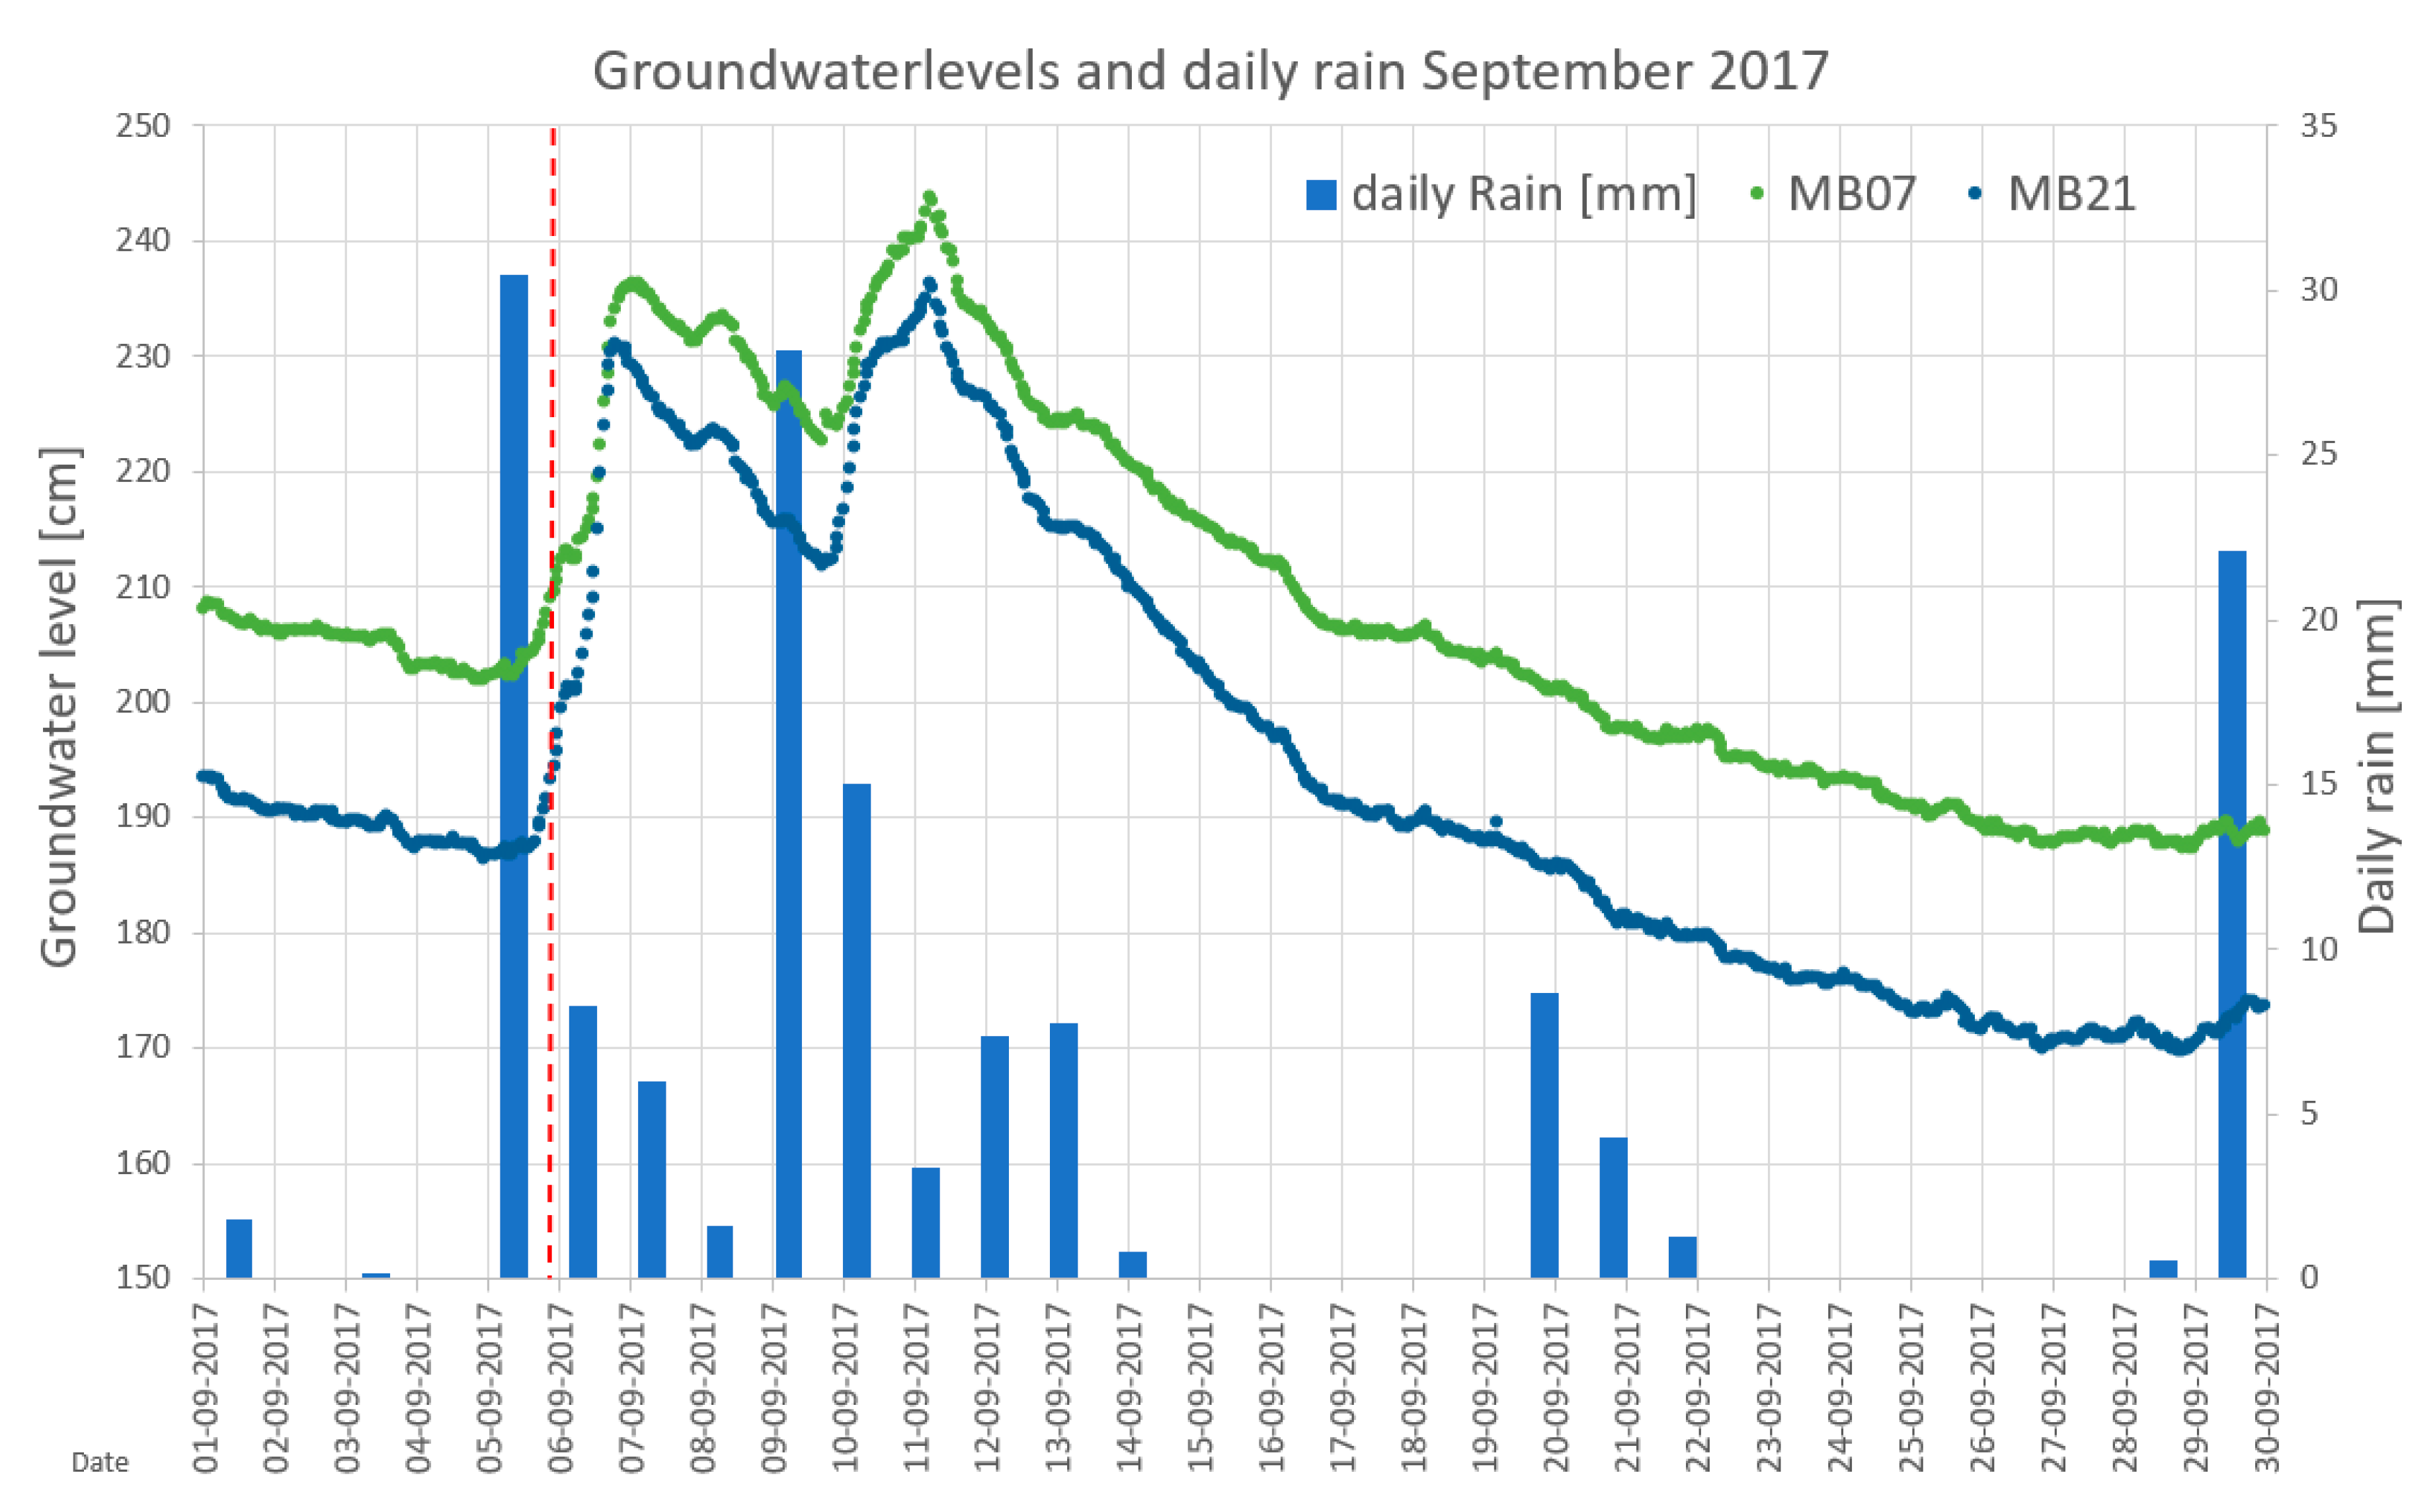
Monitoring wells MB 07 and MB 21 are located <30 m downstream of the swales (purple circles in Figure 4). These show an immediate response in rise of groundwater level to the infiltration test (Figure 11). The infiltration during the full-scale test is helped by the large amount of precipitation the day and night before, which can be seen by the rise in water level before the time of the infiltration test. The increase of ca. 35 cm in MB07 and 42 cm in MB21 in groundwater level, as seen in Figure 11. The changes in the groundwater lever curves show response to the infiltration test in addition to natural fluctuation from precipitation, as shown in Figure 11.
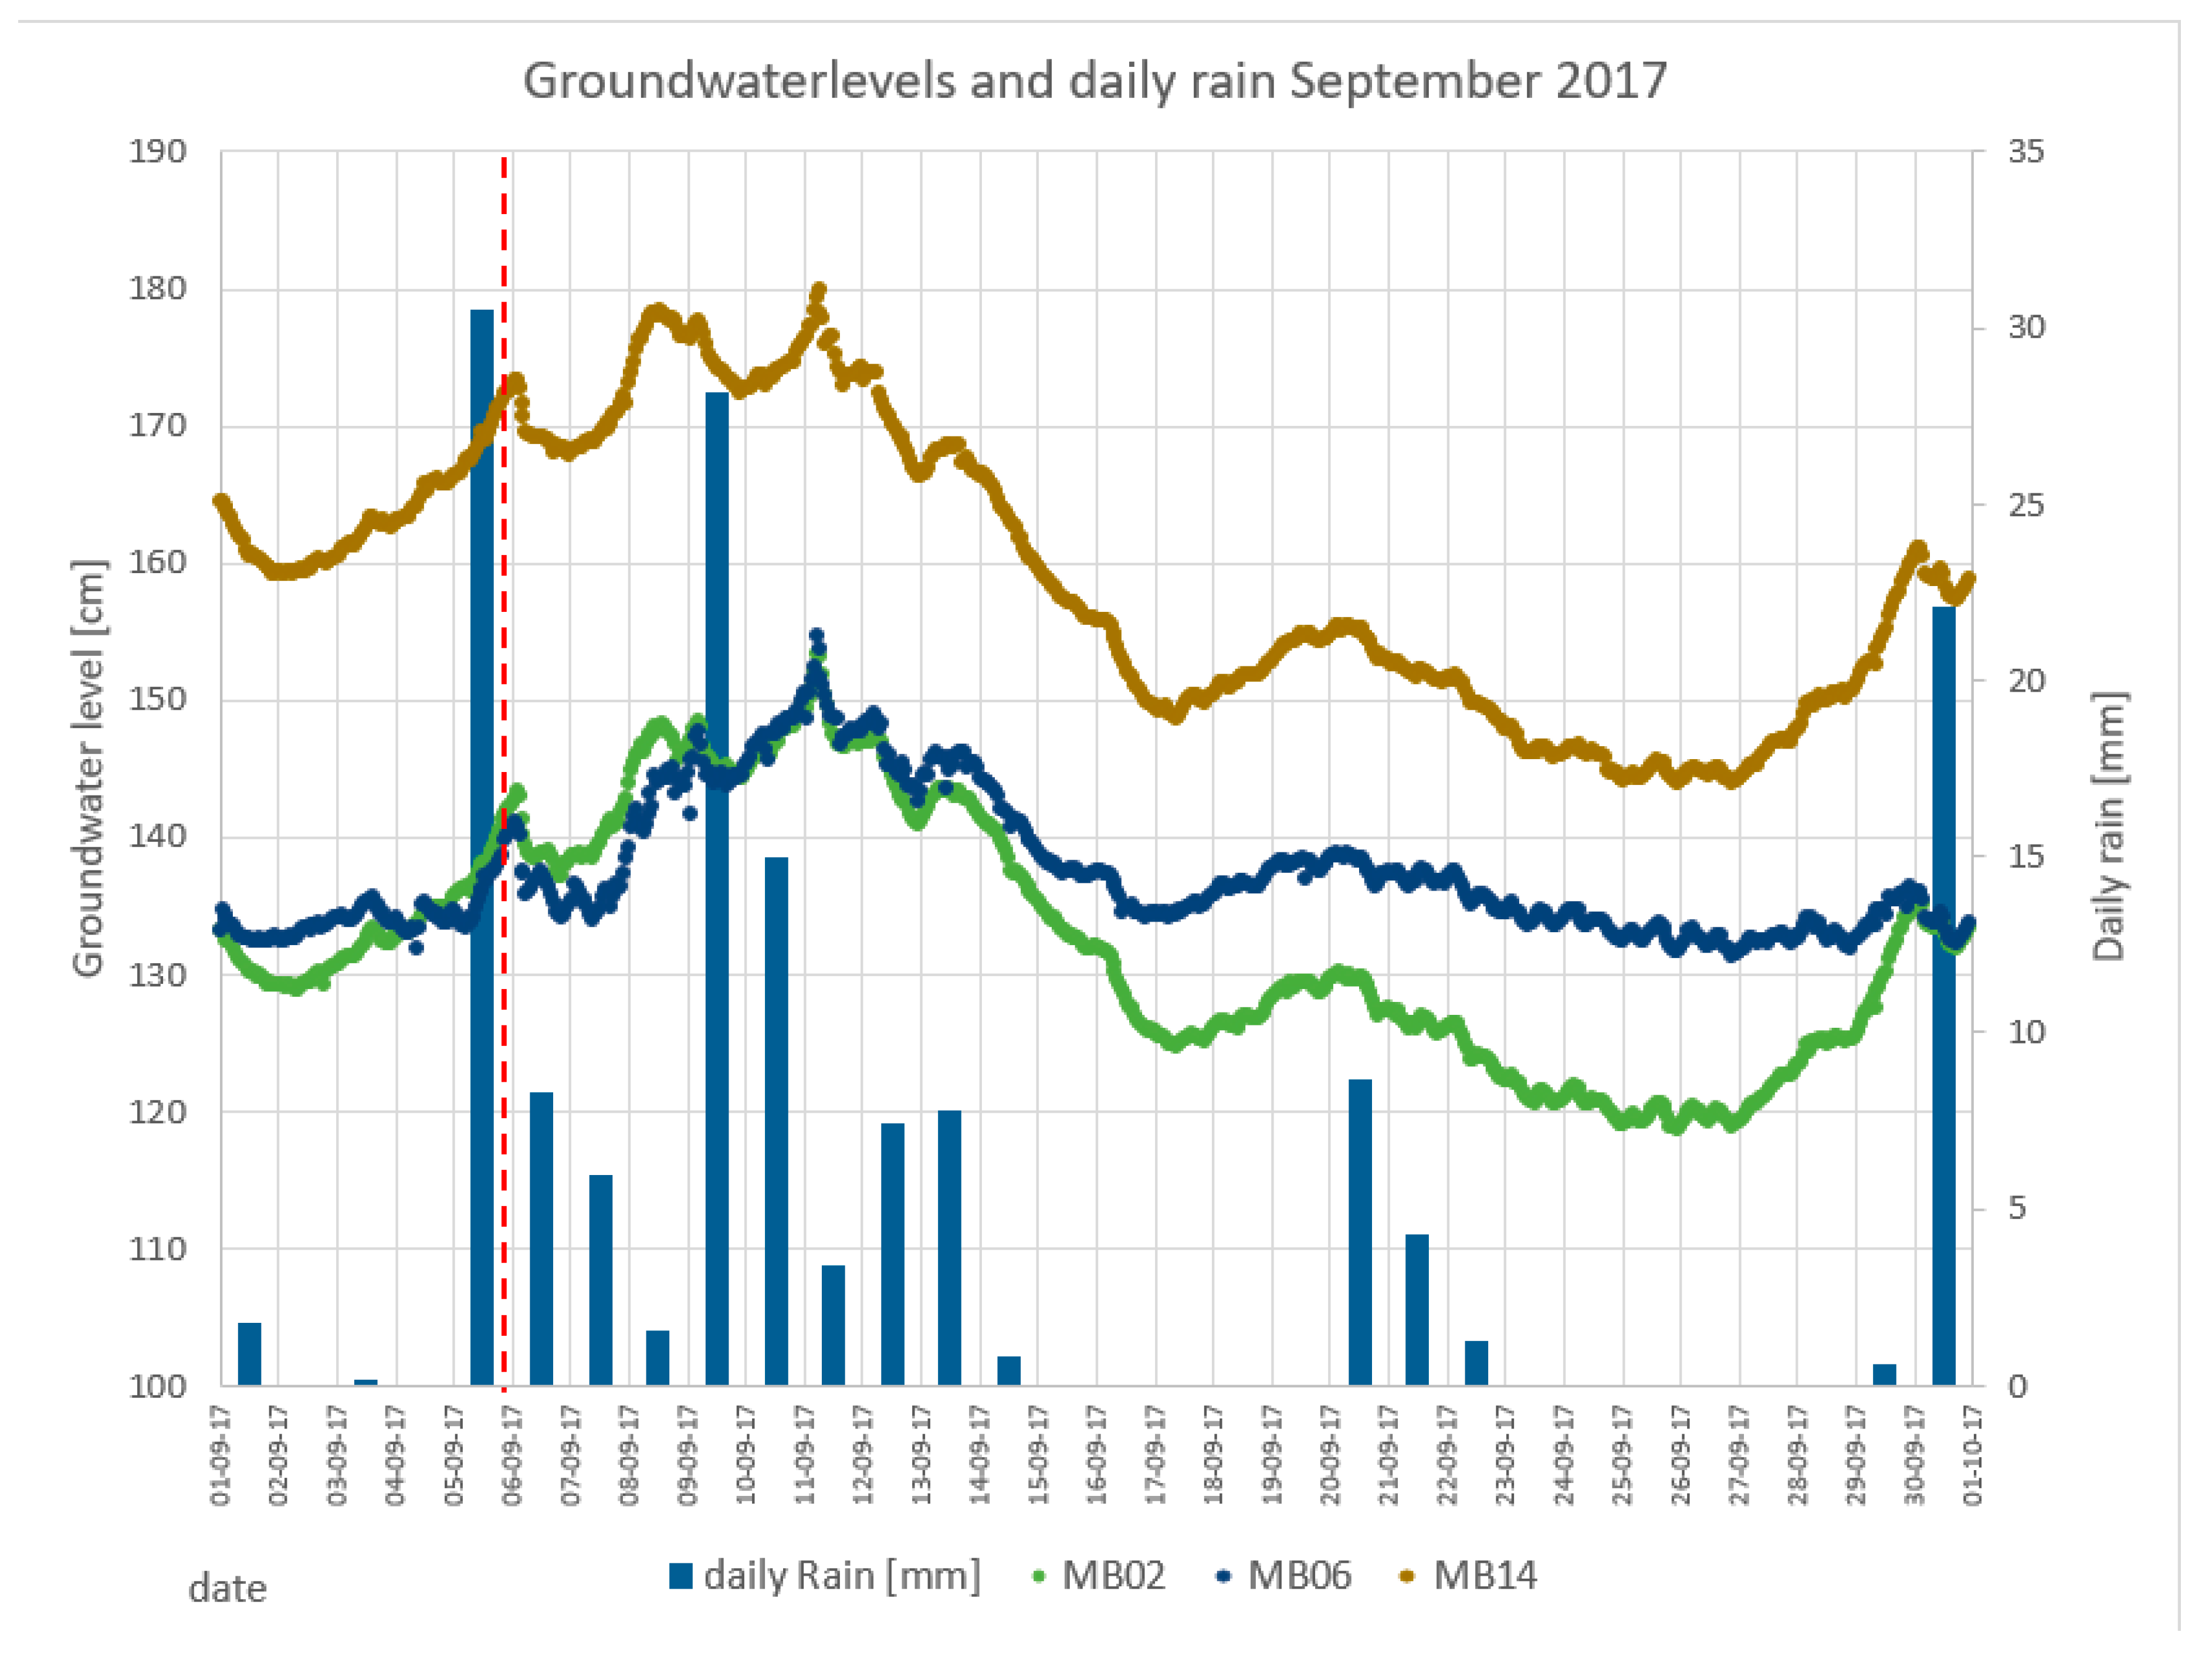
Figure 12 shows changes in the groundwater level in boreholes MB 02, MB 06 and MB 14 that are located 75–100 m further downstream from the rain gardens (yellow circles in Figure 3). The direct effect of the infiltration test is not as prominent as in borehole MB 07 and MB 21 (Figure 11), due to the distance from the infiltration point. However, the results still show a clear rise in groundwater level on the day of the full-scale infiltration test in addition to a continued increase with the following days, contributed by precipitation. These boreholes show a delay of ca. 2 days in the response, reflecting the travel time of the groundwater from source to monitoring point. The increase in the groundwater level is 20–25 cm in all three boreholes (Figure 12). Combined with additional precipitation, the infiltration peak has a duration of ca. a week.
It could be considered that the rain gardens at Bryggen is constructed with an unnecessarily high infiltration capacity, but if the infiltration capacity were too low, flooding of surface water would occur especially during heavy rainfall of 35–50 mm/day. However, this infiltration system is built for multiple purposes, the main one being to stabilize and increase the groundwater level to protect the cultural layers below Bryggen [16,17,18]. Other functions of the SuDS are retaining and storing stormwater, filtering pollutants, and increasing the soil moisture [2,9,30]. This study shows good communication between the infiltrated water and the nearby monitoring wells, <30 m distance, with a time delay of ca. 2 days according to the distance from the infiltration point (75–100 m, Figure 3, Figure 11 and Figure 12).
A large infiltration capacity is especially important in locations with a cold climate, as winter will mean a reduced infiltration capacity due to freezing and ice [31,32]. The infiltration system at Bryggen was built for a larger catchment area than presently connected (Figure 3). The infiltration capacity of 1600 mm/h is more than sufficient to handle the current runoff surface water. Therefore, the capacity should be sufficient to expand the catchment area from ca. 8500 m2 to 31,000 m2, as shown in the map in Figure 3. The increased infiltration of surface water will contribute to stabilizes the groundwater and prohibit processes driven by lack of groundwater that causes subsidence [56].
Empirical research from this study will improve the groundwater model for Bryggen, and related models [16,36]. In addition, it strengthens the best practices in cultural heritage management that the Bryggen Project has proven to be [21,40]. Bryggen is an example that measures can be taken to infiltrate surface water to restore and stabilize the groundwater, to further delay degradation and subsidence, and as a bonus, prevent flooding.
3.6. Lesson Learned
When comparing small- and large-scale infiltrations tests the tests should be repeated. For small-scale tests, the statistical representative number is 20, as demonstrated by Ahmed et al. [47]. It is a weakness in this study that only four small-scale tests were executed. The large-scale test should also be repeated for better documentation of the infiltration rate and response on groundwater level. Nordic cold climate has different challenges than warmer climate [31,32] and studies that monitor both the stormwater influx as well as groundwater response is needed. As Prudencio and Null [5] point out, SuDS have positive effects as ecosystem services, however, this is not been given any attention in this study at Bryggen.
Especially, a lesson learned from Bryggen is documentation of “as built”. There are several gaps of knowledge, there among construction deviations, the compilations of soil used, and sketches of design as built are missing. The lack of documentation make testing and follow ups challenging. For future constructions of SuDS, planning for implementation of monitoring systems, both for stormwater and groundwater, is recommended.
For interactive dissemination and outreach, the tool Climatescan (www.climatescan.org) is applied for engagement with stakeholders where open access results on infiltration of stormwater under extreme climate and hydraulic circumstances are displayed [57]. The Bergen Wharf site with its infiltration systems is continuously updated with pictures, information, research results, and open access publications [58].
4. Conclusions
This study compared the infiltration capacity of the rain gardens at Bryggen with international guidelines [41,42,43,44,45]. It compares small-scale MPD tests to full-scale infiltrations test and further evaluate if the rain garden is preforming as designed. The full-scale infiltration test showed an increase of the groundwater level in several boreholes at Bryggen.
The rain garden and its connected infiltration systems function for the purpose it is built, to infiltrate stormwater into the subsurface to increase the soil moisture as well as groundwater level to protect the cultural layers in the subsurface. The hydraulic conductivity of the SuDS is as designed with an infiltration capacity of 500–1600 mm/h. This study shows that the full-scale infiltration test gives a higher infiltration capacity of the rain gardens, compared to small-scale tests. The effect of the infiltrated volume and the natural precipitation influence the groundwater level, with an immediate response in monitoring wells close to the infiltration system (<30 m) and with a time delay of ca. 2 days in wells 75–100 m away from the infiltration point. The infiltration capacity of the rain garden exceeds the amount of available surface water currently connected to the system. The groundwater level would, in dry periods, benefit from more consistent water input to increase soil moisture and thereby preserve cultural layers below. There is excess capacity, and the connected runoff catchment area can be extended to encompass the total catchment area by 22,500 m2 or 260 precent (%). There is a need to document the effect of SuDS on the urban water cycle. This study shows how monitoring systems can be implemented in designing and planning, which could help stormwater managers with the scheduling of maintenance requirements for rain gardens with more confidence.
Author Contributions
Conceptualization, G.V. and F.C.B.; methodology, F.C.B.; validation, G.V. and F.C.B.; formal analysis, G.V. and F.C.B.; investigation, G.V.; data curation, G.V.; writing—original draft preparation, G.V.; writing—review and editing, F.C.B. and G.V.; visualization, G.V. All authors have read and agreed to the published version of the manuscript.
Funding
This research is supported through the JPI Water funded INXCES research project “Innovation for eXtreme Climatic EventS” www.inxces.eu. INXCES exchange researchers, methodology and results on an international level, with the aim is to share research results with stakeholders and set up guidelines for design, implementation and maintenance of SuDS to promote sustainable water management systems throughout the world. Within the INXCES project knowledge exchange between disciplines and nations is in focus.
Acknowledgments
Great appreciation to Torstein Dalen at the Water and Wastewater department at Bergen Municipality for help and contributions. Thanks to the Bryggen project for access to borehole data http://prosjektbryggen.no. We thank Bergen Municipality and Hanze University of Applied Sciences Groningen, Deltares and the Geological Survey of Norway for support for this work. Thanks to Riksantikvaren (Directorate for Cultural Heritage) and NIKU (Norwegian Institute for Cultural Heritage) for making data freely available. Thanks to Norwegian Hydrology Council for the NHC2018 conference in Bergen, and this special conference issue. Great appreciation to Malin Andersson at the Geological Survey of Norway (NGU) for constructive feedback on this paper.
Conflicts of Interest
The authors declare no conflict of interest.
References
- Davis, A.P.; Hunt, W.F.; Traver, R.G.; Clar, M. Bioretention Technology: Overview of Current Practice and Future Needs. J. Environ. Eng. 2009, 135, 109–117. [Google Scholar] [CrossRef]
- Fletcher, T.; Andrieu, H.; Hamel, P. Understanding, management and modelling of urban hydrology and its consequences for receiving waters: A state of the art. Adv. Water Resour. 2013, 51, 261–279. [Google Scholar] [CrossRef]
- Fletcher, T.D.; Shuster, W.D.; Hunt, W.F.; Ashley, R.; Butler, D.; Arthur, S.; Trowsdale, S.; Barraud, S.; Semadeni-Davies, A.; Bertrand-Krajewski, J.-L.; et al. SUDS, LID, BMPs, WSUD and more—The evolution and application of terminology surrounding urban drainage. Urban Water J. 2015, 12, 525–542. [Google Scholar] [CrossRef]
- Majidi, A.N.; Vojinovic, Z.; Alves, A.; Weesakul, S.; Sánchez, A.; Boogaard, F.C.; Kluck, J. Planning Nature-Based Solutions for Urban Flood Reduction and Thermal Comfort Enhancement. Sustainability 2019, 11, 6361. [Google Scholar] [CrossRef] [Green Version]
- Prudencio, L.; Null, S.E. Stormwater management and ecosystem services: A review. Environ. Res. Lett. 2018, 13, 033002. [Google Scholar] [CrossRef]
- Haughton, G.; Hunter, C. Sustainable Cities; Jessica Kingsley Publishers: London, UK, 1994; p. 357. ISBN 1134996071, 9781134996070. [Google Scholar]
- Bolund, P.; Hunhammar, S. Ecosystem services in urban areas. Ecol. Econ. 1999, 29, 293–301. [Google Scholar] [CrossRef]
- Marsalek, J.; Jiménez-Cisneros, B.E.; Malmquist, P.-A.; Karamouz, M.; Goldenfum, J.; Chocat, B. Urban Water Cycle Process and Interactions; UNESCO Publishing and Taylor and Francis Group: Paris, France, 2006; ISBN 0-203-93246-3. [Google Scholar]
- Nie, L.; Lindholm, O.; Lindholm, G.; Syversen, E. Impacts of climate change on urban drainage systems – a case study in Fredrikstad, Norway. Urban Water J. 2009, 6, 323–332. [Google Scholar] [CrossRef]
- Ashley, R.; Christensson, A.; De Beer, J.; Walker, L.; Moore, S.; Saul, A. Selling Sustainability in SKINT (SSIS), SKINT Water Series II. 2012. Available online: https://brage.bibsys.no/xmlui/bitstream/handle/11250/176007/Kulturlag_SKINT_Waterseries_2.pdf?sequence=1 (accessed on 1 August 2020).
- Boogaard, F.C.; Van De Ven, F.; Langeveld, J.G.; Van De Giesen, N. Stormwater Quality Characteristics in (Dutch) Urban Areas and Performance of Settlement Basins. Challenges 2014, 5, 112–122. [Google Scholar] [CrossRef] [Green Version]
- Wakode, H.B.; Baier, K.; Jha, R.; Azzam, R. Impact of urbanization on groundwater recharge and urban water balance for the city of Hyderabad, India. Int. Soil Water Conserv. Res. 2018, 6, 51–62. [Google Scholar] [CrossRef]
- Foster, S.S.D. Impacts of urbanization on groundwater. In Hydrological Processes and Water Management in Urban Areas; IAHS-AISH Pub. No. 198; International Association of Hydrological Sciences: Wallingford, UK, 1990. [Google Scholar]
- Lerner, D.N. Identifying and quantifying urban recharge: A review. Hydrogeol. J. 2002, 10, 143–152. [Google Scholar] [CrossRef]
- De Beer, J.; Matthiesen, H.; Christensson, A. Quantification and Visualization of In Situ Degradation at the World Heritage Site Bryggen in Bergen, Norway. Conserv. Manag. Archaeol. Sites 2012, 14, 215–227. [Google Scholar] [CrossRef]
- De Beer, J.; Seither, A. Groundwater balance. In Monitoring, Mitigation, Management: The Groundwater Project—Safeguarding the World Heritage Site of Bryggen in Bergen; Rytter, J., Schonhowd, I., Eds.; Riksantikvaren: Bergen, Norway, 2015; pp. 106–123. [Google Scholar]
- Matthiesen, H.; Hollesen, J.; Gregory, D. Preservation Conditions and Decay Rates. In Monitoring, Mitigation, Management: The Groundwater Project—Safeguarding the World Heritage Site of Bryggen in Bergen 2015; Rytter, J., Schonhowd, I., Eds.; Riksantikvaren: Bergen, Norway, 2015; pp. 76–91. [Google Scholar]
- Rytter, J.; Schonhowd, I. Operation Groundwater Rescue. In Monitoring, Mitigation, Management: The Groundwater Project—Safeguarding the World Heritage Site of Bryggen in Bergen 2015; Rytter, J., Schonhowd, I., Eds.; Riksantikvaren: Bergen, Norway, 2015; pp. 50–59. [Google Scholar]
- Christensson, A.; Paszkowski, Z.; Spriggs, J.A.; Verhoef, L. (Eds.) Safeguarding Historic Waterfront Sites. In Bryggen in Bergen as a Case Study, 1st ed.; Stiftelsen Bryggen and Polytechnika Szczecinska: Bergen, Norway, 2004. [Google Scholar]
- De Beer, J.; Matthiesen, H. Groundwater monitoring and modelling from an archaeological perspective: Possibilities and challenges. In Geology for Society; Slagstad, T., Ed.; Geological Survey of Norway Special Publication: Trondheim, Norway, 2008; Volume 11, pp. 67–81. [Google Scholar]
- Rytter, J.; Schonhowd, I. (Eds.) Monitoring, Mitigation, Management: The Groundwater Project—Safeguarding the World Heritage Site of Bryggen in Bergen 2015; Riksantikvaren: Bergen, Norway, 2015; p. 213. ISBN 978-82-7574-085-2. [Google Scholar]
- De Beer, J.; Seither, A.; Vorenhout, M. Effects of a New Hdrological Barrier on the Temperatures in the Organic Ardheaeological Remains at Bryggen in Bergen, Norway. J. Conserv. Manag. Archaeol. Sites 2016, 18, 99–115. [Google Scholar] [CrossRef]
- Nestingen, R.S. The Comparison of Infiltration Devices and Modification of the Philip-Dunne Permeameter for the Assessment of Rain Gardens. Master’s Thesis, Department of Civil Engineering, University of Minnesota, Minneapolis, MN, USA, 2007. [Google Scholar]
- Asleson, B.C.; Nestingen, R.S.; Gulliver, J.S.; Hozalski, R.M.; Nieber, J.L. Performance Assessment of Rain Gardens. JAWRA J. Am. Water Resour. Assoc. 2009, 45, 1019–1031. [Google Scholar] [CrossRef]
- American Society for Testing and Materials ASTM D3385-09. Standard Test Method for Infiltration Rate of Soils in Field Using Double-Ring Infiltrometers; ASTM: West Conshohocken, PA, USA, 2009. [Google Scholar]
- Boogaard, F.C.; Lucke, T.; Van De Giesen, N.; Van De Ven, F. Evaluating the Infiltration Performance of Eight Dutch Permeable Pavements Using a New Full-Scale Infiltration Testing Method. Water 2014, 6, 2070–2083. [Google Scholar] [CrossRef]
- Lucke, T.; Boogaard, F.; Van De Ven, F. Evaluation of a new experimental test procedure to more accurately determine the surface infiltration rate of permeable pavement systems. Urban Plan. Transp. Res. 2014, 2, 22–35. [Google Scholar] [CrossRef] [Green Version]
- Boogaard, F.C. Stormwater Characteristics and New Testing Methods for Certain Sustainable Urban Drainage Systems in the Netherlands 2015a. Ph.D. Thesis, Technische Universiteit Delft, Delft, The Netherlands, July 2015; p. 149. [Google Scholar] [CrossRef]
- Boogaard, F.C. Stormwater quality and sustainable urban drainage management. In Monitoring, Mitigation, Management: The Groundwater Project—Safeguarding the World Heritage Site of Bryggen in Bergen 2015b; Rytter, J., Schonhowd, I., Eds.; Riksantikvaren: Bergen, Norway, 2015; pp. 136–149. [Google Scholar]
- Boogaard, F.C.; Lucke, T. Long-Term Infiltration Performance Evaluation of Dutch Permeable Pavements Using the Full-Scale Infiltration Method. Water 2019, 11, 320. [Google Scholar] [CrossRef] [Green Version]
- Muthanna, T.M.; Viklander, M.; Thorolfsson, S.T. Seasonal climatic effects on the hydrology of a rain garden. Hydrol. Process. 2008, 22, 1640–1649. [Google Scholar] [CrossRef]
- Paus, K.H.; Braskerud, B.C. Suggestions for designing and constructing bioretention cells for a nordic climate. VATTEN. J. Water Manag. Res. 2014, 70, 139–150. [Google Scholar]
- MNI Metrological Institute of Norway. Available online: www.eKlima.no or www.yr.no (accessed on 10 November 2018).
- Ersland, G.A. The history of Bryggen until C. 1900. In Monitoring, Mitigation, Management: The Groundwater Project—Safeguarding the World Heritage Site of Bryggen in Bergen 2015; Rytter, J., Schonhowd, I., Eds.; Riksantikvaren: Bergen, Norway, 2015; pp. 12–23. [Google Scholar]
- Jensen, J.A. 2015 Subsidence at the Bryggen site. In Monitoring, Mitigation, Management: The Groundwater Project—Safeguarding the World Heritage Site of Bryggen in Bergen; Rytter, J., Schonhowd, I., Eds.; Riksantikvaren: Bergen, Norway, 2015. [Google Scholar]
- De Beer, J.; Price, S.J.; Ford, J.R. 3D modelling of geological and anthropogenic deposits at the World Heritage Site of Bryggen in Bergen, Norway. Quat. Int. 2012, 251, 107–116. [Google Scholar] [CrossRef] [Green Version]
- Christensson, A.; Rytter, J.; Schonhowd, I. Management History. In Monitoring, Mitigation, Management: The Groundwater Project—Safeguarding the World Heritage Site of Bryggen in Bergen 2015; Rytter, J., Schonhowd, I., Eds.; Riksantikvaren: Bergen, Norway, 2015; pp. 38–47. [Google Scholar]
- Schlumberger Water Services, Diver Manual, Delft. November 2014. Available online: https://usermanual.wiki/Datasheet/SchlumbergerDiverCompleteSpecs.428302045.pdf (accessed on 1 October 2018).
- Boogaard, F.; Wentink, R.; Vorenhout, M.; De Beer, J. Implementation of Sustainable Urban Drainage Systems to Preserve Cultural Heritage—Pilot Motte Montferland. Conserv. Manag. Archaeol. Sites 2016, 18, 328–341. [Google Scholar] [CrossRef]
- De Beer, J.; Boogaard, F. Good practices in cultural heritage management and the use of subsurface knowledge in urban areas. Procedia Eng. 2017, 209, 34–41. [Google Scholar] [CrossRef]
- Woods Ballard, B.; Wilson, S.; Udale-Clarke, H.; Illman, S.; Scott, T.; Ashely, R.; Kellagher, R. CIRIA—The SuDS Manual; CIRIA Research Project 2015, (RP)992; Department for Environment Food & Rural Affairs: London, UK, 2015; ISBN 978-0-86017-760-9. Available online: https://www.ciria.org/ItemDetail?iProductCode=C753&Category=BOOK&WebsiteKey=3f18c87a-d62b-4eca-8ef4-9b09309c1c91 (accessed on 1 September 2017).
- CRC (Cooperative Research Centre for Water Sensitive Cities). Adoption Guidelines for Stormwater Biofiltration Systems; CRC: Clayton, Australia, 2015; Available online: https://watersensitivecities.org.au/wp-content/uploads/2016/06/Adoption-Guidelines-for-Stormwater-Biofiltration-Systems-Chapter-1.pdf (accessed on 14 December 2020).
- Minnesota Pollution Control Agency (MPCA). Minnesota Stormwater Manual; Minnesota Pollution Control Agency (MPCA): St. Paul, MN, USA; Melbourne, Australia, 2008; Available online: https://www.pca.state.mn.us/water/minnesotas-stormwater-manual (accessed on 14 December 2020).
- Prince George’s County, Maryland (PGCM). Bioretention Manual. In Environmental Services Division; Department of Environmental Resources, Prince George’s County: Upper Marlboro, MD, USA, 2007. Available online: https://www.princegeorgescountymd.gov/Government/AgencyIndex/DER/ESG/Bioretention/pdf/Bioretention%20Manual_2009%20Version.pdf (accessed on 14 December 2020).
- Paus, K.H.; Morgan, J.; Gulliver, J.S.; Leiknes, T.; Hozalski, R.M. Assessment of the Hydraulic and Toxic Metal Removal Capacities of Bioretention Cells after 2 to 8 Years of Service. Watern Air Soil Pollut. 2013, 225, 1–12. [Google Scholar] [CrossRef]
- Vannlaboratoriet Bergen Vann KF. Analysis for Soil Moisture. September 2017. Available online: http://www.bergenvann.com/laboratoriet/om-vannlaboratoriet/ (accessed on 1 October 2017).
- Ahmed, F.; Gulliver, J.S.; Nieber, J.L. Field infiltration measurements in grassed roadside drainage ditches: Spatial and temporal variability. J. Hydrol. 2015, 530, 604–611. [Google Scholar] [CrossRef]
- Camuffo, D.; Della Valle, A.; Becherini, F. A critical analysis of the definitions of climate and hydrological extreme events. Quat. Int. 2020, 538, 5–13. [Google Scholar] [CrossRef]
- Palhegyi, G.E. Designing storm-water controls to promote sustainable ecosystems: Science and application. J. Hydrol. Eng. 2010, 15, 504–511. [Google Scholar] [CrossRef]
- Bettess, R. Infiltration Drainage-Manual of Good Practice; CIRIA R156 1996 CIRIA: London, UK, 1996; ISBN 978-0-86017-457-8. [Google Scholar]
- BRE Digest 365. Soakway Design; Buildings Research Establishment: Bracknell, UK, 1991; ISBN 0-85125-502-7. [Google Scholar]
- DIN 19682-7. Soil Quality—Field Tests—Part 7: Determination of Infiltration Rate by Double Ring Infiltrometer 2015; German Institute for Standardization: Berlin, Germany, 2015. [Google Scholar]
- Lucke, T.; Beecham, S. Field investigation of clogging in a permeable pavement system. Build. Res. Inf. 2011, 39, 603–615. [Google Scholar] [CrossRef]
- Fassman, E.; Blackbourn, S. Urban Runoff Mitigation by a Permeable Pavement System over Impermeable Soils. J. Hydrol. Eng. 2010, 15, 475–485. [Google Scholar] [CrossRef]
- Pezzaniti, D.; Beecham, S.; Kandasamy, J. Influence of clogging on the effective life of permeable pavements. Proc. Inst. Civ. Eng. Water Manag. 2009, 162, 211–220. [Google Scholar] [CrossRef] [Green Version]
- Venvik, G.; Bang-Kittilsen, A.; Boogaard, F.C. Risk assessment for areas prone to flooding and subsidence: A case study from Bergen, Western Norway. Hydrol. Res. 2019, 51, 322–338. [Google Scholar] [CrossRef]
- Boogaard, F.C.; Kluck, J.; Bosscher, M.; Schoof, G. Flood model Bergen Norway and the need for (sub-)surface INnovations for eXtreme Climatic EventS (INXCES). Procedia Eng. 2017, 209, 56–60. [Google Scholar] [CrossRef]
- Available online: https://climatescan.nl/projects/16/detail (accessed on 1 December 2020).
Figure 1.
The Medieval city in Bergen is located along the shore of Vågen bay.

Figure 2.
Top: Sketch of the infiltration system at Bryggen (Drawing: Multiconsult AS). Bottom: Cross section of rain garden, swale, and permeable pavement (modified from de Beer & Boogaard [40]).
Figure 2.
Top: Sketch of the infiltration system at Bryggen (Drawing: Multiconsult AS). Bottom: Cross section of rain garden, swale, and permeable pavement (modified from de Beer & Boogaard [40]).

Figure 3.
The catchment area and locations of boreholes.

Figure 4.
The design of rain garden B. Drawing: Multiconsult AS [21].
Figure 4.
The design of rain garden B. Drawing: Multiconsult AS [21].

Figure 5.
Modified Philip–Dunne (MPD) column for infiltration measurements (Photo: Tone M. Muthanna).
Figure 5.
Modified Philip–Dunne (MPD) column for infiltration measurements (Photo: Tone M. Muthanna).

Figure 6.
Description of the full-scale infiltration test at Bryggen on 6th of September 2017.

Figure 7.
A fire hydrant served as a water source, providing ca. 600 L water per minute.

Figure 8.
Full-scale infiltration test of the SuDS at Bryggen.

Figure 9.
MPD infiltration tests where MPD 3 and 4 were measured in the smaller compartment A (picture on the left) and MPD 1 and 2 were measured in the larger compartment B (picture on the right). Photo: Torstein Dalen, Bergen Municipality.
Figure 9.
MPD infiltration tests where MPD 3 and 4 were measured in the smaller compartment A (picture on the left) and MPD 1 and 2 were measured in the larger compartment B (picture on the right). Photo: Torstein Dalen, Bergen Municipality.

Figure 10.
Results of the MPD infiltration test in rain garden A and B. MPD 3 and 4 were measured in compartment A and MPD 1 and 2 in compartment B.
Figure 10.
Results of the MPD infiltration test in rain garden A and B. MPD 3 and 4 were measured in compartment A and MPD 1 and 2 in compartment B.

Figure 11.
Response in groundwater level (cm) in the monitoring well MB07 (green line) and MB21 (blue line). The red dashed line marks the day of the full-scale infiltration test. Precipitation data from Florida metrological station in the center of Bergen, ca. 1.5 km from Bryggen. Data from Norwegian Metrological Institute @ eKlima.no [33].

Figure 12.
The graph shows variations in the groundwater level (cm) in monitoring wells MB 02 (green line), MB 06 (blue line), and MB 14 (yellow line). The red dashed line marks the day of the full-scale infiltration test. Precipitation data from Norwegian Metrological Institute @ eKlima.no [33].
Figure 12.
The graph shows variations in the groundwater level (cm) in monitoring wells MB 02 (green line), MB 06 (blue line), and MB 14 (yellow line). The red dashed line marks the day of the full-scale infiltration test. Precipitation data from Norwegian Metrological Institute @ eKlima.no [33].


Table 1.
Analysis of soil moisture of samples collected before and after the full-scale test. The results are given in precent (%) of water in the soil.
Table 1.
Analysis of soil moisture of samples collected before and after the full-scale test. The results are given in precent (%) of water in the soil.
| Sample | Water Content in Percent (%) Before Full-Scale Test | Water Content in Percent (%) After Full-Scale Test |
|---|---|---|
| 1. | 30.50 | 42.40 |
| 2. | 34.30 | 56.50 |
| 3. | 28.60 | 40.70 |
| 4. | 28.10 | 58.50 |
Table 2.
The results of the small-scale and full-scale infiltration test show different infiltration capacity for the two rain gardens, compartment A and B, tested in this study. Results compared to international guidelines [41,42,43,44,45].
| Small-Scale Infiltration Tests | Full-Scale Infiltration Test | Requirement 100–300 mm/h and Empty Time of Max 48 h | |
|---|---|---|---|
| The large rain garden B | MPD 1: 245 mm/h | Ca. 1600 mm/h | 5 times the requirement of infiltration 11 min empty time |
| MPD 2: 241 mm/h | |||
| The small rain garden A | MPD 3: 382 mm/h | Ca. 510 mm/h | 1.7 times the requirement of infiltration 35 min empty time |
| MPD 4: 404 mm/h |
Publisher’s Note: MDPI stays neutral with regard to jurisdictional claims in published maps and institutional affiliations. |
© 2020 by the authors. Licensee MDPI, Basel, Switzerland. This article is an open access article distributed under the terms and conditions of the Creative Commons Attribution (CC BY) license (http://creativecommons.org/licenses/by/4.0/).
Share and Cite
MDPI and ACS Style
Venvik, G.; Boogaard, F.C. Infiltration Capacity of Rain Gardens Using Full-Scale Test Method: Effect of Infiltration System on Groundwater Levels in Bergen, Norway. Land 2020, 9, 520. https://doi.org/10.3390/land9120520
AMA Style
Venvik G, Boogaard FC. Infiltration Capacity of Rain Gardens Using Full-Scale Test Method: Effect of Infiltration System on Groundwater Levels in Bergen, Norway. Land. 2020; 9(12):520. https://doi.org/10.3390/land9120520
Chicago/Turabian StyleVenvik, Guri, and Floris C. Boogaard. 2020. "Infiltration Capacity of Rain Gardens Using Full-Scale Test Method: Effect of Infiltration System on Groundwater Levels in Bergen, Norway" Land 9, no. 12: 520. https://doi.org/10.3390/land9120520
Note that from the first issue of 2016, this journal uses article numbers instead of page numbers. See further details here.