Article

Exploring Linkages between Supporting, Regulating, and Provisioning Ecosystem Services in Rangelands in a Tropical Agro-Forest Frontier

by
Rocío Aguilar-Fernández
1,2,3,
Mayra E. Gavito
3,*,
Marielos Peña-Claros
2,
Mirjam Pulleman
1,4 and
Thomas W. Kuyper
1
1
Soil Biology Group, Wageningen University & Research, P.O. Box 47, 6700 AA Wageningen, The Netherlands
2
Forest Ecology and Forest Management Group, Wageningen University & Research, P.O. Box 47, 6700 AA Wageningen, The Netherlands
3
Instituto de Investigaciones en Ecosistemas y Sustentabilidad, Universidad Nacional Autónoma de México, Antigua Carretera a Pátzcuaro 8701 Col. Exhacienda de la Huerta, Morelia CP 58190, Mexico
4
International Center for Tropical Agriculture (CIAT), Headquarters and Regional Office for Latin America and the Caribbean, Km 17 Recta Cali-Palmira, C.P. 763537, A.A. 6713 Cali, Colombia
*
Author to whom correspondence should be addressed.
Land 2020, 9(12), 511; https://doi.org/10.3390/land9120511
Submission received: 18 November 2020 / Revised: 7 December 2020 / Accepted: 8 December 2020 / Published: 11 December 2020
(This article belongs to the Special Issue Exploring the Relationships between Land Use and Ecosystem Services)

Abstract

:
Rangeland management in former tropical rainforest areas may affect ecosystem services. We hypothesized that management practices like burning and overgrazing reduce supporting (soil quality) and consequently also provisioning (forage productivity and quality) and regulating (nutrient cycling) ecosystem services. We established 31 exclosures in two landscape categories (alluvial soils, low-hills), documented management practices, and assessed 18 soil quality indicators, litter decomposition as a proxy for nutrient cycling, and forage quantity and quality during one year in grasslands of the Lacandon region, southeast Mexico. Path analysis was used to explore direct and indirect effects of livestock management practices on soil-based ecosystem services. Landscape position had direct effects on management practices, and direct and indirect effects on soil properties. Altitude (a proxy for the soil catena, ranging from alluvial soils along the Lacantún river to Cambisols and Acrisols in the low-hills) was the variable showing most significant negative relations with soil quality and forage production. Decomposition rate was site-specific and had no relation with landscape position and management. Our study suggests that position on the landscape, which relates to nutrient and water availability, had stronger effects than management practices on forage productivity and quality and drives farmers management practices.

1. Introduction

Agricultural expansion, both for cropland and rangeland, is one of the major drivers of deforestation in the tropics [1,2]. Extensive cattle production occupies more than 27% of rural landscapes across Latin America, and continues to expand [3]. The establishment and maintenance of rangelands has large consequences for local and regional biodiversity. Given that biodiversity plays a critical role in ecosystem functioning, large impacts on ecosystem services can be expected to occur after transformation from forest to grasslands. Ecosystem services have been categorized in four classes, viz., regulating, supporting, cultural, and provisioning services [4,5,6]. Supporting and regulating services are those services crucial for the sustained supply of provisioning services, the products that humans obtain from ecosystems (food, feed, building materials, medicine, etc.). Supporting and regulating services are often replaced by external human inputs (mineral fertilizer to replace natural nutrient cycling, pesticides to replace natural pest control) in intensively managed agricultural landscapes, resulting in a disconnection between supporting and regulating services on the one hand and provisioning services on the other. However, for low-income farmers with limited resources, these supporting and regulating services may not be sufficiently replaced and become crucial for provisioning services.
Establishment of extensively managed rangelands in former tropical rainforest areas may cause a decline of supporting and regulating services, and therefore in provisioning services, which subsequently results in a further decline of supporting and regulating services. Deforestation, burning, and rangeland management can lead to a decline of soil quality through erosion, loss of soil organic matter and nutrients, and compaction, thereby reducing the ability of the soil to produce enough forage of sufficient quality, which then feeds back to the levels of soil organic matter and nutrients. Additionally, deforestation in riparian areas reduces water availability for livestock, wildlife, and local human populations [7,8,9]. Here, we focus on a better understanding of the effects of different rangeland management practices, that follow after deforestation, on soil quality and ecosystem services.
In Mexico, livestock ranching is currently the most common agricultural activity, occupying 56% of national territory [10,11]. In Marqués de Comillas, located in the Lacandon region, Chiapas, southeast Mexico, rangelands are the major anthropogenic disturbance, representing around 50% of the area [12]. Currently, many of the pasturelands in Marqués de Comillas are not managed efficiently. Local farmers have faced important deficiencies in technical assistance, training, and access to technology. Often livestock, as a private tradeable commodity, functions as a substitute for money savings, allowing for sales under immediate need for cash [13]. Apparently, current management practices fail in their intent to contribute to rural employment and to provide good levels of meat and milk production. Although the economic value of bovine production has increased since 2006, local communities have not improved their living conditions and income. Some studies reported that local farmers of Marqués de Comillas perceive that their lands are ‘poor’, and face degradation due to livestock ranching [14,15]. Additionally, the establishment of mono-dominant patches of bracken fern (Pteridum aquilinum) was identified as an important indicator of land degradation and a reason for field abandonment. Landowners perceived that invasion by bracken fern is favored by the recurrent use of fire to control the establishment of secondary vegetation, and by declining soil fertility [16]. In an attempt to prevent further decline in ecosystem services, and make cattle ranching more ‘profitable’ or ‘sustainable’, farmers rotate cattle over large areas, leaving parts of the rangelands in fallow periods to recover their productivity [15]. However, these practices drive further rangeland expansion at the expense of native forests at larger spatial scales. Sustainable use of rangelands could prevent further deforestation in agro-forest frontier areas, and thereby also contribute to maintaining biodiversity in the remaining forest fragments. Conservation of biodiversity and ecosystem services will ultimately depend on our ability to sustainably manage human-modified ecosystems.
There is an urgent need to understand how these rangelands respond to management practices, how they contribute to human well-being, and how people could use them in a sustainable way. A variety of effects of conversion of forest to rangeland has been documented. A study in the Atlantic Zone of Costa Rica found significant changes in soil properties associated with conversion of forest to pasture; namely an increase in pH, bulk density and concentrations of NH4+, and a decrease in concentrations of NO3− and rates of N-mineralization [17]. Other studies have shown changes in the soil biota. In the Brazilian Amazon, land-use change resulted in large reductions in fungal richness and an increased prevalence of generalist taxa [18]. In the Mexican rainforest, pasture establishment was associated with increased vulnerability of the soil microbial communities to seasonal changes [19]. However, few studies have so far investigated how differences in rangeland management affect soil physical, chemical, and biological quality, and related ecosystem services underpinning rangeland productivity in the humid tropics.
The objectives of our study were to (1) characterize current livestock management practices in the geomorphologically diverse landscape of the Marqués de Comillas study area, and (2) understand how these practices affect soil quality and related supporting, regulating and provisioning ecosystem services. More specifically, we explored the direct and indirect effects of livestock management practices on soil-based supporting and regulating ecosystem services and their linkages to two provisioning ecosystem services: forage productivity (quantity of palatable plants) and forage quality (forage protein concentration), supplied by these grasslands (Figure 1). We established 31 plots in different landscape categories (alluvial areas and low-hills) in the Marqués de Comillas study area, documented management practices, and measured soil quality indicators, litter decomposition potential, and forage productivity and quality.
We hypothesized that (1) the rangelands located away from the river in low-hills show lower soil quality and ecosystem services supply than the rangelands in alluvial areas; (2) the more intensively managed rangelands show a decrease in soil quality, supporting services (decomposition rate as a proxy for nutrient cycling), and provisioning services (forage productivity and quality); and (3) the rangelands with higher soil quality have higher decomposition rates (direct effect) and higher forage productivity and quality (indirect effect) than rangelands with lower soil quality.

2. Materials and Methods
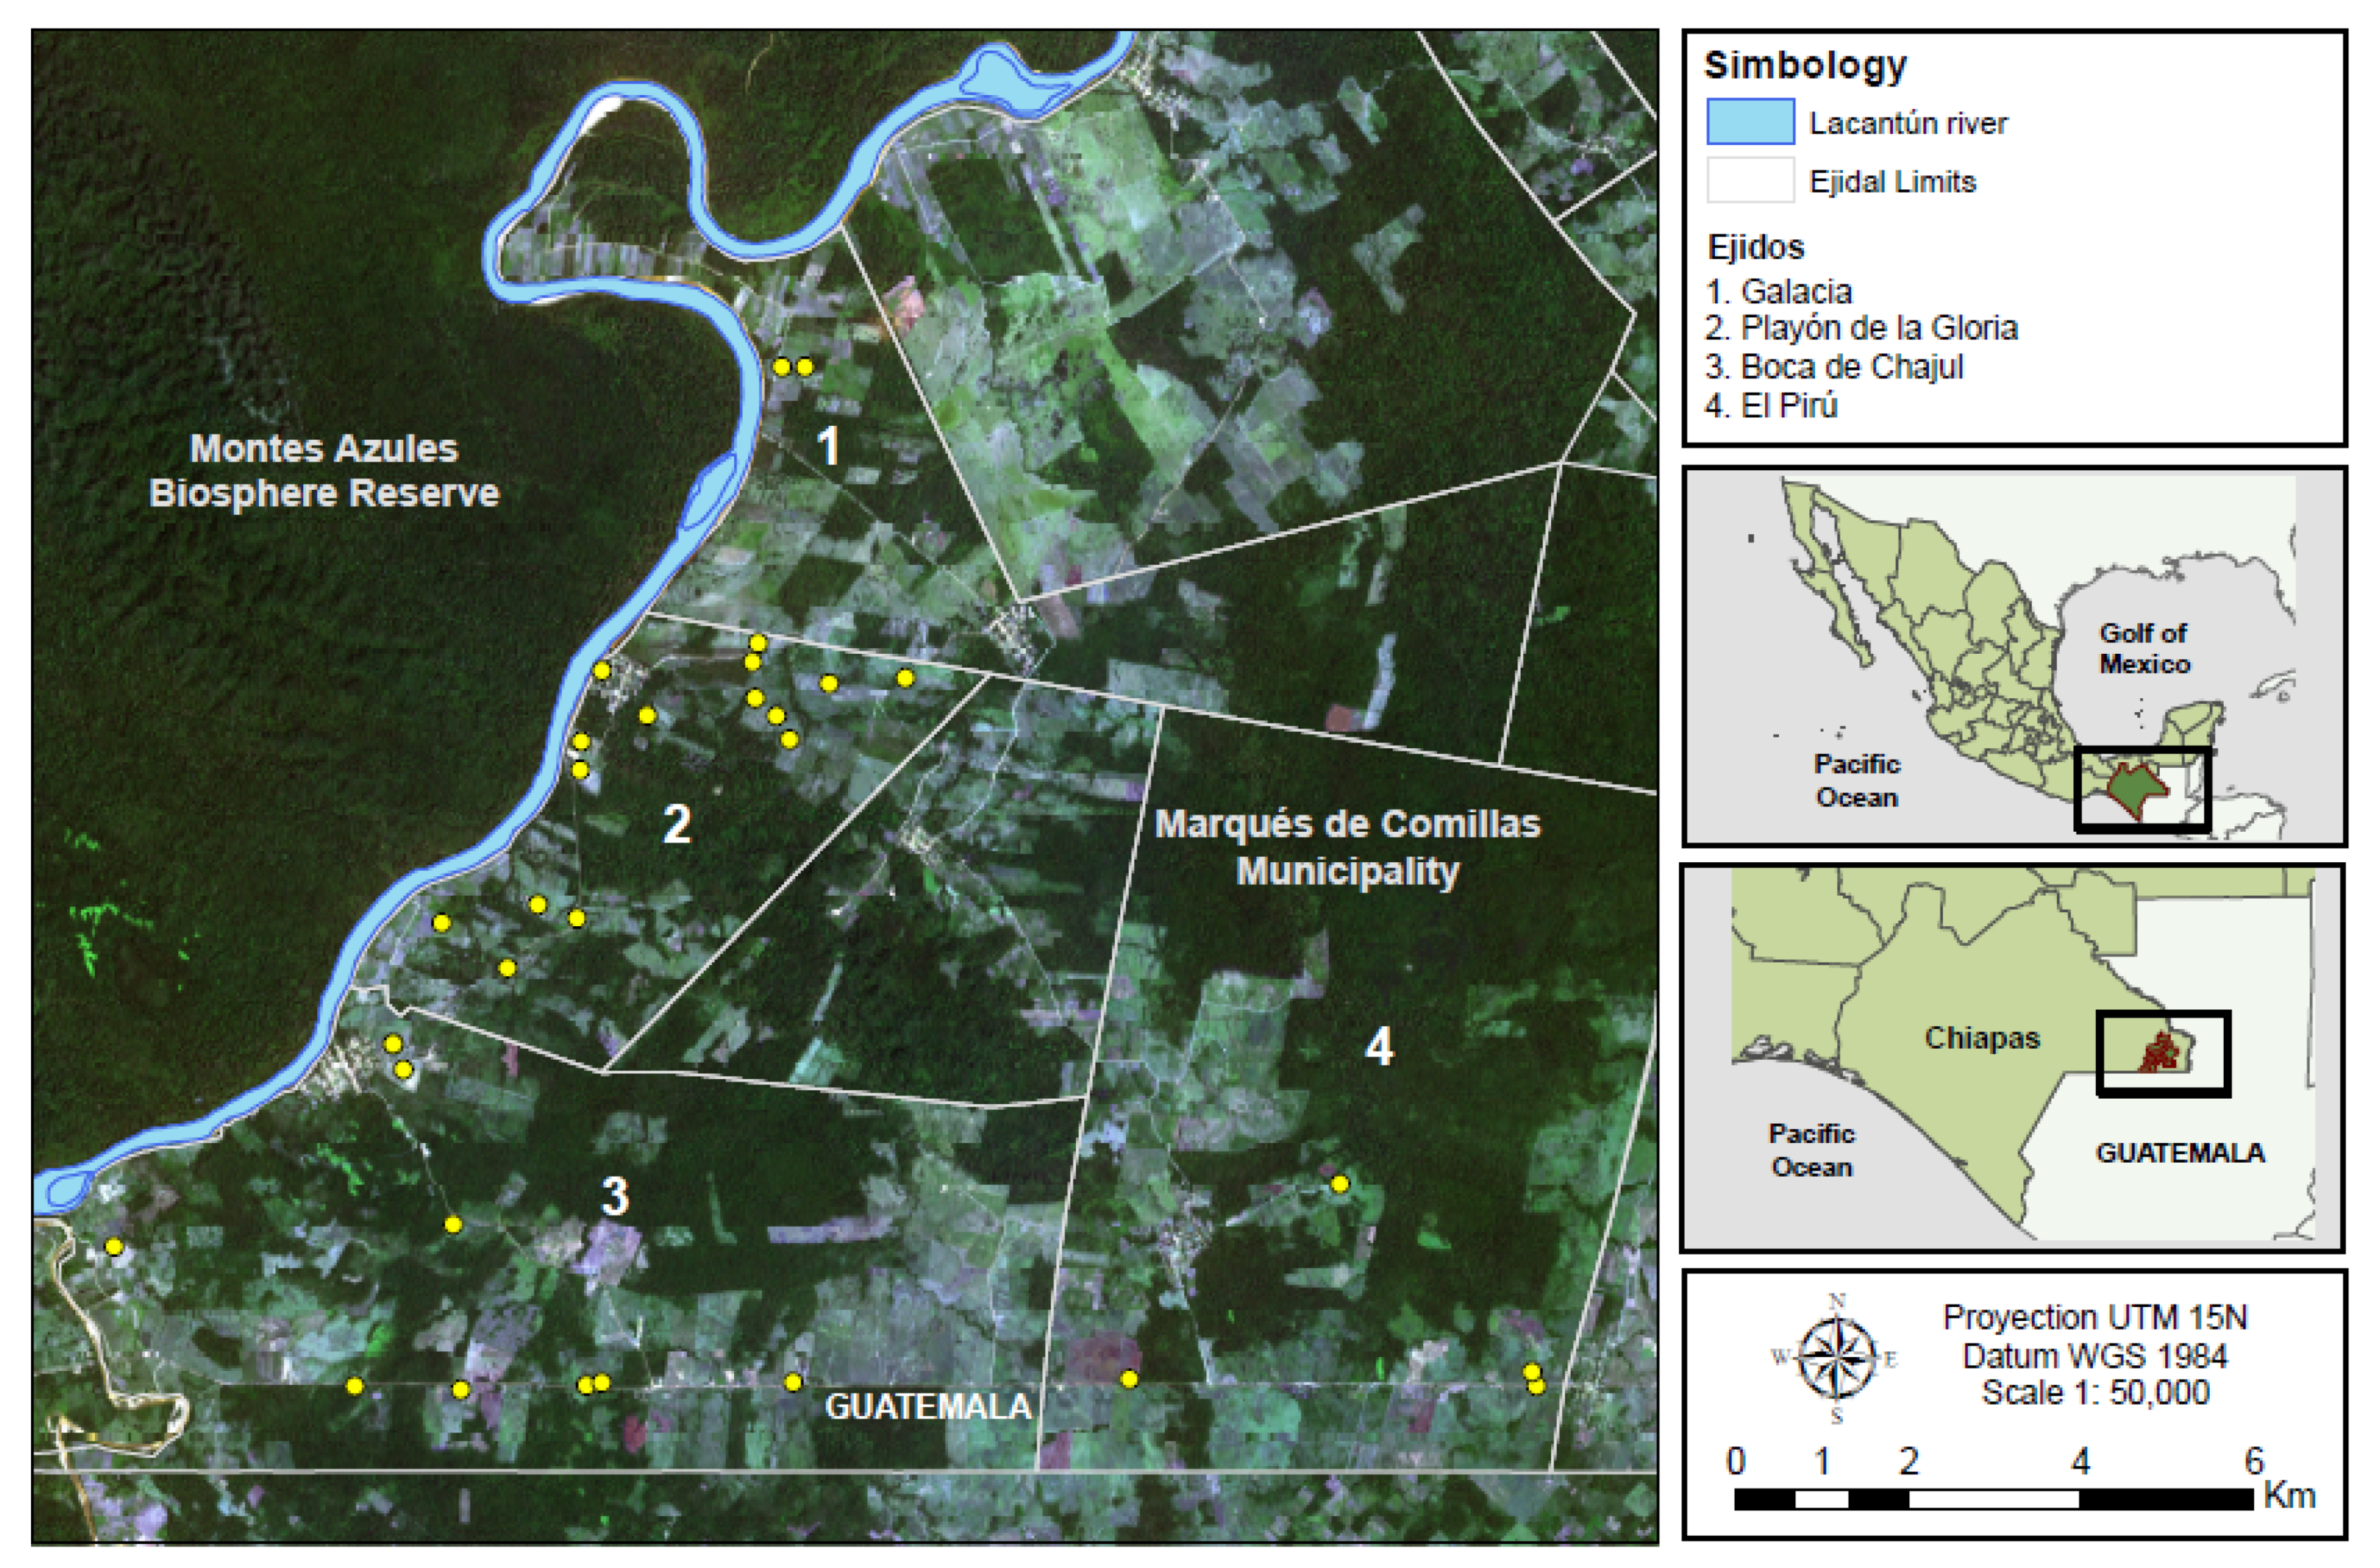
2.1. Study Site

The study was conducted in Marqués de Comillas, a part of the Lacandona rainforest region, Chiapas, southeast Mexico (16°01′ N, 90°55′ W) (Figure 2). The climate is warm-humid with an average annual temperature of 24 °C. Annual rainfall is around 3000 mm, with a dry period from February through April, with less than 100 mm rainfall per month [20]. A total of four geopedologic land units were identified in the approximately 50 km2 area, based on variation in geomorphological and pedological conditions within the larger landscape context of the study area: (1) fluvial terraces, (2) flood plains, (3) low-hills, and (4) karst mountains [21,22]. We combined fluvial terraces and flood plains into one category of alluvial areas, as both are characterized by deposition of fine sediments due to regular flooding of the Lacantún river. Alluvial areas represent 16% of the land and the main soil types there are Fluvisols, Cambisols and Luvisols. The low-hills represent 70% of the area, and consist of claystone–sandstone, siltstone–sandstone and sandstone–conglomerates. The main soil types found in the low-hills are Cambisols associated with Acrisols [21]. The karst mountains are mostly steep and soils are shallow. As these latter soils are unsuitable for pastures, they were excluded from our study. The two landscape categories (alluvial soils and low-hills) are easily recognized by farmers and are part of the discourse of local people when talking about soil management, and were therefore included in this study.
Several vegetation types characterize the area, with rainforest still being the dominant one. Extensive areas of former old-growth forest have been converted to agricultural fields (croplands) and later to rangelands. The landscape matrix is highly dynamic and under high anthropogenic pressure. In 2011, 35% of the landscape in this region was covered by rangelands, while the rest of the land was covered by mature forest (52%), secondary forest (5%), croplands (4%), forestry plantations (<3%), cocoa shade farming (<1%), and oil palm plantations (<1%) [7].
Mayans and other human groups, the original inhabitants of the area, abandoned it more than 500 years ago. Human recolonization started in the early 1970s, when governmental programs encouraged immigration. The Marqués de Comillas municipality has 28 ejidos, a unique land tenure system of common property that emerged from the Mexican Revolution to distribute lands to poor landless peasants [23,24]. A typical productive unit of an individual farmer in this region has an average size of 30–50 ha, from which 20–40 ha are usually devoted to cattle ranching [25].

2.2. Study Design, Plot Establishment and Plot Characteristics

In total, 31 exclosures (3 m × 3 m) were established in individual paddocks across four ejidos, Boca de Chajul, Playón de la Gloria, Galacia, and El Pirú, to measure biomass productivity and forage quality. The paddock selection process aimed to capture diversity in terms of landscape position, and past and actual management practices. Most rangelands in Marqués de Comillas are nevertheless located in the low-hills. Therefore, 26 of the exclosures were established in this landscape category. All exclosures were established on actively managed rangelands. Researcher and landowner decided together on the exact location of the exclosure after a joint visit to the farm. Given the heterogeneity of plant cover in the paddocks, care was taken that the exclosures were located such that the plant community structure inside and outside the exclosure was similar at the beginning of the cattle exclusion period in May 2018. For each exclosure we collected data on the presence of trees, biomass productivity, decomposition of standard material, and biological, chemical, and physical soil quality indicators.

2.3. Data Collection

2.3.1. Characterization of Livestock Management Practices

Semi-structured interviews were conducted with individual farmers to obtain information about the historical and current management practices (interview questions are provided in Appendix A). During a field visit with the owner we collected additional information about management decisions. Given that sometimes the official owner was not the one who made decisions or managed the land, additional in-depth interviews were conducted when necessary (for example, to other members of the family or to employees in charge of the rangeland). During the interview, the interviewee was asked to draw a sketch of the rangeland and to locate fences, water bodies, fragments of tree vegetation, and roads. The majority of farmers (28 of 31) practiced an incipient rotational system, which consists of reallocation of livestock from one paddock to another to allow the pastures to recover after a period of grazing (this was assessed in the path model through the variable grazing time (GT), were GT = 1 corresponds to continuous grazing). Implementation of rotational grazing systems is a relatively recent phenomenon, with the general objective of increasing productivity by ensuring that palatable plants receive sufficient resources and by enabling livestock to harvest forage more efficiently [26]. The rotational system (average grazing time per paddock and direction of the rotation between areas) was represented in the sketch, as well as the history of establishment (different parts of the rangeland were established in different years, as the rangeland area generally expanded over time). We also asked detailed questions about duration of the productive activity, fire use, agrochemical use, machinery use, stocking rate, duration of grazing period, grazing intensity (expressed as stocking rate and grazing periods), and type of production (calves, or adults for meat). When possible, information was corroborated by cross-checking. For example, years since the rangeland was established were cross-checked by Landsat images modelling, and size of farms was measured using ArcGis software.
We also calculated the Ecological Disturbance Index (EDI) according to Zermeño et al. (2015) as a general metric for the intensity of disturbance that considers various management practices: E D I = S Z + D   + S V ,   where   SV = F F + H F + T F + G S + T C [27]. The EDI is based on size (SZ) (field surface in hectares under cattle ranching), duration (D) (years since the rangeland was established) and severity of agricultural management (SV). SV is based on five criteria, viz., fire frequency (FF), frequency of herbicide use (HF), use of tractor frequency (TF), grazing severity (GS), and tree cover (TC). FF refers to the number of burning events in the history of field use; HF is quantified as the number of agrochemical applications per annual productive cycle; TF is the number of times a tractor was used per year; GS refers to the stocking density (SD) (number of livestock heads per hectare) adjusted by grazing time (GT) (proportion of time under pasture use in an annual cycle); TC is a parameter that adopts values from 0 to 2, depending on the relative cover of trees within a given field: 2, tree cover 0–25%; 1, 25–50%; and 0, >50%.

2.3.2. Soil Quality and Litter Decomposition

We took four samples with a fixed volume from 0 to 25 cm depth in each plot and bulked them into one composite sample. Samples for the determination of pH, and total C, N and P were taken in October 2018, samples for the determination of available ammonium, nitrate and orthophosphate in March 2019, at the height of the dry season. Composite samples were stored in self-sealed plastic bags and kept refrigerated until being processed in the lab. A subsample was taken and frozen for fatty-acid analysis.
Chemical soil quality was determined through pH (in 1:10 soil: water solution); soil organic matter percentage by wet combustion [28]; total C and N with a AEO Flash 2000 elemental analyzer (Thermo Scientific) after HCl to remove carbonates; total P after macro-Kjeldahl digestion [29] and colorimetry with a Bran–Luebbe Auto Analyzer III [30]; and inorganic N (ammonium, nitrate) after 2M KCl extraction [31,32] and available P (orthophosphate) after Mehlich 3 extraction and colorimetry [33]. Physical soil quality was assessed through particle size analysis [34], sand-free water-stable macro- and microaggregates, bulk density, and water infiltration rate measurements. Micro- and macro-aggregates, were measured from an undisturbed soil sample taken in each plot using a metal cylinder (10 cm diameter, 0–25 cm depth) in October 2018. Samples were sealed and stored in jars to protect their structure until being processed in the lab. Sand-free water-stable aggregates were quantified in three fractions: macro-aggregates (0.250–1 mm and 1–4 mm) and micro-aggregates and particles smaller than 0.250 mm [35]. Bulk density was also determined from two similar 0–25 cm soil cores taken with a 10-cm diameter PVC cylinder. The core was sealed and stored until being processed in the lab where the cylinder was emptied, the soil weighed, oven-dried, and weighed again. Soil infiltration rate was measured near the exclosure plot with a single-ring infiltrometer (20 of cm of diameter, 14 cm height aboveground, and 2 cm belowground) according to Verbist et al. (2010) [36]. We made three measurements in each plot and calculated the average. Soil microbial functional group abundances were quantified through fatty-acid analysis from 3 g finely ground soil from the frozen composite sample of each plot, according to Frostegård et al. (2011) [37]. The fatty acids in phospholipid and neutral lipid fractions were identified with MIDI software and quantified from their retention times in relation to the internal standard (fatty acid methyl ester 19:0). Seventeen biomarkers were selected. In total, three biomarkers were used as indicators of fungal biomass, 18:2 ω6,9 (PLFA fraction) [38], 18:1 ω7 (NLFA fraction) and 16:1 ω5c (NLFA fraction), the latter specifically for arbuscular mycorrhizal fungi (AMF) [39]. A total of 14 PLFAs represented bacterial biomass, 12:0 3OH, i14:0, 16:0 2OH, 16:0 3OH [40], i15:0, a15:0, i16:0 [41], i17:0, a17:0, cy17:0, cy19:0 ω8c [39], i17:0 3OH [42], 10 Me17:0, and 18:0 2OH [40]. We also calculated the fungi: bacteria ratio as well as the Gram-positive: Gram-negative bacteria ratio by adding the abundances of the relevant biomarkers.
Decomposition rate of a standard material (to allow comparisons between plots) was measured as a proxy for the nutrient cycling potential of each plot (referred in the text as ‘litter decomposition rate’). Decomposition rates were determined using the litterbag method [43]. Fresh leaf material was collected from the 31 study sites, dried and mixed to create a homogeneous dry mixture. Litterbags (mesh size of 2 mm in the upper side and 0.25 mm mesh in the bottom side) containing an initial dry weight of six grams of the standard material mixture were placed within each exclosure from June 2018 (month 0) to June 2019 (month 12). In total, four bags were collected from each plot in July 2018 (month 1), October 2018 (month 4), December 2018 (month 6), and July 2019 (month 12). After litterbag collection we carefully brushed off the soil residues, removed manually in-grown roots, and then oven-dried and weighed the remaining material. After weighing, the material was incinerated in a muffle oven to correct for soil contamination in the bags. Decomposition rate was calculated as the rate constant k (per day) based on the simple exponential model: d N d t = kN , with N being the mass remaining at collection time, and k the decomposition rate [44].

2.3.3. Biomass Production and Forage Quality

Biomass production of palatable species and forage protein concentration were used to estimate the provisioning service of forage productivity and quality. Cattle-grazing exclosures were established by fencing 3 m × 3 m in plots and divided into four 1-m2 subplots. We left out the outermost 50 cm of each exclosure to avoid border effects. A total of two subplots were harvested monthly (treatment 1) and the other two were harvested only at the beginning and at the end of the experiment (14 months) (treatment 2). Treatment 1 referred to a simulation of continuous grazing, where all plant biomass present was removed. Palatable and nonpalatable biomass were separated after careful examination and classification. Treatment 2 represented the cumulative biomass production in the absence of grazing effects and allowed us to evaluate if grazing affected plant biomass production. In total, four out of a total number of 434 monthly biomass samples, were discarded as cows had entered the exclosure after damaging the barbed wire (in different plots, at different times). Productivity estimates might therefore slightly underestimate total productivity. All vegetation (grasses, forbs and tree seedlings) was clipped at approximately 5 cm height with garden scissors or a small machete. Vegetation was separated into two groups: palatable and non-palatable species. Palatability of plants was established on the basis of local knowledge; when needed, information was corroborated with the literature [45]. Collected material was dried in a handmade oven until it reached constant weight and stored for further analysis. Biomass productivity with and without monthly clipping was expressed as cumulative dry weight (g) per unit area over 12 months. Forage quality was assessed as protein concentration, which is a factor that determines cattle weight gain. It was measured at the beginning of the experiment in June 2018, using a representative subsample of palatable vegetation in each plot. The subsample was ground into fine powder to determine total nitrogen after Kjeldahl method and calculate protein concentration, as its N concentration multiplied by 6.25 [46].

2.4. Data Analyses

We developed a conceptual or path model (Figure 1) to test (1) whether landscape and history of use affected current livestock management practices and soil quality; (2) if livestock management practices had a direct effect on supporting, regulating and provisioning services; (3) the effect of biological, chemical and physical soil quality on decomposition and forage productivity and quality. Path analysis is a form of multiple regression analysis that evaluates hypothesized causal models by examining the relationships between a dependent variable and a set of independent variables. Given the sample size (31 plots) relative to the number of variables (39) collected in this study, we grouped the variables into seven categories: landscape position, age of the plot (as a proxy for history of management), current management practices, chemical, physical and biological soil quality, decomposition rate (as a proxy for nutrient cycling), and provisioning ecosystem services (forage productivity and quality). Landscape position included three separate variables: landscape category, distance from the river, and altitude. Distance from the river represents the beeline distance between the exclosure plots and the Lacantún river; altitude (as a proxy for landscape position) was calculated as the vertical elevation of the plot above sea level (masl).
For each variable category we selected 1–2 variables to be included in the path analysis. To reduce the number of variables we performed two Principal Component Analyses (PCA), one for management and one for soil quality (Figure S1; Table S1). To avoid collinearity, a variance inflation factor (VIF) was calculated. When two or more variables within categories showed high VIF values, factors were eliminated and the PCA was run again. We kept the variables that resulted in higher percentage of variance explained. The first two components were used in subsequent analyses to determine the direct and indirect effects of management and soil properties on ecosystem services. Variables for final analysis were selected based on the following criteria: (1) After PCA, axes that explained at least 60% of variation were picked; (2) if two or more individual variables showed a strong negative correlation, one of them was eliminated; (3) variables that showed a strong correlation with two axes were eliminated. All data were normalized after transformation (mean = 0, standard deviation = 1) so that all responses had equal weight. Once individual variables were selected, standard β coefficients were calculated using multivariate regressions to evaluate the relationships between predictors and response variables.
We used simple regression models to (a) illustrate the statistically significant (p ≤ 0.05) correlations according to multivariate analyses (grazing time vs altitude, pH vs altitude, stocking rate vs altitude, pH vs grazing time, AMF vs altitude, pH vs grazing time, Gram+:Gram- ratio vs altitude, forage protein content vs AMF); (b) to examine the relation between the Ecological Disturbance Index and the measured provisioning ecosystem services (forage productivity and forage quality); (c) to examine the relationship between soil properties and management variables and the three proxies used to estimate ecosystem services: forage productivity, forage protein concentration, and decomposition. We used the scores of the first components of the two PCAs described above, which best explained the variation in soil properties (PO3−, NH4+, NO3−, OM, pH, sand content) and management (grazing time, herbicides, stocking rate, meat production, fire) to integrate the variation in soil quality and management.
To compare the effect of landscape category on forage productivity, we conducted one-way ANOVA and post-hoc multiple comparisons (after Bonferroni correction) by using the average values of dry biomass of palatable species collected in a year of sampling.
All statistical calculations (linear regressions, multiple regressions (method enter), PCA and one-way ANOVA) were completed with IBM SPSS statistical software version 25.

3. Results

3.1. Rangeland Characteristics and Management

The 31 study plots (paddocks) represented different ages since establishment of livestock management, ranging from 4 to 40 years of livestock management. Altitude of the plots varied from 143 masl, at 0.17 km from the Lacantún river to 186 masl at 13 km from the river. The size of the farms varied between 5 and 50 ha (Table 1). A total of five plots were located on alluvial soils and 26 plots were located on low hills. Average stocking rate was 2.24 heads ha−1, varying from 0.1 to 9 heads ha−1. The majority of farmers rotated cattle among different paddocks (28 of 31). All farmers burned the land when the pastures were established, but only two farmers reported to have used fire in the last 5 years. Several herbicides were reported, belphosphate, glyphosate, picloram, and paraquat being most frequently used. Tractor use is a recent practice in the area and was reported in only three plots. There were two types of production: calf production, where farmers sell the calves when they stop drinking milk, and meat production, where farmers fatten the cattle until it reaches a certain weight (Table 1).

3.2. Soil Quality and Biomass Productivity

Soil properties showed high variation among plots. We observed in general low levels of available nutrients, low to medium levels of soil organic matter, and large variations in pH, bulk density, infiltration rate, stable macroaggregates, and bacteria: fungi ratios (Table 2).
Litter decomposition rates showed a similar variation, close to one order of magnitude (0.003–0.016 day−1). The annual cumulative productivity of palatable species was also highly variable (114–1418 kg ha−1) in the non-grazing treatment, and in the monthly cut treatment, which was overall lower than the non-grazing treatment (18–852 kg ha−1). The protein concentration was relatively low (4.46–15.37%) (Table 2).

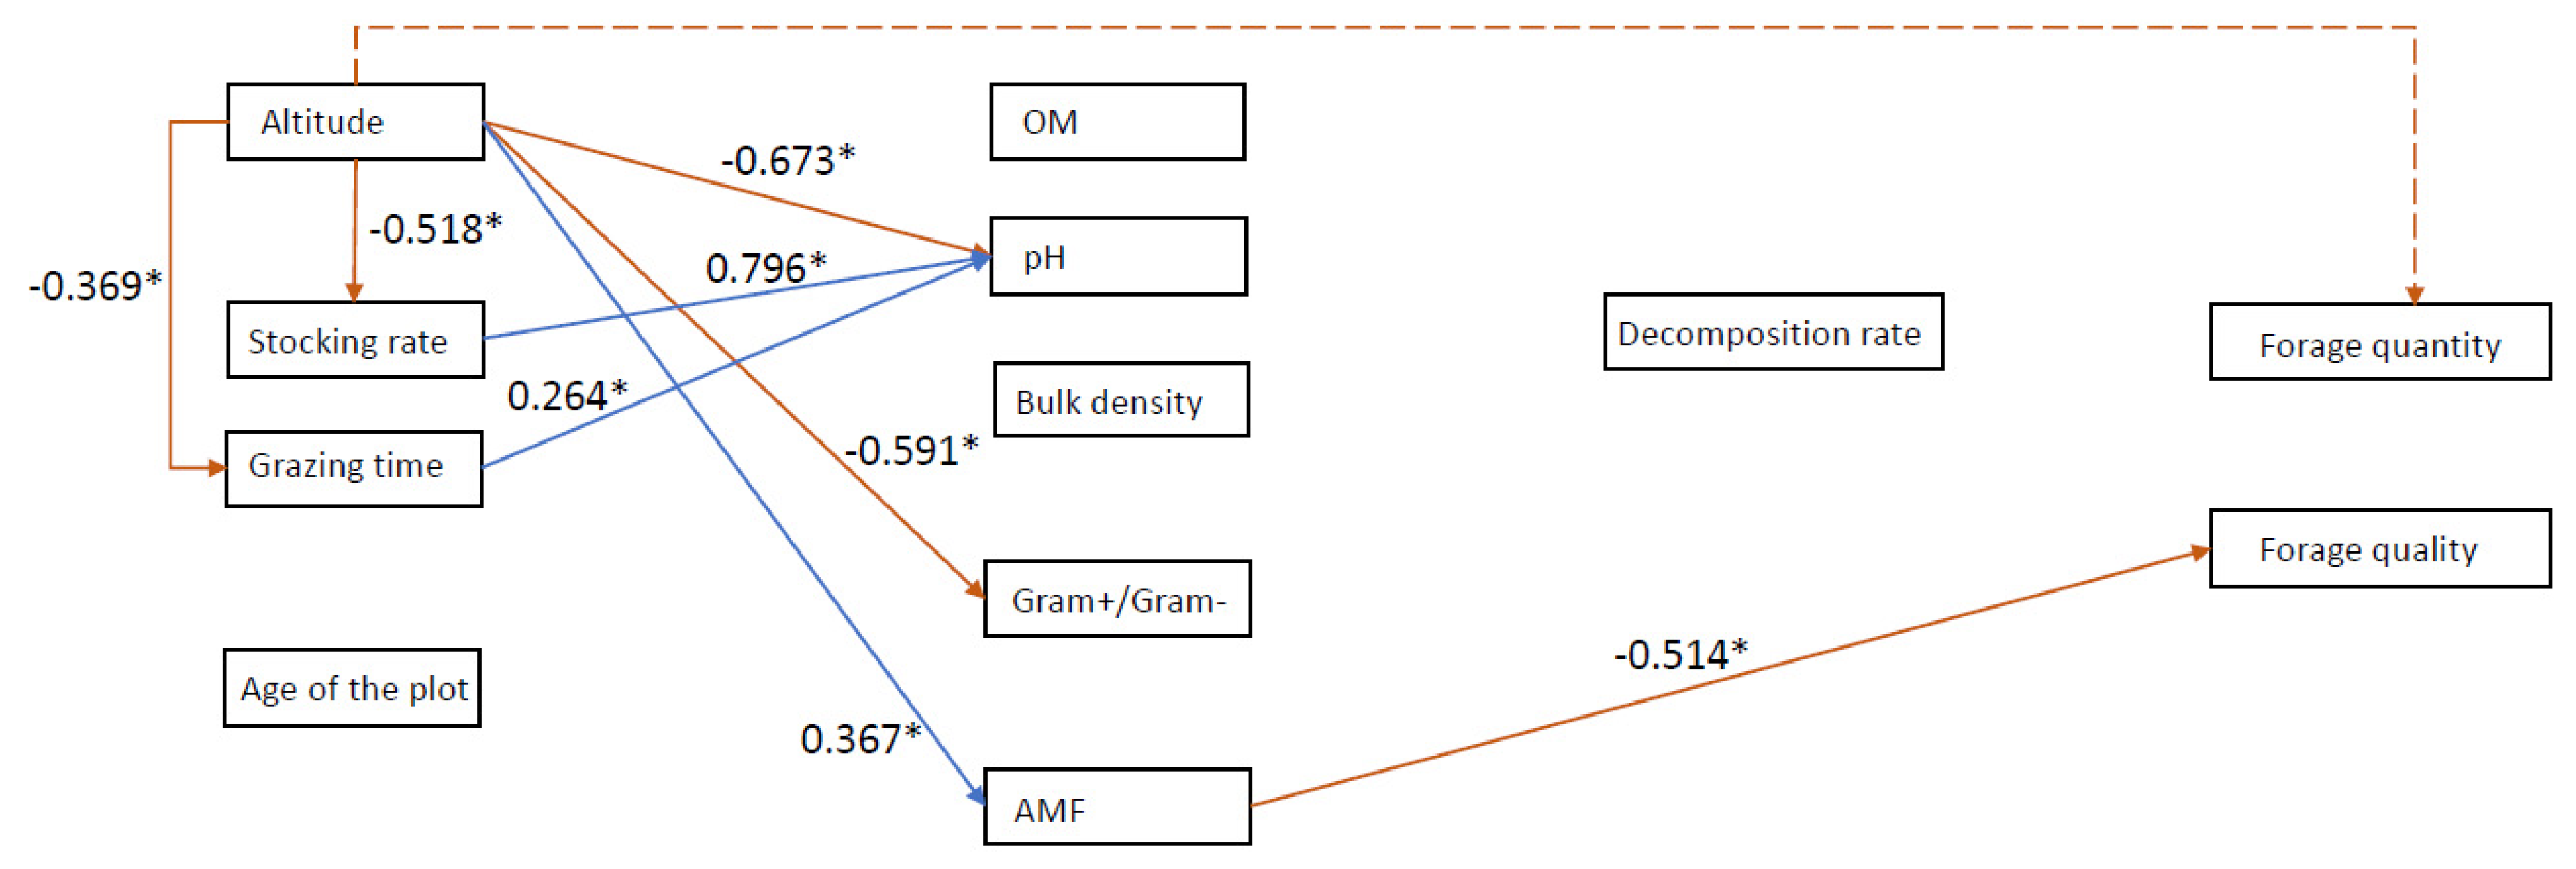
3.3. Effects of Management on Soil Quality and Ecosystem Services

The results of the path analysis are depicted as the simplified final model with standardized β coefficients (Figure 3; Table S2). There was a significant effect of altitude (a proxy for the landscape context in relation to the river) on pH, with rangeland plots in the alluvial soils having a higher soil pH than plots in the low hills (Figure S2a). Altitude was not significantly related with soil organic matter content. Altitude was related negatively with the ratio of Gram+: Gram–bacteria (Figure S2b) and positively with the relative abundance of AMF (Figure S2c). Pastures located at low altitude also had higher stocking rates (Figure S2d) and longer grazing times (Figure S2e) than pastures in the low hills. Stocking rate was directly and positively related with pH (Figure S2f) while the relationship between grazing time and pH was not significant. None of the soil biological, chemical, or physical factors were significantly correlated with decomposition rate. The abundance of AMF was negatively related with forage protein content. Altitude showed a tendency to be associated with higher productivity of palatable species, but the relation was not significant. No relation was detected between the age of the plot and management variables.
After applying linear regression models, our data did not show any significant relation between the composite index Ecological Disturbance Index (EDI) and forage productivity and forage quantity. Additionally, no relation was found between the scores of selected PCA axes for management and soil properties and forage productivity, forage quality, and organic material decomposition.

4. Discussion

4.1. Landscape Position Drives Farmers Management Practices, Soil Quality and Forage Quantity but Not Quality

We identified seven management practices that are common to all farmers. Nevertheless, the intensity and incidence differ among the study plots, showing that each farmer has a unique system of livestock management partly driven by the location of his/her land. As hypothesized, the position of rangeland plots in the landscape had a strong effect on several soil characteristics, forage quantity and quality, and thereby on management decisions, i.e., grazing intensity (Figure 3). Sites close to the Lacantún river had a higher pH and were more fertile, due to annual flooding, in terms of soil available P, OM and particle size distribution, than pastures on the low-hills as observed also by Suazo-Ortuño et al. (2015) and Navarrete (2018) [16,21]. As a consequence, farmers with pastures close to the river maintained higher stocking densities (number of cattle heads per ha) and longer grazing times than farmers on the low-hills because their plots tended to have a higher forage quantity (Figure 3). Nevertheless, the ANOVA showed no significant differences among landscape categories, probably due to the high variability between individual paddocks (F = 0.90, p = 0.767).
Although higher fertility in alluvial soils could theoretically provide better options for intensification of cattle ranching practices close to the river, we did not observe a significant relationship between landscape position and forage productivity (only a marginally significant trend). This weak relation is probably due to the fact that livestock ranching in Marqués de Comillas is low input and even the more fertile lands cannot sustain a high production in the absence of external inputs. It is also a very low-profit (or even non-profitable) activity, with a benefit: cost ratio of 0.24–0.99 for small farms with less than 60 hectares [7,47]. The alluvial soils cover 16% of the area but only 1% of the rangelands is found in the floodplains [22]. Instead, alluvial soils are preferred for agriculture (mainly maize, and beans) and, more recently in some ejidos, for oil palm plantations. Most agricultural activity in the floodplains is geared towards the production of subsistence and marketable food crops. Recently, African oil palm (Elaeis guineensis) is increasing in the floodplains to the extent that it might further reduce rangelands in this area. Since low-hills are perceived as poor soils, and farmers cannot afford fertilizers or chemicals for weed and pest control because of the low revenue, they rarely decide to use them for crop production. Instead, they use them for extensive cattle ranching requiring minimum investment and representing a low value but stable asset to be used when required. For example, El Pirú, located far away from the Lacantún river, only possesses land in the low-hills. The famers of this community rent land in Flor del Marqués, the neighbor community close to the river, to produce subsistence crops and their land is mainly dedicated to cattle production, ecotourism and, more recently, oil palm production.

4.2. Soil Properties Differed Widely with Landscape Position and among Plots

Altitude, a proxy for distance from the river and thus also for the influence of flooding and the groundwater table, affected mainly soil pH and microbial functional groups (Figure 3). Neutral to basic pH values in alluvial soils are likely explained by basic-cation accumulation in surface layers. We found a negative relation between altitude and the ratio Gram+: Gram- bacteria (Figure 3), with the highest values of that ratio observed in the floodplains. It has been proposed that Gram- bacteria, which are consider as copiotrophs, use more labile, plant-derived carbon sources such as exudates, while Gram+ bacteria, considered as more oligotrophs, use more recalcitrant carbon sources [48]. However, our data did not support this pattern. Ho et al. (2017) noted that the simple classification of Gram+ and Gram- bacteria may be too crude to capture changes along multiple environmental gradients [49]. Furthermore, Gram+ bacteria are less sensitive to stress conditions as many of them form resistant walls [50] which may help survival under conditions of flooding. Observations by Unger et al. (2009) that the Gram+: Gram- ratio increased under flooding would support this hypothesis [51] Altitude had a positive effect on the abundance of AMF (Figure 3) likely due to a higher P availability in alluvial pastures. Negative relationships between phosphate availability and AMF biomass and functioning have been commonly reported [52]. Furthermore, intermittent anaerobic conditions in alluvial areas could have negatively affected the obligate aerobic AMF [53]; consistent with that explanation we observed gley layers and water accumulation in plots closest to the river.
Stocking rate was the livestock management practice with the highest explanatory values for soil quality, followed by grazing time and the only soil variable affected was pH (Figure 3). These results were unexpected. Grazing intensity combines number of heads per hectare (stocking rate) and grazing time, and thus reflects cattle influence on biomass removal, biomass recovery, dung and urine deposition and trampling that in turn can have cascading effects on soil physical, chemical and biological properties beyond pH. However, grazing intensity did not have an effect on organic matter (Figure 3). Soil OM in these rangelands was low, with the highest soil OM values measured being approximately half the values measured in successional and old-growth forest sites of the same region [54]. These results suggest that this land use has led to soil impoverishment. Conversion of forest to pasture often results in large losses of soil organic matter and nitrogen [21,55]. However, there is less literature on how duration of land under pasture further impacts on soil organic matter levels. A meta-analysis by Zhou et al. (2017) showed a significantly negative correlation between pasture age and soil organic carbon and nitrogen [56]. These arguments may also partially explain why landscape position differences to some extent translated into differences in soil quality but ultimately had no impact on litter decomposition rates and on the productivity of palatable plants.

4.3. Land Use History Was Not Related to Actual Management Practices and Soil Quality Indicators

Surprisingly, age of the plots did not show a relationship with any management practices, and with ecosystem services, suggesting that the ecosystem services measured in our study have still not declined with time under pasture use. Our results contrast with a similar study conducted in plots with similar age range in the dry forest regions of Mexico where it was found that grazing time up to 40 years promoted forage production but decreased forage protein concentration [57]. The authors suggested that farmers apply regular burning to increase productivity in the short term (possibly because production is P- rather than N-limited) but that that practice reduces forage quality, because of N losses through volatilization in hot fires. In our study area, fire was only very infrequently used after the rangelands had been created. All plots showed low availability of essential macronutrients N and P, hence explaining the low forage productivity and low forage protein concentration. Nutrient availability thus limits forage and/or milk production despite adequate water availability in the region. Our results support previous observations that cattle raising is hardly productive in this study region.
In our study we were interested in the diversity of ways in which farmers managed their pastures and how landscape, and past and current management relate to soil quality and indicators of ecosystem services. This additional layer of farmer diversity may have obscured significant relations between grazing history, soil quality and ecosystem services that would have appeared with a plot selection that was exclusively focused on the temporal dimension. The lack of significant relationships with history fits, however, with farmer perceptions on the efficacy of their practices, as they have various ways to manage their rangelands over the long term, none of which are clearly superior over other sets of management practices.
Our data did not show any significant relation between EDI and productivity and forage quality. A major difference between our study and that by Zermeño et al. (2015) is that the latter authors focused on forest regeneration potential, whereas we focused on the ecosystem services delivery by the grasslands themselves [27]. A further reason why in our study EDI was not useful is that we focused on pastures only, whereas Zermeño et al. (2015, 2016) compared widely different land use types [27,58]. We, therefore, suggest that a separate analysis of the different components of management, rather than deriving a composite indicator as EDI, is a better approximation to understand the long-term delivery of provisioning services within these rangelands.

4.4. Implications and Recommendations for Sustainable Management

We hypothesized that time under rangeland management would have a negative effect on soil quality and provisioning ecosystem services. Nevertheless, the results did not support such relationship, suggesting that farmers are so far able to maintain the (marginal) value of their pastures. However, the decline in SOM is a warning sign as it may likely compromise ecosystem services in the future.
In our study, the quality of forage was low even in the youngest, more fertile, alluvial soils. Also, we found that the relative abundance of AMF had a negative effect on the protein concentration of the pasture. While AMF may be stimulated by low P availability, situations in the low-hills in which both P and N availability are very low may result in N immobilization in the AMF mycelium [52,53,59], thereby exacerbating N-limitation by plants and thereby reducing forage quality and protein content (Figure 3). Low forage quality does not allow productivity of cattle to be sustainable. Farmers do not apply fertilizers of any kind to these pastures so natural low fertility is expected to worsen with time. One adult cow needs 5 tons of forage per year so one hectare of these pastures could not maintain a single cow. The best plots in our study could sustain 0.3 and the worse 0.03 adult cows ha−1 with the forage biomass measured. This low forage productivity may explain why the region has focused on calf production, that requires less forage that maintaining adult cows. Current trends are to send calves to feedlots as soon as they reach the desired weight. According to Sagarpa (2014), Mexico produced an average of one head of cattle per 12.69 ha−1 of pasture per year, the state mean for Chiapas requires on average 1.80 ha head−1 year−1 (but with a wide interval of 0.80–18.90 ha head−1 year−1) [60]. Thus, the plots evaluated in this study have a productivity, both in forage and cattle, within the range reported for this region.
The majority of farmers have limited economic resources and keep the activity mostly as a self-subsistence strategy (savings) and, as stated in the interviews, a way of expressing their identity. Given the low rewards of extensive cattle ranching, oil palm plantations promoted and subsidized by state governmental programs are growing in these low-fertility soils. In oil palm plantations farmers compensate for the low soil fertility by heavily using fertilizers. The use of fertilizers, herbicides and pesticides is widespread due mainly to the credits and subsidies that currently exist for this profitable crop in contrast to subsistence crops. From this point of view, extensive cattle farming would require sustainable intensification practices to increase productivity [61,62,63] and supporting farmers with governmental training programs to increase profitability and farmers resilience.

5. Conclusions

Our results showed that management practices related to cattle ranching in Marqués de Comillas have so far not strongly degraded soil-related supporting and regulating services. Nevertheless, the delivery of provisioning services has been very poor. In human-modified landscapes, engaging local actors and sustainable practices could prevent further poverty, environmental degradation, and deforestation, and allow the transition towards more sustainable cattle production.

Supplementary Materials

The following are available online at https://www.mdpi.com/2073-445X/9/12/511/s1, Figure S1: Principal Component Analyses and position of variables for (a) management, and (b) soil chemical and physical properties. Figure S2: Biplots showing the relations between variables that were significant in the path analyses: (a) grazing time vs. altitude (masl); (b) pH vs. altitude (masl); (c) stocking rate (heads/ha) vs. altitude (masl); (d) pH vs grazing time; (e) Arbuscular Mycorrhizal Fungi (nmol g−1 soil) vs altitude (masl); (f) pH vs. grazing time. Table S1: Results of Principal Component Analyses to select variables from the Conceptual Model. Table S2. Beta standardized coefficients for selected variables after multivariate regression analyses (Enter Method). * p < 0.05, ** p < 0.01. Relations among selected variables are shown in Figure 3. OM: organic matter, BD: bulk density, AMF: arbuscular mycorrhiza fungi.

Author Contributions

Conceptualization, R.A.-F., M.E.G., M.P.-C., M.P., and T.W.K.; data curation, R.A.-F.; formal analysis, R.A.-F., and M.P.-C.; funding acquisition, T.W.K.; investigation, R.A.-F.; methodology, R.A.-F., M.E.G., M.P.-C., M.P., and T.W.K.; project administration, T.W.K.; Resources, R.A.-F., M.E.G., M.P.-C., and T.W.K.; software, R.A.-F. and M.P.-C.; supervision, M.E.G., M.P.-C., M.P., and T.W.K.; validation, R.A.-F., M.E.G., M.P.-C., and T.W.K.; visualization, R.A.-F.; writing—original draft, R.A.-F. and T.W.K.; writing—review and editing, R.A.-F., M.E.G., M.P.-C., M.P., and T.W.K. All authors have read and agreed to the published version of the manuscript.

Funding

This research was funded by the Interdisciplinary Research and Education Fund (INREF) of Wageningen University through its program FOREFRONT—Nature’s benefits in agroforest frontiers: linking actor strategies, functional biodiversity and ecosystem services, lab analyses were partially funded by Consejo Nacional de Ciencia y Tecnología, project SEP-CONACyT 2015-255544.

Acknowledgments

We acknowledge Madelon Lohbeck and Mathew Decuyper for providing Landsat modelling data that made possible to cross-check the age of the plots. We thank Natura y Ecosistemas Mexicanos, A.C and the staff of Chajul Station for their support and hospitality, and for providing essential resources to make fieldwork possible. We acknowledge support by field assistant Carlos Méndez, Ing. Carlos Alejandro Velázquez and MSc Dana van Bentum. We thank Ana Lidia Sandoval Pérez, Maribel Nava Mendoza, Yolanda García, Cesar Maldonado, and Juan Ramon Barrios Martinez for support during laboratory analysis of soil and plant samples in LANIES lab at IIES-UNAM. We thank Paola Angelica Vazquez Cisneros and Carlos Arbey Sanchez Albores for edition of the map to locate the study plots, and Francisco Mora Ardila for guidance in data analyses. Constructive comments by two reviewers are also gratefully acknowledged. We are grateful to the farmers in the ejidos for allowing us to establish exclosures on their land and to harvest biomass that would otherwise have been available for their cattle.

Conflicts of Interest

The authors declare no conflict of interest. The funders had no role in the design of the study; in the collection, analyses, or interpretation of data; in the writing of the manuscript, or in the decision to publish the results.

Appendix A

Questions to Guide Semi-Structure Interviews

  • Interviewee general data
    1.1.
    Name
    1.2.
    Age
    1.3.
    Town of origin
    1.4.
    Principal productive activities
  • Sketch of farm (rangeland). Indicate: (a) dimensions, (b) fences, (c) rotational system, (d) rivers, streams and other sources of water, (e) exclusion experiment, (f) outstanding trees, (g) average head of cattle present in each section of the farm, (h) years of establishment of the grassland.
  • History of the farm (reconstruct land-use history)
    3.1.
    Are you the first owner of the farm? When you became the owner, what was the existing land-use?
    3.2.
    When was the rainforest transformed for the first time? How did you induce the grassland establishment? (Record land-use trajectory. For example: rainforest-> cropland-> grassland)
    3.3.
    After slash-burn process, did you induce the establishment of native or commercial grasses? How? (For example, sowing, transplant of seedlings, wait for natural colonization)
    3.4.
    When did you introduced cattle for the first time?
    3.5.
    Does the rangeland has had resting periods? (time without cattle) Why? How many? How long?
    3.6.
    Do you use fire? How many times have you burned the field? Why?
    3.7.
    Do you apply agrochemicals? Which ones? When did you start using them? (Inquire about frequency and doses).
    3.8.
    What type of cattle production do you carry out? (meat production, calf production, mixed). Why?
    3.9.
    How many heads of cattle do you have in the rangeland we are talking about? (Inquire about the current and the last production cycle. Specify number of: cows, bulls, calves and steers).
    3.10.
    What is the maximum/minimum number of heads of cattle you have had in this rangeland? When was that?
    3.11.
    Calves production: In average, how many calves do you sell per productive cycle? (Specify average weigh).
    Meat production: How many calves do you fatten per year? What are the average initial and final weigh?
    3.12.
    Do you sell “old cows”? How many per productive cycle? (Specify average weigh). Do you replace them?
    3.13.
    Rotational system: Inquire how many sections exist in the rangeland and how many days the cows graze in each section. Be emphatic about the section where the exclosure was set up.
    3.14.
    What type of grasses (species) are present in the rangeland? Describe the succession of grasses in the history of the grassland.
    3.15.
    Do you feed the cattle with complementary food? (pollinasa, maize, salt). Specify quantities.
    3.16.
    Have you experience any trouble related with the productivity of the grassland? (Inquire about non-palatable species or perceptions related with soil characteristics)

References

  1. Arroyo-Rodríguez, V.; Melo, F.P.L.; Martínez-Ramos, M.; Bongers, F.; Chazdon, R.L.; Meave, J.A.; Norden, N.; Santos, B.A.; Leal, I.R.; Tabarelli, M. Multiple successional pathways in human-modified tropical landscapes: New insights from forest succession, forest fragmentation and landscape ecology research. Biol. Rev. 2017, 92, 326–340. [Google Scholar] [CrossRef] [PubMed]
  2. Quezada, M.L.; Arroyo-Rodríguez, V.; Pérez-Silva, E.; Aide, T.M. Land cover changes in the Lachuá region, Guatemala: Patterns, proximate causes, and underlying driving forces over the last 50 years. Reg. Environ. Chang. 2014, 14, 1139–1149. [Google Scholar] [CrossRef]
  3. Murgueitio, E.; Calle, Z.; Uribe, F.; Calle, A.; Solorio, B. Native trees and shrubs for the productive rehabilitation of tropical cattle ranching lands. For. Ecol. Manag. 2011, 261, 1654–1663. [Google Scholar] [CrossRef]
  4. Díaz, S.; Pascual, U.; Stenseke, M.; Martín-López, B.; Watson, R.T.; Molnár, Z.; Hill, R.; Chan, K.M.A.; Baste, I.A.; Brauman, K.A.; et al. Assessing nature’s contributions to people. Science 2018, 359, 270–272. [Google Scholar] [CrossRef] [PubMed] [Green Version]
  5. Millennium Ecosystem Assessment (MEA). Ecosystems and Human Well-Being: Synthesis; Island Press: Washington, DC, USA, 2005. [Google Scholar]
  6. Pascual, U.; Balvanera, P.; Díaz, S.; Pataki, G.; Roth, E.; Stenseke, M.; Watson, R.T.; Başak Dessane, E.; Islar, M.; Kelemen, E.; et al. Valuing nature’s contributions to people: The IPBES approach. Curr. Opin. Environ. Sustain. 2017, 26, 7–16. [Google Scholar] [CrossRef] [Green Version]
  7. Carabias, J.; Gonzalez-Ortiz, M.A.; Auzias, C.; Castro-Tovar, E.; Acevedo, M.A. Ordenamiento Comunitario del Territorio de la Microregion Marqués de Comillas: Una Iniciativa Interejidal para el Mejoramiento de los Medios de Vida Rurales en la Selva Lacandona; Grupo Autónomo para la Investigación Ambiental, A.C., Natura y Ecosistemas Mexicanos, A.C.: Mexico City, México, 2012. [Google Scholar]
  8. Heinze, A.; Bongers, F.; Ramírez Marcial, N.; García Barrios, L.; Kuyper, T.W. The montane multifunctional landscape: How stakeholders in a biosphere reserve derive benefits and address trade-offs in ecosystem service supply. Ecosyst. Serv. 2020, 44. [Google Scholar] [CrossRef]
  9. Aguilar-Fernández, R. Characterizing land use management and promoting recovery of ecosystem services in agro-forested landscapes. Unpublished, manuscript in preparation.
  10. Mora, C.A.; Pérez, J.; Rodríguez, E.; Alonso, E.; Camacho, R.; Israel, J.; Aurelio, M.; Tagle, G. Effect of Livestock in the Composition and Diversity of Trees and Shrubs in the Tamaulipan Thornscrub. Rev. Mex. Cienc. For. 2013, 4, 124–137. [Google Scholar]
  11. Fernandez, A.; Torres, A.; Nava, A.D.; Rosas, A.; Muñoz, C.; Rodríguez, C.; Cortinas, C.; Rothman, D.; Quadri, G.; Bocco, G.; et al. Perspectivas del Medio Ambiente en México; Semarnat: Mexico City, México, 2004; ISBN 968-817-683-4.
  12. Castillo Santiago, M.A. Análisis con Imágenes Satelitales de los Recursos Forestales en el Trópico Húmedo de Chiapas: Un Estudio de Caso en Marqués de Comillas. Ph.D. Thesis, Universidad Nacional Autónoma de México, Mexico City, México, June 2009. [Google Scholar]
  13. Swanepoel, F.; Stroebel, A.; Moyo, S. The Role of Livestock in Developing Communities: Enhancing Multifunctionality; The Technical Centre for Agricultural and Rural Cooperation (CTA): Bloemfontein, South Africa, 2010; ISBN 978-0-86886-798-4. [Google Scholar]
  14. Cano-Castellanos, J.I. De Montana a ‘Reserva Forestal’: Colonización, Sentido de Comunidad, y Producción de la Conservación Ecológica en el Sureste de la Selva Lacandona, México. Ph.D. Thesis, Centro de Investigaciones y Estudios Superiores en Antropología Social, Guadalajara, Jalisco, México, September 2013. [Google Scholar]
  15. Báez Montoya, J.R.; Gutiérrez Perez, I.G. Descripción y costos de la ganadería para engorda a media ceba en esquemas convencionales y silvopastoril en Marqués de Comillas. Unpublished work, manuscript in preparation.
  16. Suazo-Ortuño, I.; Lopez-Toledo, L.; Alvarado-Díaz, J.; Martínez-Ramos, M. Land-use Change Dynamics, Soil Type and Species Forming Mono-dominant Patches: The Case of Pteridium aquilinum in a Neotropical Rain Forest Region. Biotropica 2015, 47, 18–26. [Google Scholar] [CrossRef]
  17. Reiners, W.A.; Bouwman, A.F.; Parsons, W.F.J.; Keller, M. Tropical rain forest conversion to pasture: Changes in vegetation and soil properties. Ecol. Appl. 1994, 4, 363–377. [Google Scholar] [CrossRef]
  18. Mueller, R.C.; Rodrigues, J.L.M.; Nüsslein, K.; Bohannan, B.J.M. Land use change in the Amazon rain forest favours generalist fungi. Funct. Ecol. 2016, 30, 1845–1853. [Google Scholar] [CrossRef] [Green Version]
  19. Flores-Rentería, D.; Sánchez-Gallén, I.; Morales-Rojas, D.; Larsen, J.; Álvarez-Sánchez, J. Changes in the Abundance and Composition of a Microbial Community Associated with Land Use Change in a Mexican Tropical Rain Forest. J. Soil Sci. Plant Nutr. 2020, 20, 1144–1155. [Google Scholar] [CrossRef]
  20. Martínez-Ramos, M.; Anten, N.P.R.; Ackerly, D.D. Defoliation and ENSO effects on vital rates of an understory tropical rain forest palm. J. Ecol. 2009, 97, 1050–1061. [Google Scholar] [CrossRef]
  21. Navarrete-Segueda, A.; Martínez-Ramos, M.; Ibarra-Manríquez, G.; Vázquez-Selem, L.; Siebe, C. Variation of main terrestrial carbon stocks at the landscape-scale are shaped by soil in a tropical rainforest. Geoderma 2018, 313, 57–68. [Google Scholar] [CrossRef]
  22. Navarrete-Segueda, A.; Vázquez-Selem, L.; Siebe-Grabach, C.D. Caracterización geopedológica y calidad de sitio de una selva tropical. In Conservación y Desarrollo Sustentable en la Selva Lacandona: 25 años de Actividades y Experiencias; Carabias, J., de la Maza, J., Cadena, R., Eds.; Natura y Ecosistemas Mexicanos, A.C.: Mexico City, México, 2015; pp. 87–96. [Google Scholar]
  23. Méndez, M. El Ejido y la Comunidad en el México del Siglo XXI: La Transición Agraria (1992–2015), 1st ed.; Porrúa: Mexico City, México, 2016; ISBN 6070922352. [Google Scholar]
  24. Izquierdo-Tort, S.; Ortiz-Rosas, F.; Vázquez-Cisneros, P.A. ‘Partial’ participation in Payments for Environmental Services (PES): Land enrolment and forest loss in the Mexican Lacandona Rainforest. Land Use Policy 2019, 87, 103950. [Google Scholar] [CrossRef]
  25. Obregón, R. Elaboración de Proyectos Para el Fortalecimiento de la Agricultura Sustentable en los Corredores de Chiapas; Conabio: Mexico City, México, 2007.
  26. Briske, D.D.; Derner, J.D.; Brown, J.R.; Fuhlendorf, S.D.; Teague, W.R.; Havstad, K.M.; Gillen, R.L.; Ash, A.J.; Willms, W.D. Rotational grazing on rangelands: Reconciliation of perception and experimental evidence. Rangel. Ecol. Manag. 2008, 61, 3–17. [Google Scholar] [CrossRef] [Green Version]
  27. Zermeño-Hernández, I.; Méndez-Toribio, M.; Siebe, C.; Benítez-Malvido, J.; Martínez-Ramos, M. Ecological disturbance regimes caused by agricultural land uses and their effects on tropical forest regeneration. Appl. Veg. Sci. 2015, 18, 443–455. [Google Scholar] [CrossRef]
  28. Walkley, A.; Black, I.A. An Examination of Degtjareff Method for Determining Soil Organic Matter and a Proposed Modification of the Chromic Acid Titration Method. Soil Sci. 1934, 37, 29–37. [Google Scholar] [CrossRef]
  29. Bremner, J. Nitrogen. In Methods of Soil Analysis, Part 3-Chemical Methods; Sparks, D., Page, A., Helmke, P., Loeppert, R., Soltanpour, P., Tabatabai, M., Johnston, C., Sumner, M., Eds.; Soil Science Society of America: Madison, WI, USA, 1996; pp. 1085–1121. [Google Scholar]
  30. Murphy, J.; Riley, J. A modified single solution method for the determination of phosphate in natural waters. Anal. Chim. Acta 1962, 27, 31–36. [Google Scholar] [CrossRef]
  31. Harwood, J.E.; Huyser, D.J. Some aspects of the phenol-hypoclorite reaction as applied to ammonia analysis. Water Res. 1970, 4, 501–515. [Google Scholar] [CrossRef]
  32. Robertson, G.; Coleman, D.; Bledsoe, C.; Sollins, P. Standard Soil Methods for Long-Term Ecological Research; Oxford University Press: Oxford, UK, 1999. [Google Scholar]
  33. Mehlich, A. Mehlich 3 soil test extractant: A modification of Mehlich 2 extractant. Commun. Soil Sci. Plant Anal. 1984, 15, 1409–1416. [Google Scholar] [CrossRef]
  34. Kroetsch, D.; Wang, C. Particle Size Distribution, 2nd ed.; Taylor and Francis Group, LLC: Oxfordshire, UK, 2006. [Google Scholar]
  35. Hallett, P.D.; Feeney, D.S.; Bengough, A.G.; Rillig, M.C.; Scrimgeour, C.M.; Young, I.M. Disentangling the impact of AM fungi versus roots on soil structure and water transport. Plant Soil 2009, 314, 183–196. [Google Scholar] [CrossRef]
  36. Verbist, K.; Torfs, S.; Cornelis, W.M.; Oyarzún, R.; Soto, G.; Gabriels, D. Comparison of single- and double-ring infiltrometer methods on stony soils. Vadose Zone J. 2010, 9, 462–475. [Google Scholar] [CrossRef]
  37. Frostegård, Å.; Tunlid, A.; Bååth, E. Use and misuse of PLFA measurements in soils. Soil Biol. Biochem. 2011, 43, 1621–1625. [Google Scholar] [CrossRef]
  38. Zhang, H.; Zhang, X.; Zhao, J.; Du, X.; Ma, B. Analysis of the microbial communities of three kinds of Fen-Daqu by PLFAs. J. Inst. Brew. 2016, 122, 34–41. [Google Scholar] [CrossRef]
  39. Ruess, L.; Chamberlain, P.M. The fat that matters: Soil food web analysis using fatty acids and their carbon stable isotope signature. Soil Biol. Biochem. 2010, 42, 1898–1910. [Google Scholar] [CrossRef]
  40. Willers, C.; Van Rensburg, P.J.J.; Claassens, S. Phospholipid fatty acid profiling of microbial communities—A review of interpretations and recent applications. J. Appl. Microbiol. 2015, 119, 1207–1218. [Google Scholar] [CrossRef] [PubMed]
  41. Dungait, J.A.J.; Kemmitt, S.J.; Michallon, L.; Guo, S.; Wen, Q.; Brookes, P.C.; Evershed, R.P. Variable responses of the soil microbial biomass to trace concentrations of 13C-labelled glucose, using 13C-PLFA analysis. Eur. J. Soil Sci. 2011, 62, 117–126. [Google Scholar] [CrossRef]
  42. Liu, G.; Jin, M.; Cai, C.; Ma, C.; Chen, Z.; Gao, L. Soil microbial community structure and physicochemical properties in Amomum tsaoko-based agroforestry systems in the Gaoligong Mountains, Southwest China. Sustainability 2019, 11, 546. [Google Scholar] [CrossRef] [Green Version]
  43. Karberg, N.J.; Scott, N.A.; Giardina, C.P. Methods for Estimating Litter Decomposition. In Field Measurements for Forest Carbon Monitoring; Hoover, C.M.., Ed.; Springer US: New York, NY, USA, 2008; ISBN 9781402085062. [Google Scholar]
  44. Olson, J. Energy storage and the balance of producers and decomposers in ecological system. Ecology 1963, 44, 322–331. [Google Scholar] [CrossRef] [Green Version]
  45. Vibrans, H. Malezas de Mexico. Available online: http://www.conabio.gob.mx/malezasdemexico/2inicio/home-malezas-mexico.htm (accessed on 15 November 2020).
  46. Pearson, C.J.; Ison, R.L. Agronomy of Grassland Systems, 2nd ed.; Cambridge University Press: Cambridge, UK, 1997; ISBN 0521310091. [Google Scholar]
  47. Aguilar-Fernández, R. Análisis de los Componentes Socioambientales Para la Restauración de Claros Antropogénicos en la Selva Tropical Húmeda, Marqués de Comillas, Chiapas, México. Master’s Thesis, Universidad Nacional Autónoma de México, Mexico City, México, November 2013. [Google Scholar]
  48. Fanin, N.; Kardol, P.; Farrell, M.; Nilsson, M.C.; Gundale, M.J.; Wardle, D.A. The ratio of Gram-positive to Gram-negative bacterial PLFA markers as an indicator of carbon availability in organic soils. Soil Biol. Biochem. 2019, 128, 111–114. [Google Scholar] [CrossRef]
  49. Ho, A.; Di Lonardo, D.P.; Bodelier, P.L.E. Revisiting life strategy concepts in environmental microbial ecology. FEMS Microbiol. Ecol. 2017, 93, 1–14. [Google Scholar] [CrossRef] [PubMed] [Green Version]
  50. Jordan, S.; Hutchings, M.I.; Mascher, T. Cell envelope stress response in Gram-positive bacteria. FEMS Microbiol. Rev. 2007, 32, 107–146. [Google Scholar] [CrossRef] [PubMed] [Green Version]
  51. Unger, I.M.; Kennedy, A.C.; Muzika, R.-M. Flooding effects on soil microbial communities. Appl. Soil Ecol. 2009, 42, 1–8. [Google Scholar] [CrossRef]
  52. Johnson, N.C.; Wilson, G.W.T.; Bowker, M.A.; Wilson, J.A.; Miller, R.M. Resource limitation is a driver of local adaptation in mycorrhizal symbioses. Proc. Natl. Acad. Sci. USA 2010, 107, 2093–2098. [Google Scholar] [CrossRef] [Green Version]
  53. Smith, S.; Read, D. Mycorrhizal Symbiosis, 3rd ed.; Academic Press: Cambridge, MA, USA, 2008; ISBN 9780080559346. [Google Scholar]
  54. Gavito, M.E.; Unam, Morelia, Michoacán, México. Personal Communication, 2020.
  55. Aryal, D.R.; Gómez-González, R.R.; Hernández-Nuriasmú, R.; Morales-Ruiz, D.E. Carbon stocks and tree diversity in scattered tree silvopastoral systems in Chiapas, Mexico. Agrofor. Syst. 2019, 93, 213–227. [Google Scholar] [CrossRef]
  56. Zhou, G.; Zhou, X.; He, Y.; Shao, J.; Hu, Z.; Liu, R.; Zhou, H.; Hosseinibai, S. Grazing intensity significantly affects belowground carbon and nitrogen cycling in grassland ecosystems: A meta-analysis. Glob. Chang. Biol. 2017, 23, 1167–1179. [Google Scholar] [CrossRef]
  57. Trilleras, J.M.; Jaramillo, V.J.; Vega, E.V.; Balvanera, P. Effects of livestock management on the supply of ecosystem services in pastures in a tropical dry region of western Mexico. Agric. Ecosyst. Environ. 2015, 211, 133–144. [Google Scholar] [CrossRef]
  58. Zermeño-Hernández, I.; Pingarroni, A.; Martínez-Ramos, M. Agricultural land-use diversity and forest regeneration potential in human- modified tropical landscapes. Agric. Ecosyst. Environ. 2016, 230, 210–220. [Google Scholar] [CrossRef]
  59. Puschel, D.; Janouskova, M.; Hujslova, M.; Slavikova, R.; Gryndlerova, H.; Jansa, J. Plant–fungus competition for nitrogen erases mycorrhizal growth benefits of Andropogon gerardii under limited nitrogen supply. Ecol. Evol. 2016, 6, 4332–4346. [Google Scholar] [CrossRef] [Green Version]
  60. Secretaria de Agricultura y Desarrollo Rural (Sagarpa). Comisión Técnico Consultiva de Coeficientes de Agostadero (COTECOCA); Sagarpa: Mexico City, México, 2014.
  61. Vázquez, E.; Teutscherová, N.; Sotelo, M.; Villegas, D.; Velasquez, N.; Baquero, D.; Pulleman, M.; Arango, J. Intensive short-duration rotational grazing is associated with improved soil quality within one year after establishment in Colombia. Appl. Soil Ecol. 2020, 159, 103835. [Google Scholar] [CrossRef]
  62. Vázquez, E.; Teutscherova, N.; Lojka, B.; Arango, J.; Pulleman, M. Pasture diversification affects soil macrofauna and soil biophysical properties in tropical (silvo)pastoral systems. Agric. Ecosyst. Environ. 2020, 302, 107083. [Google Scholar] [CrossRef]
  63. Webster, E.; Gaudin, A.C.M.; Pulleman, M.; Siles, P.; Fonte, S.J. Improved Pastures Support Early Indicators of Soil Restoration in Low-input Agroecosystems of Nicaragua. Environ. Manag. 2019, 64, 201–212. [Google Scholar] [CrossRef] [PubMed]
Figure 1. Conceptual model showing possible causal relations among variables considered in this study. Livestock management practices may have an effect on ecosystem services either in a direct or an indirect way. Inside boxes all measured variables are listed. Arrows represent either positive or negative hypothesized relations between boxes.
Land 09 00511 g001
Figure 2. Location of the study plots. Montes Azules Biosphere Reserve on the left side of the Lacantún river and study plots located in the ejidos on the right side. The study was carried out in four ejidos (Boca de Chajul, Playón de la Gloria, Galacia and El Pirú) in Marqués de Comillas, Chiapas, México.
Land 09 00511 g002
Figure 3. Conceptual model showing significant relations among variables after multivariate analysis, suggesting that livestock management practices may have an effect on ecosystem services either in a direct or in an indirect way. Significant standardized β coefficients from multiple regressions are shown next to each path (*). Blue arrows indicate positive relations, red arrows negative relations (p ≤ 0.05). The dotted line indicates a marginally significant relation (0.05 ≤ p ≤ 0.10). OM: soil organic matter; AMF: arbuscular mycorrhizal fungi.
Land 09 00511 g003
Table 1. Landscape, history of use, and management variables tested in the model, their average, and maximum and minimum values for 31 study plots.
VariableAverageMinMaxUnits
Landscape position
distance from the river3.040.1713.00km
altitude166143186masl
History
age of the plot (Y)25440years
Management
size of the plot (SZ)20550ha
livestock heads (LH)32367head
stocking density (SD)2.160.109.00head ha−1
grazing time (GT)0.480.111.00-
grazing severity (GS)1.010.054.05-
fire incidence (FI)3.42111burns
fire frequency (FF)0.160.030.60burns/year
herbicide incidence (HI)5.94033applications
herbicide frequency (HF)0.2801-
tractor use (TI)0.1301times
Ecological Disturbance Index (EDI)1.120.542.13
Table 2. Soil chemical and physical properties, decomposition rate, and provisioning ecosystem services variables tested in the model, their average, maximum and minimum values for 31 study plots.
VariableAverageMinMaxUnits
Soil properties
available P2.470.738.88μg g−1
ammonium25.290.1172.90mg g−1
nitrate3.8109.79mg g−1
soil organic matter2.311.193.79%
total P0.220.070.72mg g−1
total N0.160.060.34%
pH6.355.308.76-
bulk density1.080.771.43g cm−3
sand content39.7011.9580.02%
clay content19.591.2555.80%
silt content40.7116.2472.22%
infiltration19620480mm hr−1
micro- and macro-aggregates67.9736.5384.84%
Soil biological composition
total AMF8.211.5617.68nmol g−1 soil
total fungi3.110.288.25nmol g−1 soil
total bacteria23.299.3245.19nmol g−1 soil
Gram+/Gram-1.961.423.45-
bacteria/fungi0.150.020.80-
Ecosystem Processes
Decomposition rate0.0040.0030.016day−1
Ecosystem Services
protein content7.34.4615.37%
forage productivity (T1)31718852kg ha−1
forage productivity (T2)6011141418kg ha−1
Publisher’s Note: MDPI stays neutral with regard to jurisdictional claims in published maps and institutional affiliations.

