A New Hypothesis on Informal Land Supply, Livelihood, and Urban Form in Sub-Saharan African Cities


Institute of Architecture, Urbanism and Landscape, Royal Danish Academy, 1435 Copenhagen, Denmark
Land 2020, 9(11), 435; https://doi.org/10.3390/land9110435
Submission received: 23 October 2020
/
Revised: 3 November 2020
/
Accepted: 5 November 2020
/
Published: 7 November 2020
(This article belongs to the Section Land Socio-Economic and Political Issues)
Abstract
:In sub-Saharan Africa, the urban majorities are financially excluded from the formal housing markets and reside in informal settlements. Limited knowledge on the development of informal settlements compromises the efficacy of urban planning and policies targeting such areas. This study presents an analysis of informal urban land use in four major cities in East Africa, as well as an analysis of urban form and household conditions in a case study area in each city. The study found more compact urban form, higher levels of tenants and overcrowding, and lower levels of access to water and sanitation in the examined cities with limited informal urban land use. The study argues that government repression of informal urban development decreases informal land supply and leads to increased competition in the informal land market, causing higher costs of accommodation and consequent fewer household resources for investments in infrastructure and thereby more compromised livelihood. The study argues that governments should accept some modes of informal development, simplify the urban development administration processes, and use technological innovation in land surveys and management, in order to lower costs of accommodation and improve livelihoods for the urban majority financially excluded from the formal housing market in East Africa.
1. Introduction
Informal settlements are urban areas typified by a lack of state control [1]. This typically encompasses lack of urban planning, construction without formal permits, and lack of formal land titles [2]. In sub-Saharan Africa, the urban majority resides in informal settlements, due to high population growth rates, high rural to urban migration, poor urban majorities, and limited state capacity to administer the urban growth since independence [3]. The proliferation of informal urban development will likely continue in the coming decades due to a continuation of these conditions. Knowledge about the size and spatial distribution of a human population in relation to the built environment is essential for understanding social, economic, and environmental issues and is thus important for developing efficient urban planning and policy [4]. Limited knowledge of the formation and development of informal settlements limits the capacity to develop effective policy and urban planning in sub-Saharan Africa [5]. This paper argues that supply of informal land is essential for the development of livelihood and urban form in informal settlements in sub-Saharan Africa. The paper proposes a provisional hypothesis describing how decreased supply of informal land leads to higher prices in the informal land market due to increased competition. This results in increased costs of accommodation in the informal housing sector and a higher share of income allocated for housing for low-income groups resulting in compromised livelihoods. In parallel, the increased competition incentivizes increasing the density of the built environment within the informal settlements, resulting in a more compact urban form. The hypothesis is supported by data from various sources showing consistency between the hypothesis and observations. The proposed hypothesis may have significant policy implications, as enforcement of the law in regard to restricting informal urban development leads to compromised livelihoods for the urban poor. Consequently, the standards for what constitutes formal urban development in large parts of sub-Saharan Africa should arguably be subject to revision.
2. Location, Urban Density, and Property Prices
Urban density has numerous definitions and methods of measurements, quantifying urban characteristics and describing the relationship between a given area and certain quantifiable entities in that area, e.g., people, dwellings, services, and floor space. High urban densities are advocated as benefitting sustainability, resilience, and economic growth, as well as cutting the costs of service delivery and infrastructure [6,7]. Recent studies suggest that cities in Africa are undergoing rapid urban expansion with low-density developments [8,9]. Urban expansion is not unique to sub-Saharan Africa, but seen in many parts of the world and is likely linked to economic development [10]. Nevertheless, inadequate investments in infrastructure and inadequate urban planning in sub-Saharan Africa compromise the sustainability of both urban expansion and urban densification, as peripheral urban expansion decreases mobility due to inadequate roads and public transport, while central urban densification compromises public health due to inadequate stormwater infrastructure and inadequate access to water and sanitation [11,12].
Different urban models have been developed in order to describe the relationship between location, land value, land use, and urban densities. Von Thünen [13] developed one of the first models with a simple representation of a monocentric city explaining the distribution of different land use around a city. The concentric zone model further elaborated the concept of concentric land use rings, highlighting the relation between land use, land values, built densities, and distance to a city center [14]. Haig [15] proposed the costs of friction hypothesis, arguing that land values are determined by transport costs to the city center and that these determine the land use and densities. Hoyt [16] proposed the sector model, arguing that cities do not develop in concentric circles but rather in different sectors surrounding the central business district (CBD). These sectors radiate outward along axes and are driven by transportation routes from the city center. Harris and Ullman [17] proposed the multi-nuclei model, arguing that sub-centers are growth points within the city, due to profit maximization through combination of costs of rent, transportation, and labor. Alonso [18] argues that households, commercial establishments, and industries compete for locations, creating segregated land use, as households will not pay commercial and industrial land prices for central locations. Smith [19] argues that urban amenities such as low crime, clean air, accessibility to work, the local quality of education, and local taxes influence land prices. Many of these concepts were combined in the spatial equilibrium model, first proposed by Samuelson [20] and later advanced through a multitude of contributions, notably by Alonso [18], Mills [21], and Muth [22]. The spatial equilibrium model assumes that welfare is equalized across space. Exogenous differences across space in productivity, amenities, and the construction sector drive differences in density, income levels, and home prices. Glaeser and Gottlieb [23] argue that increasing house prices do not naturally represent an increase in national wealth since the increase in asset values has been offset by an increase in the price of securing a basic necessity. Bertaud [24] argues that density is an indicator of land consumption, reflecting the equilibrium between supply and demand for land in a specific location. Population density is thus an indicator dependent on market parameters, mainly household income, land supply elasticity, and transport speed and cost. This implies that housing costs plus transport costs are constant across space, which means that housing costs will decline as transport costs rise with distance to the city center. Gollin, Kirchberger, and Lagakos [25] used the spatial equilibrium model to account for wage gaps and differences in household amenities between rural and urban areas across 20 African countries. Gulyani, Bassett, and Talukdar [26] suggest that location, access to infrastructure, and quality and size of housing drive costs of rent in informal settlements, based on a study on household conditions in slums in Dakar, Senegal, and Nairobi, Kenya. The study thus supports the spatial equilibrium model, underscoring that informal land markets work similarly to formal land markets. The study found that tenants have lower quality of housing, smaller dwellings, and lower levels of access to infrastructure. The study found significant inter-city differences in quality and price of accommodation, which the authors do not account for, e.g., by ascribing it the “city effect”. This underpins that the relation between the property prices, location, and urban density of informal settlements in sub-Saharan Africa remains under-researched, as argued by Visagie and Turok [27].
Colin and Woodhouse [28] provide an overview of the literature on land markets in sub-Saharan Africa and argue that empirical studies which economic models rely on remain sparse. Kombe [29] examines land use trends in peri-urban Dar es Salaam, Tanzania, and argues that the emerging land use pattern indicates a discrepancy between the planning practices and land value theories. Nkurunziza [30] examines informal housing markets in Kampala, Uganda, and argues that informal settlements provide large quantities of housing in part due to social legitimacy. Syagga [31] examines the inequality of land ownership and use in Kenya and argues that the legal and administrative procedures should be reviewed in order to accommodate more equitable access to land as well as transparent and accountable land management. Kironde [32] examines the land market in Dar es Salaam and suggested that informal land transactions are frequent. He proceeds to argue that opening of the land market would make it more reliable and efficient and provide an improved basis for governance, land management, and higher generation of public revenue. Kironde [33] examines the planning standards and administrative procedures in peri-urban Dar es Salaam. He finds that high standards for plot sizes and roads lead to duplicative costs of land and vastly reduced delivery of plots. He argues that comprehensive bureaucracy and unrealistic standards of urban regulation in sub-Saharan Africa exclude poor households from access to legal land and shelter. Wallace and Williamson [34] describe the emergence of land markets as five evolutionary stages, in which higher levels of rights to the land and more flexible modes of land transactions are provided in the latter stages. The proliferation of informal settlements in sub-Saharan Africa is in part a result of a lack of resources in the public sectors to administer the urban development and in part a result of a lack of resources at the household level to comply with the regulatory standards. The lack of public capacity to administer the urban growth in sub-Saharan Africa leads to widespread lack of land titles along with a lack of developed, approved, and implemented urban plans [35]. As construction permits require land titles and approved urban plans, legal construction is thus unattainable for residents of such areas. Provision of drawings and paperwork for formal construction permits requires specialized professionals and thus increases costs of construction. Requirements of the building code, such as minimum structural dimensions, floor to ceiling height, and access conditions, increase costs of construction. Complying with urban regulation thus increases costs and without state-subsidized alternatives, formal housing is unattainable for the urban majorities due to lack of financial resources [27]. The urban majorities in sub-Saharan Africa are thus financially excluded from the formal legal housing market, reflecting a failure of the formal housing markets to provide affordable accommodation [10]. Consequently, the lower levels of public administration have developed informal systems of provision of construction permits without formal basis in the law as well as acceptance of construction not complying with the building code, thus lowering the costs of construction and providing more affordable accommodation for the urban poor [36]. Informal settlements are thus legal gray zones in which the local public administrations engage in extra-legal practices.
The spatial extent of the areas governed through such extra-legal practices varies greatly from country to country and from city to city. In some cases, authorities adopt policies of evicting residents of informal settlements due to the extra-legal conditions of construction without permits and lack of land titles [37]. In other cases, governments grant some property rights protecting the residents of informal settlements along with de facto acceptance of the extra-legal practice to a greater extent [38]. This is exemplified by Figure 1, showing the spatial extent of informal settlements in Maputo, Mozambique, and Nairobi, Kenya. More specifically, the share of informal land use is almost 30 times as high in Maputo compared with Nairobi. Government repression of informal urban development decreases informal land supply, confining the space attainable for the poor majorities and leading to higher population densities within the informal land mass. Conversely, government acceptance or negligence of proliferation of informal urban development will increase informal land supply and thus provide more space for those excluded from the formal land mass, leading to lower population densities of the informal land mass. Government attitudes towards informal urban development, as well as the capacity to control it, will thus partially determine the population densities of these areas.
This paper presents a provisional hypothesis outlining how informal settlements develop based on analysis of various data sources. The hypothesis proposes that the supply of informal land is essential for understanding urban form and livelihood in the context of sub-Saharan Africa where cities are growing rapidly and the urban majority is financially excluded from the formal housing market. The hypothesis suggests that government constraints on informal land supply increase competition on the informal land market which, in turn, results in higher land prices. The higher prices of informal land further exclude low-income groups from holding land and thus lead to an increased share of tenants. Furthermore, the higher prices of informal land also lead to increased costs of rent which, in turn, lead to a larger share of household resources consumed for basic housing for low-income groups. This leads to fewer resources for other basic necessities, resulting in compromised livelihood. Additionally, the size of the informal land mass will determine the population density of the informal settlements at large. Decreased informal land supply will thus result in increased population densities. As limited informal land mass and informal land supply increase costs of rent, this also leads to decreased average dwelling sizes in the informal housing sector. Increased numbers of tenants provide additional income for the landholders, increasing the investment capacity for construction. Consequently, the decreased informal land supply leads to increasing built densities and a more compact urban form. The hypothesis is structured in three hierarchical layers. First, the informal land supply is partially determined by governance practice. Second, the costs of accommodation are partially determined by the informal land supply through market mechanisms. Third, urban form and livelihood are partially determined by the costs of accommodation. This paper presents an analysis of data from four major cities in East Africa underpinning this “Informal Land Supply Hypothesis” by showing consistency between theory and observations. The data include self-produced field interviews and high-resolution spatial data from four case study areas as well as land use data from various sources and references to a number of other studies on the cases under examination. The hypothesis is novel as it suggests that enforcement of the law through evictions of informal settlements and curtailment of informal urban development leads to compromised livelihood for low-income groups. Consequently, the study argues that modes of informal urban development should be accepted.
3. Materials and Methods
The paper utilizes mixed methods based on publicly available land use data, self-produced geo-spatial surveys, and field interviews on household conditions, along with a literature review of previous studies on household conditions in the examined contexts. This includes a qualitative assessment of municipal level informal urban land use data from various sources. Furthermore, it includes a quantitative and qualitative assessment of the urban form of a centrally located informal settlement in each of the four cities based on the self-produced high-resolution geo-spatial surveys. Finally, the study includes a quantitative assessment of household conditions in each case study area based on field interviews, along with a literature review of previous studies on household conditions in each context. This section outlines the methods used to obtain, process, and analyze the data.
The selection criteria for the four examined cities were based on the size of the cities and availability of informal land use data. The examined cities are the largest in their respective contexts and are characterized by the largest concentrations of populations excluded from the formal housing market. Accordingly, these cities were evaluated to provide the best cases for analysis of informal urban development. Furthermore, the informal land use data were essential for carrying out the analysis. Accordingly, the availability of informal land use data for the examined cities was decisive in the selection of cases. The individual settlements examined in this paper were selected based on location and urban form. Centrally located informal settlements were selected for the study as these feature some of the densest urban form in each respective context. As all the settlements are centrally located, centrality does not account for the variations in the urban form and household data. As all the settlements are unplanned, the urban planning history of the case study areas does not account for the variations in the data in the urban form and household data.
The examined case study areas include Hananasif, Dar es Salaam, Tanzania; Katanga, Kampala, Uganda; Kibera, Nairobi, Kenya; and Maxaquene A, Maputo, Mozambique.
3.1. Acquisition and Analysis of Informal Urban Land Use Data
Informal urban land use data from various sources were utilized to identify and analyze the spatial extent of the informal settlements in the four cities under examination. Sliuzas, Hill, Lindner, and Greiving [39] studied the urban land use of informal settlements in Dar es Salaam in 2002. A GIS data set from the study was obtained from the NASA Socioeconomic Data and Applications Center (SEDAC) website (www.sedac.ciesin.columbia.edu/). Municipal authorities surveyed urban land use of informal settlements in Kampala in 2014. A GIS data set from the survey was obtained from the Municipality of Kampala. Williams, Marcello, and Klopp [40] studied the land use of informal settlements in Nairobi in 2010. The data were obtained from the World Bank website (www.datacatalog.worldbank.org/). The Master Plan for the Municipality of Maputo (PEUMM) from 2008 includes land use maps. The land use data in DWG format were obtained from The Faculty of Architecture and Spatial Planning, Eduardo Mondlane University. Land use for informal settlements was exported in DXF format and placed manually in QGIS. The administrative boundaries of the three municipalities comprising Dar es Salaam (today there are five municipalities), the five central districts of the Municipality of Kampala, the eight divisions of Nairobi City County, and the six mainland districts of the Municipality of Maputo were obtained from The United Nations Office for the Coordination of Humanitarian Affairs (OCHA) website (www.data.humdata.org). The off-shore island and sea areas were excluded from the Maputo data and the Lake Victoria area was excluded from the Kampala data. The respective data sets were placed in QGIS. The total area of each municipality, as well as the total area of informal land use, was processed for each city using the union and dissolve commands, and the areas were subsequently calculated in the attribute table using the field calculator and the $area command. Ideally, the study would have compared the informal urban land use to the formal urban land use. However, such data were not available and the informal urban land use was thus calculated based on the size of the administrative areas and assessed qualitatively. As the data originate from different sources and were recorded at different times, and as the size of the cities and administrative areas vary, direct quantitative comparison was unsuited. Accordingly, a qualitative assessment of the extent of the informal urban development compared to the size of the city, the total administrative area, and the time of the survey was applied and summarized in the context descriptions. More specifically, the continuity or fragmentation of the informal land use was assessed based on visual inspection, as continuous informal land use likely signifies a lack of government control of urban development, while fragmented enclaves of informal land use likely signify more government control of urban development.
3.2. Acquisition of High-Resolution Spatial Data and Computation of Indicators of Urban Form
A centrally located informal settlement in each of the four cities was surveyed. The settlements were selected based on location, size, and urban fabric. In order to exclude fringe cases, areas larger than four hectares (40,000 m2) were surveyed. Centrally located settlements were selected in each context in order to minimize the significance of distance to the CBD as a primary driver of the differences in urban form. All of the surveyed areas have unplanned organic urban fabrics and none include major public spaces, large institutions, or industry. Accordingly, the settlements have relatively homogenous urban fabrics relevant for comparison. The settlements were demarcated based on natural boundaries or major roads. These were not included in the data in order to avoid distorting the results. High-resolution orthophotos were produced by mapping the four settlements using an unmanned aerial vehicle (drone) for systematic collection of high-resolution photometric aerial data. The photometric data (aerial photos) were subsequently processed using Pix4D photogrammetry software to generate high-resolution geo-referenced orthophotos, digital surface models (DSM), and digital 3D models of each settlement. Such methods have previously been used by Kurczynski et al. [41]. The public space of each settlement was mapped by walking along the boundaries of every block with a handheld GPS device (smart phone) while using the SW maps application for tracing the movement. The GPS traces were exported in KMZ format and the orthophotos were exported in geo TIFF format. These were placed and automatically scaled in QGIS and exported in DXF format. The DXF file was opened in AutoCAD and layers for buildings, blocks, and the street network were created. All building boundaries were traced manually based on the orthophotos. Multi-story buildings were identified using the DSMs and the 3D models in Pix4D and separate layers were created for each floor. The perimeter for each story was traced manually and placed on the corresponding layer. The street network was traced manually based on the GPS trace and blocks were subsequently traced based on the orthophoto and street network. The total area of all floors, blocks, and the entire case study area was extracted from the properties bar by using the region and union commands. The number of blocks was extracted from the properties bar. The total length of the street network, block perimeter, and building perimeters was extracted using the Total Length (TL) plugin. The total public space area was calculated by extracting the total blocks area from the total case study area. Floor area ratio (FAR), public space ratio (PSR), ground space index (GSI), surface area to volume ratio (SAVR), average block size (AVB), and average street width (ASW) were calculated based on these data.
Six urban form metrics were extracted from the spatial data. Five were used in previous studies, while one was developed in order to provide information on access conditions, which is a particular issue in many informal settlements. The indicators and method of computation are described next.
- Floor area ratio (FAR): the total floor area divided by the total sample area. The metric highlights the intensity of the built environment [42]. FAR is usually calculated based on the total private space rather than the total area. However, in order to avoid distorting the FAR results by variations in the share of public space, the FAR was instead calculated using the total area.
- Public space ratio (PSR): the total public space divided by the total sample area. The metric highlights the level of public space [43].
- Ground space index (GSI) also known as building coverage: the total building footprint divided by the total sample area. The metric highlights the level of the open space [42]. GSI is usually calculated based on the total private space rather than the total area. However, in order to avoid distorting the GSI results by variations in the share of public space, the GSI was instead calculated using the total area.
- Average block size: the total private area divided by the number of blocks. A block is private space surrounded by public space. The metric highlights the scale of the urban fabric [42].
- Surface area to volume ratio: the total building surface area divided by the volume of all buildings. The surface area was calculated by summing the perimeter length of all buildings multiplied by the height of each floor (three meters) and adding to the total building footprint area multiplied by two. The volume was calculated by summing the total area of each floor multiplied by the height of each floor (three meters). As the height of the buildings occur on both sides of the fraction, the imprecise three-meter floor height assessment is largely negated. The metric highlights the compactness of the built environment [44].
- Average public space width: the total area of the public space divided by the total length of the street network. The metric highlights the access conditions. The metric has not been used in previous studies, but was found to be relevant for assessing inadequate access conditions.
The survey of each settlement was carried out during the following periods of time: Hananasif, Dar es Salaam, Tanzania: January 2020; Katanga, Kampala, Uganda: May 2019; Kibera, Nairobi, Kenya: May 2019; and Maxaquene, Maputo, Mozambique: May 2019.
3.3. Field Interviews
The field interviews were carried out alongside the physical surveys. Ten residents of each case study area were interviewed based on random selection, in different parts of the neighborhoods. This entailed a fairly even distribution of gender and relative socioeconomic diversity among the interviewees within each context. The interviews inquired regarding household access to water and sanitation, household size, dwelling size, whether the respondent was a tenant or land holder, and monthly cost of rent. As such, the questions included indicators of livelihood as well as three of five of the UN defined indicators of slums (overcrowding and inadequate access to water and sanitation) [45]. The number of people per room was calculated by dividing household size by household number of rooms. The responses from tenants and land holders showed significant variations and responses from each group are thus shown separately in the Results section. Due to the limited sample size, a literature review on household conditions in the respective contexts was carried out and relevant studies are cited in the Results section.
4. Results
This section includes the results of the field interviews, the computed high-resolution spatial data of the case study areas, and context descriptions based on field observations and qualitative assessment of the land use data.
4.1. Context
This context description is based on analysis of informal urban land use data in each of the urban administrative areas and a qualitative assessment of the urban form of each of the detailed case study areas. This section provides a brief assessment of the informal land use in each city, and a brief description of each of the surveyed settlements based on field observations and previous studies of the sample areas. These descriptions are subsequently used to contextualize the discussion.
Dar es Salaam has approximately 6.70 million inhabitants and is the largest city in Tanzania and East Africa [46]. The city has one administrative body but consists of five municipalities [47]. The city is characterized by large continuous areas of informal urban development, stretching approximately 30 km into the land. The total informal land mass covered 10.36% of the total area of the city in 2002. However, the administrative area of the city is by far the largest and the sourced data are the earliest of the four cities. The informal areas have likely increased significantly since the sourced survey was carried out as peripheral areas of the administrative area of the city were largely undeveloped at the time. Accordingly, it is assessed that the authorities in the city exercise limited control of the land markets and informal settlements are de facto allowed to proliferate despite the extra-legal status. Informal settlements thus likely cover much larger areas and the share of informal areas in the city is thus likely significantly higher today compared to the time of the survey. Hananasif is one of the most centrally located settlements, at approximately 3 km from the CBD of Dar es Salaam. The settlement is characterized by single-story detached housing units and relatively wide streets, allowing access for cars.
Kampala has approximately 3.29 million inhabitants and is the largest city and the capital of Uganda [48]. The Kampala Capital City Authority (KCCA) administers the five divisions of the city [49]. The city is characterized by fragmented enclaves of informal settlements. This indicates that authorities exercise some control of the land market. Informal settlements covered 13.74% of the five central districts of the city in 2014. However, the administrative area of KCCA is the smallest of the four examined cities and the majority of the land use was urban. Accordingly, informal settlements take up relatively limited space compared to the formal urban areas. Katanga is one of the most centrally located informal settlements in Kampala, at approximately 2 km from the CBD. Katanga is located next to the main hospital in the city and the settlement is surrounded by formal urban areas. The urban fabric of Katanga is mostly characterized by single-story dense clusters of buildings and small blocks.
Nairobi has approximately 4.74 million inhabitants and is the largest city and the capital of Kenya [50]. The Nairobi City Council has eight administrative divisions [51]. The city is characterized by informal urban development limited to small fragmented enclaves. Informal settlements covered only 1.10% of the total area of the administrative area of the Nairobi City Council. While the city shows by far the smallest share of informal land of the four examined cities, it is important to note that Nairobi National Park is included in the administrative area and thus distorts the data towards a lower share of informal land use. Nevertheless, the data indicate that the authorities exercise more strict control of the land markets compared to the other three cities. This is corroborated by a previous study finding that authorities adopt policies of evicting residents of informal settlements in Nairobi [37]. Kibera is located 5 km southwest of the CBD. The settlement is characterized by large-scale one-, two-, and three-story buildings, large blocks, and limited public space. The large-scale buildings indicate large plot sizes and large-scale landowners supplying low-cost rental housing for the residents.
Maputo has approximately 2.81 million inhabitants and is the largest city and the capital of Mozambique [52]. The city consists of seven administrative districts [53]. The city is characterized by widespread continuous informal land use. Informal settlements covered 29.45% of the administrative area of the Municipality of Maputo in 2008, excluding the off-shore islands. However, a bridge connecting the urban center to the southern district of Katembe has been constructed since the time of the survey, thus incentivizing urban development in the least developed main land part of the administrative area. Accordingly, the share of informal urban land use is likely higher today. This indicates that the city authorities exercise limited control of the land markets and informal settlements are de facto allowed to proliferate despite the extra-legal status. This is corroborated by a previous study which found that governments have granted some property rights protecting the residents of informal settlements in Maputo [38]. Maxaquene A is located approximately 3 km from the CBD of Maputo. The urban fabric of Maxaquene is characterized by single-story detached households, open private spaces, and large blocks. These conditions indicate large plot sizes.
4.2. Field Interviews and Literature Review on Household Conditions
The field interviews are summarized and presented in Table 1 and Table 2. The complete field interviews are available in Appendix A Figure A1. The interview data show large variations in tenure types, dwelling sizes, household sizes, and people per room, as well as levels of household access to water and sanitation, across the case study areas. The data show that tenants have significantly lower levels of access to water and sanitation and have almost exclusively single-room dwellings, while homeowner dwelling sizes average 4.48 rooms across the sample areas. Land holder household size averages more than double that of tenants and tenant households have almost twice as many people per room. These tendencies are reflected across the sample areas. Accordingly, sample areas with a higher share of tenants also have lower levels of access to water and sanitation, along with smaller average dwelling size, smaller average household size, and more widespread overcrowding. Although the sample size is too limited to generalize, the general levels (high, moderate, low) of the surveyed household conditions are largely consistent with previous studies found in the literature review presented in Table 3. Mapunda, Yu, and Chen [54] and Jenkins, Cumming, and Cairncross [55] report that the proportion of tenants in peri-urban Dar es Salaam is moderate. Okuruta and Charles [56] report that the proportion of tenants in informal settlements in Kampala is high. Gulyani and Talukdar [51] report that the proportion of tenants in informal settlements in Nairobi is high. Jenkins [36] reports that the proportion of tenants in informal settlements in Maputo is low. Accordingly, the tenancy data are consistent with previous studies. Mapunda et al. [54] report that the level of household access to water is moderate in peri-urban Dar es Salaam, while Kirama and Mayo [57] report that the level of household access to water is high in Dar es Salaam. Katukiza et al. [58] report that the level of household access to water in peri-urban Kampala is low. Gulyani, Bassett, and Talukdar [59] report that the level of household access to water in informal settlements in Nairobi is low. Forjaz et al. [60] report that the level of household access to water in Maputo is high. Accordingly, the household access to water data are consistent with previous studies. Jenkins et al. [55] report that nearly all low-income properties in Dar es Salaam have a sanitation facility. Okurut and Charles [56] and O’Keefe, Lüthi, Tumwebaze, and Tobias [61] report that the level of household access to sanitation in informal settlements in Kampala is low. O’Keefe et al. [61] report that the level of household access to sanitation in Kibera is low. Peal, Evans, Blackett, Hawkins, and Heymans [62] report that the vast majority of households in Maputo have onsite sanitation. Accordingly, household access to sanitation data are consistent with previous studies. The National Bureau of Statistics, Tanzania [63], reports that the level of overcrowding in Dar es Salaam is moderate. Mbiggo and Ssemwogerere [64] report that in Katanga, one-room dwellings are the most common dwelling type and that overcrowding is common. Marx, Stoker, and Suri [65] report that overcrowding is common in Kibera. Holcomb et al. [66] report that few households are crowded in low-income neighborhoods of Maputo. Accordingly, the household level of overcrowding data are consistent with previous studies. No relevant data for comparison across sample areas on cost of rent were found during the literature review. However, the data on the remaining socio-economic and livelihood indicators of household conditions were consistent with previous studies.
4.3. Urban Form of Case Study Areas
The orthophotos and vectorized maps of the four case study areas are presented in Figure 2 and aerial photos of each of the four areas are presented in Figure 3. All indicators of urban form presented in Table 4 show variations across sample areas. The study found the highest FAR, GSI, and SAVR values in Kibera, while the lowest values of these three metrics were found in Maxaquene A. The study found the second highest FAR, GSI, and SAVR values in Katanga, while the second lowest values of these three metrics were found in Hananasif. Accordingly, the study found an identical order across all sample areas for the FAR, SAVR, and GSI indicators. The study found the lowest PSR in Maxaquene A and the highest PSR in Katanga, while the second lowest PSR was found in Kibera and the second highest PSR was found in Hananasif. The study found the highest ABS in Maxaquene A and the lowest in Katanga, while the second highest ABS was found in Kibera and the second lowest ABS was found in Hananasif. Accordingly, the study found a reverse identical order across all sample areas for the PSR and ABS indicators. The study found the lowest ASW in Maxaquene A and the highest ASW in Hananasif, while the second lowest ASW was found in Katanga and the second highest ASW was found in Kibera. The study found an identical order across all sample areas for all the built density indicators (FAR, GSI, and SAVR). The study found an identical order across all sample areas for two of three public space indicators (ABS and PSR). However, the study did not find a similar order of values across sample areas for the built density and public space indicators.
5. Discussion
This section analyzes the results of the study. Secondly, it outlines a provisional hypothesis of the mechanisms partially determining the informal urban development. Finally, it presents a number of policy recommendations based on the findings of the study. The hypothesis, as well as the policy recommendations, are informed by the described urban economic theories in the introduction as well as the empirical findings of the study.
5.1. Analysis of Results
The study found large variations in the informal land use across the four examined cities and thereby documents that the spatial extent of the informal urban development in major East African cities is characterized by significant variations. The study found variations within all seven indicators of urban form and thereby documents that centrally located unplanned informal settlements in major East African cities are not uniform, but are characterized by a wide spectrum of spatial characteristics. The study found large variations in household conditions and share of tenants across the sample areas. Accordingly, livelihood and tenure conditions in informal settlements in major East African cities vary significantly.
In relation to the informal urban land use data, the fragmented and limited informal urban land use observed in Kampala and Nairobi, as well as the continuous informal urban land use observed in Dar es Salaam and Maputo, suggests that government attitudes towards informal urban development differ significantly between different contexts, as reported in previous studies such as Jenkins [67] and Talukdar [37]. This is underscored by the 1.10% share of informal urban land use within the administrative area of Nairobi City Council and the 29.45% share of informal land use in the main land administrative area of Maputo Municipality. Accordingly, the study suggests that practices of authorities towards informal urban development have significant implications for informal urban land use.
In relation to the public space indicators of urban form, the study found an identical order across all sample areas for the PSR and ABS indicators. The study found a higher share of public space in areas with smaller average block sizes and a lower share of public space in areas with larger average block sizes. Accordingly, the study suggests that the share of public space in unplanned informal settlements is linked to the average block size. The study found both the lowest built densities (FAR, GSI, and SAVR) and the lowest PSR in Maxaquene A. Accordingly, the study suggests no link between low levels of public space and high built densities or a lack of free private space. The study did not find any similar ordering of the ASW indicator and the other indicators across the sample areas. Accordingly, the study suggests access conditions are not linked to the urban layout or built densities in unplanned informal settlements. As smaller blocks require more street network length per area to provide access, elementary geometry may account for parts of the link between PSR and ABS. The study thus suggests that the street layout is significant for the share of public space in informal settlements. As block sizes are determined by the street layout, the early processes of the formation of an informal settlement are essential for the development of public space. However, as ASW is not linked to PSR or ABS, the access conditions are likely linked to the subsequent governance of the informal settlements and, particularly, to what extent street encroachment is accepted by local governance structures. Accordingly, the local governance structures are likely fundamental for the development of public space in informal settlements at the time of the formation, as well as during the subsequent ongoing process of development. The study found the lowest ASW values in Katanga and Maxaquene A. These values (roughly two meters) may approximate a minimum of access conditions for both the human body and internal transportation of goods in the settlements. The study found that the share of public space alone provides inadequate information on the access conditions in informal settlements, as settlements with small blocks can have a relatively high PSR and relatively low ASW. This insight may have implications for the urban planning of so-called “slum-upgrade” projects.
In relation to the built density, the study found identical ordering across the sample areas for the FAR, GSI, and FAR indicators. Notably, a similar ordering was found across the sample areas for the informal land use data and household data. The study found the most fragmented informal urban land use in Kampala and Nairobi and the informal urban development is likely more restricted in these cities. The study found more continuous informal urban land use in Dar es Salaam, while the most continuous informal urban land use was found in Maputo. Accordingly, informal urban development is likely less restricted in these cities. The study found higher built densities in the Kampala and Nairobi case study areas, while moderate built densities were found in the Dar es Salaam case study area and lower built densities were found in the Maputo case study area. Similarly, the interview survey and literature review found a high share of tenants and higher levels of compromised livelihood in Kampala and Nairobi, a moderate share of tenants and moderate levels of compromised livelihood in Dar es Salaam, and a low share of tenants and low level of compromised livelihood in Maputo.
All four countries included in this study have high population growth rates, low national GDP per capita, and high rates of urbanization [46,48,50,52]. All four cities have large populations and urban poor majorities financially excluded from the formal housing market [3]. Accordingly, the demand for informal land in all five cities is likely high. As all four case study areas are centrally located, they represent some of the densest informal settlements within the respective contexts. Kibera is the least centrally located case and has the highest built density. Accordingly, centrality cannot account for the variations in the built density data. Hananasif is located in the largest city and the second lowest built densities were found in this sample area. Accordingly, the total urban population size cannot account for the variations in the built density data. Maputo is located in the country with the lowest GDP per capita of the four examined cities and the lowest levels of compromised livelihood were found in this sample area. Accordingly, GDP per capita cannot account for the variations in the household condition data. Geographic factors, such as mountains, lakes, and the sea, may influence the total land mass available for urban development in any given city and thereby also influence the size of informal land mass. The center of Maputo is located at the tip of a peninsula and large parts of the municipal land mass were inaccessible at the time of the survey due to it being conducted before the newly constructed bridge which provides better access to Katembe (the area south of the bay). The urban development in Nairobi is not conditioned by geographic constraints to the same extent. Consequently, geographic factors likely curb informal urban development in Maputo to a higher extent than Nairobi, yet informal urban development is much more widespread in Maputo. Accordingly, geographic factors cannot account for the variations in the informal urban land use. As demonstrated, factors such as neighborhood centrality, total urban population size, GDP per capita, and geography cannot account for the variations in the data. This study argues that the level of government control of the land market is the primary driver of the differences in the informal land use data, the urban density data, and the household condition data across the sample areas. This is explained in further detail in the following section.
5.2. A Hypothesis on Informal Land Supply, Livelihood, and Urban Form in Cities in Sub-Saharan Africa
This section outlines a provisional hypothesis for understanding informal urban development in cities characterized by high population growth rates and urban majorities financially excluded from the formal housing markets. More specifically, the hypothesis explains how government practices towards informal urban development partially determine the urban form and the livelihood in informal settlements. The hypothesis consists of three hierarchical layers. First, the governance practice partially determines the informal land supply. Second, market mechanisms partially determine the price of informal land. Third, the price of informal land partially determines household conditions and development of urban form. The hypothesis is presented in Figure 4. This hypothesis is limited to cities with large populations financially excluded from the formal housing market and limited capacity to administer urban development. However, such conditions are widespread in large cities throughout sub-Saharan Africa. These conditions are not necessarily reflective of particular context-specific cultural practices and more likely linked to general economic and demographic developments. Accordingly, cities in different cultural settings characterized by large populations financially excluded from the formal housing market and limited state capacity to administer urban growth will likely develop within similar structural conditions. Hence, urban form and household conditions will likely also be partially determined by informal land supply in such settings. Accordingly, cities in other parts of the Global South characterized by extensive urban growth, urban poor majorities excluded from the formal housing market, and limited state capacity to administer urban growth will likely develop according to the hypothesis.
The results of the study demonstrate large variations in the informal land use at municipal administrative levels, reflecting large variations in government practices towards informal urban development. Gulyani et al. [26] argued that informal land markets work similarly to formal land markets. Accordingly, previously outlined land use models may explain variations in built densities and household conditions presented in this study. The formal–informal price gap reflects a spatial equilibrium, in which the lower land prices in informal settlements are offset by a lack of property rights and consequent lack of tenure security. As tenure security represents an important amenity, the formal–informal market value of land differs significantly. This price difference excludes the urban poor from owning formal land. If simple supply and demand mechanisms partially determine the cost of informal land, government attitudes and practices towards informal urban development influence the informal land supply and thereby land prices. More specifically, government restriction of informal urban development will decrease informal land supply and thereby increase the competition in the informal land market, resulting in increased costs of land and accommodation in the informal market. Conversely, government acquiescence to the proliferation of informal urban development will increase informal land supply, and thereby decrease competition in the informal land market, resulting in decreased price of land and accommodation in the informal market. Mottelson and Venerandi [68] first proposed this mechanism explaining variations in livelihood and built densities in informal settlements. Angel [69] provided a similar argument, namely that greenbelt policies increase costs of affordable housing due to containment of urban expansion and consequent decreased land supply, resulting in increased competition and higher costs of accommodation. Consequently, government restriction of informal urban development through forced evictions decreases the informal land supply and thus leads to increased costs of accommodation. Government restriction of informal urban development and consequent increasing costs of informal land further exclude the least wealthy parts of the population from holding land and thereby lead to an increased share of tenants in the population. This mechanism is underpinned by the fragmented and limited informal urban land use, the high share of tenants, and the high cost of accommodation seen in Nairobi and Kampala, and conversely by the continuous informal urban land use, lower share of tenants, and lower costs of accommodation seen in Dar es Salaam and Maputo.
Increased financial exclusion from holding informal land leads to an increased share of tenants. Accordingly, the increased costs of land caused by decreased informal land supply may account for the high share of tenants observed in Kampala and Nairobi, the moderate share of tenants in Dar es Salaam, and the low share of tenants in Maputo. As residents of informal settlements typically have limited economic resources and cannot obtain loans in banks as their properties are extra-legal, the investment capacity for construction is largely limited. Households in informal settlements typically develop incrementally when economic resources for expansion are available [70]. As overcrowding is common in informal settlements, expansion of households is typically desired. However, built densification is largely constrained by the household economy. The population densities in the informal urban areas are an outcome of the size of the population financially excluded from the formal housing market and the total area of the informal urban land use. Limited informal urban land use and large populations financially excluded from the formal housing market thus result in high population densities. This, in turn, is linked with a high share of tenants. The income generated by tenants provides increased investment capacities for landlords and is likely a contributing factor to the higher built densities seen in informal urban areas with a high share of tenants. Furthermore, the economic incentives for landlords to optimize the use of space may partially account for the development of more compact urban form as seen in the case study areas with a higher share of tenants. Finally, the higher population densities in informal settlements in cities with limited informal land supply and large populations financially excluded from the formal housing may provide an increased accumulative collective investment capacity of high-density populations and thereby contribute to the higher built densities.
Glaeser and Gottlieb [23] argued that increasing house prices do not naturally represent an increase in national wealth since the values have been offset by an increase in cost of securing a basic necessity. Accordingly, increased competition in the informal land market will likely result in higher rents, leading to fewer household resources for other investments. Furthermore, the insecure investment conditions in informal rental housing in cities where authorities enforce evictions of informal settlements may result in a price premium paid by users due to the risk of lost investments further contributing to higher costs of rent in cities where authorities adopt more strict practices towards informal urban development. Investments in infrastructure largely depend on private funding as public investments in informal settlements are limited. Infrastructure also represents valuable amenities leading to increased market value according to the spatial equilibrium theory. Accordingly, access to infrastructure is linked to higher costs of rent. Restriction of informal land supply in cities with high population growth and large populations excluded from the formal housing market may lead to higher costs of accommodation. Accordingly, the level of informal land supply may directly affect the level of access to basic infrastructure, as low levels of informal land supply will lead to increased land prices and higher rent, which thereby reduce the economic leeway for covering costs of infrastructure. This may, in turn, lead to fewer household resources for investments in basic infrastructure such as durable housing and sufficient living space, as well as adequate water and sanitation. This mechanism is underpinned by the study as the examined cities with limited informal urban land use also have higher proportions of tenants and overcrowding, as well as lower levels of access to water and sanitation, while the cities with more informal urban land use have lower levels of tenants and overcrowding and higher proportions of access to water and sanitation.
5.3. Policy Responses
This paper argues that restriction on informal urban development in major cities in sub-Saharan Africa results in compromised livelihood for large parts of the populations. Accordingly, the policy implications may be significant if decision-makers consider improved livelihood a political goal. Complying with the building code and following the formal procedures of land management lead to increased costs for the land users. Furthermore, the administrative capacity of the public sectors to process the legal framework for formal urban development is inadequate in most major cities in the region. Accordingly, there is a need to decrease the costs of complying with regulations for the users, as well as a need to decrease the bureaucratic workload of urban land management for authorities. Some countries recognize that the residents were not able to comply with regulations or that the limited administrative capacity of the state did not provide viable alternatives to informal housing during the time of establishment of the informal settlements [36]. Consequently, these countries already grant some land rights to residents of informal settlements. This includes some protection from uncompensated forced evictions and a legal path towards formalization. A new category of tenure may be developed in order to provide rights to informal land holders and provide a higher degree of tenure security. This informal landholder title may be governed with less costly requirements for spatial surveys and less strict application of the building code. More specifically, urban development may be guided with simple zoning plans permitting auto-construction within certain spatial frameworks of plots. This may include standardized setbacks from access routes and maximum building heights. Such zoning could be administered by the local authorities in the informal settlements without involvement of high-salary technical professionals. The study demonstrates that local authorities, such as in Hananasif, can facilitate development of a desirable urban form with adequate access conditions and public space. Accordingly, such local authorities may be given additional administrative power, financial resources for investments in infrastructure, and technical training in administering urban development locally. Such policy proposals would target existing informal settlements in order to address issues with illegal construction, insecure tenure, and inadequate infrastructure.
In order to address high costs of accommodation, governments may consider expanding the informal land supply by designating new areas for informal construction. This could be pioneered through state-financed allocation of small plots with leasehold titles on government-owned land, with allocation of sufficient street space, common water and sanitation units, and local guidance for auto-construction without strict enforcement of the building code. The local administration of these areas may receive capacity building in urban management to provide general guidelines for autoconstruction according to basic zoning, similarly to the ones described in the previous paragraph. Appropriate solutions for such pilot areas may include minimal plot sizes corresponding to an apartment, on which the citizens construct their houses guided by the local administration according to the zoning. Common bathrooms, showers, and water posts may be public-funded to provide infrastructure for those who cannot afford the solutions provided by the market. The study argues that such initiative would provide viable housing options for low-income populations and thereby decrease the competition in the informal land market, resulting in lower costs of accommodation. This may, in turn, free household resources for investments in basic infrastructure and thereby improve livelihood.
Technological development has brought low-cost survey solutions with drones and community mapping with smart phones. Innovation in this field may advance affordable land management solutions utilizing drones, apps, and smartphones to provide new forms of geo-surveys of landmarks, built structures, plot boundaries, and public spaces. This could include automatically generated guidance based on inputs given to an app according to basic zoning requirements for autoconstruction described previously in this section. Such systems may be developed and tried as tools to address the negative consequences of a lack of urban regulation without the added costs for formalizing land and provide a path towards formalizing land ownership.
These recommendations relate to general discussions on the applicability of Global North-based urban planning paradigms in the Global South. The standards of administration, governance, and urban planning practice from the North were arguably developed corresponding to societies with more economic resources. The human capital and economic costs of such standards arguably do not correspond to the current conditions in much of the Global South and discussions on appropriate standards corresponding to the local conditions are important.
6. Conclusions
The study found large variations in informal urban land use across the four examined cites. Accordingly, attitudes and practices towards informal urban development likely vary among authorities across the region. The study found that centrally located settlements in the four examined cities have diverse urban form characteristics. More specifically, the study found diverse built densities and public space conditions. The study suggested that the public space ratio in informal settlements is linked to average block size. The study found that built densities do not influence the public space ratio and this is largely determined through the governance of the early formation of the settlement when blocks are established and the subsequent governance determining the level of street encroachment. The study found higher built densities in the case study areas located in the examined cities characterized by limited informal land use. The study also found a high share of tenants, more widespread overcrowding, and lower levels of access to water and sanitation in the examined cities with limited informal urban land use.
Based on these findings, the study proposed a novel hypothesis on informal urban development in cities in sub-Saharan Africa characterized by majorities financially excluded from the formal housing market. The hypothesis is structured in three hierarchical layers. First, the governance practice partially determines the informal land supply. Second, market mechanisms partially determine the price of informal land. Third, the price of informal land partially determines household conditions and development of urban form. The hypothesis is underpinned by empirical findings showing consistency between the theoretical concepts and data. However, the relation between the property prices, location, and urban density of informal settlements in sub-Saharan Africa remains under-researched [27]. Accordingly, further studies are needed to corroborate the hypothesis.
The paper argues that informal urban development proliferates when the administrative capacity of the state is limited and large parts of the populations have too limited resources to comply with regulations. The paper argues that enforcement of the law through eviction of the informal settlements leads to worse living conditions for the population financially excluded from the formal market. However, this does not mean that public policy should enhance the proliferation of informal urban development. Contrarily, the paper argues that the requirements for what is considered formal should be changed so that they require fewer resources in public administration and are less costly for the general population.
Funding
This research was funded by The Danish Council of Independent Research (ID: 7023-00007B) and the Royal Danish Academy.
Acknowledgments
I would like to thank the municipality and local authorities in the five settlements studied in this paper for permitting the spatial surveys as well as the members of the communities of each settlement who participated in the field interviews. Finally, I would like to thank the following residents who facilitated the field work: Mario Mugano Xikumbane, Ali Muhammed Muhina, Ally Hassan Ally, Daniel Futwax, John Saturday Bwambale, David Esenga, Kyeyune Daniel, Vero Razafinirina, Ravaonirina Andrine, Rasoanirina Zoeline, and Rabevaza Selestin.
Conflicts of Interest
The author declares no conflict of interest.
Appendix A
Figure A1.
Full interview data. The interviewees are numbered horizontally to the right of the neighborhood name with responses for each question underneath. The responses to the binary (yes/no) questions are assigned 1 for yes and 0 for no.
Figure A1.
Full interview data. The interviewees are numbered horizontally to the right of the neighborhood name with responses for each question underneath. The responses to the binary (yes/no) questions are assigned 1 for yes and 0 for no.

References
- Jenkins, P. Informal Settlements: Infernal and Eternal? The role of research in policy advocacy and urban informal settlements in Angola. In Informal Settlements—A Perpetual Challenge? Huchzermeyer, M., Karam, A., Eds.; University of Cape Town Press: Cape Town, South Africa, 2006; pp. 84–102. [Google Scholar]
- OECD. OECD Glossary of Statistical Terms; OECD: Paris, France, 2008; ISBN 978-92-64-02556-1. [Google Scholar]
- UN-Habitat. State of the World’s Cities 2012/2013: Prosperity of Cities; Routledge: London, UK, 2013; ISBN 1-135-01559-7. [Google Scholar]
- Lowry, J.H.; Lowry, M.B. Comparing spatial metrics that quantify urban form. Comput. Environ. Urban Syst. 2014, 44, 59–67. [Google Scholar] [CrossRef]
- UN-Habitat. State of African Cities 2010, Governance, Inequalities and Urban Land Markets | UN-Habitat; United Nations Settlement Programme: Nairobi, Kenya, 2010. [Google Scholar]
- Organisation for Economic Co-operation and Development. Compact City Policies: A Comparative Assessment; OECD: Paris, France, 2012; ISBN 92-64-16784-6. [Google Scholar]
- UN-Habitat. New Urban Agenda: H III: Habitat III: Quito 17–20 October 2016; United Nations: Nairobi, Kenya, 2017; ISBN 978-92-1-132731-1. [Google Scholar]
- Xu, G.; Dong, T.; Cobbinah, P.B.; Jiao, L.; Sumari, N.S.; Chai, B.; Liu, Y. Urban expansion and form changes across African cities with a global outlook: Spatiotemporal analysis of urban land densities. J. Clean. Prod. 2019, 224, 802–810. [Google Scholar] [CrossRef]
- Mottelson, J. Urban Densification of Informal Settlements in Sub-Saharan Africa: An Analysis of Recent Developments in Maputo, Mozambique. In Proceedings of the International Seminar on Urban Form 2020: Cities in The Twenty-First Century, Salt Lake City, UT, USA, 1–4 September 2020; p. 11. [Google Scholar]
- Angel, S.; Blei, A.M.; Parent, J.; Lamson-Hall, P.; Galarza Sanchez, N.; Civco, D.L.; Qian Lei, R.; Thom, K. Atlas of Urban Expansion The 2016 Edition Volume 1: Areas and Densities, 1st ed.; NYU Urban Expansion Program at New York University, UN-Habitat, and the Lincoln Institute of Land Policy: New York, NY, USA, 2016. [Google Scholar]
- Satterthwaite, D. Upgrading dense informal settlements: The potential for health and well-being. Available online: https://www.researchgate.net/profile/David_Satterthwaite/publication/313496157_Upgrading_dense_informal_settlements_the_potential_for_health_and_well-being/links/5910503aa6fdccc0eca1f6f3/Upgrading-dense-informal-settlements-the-potential-for-health-and-well-being.pdf (accessed on 23 October 2020).
- Andreasen, M.H.; Møller-Jensen, L. Access to the city: Mobility patterns, transport and accessibility in peripheral settlements of Dar es Salaam. J. Transp. Geogr. 2017, 62, 20–29. [Google Scholar] [CrossRef] [Green Version]
- Thünen, J.H. Von Thünen’s “Isolated state”: An English edition; Pergamon Press: Oxford, NY, USA, 1966. [Google Scholar]
- Park, R.E.; Burgess, E.W. The City; University of Chicago Press: Chicago, IL, USA, 2019. [Google Scholar]
- Haig, R.M. Toward an Understanding of the Metropolis: I. Some Speculations Regarding the Economic Basis of Urban Concentration. Q. J. Econ. 1926, 40, 179–208. [Google Scholar] [CrossRef]
- Hoyt, H.; United States Federal Housing Administration. The Structure and Growth of Residential Neighborhoods in American Cities; U.S. Government Printing Office: Washington, DC, USA, 1939.
- Lichtenberger, E. Harris and Ullman’s “The Nature of Cities”: The Paper’s Historical Context and Its Impact on Further Research. Urban Geogr. 1997, 18, 7–14. [Google Scholar] [CrossRef]
- Alonso, W. Location and Land Use: Toward a General Theory of Land Rent; Harvard University Press: Cambridge, MA, USA, 2013; ISBN 978-0-674-73085-4. [Google Scholar]
- Smith, B.A. Measuring the value of urban amenities. J. Urban Econ. 1978, 5, 370–387. [Google Scholar] [CrossRef]
- Samuelson, P.A. Spatial Price Equilibrium and Linear Programming. Am. Econ. Rev. 1952, 42, 283–303. [Google Scholar]
- Mills, E.S. An Aggregative Model of Resource Allocation in a Metropolitan Area. Am. Econ. Rev. 1967, 57, 197–210. [Google Scholar]
- Muth, R.F. Cities and Housing; the Spatial Pattern of Urban Residential Land Use; University of Chicago Press: Chicago, IL, USA, 1969; ISBN 978-0-226-55413-6. [Google Scholar]
- Glaeser, E.L.; Gottlieb, J.D. The Wealth of Cities: Agglomeration Economies and Spatial Equilibrium in the United States. J. Econ. Lit. 2009, 47, 983–1028. [Google Scholar] [CrossRef] [Green Version]
- Bertaud, A. Order without Design: How Markets Shape Cities; The MIT Press: Cambridge, MA, USA, 2018; ISBN 978-0-262-03876-8. [Google Scholar]
- Gollin, D.; Kirchberger, M.; Lagakos, D. In Search of a Spatial Equilibrium in the Developing World; National Bureau of Economic Research: Cambridge, MA, USA, 2017; p. w23916. [Google Scholar]
- Gulyani, S.; Bassett, E.M.; Talukdar, D. A tale of two cities: A multi-dimensional portrait of poverty and living conditions in the slums of Dakar and Nairobi. Habitat Int. 2014, 43, 98–107. [Google Scholar] [CrossRef]
- Visagie, J.; Turok, I. Getting urban density to work in informal settlements in Africa. Environ. Urban. 2020, 32, 351–370. [Google Scholar] [CrossRef]
- Colin, J.P.; Woodhouse, P. Interpreting land markets in Africa. Africa 2010, 80, 1–13. [Google Scholar] [CrossRef] [Green Version]
- Kombe, W.J.; Kreibich, V. Informal land management in Tanzania and the misconception about its illegality. In Proceedings of the ESF/N-Aerus Annual Workshop on “Coping with Informality and Illegality in Human Settlements in Developing Countries”, Brussels, Belgium, 23–26 May 2001. [Google Scholar]
- Nkurunziza, E. Informal mechanisms for accessing and securing urban land rights: The case of Kampala, Uganda. Environ. Urban. 2007, 19, 509–526. [Google Scholar] [CrossRef] [Green Version]
- Syagga, P.M. Land ownership and use in Kenya: Policy prescriptions from an inequality perspective. Readings on Inequality in Kenya. Sectoral Dynamics and Perspectives, Nairobi. 2006, pp. 289–344. Available online: https://learning.uonbi.ac.ke/courses/GPR203_001/document/Property_Law_GPR216-September,_2014/Articles/Syagga_Chapter8.pdf (accessed on 23 October 2020).
- Kironde, J.M.L. Understanding land markets in African urban areas: The case of Dar es Salaam, Tanzania. Habitat Int. 2000, 24, 151–165. [Google Scholar] [CrossRef]
- Kironde, J.M.L. The regulatory framework, unplanned development and urban poverty: Findings from Dar es Salaam, Tanzania. Land Use Policy 2006, 23, 460–472. [Google Scholar] [CrossRef]
- Wallace, J.; Williamson, I. Building land markets. Land Use Policy 2006, 23, 123–135. [Google Scholar] [CrossRef]
- Owusu, G. Coping with Urban Sprawl: A Critical Discussion of the Urban Containment Strategy in a Developing Country City, Accra. 17. Available online: http://ugspace.ug.edu.gh/bitstream/handle/123456789/6236/Coping%20with%20Urban%20Sprawl%20A%20critical%20discussion%20of%20the%20urban%20containment%20strategy%20in%20a%20developing%20country%20city%20Accra,.pdf?sequence=1 (accessed on 23 October 2020).
- Jenkins, P. Urbanization, Urbanism, and Urbanity in an African City: Home Spaces and House Cultures; Africa Connects; Palgrave Macmillan: New York, NY, USA, 2013; ISBN 978-1-137-38016-6. [Google Scholar]
- Talukdar, D. Cost of being a slum dweller in Nairobi: Living under dismal conditions but still paying a housing rent premium. World Dev. 2018, 109, 42–56. [Google Scholar] [CrossRef] [Green Version]
- Jenkins, P. Emerging Urban Residential Land Markets in Post-Socialist Mozambique: The Impact on the Poor and Alternatives to Improve Land Access and Urban Development; School of Planning and Housing Edinburgh College of Art/Heriot-Watt University Hunter’s Close: Edinburg, UK, 2001; p. 91. [Google Scholar]
- Sliuzas, R.V.; Hill, A.; Lindner, C.; Greiving, S. Dar es Salaam Land Use and Informal Settlement Data Set; NASA Socioeconomic Data and Applications Center (SEDAC): Palisades, NY, USA, 2016. [Google Scholar]
- Williams, S.; Marcello, E.; Klopp, J.M. Toward Open Source Kenya: Creating and Sharing a GIS Database of Nairobi. Ann. Assoc. Am. Geogr. 2014, 104, 114–130. [Google Scholar] [CrossRef]
- Kurczynski, Z.; Bakuła, K.; Karabin, M.; Kowalczyk, M.; Markiewicz, J.; Ostrowski, W.; Podlasiak, P.; Zawieska, D. The Possibility of using images obtained from the UAS in cadastral works. Int. Arch. Photogramm. Remote Sens. Spat. Inf. Sci. 2016, 41, 909. [Google Scholar] [CrossRef]
- Berghauser Pont, M.; Haupt, P. Space, Density and Urban Form; NAi Publisher: Rotterdam, The Netherlands, 2009; ISBN 978-90-5269-375-0. [Google Scholar]
- Oliver-Solà, J.; Josa, A.; Arena, A.P.; Gabarrell, X.; Rieradevall, J. The GWP-Chart: An environmental tool for guiding urban planning processes. Application to concrete sidewalks. Cities 2011, 28, 245–250. [Google Scholar] [CrossRef]
- Ratti, C.; Baker, N.; Steemers, K. Energy consumption and urban texture. Energy Build. 2005, 37, 762–776. [Google Scholar] [CrossRef]
- UN-Habitat The Challenge of Slums: Global Report on Human Settlements, 2003; Earthscan Publications: London, UK; Sterling, VA, USA, 2003; ISBN 978-1-84407-037-4.
- Africa:: Tanzania—The World Factbook—Central Intelligence Agency. Available online: https://www.cia.gov/library/publications/the-world-factbook/geos/tz.html (accessed on 22 October 2020).
- Todd, G.; Msuya, I.; Levira, F.; Moshi, I. City Profile: Dar es Salaam, Tanzania. Environ. Urban. ASIA 2019, 10, 193–215. [Google Scholar] [CrossRef]
- Africa:: Uganda—The World Factbook—Central Intelligence Agency. Available online: https://www.cia.gov/library/publications/the-world-factbook/geos/ug.html (accessed on 22 October 2020).
- Kinobe, J.R.; Niwagaba, C.B.; Gebresenbet, G.; Komakech, A.J.; Vinnerås, B. Mapping out the solid waste generation and collection models: The case of Kampala City. J. Air Waste Manag. Assoc. 1995 2015, 65, 197–205. [Google Scholar] [CrossRef] [PubMed] [Green Version]
- Africa:: Kenya—The World Factbook—Central Intelligence Agency. Available online: https://www.cia.gov/library/publications/the-world-factbook/geos/ke.html (accessed on 22 October 2020).
- Gulyani, S.; Talukdar, D. Slum Real Estate: The Low-Quality High-Price Puzzle in Nairobi’s Slum Rental Market and its Implications for Theory and Practice. World Dev. 2008, 36, 1916–1937. [Google Scholar] [CrossRef]
- Africa:: Mozambique—The World Factbook—Central Intelligence Agency. Available online: https://www.cia.gov/library/publications/the-world-factbook/geos/mz.html (accessed on 22 October 2020).
- Barros, C.P.; Chivangue, A.; Samagaio, A. Urban dynamics in Maputo, Mozambique. Cities 2014, 36, 74–82. [Google Scholar] [CrossRef]
- Mapunda, D.W.; Chen, S.S.; Yu, C. The role of informal small-scale water supply system in resolving drinking water shortages in peri-urban Dar Es Salaam, Tanzania. Appl. Geogr. 2018, 92, 112–122. [Google Scholar] [CrossRef]
- Cairncross, S. Pit latrine emptying behavior and demand for sanitation services in Dar Es Salaam, Tanzania. Int. J. Environ. Res. Public Health 2015, 12, 2588–2611. [Google Scholar]
- Okurut, K.; Charles, K.J. Household demand for sanitation improvements in low-income informal settlements: A case of East African cities. Habitat Int. 2014, 44, 332–338. [Google Scholar] [CrossRef]
- Kirama, A.; Mayo, A.W. Challenges and prospects of private sector participation in solid waste management in Dar es Salaam City, Tanzania. Habitat Int. 2016, 53, 195–205. [Google Scholar] [CrossRef]
- Katukiza, A.Y.; Ronteltap, M.; Niwagaba, C.B.; Foppen, J.W.A.; Kansiime, F.; Lens, P.N.L. Sustainable sanitation technology options for urban slums. Biotechnol. Adv. 2012, 30, 964–978. [Google Scholar] [CrossRef]
- Gulyani, S.; Bassett, E.M.; Talukdar, D. Living Conditions, Rents, and Their Determinants in the Slums of Nairobi and Dakar. Land Econ. 2012, 88, 251–274. [Google Scholar] [CrossRef]
- Forjaz, J.; Carrilho, J.; Laje, L.; Mazembe, A.; Nhachungue, E.; Battino, L.; Costa, M.; Cani, A.; Trindade, C. Moçambique, melhoramento dos assentamentos informais, análise da situação & proposta de estratégias de intervenção. Maputo Cent. Estud. Desenvolv. Habitat 2006, 1, 60. [Google Scholar]
- O’Keefe, M.; Lüthi, C.; Tumwebaze, I.K.; Tobias, R. Opportunities and limits to market-driven sanitation services: Evidence from urban informal settlements in East Africa. Environ. Urban. 2015, 27, 421–440. [Google Scholar] [CrossRef] [Green Version]
- Peal, A.; Evans, B.; Blackett, I.; Hawkins, P.; Heymans, C. Fecal sludge management (FSM): Analytical tools for assessing FSM in cities. J. Water Sanit. Hyg. Dev. 2014, 4, 371–383. [Google Scholar] [CrossRef] [Green Version]
- National Bureau of Statistics (NBS) (Tanzania). Tanzania Household Budget Survey 2011/12; NBS: Dar es Salaam, Tanzania, 2014; p. 201. [Google Scholar]
- Mbiggo, I.; Ssemwogerere, K. “An Investigation into Fire Safety Measures in Kampala Slums.” A Case of Katanga-Wandegeya. Civ. Environ. Res. 2018, 10, 30–34. [Google Scholar]
- Marx, B.; Stoker, T.; Suri, T. The Economics of Slums in the Developing World. J. Econ. Perspect. 2013, 27, 187–210. [Google Scholar] [CrossRef] [Green Version]
- Holcomb, D.A.; Knee, J.; Sumner, T.; Adriano, Z.; de Bruijn, E.; Nalá, R.; Cumming, O.; Brown, J.; Stewart, J.R. Human fecal contamination of water, soil, and surfaces in households sharing poor-quality sanitation facilities in Maputo, Mozambique. Int. J. Hyg. Environ. Health 2020, 226, 113496. [Google Scholar] [CrossRef]
- Jenkins, P. Emerging Urban Residential Land Markets in Post-Socialist Mozambique The Impact on the Poor and Alternatives to Improve Land Access and Urban Development; an Action-Research Project in Peri-Urban Areas of Maputo; School of Planning and Housing, Ediburgh College of Art, Heriot-Watt University: Edinburgh, UK, 2001. [Google Scholar]
- Mottelson, J.; Venerandi, A. A Fine-Grain Multi-Indicator Analysis of the Urban Form of Five Informal Settlements in East Africa. Urban Sci. 2020, 4, 31. [Google Scholar] [CrossRef]
- Angel, S. Housing Policy Matters: A Global Analysis; Oxford University Press: Oxford, UK, 2000; ISBN 0-19-535032-4. [Google Scholar]
- Andersen, J.E.; Jenkins, P.; Nielsen, M. Who plans the African city? A case study of Maputo: Part 2—Agency in action. Int. Dev. Plan. Rev. 2015, 37, 423–443. [Google Scholar] [CrossRef]
Figure 1.
Informal land use within the administrative boundaries of the four examined cities.

Figure 2.
Orthophotos and vectorized maps of case study areas.

Figure 3.
Aerial views of case study areas: (a) Hananasif, Dar es Salaam, Tanzania; (b) Katanga, Kampala, Uganda; (c) Kibera, Nairobi, Kenya; and (d) Maxaquene A, Maputo, Mozambique.
Figure 3.
Aerial views of case study areas: (a) Hananasif, Dar es Salaam, Tanzania; (b) Katanga, Kampala, Uganda; (c) Kibera, Nairobi, Kenya; and (d) Maxaquene A, Maputo, Mozambique.

Figure 4.
Graphic representation of the Hypothesis on Informal Land Supply, Livelihood, and Urban Form in Cities in sub-Saharan Africa: 1: governance practice, 2: market mechanisms, and 3: household conditions and urban form.
Figure 4.
Graphic representation of the Hypothesis on Informal Land Supply, Livelihood, and Urban Form in Cities in sub-Saharan Africa: 1: governance practice, 2: market mechanisms, and 3: household conditions and urban form.


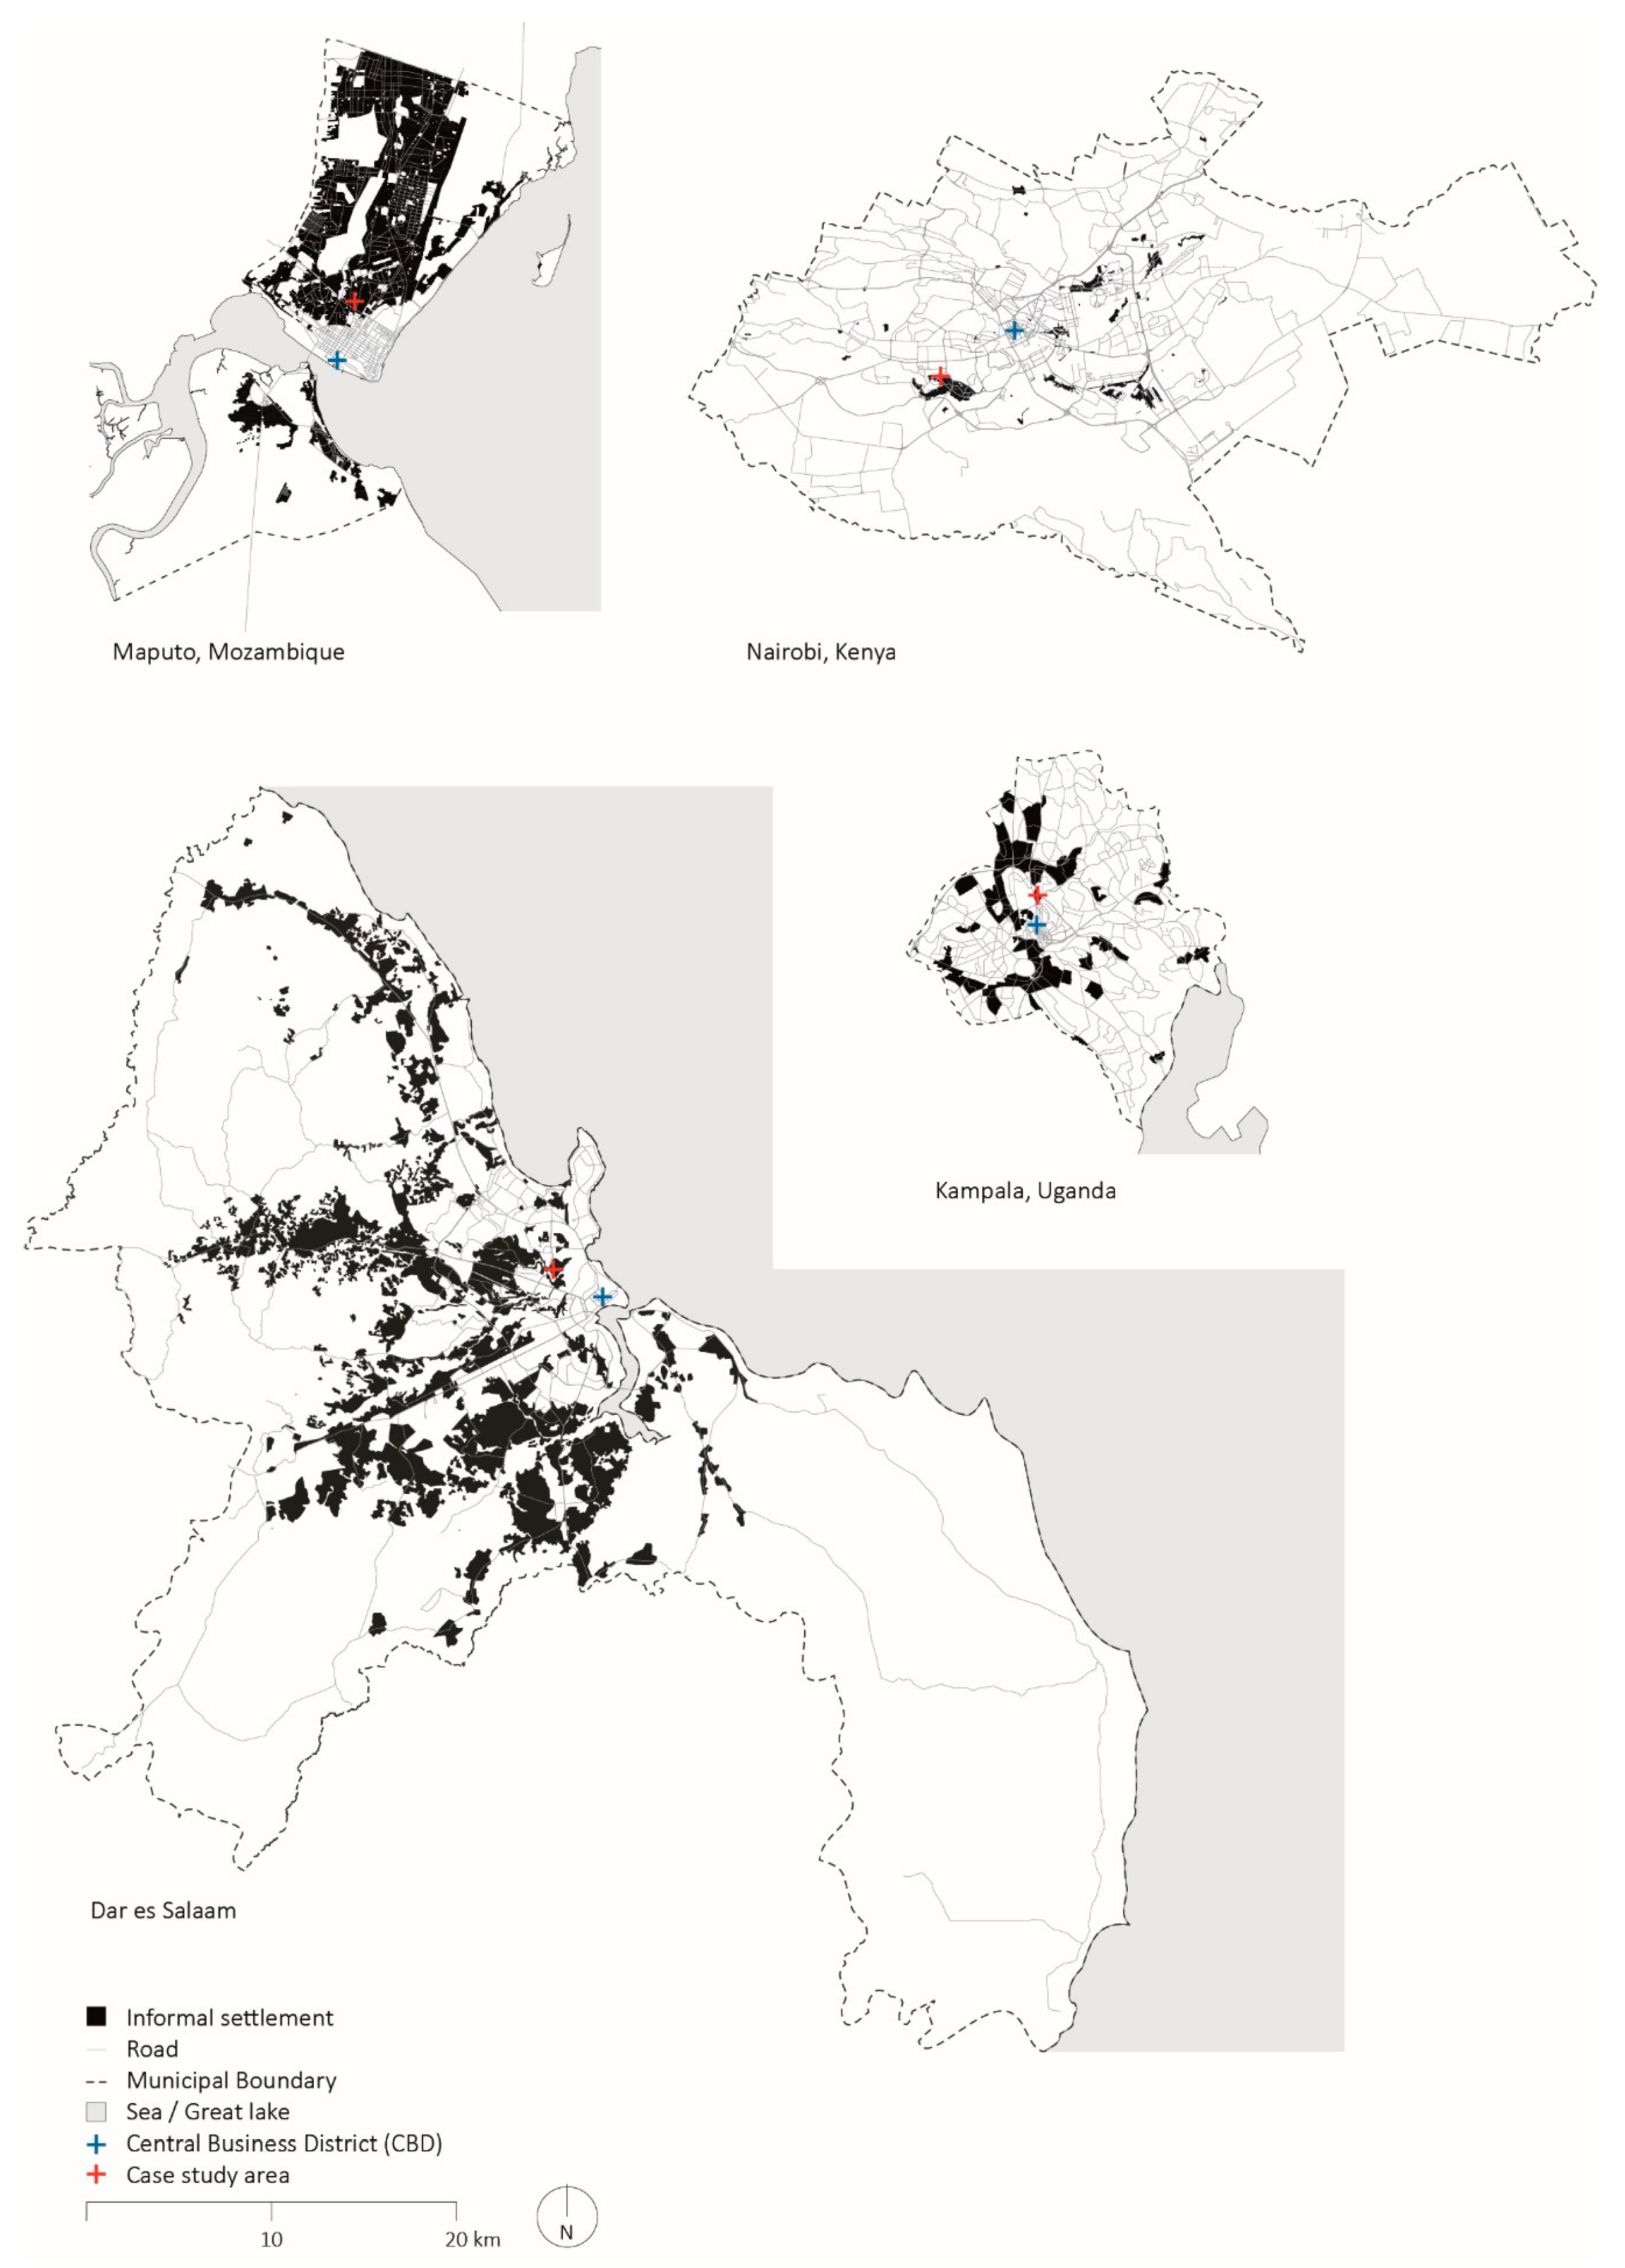
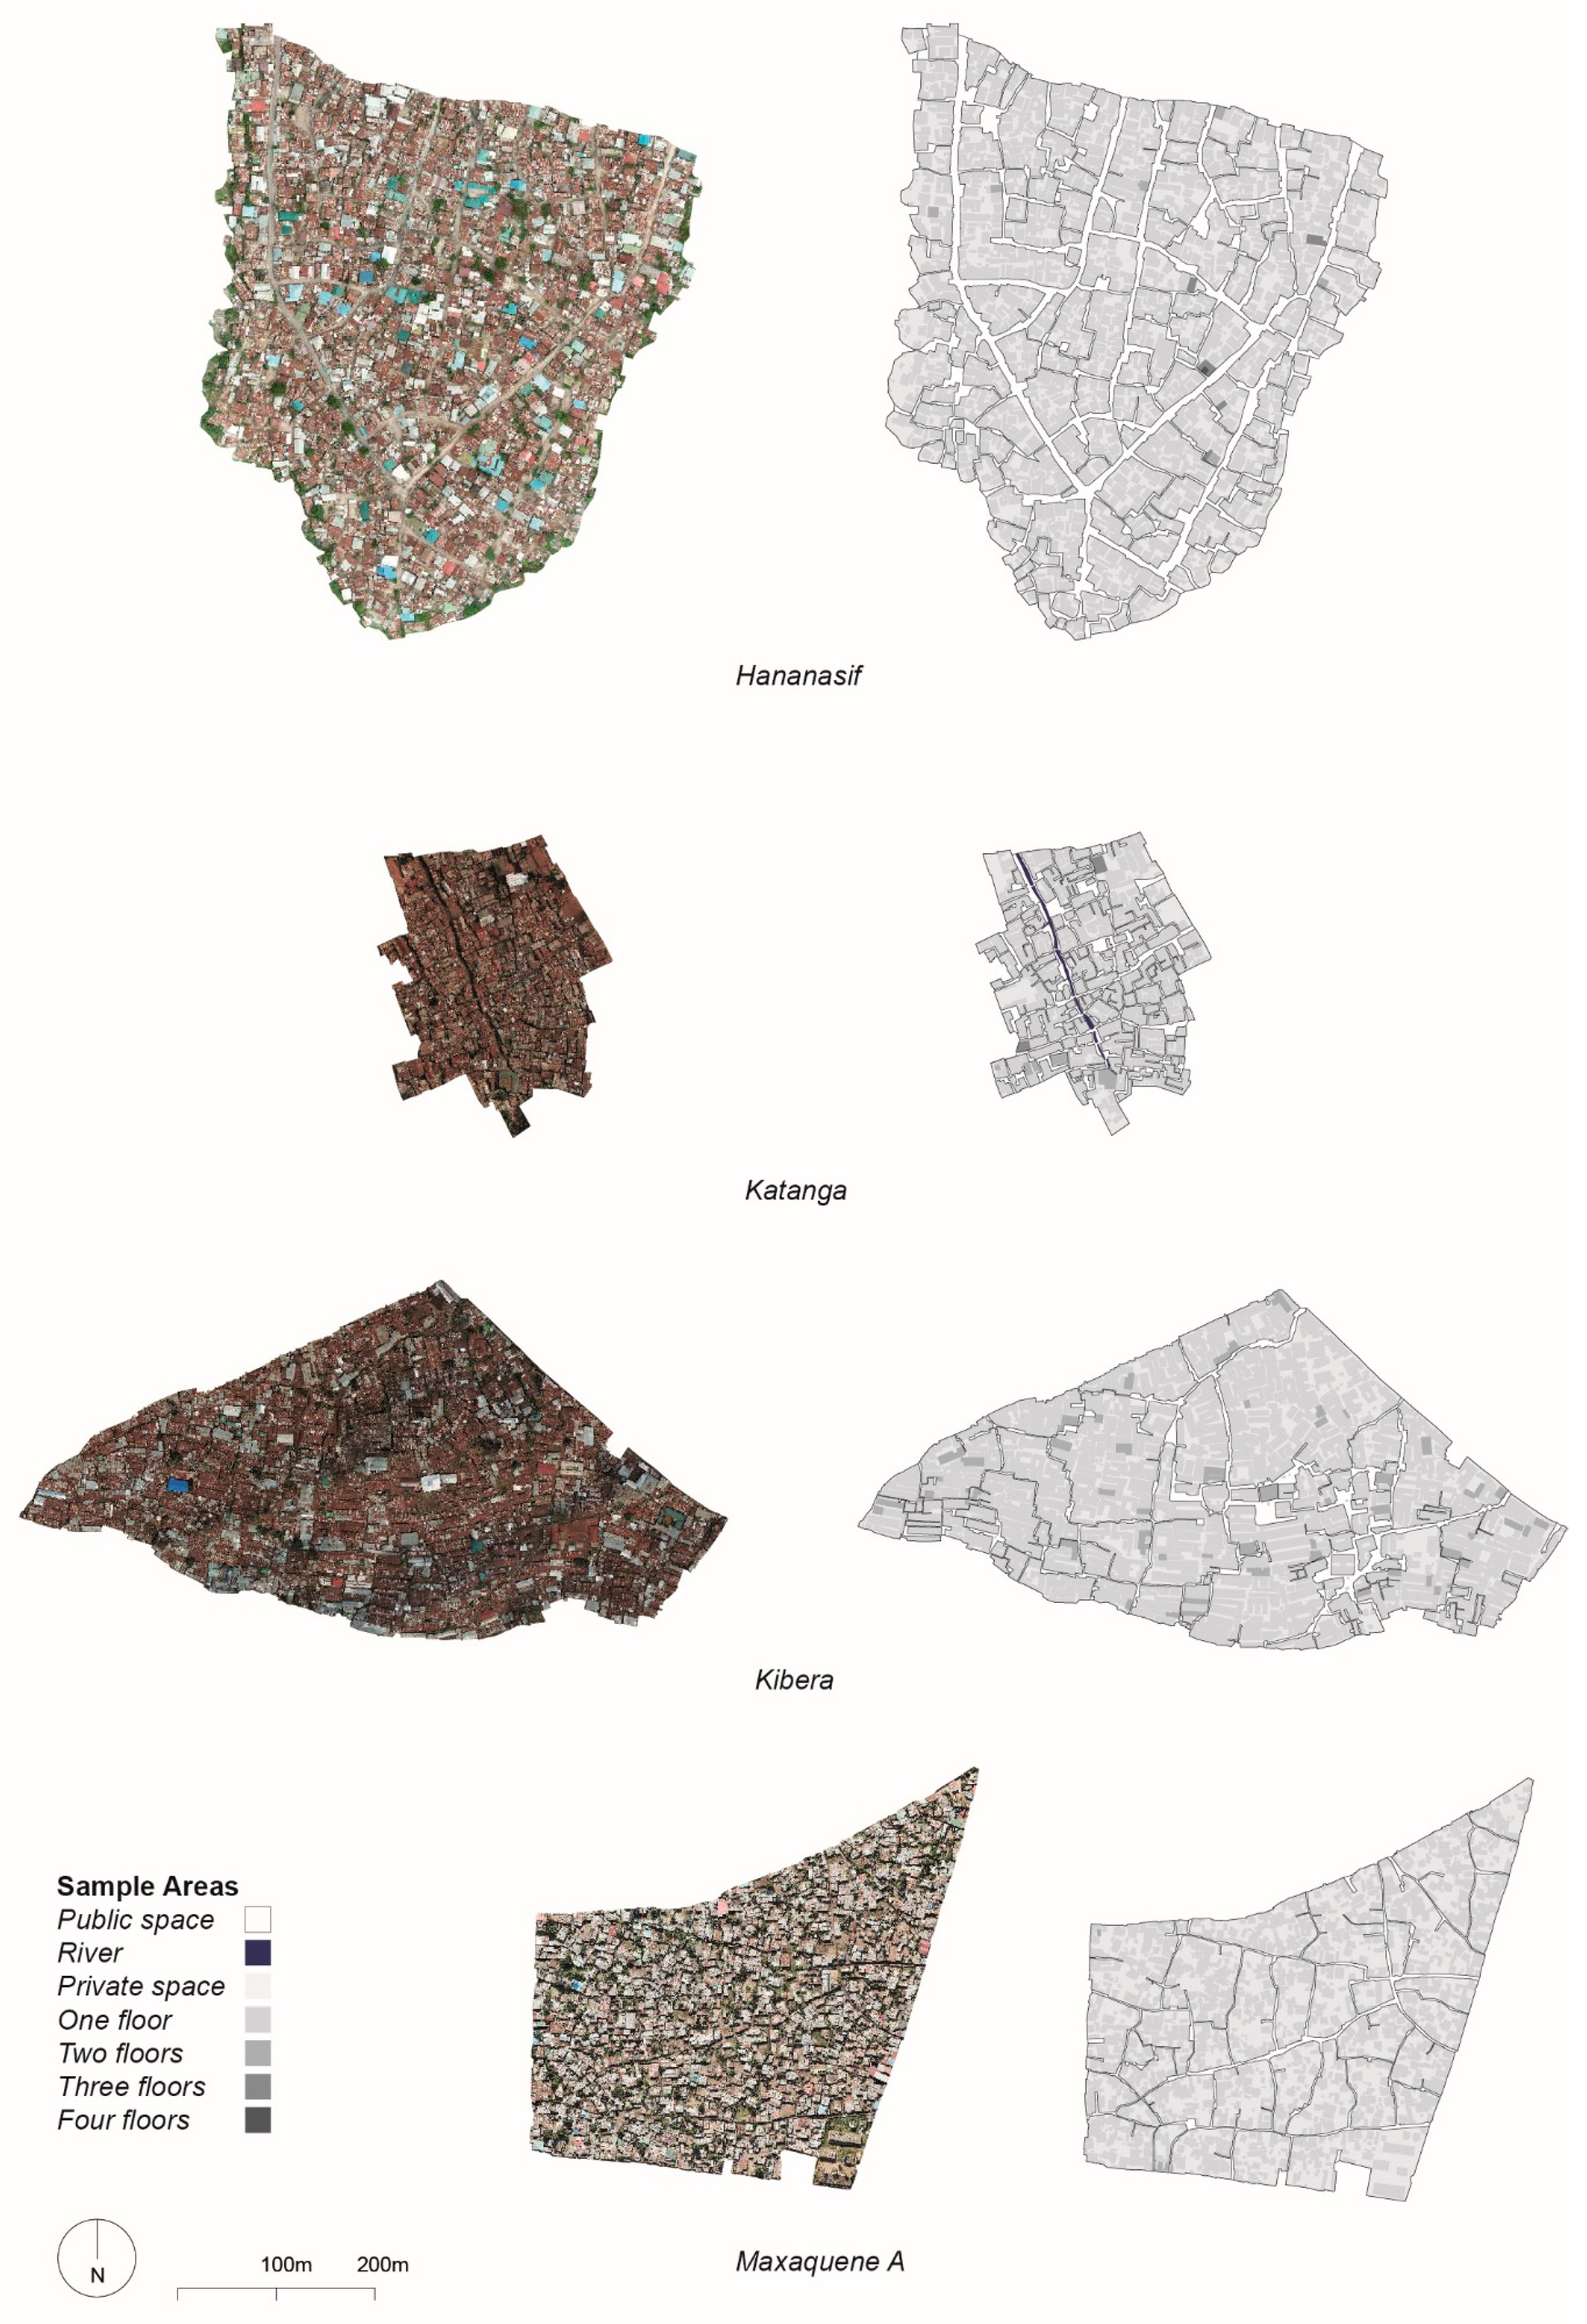
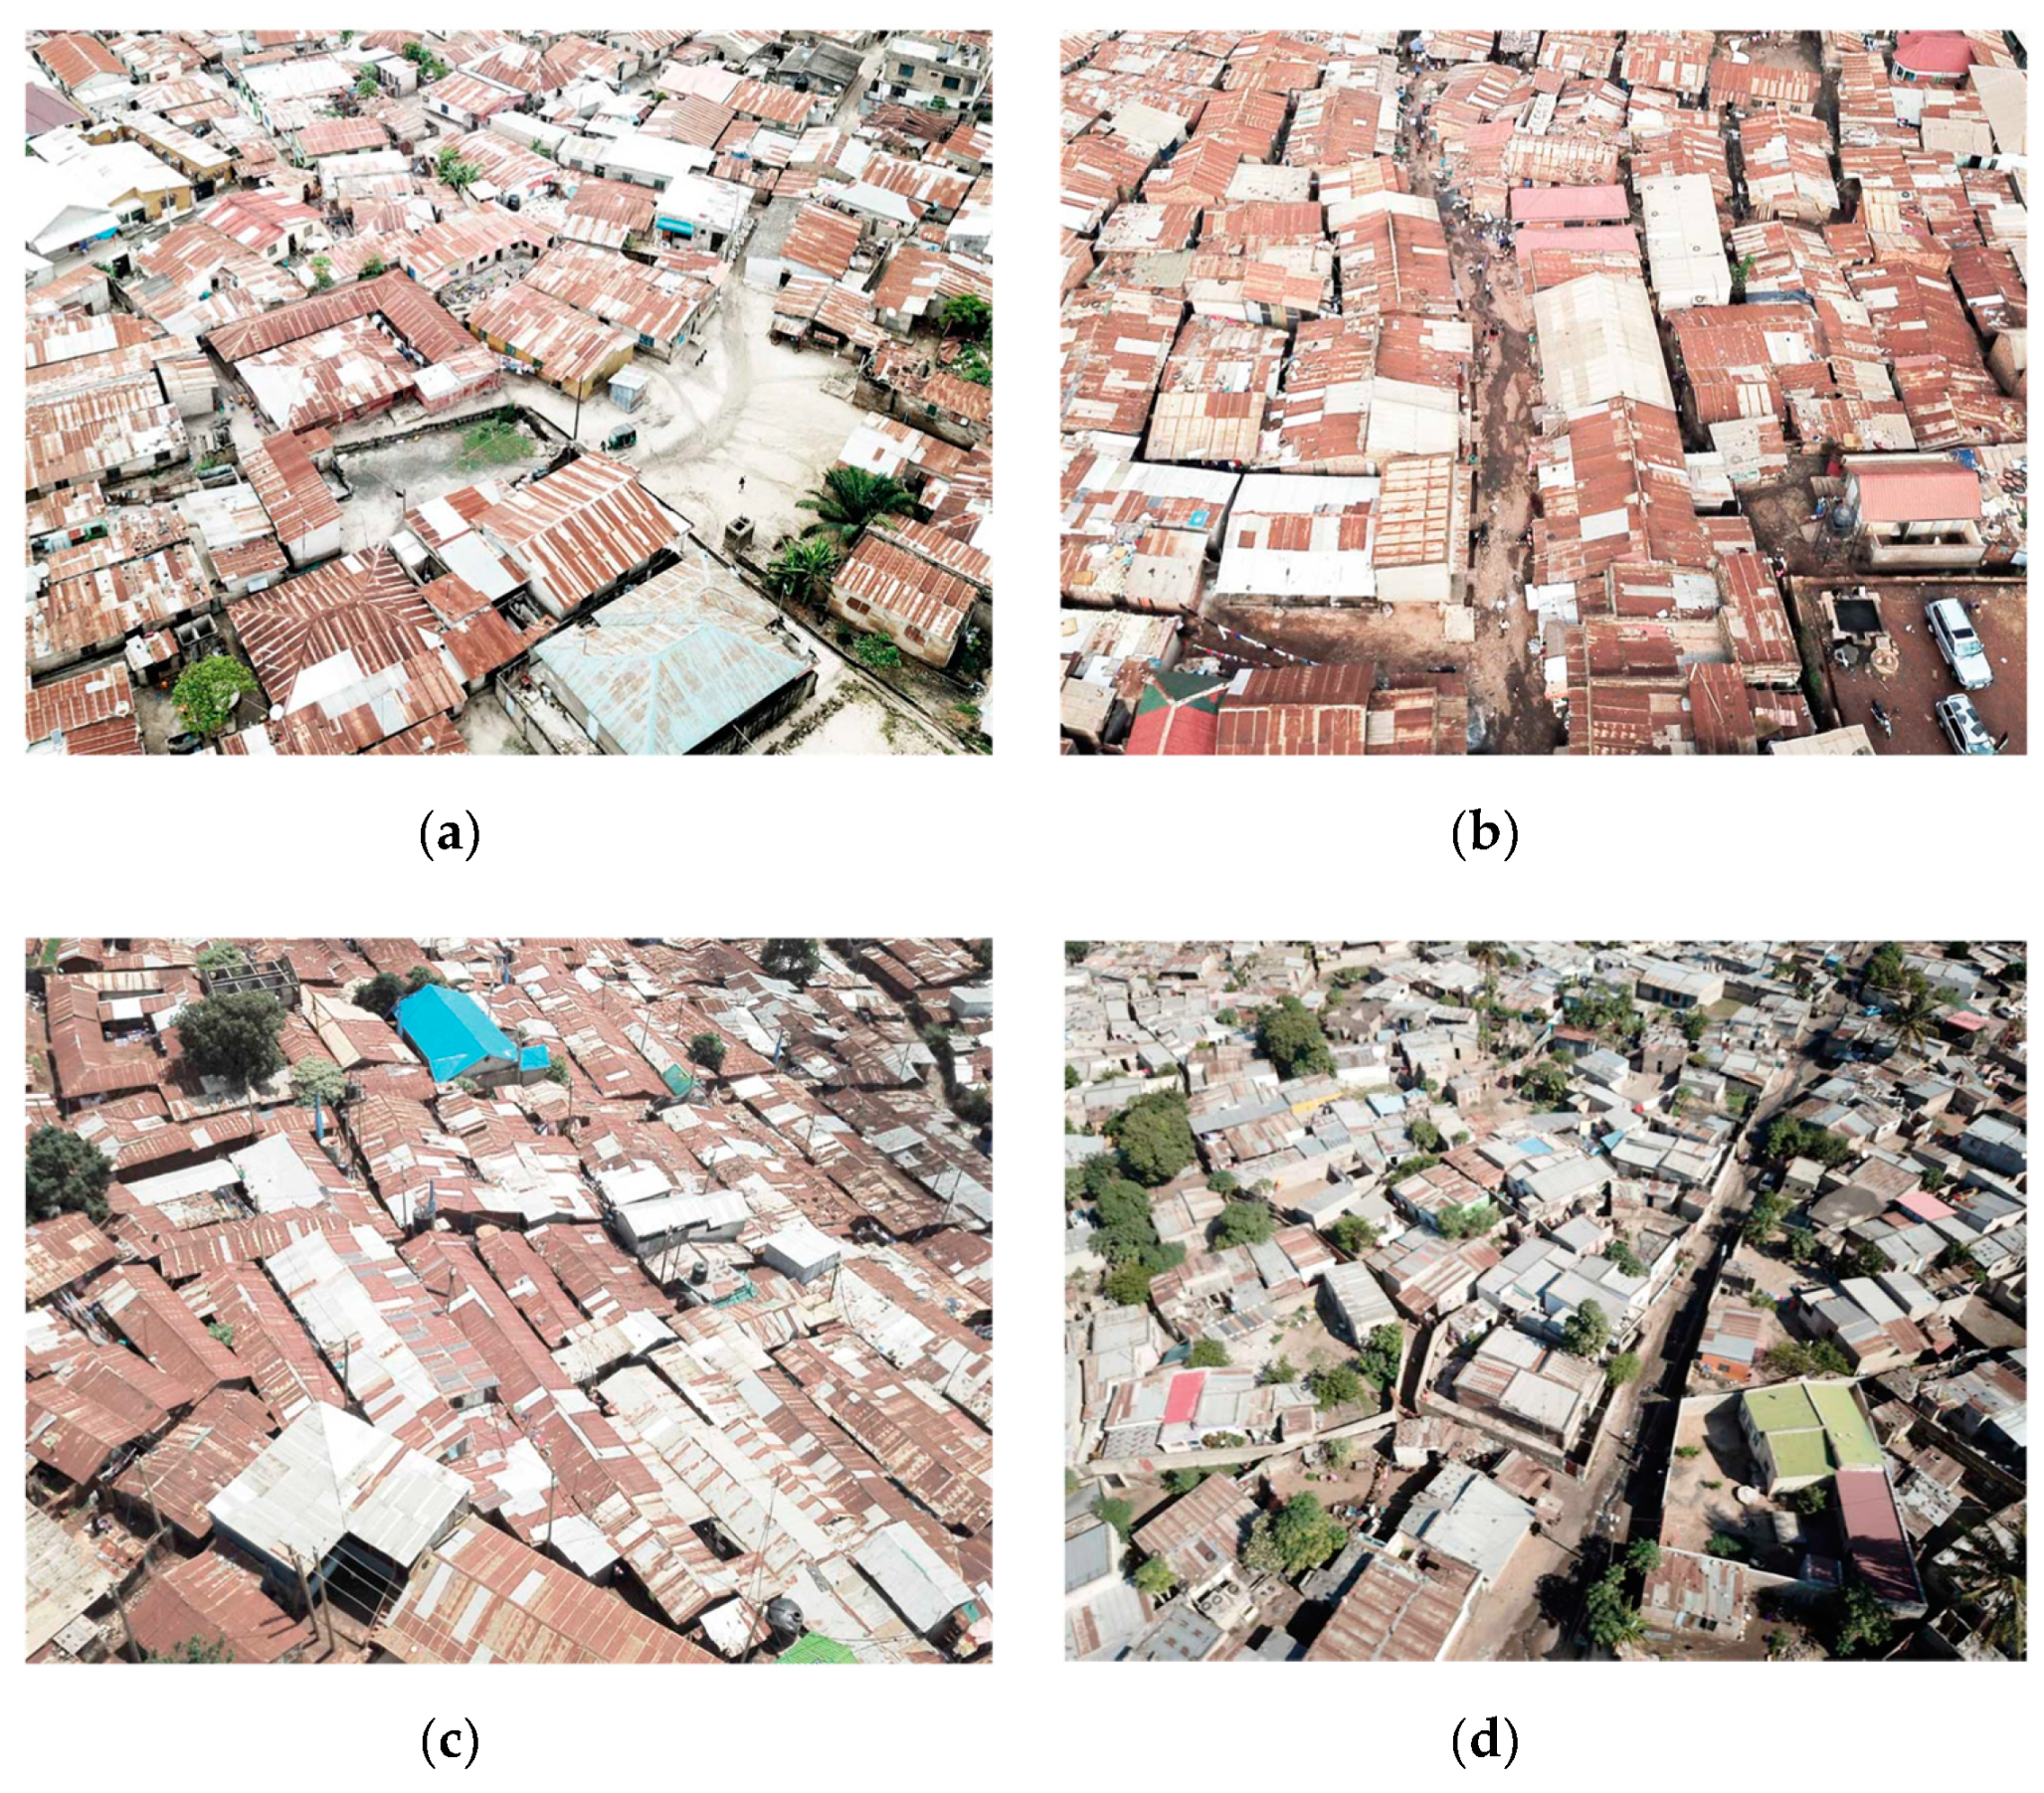
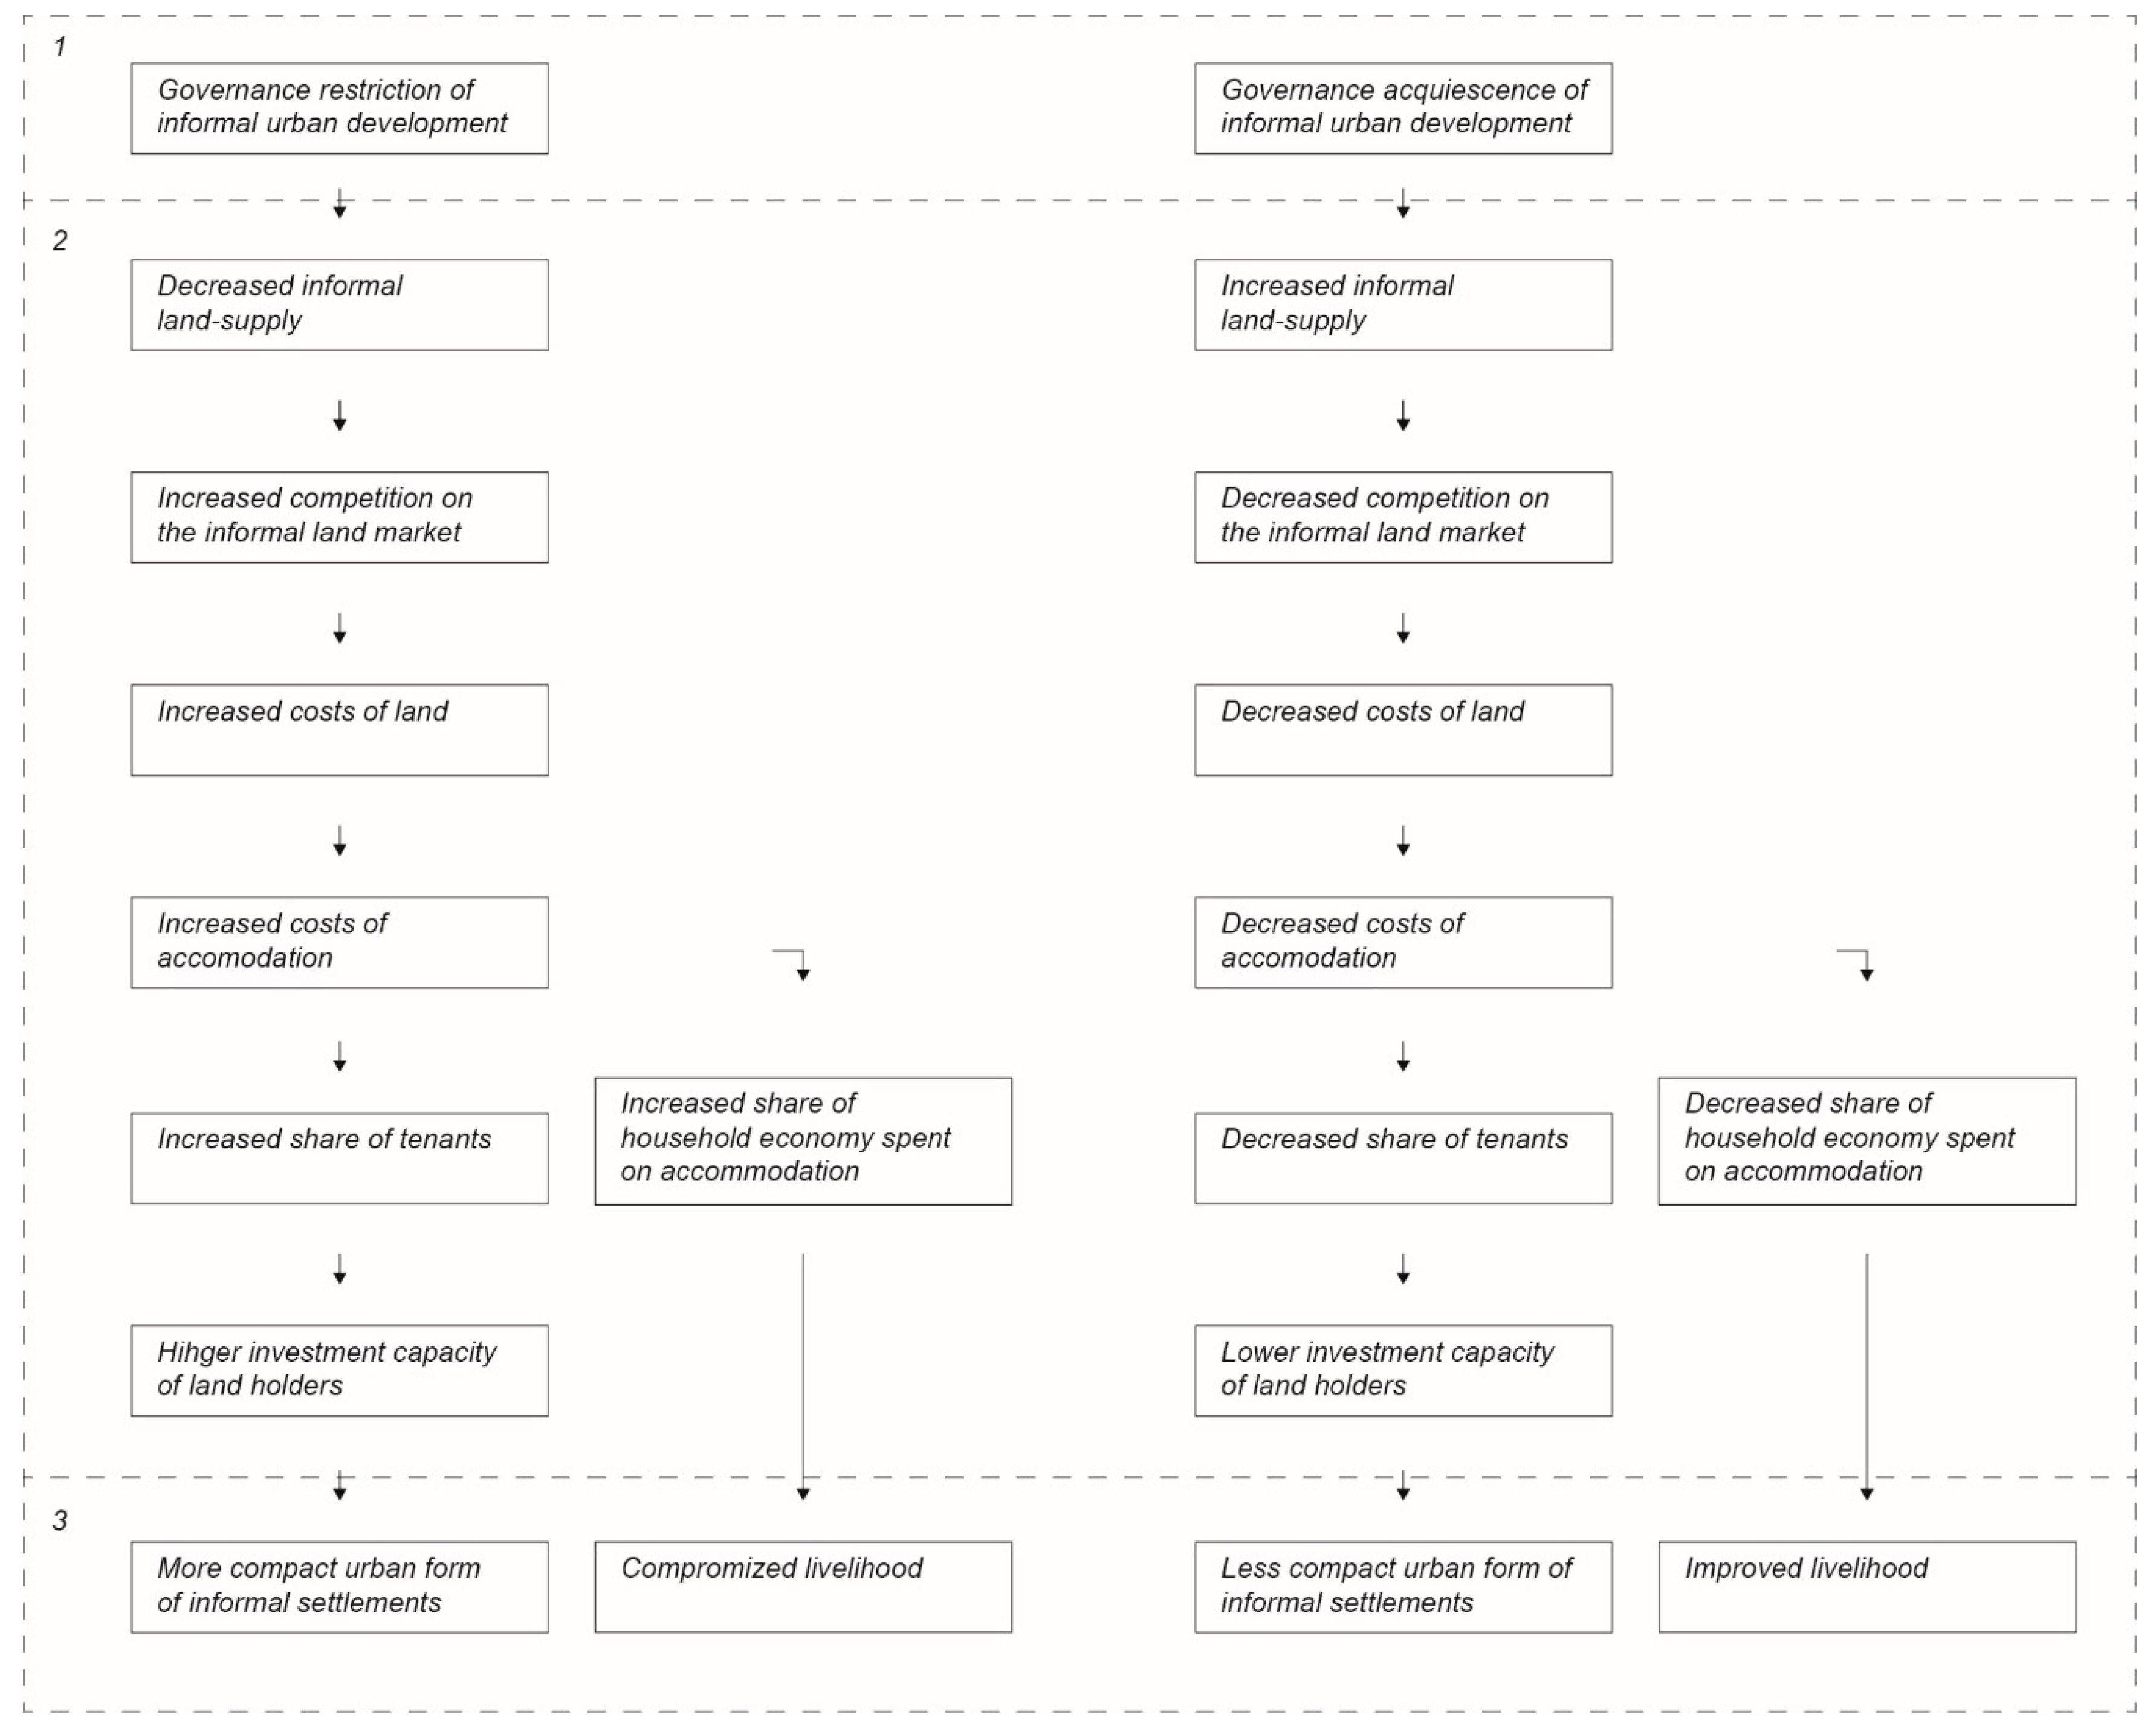
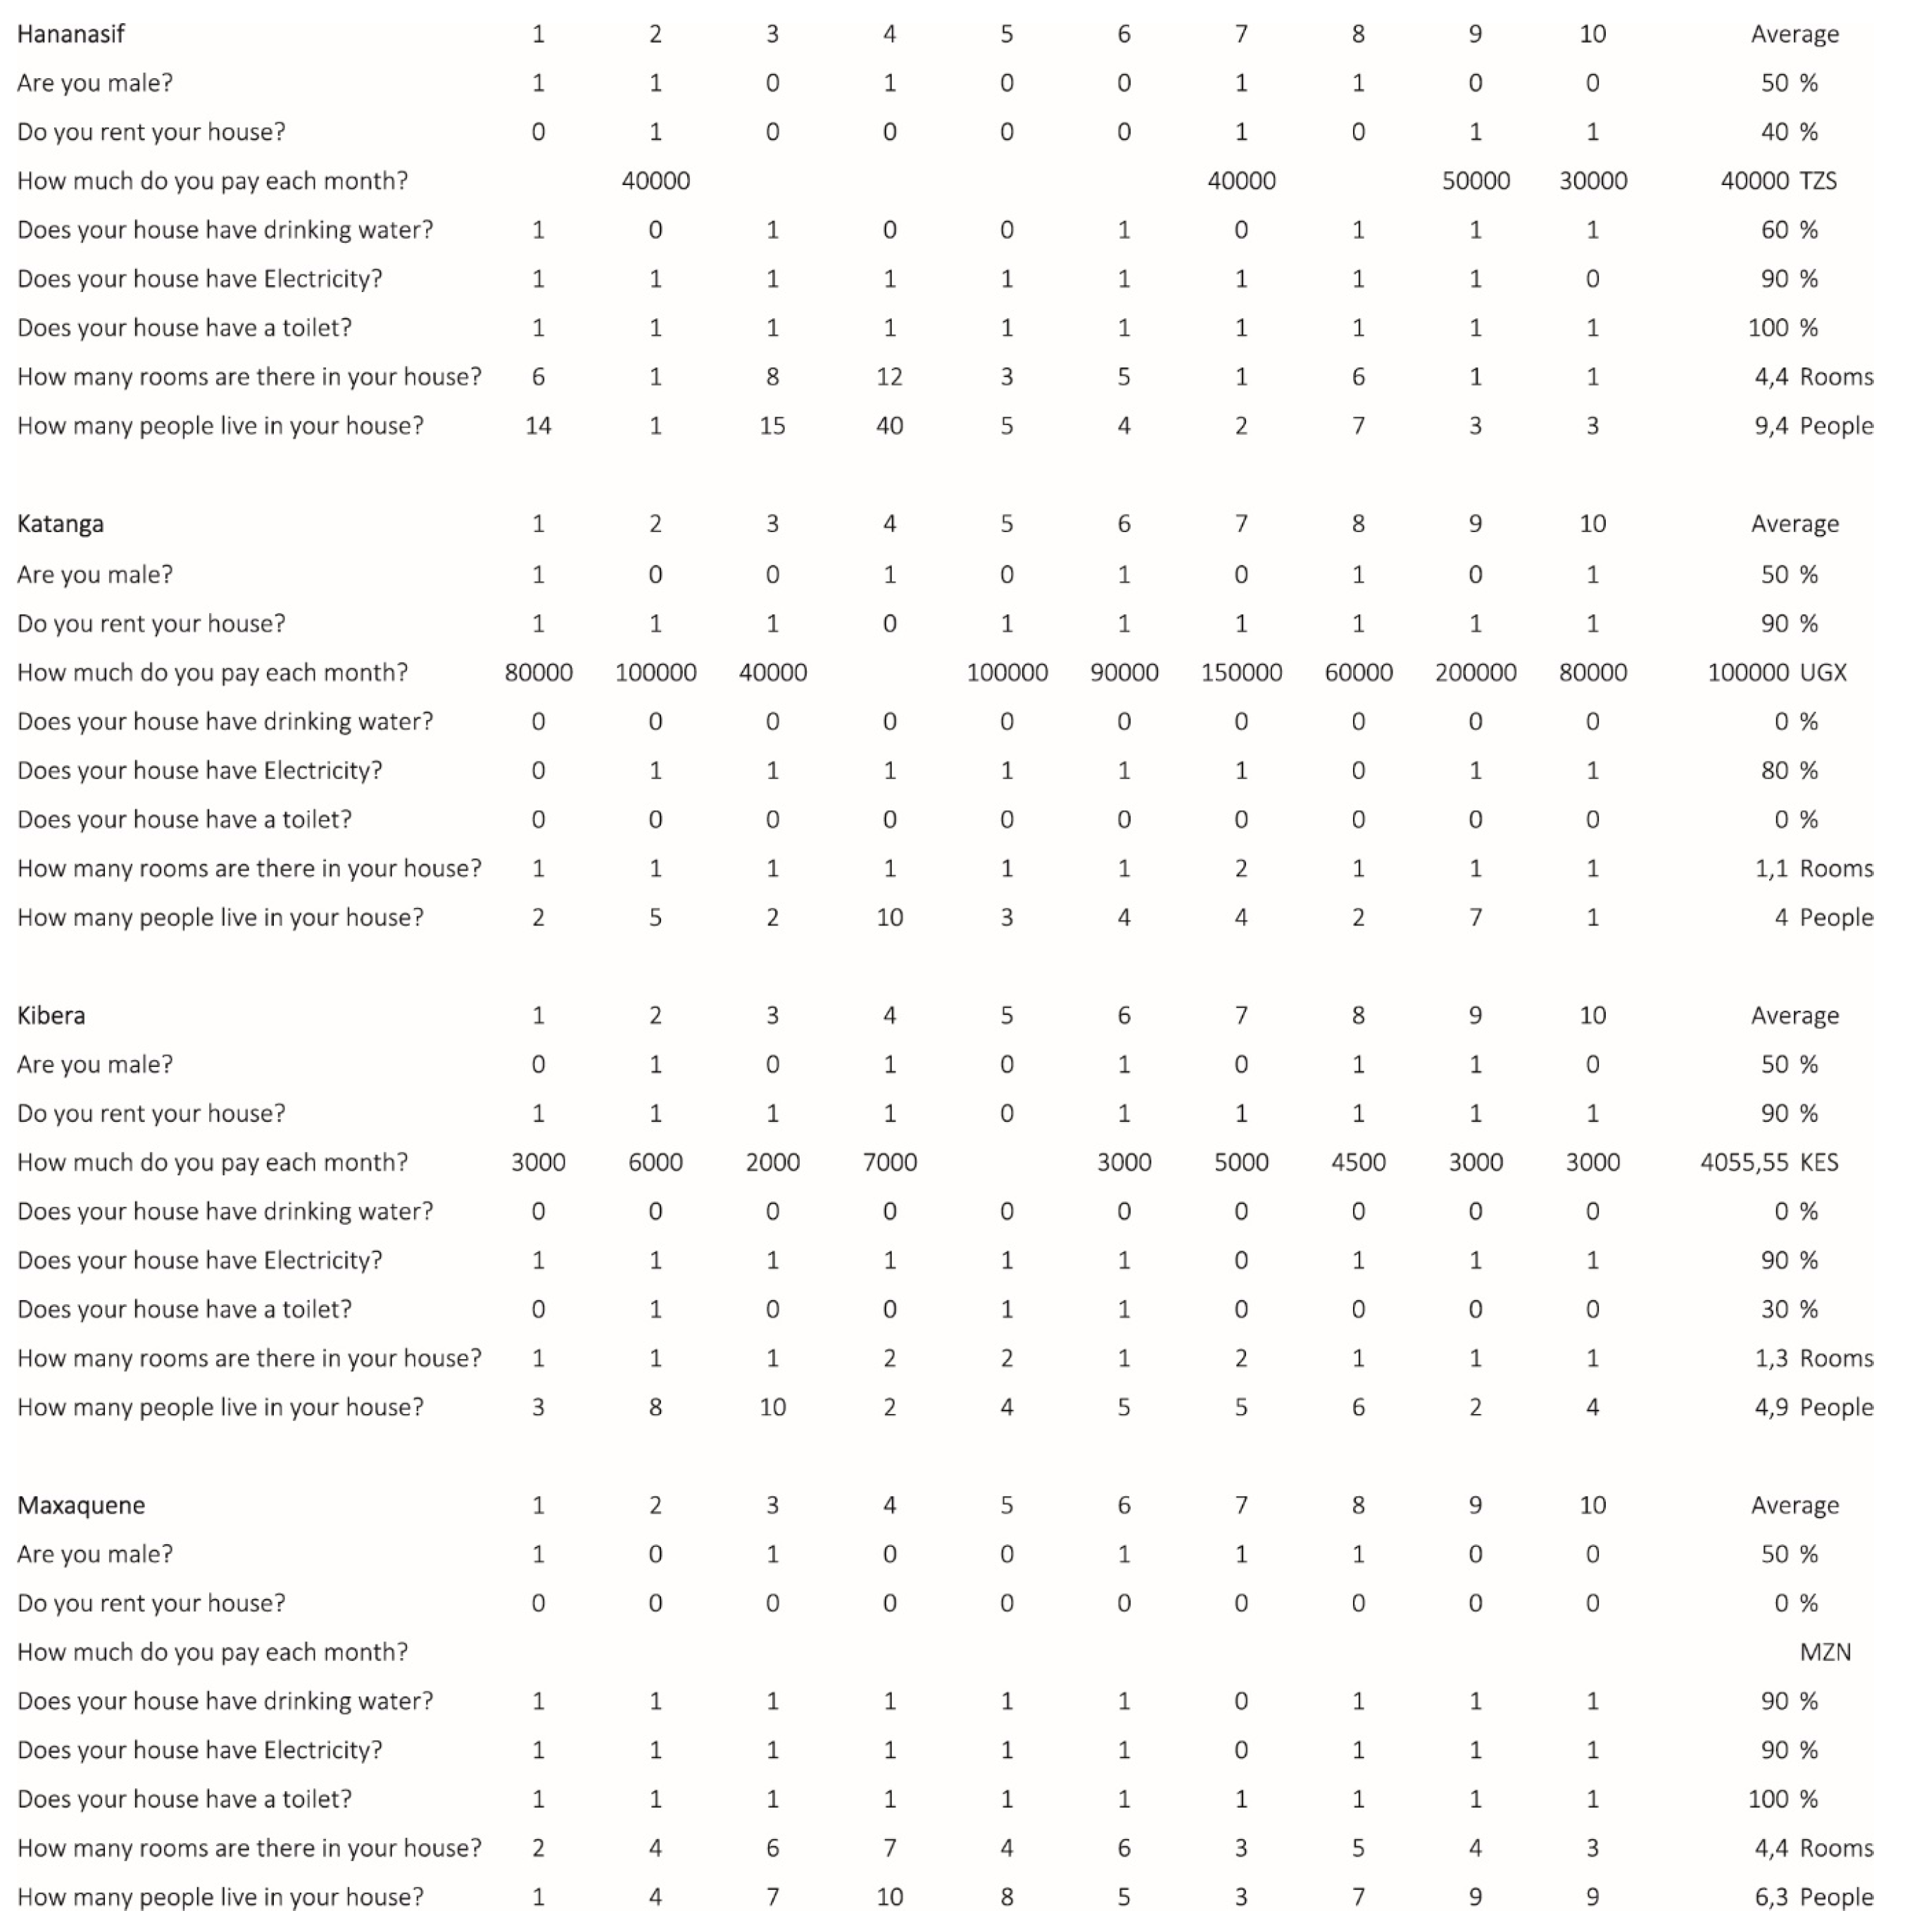
Table 1.
Interview data.
| Hananasif | Katanga | Kibera | Maxaquene A | Average | |
|---|---|---|---|---|---|
| Tenants (%) | 40.00 | 90.00 | 90.00 | 0.00 | 55.00 |
| Cost of rental household (USD/month) | 17.20 | 27.12 | 40.15 | - | 28.16 |
| Dwelling size (rooms) | 4.40 | 1.10 | 1.30 | 4.40 | 2.80 |
| Household size (people) | 9.40 | 4.00 | 4.90 | 6.30 | 6.15 |
| People per room (people/rooms) | 2.13 | 3.64 | 3.77 | 1.43 | 2.74 |
| Household access to water (%) | 60.00 | 0.00 | 0.00 | 90.00 | 37.50 |
| Household access to sanitation (%) | 100.00 | 0.00 | 30.00 | 100.00 | 57.50 |
| Tenants (%) | 40.00 | 90.00 | 90.00 | 0.00 | 55.00 |
Table 2.
Tenant/homeowner differentiated interview data.
| Hananasif | Katanga | Kibera | Maxaquene A | Average | |
|---|---|---|---|---|---|
| Tenant dwelling size (rooms) | 1 | 1.11 | 1.22 | - | 1.11 |
| Homeowner dwelling size (rooms) | 6.67 | 1 | 2 | 4.4 | 3.52 |
| Tenant household size (people) | 2.25 | 3.33 | 5 | - | 3.53 |
| Homeowner household size (people) | 14.17 | 10 | 4 | 6.3 | 8.62 |
| Tenant people per room (people/rooms) | 2.25 | 3 | 4.09 | - | 3.11 |
| Homeowner people per room (people/rooms) | 2.13 | 10 | 2 | 1.43 | 3.89 |
| Tenant access to sanitation (%) | 100 | 0 | 22.22 | - | 40.74 |
| Homeowner access to sanitation (%) | 100 | 0 | 100 | 100 | 75.00 |
| Tenant access to water (%) | 50 | 0 | 0 | - | 16.67 |
| Homeowner access to water (%) | 66.67 | 0 | 0 | 90 | 39.17 |
| Tenant access to electricity (%) | 75 | 88.89 | 88.89 | - | 84.26 |
| Home owner access to electricity (%) | 100 | 100 | 100 | 90 | 97.50 |
Table 3.
Household conditions based on the literature review.
| Hananasif | Katanga | Kibera | Maxaquene A | |
|---|---|---|---|---|
| Share of tenants | Moderate [54,55] | High [56] | High [51] | Low [36] |
| Share of households with access to water | Moderate/high [54,57] | Low [58] | Low [59] | High [60] |
| Share of households with access to sanitation | High [55] | Low [56,61] | Low [61] | High [62] |
| Share of households with overcrowding | Moderate [63] | High [64] | High [65] | Low [66] |
Table 4.
Indicators of urban form for the four surveyed areas.
| Hananasif | Katanga | Kibera | Maxaquene | |
|---|---|---|---|---|
| FAR, Floor Area Ratio | 0.53 | 0.65 | 0.75 | 0.47 |
| PSR, Public Space Ratio | 0.19 | 0.22 | 0.10 | 0.07 |
| GSI, Ground Space Index | 0.53 | 0.63 | 0.71 | 0.47 |
| AVB, Average Block Size (m2) | 1187 | 329 | 2262 | 2812 |
| SAVR, Surface Area to Volume Ratio | 0.80 | 0.79 | 0.69 | 0.89 |
| ASW, Average Street Width (m) | 3.92 | 2.06 | 2.52 | 1.99 |
Publisher’s Note: MDPI stays neutral with regard to jurisdictional claims in published maps and institutional affiliations. |
© 2020 by the author. Licensee MDPI, Basel, Switzerland. This article is an open access article distributed under the terms and conditions of the Creative Commons Attribution (CC BY) license (http://creativecommons.org/licenses/by/4.0/).
Share and Cite
MDPI and ACS Style
Mottelson, J. A New Hypothesis on Informal Land Supply, Livelihood, and Urban Form in Sub-Saharan African Cities. Land 2020, 9, 435. https://doi.org/10.3390/land9110435
AMA Style
Mottelson J. A New Hypothesis on Informal Land Supply, Livelihood, and Urban Form in Sub-Saharan African Cities. Land. 2020; 9(11):435. https://doi.org/10.3390/land9110435
Chicago/Turabian StyleMottelson, Johan. 2020. "A New Hypothesis on Informal Land Supply, Livelihood, and Urban Form in Sub-Saharan African Cities" Land 9, no. 11: 435. https://doi.org/10.3390/land9110435
Note that from the first issue of 2016, this journal uses article numbers instead of page numbers. See further details here.