Article

The Influence of Innovation Resources in Higher Education Institutions on the Development of Sci-Tech Parks’ Enterprises in the Urban Innovative Districts at the Stage of Urbanization Transformation

1
Department of Architecture, Zhejiang University, Hangzhou 310058, China
2
International Center for Architecture & Urban Development Studies, Zhejiang University, Hangzhou 310058, China
3
China Institute for New Urbanization Studies, Zhejiang University, Hangzhou 310058, China
4
Department of Regional and Urban Planning, Zhejiang University, Hangzhou 310058, China
*
Author to whom correspondence should be addressed.
Land 2020, 9(10), 396; https://doi.org/10.3390/land9100396
Submission received: 16 September 2020 / Revised: 3 October 2020 / Accepted: 15 October 2020 / Published: 20 October 2020

Abstract

:
Innovation is an inevitable way to enhance regional competitiveness, promote urbanization and achieve sustainable development. The sci-tech park is one of the main land use types in the construction of a new town and the critical space carriers of urbanization. This study focuses on the correlation between higher education institutions (HEIs) innovation and sci-tech enterprises (STEs) development, and the Hangzhou West Hi-tech Corridor as a case study. Innovation indicators of HEIs related to teaching staff, talent cultivation, scientific research quality, academic influence, and university-enterprise cooperation, as well as development indicators of STEs related to aggregation degree, development level, and innovation level are selected. The results show that HEI innovation is significantly positively correlated with STE development. The number of senior titled teachers, average number of citations per paper, and number of invested enterprises exhibit a strong positive correlation with STE development indicators. Regarding the correlation between HEI innovation and STE development, academic research HEIs and professional application HEIs are stronger than vocational skill HEIs. This study is conducive to improving land use efficiency and a sustainable development level of urban innovative districts. Suggestions are provided to support the researches and practices of urban innovative spatial planning and advancement of the urbanization process.

1. Introduction

Over the past few decades, urbanization has swept the world and become one of the most remarkable phenomena in the process of global modernization [1]. As the largest developing country in the world, China has experienced long-term and sustained ultra-high speed economic growth and large-scale urbanization since the implementation of reform and opening up in 1978 [2,3,4]. Chinese cities host many important innovative companies and their international connectivities are significantly growing in the world economy [5,6]. From 1989 to 2019, the urbanization rate rose from 26.21% to 60.60% [7], the newly added urban population was about 550 million, and the newly added urban built-up area was more than four times of the original urban area [8]. In other words, more than 80% of area of China’s urban has been built in the past 30 years. Among them, the construction of various forms of industrial parks for the purpose of regional economic development is an important component of urbanization [9,10].
The development of industrial parks and the development of urbanization are synchronized [11]. From the initial industrial parks, industrial zones and development zones to the new industrial districts and new industrial cities proposed by some localities, the development of industrial parks has gone through rich forms and a long process [12]. China’s industrial parks have experienced the development of Shenzhen Shekou Industrial zone in the early 1980s [13]; Lujiazui, Zhangjiang Hi-tech Park and Beijing Zhongguancun in the 1990s; and the development of parks in Suzhou, Wuxi, Xi’an and Chengdu since 2000 [14,15]. The scale of the parks has grown from a few square kilometers in the early days to hundreds of square kilometers [16]. Therefore, the development of industrial parks must be paid attention to in the process of urbanization.
In the past, the long-term extensive urbanization process, especially the development and construction of parks, has brought many problems, such as single urban function, blind expansion of land scale, inefficient and waste of land resources, urban landscape and ecological destruction caused by one-sided pursuit of economic growth [17,18,19]. These problems seriously hinder the sustainable development of regional economy and society. Therefore, the original model of extensive expansion at the expense of the environment has slowed. The cities must change from factor-oriented to innovation-oriented in order to break the bottleneck of urban development, promote the new normal of economy and realize sustainable development [20].
China’s urbanization process is at a critical stage of transformation from extensive to intensive. Innovation is the most important factor used to promote sustainable economic development and social progress in the era of the knowledge economy, and it is the core competitiveness feature that is pursued by cities [21]. With the transformation of national economic development to innovation leading, the practice and research of park development in China’s future new urbanization process have entered a new stage. The innovation of science and technology has enabled the development of innovation and entrepreneurship, as well as that of industrial transformation and upgrading [22]. Additionally, it has spawned a variety of new urban spatial development models. The construction of urban innovative space is responsible for the success of urban sustainable innovation-driven development [21]. As a significant part of urban innovative space, sci-tech parks have gathered a large number of enterprises developing science and technology innovation industries [23]. They are the main components of new urbanization and the major innovation-driven carriers of urban development [24].
The development of sci-tech parks is inseparable from the strong support of the elements of innovation [25]. As major sources of the factors of innovation, including intelligence, technology, and talent, HEIs provide inexhaustible motive force for the development of STEs; thus, they become an important factor affecting the development of sci-tech industries in a nation or region [26]. Additionally, industrial parks have become the main location at which universities and scientific research institutions develop advanced technology and promote the transformation efficiency of their scientific research achievements [27]. These factors have greatly enhanced the mutual influence and cooperation between HEIs and enterprises. Throughout the internationally successful case of sci-tech parks, such as Stanford University and the Silicon Valley, the MIT industrial cluster and the 128 highway in Boston, these parks are generally located close to universities, colleges, scientific research institutions, and other intellectual resources [28]. In this way, these institutions can provide strong intellectual support for the development of sci-tech parks and cities. Additionally, the strategic location of these parks can enable a close integration of “industries, universities, and research”, gradually forming a growth chain of innovation and industry clusters [29].
Innovation is the primary driving force behind the development and strategic support of the construction of a modern economic system [30]. Hangzhou, which is the capital of Zhejiang Province, has been hindered by a lack of high-quality higher education resources in the past. There is still a large gap in terms of these resources between Hangzhou and domestic first-tier cities such as Beijing and Shanghai, as well as between Hangzhou and Nanjing, Wuhan, and Xi’an [31]. During recent years, Hangzhou has been vigorously developing its higher education system. In addition to supporting the development of local universities, it has also introduced a number of high-level universities and research institutes that have large amounts of influence both domestically and abroad. In June 2020, Zhejiang Province put forward a proposal entitled “Building a High-Level Innovative Province” [32]. As an important hub for the integrated development of the Yangtze River Delta, Hangzhou has obvious advantages in terms of resource agglomeration. It is a national independent innovation demonstration zone and a hotspot for innovation and entrepreneurship; additionally, it has become one of the most developed cities in China’s “Internet Plus” emerging industries [33].
The Hangzhou West Hi-tech Corridor (hereinafter referred to as the “the Corridor”) is a key center supporting Hangzhou’s exports of scientific and technological innovations, model innovations, and product innovations to the world, and it is a strategic platform for major innovation transformation in Zhejiang Province [34]. It contains various types of sci-tech innovation establishments, such as headquarters, business incubation parks, and characteristic towns. A group of world-class innovative organizations, including Alibaba (an Internet giant), Zhejiang University (the world’s leading university), Westlake University (an international high-level research university), and Zhijiang Laboratory (a national innovative cutting-edge scientific research institution), are located in the Corridor [35]. It is an innovative location with diverse urban functions. The Corridor is currently in its initial stage of innovation and cultivation. It has accumulated a number of higher education resources, scientific research institutions, innovation platforms, science and technology enterprises, and other elements of innovation. The Corridor has emerged as an embryonic form of a new sci-tech city with active innovation and entrepreneurship. This area provides a setting that is well suited to the study of the correlation between HEI innovation and STE development.
Sci-tech parks are main land use types in the construction of new town and important space carriers of urbanization. This study focuses on the development of sci-tech parks in urban innovative districts, and aims to address the issue of urban land use and development in the process of urbanization under the background of innovation driving. The Hangzhou West Hi-tech Corridor, which has a large number of science and innovation parks and various types of HEIs, is selected as the research area. This study quantitatively analyzes the correlation between HEIs and the development of STEs in urban innovation districts and tries to explore the influence of different innovation resources in HEIs on the development of STEs. In the key stage of urbanization transformation from factor-oriented to innovation-oriented, this study is conducive to optimize the allocation of innovation resources in urban innovative districts and improve regional comprehensive innovation level. This study also provides reference for the interactive development of industry-university-research cooperation between HEIs and STEs, and guidance for the practice of sci-tech innovation parks in urban innovation districts.

2. Review of the Relevant Theories and Studies

Innovation is a key driving force for regional economic growth and urban sustainable development. The urban innovative districts house much of the innovation generating high-tech and creative industries, and they are new space carriers for innovation-driven and concentrated development. These districts, as a land use type, evolved over time in terms of their functions, features, and spatial characteristics [36]. Scholars had different definitions of urban innovative districts, such as “knowledge and innovation spaces”, “innovation clusters”, “innovation milieu”, and “innovation precincts” [37,38,39,40]. The Brookings Institution of the United States had put forward the concept of “innovation districts” in 2014. Based on the analysis and research of the constructions of global regional innovation systems, the Brookings Institution found that innovation districts have become a new urban space pattern. An innovation district is characterized by intensive technology, active innovation, and supporting facilities such as office buildings, commercial apartments, residential buildings, and retail centers, and presents characteristics such as compactness, convenient transportation, and smooth communication networks [41]. Scholars have studied the concept, connotation, evolution, characteristics, and types of urban innovative space; also, they performed further analysis from the perspectives of industrial structure, functional system, organizational connection, and evaluation [42,43,44]. There are also many successful cases including 22@ Barcelona (Spain), Boston (USA), Macquarie Park (Australia), One-North (Singapore), and Toronto (Canada) innovation districts [41].
The world’s first sci-tech park intended to facilitate academic and industrial cooperation can be traced back to 1951 when Stanford University established the Stanford Industrial Park, thus creating a new model of university-industry cooperation [45]. In the 1980s, following the proposal of Professor Frederick Terman concerning the combination of academia and industry, Stanford Industrial Park grew into Silicon Valley [46]. He argued that a research university can contribute to the economic growth of a region, and the development of a region will inevitably lead to the greater development of a university [47]. This marked the emergence of a new economic phenomenon, namely, that of sci-tech parks, which closely linked HEIs and sci-tech industries [48]. Since then, many countries have conducted research and practice on the cooperative relationship between universities and enterprises. The importance of HEIs as external sources of knowledge regarding enterprise innovation has been widely recognized within academic circles.
Most of the researches on the correlation between HEIs and STEs mainly focuses on industr–university–research cooperation. During the early period, many studies were conducted on the related national conditions, government functions, policies, and legal environments. Davies (1983) believed that the proposal of relevant laws would promote the industry-university-research cooperation [49]. Curien (1989) analyzed the role of EUREKA in the promotion of industry-university-research cooperation and considered this bill played a strong catalyzing role in combining the R&D efforts carried out by both industry and universities in Europe [50].
Since the middle to late 1990s, the research on this topic has become more detailed, and breakthroughs have been made regarding research theories and methods. In terms of theoretical research, many studies have been carried out that examine industry-university-research cooperation from different perspectives, such as the perspectives of national innovation theory, triple helix theory, synergy theory, transaction cost theory, resource dependence theory and game theory. Etzkowitz (2003) used triple helix theory to analyze the influence of the relationship between the government, schools and enterprises on collaborative innovation, and argued that they not only maintain their own functions, but also cooperate closely and coordinate with each other to jointly promote the production, transformation, application and upgrading of knowledge in the process of innovation [51]. Mier Zhang et al. (2001) studied the transaction costs of industry-university-research cooperation and believed that these costs have an important impact on the innovation produced by industry-university-research cooperation [52]. In terms of empirical research, many studies focused on the cooperation entities, cooperation motivation, cooperation mode, management mechanisms, evaluation systems, and influencing factors of industry-university-research cooperation, as well as other aspects of this topic. Annama Ria Inzelt (2004) studied the evolution of the government-industry-university-research relationship in the context of Hungary’s transition process and found out that Hungarian business create research tasks mainly in experimental development and design, in trials and in the tooling-up process [53]. The Organization for Economic Cooperation and Development (1999) divided the models of industry-university-research cooperation into several categories based on cooperation mode and degree, including those corresponding to general research support, informal cooperative research, contractual research, knowledge transfer and training programs, participation in government joint research programs, R&D alliances, and joint research centers [54]. Gray (2000) examined methodological issues relating to the assessment of university–industry collaboration and concluded interim and outcome assessments have received much evaluative scrutiny since 1980, and the modified peer-review technique has most use [55].
Regarding the impact of universities on enterprise innovation, some studies have aimed to explore the factors that influence the formation of cooperative relations between universities and enterprises. Bojun Hou, et al. (2019) discovered that the efficiency of university-industry collaboration is determined by a university’s characteristics, the scientific research funds that it receives from the government, and its regional economic status [56]. Xi Li (2020) explored the impact of university–enterprise cooperation on innovation performance in terms of various factors, and his classified review addresses three main perspectives: cooperation network structure perspective, spatial geography perspective and social factors perspective [57]. Maietta, O. W. (2015) examined the drivers of university-firm R&D collaboration and assessed the determinants of innovation in a low-tech industry [58]. Some scholars generally believe that geographic proximity between universities and companies promotes connections between these organizations. Hervas Oliver, Albors Garrigos (2009) proposed that geographic proximity between HEIs and enterprises is very important for innovation, as it is conducive to the establishment of connections between them and to transfers of knowledge, especially that of tacit knowledge [59]. D’Este et al. (2007) argued that geographical proximity plays a fundamental role in university-industry cooperation [60]. Garcia, Renato et al. (2013) suggested geographic proximity between academic research and firms’ research and development (R&D) facilities matters in fostering university-industry linkages [61]. Maietta, O. W. (2015) studied the driving factors behind school–enterprise cooperative innovation and believed that enterprises within 150 km of a university have more product innovation possibilities than those located far from a university [58]. The importance of geographic proximity to technological dynamism and economic competitiveness has been questioned as the development of science and technology has brought about a reduction in the cost of transportation and an improvement in the speed and quality of long-distance interactions. However, Anselin L et al. (2000) believed that the obscurity of knowledge determines that it must be acquired through direct and interpersonal communication [62]. He also argued that as long as there is a time interval between the generation and coding of knowledge, the primary mechanism of knowledge flow is the interaction between people (2004) [63]. Enterprises can acquire knowledge faster and more successfully through local and person-to-person contact.
HEIs are an important source of knowledge, technology, and other innovation resources (Wei Xu, 2003) [64]. The existing studies on this topic have proposed a number of indicators that reflect the development of HEIs and that of enterprises. Florian Findler et al. (2019) analyzed to what extent sustainability assessment tools are capable of measuring the impacts that HEIs have on Sustainable Development [65]. Donglin Yang and Bo Meng (2010) noted that the index of scientific research funds has become an important index by which to evaluate the comprehensive abilities of universities [66]. Patent data reflect the effective innovation output of organizations, and various studies have verified the reliability of the distribution characteristics and development of innovation activities based on patent data [67]. David (2015) used US patent and citation data to measure the technical relevance between major patent categories and to link them to various knowledge networks [68]. Tartari and Breschi (2012) noted that there is a positive correlation between the share of a researcher’s academic achievements that are published in applied journals and his or her propensity to work with industry partners [69]. Van Looy et al. (2011) argued that the size of a university, measured by the number of academics within it, affects the extent to which that university produces innovation and turns “outwards” [70]. Fontana, R et al. (2006) proposed that the staff size of an enterprise affects its university-industry cooperation and that larger enterprises are often more likely to benefit from scientific research [71]. According to the 2019 “Scoring Standard Rules of National Sci-tech Enterprises Identification”, intellectual properties is an important indicator for the measurement of the innovative ability of enterprises [72].
In conclusion, since the establishment of Stanford Industrial Park in the 1950s, most of the studies on the correlation between higher education institutions and technological innovation ability have focused on industry–university-research cooperation. It is generally believed in the academic circles that the industry–university-research cooperation is conducive to the development of all cooperative entities and the enhancement of the comprehensive strength of urban innovation districts. The theoretical research mainly includes the formulation of cooperation related policies and regulations, the proposal and application of cooperation theoretical model, cooperation model, driving force and influencing factors. In practice, excellent cases like Silicon Valley, Zhongguancun and 22@Barcelona have also appeared.
The following gaps can be found based on previous studies. First, most of the existing works have carried out empirical studies on the cooperation modes, management mechanisms, and influencing factors of industry–university–research cooperation from the perspective of a single cooperative partner in an enterprise, university, or research institution. However, there are few studies focused on the correlation among various cooperative partners. Second, some studies have proposed a number of indicators for the measurement of universities’ and enterprises’ development; however, there is a lack of systematic research on the relationship between these two entities in the context of innovation, especially the comparative study of the correlation between different types of HEIs and STEs. Third, academics generally believe that geographical proximity promotes cooperation and connection between universities and enterprises. However, the studies in this field are mostly of a qualitative nature and lack quantitative analyses. Therefore, this study attempts to narrow the above gaps on the basis of previous studies and from the perspective of innovation-driven social and economic sustainable development. It quantitatively analyzes the correlation between the two entities of industry–university–research cooperation; namely, the innovation resources of HEIs and the development of the STEs close to these HEIs, and attempt to identify the innovation indicators related to the influence of HEIs on the development of STEs.

3. Study Area, Data and Methods
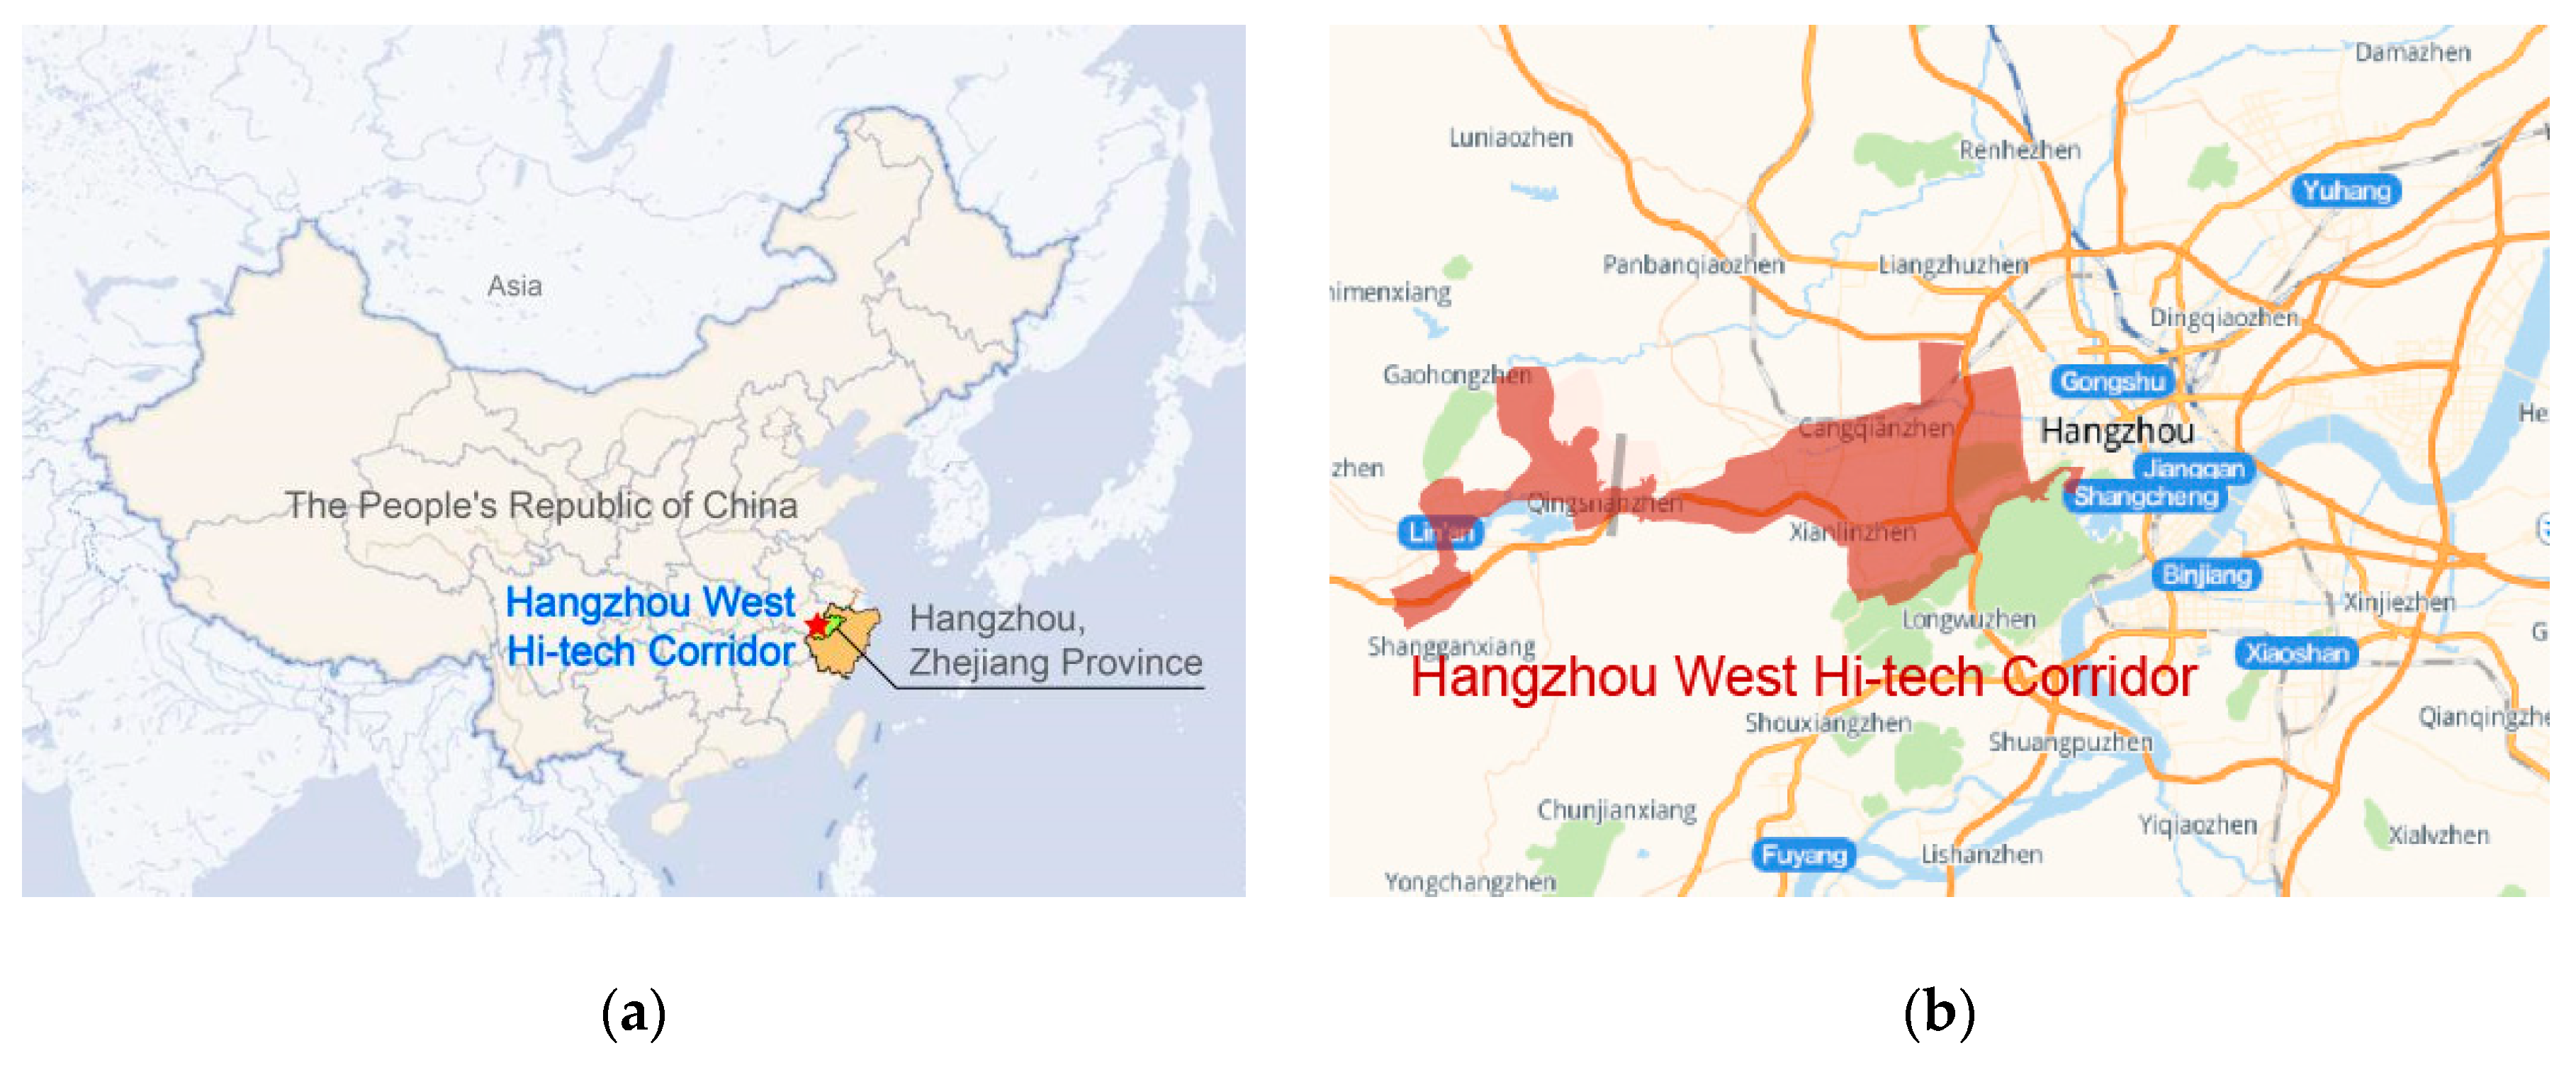
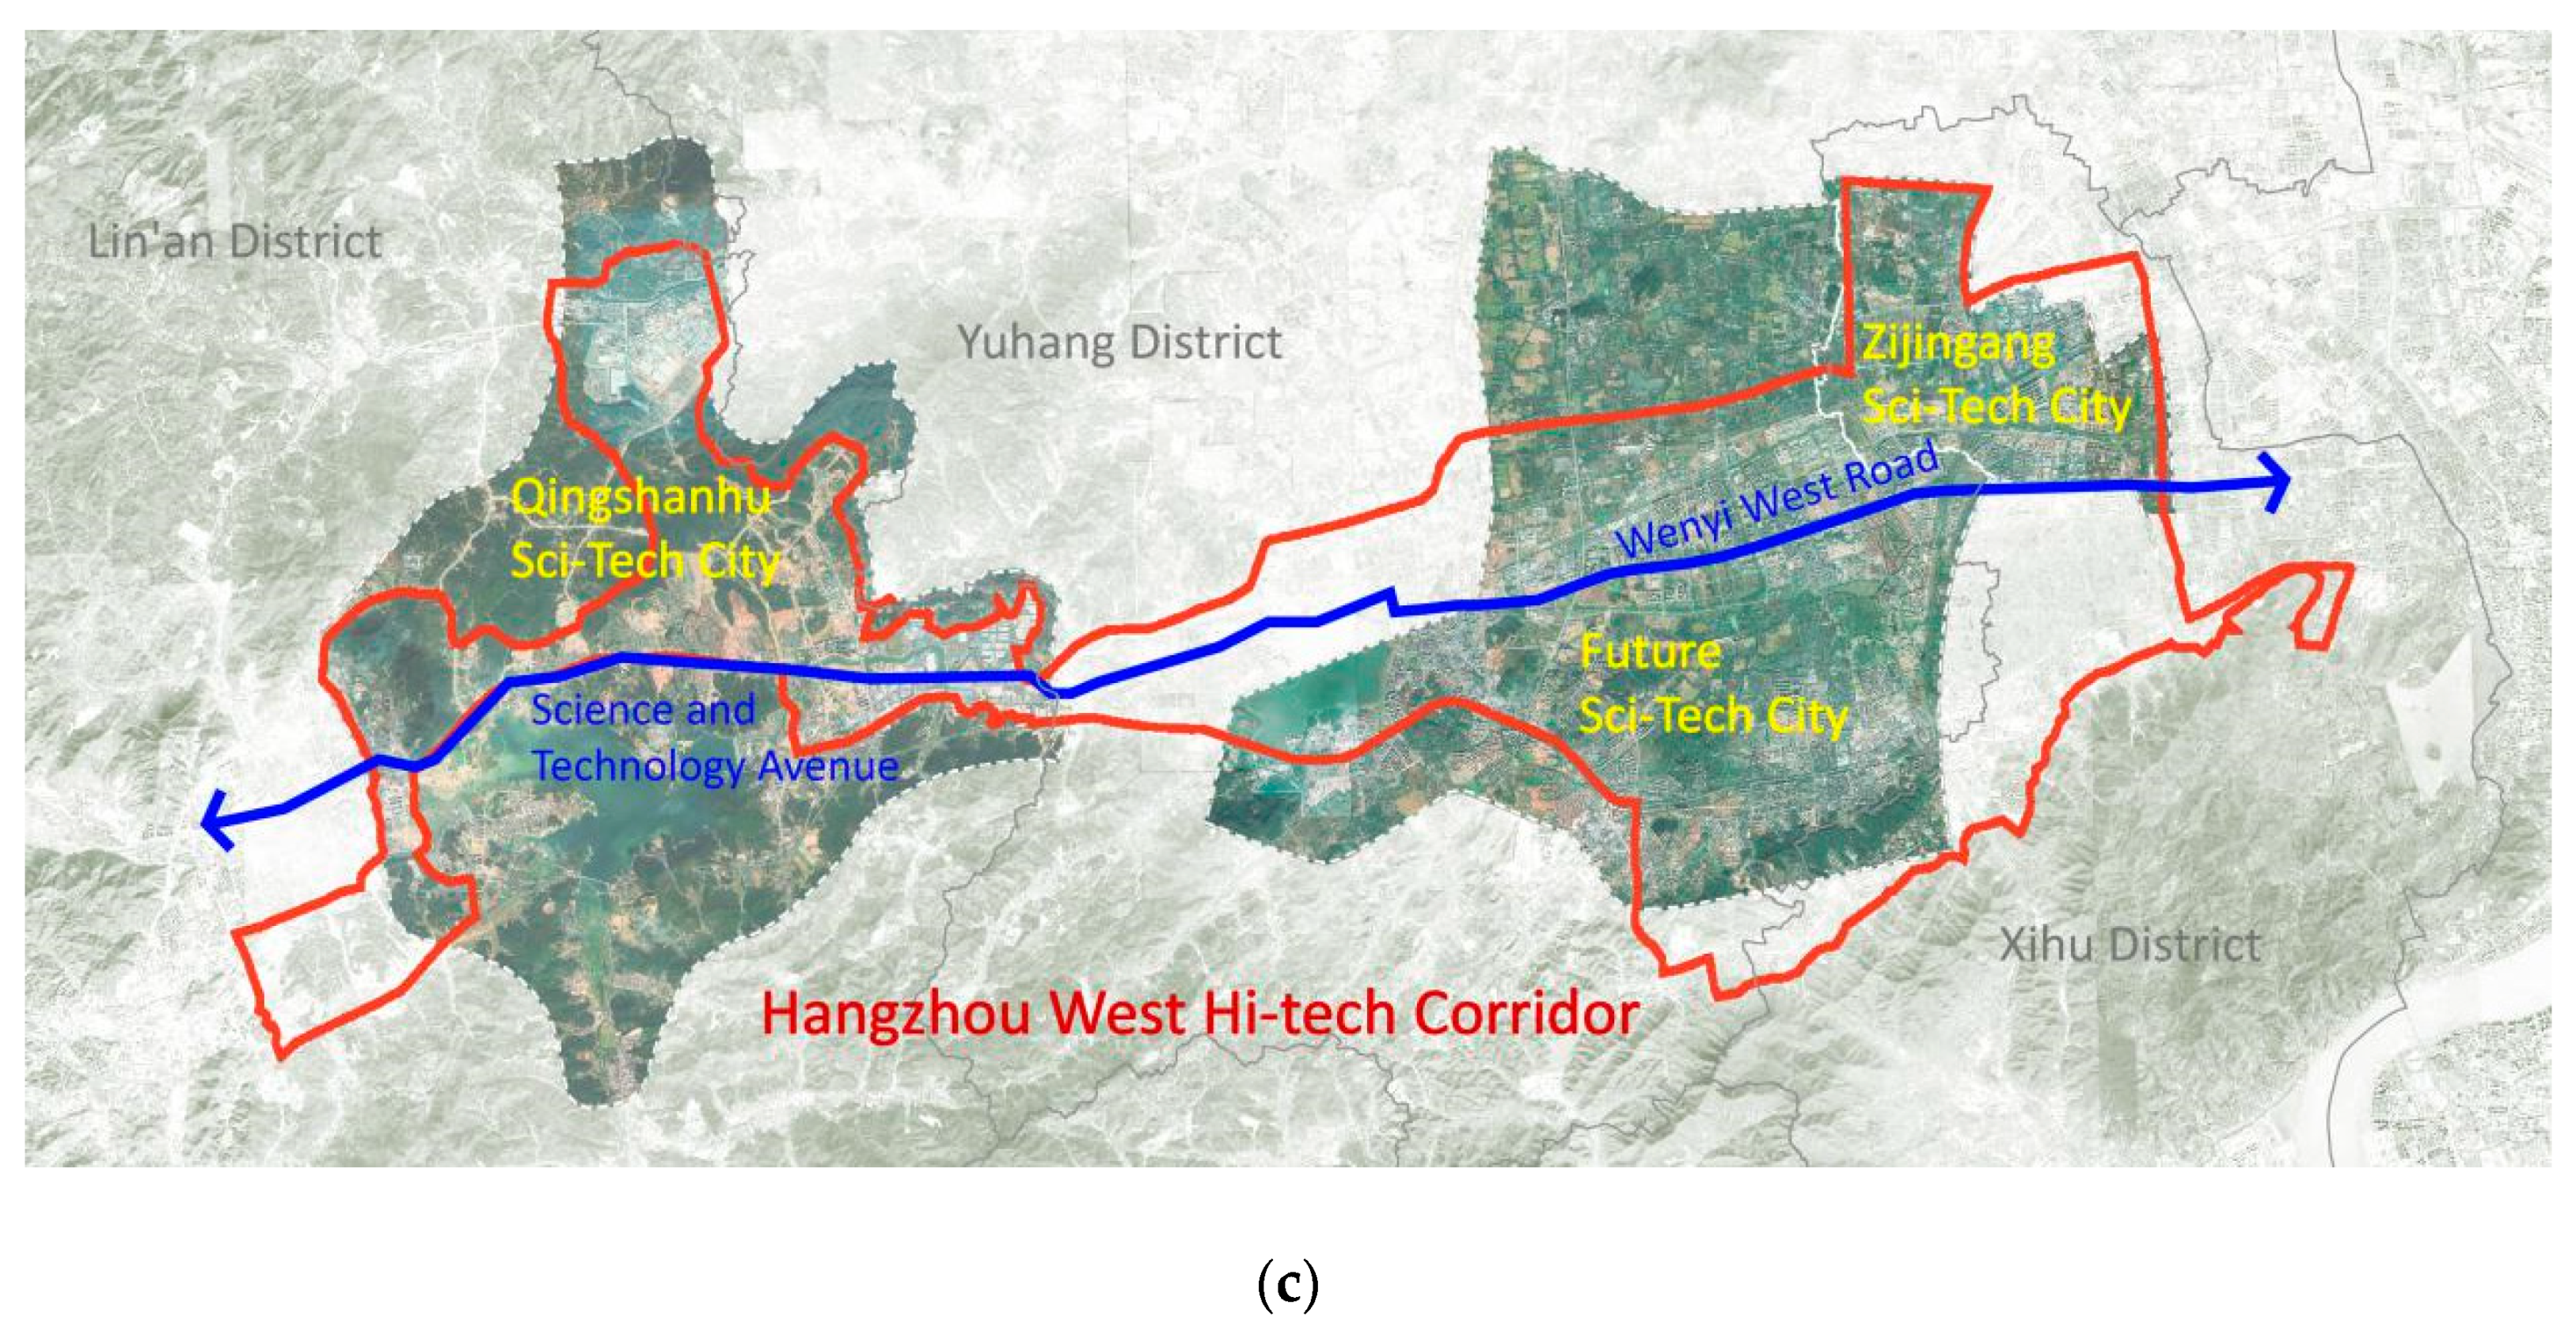
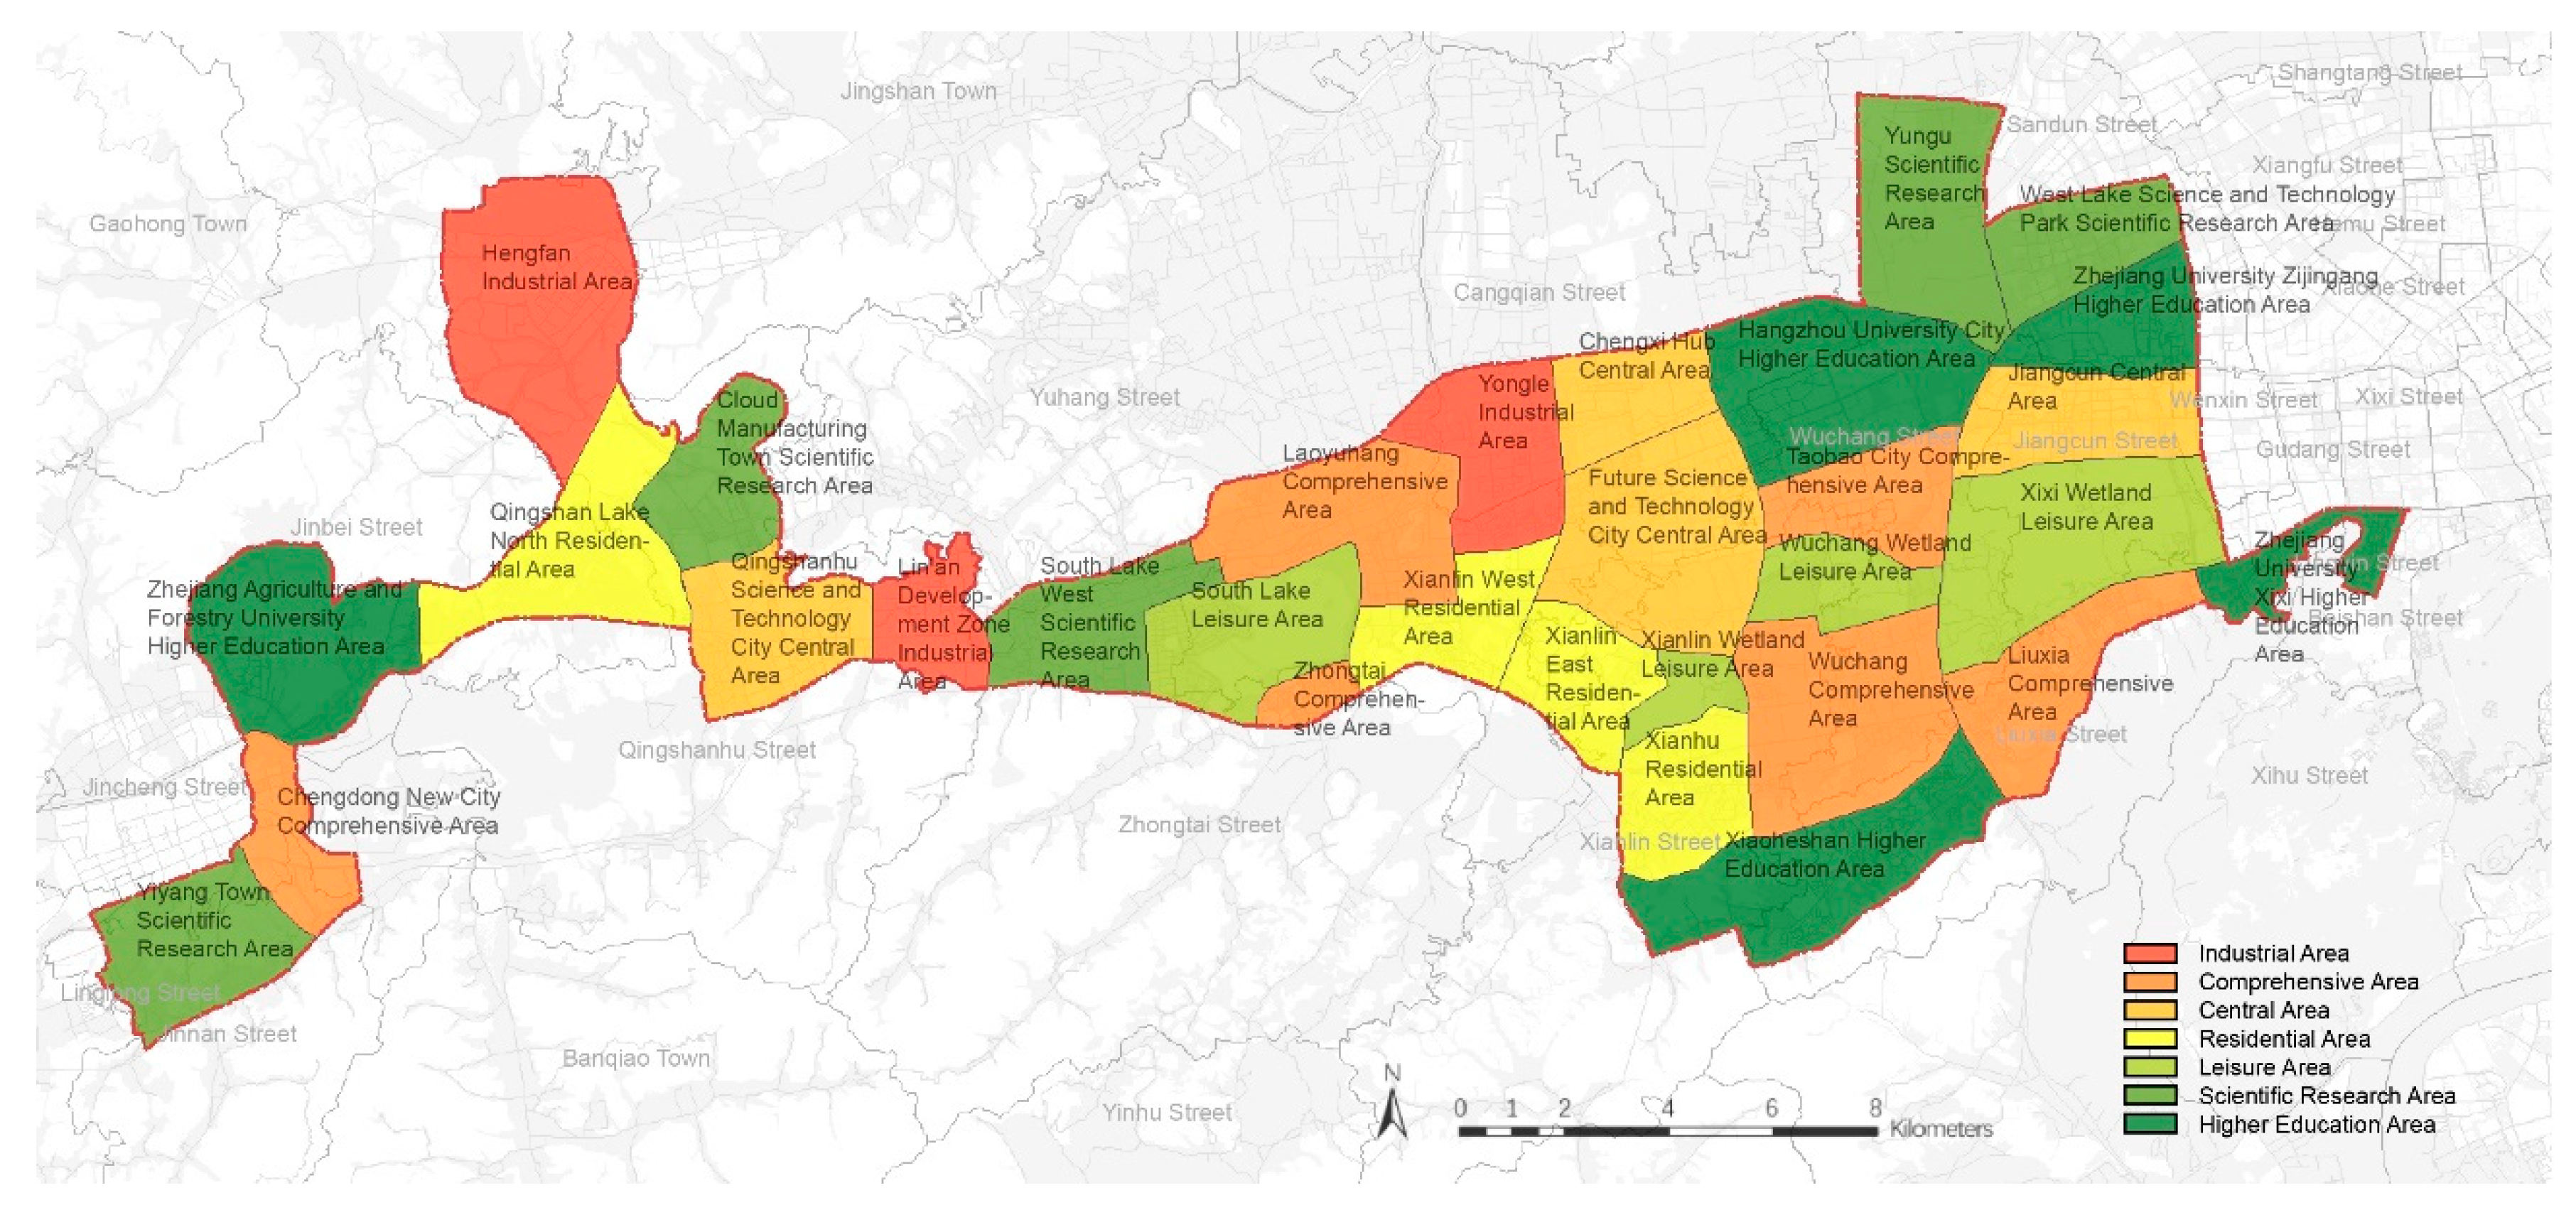
3.1. Study Area

The Corridor is located in western Hangzhou, spanning east to west across 15 streets within three districts; namely, Xihu District, Yuhang District, and Lin’an District. With Wenyi West Road as its main axis, the Corridor’s boundaries stretch from the Zijingang Campus of Zhejiang University in the east to the Zhejiang Agriculture and Forestry University in the west, passing through the Zijingang Science and Technology City, the Future Science and Technology City, and the Qingshanhu Science and Technology City (see Figure 1). It is approximately 33 km long and has a planned total area of approximately 224 square kilometers. According to the “Spatial Master Plan of the Hangzhou West Hi-tech Corridor” and the current land use status of the area, the Corridor is divided into 31 sections [73]. These areas are the central area, the scientific research area, the higher education area, the industrial area, the residential area, the comprehensive area, and the leisure area (see Figure 2). The industries in the Corridor is focused on future networks, big data cloud computing, e-commerce, artificial intelligence, life sciences, new energy vehicles, new materials, technology services, and new finance. It is the forefront of China’s “Internet Plus” and “Artificial Intelligence Plus” industries; additionally, it is the main venue for innovation in global technology and industry.

3.2. Data Sources

3.2.1. Data Regarding Development of Sci-Tech Enterprises

This study collects sci-tech enterprises information in the Corridor from Qichacha snd Tianyancha, which are the official query platforms of National Enterprise Credit Information Publicity System. The data collection process steps are as follows:
Step 1: Determine the collection scope. Using the map query function of Qichacha, draw several circles on the map to ensure that these circles can fully cover the scope of the Corridor.
Step 2: Eliminate duplicate enterprises’ data. Collect all kinds of information such as enterprise name, coordinates, industry type, staff size, the number of intellectual properties, the number of patents, and the content of sci-tech innovation in each circle on Qichacha. Summarize the information and eliminate duplicate enterprises, and then generate enterprise information summary in Excel.
Step 3: Eliminate the out-of-scope enterprises’ data. According to the coordinates, the information of each enterprise is imported into ArcGIS (geographic information system platform software). Each enterprise can be seen as a point element. According to the boundary line of the Corridor, eliminate the enterprises beyond the boundary range.
Step 4: Eliminate non-science and technology enterprises: according to the sci-tech and innovation industry type determined in Hangzhou West Hi-tech Corridor Planning [74], the enterprises not engaged in the sci-tech and innovation industry will be eliminated.
Step 5: Supplement enterprises data: According to the name of the enterprises, collect comprehensive score data of STEs on Tianyancha.
Finally, the information of 16,504 sci-tech enterprises in the Corridor is collected.
This study takes the development indicators of STEs as its dependent variables and includes the number of enterprises surrounding HEIs (Y1), which reflects the degree of STE aggregation; the comprehensive scores (Y2) and staff sizes (Y3) of STEs, which are used to reflect their levels of development; the number of intellectual properties (Y4), the number of patents (Y5) and the content of sci-tech innovation (Y6) owned by STEs, which are used to reflect their levels of innovation.
This study views the centroid of the spatial outline of each higher education institution as the center of a circle with a radius of 3 km; this circle represents the area to be sampled (see Figure 3). Since some of the universities and colleges are located on the borders of the Corridor, the sampled areas stretch beyond the borders of the Corridor. The relationship between the HEIs and the STEs surrounding them cannot be accurately reflected if only the enterprises inside the Corridor are accounted for in the statistics. Therefore, this study first calculates the area where each circle intersects with the Corridor; then, the indicators value of all the enterprises in a circle is sum up separately; finally, the ratio of the sum of the indicators value to intersection area to be used as a statistic describing the enterprises.

3.2.2. Data Regarding Innovation of Higher Education Institutions

• Geographic Spatial Data
The geographic spatial data includes HEIs data and STEs data. Among them, the geographic spatial data of HEIs mainly refers to the geographical location and the land use of each HEI in the Corridor. The data comes from the land use status map of Hangzhou city, the land use of HEIs in the land use map of Hangzhou West Hi-tech Corridor Planning, and the geographic spatial scope in the planning of each HEI. The data is mainly used to define the spatial distribution of HEIs in the Corridor and to determine the sampling range by locating the centroid position of each HEI. The geographic spatial data of STEs mainly refers to the distribution of each enterprise in the Corridor. According to the coordinates of each enterprise, enterprise data can be imported into ArcGIS. Through geographic spatial data, the relationship between the distribution of STEs and the location of HEIs can be observed, which also provides space conditions for further analyzing the influence of innovation resources in higher education institutions on the development of surrounding sci-tech parks’ enterprises.
• Innovation Data
The data sources employed include the “Compilation of Science and Technology Statistics of Higher Education Institutions [73]”, which was compiled by the Department of Science and Technology of the Ministry of Education; the “Annual Report on the Employment Quality of Graduates [75]”, which was published in 2019; the “Annual Report on the Quality of Higher Vocational Education [76]”, which was published by the Employment Guidance Centers of HEIs; an institutional analysis of the Wanfang Data Knowledge Service Platform; and the official website of each higher education institution examined.
In 2019, the Ministry of Education of the People’s Republic of China launched a survey to assess the innovation of HEIs, including that of undergraduate institutions, junior colleges, and independent colleges. The survey covered innovative talent cultivation, teaching staff, industry-university-research cooperation, and innovative technology achievement transformation. Based on this survey and the previous studies, this study selects 17 indicators to reflect the innovation of HEIs that correspond to five categories: teaching staff, talent cultivation, quality of scientific research, academic influence, and university-enterprise cooperation. This study takes these 17 indicators as its independent variables; namely, the number of teaching staff (X1), the number of teachers with senior titles (X2), the number of teaching and research staff (X3), the number of R&D staff (X4), the number of graduates (X5), the number of graduates engaged in sci-tech innovation industry (X6), the number of intellectual properties (X7), the number of patents (X8), the number of sci-tech achievements (X9), the number of sci-tech topics addressed (X10), the number of articles issued by journals (X11), the content of sci-tech innovation (X12), the funds for scientific research (X13), the number of cited papers (X14), the average number of citations per paper (X15), the number of invested enterprises (X16), and the number of holding enterprises (X17).

3.3. Study Methods

3.3.1. Spatial Analysis

ArcGIS is used to analyze the spatial distribution of the enterprises and HEIs, as well as the kernel density of the development indicators of the STEs in the Corridor. The teaching staff, talent cultivation, quality of scientific research, academic influence, and university-enterprise cooperation of the HEIs are identified and visualized.

3.3.2. Partial Least Squares Regression (PLSR)

PLSR was first proposed by S. Wold and C. Albano in 1983. This method consists of a combination of principal component analysis, canonical correlation analysis and multiple linear regression analysis [77]. First, the principal component analysis principle is applied to condense the information contained in the multiple independent variables X and dependent variables Y analyzed and obtain the principal component of these variables (X corresponds to the principal component U, Y corresponds to the principal component V). Then, the relationship between X and U, and the relationship between Y and V are analyzed by means of the typical correlation principle. Finally, the relationship between X and V is analyzed via multiple linear regression to identify the relationship between X and Y. PLSR is a multivariate statistical method that can solve collinearity problems, simultaneously analyze multiple dependent variables Y, and deal with relationships in small samples.
Supposing that the p dependent variables Y1, …, Yp and the m independent variables X1, …, Xm are all standardized variables, the n-times standardized observation data matrix of the dependent variable group and that of the independent variable group are denoted as follows, respectively:
Y 0 n × p = { y 11 y 1 p y 21 y 2 p y n 1 y n p } ,   X 0 n × m = { x 11 x 1 m x 21 x 2 m x n 1 x n m }
  • Step 1: Determine the optimal number of principal components through cross-validity analysis and variable importance in projection (VIP) analysis. For the cross-validity analysis, if Qh2 ≤ 0.0975, this means that it is not beneficial to continue increasing the number of principal components; that is, the number of principal components being used at this point is the optimal number to utilize. For the VIP analysis, if there is not an obvious change in the VIP value when the number of principal component is increased, the number of principal components currently being utilized is optimal.
  • Step 2: Extract the principal components and perform an accuracy analysis. The principal component U1 is extracted from the independent variable X, and the principal component V1 is extracted from the dependent variable Y. The components U1 and V1 must extract as much information as possible from the variable groups that they are in; thus, the degree of the correlation between U1 and V1 will be maximized. An accuracy analysis examines the information extraction rate (variance interpretation rate) of the principal components of X and Y and analyzes the model effect.
  • Step 3: Conduct a PLSR analysis. Analyze the correlation between X and Y as identified by the regression, including the regression coefficient, the significance of the relationship, and the R square value.
This study focuses on the correlation between HEIs and the STEs surrounding them. Due to the small sample size and the high level of collinearity between the variables, a PLSR method is used for this study.

4. Results

4.1. Development of Sci-Tech Enterprises

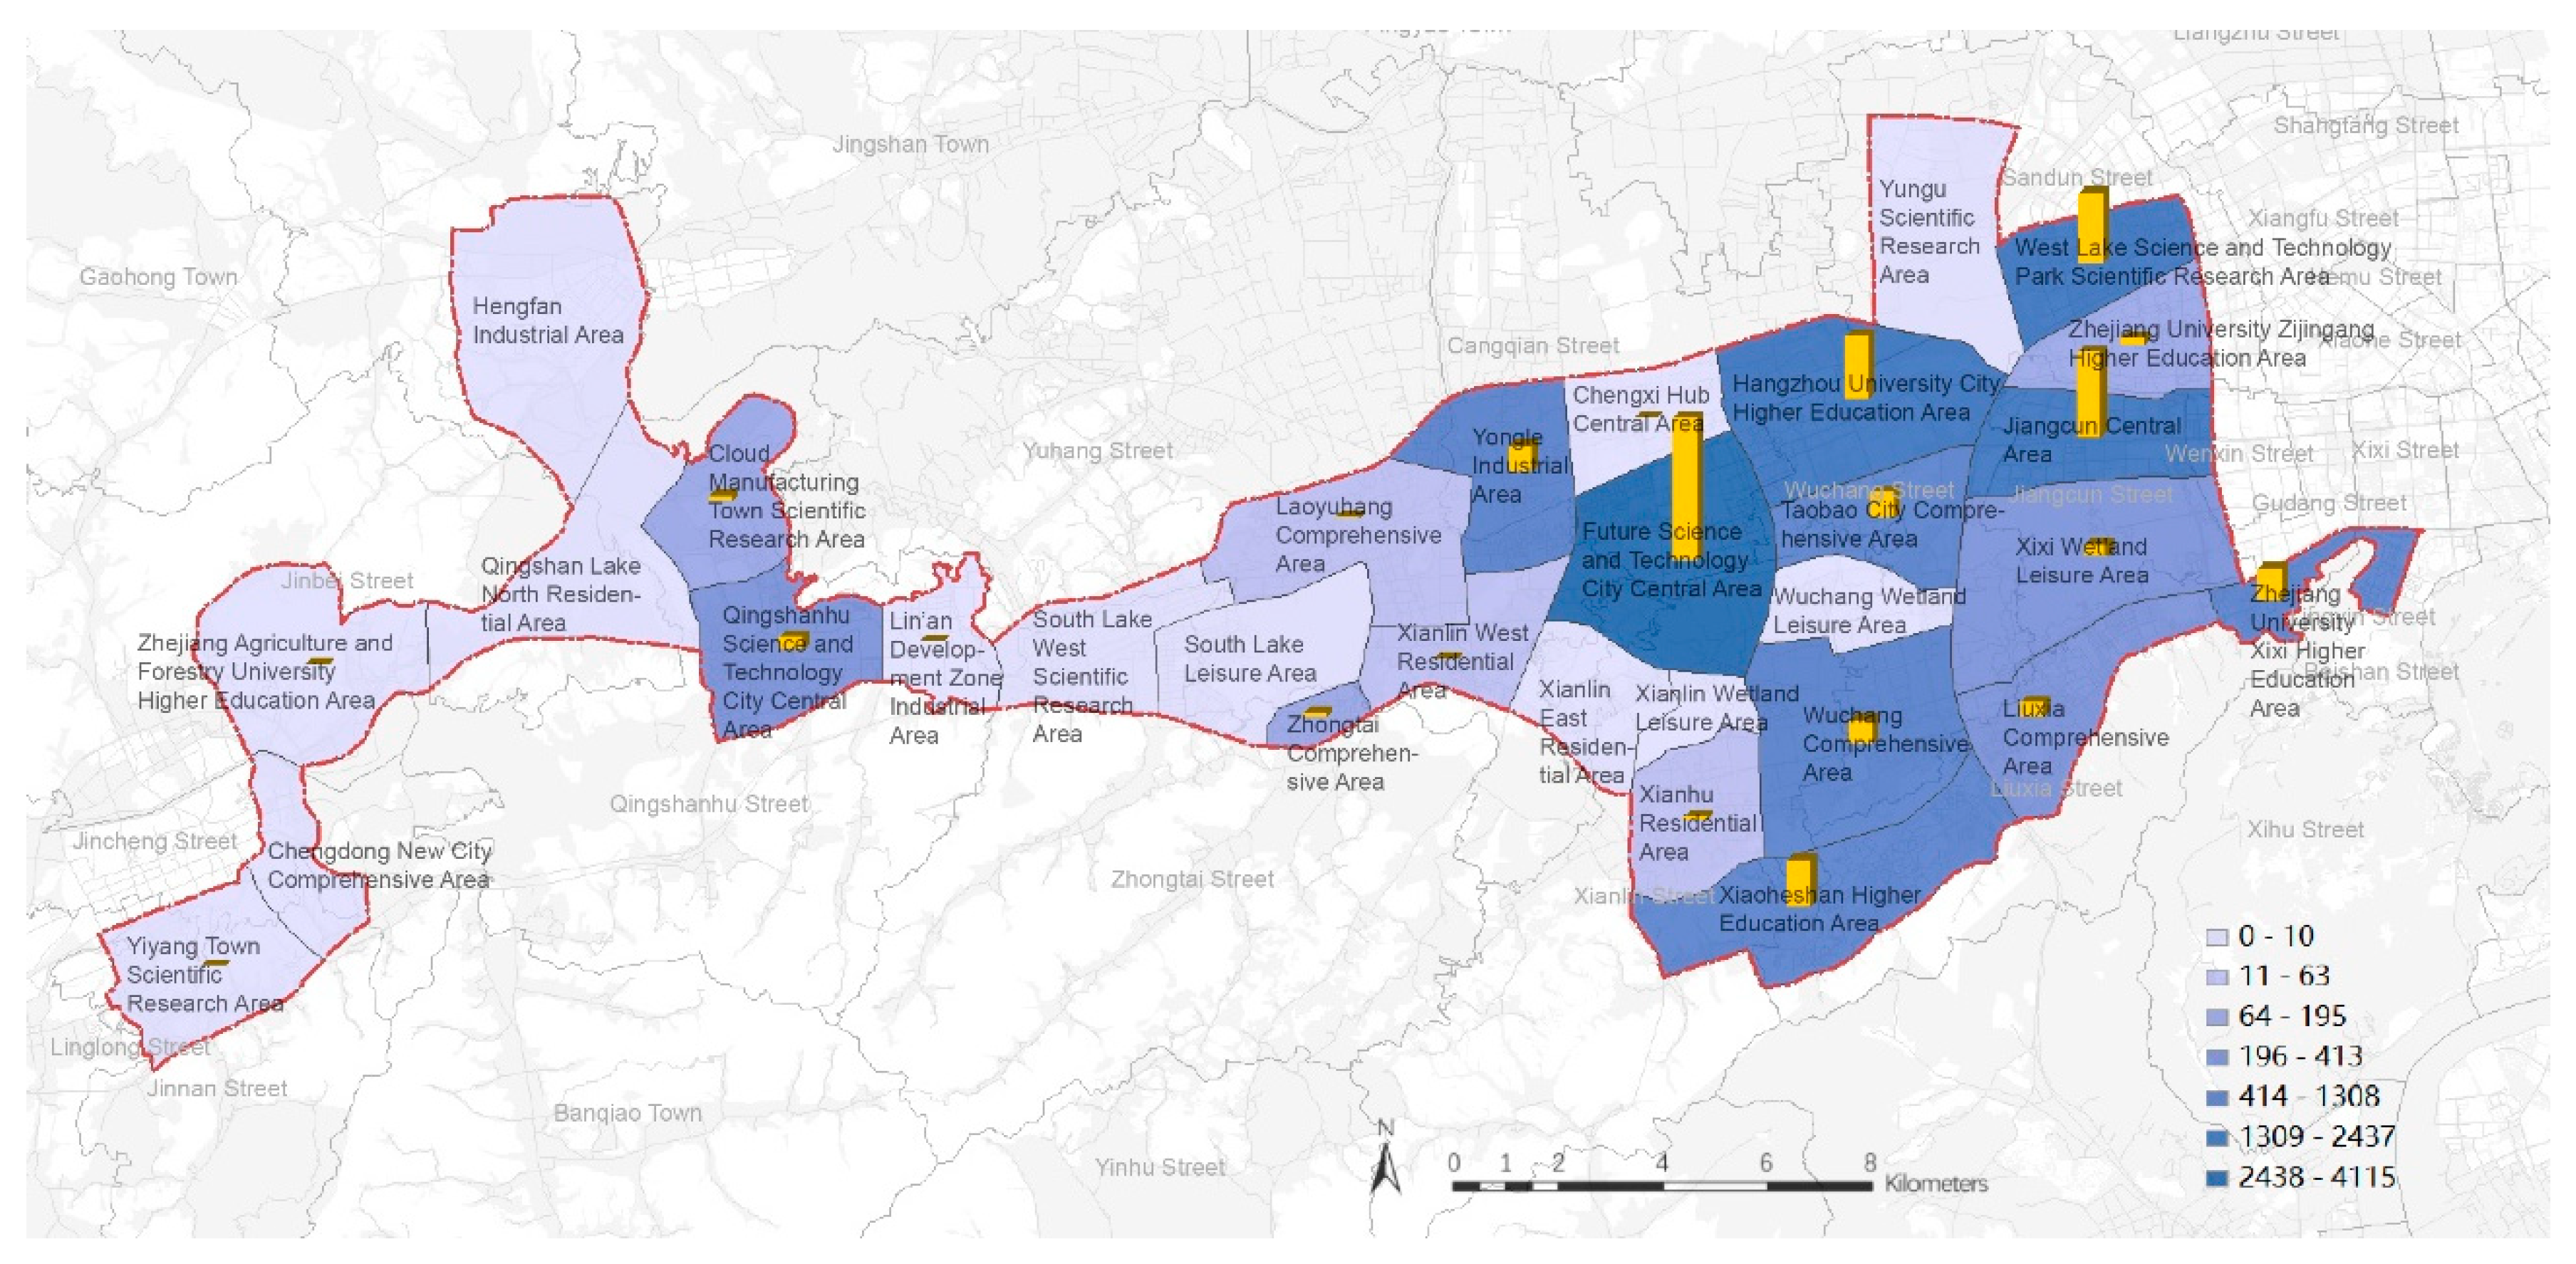
4.1.1. Spatial Distribution of Sci-Tech Enterprises

According to the statistics regarding the number of enterprises in different areas, the Future Science and Technology City Central Area, the Jiangcun Central Area, the West Lake Sci-tech Innovative Parks Scientific Research Area, the Hangzhou University City Higher Education Area, the Xiaoheshan Higher Education Area, and the Zhejiang University Xixi Higher Education Area contain the most STEs (see Figure 4).
According to a kernel density analysis of the distribution of the enterprises, it can be observed that the STEs examined are mainly located in the Zijingang Science and Technology City and the Future Science and Technology City, which are closer to downtown Hangzhou. The Qingshanhu Science and Technology City Area has fewer STEs than the abovementioned areas, and only a small number of STEs are located in the Qingshanhu Science and Technology City central area and the Cloud Manufacturing Township scientific research area (see Figure 5).

4.1.2. Analysis of the Development of the Sci-Tech Enterprises

In terms of development scale, the enterprises with larger staff sizes and higher comprehensive scores are concentrated in the Future Science and Technology City and the Zijingang Science and Technology City areas in the eastern part of the Corridor, and are especially concentrated in the Future Science and Technology City Central Area, the West Lake Science and Technology Park Scientific Research Area, the Jiangcun Central Area, and the Zhejiang University Xixi Higher Education Area.
In terms of innovation level, the Future Science and Technology City Central Area still has the highest innovation level; this area has the most intellectual properties and patents, and the highest level of sci-tech innovation content. This area contains a large number of sci-tech parks and enterprises. In addition, the Hangzhou University City Higher Education Area, the Taobao City Comprehensive Area, the West Lake Sci-tech Innovative Parks Scientific Research Area and the Wuchang Comprehensive Area along the principal axis of Wenyi West Road exhibit relatively high levels of innovative ability. The innovative ability of the Qingshanhu Science and Technology City in the western region is relatively low.

4.2. Innovation Resources of Higher Education Institutions

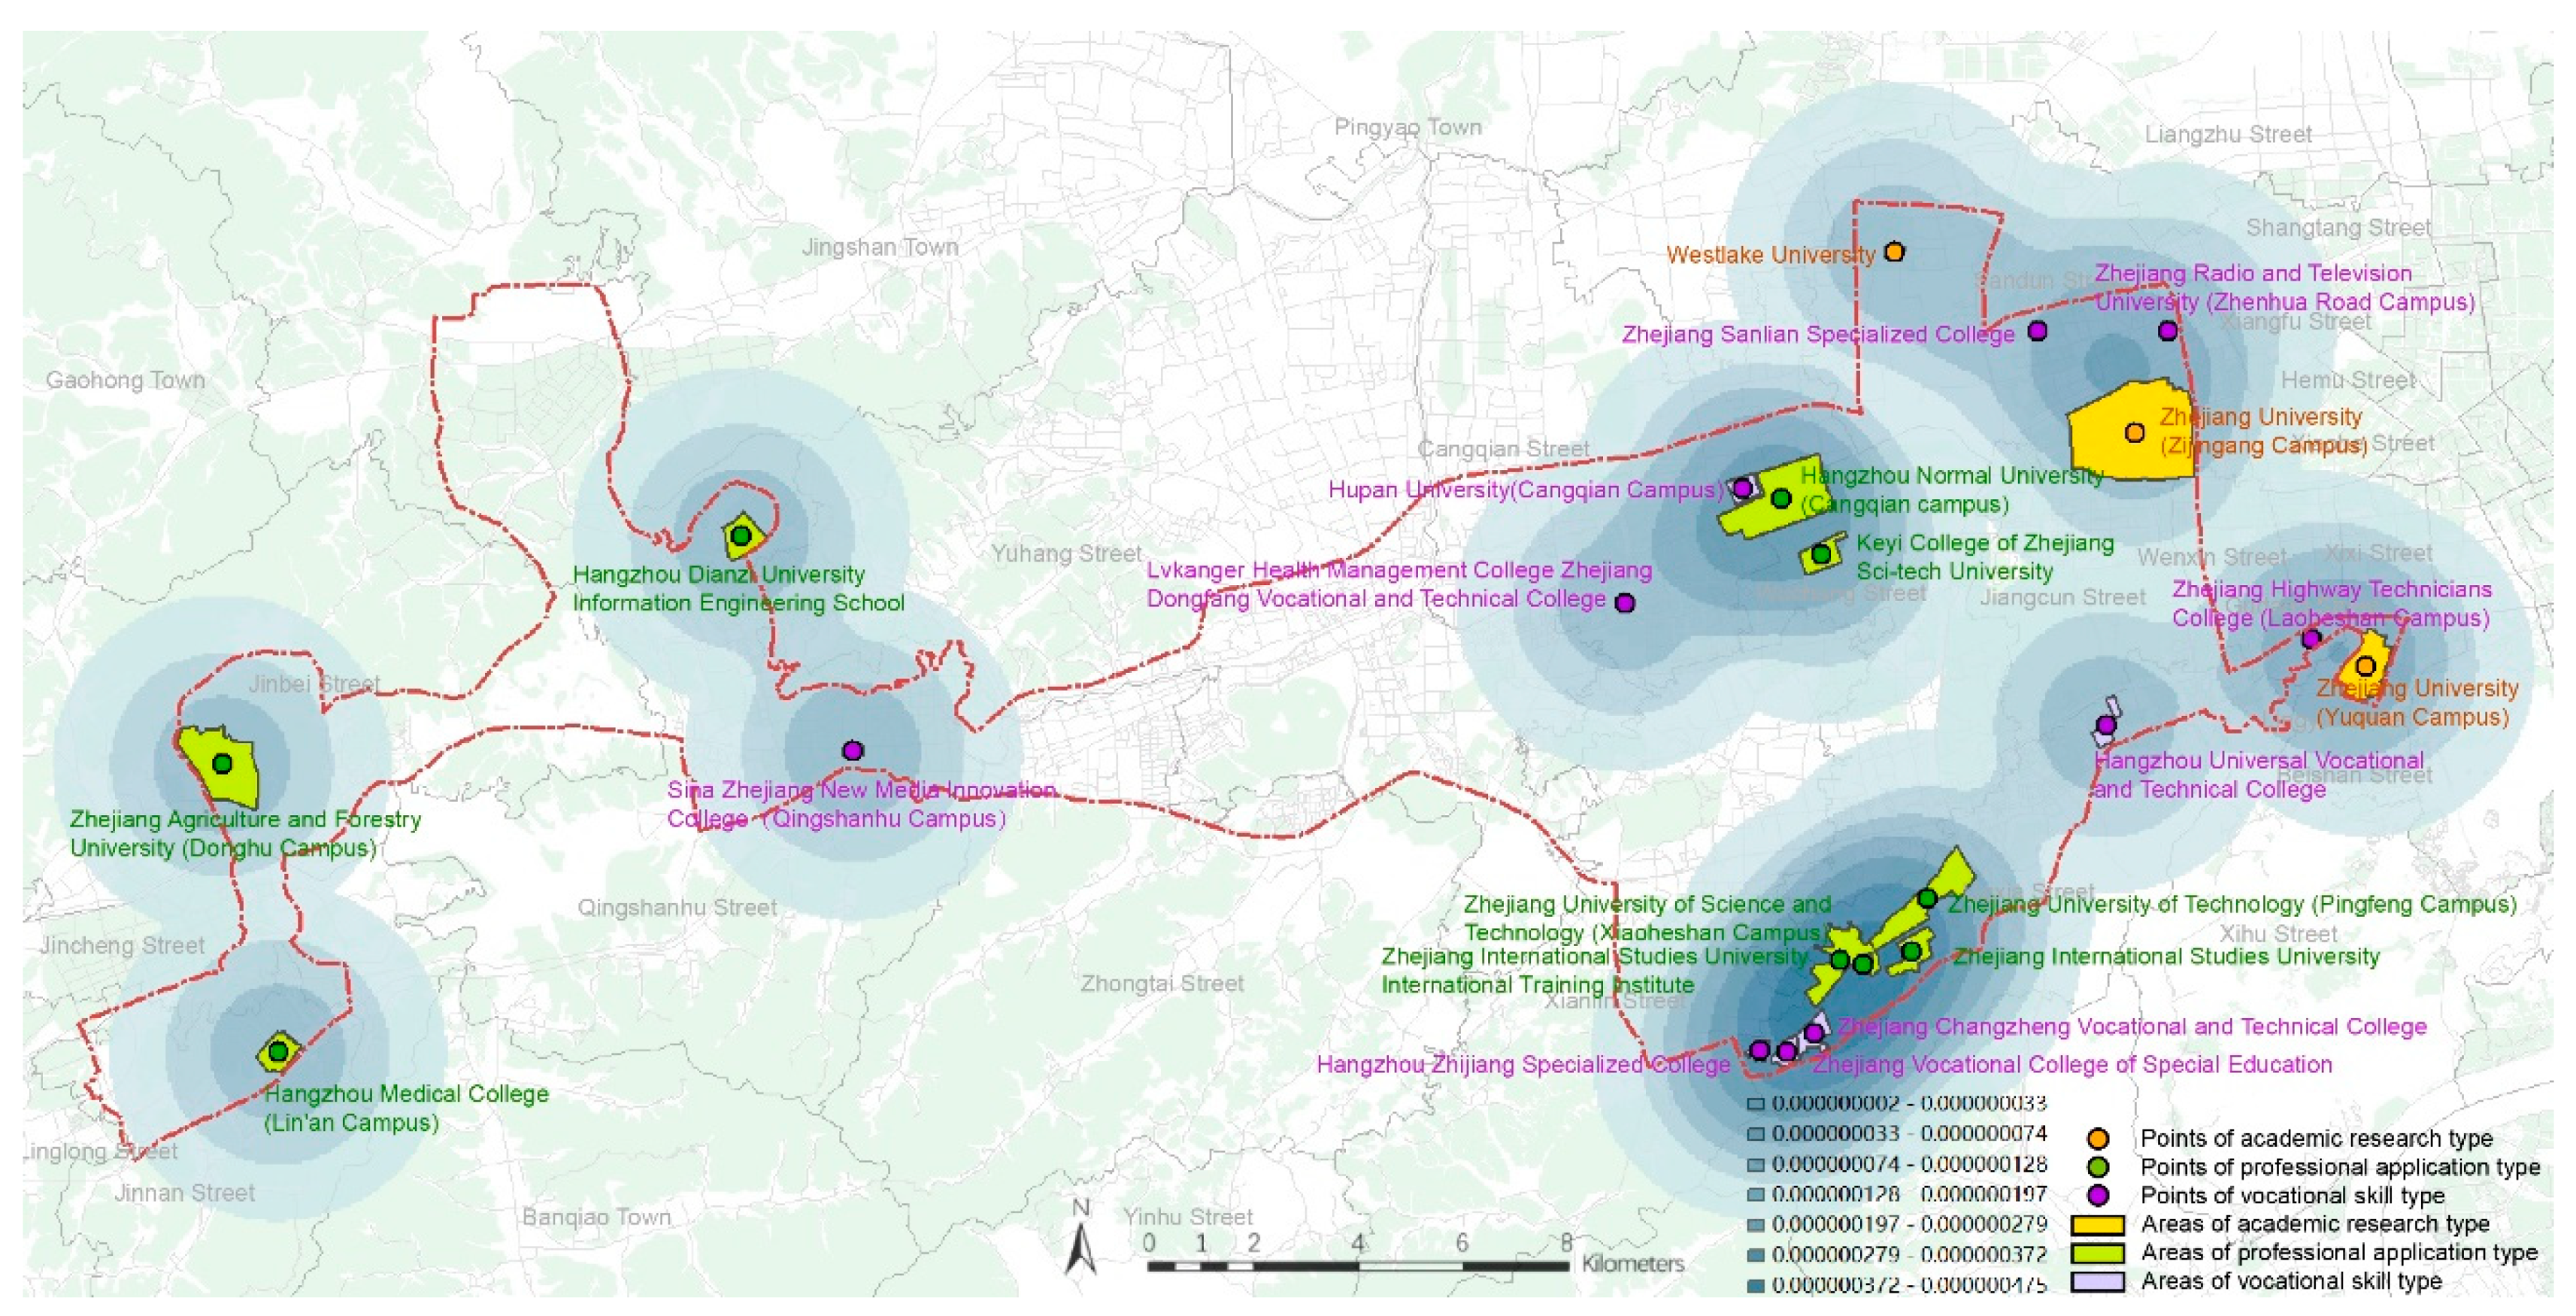
4.2.1. Classification and Distribution of Higher Education Institutions

According to the “International Standard Classification of Education (ISCED) [78]” issued by UNESCO in 2011, and the “Suggestions on the Establishment of Higher Education Institutions [79]” issued by the Ministry of Education of China in 2017, and due to the current situations in our country regarding the entrance of higher education into its popularization stage and the current social talent structure, the HEIs in the Corridor are classified into three types:
  • Type I—Academic research: This type of HEI focuses on discovering theories regarding basic disciplines and applied disciplines and cultivates leading innovative academic talent.
  • Type II—Professional application: This type of HEI focuses on acquiring high-tech professional knowledge pertaining to various industries and the ways in which high-level technology can be transformed into productivity; this type of HEI cultivates applied talent at different levels.
  • Type III—Vocational skills: Most of these HEIs are vocational colleges and mainly train professional and technical talent for future engagement in production, management, service and other specific types of work.
According to the quantitative statistics that describe the area, there are 22 HEIs in the Corridor, and these HEIs have a wealth of higher education resources (see Table 1). However, there are relatively few academic research colleges and universities, namely, only Zhejiang University and Westlake University. Additionally, with the exception of Hupan University, there is a lack of high-end vocational and technical colleges for the cultivation of high-end vocationally skilled workers. In terms of distribution, most of these colleges and universities are located on the boundaries of the Corridor. Figure 5 shows that the distribution exhibits characteristics that could be described as “scattered on the border and far away from the hinterland”. Only a small number of colleges and universities are located in the Xiaoheshan Higher Education Area (see Figure 6).
There are 3 academic research universities, and all of them are located in the Zijingang Science and Technology City. These three universities are two campus of Zhejiang University, the only “985 university (global first-class high-level university)” in Zhejiang Province, and Westlake University in the Yungu Scientific Research Area. There are 9 professional application universities and colleges, and these include provincial undergraduate colleges and independent colleges. Among these schools, Hangzhou Dianzi University Information Engineering School, Zhejiang Agriculture and Forestry University and Hangzhou Medical College are scattered in Qingshanhu Science and Technology City. Hangzhou Normal University and Zhejiang University of Science and Technology are located in the Hangzhou University City Higher Education Area. The remaining professional application universities and colleges are concentrated in the Xiaoheshan Higher Education Area. There are 10 vocational skill universities and colleges, and these are mainly vocational colleges and technical schools. These schools are scattered; however, they are generally located in the Future Science and Technology City and the Zijingang Science and Technology City.

4.2.2. Innovation Indicators of Higher Education Institutions

This study measures the innovation ability of the examined HEIs with 17 indicators corresponding to five categories: teaching staff, talent cultivation, quality of scientific research, academic influence, and university-enterprise cooperation (see Table 2).
The two campuses of Zhejiang University are located in the eastern part of the Corridor. As it is the only C9 (the first top universities alliance in China) university in Zhejiang Province, the value of each indicator for Zhejiang University is far higher than the values of the indicators corresponding to the other universities and colleges; thus, its innovative ability is higher. In addition, the HEIs examined are somewhat concentrated in the Xiaoheshan Higher Education Area and the Hangzhou University City Higher Education Area, so the innovative ability of this area is relatively high.
In terms of teaching staff, the values of the academic research and professional application indicators are significantly higher than those of the other categories, especially in the case of Zhejiang University and the Zhejiang University of Technology. These schools have obvious advantages in terms of the number of teachers with senior titles that they employ and their R&D staff. In terms of talent cultivation, academic research and professional application schools mainly focus on producing applied and innovative talent, and the number of graduates from these schools that work in the sci-tech innovation industry is larger than that of other schools. Vocational skill schools focus on producing technical talent. In terms of quality of the scientific research generated and the academic influence of the institutions, both academic research and professional application schools have an absolute advantage in terms of the number of their sci-tech achievements, the content of their sci-tech innovation, and the funds that they receive for scientific research. In terms of university-enterprise cooperation, with the exception of Zhejiang University, the Zhejiang University of Technology, and Zhejiang Agriculture and Forestry University, the number of invested enterprises and holding enterprises are very small in other universities and colleges.

4.3. Correlation Between the Innovation of Higher Education Institutions and the Development of Sci-Tech Enterprises

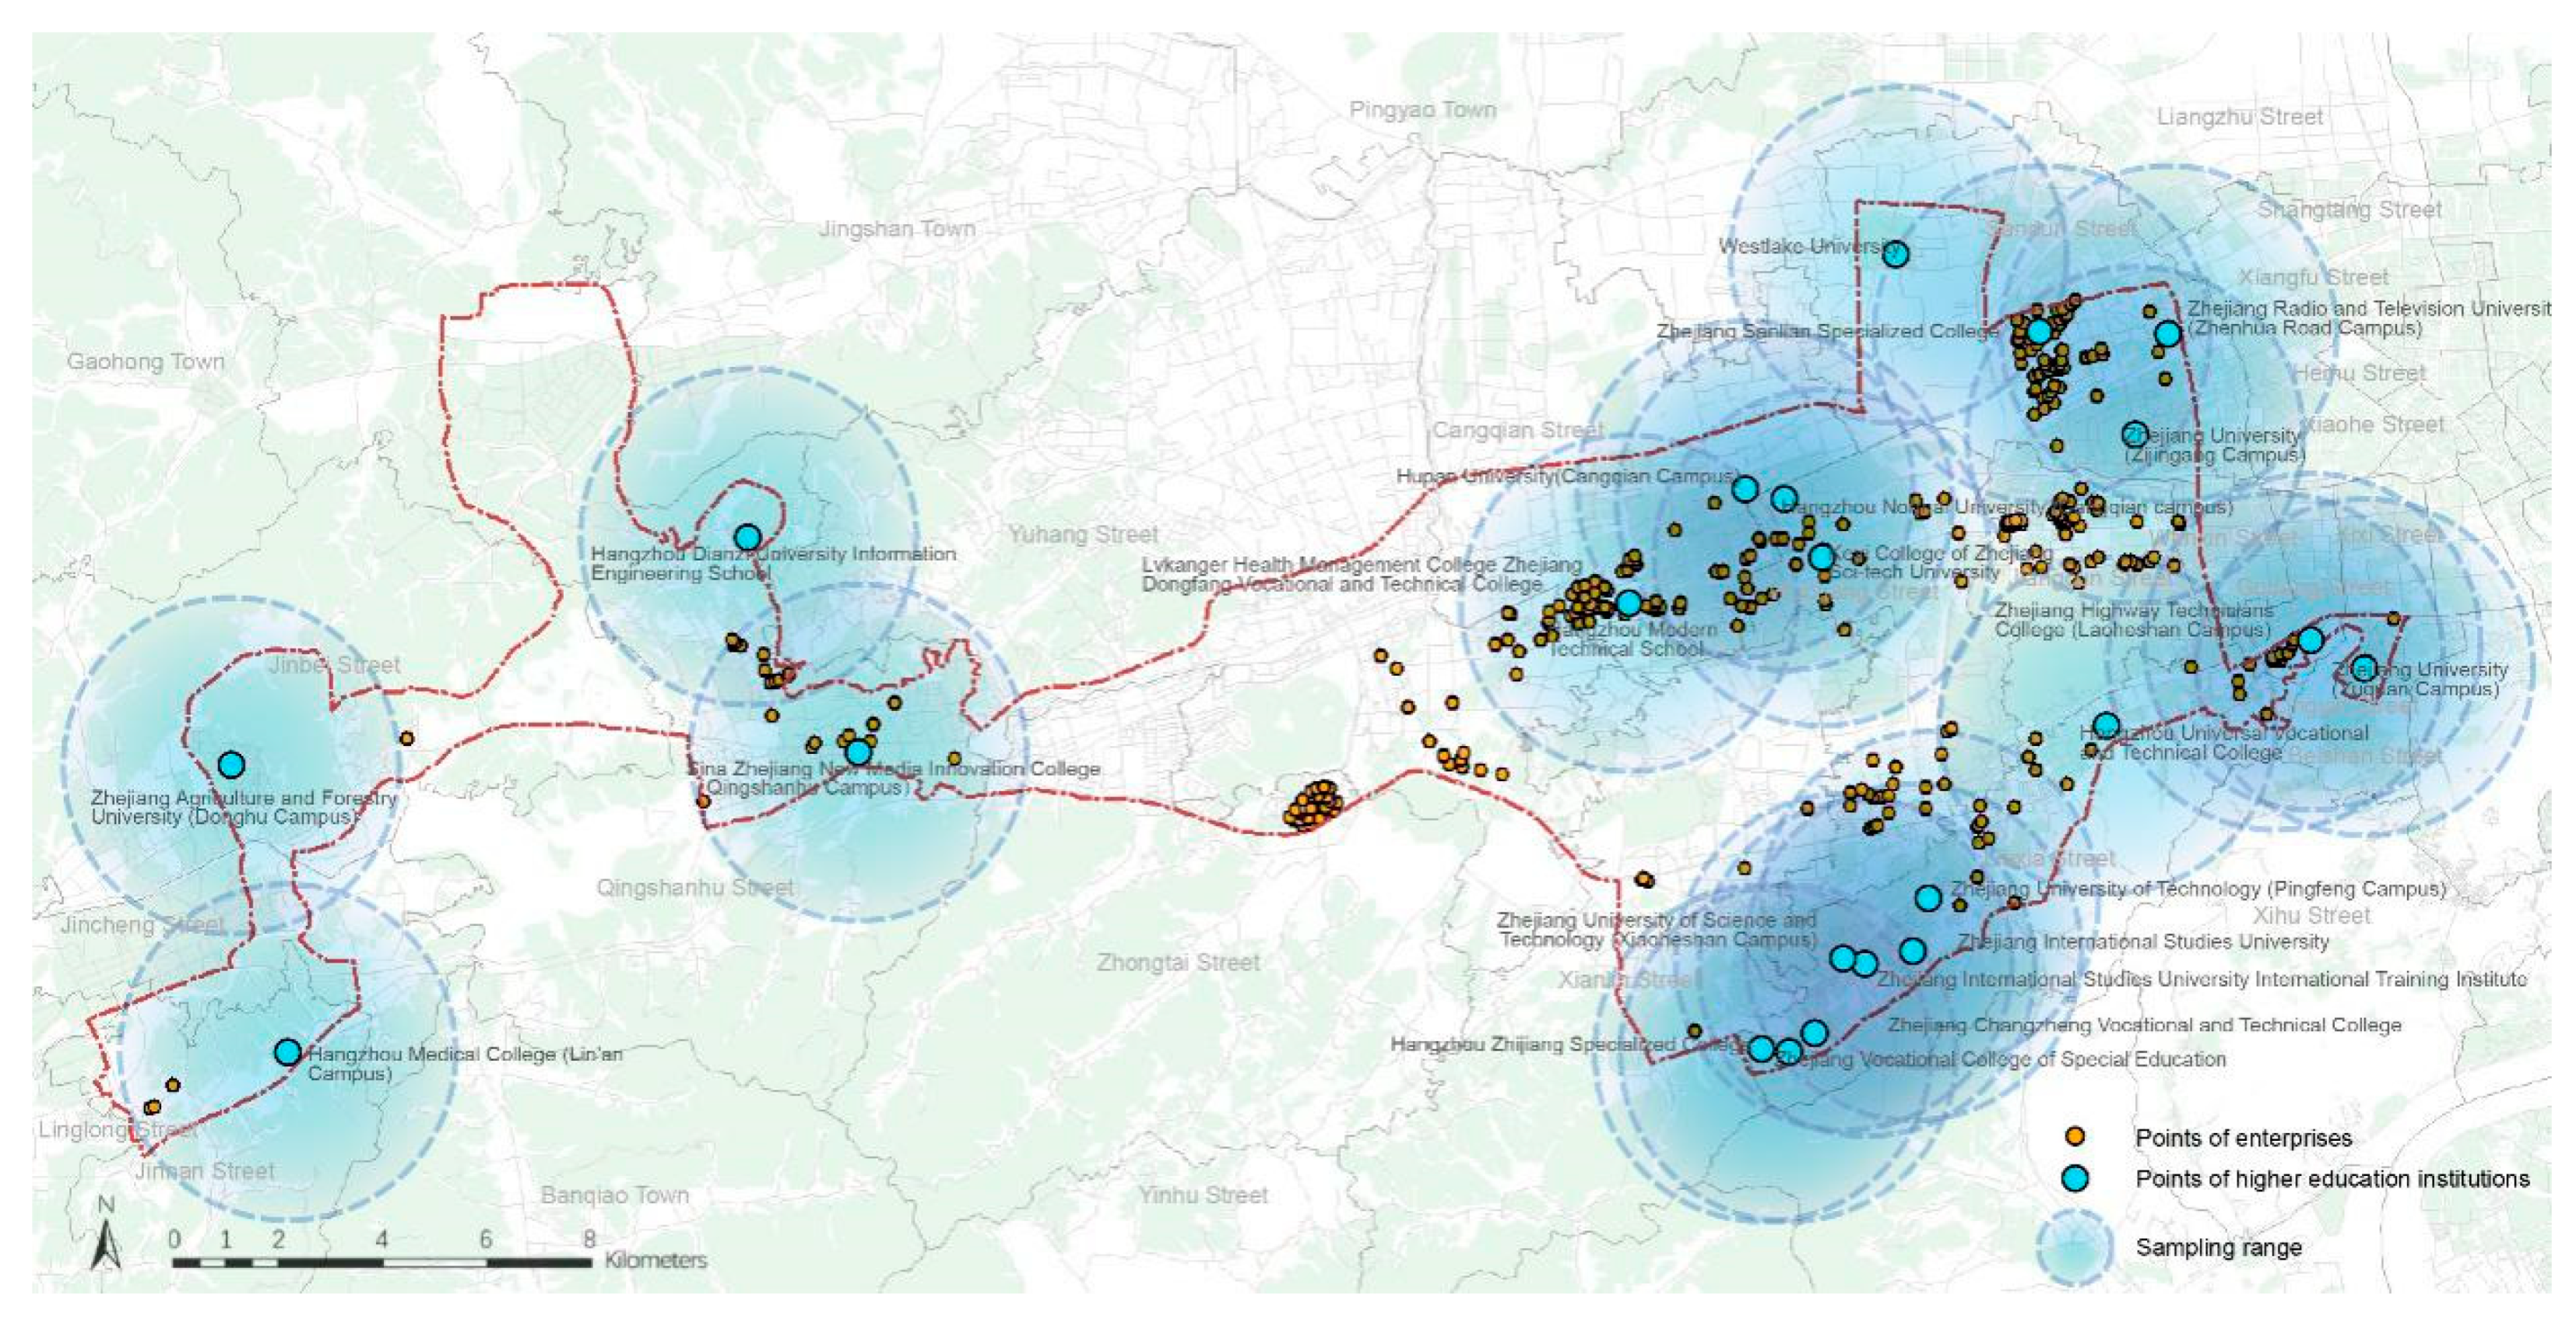
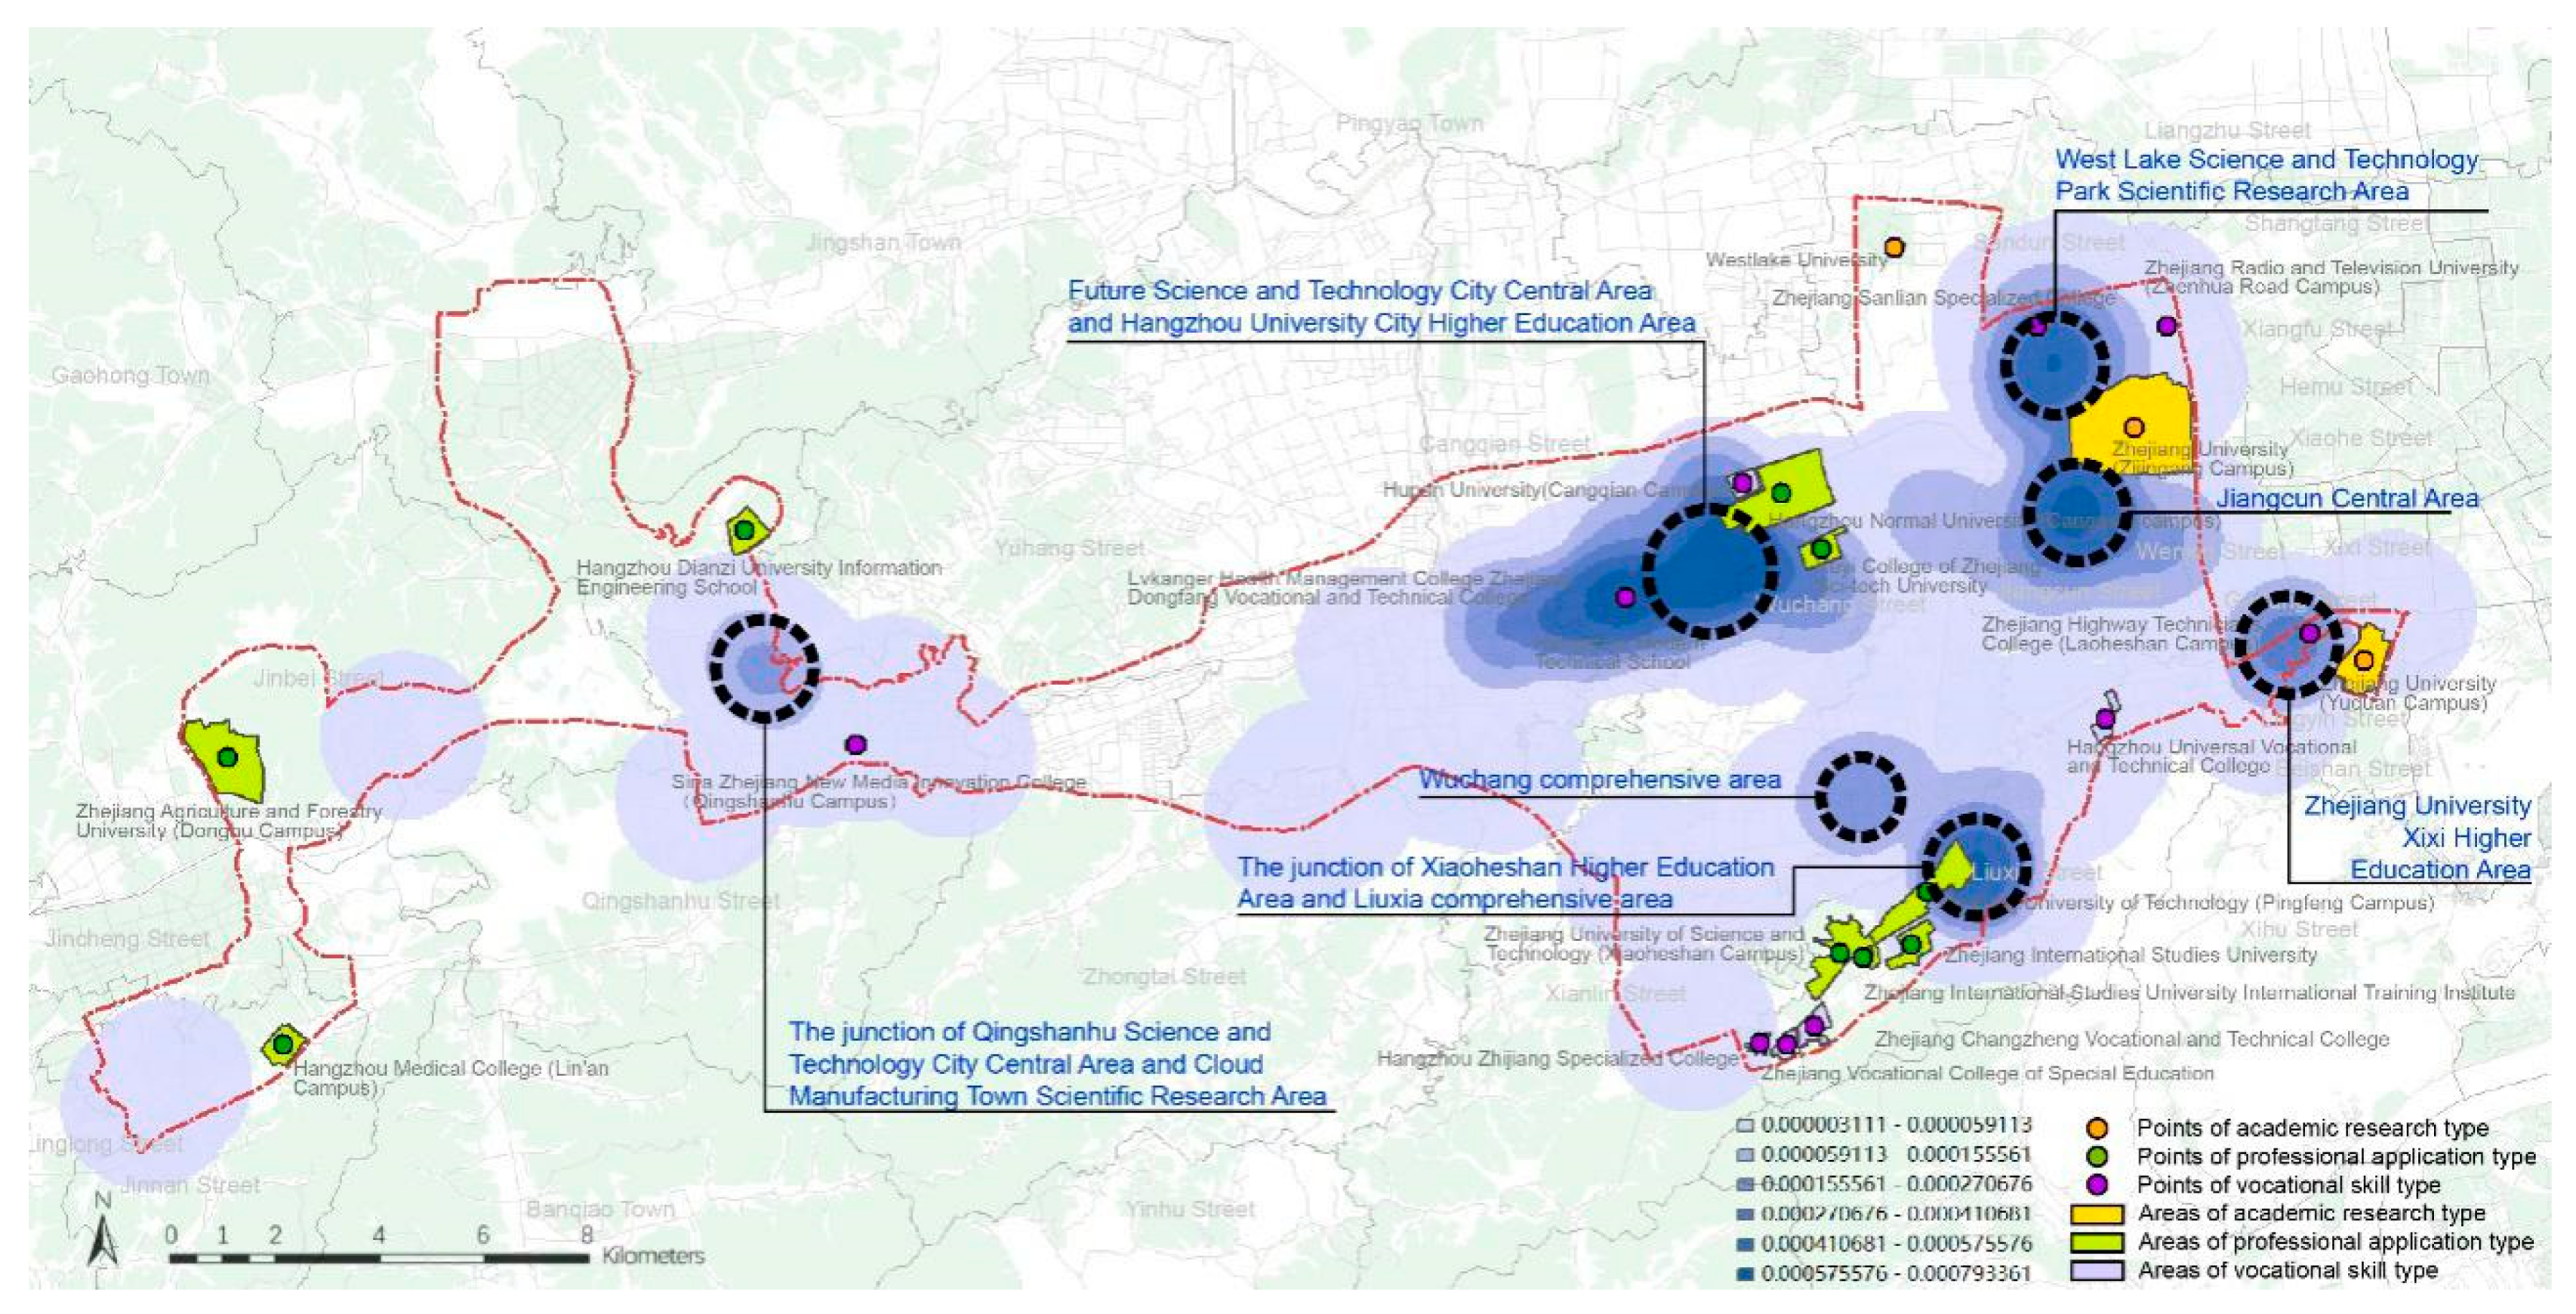
4.3.1. Relevance of Location and Site Selection

By overlapping the kernel density of the STEs with the spatial distribution map of the HEIs (see Figure 7), the relevance of location selection can be clearly seen: the 7 areas of the Corridor in which the STEs are concentrated are all geographically close to universities or colleges; additionally, they are located in the areas where the HEIs are clustered. For example, the border between the Xiaoheshan Higher Education Area and the Liuxia Comprehensive Area, where many enterprises are clustered, is adjacent to many colleges in the Xiaoheshan Higher Education Area; the Zijingang Campus of Zhejiang University is surrounded by a group of STEs, and these STEs are especially concentrated in the Westlake Science and Technology Park Research Area and the Jiangcun Central Area.

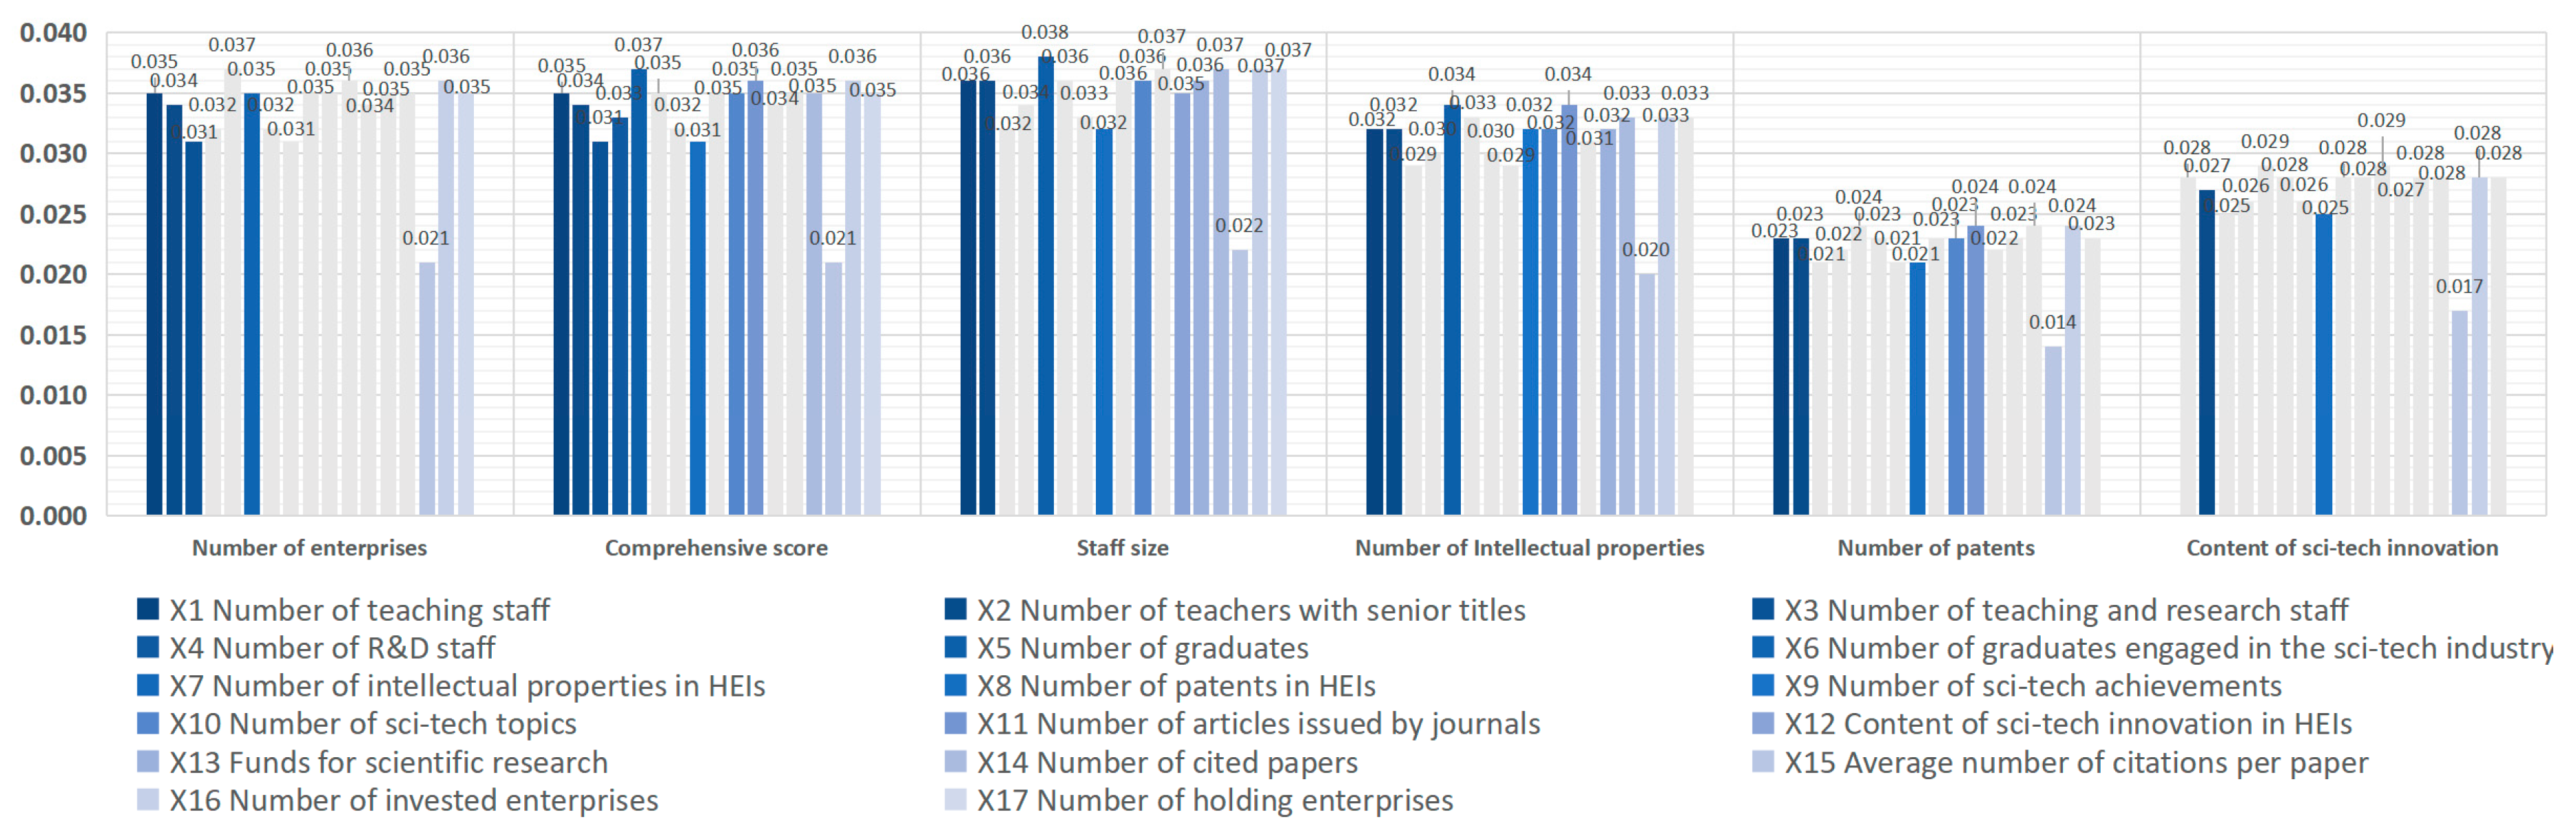
4.3.2. Correlations among Innovation Indicators of All the Higher Education Institutions and the Development Indicators of the Sci-Tech Enterprises

By observing the distribution of higher education institutions and sci-tech enterprises in the Corridor, it can be seen that the enterprises are basically distributed within three kilometers around the HEIs. The development status of the STEs located near universities and colleges is determined based on the aggregation degree, development scale and innovation ability of each STE. The correlations among innovation indicators of all the HEIs and the development indicators of the STEs would be analyzed by using PLSR.
Step 1: Perform principal component analysis by cross-validity analysis and VIP analysis to confirm that the optimal number of principal components is 1 (see Table 3). The cross-validity can be reflected by the value of Qh2.
Q h 2 = 1 PRESS h / SS ( h 1 )
In the Formula (2), h is the number of principal components. SS is the error sum of squares, PRESS is the predicted error sum of squares. SS and PRESS are the intermediate process values of cross-validity analysis. When there is only 1 principal component, Qh2 = 1; when there are 2 principal components, Qh2 ≤ 0.0975; thus, the optimal number of principal components is 1.
Step 2: principal components U1 and V1are extracted, and accuracy analysis is performed.
The comprehensive extraction ratio of principal component U1 for all 17 independent variables is 0.955 (variance interpretation rate, i.e., 95.5%), with a high extraction ratio. Among them, X15 has a high information extraction ratio of 0.602. The information extraction ratio of other 16 independent variables is all higher than 0.9 (see Table 4).
The comprehensive extraction ratio of principal component V1 for all 6 dependent variables is 0.939 (variance interpretation rate, i.e., 93.9%), with a high extraction ratio. The principal component V1 has high information extraction ratios for all 6 dependent variables Y, which were 0.959, 0.961, 0.904, 0.963, 0.921 and 0.928 (see Table 5).
Step 3: Analyze the correlation between X and Y.
The results of the PLSR analysis are as follows (see Figure 8 and Table 6):
(1)
The number of teaching staff, number of teachers with senior titles, number of teaching and research staff, number of graduates engaged in the sci-tech industry, average number of citations per paper, number of invested enterprises, and number of holding enterprises of HEIs all have significant positive influences on the number of STEs within 3 km of these HEIs at the 0.01 significance level. There is no significant correlation between the other 10 indicators and the number of enterprises.
(2)
The number of teaching staff, number of teachers with senior titles, number of teaching and research staff, number of R&D staff, number of graduates, number of patents, number of sci-tech topics, number of articles issued by journals, number of cited papers, average number of cited papers, number of invested enterprises, and number of holding enterprises of HEIs all have significant positive influences on the comprehensive score of the STEs within 3 km of these HEIs at the 0.01 significance level. There was no significant correlation between the other 5 indicators and the comprehensive score.
(3)
The number of teaching staff, number of teachers with senior titles, number of patents, number of sci-tech topics, content of sci-tech innovation, funds for scientific research, number of cited papers, average number of citations per paper, number of invested enterprises, and number of holding enterprises of HEIs all have significant positive influences on the staff size of STEs within 3 km of these HEIs at the 0.01 significance level. There is a significant positive relationship between the number of cited papers and staff size at the 0.05 significance level, and this relationship has a regression coefficient of 0.017. There is a significant positive relationship between the number of graduates and staff size at the 0.1 significance level, and this relationship has a regression coefficient of 0.003. There is no significant correlation between the other 5 indicators and staff size.
(4)
The number of teaching staff, number of teachers with senior titles, number of graduates, number of sci-tech achievements, number of sci-tech topics, number of articles issued by journals, number of cited papers, average number of citations per paper, and number of invested enterprises of HEIs all have significant positive influences on the number of intellectual properties of STEs within 3 km of these HEIs at the 0.01 significance level. Funds for scientific research have a significant positive influence on the number of intellectual properties of STEs at the 0.05 significance level, and this relationship has a regression coefficient of 0.003. There is no significant correlation between the other 7 indicators and the number of intellectual properties of STEs.
(5)
The number of teaching staff, number of teachers with senior titles, number of articles issued by journals, average number of citations per paper, and number of invested enterprises of HEIs all have significant positive influences on the number of patents held by STEs within 3 km of these HEIs at the 0.01 significance level. The number of sci-tech topics addressed by universities and colleges has a significant positive influence on the number of patents held by STEs at the 0.05 significance level, and this relationship has a regression coefficient of 0.020. The number of patents held by HEIs has a significant positive influence on the number of patents held by STEs at the 0.1 significance level, and this relationship has a regression coefficient of 0.003. There is no significant correlation between the other 10 indicators and the number of patents held by STEs.
(6)
The number of teachers with senior titles, number of patents, average number of citations per paper, and number of invested enterprises of HEIs all have significant positive influences on the content of sci-tech innovation within 3 km of these HEIs at the 0.05 significance level. There is no significant correlation between the other 13 indicators and the content of sci-tech innovation.
In conclusion, seven HEI innovation indicators, namely, the number of teaching staff, number of teachers with senior titles, number of teaching and research staff, number of graduates engaged in the sci-tech industry, average number of citations per paper, number of invested enterprises, and number of holding enterprises have a significant positive influence on the number of STEs that surround these institutions. Ten HEI innovation indicators, namely, the number of teaching staff, number of teachers with senior titles, number of graduates, number of patents, number of sci-tech topics, number of articles issued by journals, number of cited papers, average number of citations per paper, number of invested enterprises, and number of holding enterprises, have a significant positive influence on the development level of the surrounding STEs. Three HEI innovation indicators, namely, the number of teachers with senior titles, average number of citations per paper, and number of invested enterprises have a significant positive influence on the innovation level of the surrounding STEs. The indicators denoting the number of teachers with senior titles, average number of citations per paper, and number of invested enterprises have the highest correlation with the enterprise development indicators.

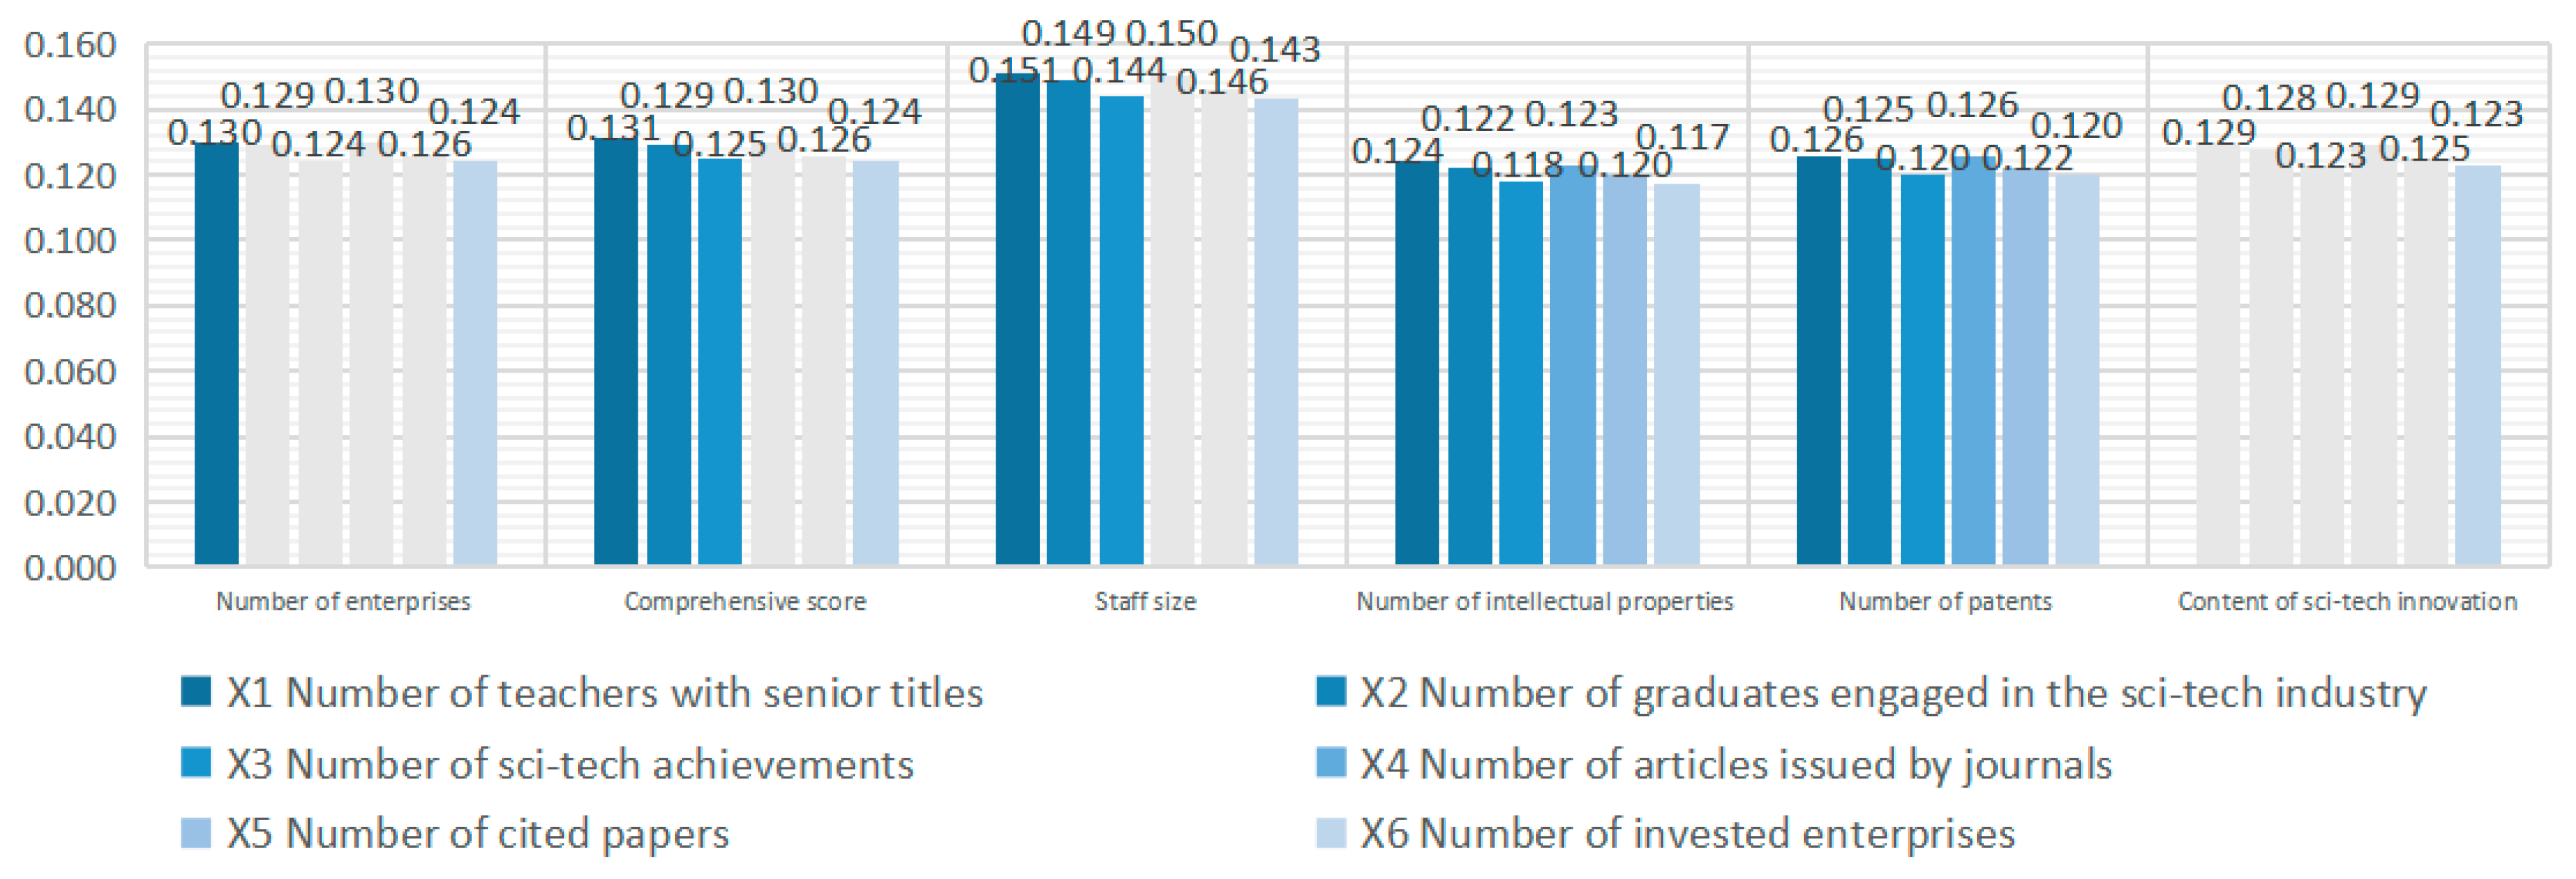
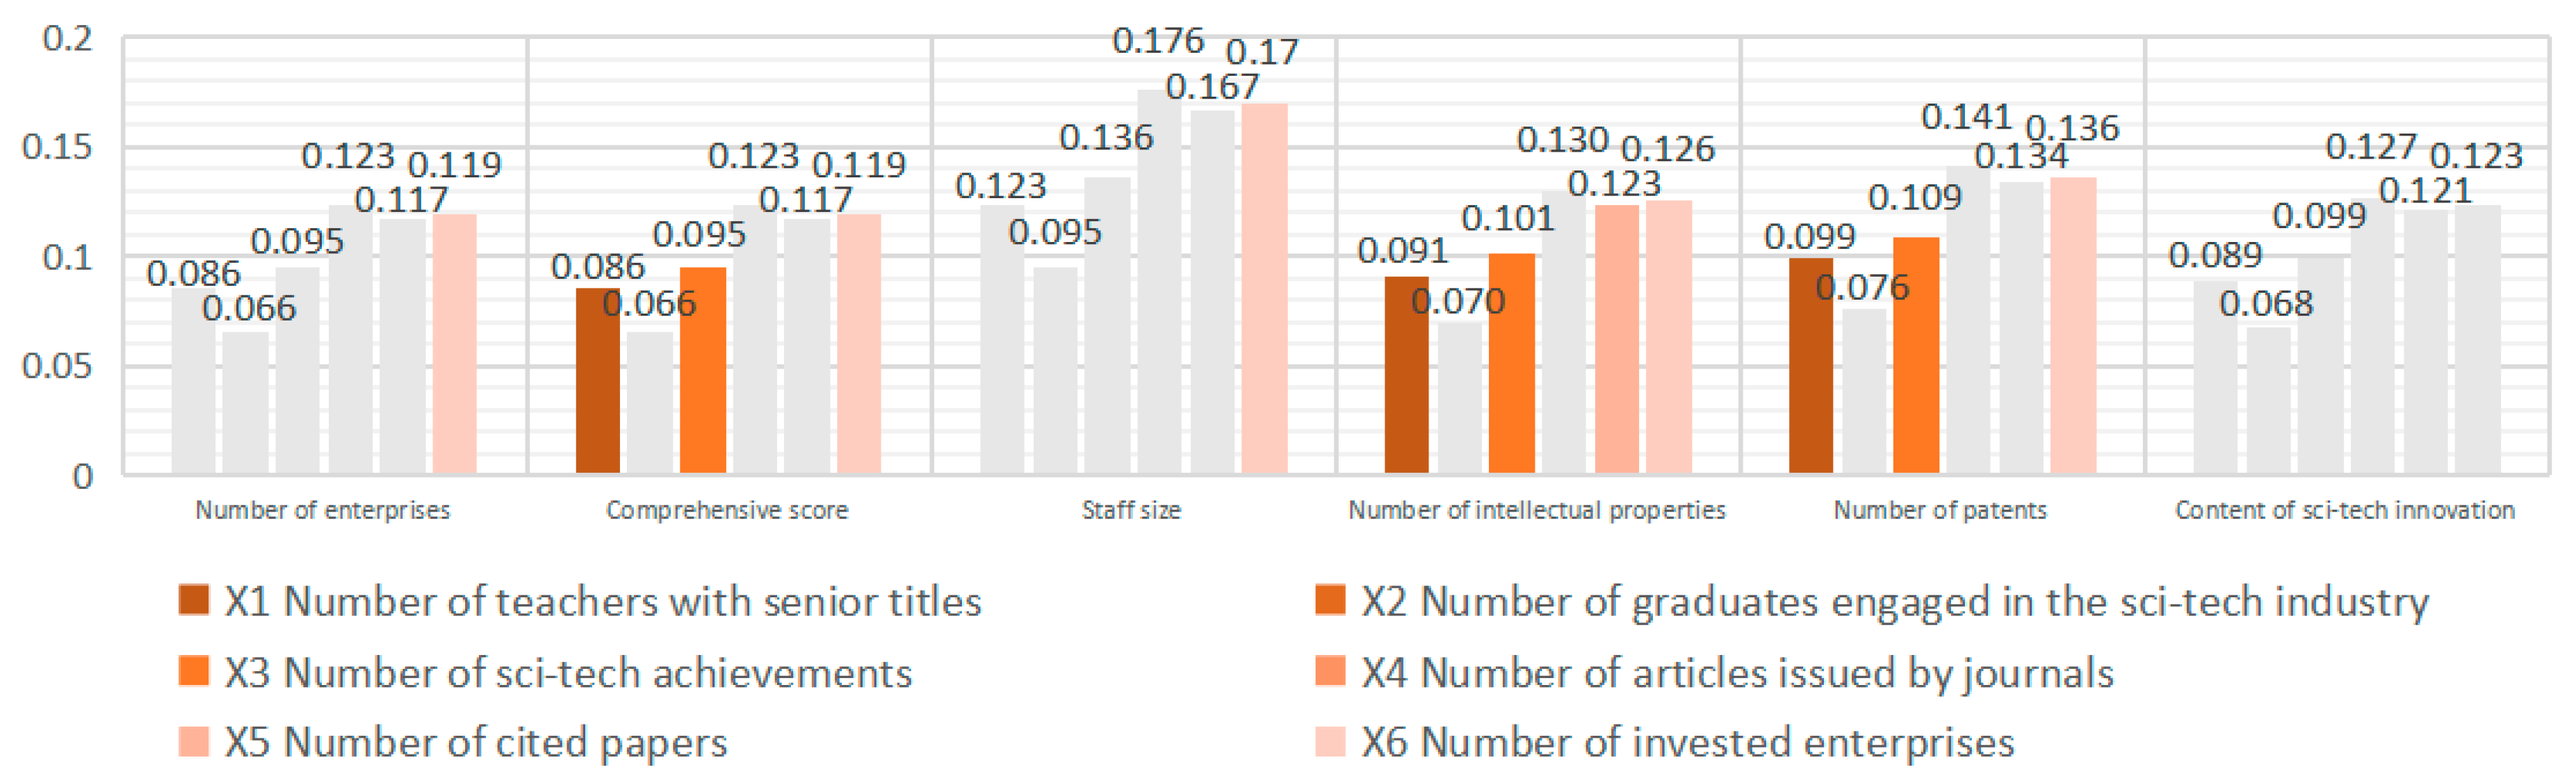
4.3.3. Correlations between the Innovation of the Different Types of Higher Education Institutions and the Development of Sci-Tech Enterprises

Six indicators are selected from the above 17 indicators as independent variables, and a PLSR is performed with these six independent variables and the dependent variables to analyze the correlation between the different types of HEIs and the development of STEs. These six independent variables are the number of teachers with senior titles (X1), number of graduates engaged in the sci-tech innovation industry (X2), number of sci-tech achievements (X3), number of articles issued by journals (X4), number of cited papers (X5), and number of invested enterprises (X6). The regression results are as follows (see Table 7 and Table 8):
(1)
Number of teachers with senior titles (X1): This indicator, corresponding to all three types of HEIs, has a significant positive influence on the comprehensive scores, number of intellectual properties, and number of patents of STEs at the 0.01 significance level; however, it has no significant correlation with the content of sci-tech innovation. This indicator of Type I and Type II HEIs has significantly positive correlations with the number of enterprises and staff size; however, the indicator of Type III HEIs shows no significant correlation.
(2)
Number of graduates engaged in the sci-tech innovation industry (X2): This indicator of Type I and Type II HEIs has significant positive influences on the comprehensive score, staff size, number of intellectual properties, and number of patents of STEs at the 0.01 significance level; however, it has no significant correlation with the other two indicators. Furthermore, the indicator of Type III HEIs has no significant correlation with any of the dependent variables.
(3)
Number of sci-tech achievements (X3): This indicator, corresponding to all three types of HEIs, has a significant positive influence on the comprehensive scores, number of intellectual properties, and number of patents of STEs at the 0.01 significance level; however, it has no significant correlation with the number of surrounding enterprises or the content of sci-tech innovation. This indicator of Type I and Type II HEIs has significantly positive correlations with staff size; however, the indicator of Type III HEIs shows no significant correlation.
(4)
Number of articles issued by journals (X4): This indicator of Type I and Type II HEIs has significant positive influences on the number of intellectual properties and number of patents of STEs at the 0.01 significance level; however, it has no significant correlation with the other four indicators. This indicator of Type III HEIs has no significant correlation with any of the dependent variables.
(5)
Number of cited papers (X5): This indicator of Type I and Type II HEIs has significant positive influences on the number of intellectual properties of STEs at the 0.05 significance level and has significant positive influences on the number of patents at the 0.01 significance level. This indicator of Type III HEIs has a significant positive influence on the number of intellectual properties at the 0.1 significance level but no significant correlation with the other five dependent variables.
(6)
Number of invested enterprises (X6): This indicator, corresponding to all three types of HEIs, has a significant positive influence on the number of surrounding enterprises as well as on the comprehensive scores, staff size, number of intellectual properties and number of patents of STEs at the 0.01 significance level. This indicator of Type I and Type II HEIs has significantly positive correlations with the content of sci-tech innovation; however, the indicator of Type III HEIs shows no significant correlation.
In conclusion, when examining the results of the regression analyzing the innovation indicators of the different types of HEIs and the development indicators of the surrounding STEs, the following observations are made (see Figure 9 and Figure 10): With respect to the number of HEI innovation indicators that have a significant positive influence on the STE development indicators, the innovation indicators corresponding to Type I and Type II HEIs are significantly more influential than those corresponding to Type III HEIs. In terms of the explanatory power of the HEIs innovation indicators on the STE development indicators (the R squared value), the Type I and Type II HEI innovation indicators are more powerful than the Type III HEI indicators. All three types of HEIs innovation indicators have strong, significant and positive impacts on the comprehensive scores, number of intellectual properties, and number of patents of STEs; however, they exhibit weak significantly positive correlations with the number of surrounding enterprises and the content of sci-tech innovation of STEs. The innovation indicators of Type I and Type II HEIs have strong significantly positive correlations with the staff size; however, the innovation indicators of Type III HEIs have a weak significantly correlation on this factor.

5. Conclusions and Discussion

The future development of sci-tech parks are the major land use types and space carriers of urban development. From the perspective of innovation-driven social and economic development, sci-tech parks and enterprises must employ their existing innovative elements to guarantee the diversified support of sci-tech industries. As they are an important source of innovation factors, such as intelligence, technology, and talent, the various types of HEIs will provide strong support for the development of STEs in the future.
This study focuses on the correlation between HEI innovation and STE development. The Hangzhou West Hi-tech Corridor is selected as the case study because it exhibits the latest trend of urbanization development in China. The Corridor is dominated by the sci-tech industry and is an innovative space that is composed of various innovative factors, such as sci-tech parks, HEIs, and scientific research institutes. PLSR is used to analyze the correlations between the teaching staff, talent cultivation, quality of scientific research, academic influence, and university–enterprise cooperation of HEIs, and the aggregation degree, development level and innovation level of STEs. Accordingly, this study on the correlation between the agglomeration of innovation resources in HEIs and development of sci-tech parks’ enterprises can optimize the allocation of innovation resources in urban innovative districts and improve the land use efficiency and regional comprehensive innovation level. Futhermore, it provides references for constructions of sci-tech parks in urban innovative districts and industry-university-research cooperation, and supports for the advancement of urbanization and regional innovation and sustainable development.
The main research conclusions of this paper are as follows:
(1)
Overall, there is a significantly positive correlation between the innovation of HEIs and the development of the surrounding STEs. The indicators denoting the number of teachers with senior titles, average number of citations per paper, and number of invested enterprises of HEIs exhibit the highest correlation with the enterprise development indicators.
As the source of knowledge, technology, intelligence and talents, HEIs have played an important role in the development of urban innovative districts, especially the surrounding STEs. Improving the senior teaching staff, academic influence and the number of invested enterprises in HEIs may promote the development of STEs in the surrounding areas. Therefore, in the urban innovative spatial planning, the spatial layout of HEIs and STEs should be optimized to strengthen the spatial connection between them, and the university-industry cooperation mechanism should be improved in order to form a collaborative innovation circle of industry–university interaction, namely, “branch campus of top academic research and professional application HEIs + high-end vocational skill HEIs + sci-tech parks”.
(2)
The teaching staff of HEIs has a significant positive influence on the comprehensive scores of enterprises. The academic influence of HEIs has a significant positive influence on the comprehensive scores, staff sizes and number of intellectual properties of STEs. Furthermore, university-enterprise cooperation has a significant positive influence on the number of enterprises surrounding HEIs, as well as the comprehensive scores and staff sizes of STEs.
Therefore, it can be inferred that increasing the number of teachers and improving the quality of high-level teachers of HEIs would be conducive to improving the comprehensive scores of the surrounding enterprises. Enhancing the academic influence of HEIs would be conducive to promoting the development levels and innovation levels of the surrounding STEs. Increasing the number of investing and holding enterprises of HEIs would be conducive to the agglomeration of the surrounding enterprises and to the enhancement of the development levels of the surrounding STEs.
(3)
The correlation between the innovation indicators of academic research HEIs and professional application HEIs and the development indicators of STEs is stronger than the correlation between vocational skill HEIs and the development indicators of STEs. The explanatory power of the independent variables to explain the dependent variables in academic research HEIs and professional application HEIs is generally more powerful than that of vocational skill HEIs.
In the future urban innovative districts planning, the existing innovation resources should be anchored, and the innovative leading effects of academic research universities should be highlighted to strengthen the spillover of innovation elements to STEs. The first is to introduce high-quality innovative resources by strengthening cooperation with top universities at home and abroad and encouraging them to settle in and build branch schools. The second is to improve the innovation quality of high-end vocational skill schools to make up for the shortage of senior technical personnel training.
(4)
The innovation indicators of academic research HEIs and professional application HEIs have strong significantly positive correlations with the comprehensive scores, staff size, number of intellectual properties and number of patents of STEs; however, they have a weak correlation with the number of enterprises and the content of sci-tech innovation of STEs. The innovation indicators of vocational skill HEIs have a strong significantly positive correlation with the comprehensive scores, number of intellectual properties and number of patents of STEs; however, they have a weak or no significantly correlation with number of enterprises surrounding these HEIs as well as the staff sizes and the content of sci-tech innovation of the STEs.
The contributions of this study can be seen more clearly when it is compared with several previous studies. Some previous studies have discussed the factors that influence industry-university-research cooperation from different perspectives. Jiuru Zhao (2018) believed that when selecting university partners, enterprises should first evaluate the status, scale, reputation and scientific research quality of the universities, including the number of scientific researchers, the number of patent, and the number of co-authors’ papers [80]. Maietta Ornella Wanda (2015) proposed that the factors affecting university-industry cooperation include academic research quality, university scale, faculty composition, and researcher qualifications [58]. Xi Peng & Min Xue (2016) concluded that the research quality of universities is one of the factors influencing the cooperation [81]. The influencing factors mentioned in these studies support some of the results of this study. These innovation resources of HEIs have a positive impact on the development of STEs and can promote the industry-university-research cooperation. However, these studies are mostly based on empirical analysis of cooperation cases or qualitative research summarized by previous experience, which is different from the relevance of quantitative analysis in this study. Also, the previous studies only put forward the influencing factors of industry-university-research, but did not specify whether these factors have a positive or negative impact and what aspects they have affected. In this study, indicators are extracted from the two subjects of HEIs and STEs respectively for regression analysis. The results can reflect the influence of different innovation resources on different aspects of STEs’ development.
Some scholars argued that professional application HEIs are more likely to carry out industry-university-research cooperation. Arvanitis (2005) pointed out that professional application HEIs are closer to the technology needs of enterprises and are more likely to collaborate with enterprises [82]. Dichu Xiao (2014) and Haifeng Liu (2014) considered that the most important thing of establishing professional application HEIs is to carry out industry-university-research cooperation, which indicates that professional application HEIs are more suitable for industry-university-research cooperation [83,84]. These results prove that professional application HEIs have a stronger correlation and greater influence on enterprise development than vocational skill HEIs. However, they have neglected the role of academic research HEIs. Compared with the other two kinds of HEIs, the academic research HEIs have a stronger level of innovation resources, which may have a larger radiation capacity and influence scope for the surrounding STEs.
In summary, this study mainly focuses on the sci-tech parks, one of the new land use types, and the correlation among different innovative subjects in the urban innovative districts at the stage of urbanization transformation. This manuscript mainly focuses on the influence of innovation resources in higher education institutions on the development of sci-tech parks’ enterprises. Our findings fill the gap in quantitative research on the correlations among different innovative subjects in the context of innovative development and find out the indicators of innovation factors in HEIs which are significantly correlated with the development of STEs.
This study mainly explores the influence of various innovative resources in HEIs on the development of STEs in sci-tech parks around them. As an important base for the transformation of HEIs’ scientific research achievements, sci-tech parks are major carriers for the future urban development and a key node in the urban innovation space network. They provide a platform for HEIs and research institutions to transform their research achievements so as to realize the value of research achievements. On the other hand, the input of various innovative resources such as knowledge, technology and talents also promotes the development of the park’s sci-tech and innovation industry and the improvement of its innovation level.
The connection between HEIs and sci-tech parks is an important part of urban innovation space network. In the practice of industry–university–research, the innovation influence of HEIs is not only limited to the surrounding STEs, but also radiated to the surrounding cities, regions and even foreign countries. This is particularly evident in academic research HEIs and professional application HEIs. For example, Zhejiang University undertakes the tasks of decision-making consultation, academic research and talent training and has provided scientific and technological services to more than 3000 enterprises and institutions in China. It has also established cooperative relations with universities, research institutes, sci-tech parks and enterprises in Europe, the United States, Canada, Japan, and other regions and countries. At present, the national strategies of regional coordinated development and Yangtze River Delta integration are gradually advancing. As a key core city in the Yangtze River Delta area, Hangzhou’s innovative resources have broken provincial boundaries and radiate to neighboring cities such as Shanghai, Suzhou, Hefei, et al. HEIs cooperate with sci-tech parks in surrounding cities to build laboratories, research and development centers, innovation practice bases and other projects. The connection between them has expanded from the inner city to the periphery of the city, and then to the overall regional innovation and collaborative development of the urban agglomeration.
There are some limitations to this study with respect to indicator selection and the areas sampled. First, when selecting the indicators of HEI innovation and STE development, this study referred to previous studies on this topic and the relevant national policies, regulations and investigation reports. However, only some of the available indicators were selected as the analysis variables, which may have had an impact on the research results. Additionally, this study set the areas to be sampled for sci-tech enterprise data to a radius of three kilometers around each HEI due to the actual distribution of the HEIs and STEs in the Corridor, a factor that may have also affected the research results.
Future research will discuss the effects of different innovation activity subjects on the development of sci-tech parks and industry-university-research cooperation. Furthermore, it will also explore the land use changes, space-time evolution and spatial planning in the urban innovative districts in the context of urbanization. The results will be verified through the comparative analysis in different urban innovative districts.

Author Contributions

Y.W. was responsible for the conception and methodology of the research and designed the research idea; Y.Y. collected and processed data, completed the calculation and analysis, and wrote the manuscript; Q.C. and W.X. provided data and made suggestions on the data processing method; Y.W. and Q.C. are responsible for future questions from readers; Q.C. is the corresponding author. All authors have read and agreed to the published version of the manuscript.

Funding

This research was supported by the National Natural Science Foundation of China (No. 51778599).

Acknowledgments

The authors are grateful for the support of the National Natural Science Foundation of China. The contents of this paper are solely the responsibility of the authors and do not represent the official views of the institutes and funding agencies.

Conflicts of Interest

The authors declare no conflict of interest.

References

  1. Kosovac, A.; Acuto, M.; Jones, T.L. Acknowledging Urbanization: A Survey of the Role of Cities in UN Frameworks. Glob. Policy 2020, 11, 293–304. [Google Scholar] [CrossRef]
  2. Dadao, L. The framework of geographical research on urbanization. Geogr. Sci. 2013, 33, 897–901. [Google Scholar]
  3. Gu, C.; Hu, L.; Cook, I.G. China’s Urbanization in 1949–2015: Processes and Driving Forces. Chin. Geogr. Sci. 2017, 27, 84–7859. [Google Scholar] [CrossRef]
  4. Raźniak, P.; Dorocki, S.; Winiarczyk-Raźniak, A. Spatial changes in the command and control function of cities based on the corporate centre of gravity model. Misc. Geogr. 2020, 24, 35–41. [Google Scholar] [CrossRef] [Green Version]
  5. Dorocki, S.; Raźniak, P.; Winiarczyk-Raźniak, A.; Boguś, M. The Role of Global Cities in Creation of Innovative Industry Sectors. Case Study—Life Sciences Sector. In Proceedings of the 5th International Conference IMES, University of Economics, Prague, Czech Republic, 25–26 May 2017; Dvouletý, O., Lukeš, M., Mísar, J., Eds.; pp. 136–146. [Google Scholar] [CrossRef]
  6. Derudder, B.; Cao, Z.; Liu, X.; Shen, W.; Dai, L.; Zhang, W.; Caset, F.; Witlox, F.; Taylor, P.J. Changing Connectivities of Chinese Cities in the World City Network, 2010–2016. Chin. Geogr. Sci. 2018, 28, 183–201. [Google Scholar] [CrossRef] [Green Version]
  7. Website of Central People’s Government of the People’s Republic of China. The Statistical Bulletin on National Economic and Social Development of People’s Republic of China in 2019. Available online: http://www.gov.cn/xinwen/2020-02/28/content_5484361.htm (accessed on 18 September 2020).
  8. Ministry of Housing and Urban-Rural Development of the People’s Republic of China. Urban Construction Statistical Yearbook; China Statistical Press: Beijing, China, 2018; pp. 7–18.
  9. Xu, H.; Liu, W.H.; Zhang, X.Z. The Empirical Analysis of Industrial Parks Development and Urbanization Process Take Jiangxi Province as an Example. In Proceedings of the 2010 International Conference of Information Science and Management Engineering, ISME 2010, Xi’an, China, 7–8 August 2010; pp. 389–392. [Google Scholar] [CrossRef]
  10. Bacильєвa, О.І. Industrial parks as a tool to promote the development of regions. Management 2016, 9, 213–221. [Google Scholar]
  11. Zhang, J. Research on the relationship between industrial park development and industrialization and urbanization. Manag. J. 2011, 9, 54. [Google Scholar]
  12. Lecluyse, L.; Knockaert, M.; André, S. The contribution of science parks: A literature review and future research agenda. J. Technol. Transf. 2019, 44, 559–595. [Google Scholar] [CrossRef]
  13. He, J.; Liu, N. Shekou mode: A new social technology innovation. Spec. Zone Econ. 2014, 12, 53–59. [Google Scholar]
  14. Wu, Y. Shaping a mature urban form for the science park conceptual plan of new Zhangjiang Hi-thch Park. Archit. Cult. 2007, 3, 24–31. [Google Scholar]
  15. Justin, T. Growth of industry clusters and innovation: Lessons from Beijing Zhongguancun Science Park. J. Bus. Ventur. 2006, 21, 827–850. [Google Scholar] [CrossRef]
  16. Wu, Y. Repairing and Revitalizing Urban Function of Newly Built Urban Area in China—Two Conceptual Planning Projects in Pudong, Shanghai. Archit. Cult. 2007, 3, 13–14; discussion 12. [Google Scholar]
  17. Qiu, B.; Li, H.; Tang, Z.; Chen, C.; Berry, J. How cropland losses shaped by unbalanced urbanization process? Land Use Policy 2020, 96, 104715. [Google Scholar] [CrossRef]
  18. Zeng, Y. Study on Ecological Environmental Problems and Their Countermeasures in the Process of Rural Urbanization. In Proceedings of the 2016 International Conference on Environmental Science and Engineering, Guilin, China, 15 April 2016; pp. 822–827. [Google Scholar]
  19. Zhao, Y.; Bai, Y. Knowledge spillovers: A survey of the literature. Econ. Res. J. 2009, 1, 144–156. [Google Scholar]
  20. Zhao, M.; Cai, H.; Qiao, Z.; Xu, X. Influence of urban expansion on the urban heat island effect in Shanghai. Int. J. Geogr. Inf. Sci. 2016, 30, 2421–2441. [Google Scholar] [CrossRef]
  21. Liu, N.; Wang, J.; Song, Y. Organization Mechanisms and Spatial Characteristics of Urban Collaborative Innovation Networks: A Case Study in Hangzhou, China. Sustainability 2019, 11, 5988. [Google Scholar] [CrossRef] [Green Version]
  22. Bai, J.X.; Zhou, J.K. R & D agglomeration, innovation ability and industrial transformation and upgrading: Empirical research on China’s industrial enterprise data based on 2005–2007. Sci. Decis. Mak. 2017, 1, 1–16. [Google Scholar] [CrossRef]
  23. Entringer, T.C.; Lívia, L.D.S. Critical success factors in science and technology parks: A bibliographic review and analysis. Indep. J. Manag. Prod. 2020, 11, 343–359. [Google Scholar] [CrossRef]
  24. Li, D.; Liu, S.; Kong, Y. Problems and countermeasures in the construction of urban industrial park. J. Shandong Jianzhu Univ. 2018, 33, 65–70. [Google Scholar]
  25. Wang, J.; Liu, N.; Ruan, Y. Influence Factors of Spatial Distribution of Urban Innovation Activities Based on Ensemble Learning: A Case Study in Hangzhou, China. Sustainability 2020, 12, 1016. [Google Scholar] [CrossRef] [Green Version]
  26. Tseng, F.C.; Huang, M.H.; Chen, D.Z. Factors of university-industry collaboration affecting university innovation performance. J. Technol. Transf. 2020, 45, 560–577. [Google Scholar] [CrossRef]
  27. Wang, F.; Liang, X.; Hou, Y. Construction of strategies for the development of high and new technology industrialization in colleges and universities. Mod. Bus. Trade Ind. 2012, 19, 25–27. [Google Scholar] [CrossRef]
  28. Gu, S. Study on University-Industry Interactions and Reconstruction of Innovative Culture. China Soft Ence 2007, 43, 41–48. [Google Scholar] [CrossRef]
  29. Ma, W.; Liu, A. Regional Distribution and Geographical Concentration of Industry-University- Research Cooperation in Chinese Universities. High. Educ. Explor. 2014, 2, 18–23. [Google Scholar]
  30. Securing a Decisive Victory in Building a Moderately Prosperous Society in All Respects and Securing the Great Victory of Socialism with Chinese Characteristics for a New Era—Report Delivered at the 19th National Congress of the Communist Party of China. Available online: http://www.gov.cn/zhuanti/2017-10/27/content_5234876.htm (accessed on 27 October 2017).
  31. Dai, X.; Huang, Z. Research on the introduction of high-quality higher education resources in Shenzhen, Qingdao and Suzhou and its enlightenment to Hangzhou. Mod. Cities 2017, 12, 39–41. [Google Scholar]
  32. The Decision of Zhejiang Provincial Committee of the COMMUNIST Party of China on Building a High-Quality and Powerful Talent Team to Build a High-Level Innovative Province. Available online: http://www.zjzwfw.gov.cn/zjservice/item/detail/lawtext.do?outLawId=f44f686c-2e1e-423f-bef9-1b54015ea88e (accessed on 29 June 2020).
  33. Wu, Y.; Xu, M.; Yang, Y. Research and Evaluation on the Open Space System in Hangzhou West Technology Innovation Corridor. Archit. Cult. 2020, 7, 207–210. [Google Scholar]
  34. Su, S.; Zhou, S.; Shi, X.; Zhang, X. Research and policy Suggestions on the path of Zhejiang innovation development led by Hangzhou West Hi-tech Corridor. Sci. Technol. Econ. 2016, 29, 36–40. [Google Scholar]
  35. Wu, Y.; Song, S. Comparative Study on the Spatial Form of “Internet +” Emerging Industrial Parks in Hangzhou West Innovation Corridor—Taking Xixi Park of Alibaba, the First Phase of ZOTP and Dream Town as Examples. Archit. Cult. 2018, 10, 83–85. [Google Scholar]
  36. Yigitcanlar, T.; Adu-McVie, R.; Erol, I. How can contemporary innovation districts be classified? A systematic review of the literature. Land Use Policy 2020, 95, 104595. [Google Scholar] [CrossRef]
  37. Pancholi, S.; Yigitcanlar, T.; Guaralda, M. Place making for innovation and knowledge-intensive activities: The Australian experience. Technol. Fore. Soc. Chang. 2019, 146, 616–625. [Google Scholar] [CrossRef] [Green Version]
  38. Huggins, R. The evolution of knowledge clusters: Progress and policy. Eco. Dev. 2008, 22, 277–289. [Google Scholar] [CrossRef]
  39. Evans, G.; Hutton, T. Creative cities, creative spaces and urban policy. Urban Stud. 2009, 46, 1003–1040. [Google Scholar] [CrossRef]
  40. Esmaeilpoorarabi, N.; Yigitcanlar, T.; Guaralda, M.; Kamruzzaman, M. Does place quality matter for innovation districts? Determining the essential place characteristics from Brisbane’s knowledge precincts. Land Use Policy 2018, 79, 734–747. [Google Scholar] [CrossRef]
  41. Katz, B.; Wagner, J. The rise of innovation districts: A new geography of innovation in America. Brook. Rep. 2014, 1, 1–34. [Google Scholar]
  42. Hawken, S.; Hoon, H.J. Innovation districts and urban heterogeneity: 3D mapping of industry mix in downtown Sydney. J. Urban Des. 2017, 22, 568–590. [Google Scholar] [CrossRef]
  43. Crevoisier, O. Beyond territorial innovation models: The pertinence of the territorial approach. Reg. Stud. 2014, 48, 551–561. [Google Scholar] [CrossRef]
  44. Cheng, Y.; Liu, Y.; Fan, W.; Yan, Z.; Ye, X. Triple helix on globalization: A case study of the China International Nanotech Innovation Cluster. Inf. Dev. 2019, 35, 272–289. [Google Scholar] [CrossRef]
  45. Clark, W.W., Jr. Science parks: Theory and background. Int. J. Technol. Transf. Commer. 2003, 2, 150–178. [Google Scholar] [CrossRef]
  46. Tajnai, C.E. Fred Terman, the Father of Silicon Valley. IEEE Des. Test Comput. 2007, 2, 75–81. [Google Scholar] [CrossRef]
  47. Luo, Z.; Lu, L. Review of the research on the effect of University Town on economic development. Commer. Times 2009, 23, 122–124. [Google Scholar]
  48. Lin, Y. The enlightenment of foreign university science and technology Parks to the establishment of University Science and Technology parks in China. Sci. Technol. Ind. China 2002, 7, 15–17. [Google Scholar] [CrossRef]
  49. Davies, D. Actions to strengthen university-industry cooperation. Technol. Soc. 1983, 5, 317–323. [Google Scholar] [CrossRef]
  50. Curien, H. Actions to facilitate cooperation between industries, universities and other research organizations: Attitudes and experiences of governmental institutions. Technovation 1989, 9, 235–239. [Google Scholar] [CrossRef]
  51. Etzkowitz, H. Innovation in Innovation: The Triple Helix of University-Industry- Government Relations. Soc. Sci. Inf. 2003, 42, 293–337. [Google Scholar] [CrossRef] [Green Version]
  52. Mier, Z.; Chunyou, W. The transaction cost of industry-University-Research cooperation innovation. Sci. Res. 2001, 19, 89–92. [Google Scholar] [CrossRef]
  53. Inzelt, A. The evolution of university-industry-government relationships during transition. Res. Policy 2004, 33, 975–995. [Google Scholar] [CrossRef]
  54. OECD. University Research in Transition; OECD Publisher: Paris, France, 1999; pp. 13–21. [Google Scholar] [CrossRef]
  55. Gray, D.O. Government-sponsored industry-university cooperative research: An analysis of cooperative research center evaluation approaches. Res. Eval. 2000, 8, 57–67. [Google Scholar] [CrossRef]
  56. Hou, B.; Hong, J.; Shi, X. Efficiency of university–industry collaboration and its determinants: Evidence from Chinese leading universities. Ind. Innov. 2019. [Google Scholar] [CrossRef]
  57. Li, X. A Review of the Factors Influencing the Performance of University-Enterprise Cooperation Innovation. Open J. Bus. Manag. 2020, 8, 1281–1286. [Google Scholar] [CrossRef]
  58. Maietta, O.W. Determinants of University-Firm R&D Collaboration and Its Impact on Innovation: A Perspective from a Low-Tech Industry. Res. Policy 2015, 44, 1341–1359. [Google Scholar] [CrossRef]
  59. Hervas-Oliver, J.L.; Albors-Garrigos, J. The role of the firm’s internal and relational capabilities in clusters: When distance and embeddedness are not enough to explain innovation. J. Econ. Geogr. 2009, 9, 263–283. [Google Scholar] [CrossRef]
  60. D’Este, P.; Patel, P. University–industry linkages in the UK: What are the factors underlying the variety of interactions with industry? Res. Policy 2007, 36, 1295–1313. [Google Scholar] [CrossRef]
  61. Garcia, R.; Araujo, V.; Mascarini, S. The role of geographic proximity for university-industry linkages in Brazil: An emprical analysis. Australas. J. Reg. Stud. 2013, 19, 433. [Google Scholar]
  62. Anselin, L.; Varga, A.; Acs, Z.J. Geographic and sectoral characteristics of academic knowledge externalities. Pap. Reg. Sci. 2000, 79, 435–443. [Google Scholar] [CrossRef]
  63. Arundel, A.; Geuna, A. Proximity and the use of public science by innovative European firms. Econ. Innov. New Technol. 2004, 13, 559–580. [Google Scholar] [CrossRef]
  64. Xu, W. University Science park will become the “export” of university Science and Technology Innovation. Guangdong Sci. Technol. 2003, 9, 21–22. [Google Scholar] [CrossRef]
  65. Florian, F.; Norma, S.; Rodrigo, L.; Barbara, S. Assessing the impacts of higher education institutions on sustainable development-an analysis of tools and indicators. Sustainability 2019, 11, 59. [Google Scholar] [CrossRef] [Green Version]
  66. Yang, D.; Meng, B. University-enterprise cooperation plays an important role in improving technological innovation of enterprises. Ind. Technol. Econ. 2010, 4, 52–54. [Google Scholar] [CrossRef]
  67. Acs, Z.J.; Anselin, L.; Varga, A. Patents and innovation counts as measures of regional production of new knowledge. Res. Policy 2002, 31, 1069–1085. [Google Scholar] [CrossRef]
  68. David, L.R. Technological relatedness and knowledge space: Entry and exit of US cities from patent classes. Reg. Stud. 2015, 49, 1922–1937. [Google Scholar] [CrossRef]
  69. Tartari, V.; Breschi, S. Set the free: Scientists’ evaluations of the benefits and costs of university-industry research collaboration. Ind. Corp. Chang. 2012, 21, 1117–1147. [Google Scholar] [CrossRef]
  70. Bart, V.L.; Paolo, L.; Julie, C.; Van Pottelsberghe, B.; Sapsalis, E.; Debackere, K. Entrepreneurial effectiveness of European universities: An empirical assessment of antecedents and trade-offs. Res. Policy 2011, 40, 553–564. [Google Scholar] [CrossRef]
  71. Roberto, F.; Aldo, G.; Mireille, M. Factors affecting university-Industry R&D projects: The importance of searching, screening and signaling. Res. Policy 2006, 35, 309–323. [Google Scholar] [CrossRef]
  72. Scoring Standard Rules of National Sic-Tech Enterprises Identification. Available online: https://www.sohu.com/a/316998006_100028857 (accessed on 28 May 2019).
  73. Department of Science and Technology of the Ministry of Education. Compilation of Science and Technology Statistics of Higher Education Institutions; Department of Science and Technology of the Ministry of Education: Beijing, China, 2019; pp. 4–256.
  74. Hangzhou Municipal People’s Government. Hangzhou West Hi-Tech Corridor Planning; Hangzhou Municipal People’s Government: Hangzhou, China, 2016; p. 19.
  75. Annual Report on the Employment Quality of Graduates in 2019. Available online: http://wk.yingjiesheng.com/careerreport/?qq-pf-to=pcqq.c2c (accessed on 10 July 2020).
  76. Annual Report on the Quality of Higher Vocational Education in 2019. Available online: https://www.tech.net.cn/column_rcpy/info.aspx?nd=2019&sf=%E6%B5%99%E6%B1%9F%E7%9C%81&lx=0 (accessed on 13 July 2020).
  77. Wang, H.; Wu, Z.; Meng, J. Partial Least Squares Regression—Linear and Nonlinear Methods; National Defense Industry Press: Beijing, China, 2006; pp. 138–149. [Google Scholar]
  78. UNESCO. International Standard Classification of Education (ISCED); UNESCO Institute for Statistics: Paris, France, 2011; pp. 46–84. [Google Scholar] [CrossRef]
  79. Suggestions on the Establishment of Higher Education Institutions during the Period of 13th Five-Year published by Ministry of Education of China. Available online: http://www.moe.gov.cn/srcsite/A03/s181/201702/t20170217_296529.html (accessed on 4 February 2017).
  80. Zhao, J. An Analysis on the Construction Process and Influence Factors of Partnership between Enterprises and Colleges. J. Henan Univ. Sci. Technol. 2018, 38, 4–9. [Google Scholar] [CrossRef]
  81. Xi, P.; Min, X. A Summary of the Study on the Impact of Science Strength on the Cooperative Relationship Strength of University-Industry. Sci. Technol. Innov. Product. 2016, 1, 39–41. [Google Scholar] [CrossRef]
  82. Arvanitis, S.; Kubli, U.; Sydow, N.; Wörter, M. Knowledge and Technology Transfer (KTT) Activities Between Universities and Firms in Switzerland: The Main Facts—An Empirical Analysis Based on Firm-Level Data. Ssrn Electron. J. 2005, 115. [Google Scholar] [CrossRef] [Green Version]
  83. Xiao, D. Reflection and Exploration on the Transformation and Development of local undergraduate institutions. J. Tianzhong 2014, 5, 113–116. [Google Scholar] [CrossRef]
  84. Liu, H. It is imperative to carry out transformation and development project in newly-built undergraduate colleges. J. Tianzhong 2014, 4, 122–125. [Google Scholar] [CrossRef]
Figure 1. Location and spatial layout of Hangzhou West Hi-tech Corridor: (a) China; (b) Study Area of Hangzhou; (c) the Hangzhou West Hi-tech Corridor.
Land 09 00396 g001aLand 09 00396 g001b
Figure 2. Distribution of the Hi-tech Corridor’s functional areas.
Land 09 00396 g002
Figure 3. Areas sampled for the collection of sci-tech enterprise data (Autuors’ design (2020) for figures).
Land 09 00396 g003
Figure 4. Distribution of sci-tech enterprises in each area of the Corridor (Autuors’ design (2020) for figures).
Land 09 00396 g004
Figure 5. The indicators adopted for the kernel density analysis of the development of the sci-tech enterprises in the Corridor are as follows: (a) Number of enterprises; (b) Staff size; (c) Comprehensive score; (d) Number of intellectual properties; (e) Number of patents; (f) Content of sci-tech innovations. (Autuors’ design (2020) for figures).
Land 09 00396 g005
Figure 6. Distribution of the different types of higher education institutions in the Corridor (Autuors’ design (2020) for figures).
Land 09 00396 g006
Figure 7. Relevance of location for sci-tech enterprises and higher education institutions (Autuors’ design (2020) for figures).
Land 09 00396 g007
Figure 8. Standardized regression coefficients (The gray bar charts indicate that independent variables and dependent variables are not significantly correlated.) (Autuors’ design (2020) for figures).
Land 09 00396 g008
Figure 9. Standardization regression coefficients of the Type I and Type II HEIs innovation indicators (The gray bar charts indicate that independent variables and dependent variables are not significantly correlated.) (Autuors’ design (2020) for figures).
Land 09 00396 g009
Figure 10. Standardization regression coefficients of the Type III HEIs innovation indicators (The gray bar charts indicate that independent variables and dependent variables are not significantly correlated.) (Autuors’ design (2020) for figures).
Land 09 00396 g010
Table 1. List of higher education institutions in the Corridor (Autuors’ design (2020) for figures).
ClassifyNo.NameType
Academic research HEIs1Zhejiang University (Yuquan Campus)“985”, “Double First-rate”
2Zhejiang University (Zijingang Campus)“985”, “Double First-rate”
3Westlake UniversityPrivate Research University
Professional application HEIs 4Hangzhou Dianzi University Information Engineering SchoolIndependent College
5Hangzhou Normal University (Cangqian campus)Public Universitiy
6Hangzhou Medical College (Lin’an Campus)Public Universitiy
7Zhejiang University of Technology (Pingfeng Campus)Public Universitiy
8Zhejiang University of Science and Technology (Xiaoheshan Campus)Public Universitiy
9Keyi College of Zhejiang Sci-tech UniversityIndependent College
10Zhejiang Agriculture and Forestry University (Donghu Campus)Public Universitiy
11Zhejiang International Studies UniversityPublic Universitiy
12Zhejiang International Studies University International Training InstituteIndependent College
Vocational skill HEIs13Hangzhou Universal Vocational and Technical CollegeVocational College
14Hangzhou Zhijiang Specialized CollegeVocational College
15Sina Zhejiang New Media Innovation College (Qingshanhu Campus)Vocational College
16Lvkanger Health Management College Zhejiang Dongfang Vocational and Technical CollegeVocational College
17Zhejiang Highway Technicians College (Laoheshan Campus)Technical School
18Zhejiang Sanlian Specialized CollegeVocational College
19Zhejiang Changzheng Vocational and Technical CollegeVocational College
20Zhejiang Vocational College of Special EducationVocational College
21Zhejiang Radio and Television University (Zhenhua Road Campus)Provincial Modern Remote Open University;vocational education;
22Hupan University(Cangqian Campus)Elite Vocational Education
Table 2. Innovation indicators of higher education institutions (Autuors’ design (2020) for figures).
CategoryIndicators
Teaching staff· Number of teaching staff;
· Number of teachers with senior titles;
· Number of teaching and research staff;
· Number of R&D staff;
Land 09 00396 i001
(a) Bar chart of indicators reflecting teaching staff in each HEI of the Corridor
Talent cultivation· Number of graduates;
· Number of graduates engaged in sci-tech innovative industries;
Land 09 00396 i002
(b) Bar chart of indicators reflecting talent cultivation in each HEI of the Corridor
Quality of scientific research· Number of intellectual properties in HEIs;
· Number of patents in HEIs;
· Number of sci-tech achievements;
· Number of sci-tech topics;
· Number of articles issued by journals;
· Content of sci-tech innovation in HEIs;
· Funds for scientific research;
Land 09 00396 i003
(c) Bar chart of indicators reflecting quality of scientific research in each HEI of the Corridor
Academic influence· Number of cited papers;
· Average number of citations per paper;
Land 09 00396 i004
(d) Bar chart of indicators reflecting academic influence in each HEI of the Corridor
University-
enterprise cooperation
· Number of invested enterprises;
· Number of holding enterprises;
Land 09 00396 i005
(e) Bar chart of indicators reflecting university-enterprise cooperation in each HEI of the Corridor
Table 3. Cross-validity analysis (Authors’ computations for estimations).
Number of Principal Components (h)SSPRESSQh2
11.04331 × 10131.35891 × 10131
29.55038 × 10121.47581 × 1013−0.415
39.33967 × 10121.86771 × 1013−0.956
48.63772 × 10121.80303 × 1013−0.931
58.61292 × 10122.1244 × 1013−1.459
68.48462 × 10122.17491 × 1013−1.525
78.04665 × 10122.45115 × 1013−1.889
88.00909 × 10126.24929 × 1013−6.766
97.88746 × 10121.76633 × 1014−21.054
107.8176 × 10126.96579 × 1014−87.315
112.14419 × 10125.53405 × 1014−69.79
122.04149 × 10121.58076 × 1015−736.229
131.22983 × 10126.5545 × 1015−3209.652
145.50372 × 10116.55435 × 1015−5328.468
155.50372 × 10116.55435 × 1015−11,907.956
165.50372 × 10116.55435 × 1015−11,907.956
175.50372 × 10116.55435 × 1015−11,907.956
Table 4. Accuracy analysis of the principal component U1 and X (Authors’ computations for estimations).
XIndependent Variable Principal Component U1
X1Number of teaching staff0.987
X2Number of teachers with senior titles0.986
X3Number of teaching and research staff0.953
X4Number of R&D staff0.986
X5Number of graduates0.943
X6Number of graduates engaged in the sci-tech industry0.937
X7Number of intellectual properties in HEIs0.982
X8Number of patents in HEIs0.955
X9Number of sci-tech achievements0.990
X10Number of sci-tech topics0.985
X11Number of articles issued by journals0.994
X12Content of sci-tech innovation in HEIs0.996
X13Funds for scientific research0.983
X14Number of cited papers0.985
X15Average number of citations per paper0.602
X16Number of invested enterprises0.992
X17Number of holding enterprises0.976
Comprehensive result0.955
Table 5. Accuracy analysis of principal component V1 and Y (Authors’ computations for estimations).
YDependent Variable Principal Component V1
Y1Number of enterprises0.959
Y2Comprehensive score0.961
Y3Staff size0.904
Y4Number of Intellectual properties0.963
Y5Number of patents0.921
Y6Content of sci-tech innovation0.928
Comprehensive result0.939
Table 6. Regression coefficients of the PLSR (Authors’ computations for estimations).
Y1 Number of EnterprisesY2 Comprehensive ScoreY3 Staff SizeY4 Number of Intellectual PropertiesY5 Number of PatentsY6 Content of Sci-Tech Innovation
Con.3048.967184,570.86943,188.55218,263.9543824.7741276.165
Teaching staff
X1Number of teaching staffCoefficient0.027 ***1.682 ***0.461 ***0.181 ***0.022 ***0.009
Standard error0.0050.0120.0040.010.0050.018
X2Number of teachers with senior titlesCoefficient0.066 ***4.015 ***1.101 ***0.431 ***0.053 ***0.022 ***
Standard error0.0010.0010.0070.00400.001
X3Number of teaching and research staffCoefficient0.018 ***1.104 ***0.3030.1190.0140.006
Standard error0020.7020.5230.0900.289
X4Number of R&D staffCoefficient0.0603.688 ***1.0120.3960.0480.020
Standard error0.7290.2200.6020.2931.0780.041
Talent cultivation
X5Number of graduatesCoefficient0.0261.570 ***0.431 *0.169 ***0.0210.009
Standard error0.0720.4090.2260.0110.0590.005
X6Number of graduates engaged in sci-tech industryCoefficient0.077 ***4.7401.3000.5090.0620.026
Standard error0.0011268.51831.7025.4750.1090.271
Quality of the scientific research
X7Number of intellectual properties in HEIsCoefficient0.0030.1930.0530.0210.0030.001
Standard error0.0800.2340.1060.3750.0150.024
X8Number of patents in higher education institutionsCoefficient0.0040.254 ***0.070 ***0.0270.003 *0.001 ***
Standard error0.1500.0850.0040.0220.0020
X9Number of sci-tech achievementsCoefficient0.0422.5620.7030.275 ***0.0340.014
Standard error358.15310.7721.9410.0340.0880.029
X10Number of sci-tech topicsCoefficient0.0251.529 ***0.419 ***0.164 ***0.020 **0.008
Standard error0.0810.0330.1300.0050.0090.047
X11Number of articles issued by journalsCoefficient0.0010.063 ***0.017 **0.007 ***0.001 ***0.000
Standard error0.0270.0010.0070.0010141.203
X12Content of sci-tech innovation in HEIsCoefficient0.0060.3530.097 ***0.0380.0050.002
Standard error3.4020.5920.0090.0220.0060.020
X13Funds for scientific researchCoefficient0.0010.0320.009 ***0.003 **0.0000.000
Standard error0.0090.0280.0010.0020.0140.008
Academic influence
X14Number of cited papersCoefficient0.0000.006 ***0.002 ***0.001 ***0.0000.000
Standard error00.0020018.8461.015
X15Average number of citations per paperCoefficient27.774 ***1701.182 ***466.695 ***182.800 ***22.255 ***9.210 ***
Standard error0.1820.0060.0140.0040.0120.005
University-enterprise cooperation
X16Number of invested enterprisesCoefficient3.109 ***190.433 ***52.243 ***20.463 ***2.491 ***1.031 ***
Standard error0.0160.0010.0010.0090.0050
X17Number of holding enterprisesCoefficient0.554 ***33.902 ***9.301 ***3.6430.4440.184
Standard error0.001008.0780.6790.121
R Squared 0.3120.3120.3340.2680.1380.198
***. Significant at p = 0.01; **. Significant at p = 0.05; *. Significant at p = 0.1.
Table 7. PLSR results of the Type I and Type II HEIs innovation indicators (Authors’ computations for estimations).
Y1 Number of EnterprisesY2 Comprehensive ScoreY3 Staff SizeY4 Number of Intellectual PropertiesY5 Number of PatentsY6 Content of Sci-Tech Innovation
X1Number of teachers with senior titlesCoefficient0.225 ***13.808 ***4.082 ***1.540 ***0.216 ***0.084
Standard error0.0350.0450.0210.00101.572
X2 Number of graduates engaged in sci-tech industryCoefficient0.25515.613 ***4.616 ***1.742 ***0.244 ***0.095
Standard error2.0922.7031.2880.0310.00395.401
X3 Number of sci-tech achievementsCoefficient0.1318.011 ***2.368 ***0.894 ***0.125 ***0.049
Standard error0.6370.8890.3630.0090.00127.013
X4 Number of articles issued by journalsCoefficient0.0030.2000.0590.022 ***0.003 ***0.001
Standard error0.2280.3240.1480.003011.204
X5 Number of cited papersCoefficient0.0000.0180.0050.002 **0.000 ***0.000
Standard error0.0560.0660.0340.00102.493
X6 Number of invested enterprisesCoefficient9.380 ***575.270 ***170.083 ***64.18 ***8.984 ***3.492 *
Standard error0.0390.0430.0230.00101.652
R Squared 0.5720.5740.7630.5150.5360.563
***. Significant at p = 0.01; **. Significant at p = 0.05; *. Significant at p = 0.1.
Table 8. PLSR results of Type III HEIs innovation indicators (Authors’ computations for estimations).
Y1 Number of EnterprisesY2 Comprehensive ScoreY3 Staff SizeY4 Number of Intellectual PropertiesY5 Number of PatentsY6 Content of Sci-Tech Innovation
X1 Number of teachers with senior titlesCoefficient5.568340.438 ***128.31239.519 ***9.453 ***2.695
Standard error6.7915.518932.4580.1000.122610.933
X2 Number of graduates engaged in sci-tech industryCoefficient1.713104.70939.46512.1552.9080.829
Standard error414.769333.74956,082.2286.1707.37636,738.202
X3 Number of sci-tech achievementsCoefficient202.03712,352.626 ***4655.7411433.918 ***343.010 ***97.803
Standard error148.26104.34816,698.5442.5782.37510,805.389
X4 Number of articles issued by journalsCoefficient0.18511.3124.2641.3130.3140.090
Standard error47.75435.6555797.6850.7490.7913787.644
X5 Number of cited papersCoefficient0.0643.9071.4720.453 *0.1080.031
Standard error11.2947.5111125.2530.1920.165729.261
X6 Number of invested enterprisesCoefficient122.496 ***7489.468 ***2822.802 ***869.392 ***207.969 ***59.299
Standard error3.2162.559430.3150.0440.057281.242
R Squared 0.2700.2700.5140.2980.3330.278
***. Significant at p = 0.01; *. Significant at p = 0.1.
Publisher’s Note: MDPI stays neutral with regard to jurisdictional claims in published maps and institutional affiliations.

