Increasing Sugar Production in Indonesia through Land Suitability Analysis and Sugar Mill Restructuring
by
Andi Amran Sulaiman
1, 
Yiyi Sulaeman
2,*,
Novia Mustikasari
2,
Dedi Nursyamsi
2 and
Andi Muhammad Syakir
3 1
Faculty of Agriculture, Hasanuddin University, Makasar, South Sulawesi 90245, Indonesia
2
Indonesian Center for Agricultural Land Resource Research and Development, Bogor, West Java 16114, Indonesia
3
Indonesian Center for Estate Crop Research and Development, Bogor, West Java 16114, Indonesia
*
Author to whom correspondence should be addressed.
Land 2019, 8(4), 61; https://doi.org/10.3390/land8040061
Submission received: 2 March 2019
/
Revised: 4 April 2019
/
Accepted: 5 April 2019
/
Published: 8 April 2019
Abstract
:Indonesia is the fourth most populated country in the world with an annual population growth rate of 1.3%. This growth is accompanied by an increase in sugar consumption, which is occurring at an annual rate of 4.3%. The huge demand for sugar has created a large gap between sugar production and demand. Indonesia became the world’s largest sugar importer in 2017–2018. Sugarcane farmers have an important role in sugar production. They are facing problems with declining sugarcane productivity and arable land decreasing. We aimed to understand the sugar production issue in Indonesia and to examine options to increase sugar production. To achieve these aims, a framework consisting of four steps was developed: Analysis of the current situation; problems identification; resolution; and delivering programs; and strategies. The main problems in sugar production in Indonesia were identified, including a stagnation in sugarcane harvest area, low sugarcane productivity, lack of good varieties, and inefficient sugar mills. Based on the identified problems, strategies to increase production were created. Two approaches need to be executed simultaneously: An increase in sugarcane planting area, and an increase in productivity and sugar yield. The first approach in increasing sugar production is the exploration of new sugarcane planting areas outside of Java both on existing agricultural land and in new areas. A land suitability analysis for the whole country was conducted based on a semi-detailed soil map. The main priority for development was the existing agricultural area via an integration system or existing crop exchange. The second approach is restructuring sugar factories through the revitalization of existing sugar mills and investment in the construction of new mills. The challenges that need to be addressed include land availability, provision of high-yielding varieties, and improving the efficiency of sugar mills. General strategies and medium-term programs are presented and discussed. These efforts, if well-executed, will boost Indonesia’s sugar production to meet its domestic demand by 2025, achieving competitiveness in the world market by 2045.
1. Introduction
With an increasing global population, by 2050 we need to double crop production to feed the growing population [1,2]. In Indonesia, the increase in middle-income population is causing a structural change in diets from carbohydrate-rich staples (rice, roots, and tubers) to vegetable oils, animal products (meat and dairy foods), and sugar [3]. Indonesia considers sugar as an important commodity in the World Trade Organization (WTO) negotiating forum, along with rice, corn, and soybeans [4]. With the aim of strengthening food security and improving livelihoods in rural areas, Indonesia needs to increase its domestic agricultural production. Sugar is one of the important target commodities.
The demand for raw sugar for food and beverages is increasing in Indonesia; 6.32 million tons of sugar were consumed in Indonesia in 2017, with a 6% increase in demand in 2018 [5]. With an annual population growth of 1.3%, the growth of sugar consumption has averaged 4.3% per year since 2008. This large demand for sugar has created a large gap between sugar production and demand. As a result, Indonesia became the world’s largest sugar importer in 2017–2018 at 4.45 million tons [6].
Because sugar is classified as an essential commodity [7], the Government of Indonesia has tried to address this issue through its national development program [8]. The National Sugar Production and Productivity Acceleration Program 2003–2008 was established in 2003. In 2006, the program was updated to become the Road Map for National Sugar Self-Sufficiency 2006–2009 and continued with the Road Map for Sugar Production 2010–2014, where production and consumption were targeted to balance at 3.1 million tons annually. However, consumption has further increased and the production target has not been achieved, due to the difficulty in obtaining new land for cultivation and the constraints on implementing the sugar factory revitalization program.
Sugar and sugarcane production have important roles in the rural economy through farming income, providing jobs, and supporting rural economies. To achieve food security and improve farmers’ income, the challenge is how to find the most effective methods to increase national sugar production, with no or minimal displacement of smallholder farmers. Sugarcane farmers have an important role in supplying raw materials for sugar production but they are facing problems in declining sugarcane productivity and a lack of available arable land. Studies in Indonesia have only examined one aspect of sugar production in Indonesia, such as sugar mills [9], trade policy [10], farmers, land use optimization [11], bioethanol production [12], and cane farmers [13]. This paper provides a holistic review of the sugar cane production in Indonesia.
We aimed to understand and examine the sugar production issue in Indonesia and investigate and suggest options to increase sugar production. To address these aims, we developed a framework that consists of four steps: Analysis of the current situation, problems identification, resolution, and delivering programs and strategies.
2. Methods
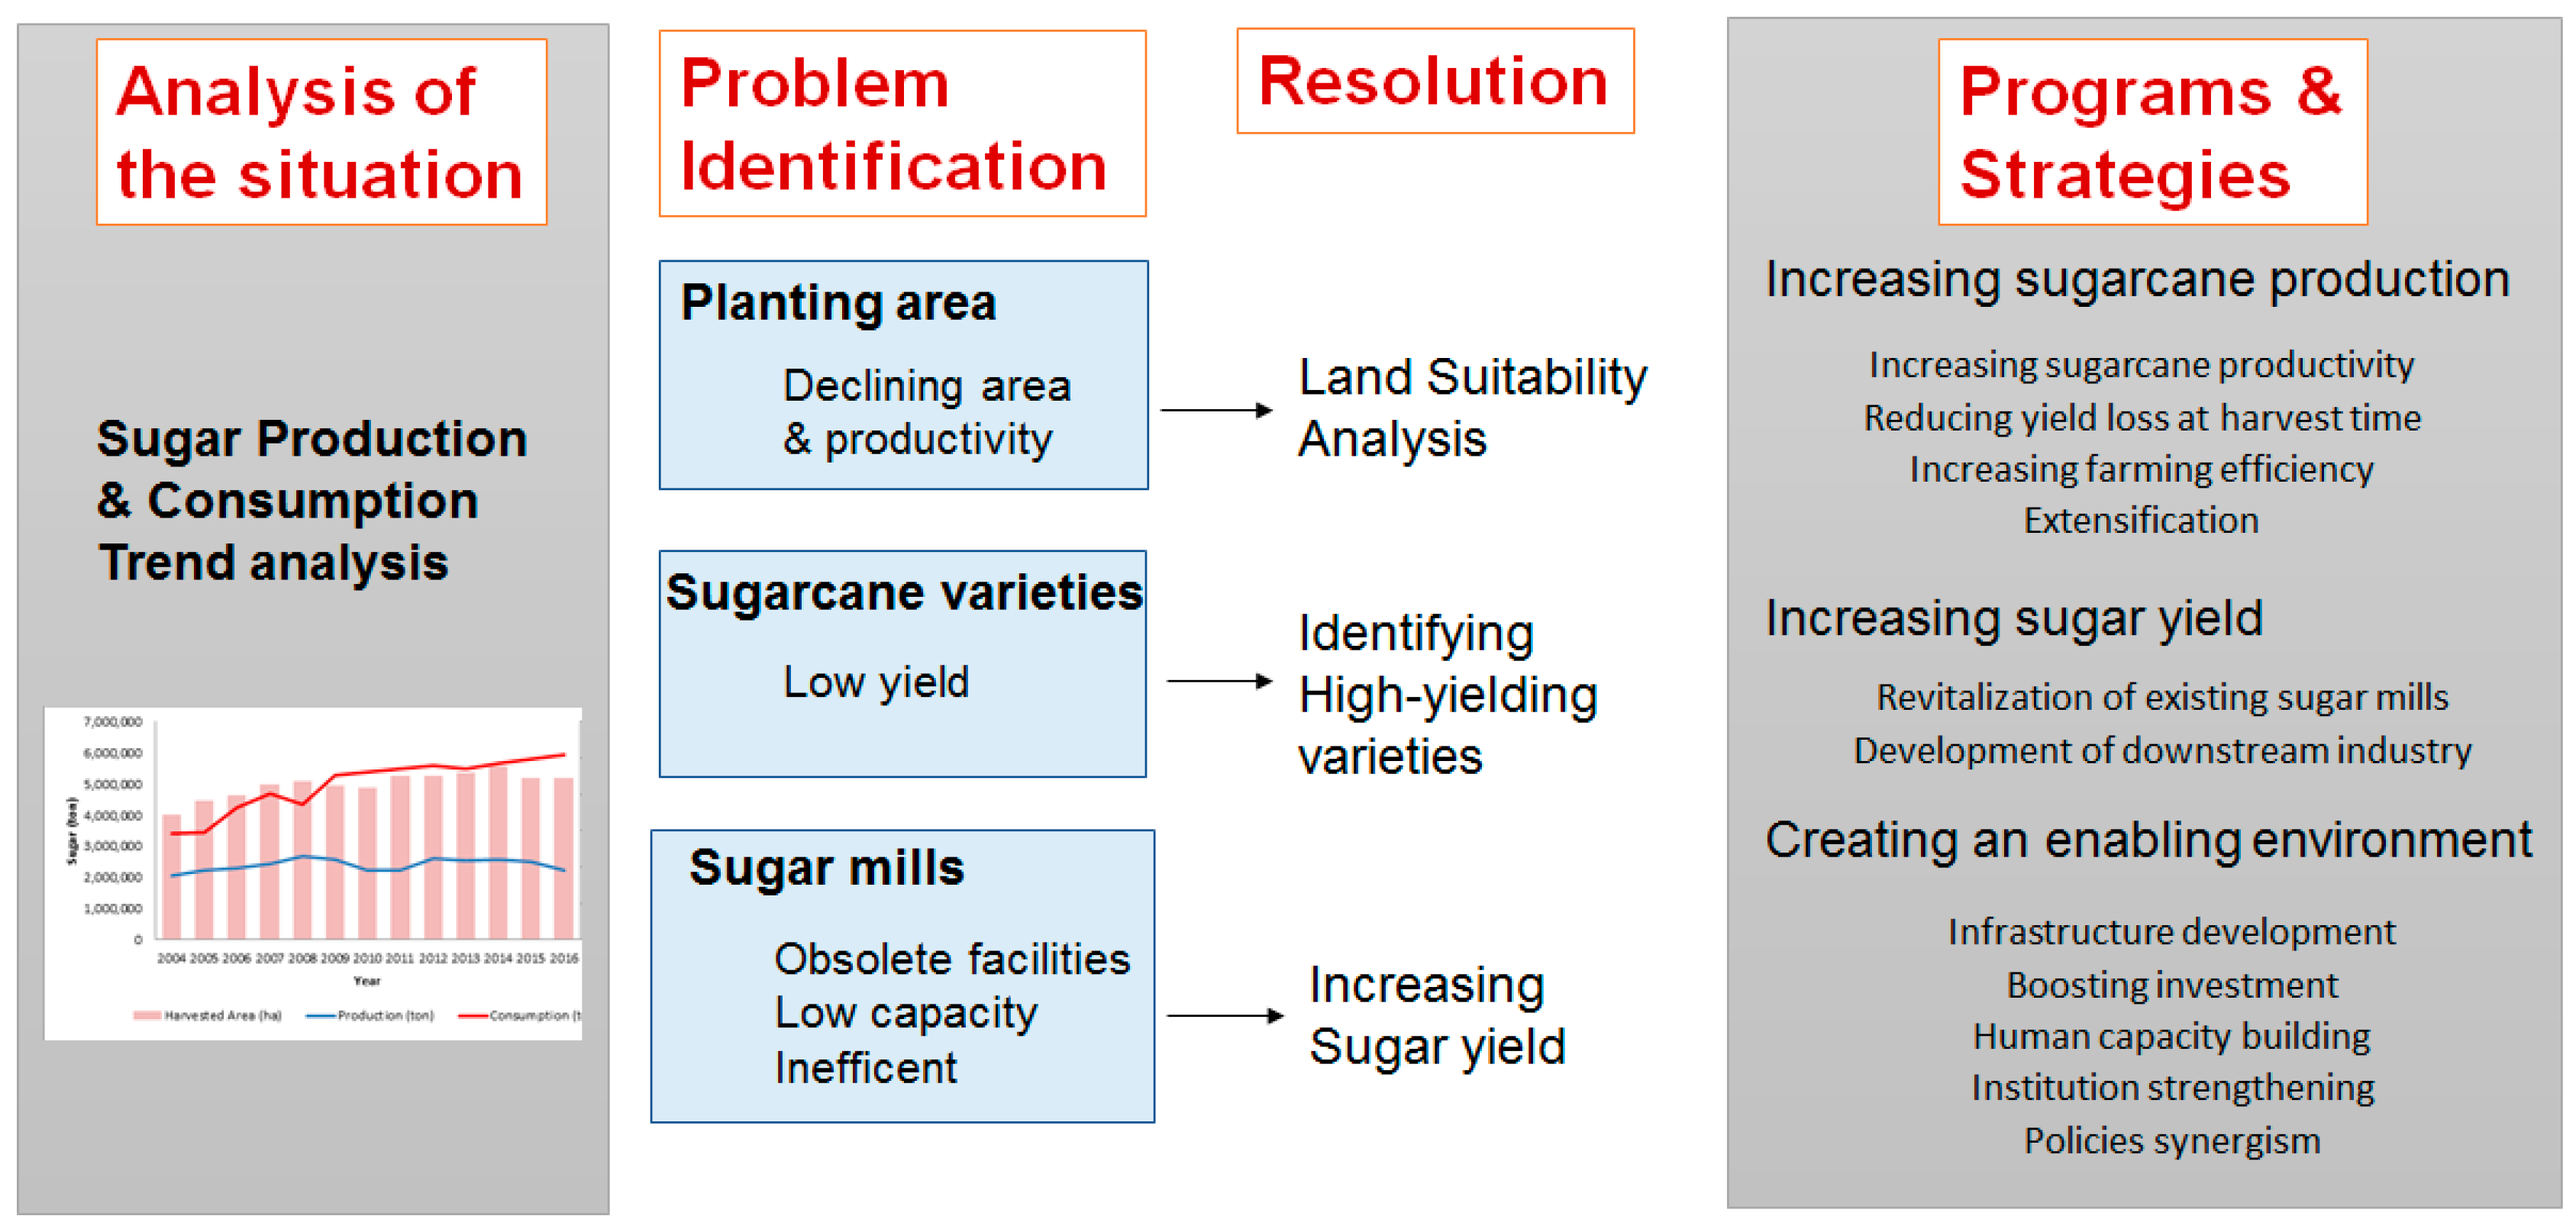
The framework conducted in this study is summarized in Figure 1. It consists of four steps: Analysis of the current situation, problems identification, resolution, and delivering programs and strategies. The framework is qualitative in nature, and is in line with the study by Maria [14].
2.1. Analysis of the Current Situation
In the first step, trends, needs and opportunities were analyzed. First, data on sugar production and consumption trends in Indonesia (2014–2017) were obtained from the Ministry of Agriculture. A national sugar balance for 2014–2017, in terms of stock, production, and consumption were analyzed. The proposed roadmap toward Indonesian sugar self-sufficiency 2015–2045 was analyzed.
2.2. Problems Identification
The next step, a gap analysis, was used to identify problems in sugar production based on secondary data: Sugarcane planting, and harvested area and productivity, with data from United Nation Food and Agriculture Organization (FAO) and Indonesian data center from 1960 to 2017, sugar cane varieties and production, and sugar mills with production data from 2004 to 2016 from the Ministry of Agriculture.
The planting area and varieties are a significant factor in controlling cane production and productivity. Sugar mill performance is an important factor in producing sugar from cane. Key issues for each of the areas are discussed along with supporting data.
2.3. Resolution
2.3.1. Land Suitability Analysis
To gain more insight into the land problem, a land suitability analysis, based on the work conducted by the Indonesian Center for Agricultural Land Resource Research and Development (ICALRD), was used as a basis. The land suitability analysis was based on semi-detailed soil maps that identified potential areas for agricultural expansion.
The Indonesian soil map at the scale of 1:50,000 was used as the basis. Based on the soil map, the following soil properties were extracted using the majority soil class in the polygon: Soil texture, coarse fragments, soil thickness, cation exchange capacity, base saturation, pH, organic C, total N, total P2O5, and total K2O. A database of the soil characteristics was formed.
The land suitability assessment based on the FAO framework was conducted. Land suitability was evaluated based on its potential use and suitability, biophysical constraints, and required land remediation. The criteria are:
- Climate: Air temperature, rainfall
- Plant oxygen requirement: Drainage
- Rooting condition: Soil texture, coarse fragments, soil thickness
- Nutrient supply capacity: Cation exchange capacity, base saturation, pH, organic C
- Nutrient reserve: Total N, total P2O5, total K2O
- Toxicity: Salinity, sodicity, sulfidic depth
- Erosion potential
- Flooding risk
- Land preparation: Stoniness.
Land suitability classes that characterize the degree of suitability for sugarcane growth were formed based on the literature and expert judgement. The classification is as follows:
- Class S1, Highly Suitable: Land having no significant limitations to sugarcane plantations.
- Class S2, Moderately Suitable: Land having limitations that are moderately critical for sugarcane. The limitations will reduce cane productivity and extra inputs are required so the land can be successfully used for growing cane.
- Class S3, Marginally Suitable: Land having limitations that severely impact cane productivity. Heavy investment is required to make the land usable for cane production.
- Class N, Not suitable: Land having severe limitations that cannot be or are difficult to remediate.
The degrees of suitability are controlled by the balance between benefits and inputs. The inputs required for cane production include capital investment, labor, fertilizers, and energy. The detailed criteria of land suitability are provided in Table S1.
2.3.2. Resolution of Other Issues
The resolution of issues were carried out by focusing on leveraging factors of sugar production, namely land condition, being related to cane production, varieties, crop management being related to cane productivity, sugar content, and mill condition and management, being related to sugar production. Need and opportunity analysis (NOA), gap analysis, and requirement analysis were used to form a resolution.
2.3.3. Tradeoff Analysis
The two contrasting approaches for increasing sugar production are: (1) keeping the production land area constant and maximizing productivity via improved cane varieties, and (2) keeping the cane productivity and sugar production at the current rate, and increased planting area by extending production area. Data collected from the previous section (potential yield from high-yielding varieties), land planting area, and sugar yield were used in this analysis.
2.4. Delivering Programs and Strategies
As the final step, based on the key issues identified for sugar production, and the principles and summary guidelines for increased sugar production were developed. The programs and strategies were formulated, based on discussion between the authors and the key stakeholders from the ICALRD.
3. Results and Discussion
3.1. Sugar Production and Consumption in Indonesia
In Indonesia, several terms are used for sugar. Hirani et al. [15] grouped sugar into three types: White crystal sugar, refined crystal sugar, and raw crystal sugar. Raw crystal sugar was imported, whereas others are produced in Indonesia. Sulaiman et al. [16] considered two types of sugar: White crystal sugar (in Indonesian: GKP = Gula kristal putih), and refined crystal sugar (in Indonesian: GKR = Gula Kristal rafinasi), based on the use of sugar. GKP is sugar used for direct consumption by households, restaurants, and hotels, and by small-scale food and beverage vendors. GKR is a type of sugar that can only be used by food, beverage, and pharmaceutical industries (large-, medium-, and small-scale) and use is prohibited in the GKP sugar market. These two types of sugar are considered in this paper.
Sugar consumption continues to increase along with the increasing population, increasing income per capita, and growth in the food and beverage processing industry. With economic growth, there is a tendency to adopt the western diet—a diet low in dietary fiber, but high in total fat, saturated fat, animal fat, and additive sugars [17].
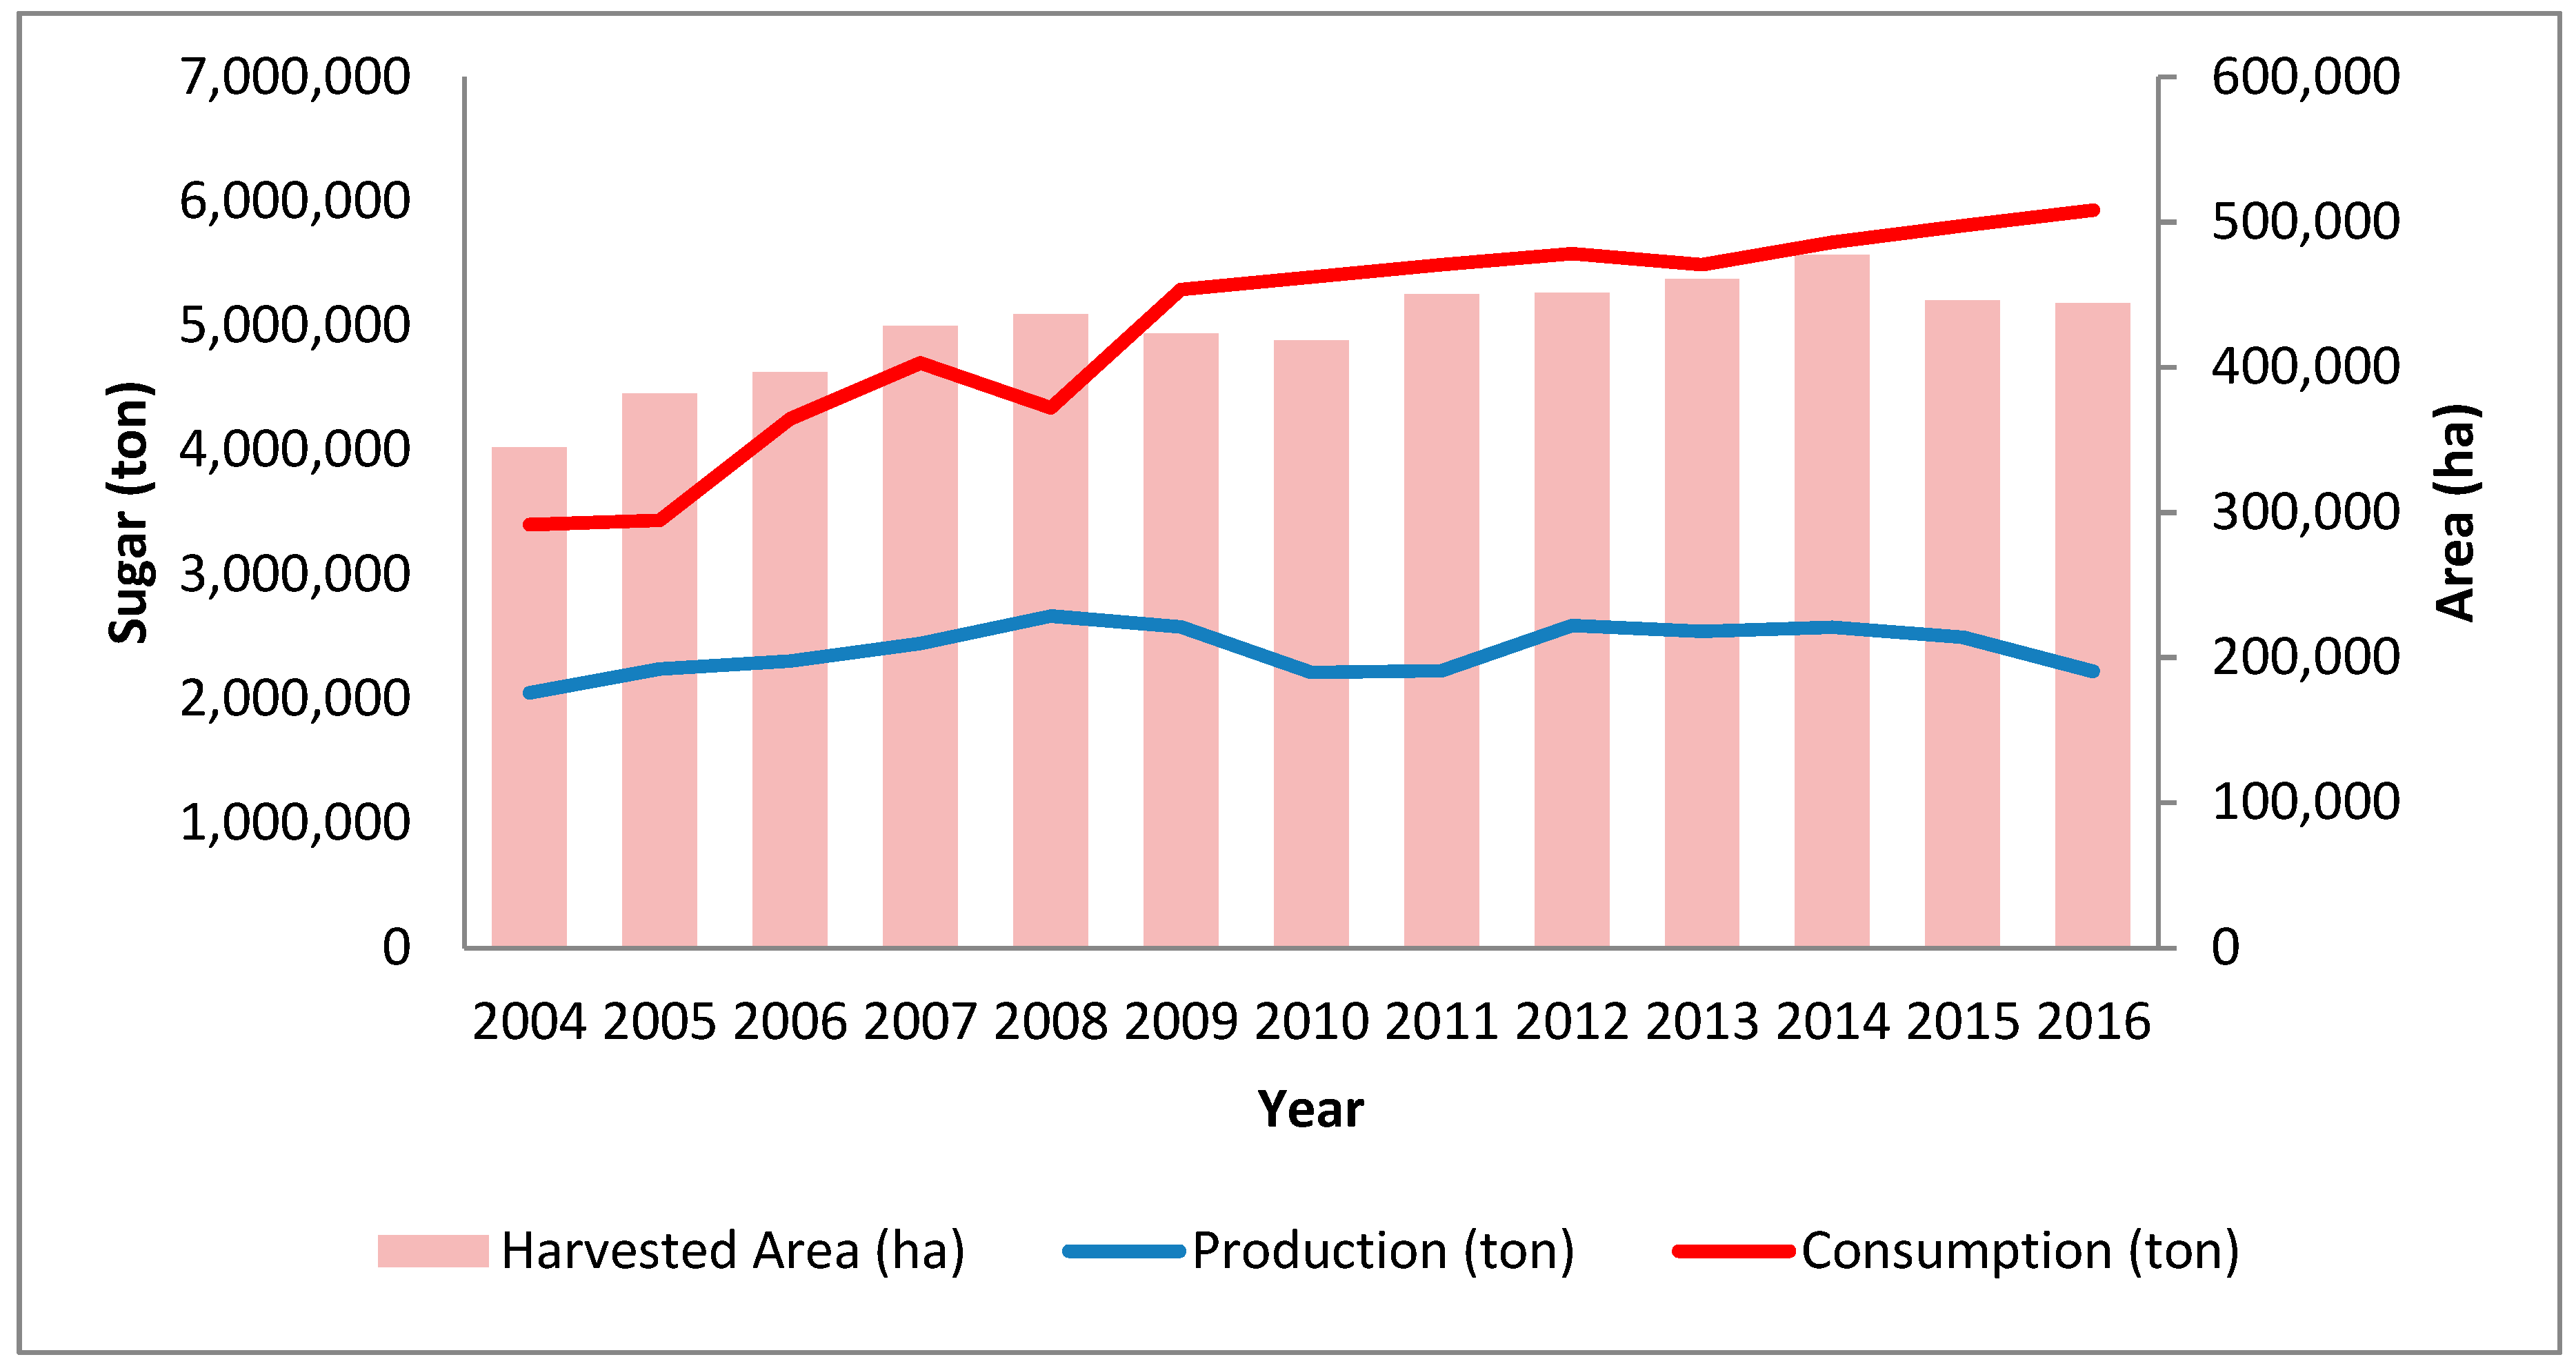
The national sugar production has not yet fulfilled its consumption needs (Figure 2). GKP sugar production, during 2008–2016, declined from 2.67 million tons in 2008 to 2.59 million tons in 2012 and 2.11 million tons in 2016.
The production of current sugar in the form of GKP was in a deficit of 100,000–300,000 tons/year or 3–10% of consumption. As shown in Table 1, in 2015 no GKP was imported, which means that sugar distribution was only sourced from domestic sugar production and stock. Cumulatively, the national sugar balance had an initial and end of year stock. For the 2017 GKP balance, the initial stock was 832.94 thousand tons. This amount is only able to meet the demand for 3.5 months (consumption of GKP 249,400 tons/month). As the beginning of the milling season in 2017 occurred in May, there was a deficit in April–May, which could have been b filled with refined sugar or imported raw GKP from the last year. Raw sugar for 2017 GKP was obtained from 2017 imports of 850,000 tons, and the remaining raw sugar from the previous year was 353,618 tons or 1,203,618 tons, which is equivalent to GKP 1143.44 thousand tons.
To fulfill sugar consumption and industry demands, that could not be satisfied by domestic GKP production, Indonesia imported raw sugar. During 2014–2019, 2.75–3.26 million tons GKR were produced from imported raw sugar (Table 2). With the addition of GKR stock, the initial national stock of 2017 was 945.04 thousand tons, whereas the end stock in 2017 was 961.59 thousand tons. This balance indicates that the contribution of GKR to the national amount of sugar stock was insignificant.
During 2015–2019, GKP sugar consumption is projected to further increase due to the increase in population and purchasing power of consumers (Figure 3). Also, the increase in home industries (such as cake and drink) boosts sugar demand. GKR consumption is projected to increase in line with the growth in the food and beverage industry.
The growth of the national sugar industry has been stagnant and showed a decreasing trend in sugar production from 2008 to 2017. With a continuing decline in sugar production, Indonesia’s status has changed from an exporter of sugar to a net importer. Dependencies on imported sugar will threaten food sovereignty. The demand for sugar will continue to grow along with population and economic growth. Therefore, various breakthroughs are needed to increase the production and competitiveness of the national sugar industries. The aim of these actions is not only to meet the domestic needs but also to be competitive in the global market.
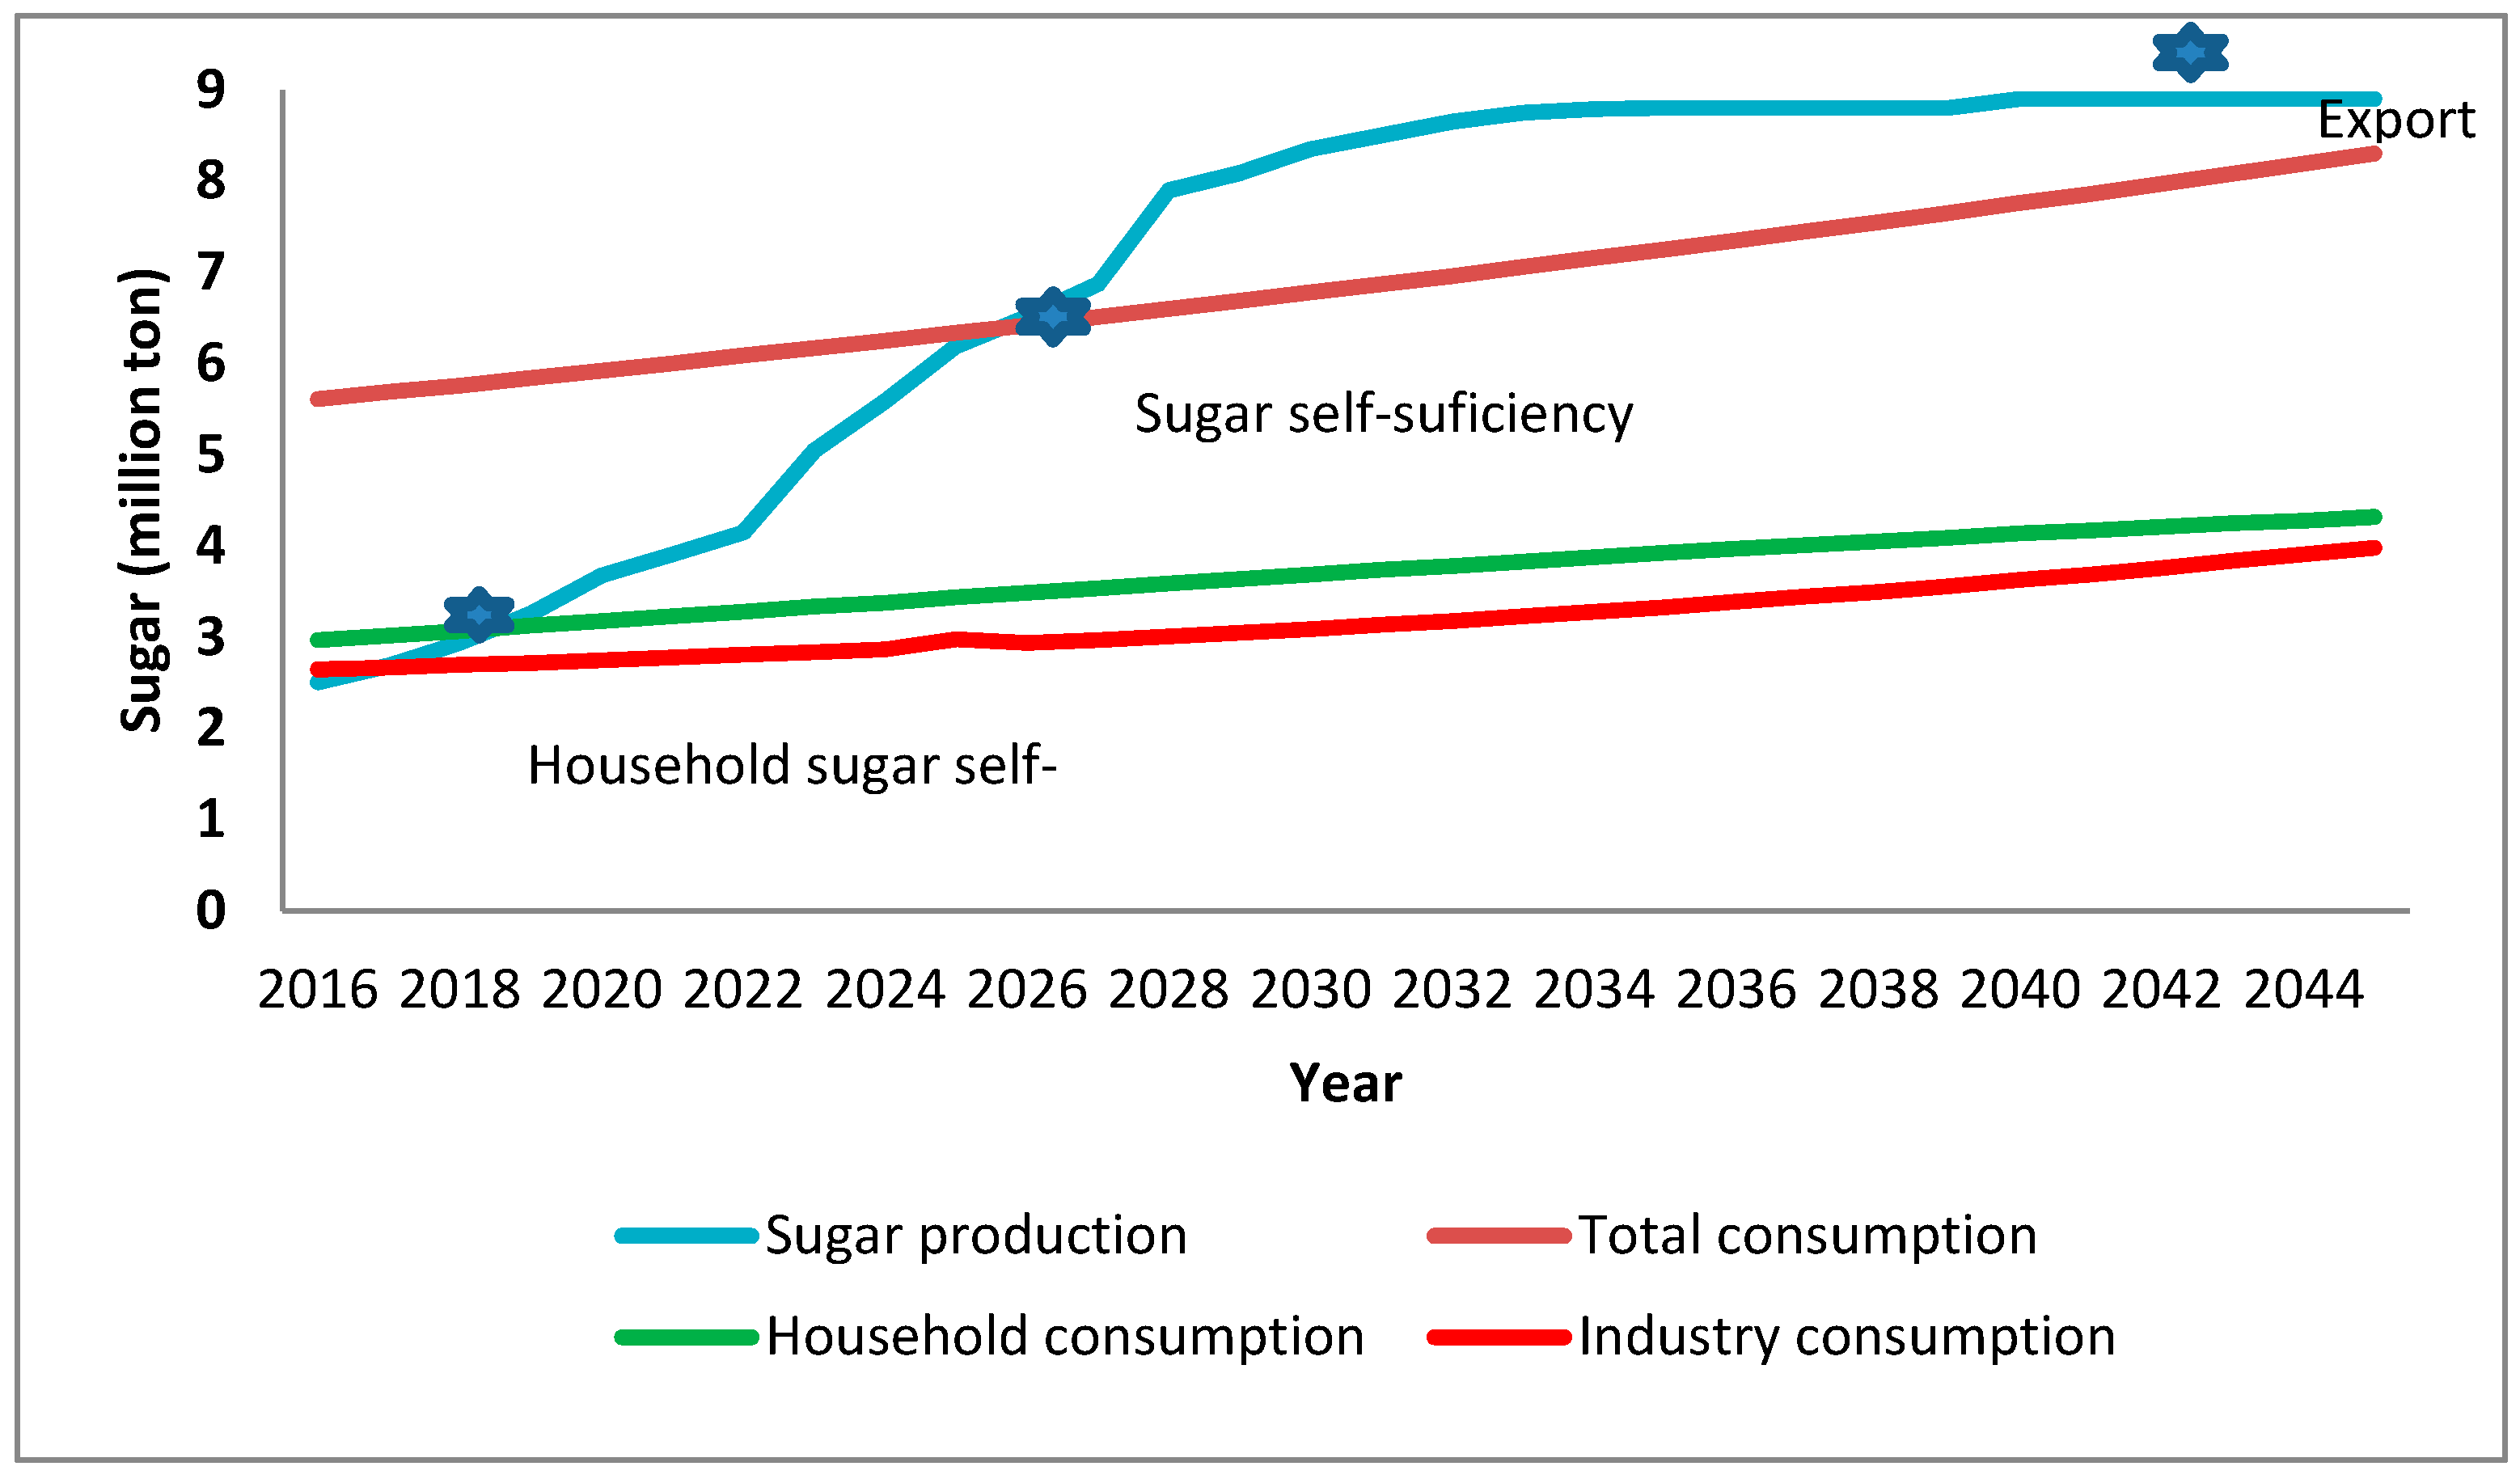
The government of Indonesia has stated a goal in its Sugar Roadmap 2016–2045 program [8]. This program has a target that, by 2019, Indonesia needs to fulfill its sugar consumption demand of 3.2 million tons from local production. In 2025, Indonesia targets to achieve sugar self-sufficiency by fulfilling total sugar needs (direct consumption and local industries consumption) of 6.3 million tons through its national sugar production of 6.2 million tons. From 2025 to 2045, Indonesia aims to be self-sufficient and to increase production to contribute to the world sugar demand (Figure 4).
The problems in sugar production in Indonesia include a decreased area of sugarcane fields, farm inefficiency, lack of good varieties, low productivity, and inefficient and aging sugar mills [9]. Thus, achieving a national sugar self-sufficiency target cannot be separated from land extensification planning and the sugar production target. Yunitasari et al. [19] stated that to achieve sugar self-sufficiency, policies to increase agricultural area, productivity, and sugar yield need to be executed simultaneously. The following sections discuss three main areas in detail: Sugarcane planting area, sugarcane varieties, and sugar mills.
3.2. Sugarcane Area and Production
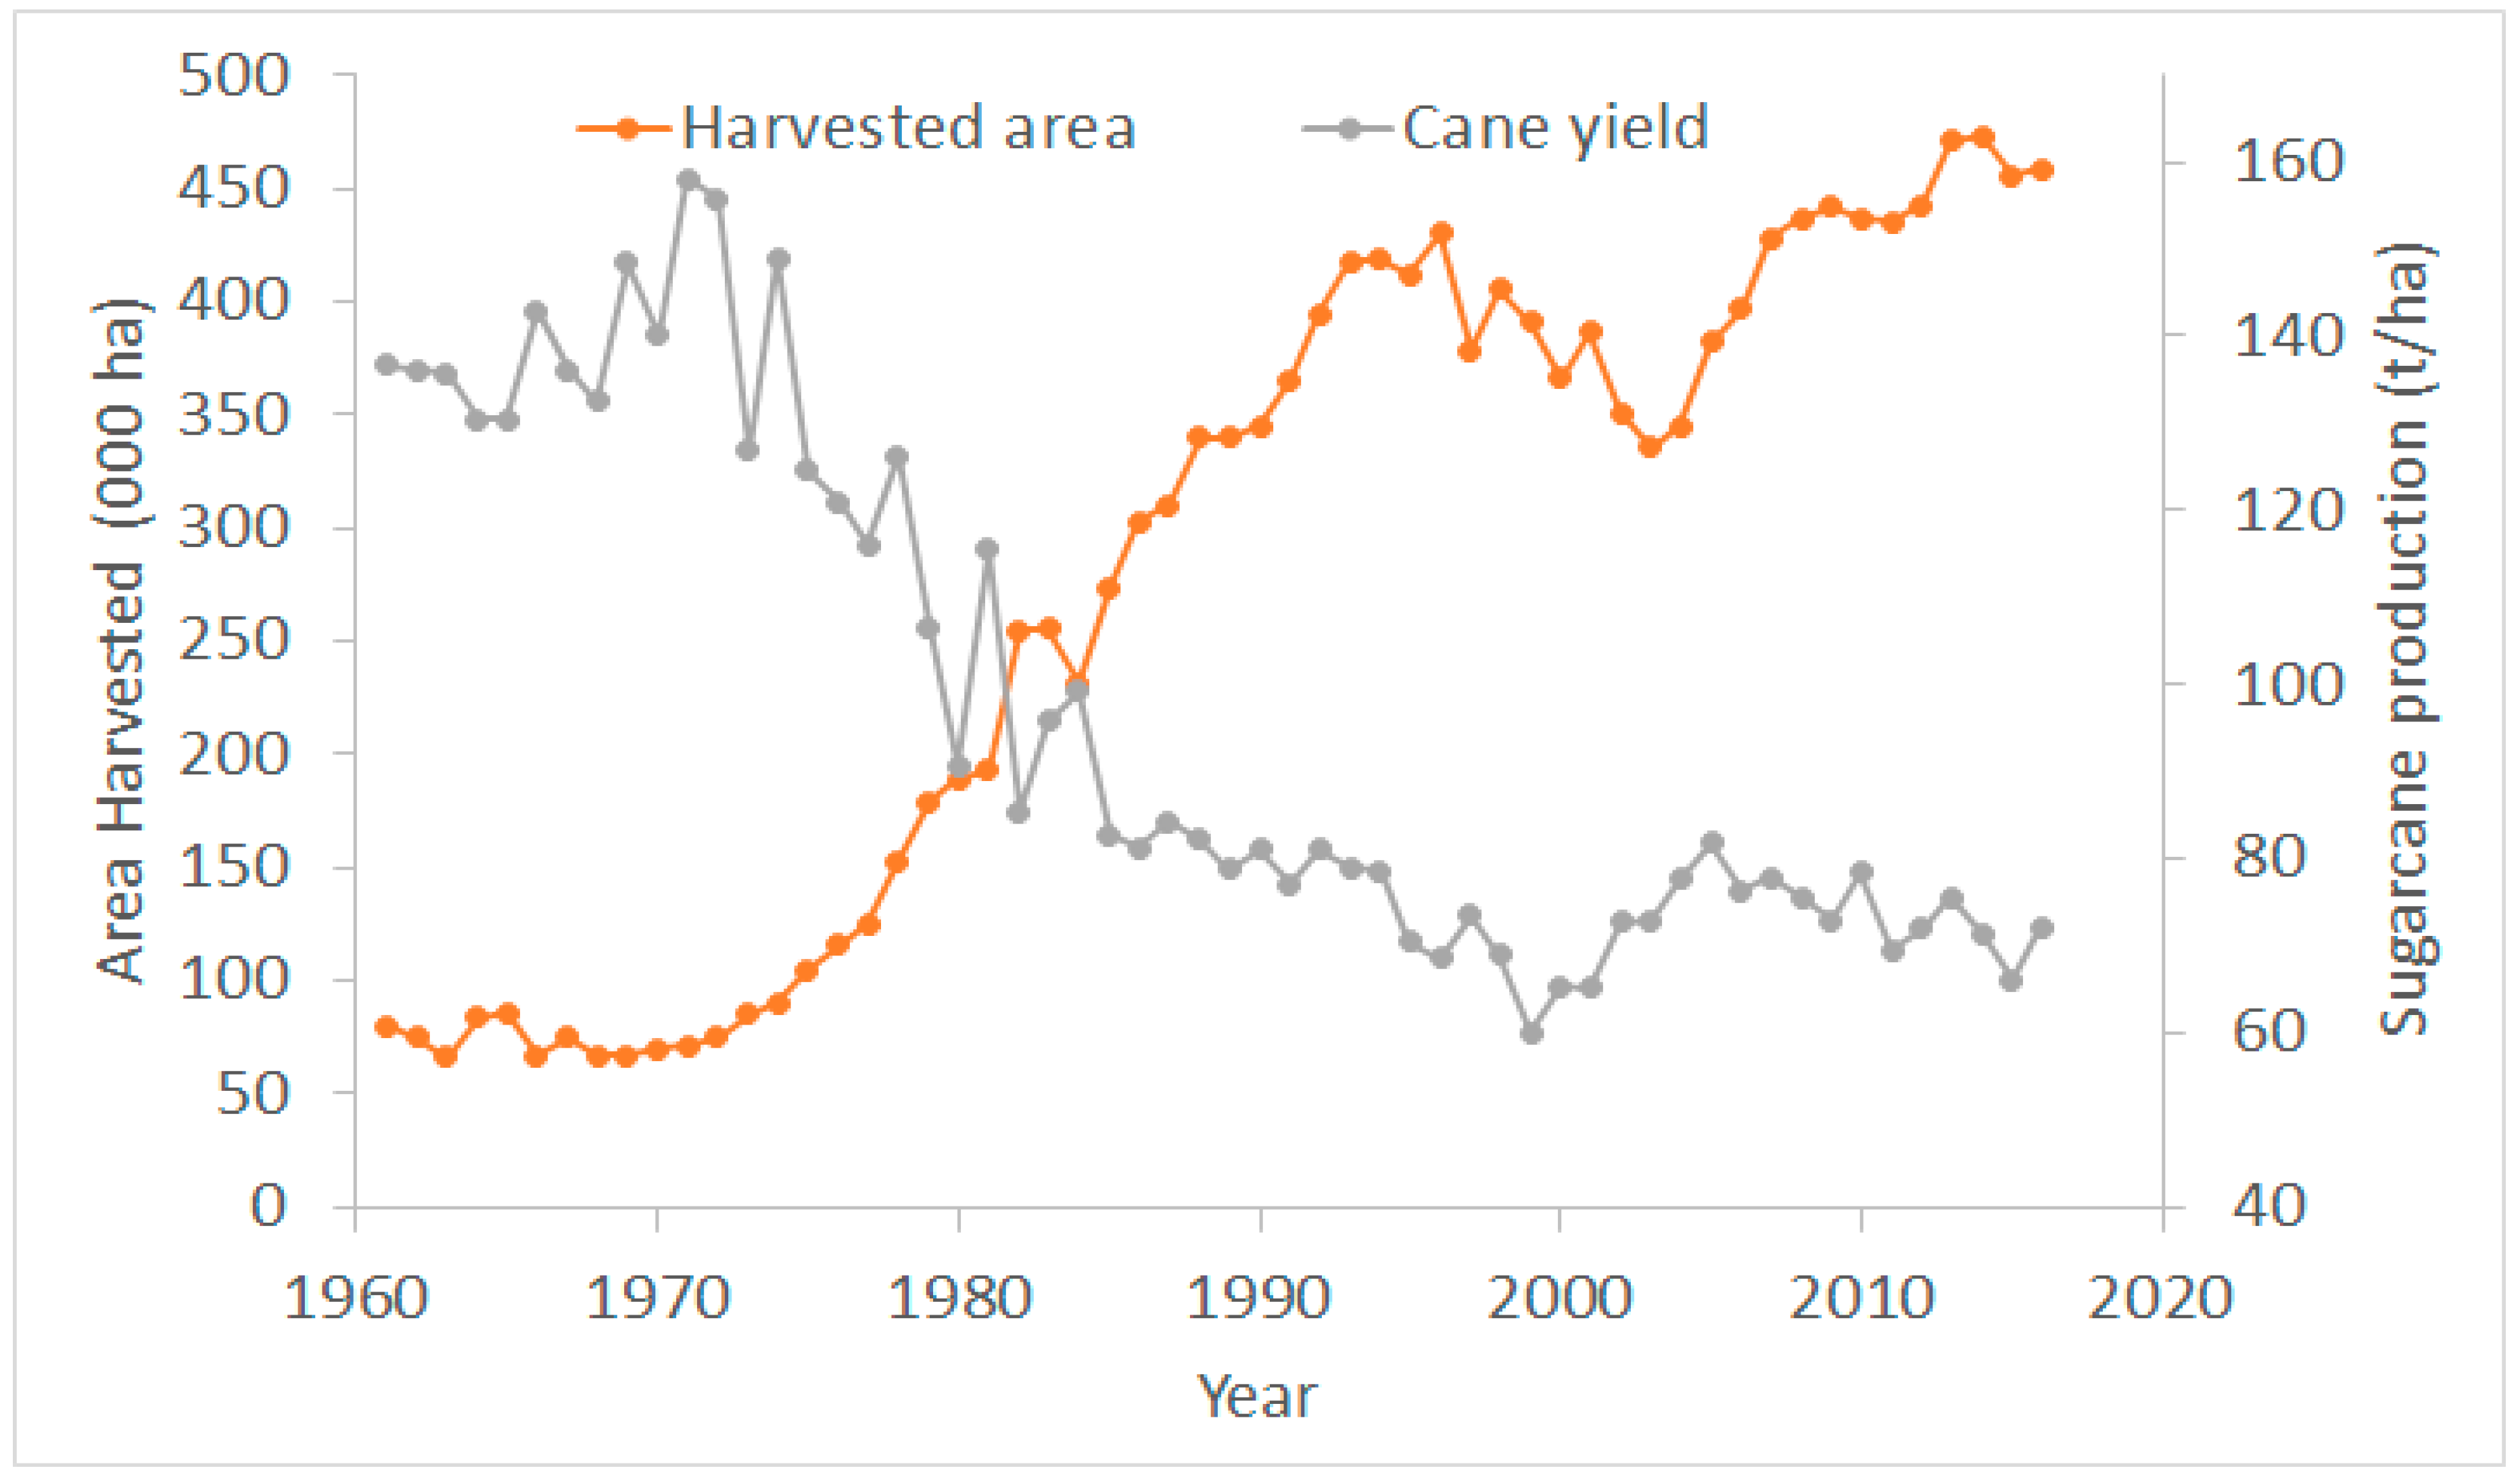
Figure 5 shows the area harvested in Indonesia for sugarcane and its productivity in ton/ha from 1960 to 2017. From 1972 to 1996, sugarcane harvested area increased from 74,800 to 430,400 ha. Since then, the area decreased from 1997 to 2003, and increased to its maximum in 2014 of 455,800 ha. However, sugarcane productivity (ton/ha) has been decreasing since 1974, with an average level of 71 ton/ha in 2012–2017. On average, Indonesia produced 2.5 million tons of raw sugar from 32 Mt of sugarcane, harvested from 452,000 ha.
The existing sugar cane planting area is mainly on Java Island, and this situation is not profitable in the long term: The land and labor costs are very high. Sugar agroindustry needs to be developed outside of Java given the rapid growth of population and population density. Sawit [20] stated that in the long run, the sugar industry has to be designed to be expanded to dryland areas and islands outside of Java, managed by the private sector. However, there is also the problem of competition for land with other commodities, such as oil palm.
The government has encouraged investment in integrated sugar mills that include sugar plantations. Land acquisition is among the largest obstacles in Indonesia. To obtain new land for sugar plantations, many aspects have to be considered, including, (1) the status of the area, the development of a new area is only limited to certain land use class (discussed in a later section); (2) land suitability for sugarcane needs to be assessed to ensure that the land is suitable; and (3) land ownership. To achieve an additional production of 3.4 million tons GKP, based on sugar crystal productivity of 6.5–7.0 tons per hectare, an expansion of around 500,000 hectares is required.
3.3. Land Suitability for Sugarcane
ICALRD conducted land suitability analysis for Indonesian strategic commodities based on a semi-detailed soil map at a scale of 1:50,000 [22]. The suitability maps include rice, corn, soybean, shallot, chili, sugarcane, cocoa, oil palm, and feedstock. The analysis is presented in Atlas of Land Suitability and Crop Recommendation, available for every local government district level (Kabupaten in Indonesia). The atlas provides detailed maps and a table of land suitability at the district level.
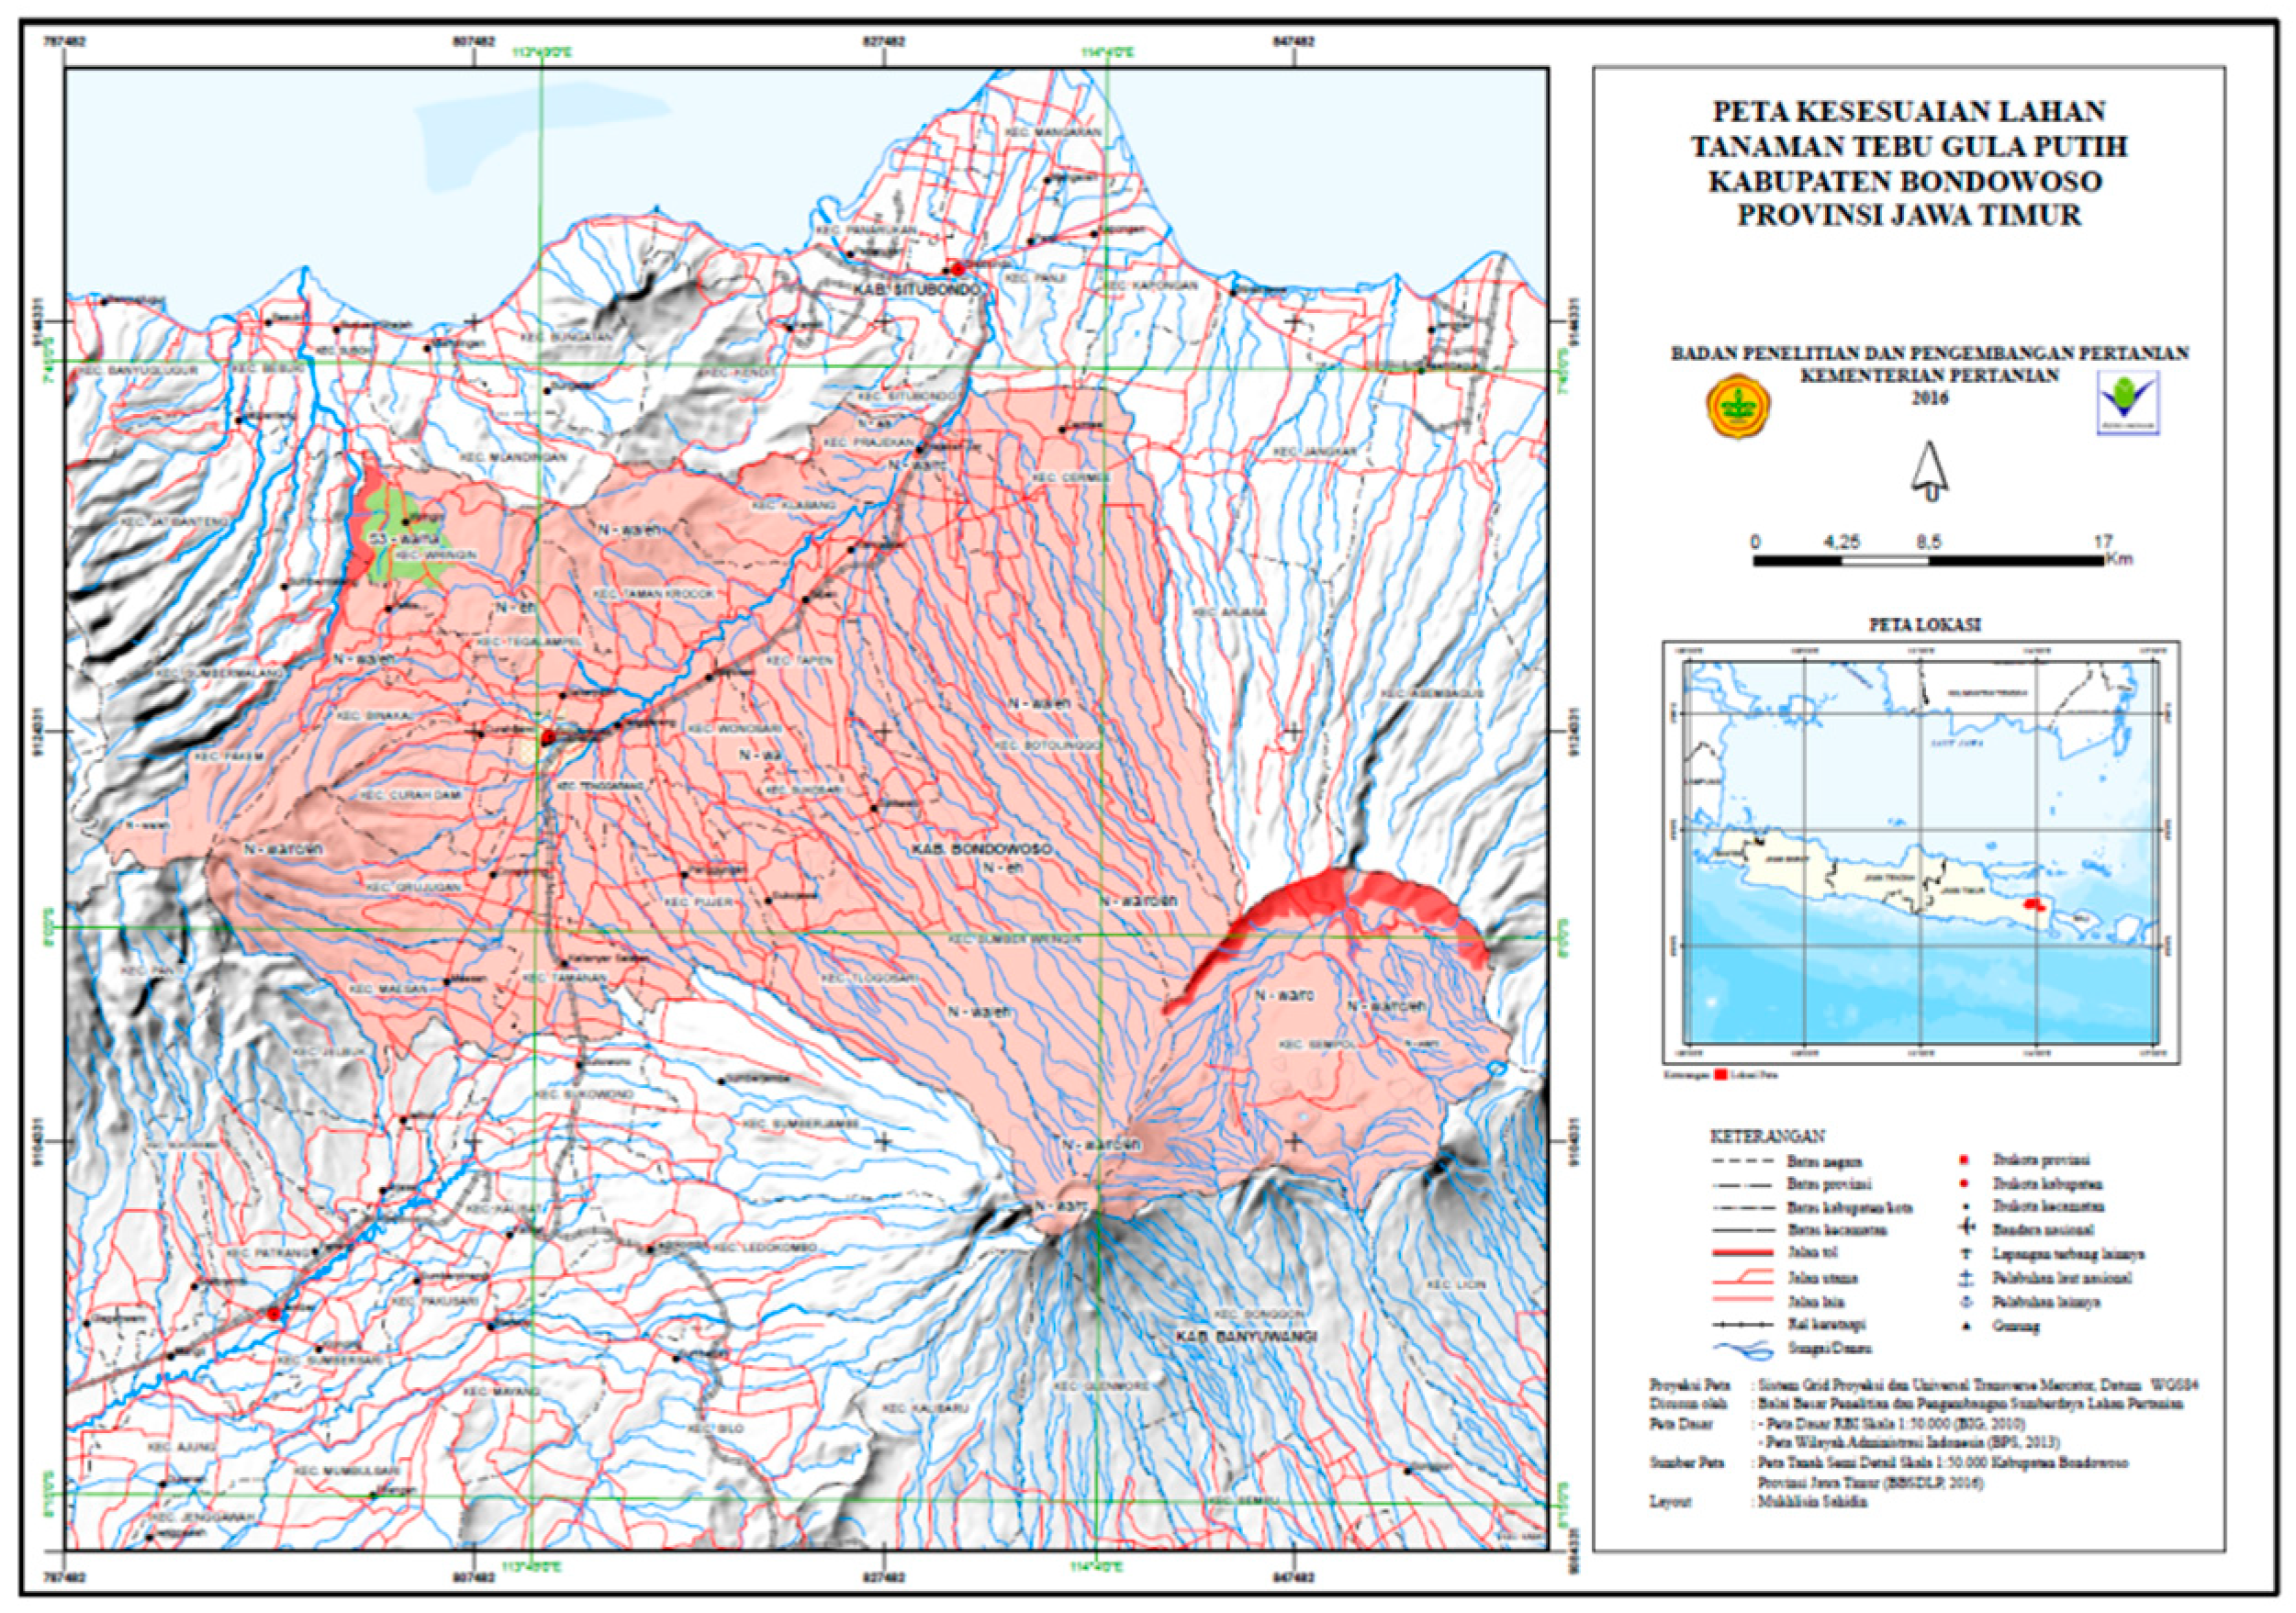
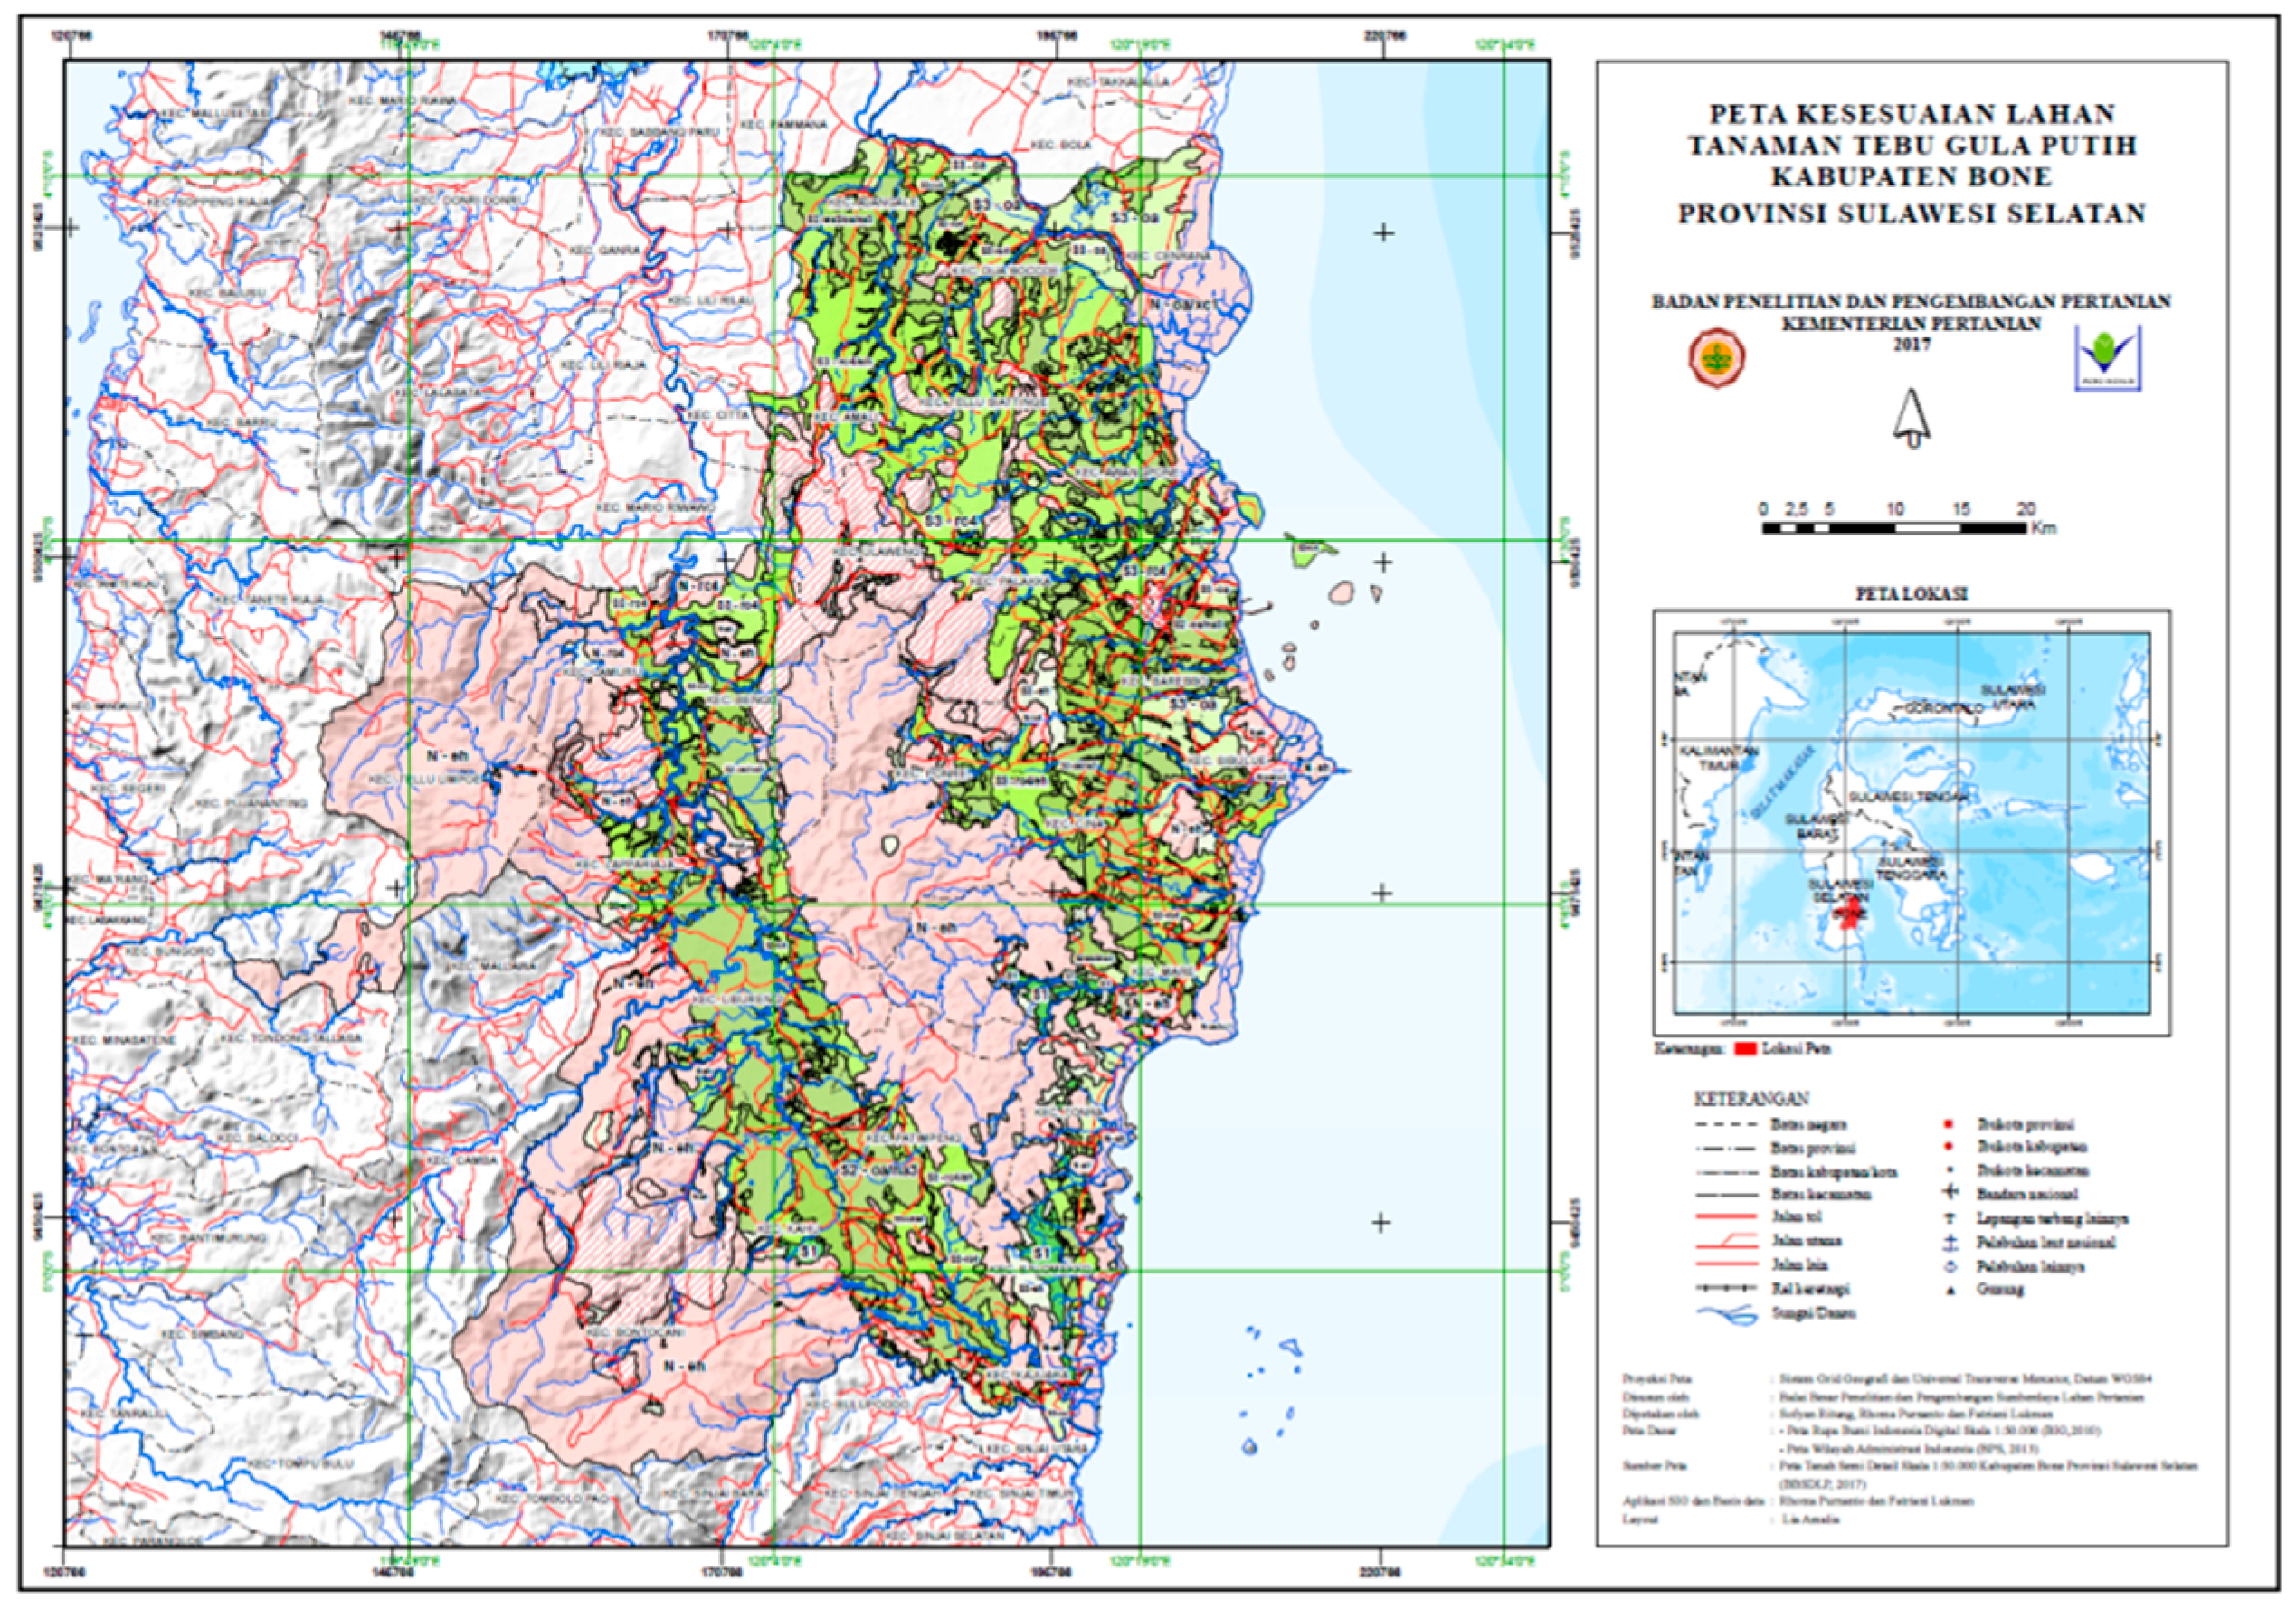
Figure 6 show the land suitability map for sugarcane in Banyuwangi District, East Java Province on Java Island. Only small part of this district is suitable for sugarcane. Figure 7 shows the land suitability map for sugarcane in Bone District, South Sulawesi Province in Sulawesi Island. In Bone, extensive amounts of land are suitable for sugarcane.
Subsequently, an in-depth study on sugarcane land suitability assessment was conducted for 236 selected district levels [23]. This study overlaid suitable land with forest status maps. The results are presented in the Supplementary Materials. The status of forest is categorized into:
- (1)
- Limited production forest (Hutan Produksi Terbatas (HPT) in Indonesian),
- (2)
- Production forest (Hutan Produksi Tetap (HP) in Indonesian),
- (3)
- Converted production forest (Hutan Produksi dapat Dikonversi (HPK)), and
- (4)
- Other land uses (Areal Penggunaan lain (APL) in Indonesian).
According to Indonesian law, only land that is classified as other land uses (APL) can be used for plantation. Suitable land identified in HPT, HPK, and HP need to be converted to APL before they can be used for sugarcane. Areas in APL need to be further analyzed for land tenure and present land use status.
The results of the 236 districts showed that the amount of land suitable for sugarcane is about 33.3 Mha, distributed in APL: 18.3 Mha, HP: 7.0 Mha, HPK: 4.0 Mha, and HPT: 3.8 Mha [23]. Sugarcane should first be developed in APL and then in HPK. See Supplementary Materials for more detailed information. With this spatial information, new land for sugarcane is still available, yet series of processes are needed to prepare the land for cane planting.
3.4. Sugarcane Varieties and Crop Management
In Indonesia, sugarcane is grouped into three types based on harvest time: early harvest, middle harvest, and late harvest [24]. The early cane harvest is suitable for the beginning of the year milling time (May–June). Middle harvest is suitable in the middle milling time (July–August), and late harvest is at the end of milling time (September–October). The ideal proportion for a sugar mill is 30% early cane, 40% middle cane, and 30% late cane.
Currently, high-yielding sugarcane varieties planted by small-holder farmers are lacking. High-yielding sugarcane varieties have high production potential and high tolerance and resistance to certain pest attacks. The high-yielding sugarcane varieties also have good characteristics in terms of productivity, maturity stage, and proper milling period. However, the characteristics of these varieties have not yet been fully realized in the field. Whereas the high-yielding varieties can be supplied in large amounts with modern propagation technology, such as tissue culture, they also require a proper soil, cultivation, and management system. The adoption of the new varieties and farm technology remains poor.
The potential productivity of sugarcane varieties varies considerably (Table 3). The high-yielding variety can attain a maximum yield if grown in a suitable area with the right cultivation techniques. Riajaya and Kadarwati [25] showed that the potential cane yield is hard to attain if planted on unsuitable land. Theoretically, with a high input, sugarcane productivity can reach 300–400 tons per hectare. However, the Bululawang varieties, grown in irrigated land in Purbalingga (Central Java), only produced an average of 150 tons per hectare using 5 tons organic fertilizer per hectare. These suggest that using high-yielding varieties without applying best management practices and best post-harvest practice will not boost cane production.
3.5. Sugar Mill Performance
Indonesia has 63 sugar mills owned by 18 companies (Table 4). However, most of these factories report low productivity [9]. The country’s sugar factories have an average of 3900 tons cane/day (TCD) per factory with sugar yield (rendemen) of 7.1%. This figure is low compared to Thailand, which only has 50 sugar mills but has an average capacity of 18,800 TCD and a sugar yield of 11.82% [9]. As a comparison, Australia has 24 mills, with an average of >10,000 TCD, and can produce 35 million tons of sugar per year [24].
Many of the mills in Indonesia are obsolete with old machinery and equipment, inefficient mill performance, and low milling capacity. This was further discussed by Siagian [26] who found that the main constraints faced by sugar factories in Indonesia are: (1): ow quality of raw materials, (2) low grinding capacity of some sugar mills; (3) low efficiency of sugar mills as a result of the high proportion non-grinding hours; and (4) high production costs.
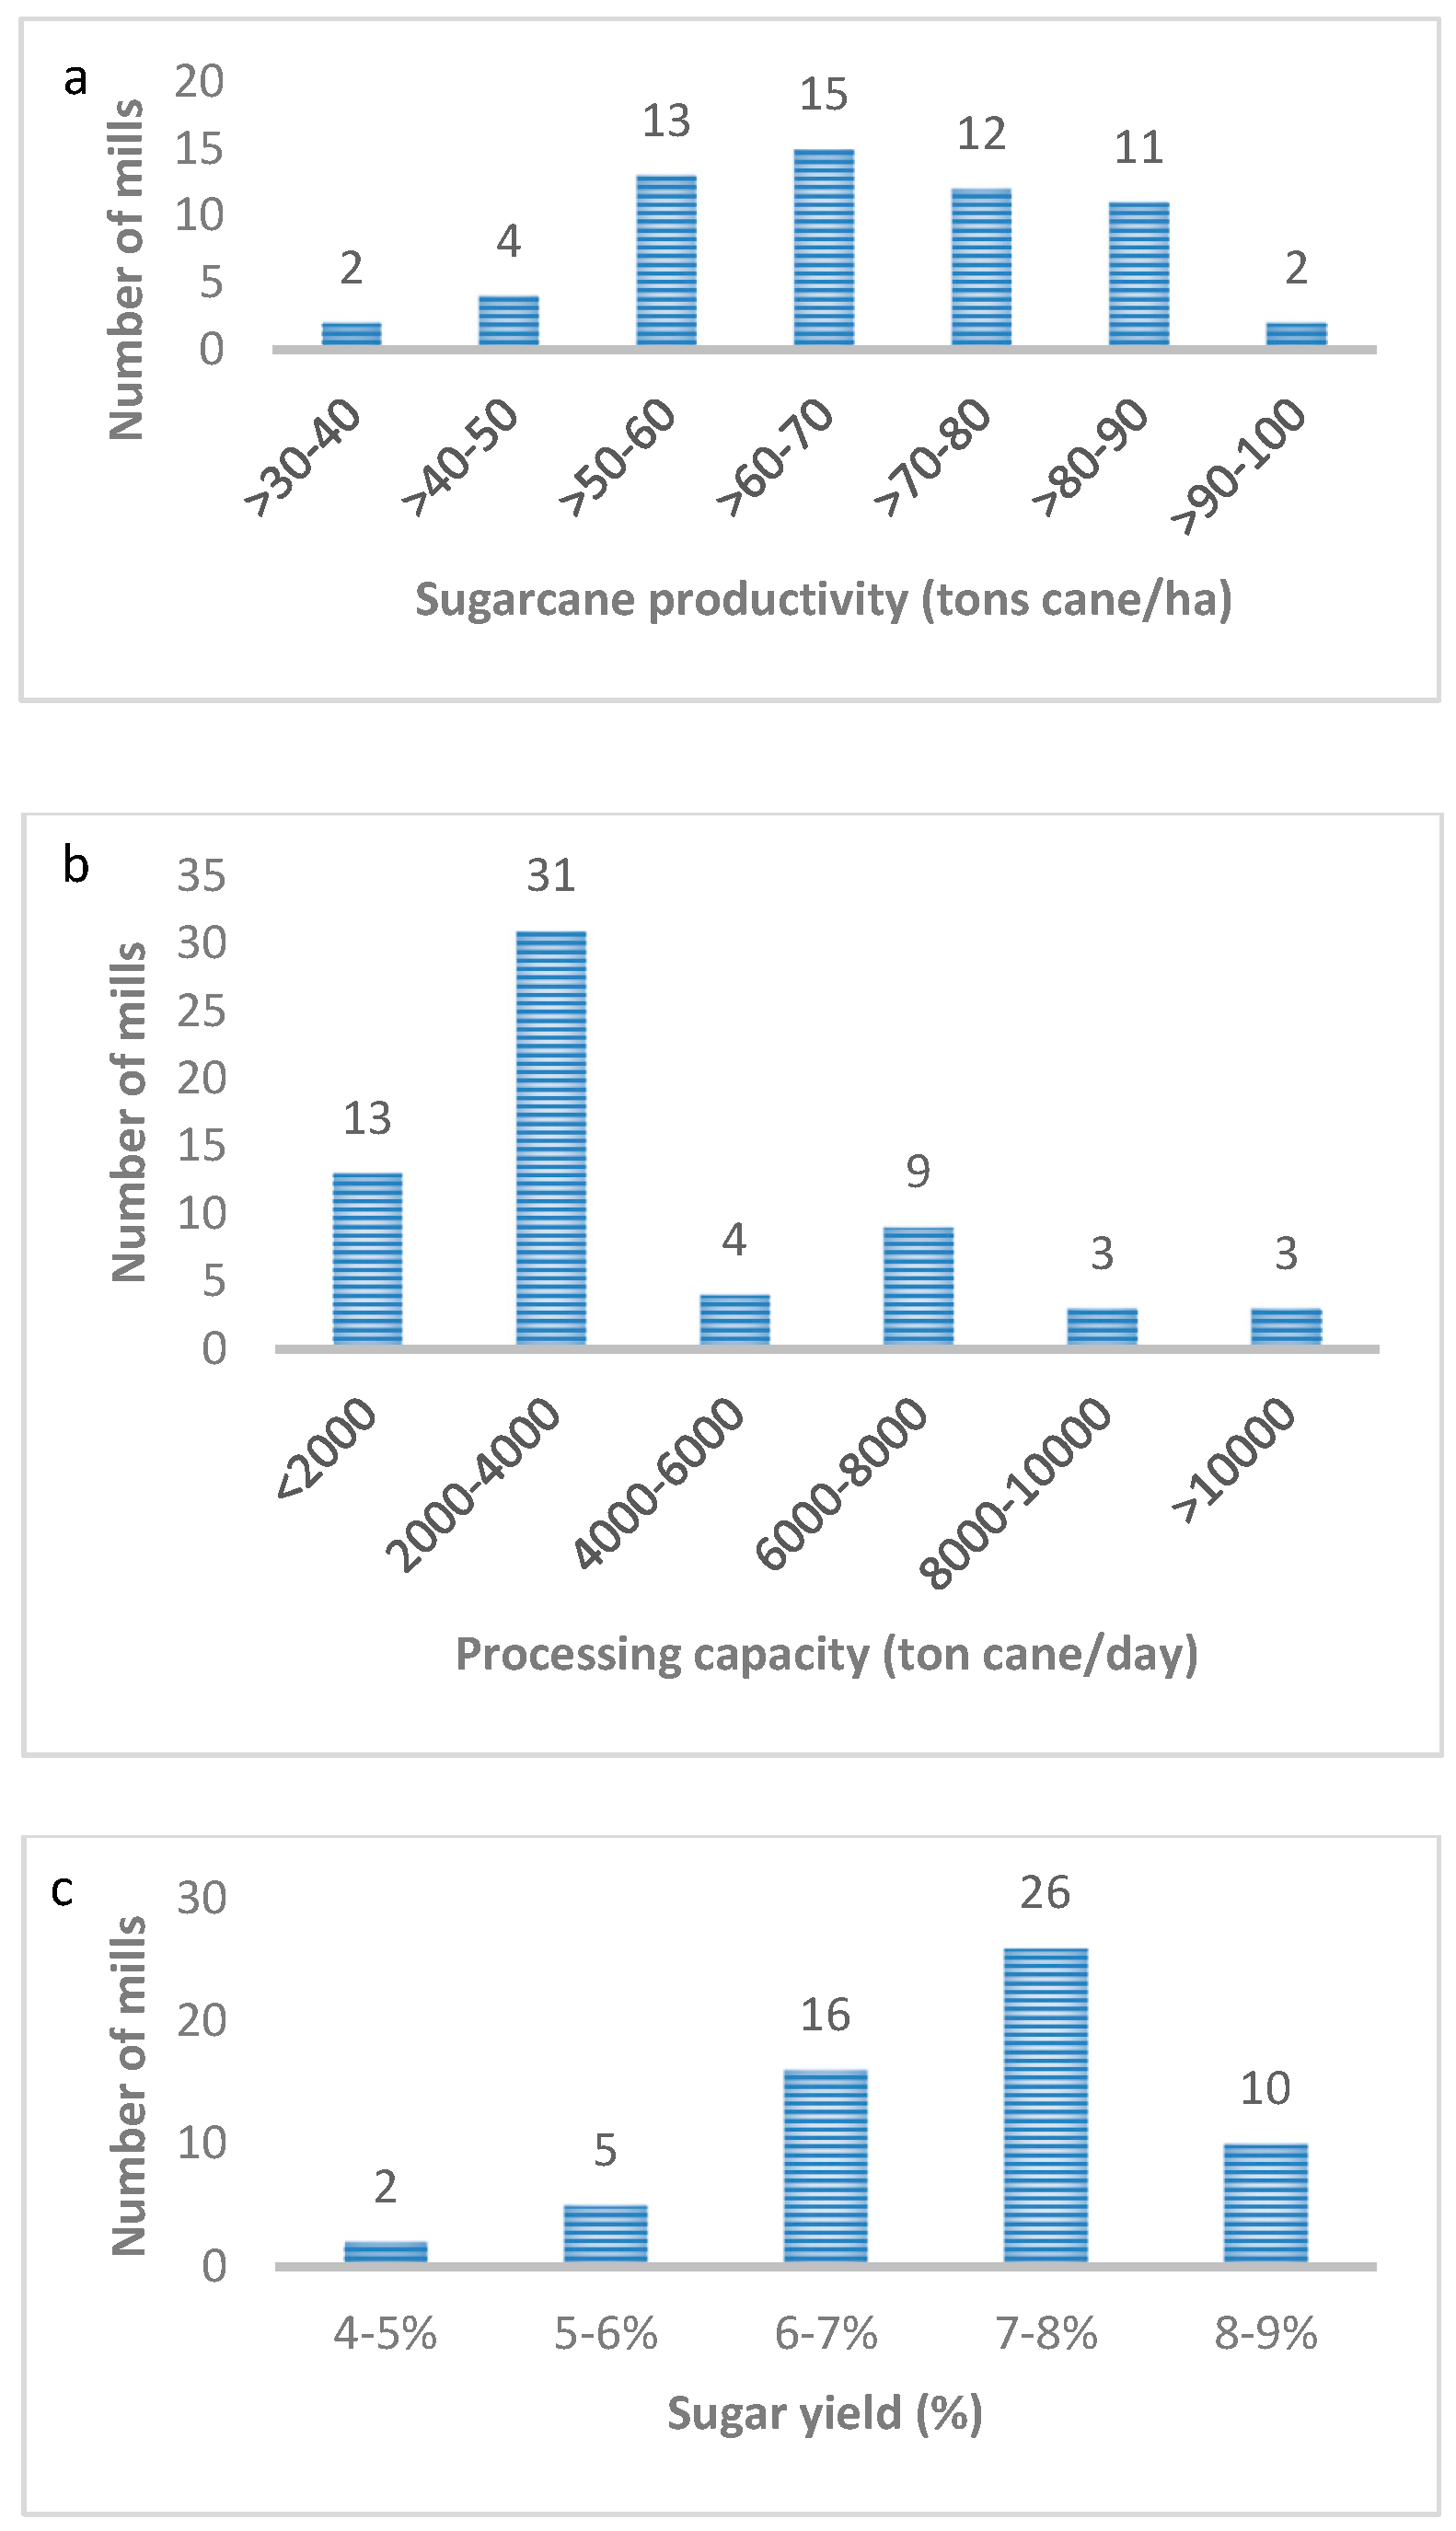
Based on the sugarcane productivity data in 2017, of the 59 sugar mills that still operate, 34 factories (57.63%) had productivity gains below 70 tons/ha (Figure 8). To meet sugar demand, the productivity level needs to be >80 tons/ha. Based upon the milling capacity, 48 sugar mills (75%) in 2017 have a milling capacity less than 6000 TCD) (Figure 8). Among the 48 low-performing mills with a capacity <6000 TCD, 37 are government-owned mills. These mills need to be revitalized.
The sugar yield data from 2017 showed that 23 (38.98%) of the 59 mills yield was still below 7% (Figure 8). Besides the quality of sugarcane, the sugar yield is largely determined by the efficiency of a sugar mill. Therefore, those 23 sugar mills should be revitalized.
According to the performance of sugar mills in 2004–2016, the production of sugarcane tends to increase but the productivity fluctuated in the range of 71 to 82 tons/ha and sugar yield fluctuated between 6.5 and 8.28% (Table 4). Although sugar production increased, its productivity was low, between 5 and 6 tons of sugar per hectare.
3.6. Tradeoff Analysis of Increased Yield Potential vs. Land Area Expansion
In this section, we contrasted two approaches: Maximizing productivity via improved cane varieties and land extensification.
3.6.1. Scenario 1: Maximizing Productivity and Sugar Yield
Considering the current planting area, an average of 455,800 ha, we calculated the potential yield increase if the production is fully maximized via high-yielding varieties. Data from Table 3 on high-yielding varieties indicate a potential sugarcane productivity of 124 ton/ha in paddy fields and 94 t/ha in upland areas. The average potential productivity of 110 ton/ha is expected with an average sugar yield of 9.5%.
The expected potential increases based on this scenario are: (1) Annual sugarcane production increases from 32. 3 million ton to 50.1 million ton (155% increase); (2) at an average sugar yield of 9.5%, sugar production will increase from 2.4 million tons to 4.8 million tons, or double the productivity, from 5.3 to 10.4 ton/ha/year. This increase will satisfy 79% of the projected sugar demand of 6.2 million ton per year. This scenario requires support to provide loans or subsidies for smallholder farmers to replant existing sugarcane areas with high-yielding varieties. This needs to be balanced with improved infrastructure, and new and improved mills to process almost double the sugar cane. However, this analysis assumes that the improved varieties can perform maximally. This is not always the case as the variety needs to be matched with the required environment.
3.6.2. Scenario 2: Maintaining Productivity and Increase Land Area
At the current average cane productivity of 71 t/ha, the amount of land required to meet the demand of 6.2 million tonsis 2.5 times the amount of land or 1.1 million hectares, which is an additional 677,000 hectares of new land. Land suitability analysis (Section 3.3.) showed that 18.3 million haare potentially available for conversion to the sugarcane field. Although the required area of land may be available, 2.5-fold expansion of sugarcane land will require considerable crop estate and infrastructure investment and the doubling of the number of mills.
Based on the two scenarios, a balance between maximizing productivity and increasing plantimg land area is required to fulfill the sugar demand. Assuming an increase to 80% of maximum cane yield potential (88 t/ha) and sugar yield of 8.5%, an expansion of 400,000 ha is still required.
3.7. Practical and Policy Implications
Previous sections discussed the current sugar production conditions in Indonesia. Based on the identified key issues, guidelines and recommendations to increase sugar production can be developed. To increase the production of sugar in Indonesia, advanced improvements in on- and off-farm areas must be achieved. Existing sugarcane plantations need to be intensified to produce an average of 8–9 tons of sugar per ha. The expansion of sugarcane plantation outside Java needs to be accelerated along with the establishment of new sugar mills. Smaller land parcels and mills require consolidation.
The medium- and short-term strategies to accelerate sugar self-sufficiency target include:
- (1)
- Increasing sugarcane production,
- (2)
- Increasing sugar yield and added value products from sugarcane, and
- (3)
- Creating an enabling environment so that the first two strategies can be implemented effectively and efficiently.
3.7.1. Increasing Sugarcane Production
Sugarcane production is measured in tons of cane per planting season per hectare. The higher the cane production, the higher the sugar production. Table 5 lists strategies and activities used to increase sugarcane production. In addition to increasing cane productivity, other factors need to be considered, including reducing loss at harvest time and increasing farming efficiency.
- (1)
- Increasing sugarcane productivity: The increase in sugar production, due to the increase in cane production, varies among sugarcane varieties. Thus, better sugarcane varieties enable increased cane productivity, or potential attainable yield.
- (2)
- Reducing yield loss at harvest time: Efficient harvesting via mechanization and post-harvest logistic can decrease loss and produce better cane yield and sugar yield.
- (3)
- Increasing farming efficiency: Agronomically, improving production requires sophisticated site-specific nutrient management, water management via irrigation, and integrated weed, pest, and disease control. Site-specific nutrient management requires regular soil and plant nutrient testing so that efficient fertilizer recommendations can be formulated to increase yield and reduce overfertilization. Sugarcane is one of the most intensive users of water. In Indonesia, around 80% of production is irrigated, increasing sugarcane production can reduce water availability for people, other croplands, and natural ecosystems. A proper water balance calculation for irrigation scheduling is necessary. Strategies to increase tons per hectare would require better management and land-use planning that avoid environmental stress. In Brazil, sugarcane has expanded more than 10 million hectares from 1990 to 2015. A guideline to sustainable sugarcane production in Brazil has been established, and social, economic, and environmental impacts need to be evaluated [27].
- (4)
- Extensification: This includes extension and consolidation of planting areas outside Java. The main priority is the existing agricultural area by integrating existing areas or crop exchanges. An important factor is the current fragmented agricultural land. Fragmented agricultural land has caused land degradation and hampered agricultural development. Fragmented land is characterized by inefficient farm management, high labor cost, restricted irrigation application, and inconvenient crop management. Land consolidation is a method to tackle land fragmentation, which can increase farm sizes and farming efficiency. Small fields of land are consolidated and regularly used infrastructure can be constructed. For smallholder framers, land consolidation is participatory and the emphasis is on local development with the provision of infrastructure. In areas where large plantations have been established, land swaps are an option. Land swap means that the government offers compensation by providing a similar land area in another location. Land consolidation has been shown to improve land quality and agricultural production. Experiences in China indicate that land consolidation could increase farmer income, improve facilities and livelihood, as well as protect the environment in farming regions [26].
3.7.2. Increasing Sugar Yield and Added Value Products
Table 6 provides strategies and programs to increase sugar yield and the added value of cane-based products in Indonesia: Revitalization of existing sugar mills and the development of a downstream industry.
- (1)
- Revitalization of existing sugar mills. To fulfill the demand for sugar, 10–25 new sugar mills having a capacity between 6000 and 15,000 TCD and an expansion of 3,500,000 ha of additional sugarcane plantation are needed. Nine new sugar mills have been planned for 2020. The target of self-sufficiency is impossible to attain using normal production, demonstrating the need to build new sugar mills [28]. Technology that improves the energy and water use efficiency in traditional sugar mills, as noted by Birru et al. [29], can be implemented.
- (2)
- Development of downstream industry. Currently, diversification of sugarcane products is lacking. Developing downstream sugar industry will grow new income sources that will strengthen the sugar industry. Sugar mills can be reoriented to produce several products. Beside crystal sugar, sugar mills, with the investment in new processing technology, can produce liquid sugar, brown sugar, low-calorie sugar, and functional sugar. Also, by-products can be converted into marketable products.
3.7.3. Creating an Enabling Environment
Table 7 lists possible strategies and programs to create an enabling environment for new sugar mills and the expansion of sugarcane plantation. This environment includes infrastructure development, investment development, human building capacity, institution strengthening, and policy synergism.
- (1)
- Infrastructure development via road and transport can increase production efficiency. This requires financial investment.
- (2)
- Incentives to encourage national and foreign investment in cane plantation and sugar mills are required. Partnership between foreign investors and local entrepreneurs enables beneficial cooperation. Foreign experts play a more dominant role in technical aspects, whereas local entrepreneurs address non-technical aspects such as local market, licensing administration, and business safeguards.
- (3)
- Human resources has an important role in advancing the industry. Training in high technology precision farming and mill operation will be key.
- (4)
- These aspects require institutional strengthening so all operation can be standardized.
- (5)
- A synergistic policy is required as the sugar industry involves various ministries and institutions. A Coordinator Ministry should coordinate and synergize these institutions.
4. Conclusions
Sugar consumption and demand will continue to increase, due to population and economic growth in Indonesia. We identified the main problems facing sugar production in Indonesia: Reduced sugarcane field areas and productivity, farm inefficiency, low cane production, lack of quality varieties, and inefficient sugar mills. To address these challenges, we suggest that the Indonesian government expand the sugarcane plantation area, use high yielding varieties, improve agronomic management and postharvest technology, and increases sugar mill efficiency.
Land suitability for sugarcane throughout Indonesia was analyzed, and the results can be used to select areas for new development. Land consolidation and high yielding varieties play important roles in increasing sugar cane production. Also, sugar mill restructuring and building new mills are key to boosting sugar production. Based on a trade-off analysis, the maximization of productivity, and the increase in sugarcane planting area, are both required to fulfill the sugar demand. An increase in current land to 80% of maximum cane yield potential (88 tons/ha) and sugar yield of 8.5%, still requires 400,000 ha of new planting area.
The recommended strategies and programs to fulfill sugar demand in Indonesia are divided into three aspects:
- (1)
- Increasing cane production, which includes increasing cane productivity, reducing loss at harvest time, and increasing farming efficiency. In addition, extensification via new land development and land consolidation are required to increase sugar cane production.
- (2)
- Increasing sugar yield and added products through: Revitalization of existing sugar mills, establishing new mills outside Java, and the development of a downstream industry.
- (3)
- Establishing enabling environments to ensure the first two programs can run efficiently and effectively. This includes infrastructure development, investment development, human building capacity, institution strengthening, and policy synergism.
If these recommendations are well-executed, they are expected to boost Indonesia’s sugar production to meet its domestic demand by 2025, and it will become competitive in the world market by 2045.
Supplementary Materials
The following are available online at https://www.mdpi.com/2073-445X/8/4/61/s1, Table S1: Land Suitability criteria for Sugarcane. Table S2: Suitable land for sugarcane in selected regencies in Indonesia based on forest status.
Author Contributions
Conceptualization, A.A.S. and Y.S.; formal analysis, Y.S. and N.M.; writing—original draft preparation, Y.S. and N.M.; writing—review and editing, D.N. and A.M.S.
Funding
This research received no external funding.
Acknowledgments
The authors thank Budiman Minasny from the University of Sydney and Saefoel Bachri from the Indonesian Center for Agricultural Land Resource Research and Development for his contribution in reviewing and commenting draft manuscripts.
Conflicts of Interest
The authors declare no conflict of interest.
References
- Tomlinson, I. Doubling food production to feed the 9 billion: A critical perspective on a key discourse of food security in the UK. J. Rural Stud. 2013, 29, 81–90. [Google Scholar] [CrossRef]
- Godfray, H.C.J.; Beddington, J.R.; Crute, I.R.; Haddad, L.; Lawrence, D.; Muir, J.F.; Pretty, J.; Robinson, S.; Thomas, S.M.; Toulmin, C. Food security: The challenge of feeding 9 billion people. Science 2010, 327, 812–818. [Google Scholar] [CrossRef] [PubMed]
- Kearney, J. Food consumption trends and drivers. Philos. Trans. R. Soc. B Biol. Sci. 2010, 365, 2793–2807. [Google Scholar] [CrossRef] [PubMed]
- Arifin, B. Ekonomi Swasembada Gula Indonesia. Econ. Rev. 2008, 211, 1–12. [Google Scholar]
- Indonesia Raw Sugar Consumption for Food, Beverages Seen Edging up in 2018 | Reuters. Available online: https://www.reuters.com/article/indonesia-sugar/indonesia-raw-sugar-consumption-for-food-beverages-seen-edging-up-in-2018-idUSJ9N1I400Q (accessed on 2 March 2019).
- Sweet Tooth Grows in Top Sugar Importer as Buying to Climb – Bloomberg. Available online: https://www.bloomberg.com/news/articles/2019-02-19/sweet-tooth-grows-in-top-importer-as-buying-to-beat-expectations (accessed on 2 March 2019).
- Asyarif, M.I.; Hanani, N. Analisis efisiensi teknis usahatani tebu lahan kering di Kabupaten Jombang. J. Ekon. Pertan. Agribisnis 2018, 2, 159–167. [Google Scholar] [CrossRef]
- Kementerian Pertanian. Peta jalan (roadmap) tebu menuju Indonesia Sebagai lumbung pangan dunia 2045; Kementerian Pertanian: Jakarta, Indonesia, 2017.
- Toharisman, A.; Triantarti. An Overview of Sugar Sector in Indonesia. Sugar Tech 2016, 18, 636–641. [Google Scholar] [CrossRef]
- Stapleton, T. Institutional determinants of Indonesia’s sugar trade policy. Bull. Indones. Econ. Stud. 2006, 42, 95–103. [Google Scholar] [CrossRef]
- Osly, P.J.; Pramudya, B.; Gandasamita, K.; Widiatmaka. Land Use Optimization for Sugarcane Plantations in Eastern Seram District, Indonesia. J. Dev. Sustain. Agric. 2014, 9, 89–96. [Google Scholar]
- Khatiwada, D.; Silveira, S. Scenarios for bioethanol production in Indonesia: How can we meet mandatory blending targets? Energy 2017, 119, 351–361. [Google Scholar] [CrossRef]
- Baksh, R.; Yustika, A.E. Sugarcane farmers in east Java: Institutional arrangement perspective. J. Indones. Appl. Econ. 2008, 2. [Google Scholar] [CrossRef]
- De Maria, M. Understanding Land in the Context of Large-Scale Land Acquisitions: A Brief History of Land in Economics. Land 2019, 8, 15. [Google Scholar] [CrossRef]
- Hirani, R.I.; Aji, J.M.M.; Januar, J. Analisis trend produksi dan impor gula serta factor-faktor yang mempengaruhi impor gula di Indonesia. Berk. Ilm. Pertan. 2013, 1, 77–85. [Google Scholar]
- Sulaiman, A.A.; Subagyono, K.; Soetoepo, D.; Richana, N.; Syukur, M.; Hermanto; Ardhana, I.K. Menjaring Investasi Meraih Swasembada Gula; IAARD Press: Jakarta, Indonesia, 2018. [Google Scholar]
- Peng, C.-J.; Lin, C.-Y.; Guo, H.-R. A comparison of food supply from 1984 to 2009 and degree of dietary westernization in Taiwan with Asian countries and world continents. BioMed Res. Int. 2015, 2015, 628586. [Google Scholar] [CrossRef] [PubMed]
- Nusantara Sugar Community. Jurnal Gula; NSC: Jakarta, Indonesia, 2018. [Google Scholar]
- Yunitasari, D.; Hakim, D.B.; Juanda, B.; Nurmalina, R. Menuju swasembada gula nasional: Model kebijakan untuk meningkatkan produksi gula dan pendapatan petani tebu di Jawa Timur. J. Ekon. Dan Kebijak. Publik 2015, 6, 1–15. [Google Scholar]
- Sawit, M.H. Industri Gula Nasional di Persimpangan Jalan: Mampu Bertahan atau Tersingkir. J. Indones. Econ. Bus. 2001, 16, 111–121. [Google Scholar]
- FAOSTAT. Available online: http://www.fao.org/faostat/en/#data/QC/visualize (accessed on 2 March 2019).
- BBSDLP. Laporan Tahunan BBSDLP 2016; BBSDLP: Bogor, Indonesia, 2017.
- BBSDLP. Potensi Kesesuaian Lahan Tebu di Indonesia pada Kawasan APL, HPT, dan HPK; BBSDLP: Bogor, Indonesia, 2018.
- Supriadi; Khuluq, A.D.; Pertumbuhan, D. Produktivitas dan Hasil Hablur Klon Tebu Masak Awal-Tengah di Tanah Inceptisol. J. Agron. Indones. 2018, 46, 208–214. [Google Scholar]
- Riajaya, P.D.; Kadarwati, F.T. Kesesuaian Tipe Kemasakan Varietas Tebu pada Tipologi Lahan Bertekstur Berat, Tadah Hujan, dan Drainase Lancar. Bul. Tanam. TembakauSerat Miny. Ind. 2018, 8, 85–97. [Google Scholar]
- Siagian, V. Analisis efisiensi biaya produksi gula di Indonesia: Pendekatan fungsi biaya multi input multi output; IPB: Bogor, Indonesia, 1999. [Google Scholar]
- Coutinho, C.H.; Turetta, A.P.D.; Monteiro, J.M.; Castro, S.; Pietrafesa, J.P. Participatory Sustainability Assessment for Sugarcane Expansion in Goiás, Brazil. Sustainability 2017, 9, 1573. [Google Scholar] [CrossRef]
- Bantacut, T. Swasembada gula: Prospek dan strategi pencapaiannya. Pangan 2010, 19, 245–256. [Google Scholar]
- Birru, E.; Erlich, C.; Herrera, I.; Martin, A.; Feychting, S.; Vitez, M.; Abdulhadi, E.B.; Larsson, A.; Onoszko, E.; Hallersbo, M.; et al. A Comparison of Various Technological Options for Improving Energy and Water Use Efficiency in a Traditional Sugar Mill. Sustainability 2016, 8, 1227. [Google Scholar] [CrossRef]
Figure 1.
Framework used to examine methods to increase sugar production in Indonesia.

Figure 2.
Sugar production and consumption in Indonesia from 2004 to 2016. After Kementerian Pertanian [8].
Figure 2.
Sugar production and consumption in Indonesia from 2004 to 2016. After Kementerian Pertanian [8].

Figure 3.
The projection of sugar demand in Indonesia from 2015 to 2019. After Sulaiman et al. [16].
Figure 3.
The projection of sugar demand in Indonesia from 2015 to 2019. After Sulaiman et al. [16].

Figure 4.
Sugar self-sufficiency and export scenario. After Kementerian Pertanian [8]).
Figure 4.
Sugar self-sufficiency and export scenario. After Kementerian Pertanian [8]).

Figure 5.
Sugarcane harvested area and sugarcane production (t/ha) from 1960 to 2017. Source: FAOSTAT [21].
Figure 5.
Sugarcane harvested area and sugarcane production (t/ha) from 1960 to 2017. Source: FAOSTAT [21].

Figure 6.
Land suitability map for sugarcane in Banyuwangi District, Java Island (courtesy of ICALRD). Green indicates suitable land.
Figure 6.
Land suitability map for sugarcane in Banyuwangi District, Java Island (courtesy of ICALRD). Green indicates suitable land.

Figure 7.
Land suitability map for sugarcane in Bone District, Sulawesi Island (courtesy of ICALRD). Green indicates suitable land.
Figure 7.
Land suitability map for sugarcane in Bone District, Sulawesi Island (courtesy of ICALRD). Green indicates suitable land.

Figure 8.
The performance of sugar mills in Indonesia in 2017: (a). sugarcane productivity, (b) processing capacity, (c). sugar yield. Source: Nusantara Sugar Community [18].
Figure 8.
The performance of sugar mills in Indonesia in 2017: (a). sugarcane productivity, (b) processing capacity, (c). sugar yield. Source: Nusantara Sugar Community [18].


Table 1.
The annual sugar balance of white crystal sugar in Indonesia, 2014–2017 (in thousand tons). Source: Nusantara Sugar Community [18].
Table 1.
The annual sugar balance of white crystal sugar in Indonesia, 2014–2017 (in thousand tons). Source: Nusantara Sugar Community [18].
| Year | Initial Stock | Import | Sugar Production | Total Supply | Distri-Bution | Last Stock | ||
|---|---|---|---|---|---|---|---|---|
| Domestic | Raw Import | Total | ||||||
| 2014 | 1240.20 | 21.60 | 2593.30 | 210.20 | 2803.60 | 4065.30 | 2882.90 | 1182.40 |
| 2015 | 1182.40 | 0 | 2497.99 | 63.83 | 2561.83 | 3755.23 | 2927.63 | 816.59 |
| 2016 | 816.59 | 84.67 | 2204.62 | 190.00 | 2394.62 | 3295.89 | 2462.95 | 832.94 |
| 2017 | 832.94 | 0 | 2118.21 | 0 | 2118.21 | 2951.14 | 2125.12 | 826.03 |
Table 2.
The growth in national sugar balance of 2014–2017 (in thousand tons). Source: Nusantara Sugar Community [18].
Table 2.
The growth in national sugar balance of 2014–2017 (in thousand tons). Source: Nusantara Sugar Community [18].
| Parameter * | 2014 | 2015 | 2016 | 2017 |
|---|---|---|---|---|
| Initial stock (GKP and GKR) | 1447.30 | 1226.81 | 933.34 | 945.04 |
| Import (GKP and GKR) | 76.70 | 65.30 | 97.04 | 0 |
| GKP from cane and imported raw sugar | 2803.60 | 2561.82 | 2204.62 | 2118.21 |
| GKR from imported raw sugar | 2759.21 | 2809.05 | 3261.64 | 3234.01 |
| Total Production (GKP and GKR) | 5562.81 | 5370.87 | 5446.25 | 5352.21 |
| Total Provision (GKP and GKR) | 7086.71 | 6662.98 | 6496.64 | 6297.25 |
| Distribution (GKP and GKR) | 5859.90 | 5729.64 | 5551.60 | 5335.66 |
| Final Stock (GKP and GKR) | 1226.81 | 933.34 | 945.04 | 961.59 |
* Note: GKP = gula Kristal putih (white crystal sugar), GKR = gula kristal rafinasi (refined crystal sugar).
Table 3.
List of superior varieties of sugarcane in Indonesia. Source: Sulaiman et al. [16], updated.
Table 3.
List of superior varieties of sugarcane in Indonesia. Source: Sulaiman et al. [16], updated.
| Variety | Maturity | Potential of Production | |||
|---|---|---|---|---|---|
| Rice Field | Upland | ||||
| Sugarcane (ton/ha) | Sugar Yield (%) | Sugarcane (ton/ha) | Sugar Yield (%) | ||
| PS 865 | Early-middle | 80.40 ± 11.20 | 9.38 ± 1.41 | ||
| Kidang Kencana | Middle-late | 112.50 ± 32.50 | 10.99 ± 1.65 | 99.02 ± 23.80 | 9.51 ± 0.88 |
| PS 864 | Middle-late | 122.10 ± 22.80 | 8.34 ± 0.60 | 88.08 ± 23.00 | 9.19 ± 0.64 |
| PS 891 | Middle-late | 110.60 ± 27.10 | 9.33 ± 1.19 | 84.04 ± 32.90 | 10.19 ± 1.35 |
| PSBM 901 | Early-middle | 70.40 ± 16.20 | 9.93 ± 1.02 | ||
| PS 921 | Middle | 139.10 ± 10.10 | 8.53 ± 1.19 | ||
| PS 951 | Late | 146.10 ± 30.40 | 9.87 ± 0.86 | ||
| AAS Agribun | Middle-late | 134.60 ± 68.95 | 10.05 ± 0.97 | 112.50 ± 33.11 | 7.76 ± 0.47 |
| AMS Agribun | Middle-late | 132.50 ± 63.34 | 10.03 ± 0.45 | 110.00 ± 57.50 | 7.84 ± 0.11 |
| ASA Agribun | Middle-late | 121.10 ± 42.10 | 10.18 ± 0.13 | 116.63 ± 49.52 | 7.16 ± 0.30 |
| CMG Agribun | Middle-late | 102.30 ± 53.97 | 10.68 ± 1.27 | 84.77 ± 20.02 | 7.94 ± 0.23 |
Table 4.
The performance of sugar industry between 2004 and 2016. Source: Sulaiman et al. [16].
Table 4.
The performance of sugar industry between 2004 and 2016. Source: Sulaiman et al. [16].
| Year | Number of Mills | Area (ha) | Cane | Sugar | |||
|---|---|---|---|---|---|---|---|
| Production (ton) | Productivity (ton/ha) | Sugar Yield (%) | Production (ton) | Productivity (ton/ha) | |||
| 2004 | 59 | 344,793 | 26,743,181 | 77.6 | 7.67 | 2,051,644 | 5.95 |
| 2005 | 59 | 381,786 | 31,242,268 | 81.8 | 7.18 | 2,241,741 | 5.87 |
| 2006 | 59 | 396,440 | 30,232,835 | 76.3 | 7.63 | 2,307,027 | 5.82 |
| 2007 | 60 | 428,401 | 33,289,452 | 77.7 | 7.35 | 2,448,143 | 5.71 |
| 2008 | 61 | 436,504 | 32,960,166 | 75.5 | 8.10 | 2,668,428 | 6.11 |
| 2009 | 61 | 422,935 | 32,165,572 | 76.1 | 8.02 | 2,580,080 | 6.10 |
| 2010 | 62 | 418,266 | 34,216,549 | 81.8 | 6.47 | 2,214,489 | 5.29 |
| 2011 | 62 | 450,299 | 30,323,228 | 67.3 | 7.35 | 2,228,259 | 4.95 |
| 2012 | 62 | 451,191 | 31,888,928 | 72.1 | 8.13 | 2,591,687 | 5.86 |
| 2013 | 62 | 460,497 | 35,378,805 | 76.8 | 7.20 | 2,545,842 | 5.33 |
| 2014 | 63 | 477,123 | 33,723,376 | 70.7 | 7.65 | 2,579,173 | 5.42 |
| 2015 | 63 | 446,060 | 30,164,097 | 67.6 | 8.28 | 2,497,997 | 5.60 |
| 2016 | 64 | 444,220 | 33,077,163 | 74.5 | 6.72 | 2,222,971 | 5.00 |
Table 5.
List of strategies and programs to increase sugarcane production in Indonesia.
| No. | General Strategy | Significance | Program |
| 1 | Increasing sugarcane productivity | Increase sugarcane production per hectare for planting season. Existing planting areas are the main target. Increasing productivity, i.e., the increase in productivity and harvesting area |
|
| 2 | Reducing yield loss at harvest time | By reducing this loss, production can increase. |
|
| 3 | Increasing farming efficiency | Optimally use space and time in planting and efficiently for sugarcane farming. Optimal agro-input per hectare can result in a higher yield |
|
| 4 | Extensification | Increase the area for sugarcane planting from non-agricultural land and shrub land |
|
Table 6.
List of strategies and programs to increase sugar yield and added value of cane-based products.
Table 6.
List of strategies and programs to increase sugar yield and added value of cane-based products.
| No. | General Strategy | Significance | Program |
|---|---|---|---|
| 1 | Revitalization of existing sugar mills | Improving mill operational conditions to increase sugar yield and milling capacity. Repairing supporting facilities. |
|
| 2 | Development of downstream industry | Increase the added value of cane-based products, other sugar-sourced crops, and sugar processing activities. |
|
Table 7.
List of strategies and programs to create an enabling environment for sugar production.
| No | General Strategy | Significance | Program |
|---|---|---|---|
| 1 | Infrastructure development | To increase the efficiency of the production system and production means, value chain, domestic transportation system, and accessibility, and to increase international market connection |
|
| 2 | Boosting investment | Financial capital is the main factor for implementing any activities. This capital can be received from investors through efforts to attract their interest to invest in research and development as well as for developing prospective business |
|
| 3 | Human capacity building | Human resources play an important role: their ability and knowledge determine the success attainment of the established targets |
|
| 4 | Institution strengthening | The operation to be run in a standard system. Business processes need to be clarified through institution strengthening. |
|
| 5 | Policies synergism | Several ministries and institutions are related to the sugar industry. The Coordinator Ministry for economic affairs can coordinate and synergize these institutions. Ministry of Agriculture works collaboratively with the Ministry of Trade, Ministry of Industry, and others in determining policies related to sugar affairs |
|
© 2019 by the authors. Licensee MDPI, Basel, Switzerland. This article is an open access article distributed under the terms and conditions of the Creative Commons Attribution (CC BY) license (http://creativecommons.org/licenses/by/4.0/).
Share and Cite
MDPI and ACS Style
Sulaiman, A.A.; Sulaeman, Y.; Mustikasari, N.; Nursyamsi, D.; Syakir, A.M. Increasing Sugar Production in Indonesia through Land Suitability Analysis and Sugar Mill Restructuring. Land 2019, 8, 61. https://doi.org/10.3390/land8040061
AMA Style
Sulaiman AA, Sulaeman Y, Mustikasari N, Nursyamsi D, Syakir AM. Increasing Sugar Production in Indonesia through Land Suitability Analysis and Sugar Mill Restructuring. Land. 2019; 8(4):61. https://doi.org/10.3390/land8040061
Chicago/Turabian StyleSulaiman, Andi Amran, Yiyi Sulaeman, Novia Mustikasari, Dedi Nursyamsi, and Andi Muhammad Syakir. 2019. "Increasing Sugar Production in Indonesia through Land Suitability Analysis and Sugar Mill Restructuring" Land 8, no. 4: 61. https://doi.org/10.3390/land8040061
Note that from the first issue of 2016, this journal uses article numbers instead of page numbers. See further details here.