Gender, Educational Attainment, and Farm Outcomes in New Zealand


Manaaki Whenua—Landcare Research, Wellington 6011, New Zealand
Land 2019, 8(1), 18; https://doi.org/10.3390/land8010018
Submission received: 11 December 2018
/
Revised: 9 January 2019
/
Accepted: 9 January 2019
/
Published: 14 January 2019
Abstract
:Empirical studies of farm outcomes that rely on survey data often find important roles for education and gender. However, relatively few studies consider either field of study or gender of the decision maker (as opposed to gender of the survey respondent). This paper evaluates how the field of education and gender of decision makers correlate with profitability, farm management, future intentions, risk and norms, and adoption of novel technologies in New Zealand, explicitly accounting for the fact that many farming households make decisions jointly. Findings show that post-secondary education in a relevant field is a strong predictor of farm outcomes such as adoption of best management practices, plans to convert or intensify land use, risk tolerance, and adoption of novel technologies. Male sole decision makers (vis-à-vis joint decision makers) are more likely to have adopted best management practices and to have greater risk tolerance while female sole decision makers have adopted fewer novel technologies. These results have important implications for policy makers and extension officers who wish to encourage the uptake of best management practices and who wish to better understand future land-use change.
1. Introduction
The relationships between gender and farming outcomes and between educational attainment and farming outcomes are well studied in agricultural economics, but the measurement of gender and education has been problematic. Specifically, the majority of the literature that addresses the roles of education and gender relies on correlates of the measures in which policy makers are interested, namely, the number of years of education attained (as opposed to the field of study) and the gender of the respondent (as opposed to the gender and decision-making authority of the decision maker).
For example, Lockheed et al. [1] review 37 empirical analyses of the relationship between education and farm profitability and/or efficiency. Using years completed as an indicator of education, they conclude that the relationship between education and profitability is strongly positive, particularly in modernizing agricultural systems. Similarly, Griliches [2] observes that the number of years of education attained by farmers is strongly and positively associated with US farm productivity. One possible explanation for the relationship between educational attainment and productivity is that farmers with more education may more readily adapt to new market opportunities [3,4].
Prokopy et al. [5] undertake a meta-analysis of 55 studies that analyse household- and individual-level characteristics that drive farmers to adopt best management practices. They find a positive association between the number of years of education and adoption of one or more best management practices by farming households. Similarly, Quisumbing [6], Huang et al. [7], Bergström [8], and Brown and Roper [9] find that tertiary education is positively associated with adoption of novel technologies, including in New Zealand. A possible reason underlying these relationships is that better-educated farmers may be more aware of specific practices as a result of having better contacts and stronger professional networks. More generally, Filson [10] and Kaiser et al. [11] argue that the number of years of education obtained by survey respondents is positively associated with pro-environmental attitudes and intentions.
Evidence on the relationship between educational attainment and values is more mixed. For example, Binswager [12], Miyata [13], and Gloede et al. [14] find that educational attainment and risk aversion are negatively correlated while Tanaka et al. [15] find that educational attainment is positively correlated with risk aversion. Kebede et al. [16] argue that the overall relationship between education and risk tolerance in farming households depends critically on the availability of off-farm income-generating opportunities. In the New Zealand context, Brown and Roper [9] and Small et al. [17] observe that farmers with higher educational attainment have larger and more diverse professional networks, which may reflect the influence of the farm community on their operations.
Most studies in agricultural economics do not distinguish between the gender of the survey respondent and the gender of the decision maker [18] or the independent decision-making authority of the respondent [19], implicitly assuming that survey respondents speak for all members of the household in the sense of Becker [20]. In doing so, they conclude in a variety of contexts that female farmers are more productive (and thus more profitable) than male farmers [21,22], that female farmers are less productive than male farmers [23,24], that men and women are equally productive farmers [6,25], or that relative productivity depends critically on the assignment of farm tasks [26], the allocation of physical capital [27], or the allocation of human capital [28].
Also using gender of the respondent as a proxy for gender and independence of the decision maker, Burton et al. [29] find that women are more likely to adopt organic farming practices while Filson [10] and Karami and Mansoorabadi [30] report that women are more likely to have pro-environmental attitudes and to support pro-environmental government regulations. In contrast, men are more likely to adopt nutrient management plans, soil management plans, fencing, and other best management practices [31] as well as emerging technologies [32]. Although female survey respondents are generally found to demonstrate greater risk aversion than male survey respondents [12,33,34], female survey respondents have also been shown to exhibit greater openness to changing land uses than male survey respondents in some studies [35].
The simplified measures of education and gender in the above-referenced studies fail to account for other important aspects of education and gender, namely field of study [36] and the gender and authority of decision makers [18] as opposed to survey respondents. Research on agricultural earnings in the US shows that field of study significantly impacts income [37], although the financial rewards associated with individual fields of study diminish with experience [38]. Similarly, Riley [39] finds that study of agriculture (as opposed to years of education) impacts farming intensity in Ireland. In terms of gender, men and women who make decisions independently have been shown not only to have different preferences and to make different decisions from one another, but also to have different preferences and to make different decisions from families that make decisions jointly [40], which may have important implications for farming incomes. However, none of these studies focus on adoption of best management practices, nor do they provide empirical evidence from Australasia. Moreover, none of them consider the potentially important interaction between field of study and the gender of decision makers for farm outcomes. This paper sets out to do so using a rich dataset of New Zealand farmers.
2. Materials and Methods
2.1. Survey of Rural Decision Makers
The empirical analysis is based on the 2015 Survey of Rural Decision Makers (SRDM) [41,42,43], a large, Internet-based survey that covers both commercial production and lifestyle farming in all 16 regions of New Zealand. In contrast to many existing datasets, these rich data allow for analysis that emphasizes relevance of study (rather than years of education) and decision-making authority (rather than gender of the respondent) in assessing the relationship between education and outcomes such as profitability, adoption of best management practices, future plans, values and norms, and adoption of novel technologies. The survey consists of 288 questions, including detailed information on demographics; values; land use and land-use change; farm management; and farming objectives. Notably, the demographics data include data on field of study not only for the survey respondent, but also for his or her spouse, if applicable. The survey was adaptive, such that respondents were only shown questions that were relevant to their industries.
The sampling strategy relied primarily on contacting farmers via email through the National Animal Identification and Tracing database, industry and sector group membership lists, and individuals who responded to the 2013 Survey of Rural Decision Makers. Industry and sector groups that circulated information about the survey among their members included Beef + Lamb New Zealand, the Farm Forestry Association, Federated Farmers, the Foundation for Arable Research, Horticulture New Zealand, New Zealand Wine, the QEII Charitable Trust, and Rural Women. In addition, invitations to participate in the survey were posted by mail to approximately 40% of all commercial farmers in the Statistics New Zealand business registry. Invitations were personalized and unique URLs were sent to each address to facilitate sending of reminder messages to non-respondents. A $10 donation was made to charity for each completed survey, and all survey participants were entered into a prize draw. The survey took 27 minutes to complete, on average.
One criticism levied against online surveying is the lack of accessibility, particularly for rural populations. However, approximately 80% of rural New Zealanders had home access to broadband in 2015 (a figure that is rapidly expanding under the government’s Rural Broadband Initiative). In total, 2839 respondents completed the survey, including 1984 commercial farmers. While an overall response rate is difficult to calculate given the sampling methodology, the sample of commercial farmers closely approximates the population reported in the 2012 agricultural census by geography, industry, and farmer age [44], although sheep and/or beef farmers and farmers from Auckland and Wellington are slightly over-represented, and foresters and farmers from Waikato are slightly underrepresented [45]. The inferential analysis thus accounts for industry, region, and demographics.
To analyse the effect of gender and education on farm outcomes, the sample is restricted to respondents that make their decisions individually or in partnership with another individual, typically a spouse (as opposed to those who speak on behalf of trust boards or corporations) because these two groups have clear information on gender and education for all decision makers. Because the adoption of best management practices and novel technologies are of particular interest, the sample is further restricted to commercial farmers.1
Education in this study is measured by both the number of years of education attained and by the field of study. There are three classifications of attainment: secondary school or less, post-secondary education in a non-relevant field, and post-secondary education in a relevant field. Secondary school in New Zealand provides a general education rather than any specialized training. Relevant post-secondary education includes the following fields: agriculture, animal science, business, dairy science, environmental studies, farming, horticulture, forestry, meat/wool production, veterinary science, viticulture, and other agricultural fields. Respondents are categorized as being male sole decision makers, female sole decision makers, or joint decision makers. For households that make decisions jointly, the gender of the survey respondent is not relevant. Accordingly, the education of joint decision makers is recorded as the most relevant degree among the joint decision makers. For example, if the survey respondent has a degree in a non-relevant field and his or her spouse has a degree in agriculture, then the education for this household is considered to be relevant.
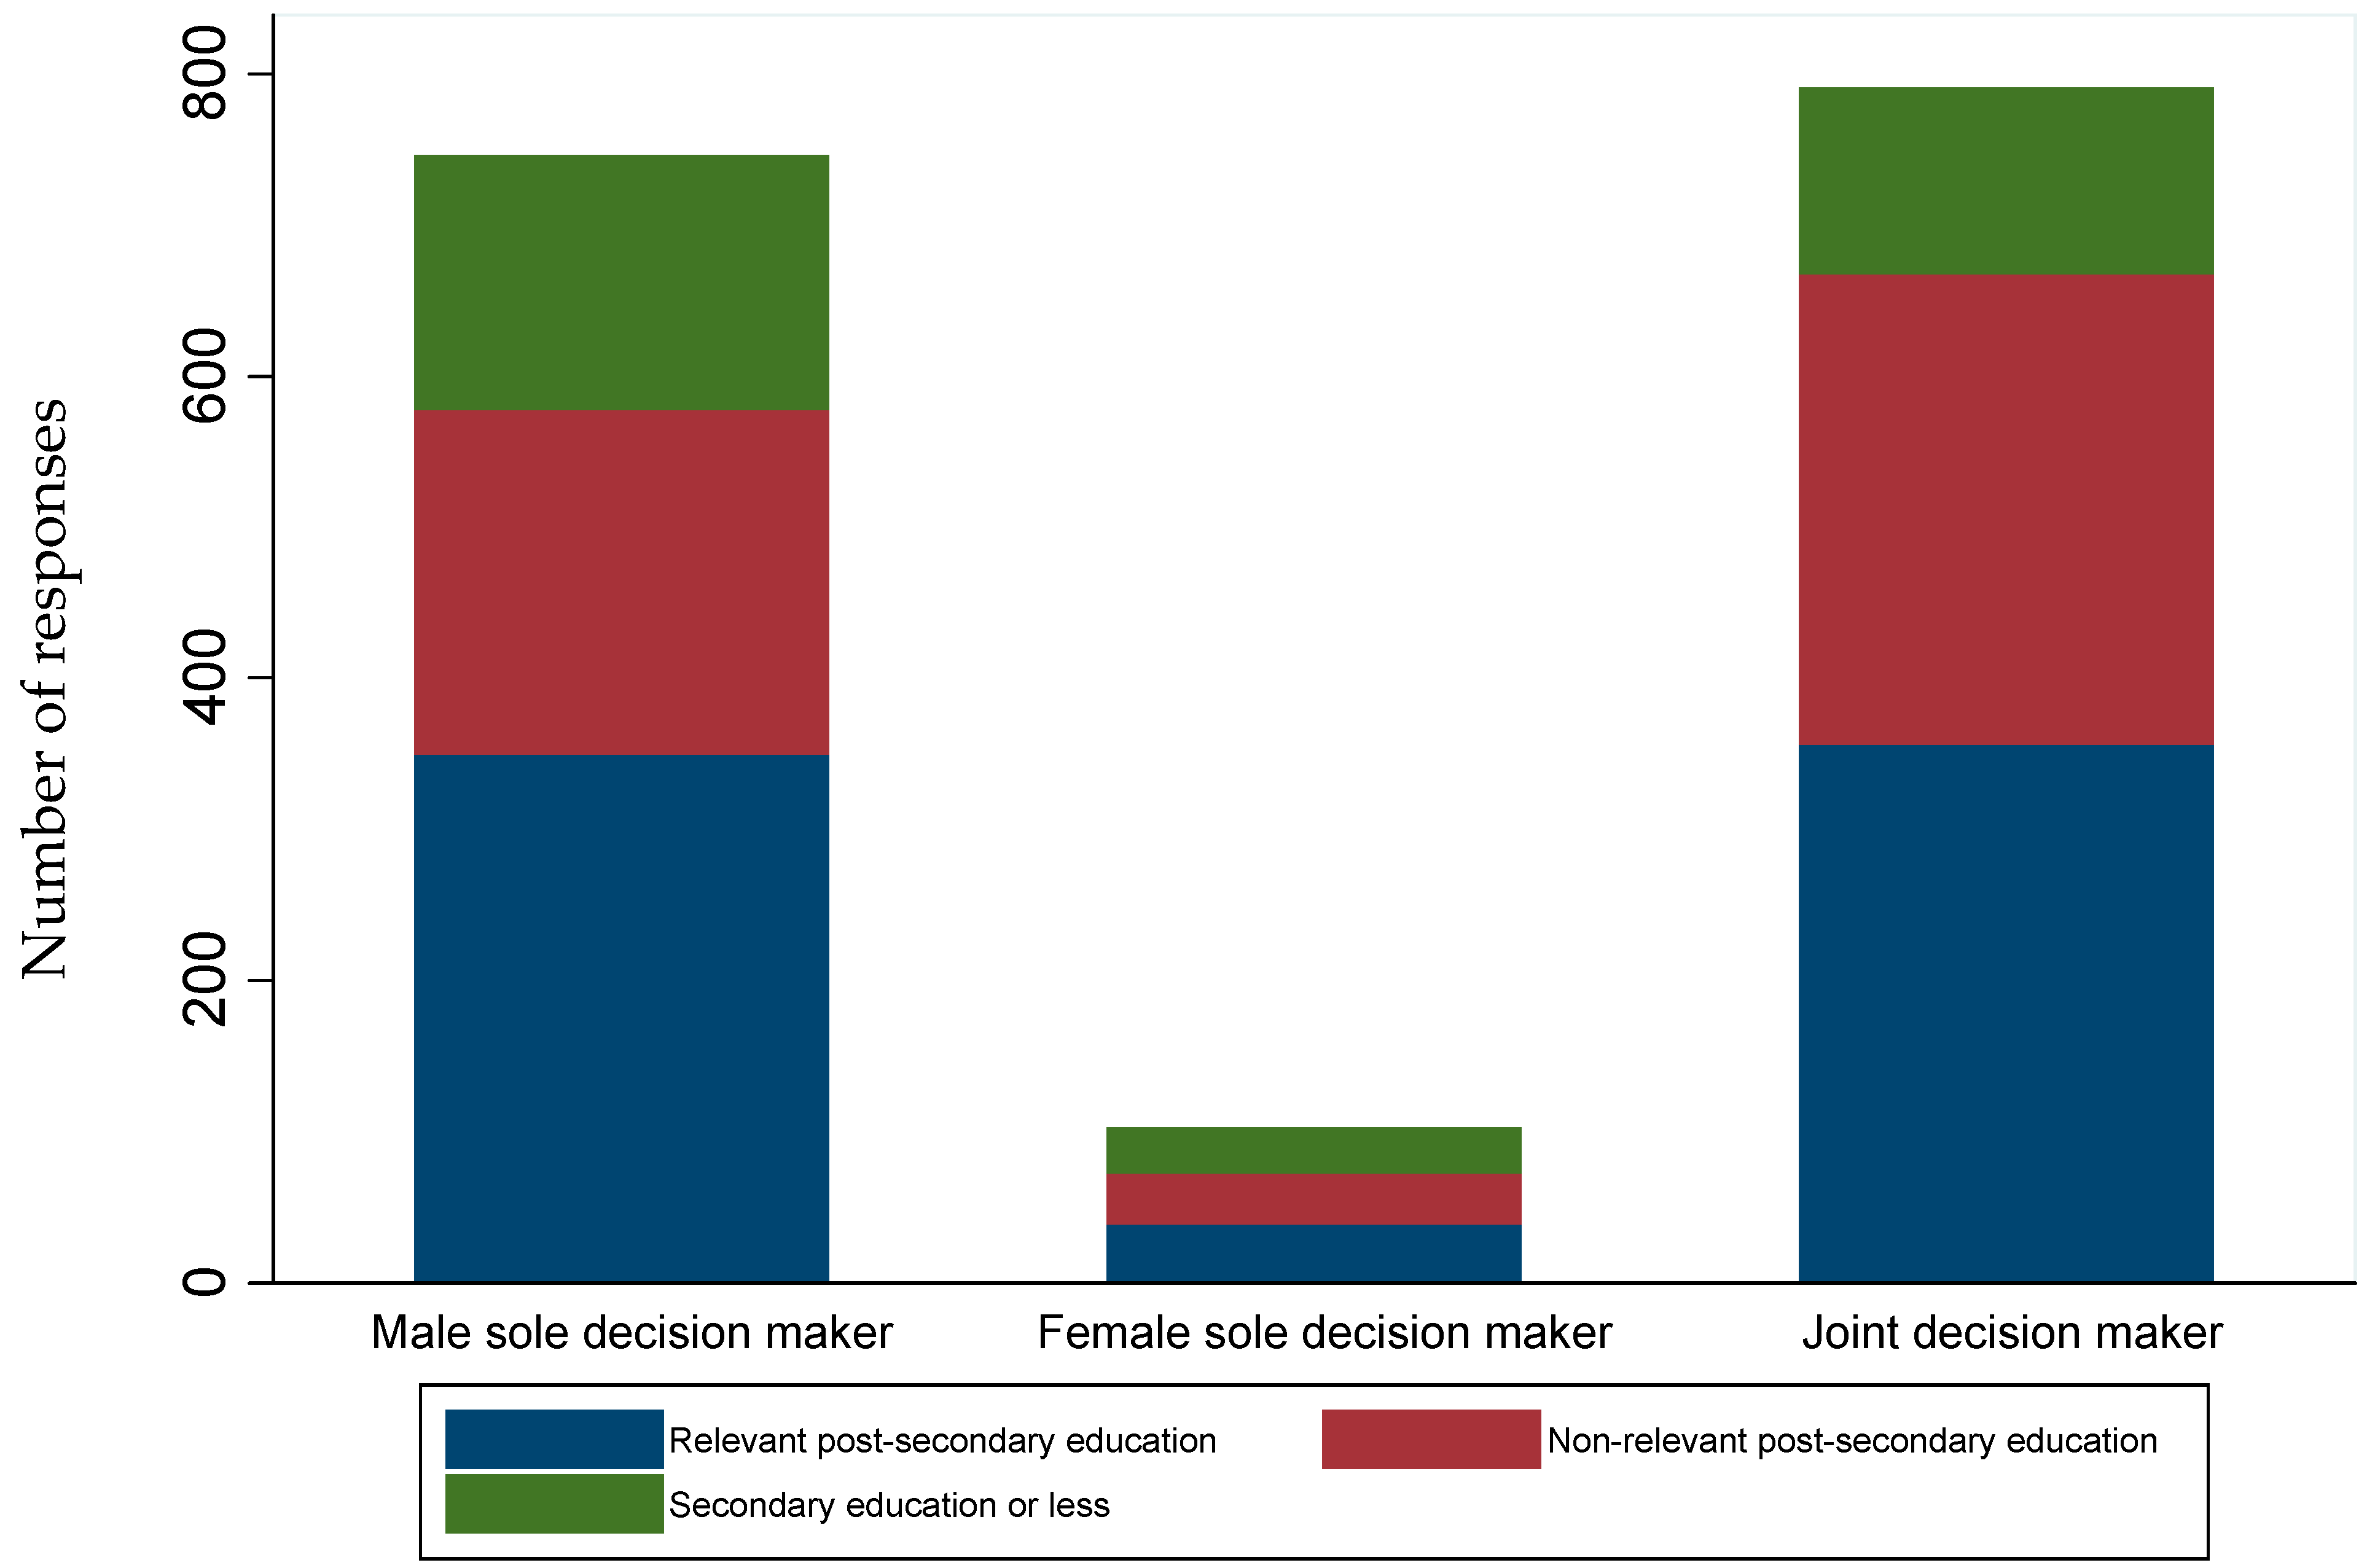
The sample includes 103 female sole decision makers, 791 male sole decision makers, and 746 households in which decisions are made jointly (Figure 1). Women comprise 11.4% of sole decision makers in our sample, consistent with lower participation rates in farming in general. For example, women comprised just 4.3% of enrollees at Lincoln university (which specializes in agricultural training) in the mid 1970s and 16% of enrollees at its Telford campus in 2010 [48,49].
Among female sole decision makers, 32.0% have secondary schooling or less, 30.1% have post-secondary education in a non-relevant field, and 37.9% have post-secondary education in a relevant field. Just under 40% of male sole decision makers have secondary schooling or less, while 45.0% have post-secondary education in a relevant field. The share of male decision makers with non-relevant post-secondary education is substantially less than that of their female counterparts at 15.7%. Among joint decision makers, one or both partners have relevant post-secondary education in 46.8% of cases and non-relevant post-secondary education in 22.7% of cases.
The relationships between education and gender and five classes of dependent variables are considered, namely profitability, adoption of best management practices, future intentions, values and norms, and adoption of novel technologies. Profitability is measured by a dummy variable that takes the value of 1 if the farm is self-reported to be profitable and 0 if the farm breaks even or is unprofitable. To analyse adoption of best management practices, dummy variables are used to indicate whether farmers have fenced waterways, have implemented a nutrient management plan (NMP), have implemented a soil management plan (SMP), and have implemented plan for managing pugging (PMP). Future intentions are measured by dummy variables that describe whether farmers plan to increase the intensity of an existing land use in the next two years, plan to convert or add a new land use in the next two years, plan to increase land allocated to an existing land use in the next two years, or plan to sell, subdivide, or lease land in the next two years. Values and norms are measured by risk preferences (specifically, the degree to which farmers are prepared to take risk, with 0 indicating a high level of risk avoidance and 10 indicating a level of risk tolerance; and preference for leaving experimentation to others, with 0 indicating a high willingness to experiment and 10 indicating a avoidance of experimentation) and norms (specifically, whether farmers report that they farm out of family tradition and whether farmers feel pressure to farm sustainably by their families, by the farming community, and by the New Zealand public, each measure on 0-low to 10-high scale). Adoption of novel technology is measured via a count indicating how many of the following technologies have been adopted: windmills for generating electricity, computer-based management systems, automatic sensors and/or lysimeters, and lucerne and/or plantain grasses. Table 1 shows summary statistics for the entire set of dependent variables.
Table 2 and Table 3 show summary statistics by group. Specifically, Table 2 reports on the variables of interest by relevance of education and Table 3 reports on the variables of interest by gender of the decision maker. Statistical differences based on Bonferroni multiple comparison tests are reported in the right column.
Table 2 shows that farms on which the decision maker does not have a relevant post-secondary qualification are less profitable and less likely to have adopted NMPs than farms on which the decision maker has a relevant post-secondary education or post-secondary education or less. Farms on which decision makers have relevant post-secondary educations are more likely to have SMPs and to have plans for intensifying, converting, or increasing land allocated to a given activity. Farms on which decision makers have secondary education or less are more likely to farm out of family tradition and less likely to farm sustainably due to family or community norms. They have also adopted fewer novel technologies.
As shown in Table 3, male sole decision makers are more likely to operate profitably than female sole decision makers. Male sole decision makers also report higher risk tolerance, higher likelihood of farming sustainably due to community norms, and higher levels of adoption of novel technologies than female sole decision makers. Vis-à-vis joint decision makers, male sole decision makers are more likely to have plans to intensify or convert land, to report higher risk tolerance, and to report lower levels of sustainable farming due to public norms. Female sole decision makers are less likely to be profitable, less likely to plan to increase land allocated to an existing activity, less risk tolerant, less likely to farm sustainably due to community norms, and less likely to adopt novel technologies than joint decision makers.
Given the adaptive nature of the survey, not every respondent saw every question. For example, only those with livestock and waterways were asked whether waterways were fenced. For this reason, the sample size varies somewhat by outcome.
2.2. Econometric Model
Model specifications change depending on the dependent variable of interest. Dummy variables are used to represent whether a respondent’s farm is profitable, whether waterways are fenced, whether he or she has implemented an NMP, SMP, or PMP, and whether he or she plans to intensify a land use, convert an existing land use, increase the amount of land allocated to an existing land use, or sell/subdivide/lease land in the next two years. The probit model is estimated as follows:
where indicates whether or not respondent ’s farm is profitable, whether the management practice was adopted, or whether he or she intends to make a specified change in the next two years.
is a latent variable informed by a vector of explanatory variables, . In the first, most parsimonious specification of the model, includes dummy variables for post-secondary education in a relevant field, post-secondary education in a non-relevant field, male sole decision maker, female sole decision maker, age, region, and industry. In the second specification of the model, the dummy variables for education and gender are interacted to allow for the possibility that the effects of education differ by gender.
To measure risk tolerance, experiment avoidance, whether one farms out of tradition, pressure from family to farm sustainably, pressure from the farming community to farm sustainably, and pressure from the greater New Zealand public to farm sustainably, a Tobit model is estimated:
where is a latent variable such that
For the count variable of how many novel technologies a farmer has adopted, a negative binomial model2 is estimated as follows:
where is the count of novel farm technologies adopted by respondent i. and , where .
3. Results
Table 4 shows estimation results for 16 different outcomes described above, controlling for age, primary industry, and region. Marginal effects are reported where relevant and heteroscedasticity-robust standard errors are reported throughout. Farmers with non-relevant post-secondary education are, on average, 9.4% less likely to be profitable than those with secondary education or less (p < 0.01), the omitted category. However, the estimated probability of being profitable among farmers with relevant post-secondary education is neither higher nor lower than that among farmers with secondary education or less. Farmers with non-relevant post-secondary education are 4.9% less likely to have adopted a nutrient management plan than farmers with secondary education or less (p < 0.10), while farmers with relevant post-secondary education are no more or less likely to have adopted a nutrient management plan than the omitted group. Farmers with relevant post-secondary education are 3.6% more likely to have fenced waterways (p < 0.10), 8.5% more likely to have implemented a plan for managing soils (p < 0.01), and 6.7% more likely to have implemented a plan for managing pugging (p < 0.05) than their counterparts with secondary education or less. In contrast, farmers with non-relevant post-secondary education are neither more nor less likely to have implemented these three management practices.
Having a relevant post-secondary education is associated with a 7.1% (p < 0.05) greater probability of planning to intensify existing land uses in the next two years, a 7.0% (p < 0.01) greater probability of planning to convert to a new land use in the next two years, and an 8.3% (p < 0.01) greater probability of planning to increase the land allocated to an existing land use in the next two years, while having a non-relevant post-secondary education is not statistically correlated with plans of making these three land use changes.
Farmers with relevant post-secondary education rate their risk tolerance, on average, 0.40 points higher on a 0–10 scale than farmers with secondary education or less (p < 0.01). They also are less likely to avoid experimentation, rating themselves 0.50 points lower, on average, than farmers with secondary education or less (p < 0.01).
Farmers with post-secondary education (regardless of field) consider themselves to be less likely to farm out of tradition than farmers with less education (p < 0.01). Both farmers with non-relevant post-secondary education and farmers with relevant post-secondary education feel pressure from their families to farm sustainably. Farmers with non-relevant education evaluate pressures they feel from their families 0.48 points higher than farmers with secondary education or less (p < 0.05), while farmers with relevant post-secondary education evaluate these same pressures 0.33 points less than farmers with secondary education or less (p < 0.05). Farmers with relevant post-secondary education also feel pressure from the New Zealand public to farm sustainably, rating this pressure 0.24 points higher than farmers with secondary education or less (p < 0.10).
Both farmers with non-relevant post-secondary education and those with relevant post-secondary education have adopted a greater number of novel technologies than farmers with secondary education or less. Farmers with non-relevant post-secondary education have adopted 0.11 more novel technologies (p < 0.10) while those with post-secondary education in a relevant field have adopt 0.31 more novel technologies (p < 0.01).
Female sole decision makers are 10.5% less likely to report being profitable than joint decision makers (the omitted category), ceteris paribus (p < 0.05). Male sole decision makers, in contrast, are neither more nor less profitable than joint decision makers. Male sole decision makers are also neither more nor less likely than joint decision makers to have adopted any of the four best management practices, but they are 6.3% more likely to plan to intensify existing land uses (p < 0.05) and 6.2% more likely to plan to convert to new land uses (p < 0.01) in the next two years. Female sole decision makers are 10.6% less likely to plan to sell, subdivide, or lease out land than joint decision makers (p < 0.05).
Male sole decision makers also exhibit greater risk tolerance, rating themselves 0.45 points higher for risk tolerance than joint decision makers on a 0-10 scale, on average (p < 0.01), and 0.28 points lower for experimentation avoidance (p < 0.05). Female sole decision makers are no different than joint decision makers in terms of risk preferences. However, female sole decision makers evaluate pressure from the farming community to farm sustainably 0.78 points lower than joint decision makers (p < 0.01).
Finally, female sole decision makers have adopted 0.21 fewer novel technologies than joint decision makers (p < 0.01), while male sole decision makers have adopted 0.08 more novel technologies than joint decision makers (p < 0.10). This result may reflect the greater risk tolerance reported by men above.
For robustness, education and gender are also interacted. Table 5 presents results in which the average marginal effect (i.e., partial effect) of education is reported separately for male and female sole decision makers; point estimates are interpreted relative to joint decision makers with secondary education or less. As before, age, primary industry, and region are included as control variables and heteroscedasticity-robust standard errors are reported. With few observations in some categories, point estimates are less precise than those reported previously. These results nevertheless underscore the earlier findings.
Female sole decision makers with secondary education or less are statistically indistinguishable from similarly educated joint decision makers in terms of farm profitability and adoption of farm management practices. However, they are 22.1% less likely to hold intentions to sell, subdivide, or lease the farm in the immediate future than joint decision makers with secondary education or less (p < 0.01). They are also significantly less likely to report that they farm out of family tradition (p < 0.10). Moreover, while point estimates for risk are not statistically significant, female sole decision makers with secondary education or less have adopted 0.23 fewer novel technologies than similarly educated joint decision makers, on average.
Female sole decision makers with post-secondary education are not substantively different from joint decision makers with secondary education or less. However, women with non-relevant post-secondary education are 7% more likely to report having fenced large, permanently flowing streams (p < 0.05), and they have adopted 0.32 fewer novel technologies (p < 0.01), on average. Female sole decision makers with relevant post-secondary education feel substantially less pressure from the wide farming community to farm sustainably (p < 0.01).
Male sole decision makers are neither more nor less likely to report being profitable than joint decision makers with secondary education or less, regardless of their own education levels. Similarly, male sole decision makers are neither more nor less likely to have adopted specific management practices on the whole, although male sole decision makers are 7.2% more likely to have plans for managing pugging in place (p < 0.10). However, male sole decision makers are significantly more likely to hold intentions to change practices: those with relevant post-secondary education are 13.5% more likely to hold plans to intensify operations in the immediate future (p < 0.01) and 8.6% more likely to hold plans to convert land to new uses (p < 0.05), while those with non-relevant post-secondary education are 11.0% more likely to intend to sell, subdivide, or lease the farm out (p < 0.10). Male sole-decision makers are also greater risk takers, particularly those with secondary education or less (p < 0.05) and those with relevant post-secondary education (p < 0.01); similarly, those with relevant post-secondary education are less likely to report reluctance to experiment (p < 0.05) while those with secondary education or less have adopted 0.11 more novel technologies than their counterparts who make decisions jointly (p < 0.05). Male sole decision makers with non-relevant secondary education are significantly less likely to report farming out of family tradition (p < 0.05), i.e., they are more likely to have independently chosen farming as a vocation.
4. Discussion and Conclusions
Using a more nuanced measure of education than is available in most analyses affords a richer understanding of how education impacts profitability, farm management practices, future intentions, risk and norms, and adoption of novel technologies. For example, the literature has demonstrated a strong correlation between the number of years of education completed and farm profit [1]. However, this paper shows that farmers with non-relevant post-secondary education are, on average, less profitable than farmers with secondary education or less, even after controlling for gender, age, industry, and region; similarly, farmers with relevant post-secondary education are neither more nor less likely to be profitable than farmers with secondary education or less.
The academic literature further shows that higher levels of education completed lead to higher adoption of best management practices and to higher adoption of novel technologies [4,5,6,7,8], including those using this dataset [9,42,50]. This paper shows that post-secondary education in a relevant field is positively associated with adoption for three of the best management practices, while post-secondary education in a non-relevant field is negatively correlated with adoption of a fourth. Farmers with post-secondary education adopt a greater number of novel technologies than those with secondary education or less. In addition, farmers with relevant post-secondary education are more likely to hold intentions to intensify, to convert to new land uses, and to increase the sizes of their farms in the near future.
The results in this paper add a new dimension to the nebulous relationship between education and risk preferences [12,13,14,15]. While Brown et al. [50] show that years of education is positively correlated with risk tolerance in New Zealand, these results show that farmers with relevant post-secondary education report higher risk tolerance than those with secondary education or less, i.e., that field of study matters. In addition, farmers with post-secondary education report that family tradition was less influential in their decision to become farmers than those with secondary education or less. Farmers with post-secondary education also disproportionately report that both their families and the New Zealand public expect them to farm sustainably, a result consistent with that reported in earlier studies [50].
A different understanding of gender dynamics in farm decision making also contributes a new and nuanced interpretation of gender and outcomes for New Zealand farms. Specifically, in contrast to the vast majority of studies, this study asks whether the survey respondent makes farm-related decisions solely or jointly with his or her partner. Controlling for education, it is found that female sole decision makers are less likely to be profitable than joint decision makers, a result that supports Jamison [23] and Bindlish and Evenson [24], while refuting Jacoby [21], Dadzie and Dasmani [22], and others. Farm management is not strongly stratified by gender (consistent with Brown and Roper [9], which uses the same dataset), but male sole decision makers are more likely to plan to intensify existing land uses and to convert to new land uses in the near future while female sole decision makers are less likely to plan to sell, subdivide, or lease. These results run contrary to previous findings that female survey respondents are more open to changing land use than men [35] and are more nuanced than results reported in Brown et al. [50], which uses the same dataset to show that men disproportionately plan to change land use.
Male sole decision makers adopt a greater number of novel technologies than joint decision makers, while female sole decision makers adopt fewer, mirroring results reported by [9,32]. Risk tolerance could underlie decisions to adopt novel technologies and to change land use and intensity, and this paper finds that male sole decision makers are not only more risk tolerant than joint decision makers, but they are also less likely to avoid experimentation. Again, the results are more nuanced than results reported in Brown et al. [50], which shows that male New Zealand farmers have higher risk preferences than female New Zealand farmers.
Interacting education and gender deepens comprehension of how different groups make farming decisions. The results show that relevant post-secondary education has a stronger impact on the farming outcomes for men than women. Specifically, male sole decision makers with relevant post-secondary education are disproportionately likely to plan to intensify and/or convert to a new land use in the near future. Male sole decision makers with relevant post-secondary education are also disproportionately risk tolerant and less likely to avoid experimentation. That said, male sole decision makers with relevant post-secondary education are statistically indistinguishable from joint decision makers with secondary education or less in the number of novel technologies that have been adopted. Instead, it is male sole decision makers without post-secondary education that disproportionately adopt novel technologies.
This subtler understanding of education and gender affords better targeting of policy for achieving desired farm outcomes. For example, because households in which at least one decision maker has education in a field related to agriculture are significantly more likely to adopt best management practices, policy makers and extension officers may target their efforts at farmers without this educational background. Similarly, policy makers and extension officers who wish to encourage the adoption of new technologies may target their efforts at female decision makers. New Zealand has set aggressive targets for reducing greenhouse gas emissions to 5% below 1990 levels by 2020, to 30% below 2005 levels by 2030, and to 50% below 1990 levels by 2050 [51]. To meet these targets, the government has pledged to plant one billion trees by 2028 [52], the most ambitious afforestation program ever undertaken, and has invested in research to improve emissions efficiency through feed and nutrition, animal genetics, and pasture management [53]. In addition, the government has established a goal of eradicating introduced rats, mustelids, and possums from the entire country by 2050 [54] as a means of protecting endemic flora and fauna. Because agriculture accounts for nearly half of greenhouse gas emissions in New Zealand [55] and because participation from farmers is critical for large-scale tree planting [52], herd and pasture management [53], and pest control efforts [54], the results of this paper show that policy makers would do well to offer targeted support to female farmers and those without specialized training in agriculture. More generally, these results may encourage others to develop more nuanced understandings of education and gender in agricultural decision making.
Differential effects of education and gender may be amplified if groups respond to exogenous factors such as unanticipated changes in commodity prices differently. For example, dairy payouts fell significantly between 2014 and 2015 while beef prices reached record highs. If farmers with specialised education are better able to insulate their businesses from price swings, for example, then the estimated effects of post-secondary education in a relevant field will be biased upward. While this possibility is mitigated by including industry fixed effects, a promising future extension is using panel data to isolate exogenous shocks.
Furthermore, although explaining why differences in farm outcomes exist requires a theoretical framework that exceeds the scope of this paper, a further area of investigation is to test hypotheses for why men and women and those with and without specialised education differ in in terms of profitability, farm management, future intentions, risk and norms, and adoption of novel technologies in New Zealand farming.
Funding
This research was funded by the New Zealand Ministry for Primary Industries.
Conflicts of Interest
The author declares no conflict of interest.
References
- Lockheed, M.E.; Jamison, T.; Lau, L.J. Farmer education and farm efficiency: A survey. Econ. Dev. Cult. Chang. 1980, 29, 37–76. [Google Scholar] [CrossRef]
- Griliches, Z. Research expenditures, education, and the aggregate agricultural production function. Am. Econ. Rev. 1964, 54, 961–974. [Google Scholar]
- Dupraz, P.; Vanslembrouck, I.; Bonnieux, F.; Van Huylenbroeck, G. Farmers’ participation in European agri-environmental policies. In Proceedings of the Xth EAAE Congress. ‘Exploring Diversity in the European Agri-Food System’, Zaragoza, Spain, 28–31 August 2002. [Google Scholar]
- Defrancesco, E.; Gatto, P.; Runge, F.; Trestini, S. Factors affecting farmers’ participation in Agri-environmental measures: A Northern Italian perspective. J. Agric. Econ. 2008, 59, 114–131. [Google Scholar] [CrossRef]
- Prokopy, L.S.; Floress, K.; Klotthor-Weinkauf, D.; Baumgart-Getz, A. Determinants of agricultural best management practice adoption: Evidence from the literature. J. Soil Water Conserv. 2008, 63, 300–311. [Google Scholar] [CrossRef]
- Quisumbing, A.R. Gender Differences in Agricultural Productivity (No. 5); International Food Policy Research Institute (IFPRI): Washington, DC, USA, 1995. [Google Scholar]
- Huang, L.-Y.; Hsieh, Y.-J.; Chang, S.E. The effect of consumer innovativeness on adoption of location-based services. Rev. Glob. Manag. Serv. Sci. 2011, 1, 17–31. [Google Scholar]
- Bergström, A. The contexts of internet use: From innovators to late majority. J. Audience Recept. Stud. 2015, 12, 3–18. [Google Scholar]
- Brown, P.; Roper, S. Innovation and networks in New Zealand farming. Aust. J. Agric. Resour. Econ. 2017, 61, 422–442. [Google Scholar] [CrossRef]
- Filson, G.C. Demographic and farm characteristic differences in Ontario farmers’ views about sustainability policies. J. Agric. Environ. Ethics 1996, 9, 165–180. [Google Scholar] [CrossRef]
- Kaiser, F.G.; Wölfing, S.; Fuhrer, U. Environmental attitude and ecological behaviour. J. Environ. Psychol. 1999, 19, 1–19. [Google Scholar] [CrossRef]
- Binswanger, H. Attitudes towards risk: Experimental measurements in rural India. Am. J. Agric. Econ. 1980, 62, 395–407. [Google Scholar] [CrossRef]
- Miyata, S. Household’s risk attitudes in Indonesian villages. Appl. Econ. 2003, 35, 573–583. [Google Scholar] [CrossRef]
- Gloede, O.; Menkhoff, L.; Waibel, H. Shocks, individual risk attitude, and vulnerability to poverty among rural households in Thailand and Vietnam. World Dev. 2015, 71, 54–78. [Google Scholar] [CrossRef]
- Tanaka, T.; Camerer, C.F.; Nguyen, Q. Risk and time preferences: Linking experimental and household survey data from Vietnam. Am. Econ. Rev. 2010, 100, 557–571. [Google Scholar] [CrossRef]
- Kebede, Y.; Gunjal, K.; Coffin, G. Adoption of new technologies in Ethiopian agriculture: The case of Tegulet-Bulga district Shoa province. Agric. Econ. 1990, 4, 27–43. [Google Scholar] [CrossRef]
- Small, B.; Brown, P.; Montes de Oca Munguia, O. Values, trust, and management in New Zealand agriculture. Int. J. Agric. Sustain. 2016, 14, 282–306. [Google Scholar] [CrossRef]
- Pfeiffer, L.; Richter, S.; Fletcher, P.; Taylor, J.E. Gender in economic research on international migration and its impacts: A critical review. Intern. Migr. Women 2007, 11–51. Available online: http://siteresources.worldbank.org/INTGENDER/Resources/Session1Tayloretal.pdf (accessed on 13 January 2019).
- Manser, M.; Brown, M. Marriage and household decision-making: A bargaining analysis. Int. Econ. Rev. 1980, 21, 31–44. [Google Scholar] [CrossRef]
- Becker, G.S. A theory of marriage—Part 1. J. Political Econ. 1973, 82, 1063–1093. [Google Scholar] [CrossRef]
- Jacoby, H.G. Productivity of men and women and the sexual division of labor in peasant agriculture of the Peruvian Sierra. J. Dev. Econ. 1991, 37, 265–287. [Google Scholar] [CrossRef]
- Dadzie, S.K.; Dasmani, I. Gender difference and farm level efficiency: Metafrontier production function approach. J. Dev. Agric. Econ. 2010, 2, 441–451. [Google Scholar]
- Jamison, D.T.; Lau, L.J. Farmer Education and Farm Efficiency; Johns Hopkins University Press: Baltimore, MD, USA, 1982. [Google Scholar]
- Bindlish, V.; Evenson, R.E. Evaluation of the Performance of T&V Extension in Kenya; World Bank: Washington, DC, USA, 1993; Volume 23. [Google Scholar]
- Moock, P.R. The efficiency of women as farm managers: Kenya. Am. J. Agric. Econ. 1976, 58, 831–835. [Google Scholar] [CrossRef]
- Udry, C.; Hoddinott, J.; Alderman, H.; Haddad, L. Gender differentials in farm productivity: Implications for household efficiency and agricultural policy. Food Policy 1995, 20, 407–423. [Google Scholar] [CrossRef]
- Udry, C. Gender, agricultural production, and the theory of the household. J. Political Econ. 1996, 104, 1010–1046. [Google Scholar] [CrossRef]
- Quisumbing, A.R. Male-female differences in agricultural productivity: Methodological issues and empirical evidence. World Dev. 1996, 24, 1579–1595. [Google Scholar] [CrossRef]
- Burton, M.; Rigby, D.; Young, T. Modelling the adoption of organic horticultural technology in the UK using duration analysis. Aust. J. Agric. Resour. Econ. 2003, 47, 29–54. [Google Scholar] [CrossRef]
- Karami, E.; Mansoorabadi, A. Sustainable agricultural attitudes and behaviors: A gender analysis of Iranian farmers. Environ. Dev. Sustain. 2008, 10, 883–898. [Google Scholar] [CrossRef]
- Gillespie, J.; Kim, S.; Paudel, K. Why don’t producers adopt best management practices? An analysis of the beef cattle industry. Agric. Econ. 2007, 36, 89–102. [Google Scholar] [CrossRef]
- Morris, M.L.; Doss, C.R. How does gender affect the adoption of agricultural innovations? The case of improved maize technology in Ghana. In Proceedings of the Annual Meeting of the American Agricultural Economics Association, Nashville, TN, USA, 8–11 August 1999. [Google Scholar]
- Jianakoplos, N.A.; Bernasek, A. Are women more risk averse? Econ. Inq. 1998, 36, 620–630. [Google Scholar] [CrossRef]
- Eckel, C.C.; Grossman, P.J. Men, women and risk aversion: Experimental evidence. Handb. Exp. Econ. Results 2008, 1, 1061–1073. [Google Scholar]
- Villamor, G.B.; Desrianti, F.; Akiefnawati, R.; Amaruzaman, S.; van Noordwijk, M. Gender influences decisions to change land use practices in the tropical forest margins of Jambi, Indonesia. Mitig. Adapt. Strateg. Glob. Chang. 2014, 19, 733–755. [Google Scholar] [CrossRef]
- Burton, R.J. The influence of farmer demographic characteristics on environmental behaviour: A review. J. Environ. Manag. 2014, 135, 19–26. [Google Scholar] [CrossRef] [Green Version]
- Barkley, A.; Sylvius, C.; Stock, W. Agricultural graduate earnings: The impacts of college, career, and gender. Am. J. Agric. Econ. 1999, 81, 785–800. [Google Scholar] [CrossRef]
- Preston, W.; Broder, J.; Almero, M. Temporal analysis of income earned by former agriculture students. Am. J. Agric. Econ. 1990, 72, 13–23. [Google Scholar] [CrossRef]
- Riley, M. Reconsidering conceptualisations of farm conservation activity: The case of conserving hay meadows. J. Rural Stud. 2006, 22, 337–353. [Google Scholar] [CrossRef]
- Kocher, M.G.; Sutter, M. The decision maker matters: Individual versus group behaviour in experimental beauty-contest games. Econ. J. 2005, 115, 200–223. [Google Scholar] [CrossRef]
- Brown, P. Survey of Rural Decision Makers; Landcare Research: Lincoln, New Zealand, 2015. [Google Scholar]
- Brown, P.; Hart, G.; Small, B.; Montes de Oca Munguia, O. Agents for diffusion of agricultural innovations for environmental outcomes. Land Use Policy 2016, 55, 318–326. [Google Scholar] [CrossRef]
- Fernandez, M.A.; Daigneault, A. Erosion mitigation in the Waikato District, New Zealand: Economic implications for agriculture. Agric. Econ. 2016, 48, 341–361. [Google Scholar] [CrossRef]
- Statistics New Zealand. 2012 Agricultural Census. 2012. Available online: http://www.stats.govt.nz/browse_for_stats/industry_sectors/agriculture-horticulture-forestry/2012-agricultural-census-tables.aspx (accessed on 5 November 2018).
- Morgan, F.J.; Brown, P.; Daigneault, A.J. Simulation vs. definition: Differing approaches to setting probabilities for agent behaviour. Land 2015, 4, 914–937. [Google Scholar] [CrossRef]
- Heritage Foundation. 2018 Index of Economic Freedom. 2018. Available online: https://www.heritage.org/index/ranking/ (accessed on 9 January 2019).
- World Economic Forum. The Global Gender Gap Report. 2017. Available online: http://www3.weforum.org/docs/WEF_GGGR_2017.pdf (accessed on 9 January 2019).
- Otago Daily Times. Agricultural training: It’s a women’s world. Otago Daily Times. Available online: https://www.odt.co.nz/regions/south-otago/agriculture-training-its-womens-world (accessed on 8 January 2019).
- New Zealand Herald. Women Flock to Farm Careers. Available online: https://www.nzherald.co.nz/nz/news/article.cfm?c_id=1&objectid=11469422 (accessed on 8 January 2019).
- Brown, P.; Daigneault, A.; Dawson, J. Age, values, farming objectives, past management decisions, and future intentions in New Zealand agriculture. J. Environ. Manag. 2019, 231, 110–120. [Google Scholar] [CrossRef] [PubMed]
- Ministry for the Environment. About New Zealand’s Emissions Reduction Targets. Available online: http://www.mfe.govt.nz/climate-change/what-government-doing/emissions-reduction-targets/about-our-emissions-reduction (accessed on 8 January 2019).
- Te Uru Rākau. One Billion Trees Programme. Available online: https://www.mpi.govt.nz/funding-and-programmes/forestry/planting-one-billion-trees/ (accessed on 8 January 2019).
- Ministry for Primary Industries. Agriculture and Greenhouse Gases. Available online: https://www.mpi.govt.nz/protection-and-response/environment-and-natural-resources/emissions-trading-scheme/agriculture-and-greenhouse-gases/ (accessed on 5 November 2018).
- Department of Conservation. Predator Free 2050. Available online: https://www.doc.govt.nz/nature/pests-and-threats/predator-free-2050/ (accessed on 9 January 2019).
- Organisation for Economic Co-Operation and Development (OECD). OECD Environmental Performance Reviews: New Zealand 2017; OECD Publishing: Paris, France, 2017. [Google Scholar]
| 1 | New Zealand is noted for having a pro-business environment and strong property rights. For example, [46] ranks New Zealand the second highest country in the world (behind Singapore) for legal protection of property rights and enforcement of those laws. There are no restrictions on ownership by gender, and [47] ranks New Zealand as having the ninth smallest gender gap in the world, reflecting high levels of economic participation. Men and women have equal rights of inheritance and successorship in farming. While there are significantly fewer female sole decision makers than male sole decision makers among survey respondents, women are represented in all primary industries and in all regions in New Zealand. |
| 2 | After testing for over-dispersion, Poisson regression is ruled out. |
Figure 1.
Field of education by gender. Notes: Relevant post-secondary education includes specialised training in the following fields: agriculture, animal science, business, dairy science, environmental studies, farming, horticulture, forestry, meat/wool production, veterinary science, viticulture, and other agricultural fields. In households that make decisions jointly, the highest relevant degree is reported.


Table 1.
Summary Statistics—Dependent Variables.
| Variable | Scale | Mean | sd | Min | Max |
|---|---|---|---|---|---|
| Farm is profitable (profitable) | Dummy | 0.49 | 0.50 | 0.00 | 1.00 |
| Waterways are fenced (fenced) | Dummy | 0.84 | 0.37 | 0.00 | 1.00 |
| Nutrient management plan (NMP) | Dummy | 0.39 | 0.49 | 0.00 | 1.00 |
| Soil management plan (SMP) | Dummy | 0.32 | 0.47 | 0.00 | 1.00 |
| Pugging management plan (PMP) | Dummy | 0.78 | 0.41 | 0.00 | 1.00 |
| Plan to intensify in next 2 years (intensify) | Dummy | 0.45 | 0.50 | 0.00 | 1.00 |
| Plan to convert in next 2 years (convert) | Dummy | 0.34 | 0.47 | 0.00 | 1.00 |
| Plan to increase land to existing uses in next 2 years (increase) | Dummy | 0.35 | 0.48 | 0.00 | 1.00 |
| Plan to sell, subdivide, or lease in next 2 years (sell) | Dummy | 0.34 | 0.47 | 0.00 | 1.00 |
| Risk tolerance (risk) | (0–10) | 5.90 | 2.16 | 0.00 | 10.00 |
| Aversion to experimentation (experiment) | (0–10) | 4.48 | 2.20 | 0.00 | 10.00 |
| Farm due to family tradition (tradition) | (0–10) | 3.94 | 2.78 | 0.00 | 10.00 |
| Farm sustainably due to family norms (family) | (0–10) | 6.87 | 2.17 | 0.00 | 10.00 |
| Farm sustainably due to community norms (community) | (0–10) | 6.74 | 1.98 | 0.00 | 10.00 |
| Farm sustainably due to public norms (public) | (0–10) | 7.63 | 1.83 | 0.00 | 10.00 |
| Adoption of novel technologies (novel tech) | Count | 0.61 | 0.85 | 0.00 | 5.00 |
Table 2.
Summary Statistics by relevance of education.
| Variable | Secondary Education or Less | Non-Relevant Post-Secondary Education | Relevant Post-Secondary Education | Difference |
|---|---|---|---|---|
| Farm is profitable (profitable) | 0.48 | 0.41 | 0.51 | B*** |
| Waterways are fenced (fenced) | 0.84 | 0.84 | 0.86 | |
| Nutrient management plan (NMP) | 0.40 | 0.33 | 0.41 | B*** |
| Soil management plan (SMP) | 0.29 | 0.33 | 0.37 | C** |
| Pugging management plan (PMP) | 0.76 | 0.76 | 0.81 | |
| Plan to intensify in next 2 years (intensify) | 0.41 | 0.40 | 0.52 | B***, C*** |
| Plan to convert in next 2 years (convert) | 0.27 | 0.32 | 0.40 | B**, C*** |
| Plan to increase land to existing uses in next 2 years (increase) | 0.28 | 0.32 | 0.42 | B***, C*** |
| Plan to sell, subdivide, or lease in next 2 years (sell) | 0.37 | 0.32 | 0.32 | |
| Risk tolerance (risk) | 5.61 | 5.63 | 6.30 | B***, C*** |
| Aversion to experimentation (experiment) | 4.75 | 4.74 | 4.12 | |
| Farm due to family tradition (tradition) | 4.46 | 3.56 | 3.68 | A***, C*** |
| Farm sustainably due to family norms (family) | 6.57 | 7.04 | 6.99 | A***, C*** |
| Farm sustainably due to community norms (community) | 6.77 | 6.55 | 6.81 | |
| Farm sustainably due to public norms (public) | 7.55 | 7.48 | 7.79 | B**, C* |
| Adoption of novel technologies (novel tech) | 0.54 | 0.63 | 0.65 | A***, C*** |
Notes: Differences are tested using a Bonferroni multiple comparison test. “A” indicates a statistically significant difference between secondary education or less and non-relevant post-secondary education; “B” indicates a statistically significant difference between non-relevant post-secondary education and relevant post-secondary education; and “C” indicates a statistically significant difference between secondary education or less and relevant post-secondary education. *** p < 0.01, ** p < 0.05, * p < 0.1.
Table 3.
Summary Statistics by gender of the decision maker.
| Variable | Male Sole Decision Maker | Female Sole Decision Maker | Decisions Made Jointly | Difference |
|---|---|---|---|---|
| Farm is profitable (profitable) | 0.51 | 0.35 | 0.48 | A***, B** |
| Waterways are fenced (fenced) | 0.83 | 0.81 | 0.86 | |
| Nutrient management plan (NMP) | 0.37 | 0.35 | 0.42 | |
| Soil management plan (SMP) | 0.35 | 0.29 | 0.31 | |
| Pugging management plan (PMP) | 0.80 | 0.76 | 0.77 | |
| Plan to intensify in next 2 years (intensify) | 0.49 | 0.40 | 0.43 | C** |
| Plan to convert in next 2 years (convert) | 0.37 | 0.30 | 0.31 | C** |
| Plan to increase land to existing uses in next 2 years (increase) | 0.38 | 0.23 | 0.34 | A***, B* |
| Plan to sell, subdivide, or lease in next 2 years (sell) | 0.35 | 0.29 | 0.34 | |
| Risk tolerance (risk) | 6.16 | 5.21 | 5.72 | A***, B*, C*** |
| Aversion to experimentation (experiment) | 4.30 | 4.90 | 4.59 | A**, C** |
| Farm due to family tradition (tradition) | 4.00 | 3.59 | 3.89 | |
| Farm sustainably due to family norms (family) | 6.84 | 6.75 | 6.93 | |
| Farm sustainably due to community norms (community) | 6.74 | 6.18 | 6.89 | A**, B*** |
| Farm sustainably due to public norms (public) | 7.55 | 7.61 | 7.76 | C* |
| Adoption of novel technologies (novel tech) | 0.63 | 0.42 | 0.60 | A***, B** |
Notes: Differences are tested using a Bonferroni multiple comparison test. “A” indicates a statistically significant difference between male sole decision makers and female sole decision makers; “B” indicates a statistically significant difference between female sole decision makers and joint decision makers; and “C” indicates a statistically significant difference between male sole decision makers and joint decision makers. *** p < 0.01, ** p < 0.05, * p < 0.1.
Table 4.
Probit, Tobit, and Negative Binomial Regressions.
| (panel A) | |||||||||
| Profitability | Farm Management | Future Intentions | |||||||
| Profit | Fenced | NMP | SMP | PMP | Intensify | Convert | Increase | Sell | |
| Non-Relevant | −0.094 *** | 0.003 | −0.049 * | 0.054 | 0.037 | −0.013 | 0.038 | 0.030 | −0.037 |
| (0.035) | (0.029) | (0.030) | (0.034) | (0.033) | (0.034) | (0.033) | (0.032) | (0.033) | |
| Relevant | 0.027 | 0.037* | −0.011 | 0.085 *** | 0.067 ** | 0.071 ** | 0.070 *** | 0.083 *** | −0.030 |
| (0.028) | (0.022) | (0.024) | (0.027) | (0.026) | (0.028) | (0.026) | (0.026) | (0.026) | |
| Female | −0.105 ** | −0.032 | 0.005 | −0.019 | −0.020 | −0.008 | −0.010 | −0.064 | −0.106 ** |
| (0.052) | (0.044) | (0.045) | (0.049) | (0.049) | (0.052) | (0.048) | (0.046) | (0.046) | |
| Male | 0.025 | −0.015 | 0.010 | 0.015 | 0.031 | 0.063 ** | 0.062 *** | 0.038 | −0.002 |
| (0.026) | (0.020) | (0.022) | (0.025) | (0.024) | (0.025) | (0.024) | (0.023) | (0.024) | |
| Obs | 1612 | 1172 | 1607 | 1468 | 1235 | 1591 | 1591 | 1591 | 1591 |
| (panel B) | |||||||||
| Risk and Norms | Adoption of | ||||||||
| Risk | Experiment | Tradition | Family | Community | Public | Novel Tech | |||
| Non-Relevant | 0.109 | −0.131 | −1.306 *** | 0.484 ** | 0.041 | 0.161 | 0.110 * | ||
| (0.180) | (0.174) | (0.255) | (0.190) | (0.159) | (0.170) | (0.056) | |||
| Relevant | 0.402 *** | −0.499 *** | −1.026 *** | 0.334 ** | 0.007 | 0.237 * | 0.314 *** | ||
| (0.139) | (0.137) | (0.199) | (0.152) | (0.130) | (0.132) | (0.044) | |||
| Female | −0.296 | 0.266 | −0.372 | −0.079 | −0.779 *** | −0.065 | −0.206 *** | ||
| (0.249) | (0.229) | (0.406) | (0.305) | (0.241) | (0.230) | (0.079) | |||
| Male | 0.454 *** | −0.284 ** | 0.045 | −0.093 | −0.049 | −0.124 | 0.078 * | ||
| (0.129) | (0.128) | (0.180) | (0.141) | (0.118) | (0.123) | (0.043) | |||
| Obs | 1386 | 1386 | 1386 | 1386 | 1386 | 1386 | 1612 | ||
Notes: All regressions include age, industry, and region fixed effects. Marginal effects are reported for profit, fenced, NMP, SMP, PMP, intensify, convert, increase, and sell. Point estimates are reported for risk, experiment, tradition, family, community, public, and novel tech. Robust standard errors in parentheses. *** p < 0.01, ** p < 0.05, * p < 0.1.
Table 5.
Probit, Tobit, and Negative Binomial Regressions with Interactions between Education and Gender.
Table 5.
Probit, Tobit, and Negative Binomial Regressions with Interactions between Education and Gender.
| (panel A) | ||||||||||||
| Profitability | Farm Management Practices | Future Intentions | ||||||||||
| Profit | Fenced | NMP | SMP | PMP | Intensify | |||||||
| Women | Men | Women | Men | Women | Men | Women | Men | Women | Men | Women | Men | |
| Secondary | −0.084 | 0.062 | −0.091 | 0.006 | −0.072 | 0.020 | −0.019 | 0.060 | 0.009 | 0.072 * | −0.128 | −0.032 |
| (0.093) | (0.045) | (0.094) | (0.031) | (0.095) | (0.047) | (0.081) | (0.041) | (0.099) | (0.043) | (0.094) | (0.045) | |
| Non-relevant | −0.125 | −0.072 | 0.070 ** | −0.031 | 0.034 | −0.036 | −0.041 | −0.023 | −0.074 | −0.024 | −0.041 | 0.082 |
| (0.095) | (0.060) | (0.032) | (0.048) | (0.104) | (0.065) | (0.099) | (0.062) | (0.099) | (0.057) | (0.098) | (0.061) | |
| Relevant | −0.120 | 0.038 | −0.064 | −0.021 | 0.047 | 0.027 | −0.006 | −0.006 | −0.007 | 0.025 | 0.109 | 0.135 *** |
| (0.087) | (0.039) | (0.067) | (0.021) | (0.101) | (0.041) | (0.083) | (0.039) | (0.072) | (0.033) | (0.090) | (0.039) | |
| Obs | 1612 | 1612 | 1172 | 1172 | 1607 | 1607 | 1468 | 1468 | 1235 | 1235 | 1591 | 1591 |
| (panel B) | ||||||||||||
| Future Intentions | Risk and Norms | |||||||||||
| Convert | Increase | Sell | Risk | Experiment | Tradition | |||||||
| Women | Men | Women | Men | Women | Men | Women | Men | Women | Men | Women | Men | |
| Secondary | −0.072 | 0.025 | −0.039 | 0.066 | −0.221 *** | −0.041 | −0.607 | 0.496 ** | 0.159 | −0.251 | −1.020 * | 0.050 |
| (0.077) | (0.041) | (0.081) | (0.042) | (0.074) | (0.043) | (0.440) | (0.217) | (0.361) | (0.202) | (0.558) | (0.268) | |
| Non-relevant | −0.097 | 0.094 | −0.135 | −0.011 | −0.021 | 0.110 * | −0.399 | −0.104 | 0.287 | −0.049 | −0.029 | −0.792 ** |
| (0.085) | (0.060) | (0.091) | (0.059) | (0.091) | (0.058) | (0.464) | (0.310) | (0.435) | (0.299) | (0.667) | (0.350) | |
| Relevant | 0.108 | 0.086 ** | −0.047 | 0.045 | −0.070 | −0.020 | 0.018 | 0.587 *** | 0.358 | −0.382 ** | −0.018 | 0.335 |
| (0.088) | (0.037) | (0.083) | (0.039) | (0.080) | (0.037) | (0.362) | (0.170) | (0.365) | (0.179) | (0.562) | (0.225) | |
| Obs | 1591 | 1591 | 1591 | 1591 | 1591 | 1591 | 1306 | 1306 | 1386 | 1386 | 1334 | 1334 |
| (panel C) | ||||||||||||
| Risk and Norms | Adoption of | |||||||||||
| Family | Community | Public | Novel Tech | |||||||||
| Women | Men | Women | Men | Women | Men | Women | Men | |||||
| Secondary | −0.084 | −0.022 | −0.037 | −0.055 | 0.109 | −0.139 | −0.225 *** | 0.112 ** | ||||
| (0.514) | (0.203) | (0.421) | (0.196) | (0.378) | (0.183) | (0.076) | (0.057) | |||||
| Non-relevant | 0.217 | 0.115 | −0.180 | 0.136 | −0.113 | 0.031 | −0.315 *** | 0.036 | ||||
| (0.422) | (0.286) | (0.369) | (0.251) | (0.322) | (0.246) | (0.121) | (0.097) | |||||
| Relevant | −0.245 | −0.205 | −1.764 *** | −0.097 | −0.141 | −0.126 | −0.081 | 0.061 | ||||
| (0.446) | (0.186) | (0.341) | (0.154) | (0.303) | (0.143) | (0.147) | (0.064) | |||||
| Obs | 1386 | 1386 | 1386 | 1386 | 1386 | 1386 | 1612 | 1612 | ||||
Note: All regressions include age, industry fixed effects, and region fixed effects. Average marginal effects are reported. Robust standard errors in parentheses. *** p < 0.01, ** p < 0.05, * p < 0.1.
© 2019 by the author. Licensee MDPI, Basel, Switzerland. This article is an open access article distributed under the terms and conditions of the Creative Commons Attribution (CC BY) license (http://creativecommons.org/licenses/by/4.0/).
Share and Cite
MDPI and ACS Style
Brown, P. Gender, Educational Attainment, and Farm Outcomes in New Zealand. Land 2019, 8, 18. https://doi.org/10.3390/land8010018
AMA Style
Brown P. Gender, Educational Attainment, and Farm Outcomes in New Zealand. Land. 2019; 8(1):18. https://doi.org/10.3390/land8010018
Chicago/Turabian StyleBrown, Philip. 2019. "Gender, Educational Attainment, and Farm Outcomes in New Zealand" Land 8, no. 1: 18. https://doi.org/10.3390/land8010018
Note that from the first issue of 2016, this journal uses article numbers instead of page numbers. See further details here.