Prioritizing Suitable Locations for Green Stormwater Infrastructure Based on Social Factors in Philadelphia


1
Department of Geography, Planning, and Sustainability, School of Earth and Environment, Rowan University, Glassboro, NJ 08028, USA
2
Department of Planning and Community Development, Tyler School of Art, Temple University, Philadelphia, PA 19122, USA
*
Author to whom correspondence should be addressed.
Land 2018, 7(4), 145; https://doi.org/10.3390/land7040145
Submission received: 30 October 2018
/
Revised: 21 November 2018
/
Accepted: 22 November 2018
/
Published: 26 November 2018
(This article belongs to the Special Issue Landscape Urbanism and Green Infrastructure)
Abstract
:Municipalities across the United States are prioritizing green stormwater infrastructure (GSI) projects due to their potential to concurrently optimize the social, economic, and environmental benefits of the “triple bottom line”. While placement of these features is often based on biophysical variables regarding the natural and built environments, highly urbanized areas often exhibit either limited data or minimal variability in these characteristics. Using a case study of Philadelphia and building on previous work to prioritize GSI features in disadvantaged communities, this study addresses the dual concerns of the inequitable benefits of distribution and suitable site placement of GSI using a model to evaluate and integrate social variables to support decision making regarding GSI implementation. Results of this study indicate locations both suitable and optimal for the implementation of four types of GSI features: tree trenches, pervious pavement, rain gardens, and green roofs. Considerations of block-level site placement assets and liabilities are discussed, with recommendations for use of this analysis for future GSI programs.

1. Introduction
The ability for vegetation to capture rainfall, mitigating overland sheet flows by promoting infiltration, reducing stormwater volume through transpiration, and filtering pollution through biological processes, has been well documented [1,2,3]. Simultaneously, managing rainfall poses unique challenges for many older urban areas in North America, which commonly utilize combined sewer systems (CSS) that manage both sewage and stormwater [4,5]. Intense rainfall events, either high volume or rapidly occurring, can exceed the capacity of these systems, leading to the diversion of untreated wastewater into rivers and other water bodies. Unsurprisingly, a growing number of cities across the United States have sought to leverage vegetation as a cost-effective means of mitigating the volume of stormwater and are increasingly allocating stormwater management funding to “green” as opposed to “grey” infrastructure projects [6,7].
Green stormwater infrastructure (GSI) refers to the suite of interventions, comprised of both natural and artificial materials, that utilize vegetation to slow or store surface water runoff, mitigating the volume rapidly reaching the CSS. The implementation of GSI depends largely on the intersection of properties associated with the physical and built environment as well as the priorities of municipal actors and community members [7,8]. This study specifically seeks to further develop the latter means of siting GSI through the development of a model for the balancing of social factors with the constraints of the built environment in prioritizing the implementation of GSI within Philadelphia, PA, USA. Specifically, answers to three major research questions were sought:
- What areas are suitable for GSI implementation, based on the physical constraints of the landscape and the goal of promoting equitable GSI distribution?
- How can social factors be used to prioritize and rank GSI site selection?
- How do virtual site observations corroborate modeled site suitability for GSI features?
In addressing the research questions outlined above, this study employs site suitability modeling based on an analytical hierarchical procedure of expert opinion on the influence of social factors to site GSI features. The study is built upon previous research done by Mandarano and Meenar [9] that identified Philadelphia census tracts for future GSI projects, prioritizing tracts with mid- to high-level of socio-economically disadvantaged residents but with high-level of community capacity. Results of this study identify locations across those high-priority census tracts for GSI features based on a variety of social factors. This study addresses gaps in existing procedures by utilizing social factors in urbanized regions that may have limited data or variability in characteristics of the natural and built environment commonly used to site green GSI.
2. Siting Green Stormwater Infrastructure
Municipalities across the United States are prioritizing GSI projects due to their “triple bottom line” benefits (e.g., social, economic, and environmental benefits). Fully realizing the social, economic, and environmental benefits of GSI necessitates a holistic methodology for siting GSI. The vast majority of research surrounding the implementation of GSI has largely ignored the social and economic benefits of GSI, instead choosing to focus principally on the environmental benefits. While this perspective for evaluating GSI improvements may effectively maximize pollutant reduction and runoff retention, it may not truly maximize the value of this infrastructure [10,11,12,13,14].
Adoption of an ecosystem services analysis of water supply investments, which seeks to comprehensively evaluate the environmental impact of infrastructure spending, reveals a grey area in the valuation of benefits, even before considering more abstract social benefits [15,16,17,18]. Attempts to measure and incorporate the social value of these ecosystem services underscore the difficulty in ascribing a singular value to any particular infrastructure, and challenges persist with respect to community education and adoption of any type of intervention [13,15,19]. In a pluralistic society such as the United States, engaging with and leveraging local institutions such as community groups and schools may represent a means of engaging with stakeholders over smaller-scale GSI projects [20].
Four major types of GSI interventions, varying in scale, structure, and operation are considered by this study: tree trenches, rain gardens, pervious pavements, and green roofs [7].
Tree Trenches are GSI elements comprised of a localized gap in the curbside impervious surface, planted with vegetation to temporarily store stormwater runoff from the street and sidewalk, enabling infiltration and evapotranspiration to decrease the volume entering the combined sewer system [6,21]. During major storm events, excess stormwater is directed to an existing stormwater inlet. Tree trench siting is contingent on the location of underground utilities and the required right-of-way, in addition to neighborhood physical and social factors discussed below. A tree trench may be as small as a single square meter along a sidewalk or an area of several dozen square meters along a building or pedestrian walkway.
Rain Gardens are extensive vegetated depressions that can collect water from surrounding impervious surfaces, thereby reducing velocity, promoting infiltration and evapotranspiration, and filtering pollutants from stormwater [7,22]. Connections to existing stormwater inlets manage excess volume during extreme precipitation events. Rain gardens necessitate an area of open space beyond the 100-year floodplain. Additionally, maintenance requirements of rain gardens make it highly desirable to site these features in proximity to institutions, such as schools or community centers, that may share in their upkeep. Spatial requirements for rain gardens vary from 10s to 1000s of square meters.
Pervious (or Permeable) Pavement interventions are a suite of design features that slow runoff water by promoting infiltration at the location that precipitation falls [7,23]. Though not required, pervious pavement is often accompanied by underground storage in urbanized areas, with connections to stormwater inlets for events when stormwater volumes exceed capacity. Additionally, the storage of water in these joint features must be cycled within days to avoid facilitating mosquitoes and other disease-harboring insects. The most suitable locations for the installation of pervious pavement are existing surface parking lots, outside the 100-year floodplain.
Green Roof features are additions to flat building roofs that reduce the velocity and volume of stormwater runoff by creating temporary storage and promoting evapotranspiration [7,24,25]. While newer green roof technology has reduced the structural burden of this type of infrastructure, thus expanding opportunities for retrofitting older structures, green roofs must feature downspouts connecting to the municipal wastewater system. Due to the financial and labor costs of installation and maintenance of these features, institutional capacity is also an important consideration.
Any GSI elements involving infiltration, including tree trenches, rain gardens, and pervious pavements, are affected by the underlying soil hydrology; however, in the densely built environment of many older cities, the longstanding disturbance of natural soil deposition limit the utility of this variable, and scant or unreliable data make this factor difficult to incorporate into models [26]. Similarly, topographic data can be used to site features, as tree trenches may benefit from a relatively flat topography to avoid inundation, while rain gardens and pervious pavements may be most effective when sited near slopes that accumulate a greater volume of stormwater [27]. In practice, the limited variation in slope of some cities, including Philadelphia, mean that this variable (i.e., slope) is similarly difficult to include in site selection models.
Concurrently, this built environment does exert a localized influence on the siting of GSI features. The presence of nearby impervious surfaces may support the effectiveness of GSI features promoting infiltration. In urbanized centers, impervious surface coverage may vary by block or parcel any change relatively rapidly necessitating the consideration of site-specific conditions [8,28,29,30,31]. In most cases, the engineering practices underlying GSI features necessitate proximity to a stormwater inlet to manage excess overflow and drainage [29]. Further, locating GSI features within an area served by a CSS more effectively furthers the ultimate goal of reducing stormwater infiltration and load on the system in order to reduce overflow events [5]. Finally, it is advisable to locate new GIS features beyond areas of expected inundations delineated by the US Federal Emergency Management Agency (FEMA) 100-year-flood map [32].
Beyond the physical requirements of any individual GSI intervention, many factors in the natural, built, and social environment must be considered in the selection of a suitable site for implementation [33,34,35]. Social factors that may be used to promote successful GSI interventions primarily involve metrics of proximity to institutions or community members who may directly or indirectly support them. Physical proximity to a partnered institution, such as a school, university, or recreation center may ease the financial and labor burdens of maintenance. Additionally, community organizations, such as Neighborhood Advisory Committees (NAC), can engage and educate residents, while also mustering volunteers for maintenance and promotion of these shared features. Further, these organizations may also provide long-term support through membership and leadership cycles. Characteristics of the specific target parcel and block ultimately carry critical importance that can be incorporated into a decision framework, both in the model and in the final site evaluation and validation [30]. Land tenure, including commercial or institutional ownership, areal requirements of the parcel, and local site configuration can enhance or diminish a site’s suitability for GSI placement [29,36].
Though research has identified significant challenges associated with the incorporation of socioeconomic criteria in the siting of GSI, the need to consider these issues has been clearly demonstrated, albeit under the broader framework of sustainability [37]. At the same time, the social value of GSI has been empirically demonstrated; statistically significant decreases in burglaries and narcotics production and sale were found at multiple scales surrounding GSI in Philadelphia [8]. While crime statistics may be correctly identified as an insufficient proxy for capturing a broader range of socioeconomic factors, this research highlights the difficulty in quantifying these variables.
By constructing an analytical hierarchy framework for the prioritization of site-specific GSI [13], a model for maximizing the social and economic benefits of investments in GSI is proposed in this study. In the built environment, with limited variability or reliability of physical characteristics, social factors may exert a stronger influence on the successful implementation of GSI interventions, with regard to the impact of their placement to promote equitable access and impacts, especially among disadvantaged communities [38,39,40]. Previous work by Mandarano and Meenar [9] highlighted the inequitable distribution of GSI features across Philadelphia, due to their association especially with private, but also public, investment. That study integrated environmental justice and additional community context variables to identify high priority census tracts for new public-sector GSI implementations, based on community capacity.
3. Materials and Methods
This project was conducted in Philadelphia—the sixth most populous city of the United States—with an estimated population of 1.6 million residents [41] and a program to reduce the impervious surface due to the city’s use of Combined Sewer Overflow (CSO) system [6,7,9]. The city is bordered to the east and south by the Delaware River and Bay and it is bisected by the Schuylkill River, with minimal topographical variability. Most of the city is covered by the CSS, and the neighborhoods that abut the rivers are within the FEMA 100-year flood zone. In Philadelphia, the Green City, Clean Waters program seeks to invest $2.4 billion over 25 years to capture 85% of the stormwater entering the sewer system [6,7]. Over the next 45 years, this program is expected to increase property values by $390 million by improving community quality of life and is estimated to prevent 140 fatalities by mitigating the impact of the urban heat island effect. Additionally, the program will employ 250 people, and improve air quality by absorbing an estimated 1.5 billion pounds of carbon dioxide annually [6,7]. This “triple bottom line” accounting of benefits was both essential to the program’s adoption and unique amongst US municipalities [42].
Data for this analysis were obtained through several sources compiled via the OpenDataPhilly web portal [43]. High priority Census Tract data developed by Mandarano and Meenar [9] were thresholded to constrain the potential GSI implementation sites. Impervious surface and Combined Sewer Service Area data were prepared by the Philadelphia Water Department. Current tree plantings were obtained through the PhillyTreeMap, an implementation of OpenTreeMap built by Azavea with funding from the United States Department of Agriculture. The 100-year floodplain limits were prepared by the Federal Emergency Management Agency. Land cover data were produced by the City of Philadelphia with University of Vermont Spatial Analysis Laboratory. Building Footprint data were derived from Philadelphia License and Inspections database.
Prioritization and evaluation of suitable GSI implementation sites was conducted in four stages:
- 1)
- prior identification of high priority zones to achieve more equitable distribution based on community context and capacity, developed as part of previous research;
- 2)
- restriction of potential implementation sites based on constraints of the built and physical environment;
- 3)
- prioritization of potential implementation sites based on proximity to social criteria; and
- 4)
- virtual and in situ site evaluation for site feasibility and implementation considerations.
3.1. Prior Identification of High Priority Zones within Philadelphia
Data on high priority zones for future GSI locations in Philadelphia were collected from previous work by Mandarano and Meenar [9], who developed a strategy for public investment in GSI projects to achieve a more equitable distribution across the city. By following several methodological steps, they identified and prioritized US Census Tracts from the 2012 American Community Survey that included socio-economically disadvantaged populations but experienced high level of community capacity. First, using GIS-based raster overlay analysis, they identified and ranked disadvantaged census tracts by using community context variables that captured traditional environmental justice characteristics as well as other factors of disenfranchised communities, including demographic identity and rates of poverty, violent crime, vacant properties, single parent households, as well as a metric of income inequality. Next, they identified and ranked census tracts based on their level of community capacity. The community capacity variables incorporated measures of community capitals framework including educational attainment and median income of residents, presence of community organizations and number of residents who had participated in a civic engagement program, and the presence of public property and green space. Outputs from both analyses were overlaid to identify priority census tracts for equitable GSI distribution. Finally, the resulting prioritization scheme was ordinally ranked into five categories using a natural breaks classification method. In this study, the top two categories—indicating high levels of capacity and medium to high-levels of context/disadvantage—were used as a threshold to constrain all types of future GSI implementation. This process delimited priority zones for GSI implementation, which served to constrain this new study to further prioritize individual site selection for each type of GSI feature.
3.2. Restriction of Potential Implementation Sites
Locations within high priority GSI implementation zones were then further limited to CSS areas within the City of Philadelphia.
Tree Trenches: Potential GSI implementation zones for tree trenches were seeded with existing planting sites maintained by OpenTreeMap, under the rationale that any block that had any existing tree well or trench would satisfy requirements for sidewalk width, right-of-way, and be free of conflicting underground infrastructure, like water and electrical services.
Pervious Pavement: Potential GSI implementation zones for pervious pavement were seeded with existing surface parking lots, isolated from the map of impervious surfaces maintained by the Philadelphia Water Department, under the rationale that these features would be clear and accessible, with ongoing access following implementation. Additionally, sites were restricted to those beyond the limits of the FEMA 100-year floodplains along the Delaware and Schuylkill Rivers.
Rain Gardens: Potential GSI implementation zones for rain gardens were seeded with areas that were grass or bare earth, from the Urban Tree Canopy Assessment produced for Philadelphia by the University of Vermont Spatial Analysis Laboratory. These areas were further restricted to institutional land uses, under the rationale that these locations would have improved accessibility and maintenance. Based on anticipated size requirements of this type of implementation, areas smaller than 10 m2 were removed, and zones were further restricted by being beyond the FEMA 100-year floodplains.
Green Roofs: Potential GSI implementation zones for green roofs were seeded with the City of Philadelphia Department of Licenses and Inspections building footprints database, which were further refined by those of civic and institutional ownership, isolated from the Philadelphia City Planning Commission, for more facile land use rights and access potential.
3.3. Prioritization of Features and Distances for Site Selection
The suitable sites identified above were prioritized based on their ranked proximity to a variety of features defined by the built and social environments using a site suitability analysis, as described below (Site suitability modeling is an analytical process to evaluate and integrate variables expressed in spatial data, in order to support decision making [44]. Variables regarding local characteristics or the proximity to a feature may be evaluated in comparison to a threshold value or a range of suitable values. Preparation of these variables is generally in two forms: constraints, which are binary criteria that impose strict inclusion or exclusion criteria, and factors, which can be evaluated to enable trade-off with other variables. Generally speaking, site suitability models incorporate constraints to identify the set of locations that may be considered for selection, and factors are used to prioritize selection within the set of all possible locations). The ranking of the influence of each factor on the ensuing selection was established through an analytical hierarchical weighting procedure based on the expert opinions of 16 professional planners, scholars, and municipal officials.
Factors chosen to act as indicators, signaling that a location may be a suitable location for GSI interventions were used through proximity metrics to the institutions or community members who may directly or indirectly support them, due to the potential to share in the financial and labor maintenance costs. Partner institutions, like schools, universities, or recreation centers, or community organizations, like NACs, may support the financial and labor costs of maintenance, educate and engage neighbors, and gather participants for events and education, especially through membership and leadership cycles. Linear distances to the nearest features were calculated in ArcMap 10.6 [45] using the NEAR function. Features for prioritized proximity included:
- Stormwater Inlets, necessary to drain excess water from all GSI features.
- Transit Stops, which act as community gateways. GSI and its accompanying vegetation have the potential to add vibrancy to the area and promote more than just environmentally sound stormwater management practices.
- Neighborhood Advisory Committees (NACs) are part of a Division of Housing and Community Development program whereby NACs lead and engage their neighborhoods in initiatives that align with the City’s objectives including promoting sustainability, cultivating civic engagement, and ensuring residents have access to services. Nonprofits in eligible neighborhoods (low- and moderate-income) can partner with the City through this program; currently, 19 NACs operate throughout Philadelphia, and indicate a localized measure of neighborhood capacity.
- Schools, as GSI features offer potential educational value, and students exposed to GSI may learn about how it operates and the environmental implications of improperly managed stormwater runoff.
- Universities, as large institutions with financial resources and social obligations to pay for GSI on their campus or help maintain nearby GSI.
- Recreation Centers, which host civic events and programming, offer an opportunity to leverage the educational value of GSI and may support maintenance using existing staff and volunteers.
Opinions of participating experts was solicited to determine the functional distances from the features above to the GSI feature implementation site. Each feature has an optimal minimum distance and functionally limiting maximum distance. The range of each of these values was scaled linearly from 1 (best) to 0 (worst), with saturation points at each end of the scale beyond the minimum and maximum distances.
Based on the opinions of participating experts, the relative importance of the distances from each of the six criteria above were ranked from 1 (minimally influential) to 5 (critically influential), with 3 as a moderate or average influence. These were then scaled to a percentage of influence based on the sum of all factors per GSI feature.
The priority weights determined through this process were used in a linear combination to weigh the influence of all scaled distance factors for GSI site selection.
3.4. Virtual Site Observation and Validation
Sites for GSI implementation identified by the geospatial model outlined above were then inspected for potential feature installation using a checklist-based field assessment, which validated the efficacy of the model and identified relevant site-specific characteristics.
Visits were conducted virtually using the Street View service of Google Maps, which provides a ground-level 360° panoramic interface and orthogonal imagery from above to view roof and site configurations [46]. Locations extracted from the analysis in ArcMap were converted to a KML location document and integrated with the Google Maps platform for evaluation. At each location, factors commonly considered in the installation of GSI were evaluated by the virtual site assessment, including:
- slope of both the site and surrounding area (slopes in excess of 10 percent are generally excluded);
- impervious area of the parcels and roadways surrounding the site, to estimate the volume of potential drainage;
- spatial requirements for the potential GSI feature;
- proximity to existing GSI, in order to promote equitable distribution; and
- aesthetic considerations, including site visibility and potential obstructions.
Thirty-seven virtual site observations were conducted across the four types of proposed GSI interventions. For validation of site selection, all available regions per GSI type were merged (dissolved) into a single spatial feature, which was used to constrain the placement of the random points for site visits. A minimum distance of 161 m (528 feet, 1/10 mile, or approximately 1 major city block in Philadelphia) between points was established to avoid issues of proximity and spatial autocorrelation. This process ensured 10 independent validation points for tree trenches, pervious pavement, and green roofs. For rain gardens, the minimum distance was halved, but only 7 spatially independent points were possible due to the clustering of high priority locations. Thus, a total of 37 points comprised the extent of virtual site observation and validation.
4. Results
4.1. Prior Identification of High Priority Zones within the City of Philadelphia
4.2. Restriction of Potential Implementation Sites
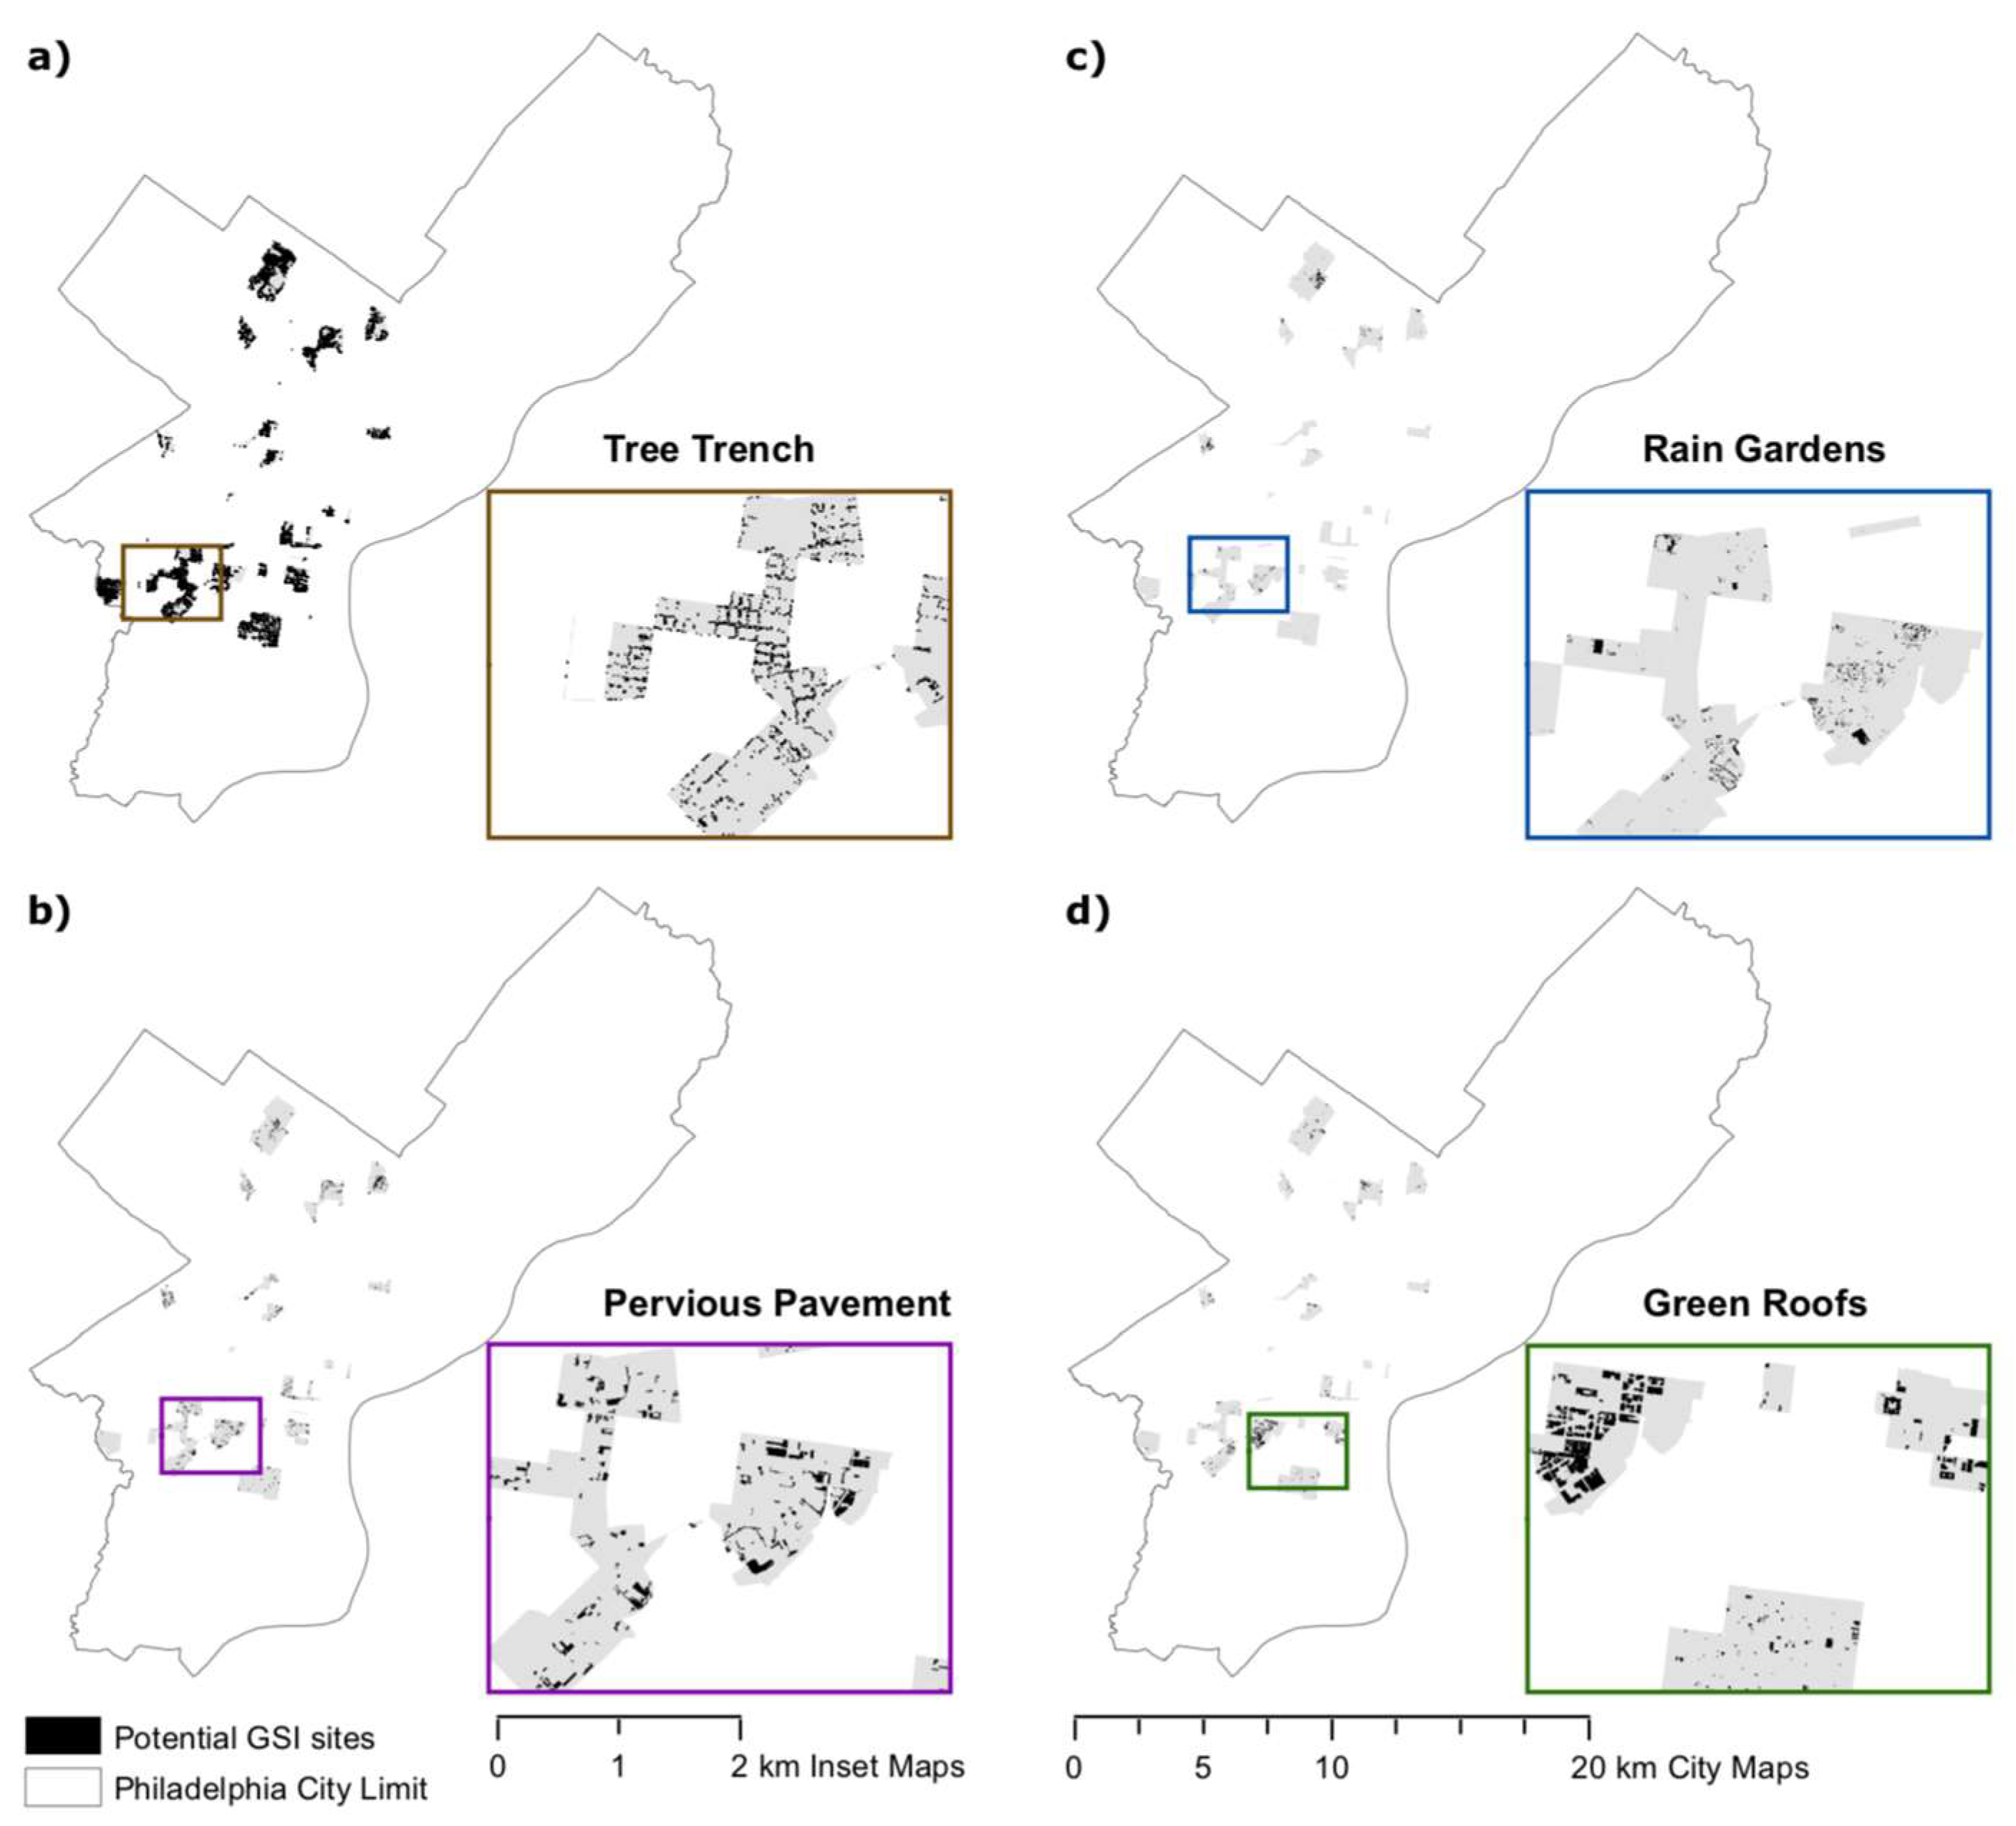
Based on the constraints applied to the implementation of GSI features, a suite of suitable locations were identified. A set of 7850 locations of existing street trees were identified, representing locations for which there was adequate sidewalk width without interference of underground utility infrastructure. Individual street tree wells may be linked for tree trenches or that areas along the same block may be selected for tree trench installation. Potential pervious pavement implementation sites included 527 parcels identified as suitable surface parking lots, totaling 0.554 square kilometers. Areas of grass or bare earth suitable for the installation of rain gardens yielded 1270 potential implementation sites, totaling 0.225 square kilometers. Building footprints with civic and institutional ownership included 833 potential implementation sites for green roofs, totaling 0.324 square kilometers. These areas are the black features for each type in Figure 1.
4.3. Prioritization of Features and Distances for Site Selection
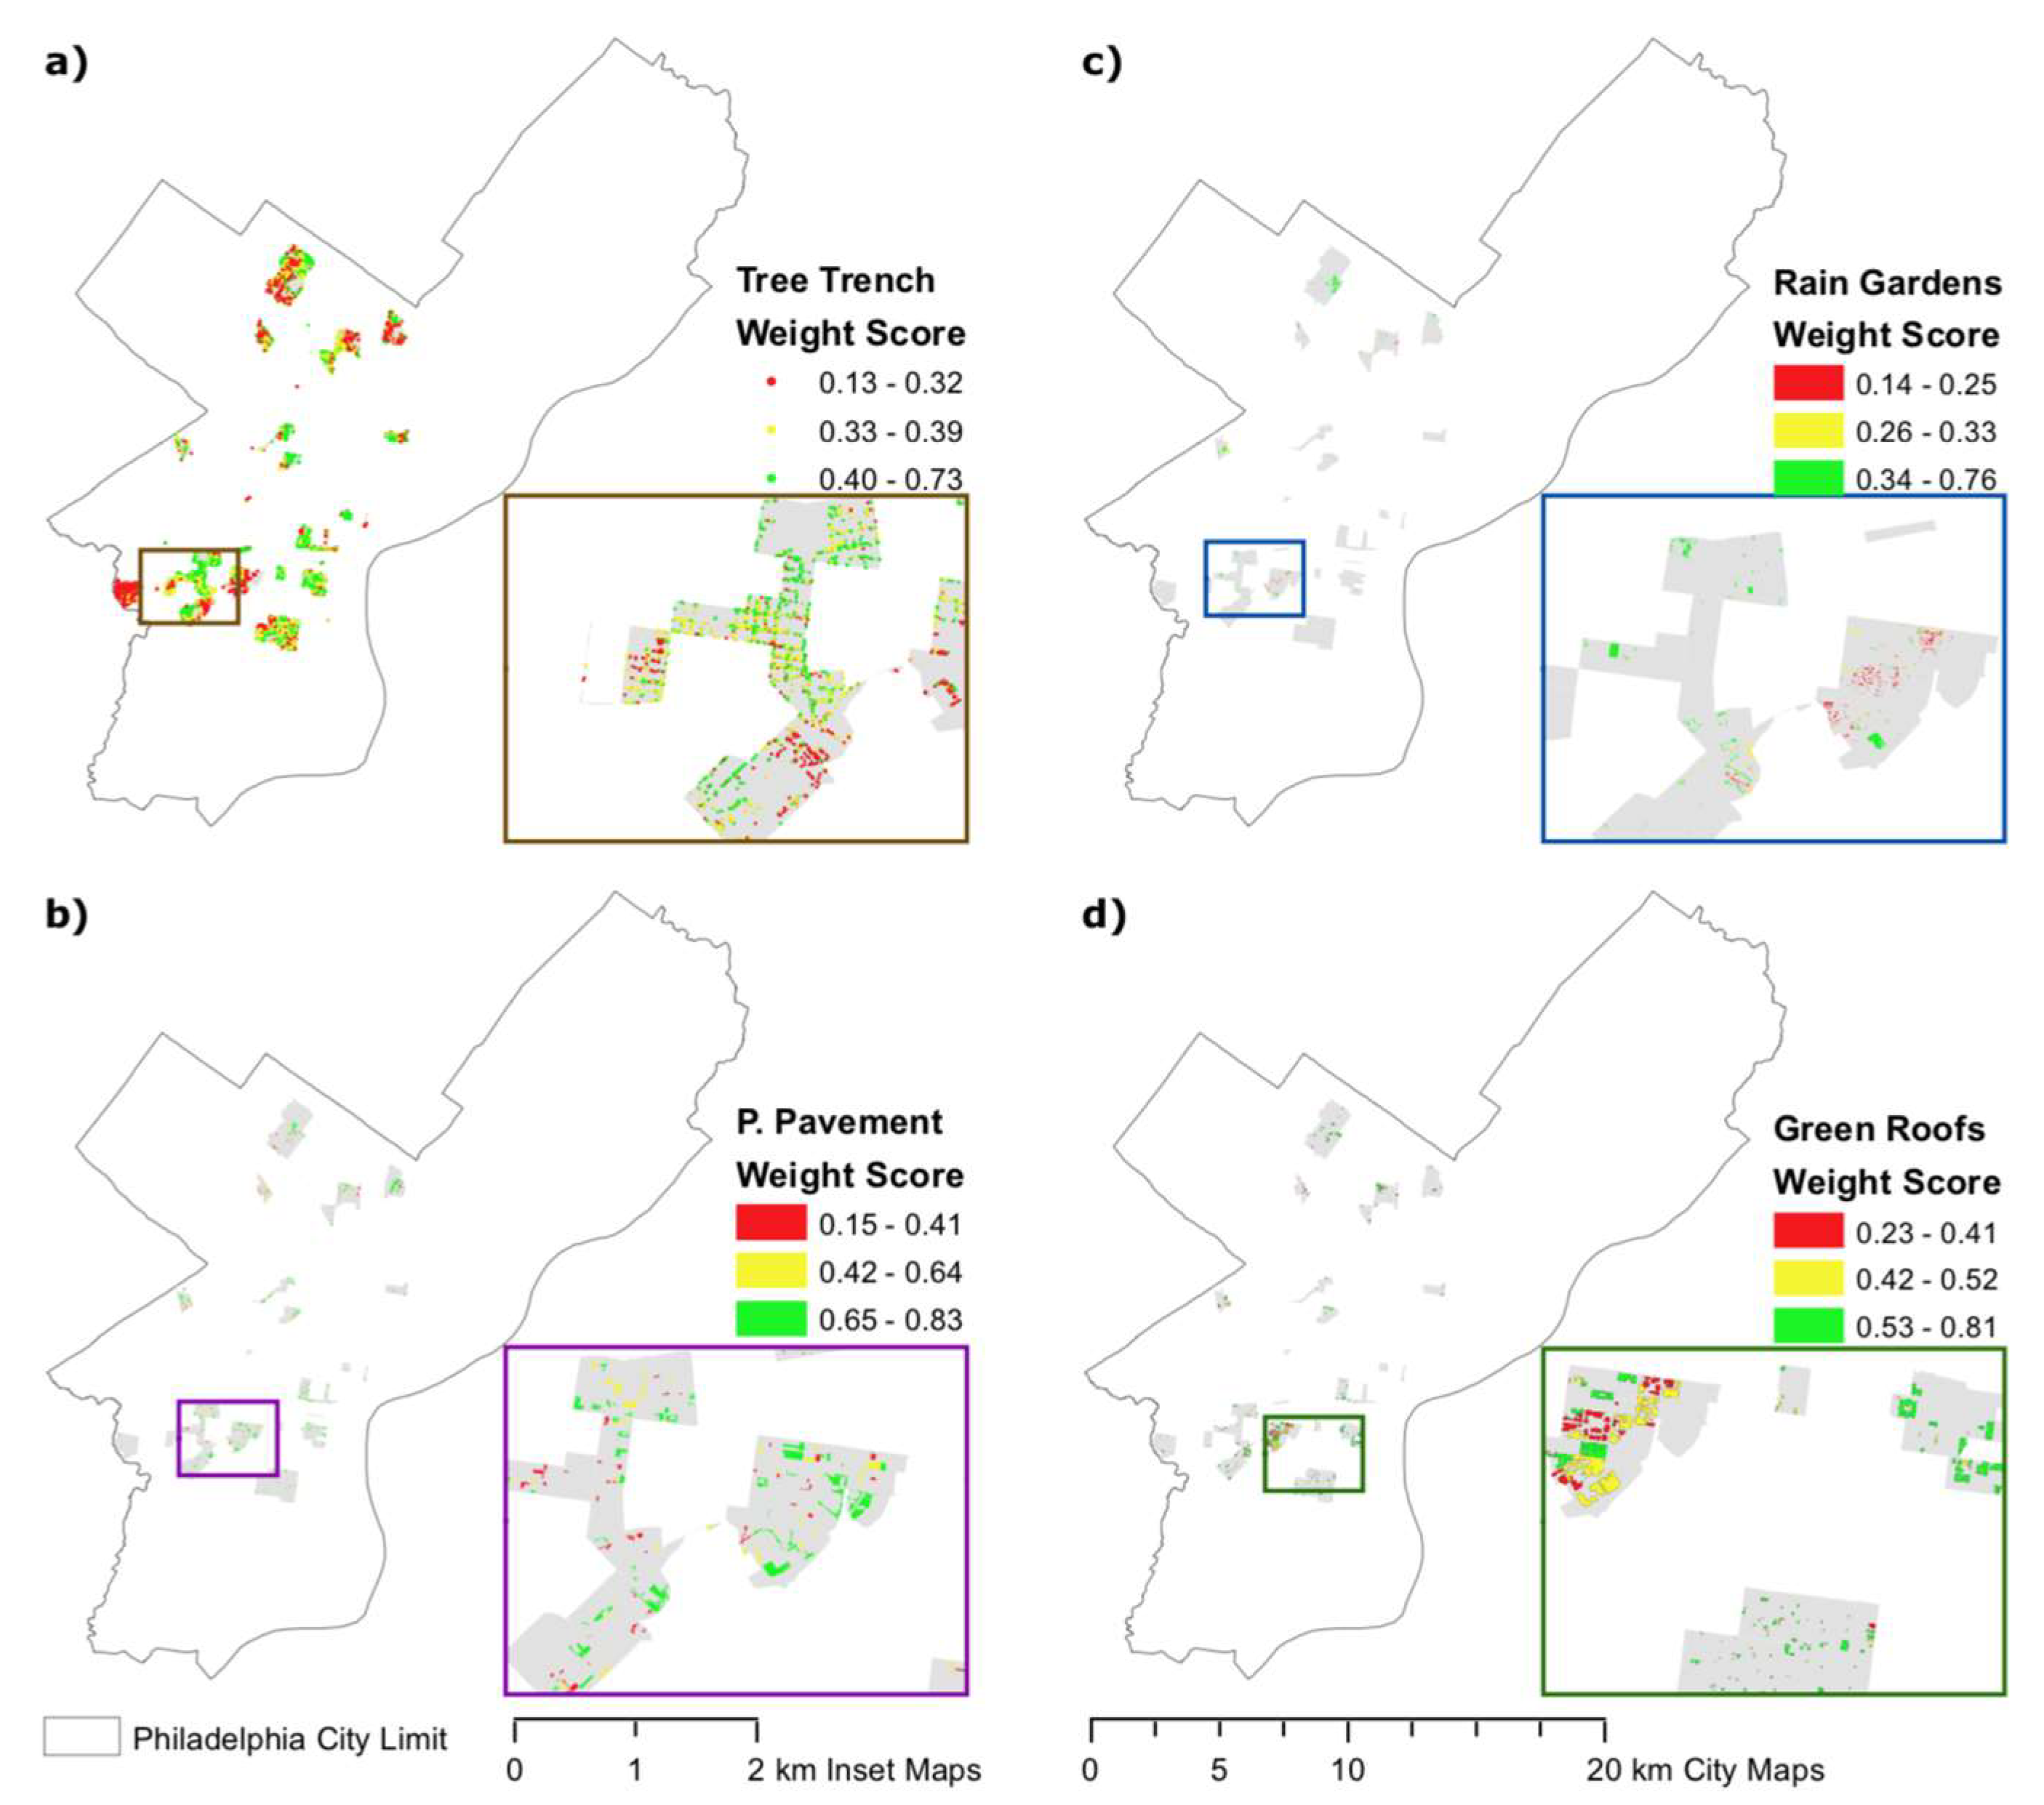
Priority weights based on expert opinion are listed in Table 1. These weights were used in the linear combination to rank the suitable GSI implementation sites, which are depicted in Figure 2.
Based on the weighted linear combination of site prioritization characteristics, a suitability score was calculated for each potential location for GSI implementation. Site scores ranged from 0 (least suitable) to 1 (most suitable). Results were categorized into three tiers by quantile classification, with full results in Figure 2. Scores for sites with the highest suitability ranged from 0.40–0.73 for tree trenches, 0.65–0.83 for pervious pavement, 0.53–0.81 for green roofs, and 0.34–0.76 for rain gardens.
4.4. Virtual Site Observation and Validation
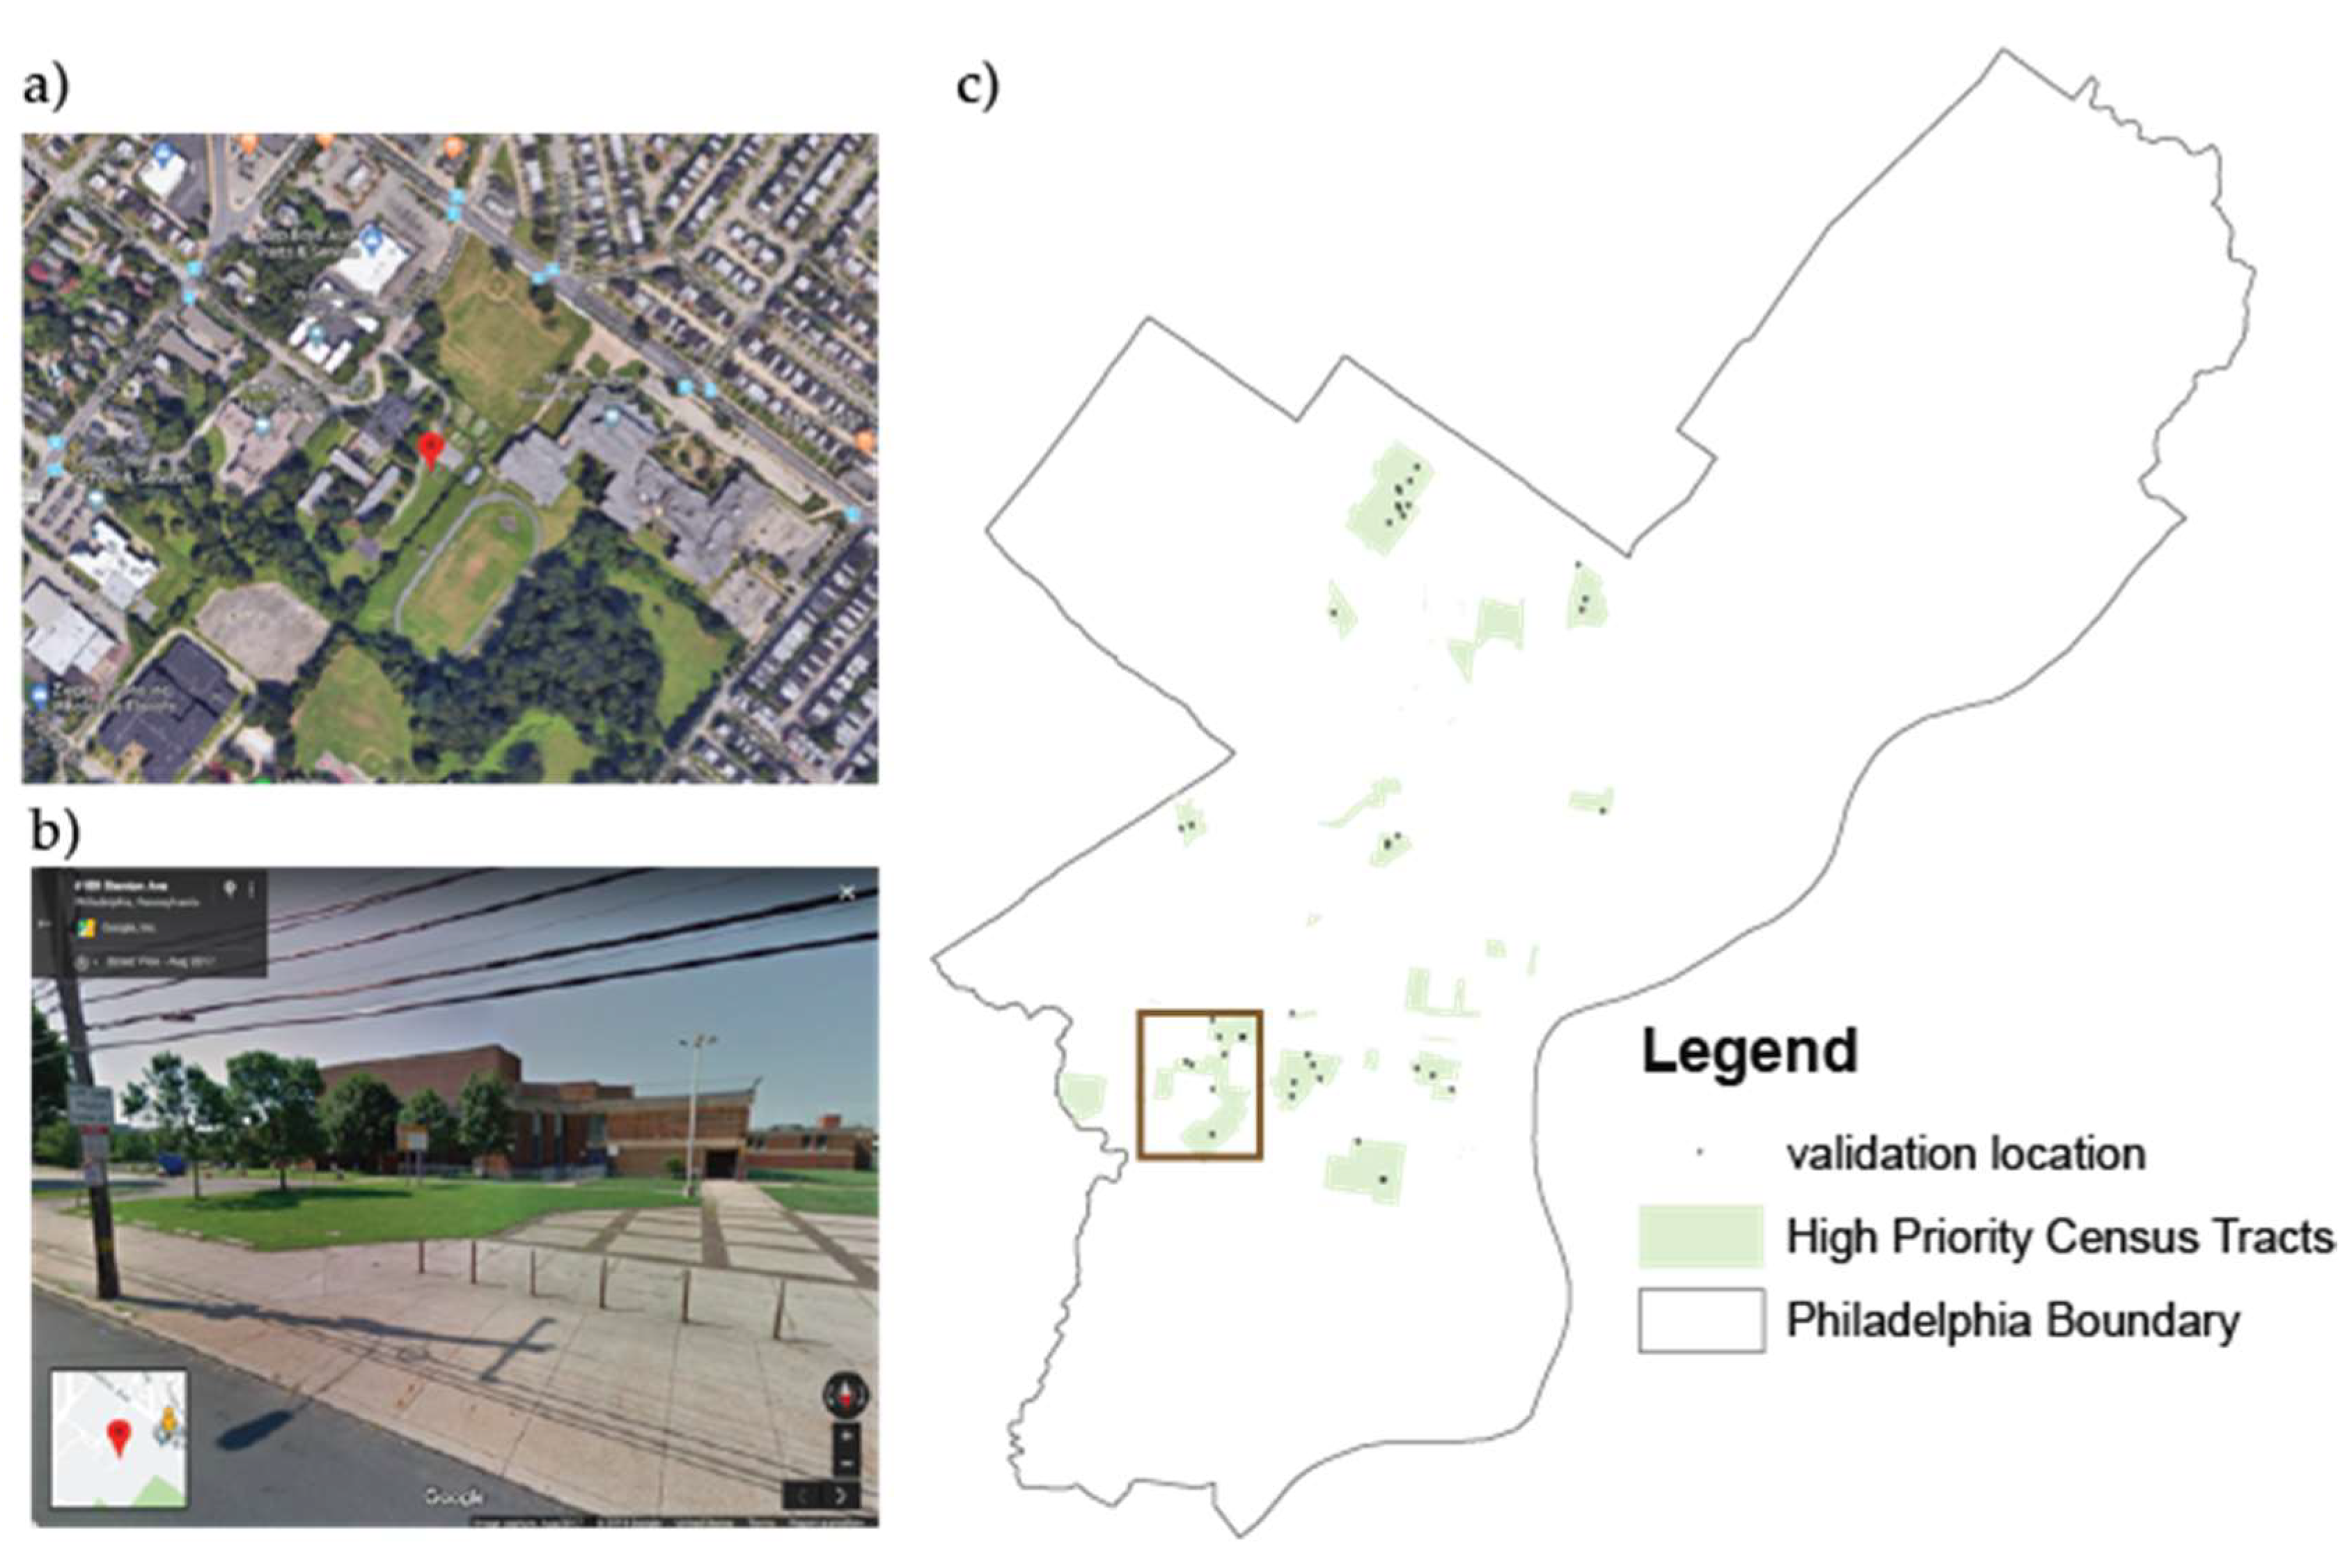
Of the 37 virtual site observations, 25 (67%) of locations had the available 360° imagery dated in 2017, with the remainder in 2016 (5 locations), 2014 (6 locations), and 2009 (1 location). All imagery were accessed in August, 2018. Figure 3 depicts a potential GSI implementation site imagery and the distribution of sites across the high-priority Census Tracts of the study area.
At each location, a survey of the types and conditions of properties and streetside infrastructure was conducted through a visual examination of the orthographic and streetside 360° imagery, tallied in a standard survey questionnaire (Appendix B). Residential properties were visible at 62% of locations, with 96% described as moderately- or very- well-kept, on a 4-point Likert scale. Commercial properties were visible at 46% of locations, with 94% of those at least moderately well-kept. Industrial properties were visible at only 11% of locations, with 100% at least moderately well-kept. Other buildings were present at 78% of locations, with 97% at least moderately well-kept.
Regarding the streetside infrastructure: yards (vegetation or other aesthetic implementations) and sidewalks were noted at all sites, with 89% and 81%, respectively, at least moderately well-kept, free of litter, and not in obvious disrepair. Recreation facilities were visible at 22% of locations and parking lots were visible at 49% of locations; all of these features were at least moderately well-kept.
Of the sites virtually observed, only one (3%) had a slope that exceeded 2% but less than 5%; for all other locations, slopes were 0–2%. Sites varied widely regarding the presence of impervious surfaces, which were estimated for the streetside structure, adjacent lots, and institutional lots, and results are shown below in Table 2.
In addition to the type of GSI feature indicated by the suitability model, each site was also evaluated for its suitability for all GSI feature types. The suitability for the indicated GSI feature type at each location had high correspondence: 100% of the tree trench and pervious pavement sites, 90% of the green roof sites, and 85.71% of the rain garden sites were deemed suitable for their respective feature implementations. Overall, it was estimated that 95% of all sites visited for any potential GSI type had sufficient space in the nearby area for a tree trench GSI feature. For the placement of pervious pavement, 51% had sufficient space, and for the placement of a rain garden, 35% had sufficient space. Green roof placement was assessed by the presence of a visible flat roof in an adjacent commercial or institutional property, and 38% had sufficient space for this GSI feature.
Finally, addressing the question of whether the anticipated GSI use was found to be suitable for the observed location. In the virtual observation site examination, the potential suitability for each of the four GSI types was evaluated at every location, to account for potential local site substitution based on community and design implementation factors. Full results are listed in Table 3.
5. Discussion
Though the social and economic benefits associated with GSI have been well documented [8,37], efforts to maximize these benefits have been limited. Building on research identifying census tracts in Philadelphia with indicators for disadvantage as well as a high community capacity for collective action [9], this prioritization framework offers a means of maximizing the triple bottom line benefits of GSI while considering the equity and long-term viability of these investments.
While the focus of municipal agencies may be, understandably, on the environmental impact of the proposed GSI, these analyses may benefit from the consideration of a broader range of criteria. Potential advantages include: maximizing the social and economic benefits of GSI; equitably distributing GSI; distinguishing amongst similar candidate parcels (common in urban areas); and leveraging community capacity to facilitate the ongoing maintenance of GSI. As municipalities struggle to meet federal requirements for reducing CSOs, resources are often divided across “green” and “grey” infrastructure projects [42]. When GSI projects are sited to maximize social and economic benefits, they may be viewed in more economically favorable terms, which may, in turn, accelerate adoption of sustainable municipal stormwater management practices.
This study represents a starting point for parties interested in the social and economic benefits of GSI. Previous work demonstrated the practicality of prioritizing social equity and community capacity while raising important questions for future research to answer [9]. The framework and subsequent prioritization developed through this research have immediate relevance for those working to install GSI throughout Philadelphia in addition to long-term implications for municipalities and their agencies seeking to maximize the impact of GSI projects. Further research must also address the benefits and perception thereof by residents and local officials, which can influence the perceived success and future public support for GSI projects.
Within Philadelphia, validation and local site examination suggests that the process of restricting potential sites based on the distance-based social features of the site was an effective means of identifying sites for prioritization. Though it is difficult to even anticipate the effectiveness of the subsequent priority ranking process, the variability of site rankings resulting from the analysis of expert opinion suggests that this process effectively distinguished among comparable candidate sites.
Results of this study are significant to the fields of environmental planning and management, restorative sustainability, and environmental justice, by enhancing methods to identify sites for GSI implementation in highly urbanized areas and disadvantaged communities. First and foremost, the findings demonstrate the utility of a site suitability model that employs social factors coupled with virtual field observations to evaluate siting of GSI projects in Philadelphia. The site suitability model developed is unique in its approach to identify GSI sites in highly urbanized areas using physical constraints of the built environment coupled with social factors. A lack of variability or reliable data limit the utility of environmental data for siting GSI in urban areas that may have limited undisturbed natural landscapes. In response, this model used built environmental characteristics, including locations of trees and vacant tree wells, parking lots, grassy areas, and building footprints for the respective GSI features to be implemented. While proximity to existing stormwater infrastructure is a conventional criterion used in siting GSI, this study also used expert opinion to identify and rank other proximity criteria. While the expert opinions were calibrated by the conditions in Philadelphia, the methodology of incorporating such social factors is transferrable.
The approach to validating the sites generated from the suitability model also facilitates the site selection process. The use of virtual site observations of the suitability model results demonstrated that the model generated locations that ranged from 85.71% to 100% suitable for the proposed GSI project. In addition, it is important to note the sites suitable for tree trenches also were appropriate locations for other types of GSI projects. The novel use of a virtual approach to field validation offers the potential for substantial savings in in time and resources.
This study also contributes to strategies to bring nature-based solutions to environmental justice communities through a two-tiered method to identified locations for GSI projects with the potential to deliver triple bottom line benefits. Building on previous work that developed a strategy to prioritize Census tracts for equitable distribution of GSI in Philadelphia [9], this study employed a suitability model with proximity criteria and weights based on expert opinion. Together, these methods identified block-level suitable locations with community capacity bolstered by transit stops, NACs, schools, and recreation centers.
This study is not without limitations. While the principles upon which this site-specific prioritization framework is built may be broadly transferrable, the physical and social characteristics meriting consideration may vary significantly. With regards to physical characteristics, slope and hydrologic soil grouping, variables excluded from analysis in the case of Philadelphia, could prove critically important if this methodology was to be utilized elsewhere. Similarly, NACs are unique to Philadelphia, and Universities may not provide a comparable institutional presence in another region of analysis. Finally, as the form and availability of data influenced the design of this prioritization framework, it would be expected to influence subsequent applications of the framework across geographies in different ways, resulting in the consideration of new features of the social and built environments. It is also important to note that while this framework includes expert opinion to inform the site selection process at the local level, it does not include direct input from the impacted community. Ultimately, community preference for and knowledge of the appropriate location and type of GSIs should be incorporated to further guide implementation and this can be addressed in a future study.
Longitudinal research, comparing the actual benefits of GSI elements with their prioritization score would be required to measure the effectiveness of this particular prioritization framework; however, the complexity of measuring these variables and the temporal scope required to conduct such an analysis will likely prove prohibitive. Nevertheless, demonstrating the replicability of this methodology, appropriately adjusted for a new geography, is warranted as a means of validating this approach to the prioritization of GSI, incorporating features of both the social and built environment. Such replication would further this model of accounting for the positive externalities of GSI and serve as a means of furthering its propagation. Further research should incorporate the perceptions of GSI features by the heterogeneous communities across the urban context and how these features may promote or compete with community well-being, heritage, and future development.
6. Conclusions
This study demonstrated a framework for siting GSI features in the context of an urbanized area with limited variability in the characteristics of the natural and built environments commonly used. Through this analysis, locations for four different types of GSI features were identified within the high-priority census tracts identified by previous work, which balanced environmental justice and community capacity factors [9]. This study incorporated the opinions of experts to prioritize and delimit distances of influence for GSI siting, which were validated and further contextualized using virtual field observations, with potentially transferrable insights for other urbanized areas that seek to control stormwater impacts on aging infrastructure.
Author Contributions
Conceptualization, L.M., M.M., and Z.C.; methodology, M.M., K.H., and Z.C.; data curation, K.H.; analysis, K.H. and Z.C.; validation, Z.C.; writing—original draft preparation, M.M., Z.C., K.H., and L.M.; writing—review and editing, Z.C., M.M., K.H., and L.M.; visualization, Z.C. and K.H.
Funding
This research has been supported by a grant from the U.S. Environmental Protection Agency’s Science to Achieve Results (STAR) program under Assistance Agreement No._835557. It has not been formally reviewed by EPA. The views expressed in this document are solely those of authors and do not necessarily reflect those of the Agency. EPA does not endorse any products or commercial services mentioned in this publication.
Acknowledgments
We would like to acknowledge Rowan University students Cassie Shugart, Robert Kearney, and Donald Morrison for their support in the beginning stage of this project. We thank Philadelphia area GSI experts for their valuable feedback on the suitability model criteria selection process.
Conflicts of Interest
The authors declare no conflict of interest.
Appendix A. Questions asked of Experts regarding Influence and Relative Importance of Factors Facilitating the Prioritization of Green Stormwater Infrastructure
The following questions were asked in identical form for each of the four types of GSI features (tree trenches, rain gardens, pervious pavement, and rain gardens):
- Regarding the distance to the nearest stormwater inlet, what is the minimum optimal distance (in feet), and is there a range of minimum values that would all be optimal (e.g., a stormwater inlet closer than 20 feet is ideal and equivalent in terms of cost & efficacy)? (text input)
- Now, regarding the distance to the nearest stormwater inlet, what is the maximum optimal distance (in feet) beyond which this factor no longer influences the choice or decision framework for this GSI element (e.g., a stormwater inlet more than 100 feet away is irrelevant)? (text input)
- Regarding the distance to the nearest transit stop, what is the minimum optimal distance (in feet), and is there a range of minimum values that would all be optimal (e.g., a transit stop Proximity of nearest recreation center
- Now, regarding the distance to the nearest transit stop, what is the maximum optimal distance (in feet) beyond which this factor no longer influences the choice or decision framework for this GSI element (e.g., a transit stop more than 1,000 feet away is irrelevant)?
- Regarding the distance to the nearest Neighborhood Advisory Committee, what is the minimum optimal distance (in feet), and is there a range of minimum values that would all be optimal?
- Now, regarding the distance to the nearest Neighborhood Advisory Committee, what is the maximum optimal distance (in feet) beyond which this factor no longer influences the choice or decision framework for this GSI element?
- Regarding the distance to the nearest school, what is the minimum optimal distance (in feet), and is there a range of minimum values that would all be optimal?
- Now, regarding the distance to the nearest school, what is the maximum optimal distance (in feet) beyond which this factor no longer influences the choice or decision framework for this GSI element?
- Regarding the distance to the nearest university, what is the minimum optimal distance (in feet), and is there a range of minimum values that would all be optimal?
- Now, regarding the distance to the nearest university, what is the maximum optimal distance (in feet) beyond which this factor no longer influences the choice or decision framework for this GSI element?
- Regarding the distance to the nearest recreation center, what is the minimum optimal distance (in feet), and is there a range of minimum values that would all be optimal?
- Now, regarding the distance to the nearest recreation center, what is the maximum optimal distance (in feet) beyond which this factor no longer influences the choice or decision framework for this GSI element?
- In siting a tree trench, how would you rank the relative importance of these factors? (choice matrix
- Factors
- Proximity of nearest stormwater inlet
- Proximity of nearest transit stop
- Proximity of nearest Neighborhood Advisory Committee
- Proximity of nearest school
- Proximity of nearest university
- Proximity of nearest recreation center
- Influence
- Not at all important
- Some importance
- Somewhat important
- Very important
- Most important
Appendix B. Green Stormwater Infrastructure site validation and micro-characteristics survey
- Number of feature (from stratified random sample scheme) (text input)
- Latitude/Longitude of observed point (text input)
- Street address of observed point (text input)
- Date of Google Street View imagery (Month/year)
- Type of Site under consideration at this location (choice matrix)
- Tree trench
- Pervious pavement
- Rain garden
- Green roof
- Slope limitations
- 0–2%
- 2–5%
- 5–10%
- 10+%
- Current impervious surface (choice matrix)
- Types
- Street-side structure
- Adjacent lots
- Institutional lots
- Ranges
- 0–25%
- 25–50%
- 50–75%
- 75–100%
- cannot determine
- Assets of site (checkbox)
- Site has good visibility from street
- Institution is visible at this location
- Asset comments (text input)
- Liabilities of site (checkbox)
- Visible trash
- Visible disrepair of adjacent properties
- Liability comments (text input)
- Block characteristics (choice matrix))
- Types
- Residential properties
- Commercial properties
- Industrial properties
- Other buildings
- Yards and surrounding areas
- Sidewalks
- Recreational facilities
- Parking lots
- Vacant lots or unused marked space
- Conditions
- Not present
- Poor/badly deteriorated (extensive damage, neglect)
- Fair condition (e.g., peeing paint; needs repair)
- Moderately well-kept
- Very well-kept (no visible problems)
- Cannot determine from view
- Is there sufficient space at this site for (choice matrix)
- Types
- Tree trench
- Pervious pavement
- Green roof
- Rain garden
- Responses
- Yes
- No
- Unclear from observation
- Comments (text input)
References
- Muerdter, C.P.; Wong, C.K.; LeFevre, G.H. Emerging investigator series: The role of vegetation in bioretention for stormwater treatment in the built environment: Pollutant removal, hydrologic function, and ancillary benefits. Environ. Sci.-WATER Res. Technol. 2018, 4, 592–612. [Google Scholar] [CrossRef]
- Pennino, M.J.; McDonald, R.I.; Jaffe, P.R. Watershed-scale impacts of stormwater green infrastructure on hydrology, nutrient fluxes, and combined sewer overflows in the mid-Atlantic region. Sci. Total Environ. 2016, 565, 1044–1053. [Google Scholar] [CrossRef] [PubMed]
- Li, C.; Fletcher, T.D.; Duncan, H.P.; Burns, M.J. Can stormwater control measures restore altered urban flow regimes at the catchment scale? J. Hydrol. 2017, 549, 631–653. [Google Scholar] [CrossRef]
- Brombach, H.; Weiss, G.; Fuchs, S. A new database on urban runoff pollution: Comparison of separate and combined sewer systems. Water Sci. Technol. 2005, 51, 119–128. [Google Scholar] [CrossRef] [PubMed]
- United States Environmental Protection Agency Office of Water. Report to Congress: Impacts and Control of CSOs and SSOs; EPA B33-R-04-001; Office of Water: Washington, DC, USA, August 2004.
- LaDuca, A.; Kosko, J. Getting to Green: Paying for Green Infrastructure--Financing Options and Resources for Local Decision-Makers; EPA 842-R-14-005; United States Environmental Protection Agency: Washington, DC, USA, 2014.
- Philadelphia Water Department. Green Infrastructure Maintenance Manual; Green City Clean Waters; Version 2.0; Philadelphia Water Department: Philadelphia, PA, USA, September 2016.
- Kondo, M.C.; Low, S.C.; Henning, J.; Branas, C.C. The Impact of Green Stormwater Infrastructure Installation on Surrounding Health and Safety. Am. J. Public Health 2015, 105, e114–e121. [Google Scholar] [CrossRef] [PubMed]
- Mandarano, L.; Meenar, M. Equitable distribution of green stormwater infrastructure: A capacity-based framework for implementation in disadvantaged communities. Local Environ. 2017, 22, 1338–1357. [Google Scholar] [CrossRef]
- Tsihrintzis, V.A.; Hamid, R. Modeling and Management of Urban Stormwater Runoff Quality: A Review. Water Resour. Manag. 1997, 11, 136–164. [Google Scholar] [CrossRef]
- Collins, K.A.; Lawrence, T.J.; Stander, E.K.; Jontos, R.J.; Kaushal, S.S.; Newcomer, T.A.; Grimm, N.B.; Cole Ekberg, M.L. Opportunities and challenges for managing nitrogen in urban stormwater: A review and synthesis. Manag. Denitrification Hum. Domin. Landsc. 2010, 36, 1507–1519. [Google Scholar] [CrossRef]
- Shafique, M.; Kim, R.; Kyung-Ho, K. Green Roof for Stormwater Management in a Highly Urbanized Area: The Case of Seoul, Korea. Sustainability 2018, 10. [Google Scholar] [CrossRef]
- Young Kevin, D.; Kibler David, F.; Benham Brian, L.; Loganathan, G.V. Application of the Analytical Hierarchical Process for Improved Selection of Storm-Water BMPs. J. Water Resour. Plan. Manag. 2009, 135, 264–275. [Google Scholar] [CrossRef]
- Wang, R.; Eckelman, M.J.; Zimmerman, J.B. Consequential Environmental and Economic Life Cycle Assessment of Green and Gray Stormwater Infrastructures for Combined Sewer Systems. Environ. Sci. Technol. 2013, 47, 11189–11198. [Google Scholar] [CrossRef] [PubMed]
- Kandulu, J.M.; Connor, J.D.; MacDonald, D.H. Ecosystem services in urban water investment. J. Environ. Manage. 2014, 145, 43–53. [Google Scholar] [CrossRef] [PubMed]
- Dagenais, D.; Thomas, I.; Paquette, S. Siting green stormwater infrastructure in a neighbourhood to maximise secondary benefits: Lessons learned from a pilot project. Landsc. Res. 2017, 42, 195–210. [Google Scholar] [CrossRef]
- Cox, J. “Green Stormwater Infrastructure”; Parks & Recreation. February 2018. Available online: https://www.nrpa.org/parks-recreation-magazine/2018/february/green-stormwater-infrastructure/ (accessed on 25 November 2018).
- Cai, G.; Du, M.; Xue, Y. Monitoring of urban heat island effect in Beijing combining ASTER and TM data. Int. J. Remote Sens. 2011, 32, 1213–1232. [Google Scholar] [CrossRef]
- Kati, V. Hotspots, complementarity or representativeness? designing optimal small-scale reserves for biodiversity conservation. Biol. Conserv. 2004, 120, 471–480. [Google Scholar] [CrossRef]
- Kati, V.; Jari, N. Bottom-up thinking—Identifying socio-cultural values of ecosystem services in local blue–green infrastructure planning in Helsinki, Finland. Land Use Policy 2016, 50, 537–547. [Google Scholar] [CrossRef]
- Jayasooriya, V.M.; Ng, A.W.M. Tools for Modeling of Stormwater Management and Economics of Green Infrastructure Practices: A Review. Water. Air. Soil Pollut. 2014, 225, 2055. [Google Scholar] [CrossRef]
- Elliott, A.H.; Trowsdale, S.A. A review of models for low impact urban stormwater drainage. Spec. Sect. Adv. Technol. Environ. Model. 2007, 22, 394–405. [Google Scholar] [CrossRef]
- Cheng, M.-S.; Zhen, J.X.; Shoemaker, L. BMP decision support system for evaluating stormwater management alternatives. Front. Environ. Sci. Eng. China 2009, 3, 453. [Google Scholar] [CrossRef]
- Stovin, V. The potential of green roofs to manage Urban Stormwater. Water Environ. J. 2010, 24, 192–199. [Google Scholar] [CrossRef]
- VanWoert, N.D.; Rowe, D.B.; Andresen, J.A.; Rugh, C.L.; Fernandez, R.T.; Xiao, L. Green Roof Stormwater Retention This paper is a portion of a thesis submitted by N.D. VanWoert. J. Environ. Qual. 2005, 34, 1036–1044. [Google Scholar] [CrossRef] [PubMed]
- U.S. Department of Agriculture; Natural Resources Conservation Service. Web Soil Survey. Available online: https://websoilsurvey.sc.egov.usda.gov/App/HomePage.htm (accessed on 25 November 2018).
- Pennsylvania Department of Environmental Protection Bureau of Watershed Management; Pennsylvania Stormwater Best Management Practices Manual; 363-0300-002. Available online: http://pecpa.org/wp-content/uploads/Stormwater-BMP-Manual.pdf (accessed on 25 November 2018).
- Pataki, D.E.; Carreiro, M.M.; Cherrier, J.; Grulke, N.E.; Jennings, V.; Pincetl, S.; Pouyat, R.V.; Whitlow, T.H.; Zipperer, W.C. Coupling biogeochemical cycles in urban environments: Ecosystem services, green solutions, and misconceptions. Front. Ecol. Environ. 2011, 9, 27–36. [Google Scholar] [CrossRef]
- Porse, E. Open data and stormwater systems in Los Angeles: Applications for equitable green infrastructure. Local Environ. 2018, 23, 505–517. [Google Scholar] [CrossRef]
- Eaton, T.T. Approach and case-study of green infrastructure screening analysis for urban stormwater control. J. Environ. Manag. 2018, 209, 495–504. [Google Scholar] [CrossRef] [PubMed]
- Liu, W.; Chen, W.; Peng, C. Influences of setting sizes and combination of green infrastructures on community’s stormwater runoff reduction. Ecol. Manag. Hum.-Domin. Urban Reg. Ecosyst. 2015, 318, 236–244. [Google Scholar] [CrossRef] [Green Version]
- Federal Emergency Management Agency Flood Zones. Available online: https://www.fema.gov/flood-zones (accessed on 25 November 2018).
- Green, O.O.; Shuster, W.D.; Rhea, L.K.; Garmestani, A.S.; Thurston, H.W. Identification and Induction of Human, Social, and Cultural Capitals through an Experimental Approach to Stormwater Management. Sustainability 2012, 4. [Google Scholar] [CrossRef]
- Boyle, L.; Michell, K.; Viruly, F. A Critique of the Application of Neighborhood Sustainability Assessment Tools in Urban Regeneration. Sustainability 2018, 10. [Google Scholar] [CrossRef]
- Keeley, M.; Koburger, A.; Dolowitz, D.P.; Medearis, D.; Nickel, D.; Shuster, W. Perspectives on the Use of Green Infrastructure for Stormwater Management in Cleveland and Milwaukee. Environ. Manag. 2013, 51, 1093–1108. [Google Scholar] [CrossRef] [PubMed]
- Garcia-Cuerva, L.; Berglund, E.Z.; Rivers, L., III. An integrated approach to place Green Infrastructure strategies in marginalized communities and evaluate stormwater mitigation. J. Hydrol. 2018, 559, 648–660. [Google Scholar] [CrossRef]
- Sahely, H.R.; Kennedy, C.A.; Adams, B.J. Developing sustainability criteria for urban infrastructure systems. Can. J. Civ. Eng. 2005, 32, 72–85. [Google Scholar] [CrossRef]
- Schilling, J.; Logan, J. Greening the Rust Belt: A Green Infrastructure Model for Right Sizing America’s Shrinking Cities. J. Am. Plann. Assoc. 2008, 74, 451–466. [Google Scholar] [CrossRef]
- Wolch, J.R.; Byrne, J.; Newell, J.P. Urban green space, public health, and environmental justice: The challenge of making cities ‘just green enough’. Landsc. Urban Plan. 2014, 125, 234–244. [Google Scholar] [CrossRef] [Green Version]
- Mell, I.C. Can green infrastructure promote urban sustainability? Proc. Inst. Civ. Eng.-Eng. Sustain. 2009, 162, 23–34. [Google Scholar] [CrossRef]
- United States Census Bureau. American Community Survey 1-Year Estiamtes; American Community Sruvey; United States Census Bureau: Suitland, MD, USA, 2017.
- Hopkins, K.G.; Grimm, N.B.; York, A.M. Influence of governance structure on green stormwater infrastructure investment. Environ. Sci. Policy 2018, 84, 124–133. [Google Scholar] [CrossRef]
- OpenDataPhilly web portal. Available online: https://www.opendataphilly.org (accessed on 25 November 2018).
- Eastman, J.R.; Jiang, H.; Toledano, J. Multi-criteria and multi-objective decision making for land allocation using GIS. In Multicriteria Analysis for Land-Use Management; Beinat, E., Nijkamp, P., Eds.; Springer: Dordrecht, The Netherlands, 1998; pp. 227–251. ISBN 978-94-015-9058-7. [Google Scholar]
- ESRI 2018 ArcGIS Desktop Release 10.6; Redlands, CA: Environmental Systems Research Institute. Available online: http://desktop.arcgis.com/en/arcmap/ (accessed on 25 November 2018).
- Anguelov, D.; Dulong, C.; Filip, D.; Frueh, C.; Lafon, S.; Lyon, R.; Ogale, A.; Vincent, L.; Weaver, J. Google Street View: Capturing the World at Street Level. Computer 2010, 43, 32–38. [Google Scholar] [CrossRef]
Figure 1.
The distribution of potential GSI implementation sites by type of feature, across the City of Philadelphia.
Figure 1.
The distribution of potential GSI implementation sites by type of feature, across the City of Philadelphia.

Figure 2.
Ranked prioritization of potential GSI implementation sites by type of feature, across the City of Philadelphia.
Figure 2.
Ranked prioritization of potential GSI implementation sites by type of feature, across the City of Philadelphia.

Figure 3.
(a) sample location for potential siting of GSI feature in Google orthographic imagery; (b) StreetView 360° imagery; (c) location of all validation points, within previously established high priority census tracts.
Figure 3.
(a) sample location for potential siting of GSI feature in Google orthographic imagery; (b) StreetView 360° imagery; (c) location of all validation points, within previously established high priority census tracts.


Table 1.
Weighting of proximity to socially relevant features and their functional distances.
| Feature | Tree Trench | Pervious Pavement | Rain Garden | Green Roof | Distance Range, Min-Max (m [feet]) |
|---|---|---|---|---|---|
| Sewer Inlet | 12.00% | 41.70% | 17.20% | 23.50% | 0–4.57 [0–15] |
| Transit Stop | 16.00% | 8.30% | 13.80% | 5.90% | 6.10–15.24 [20–50] |
| School | 20.00% | 8.30% | 17.20% | 23.50% | 15.24–762 [50–2500] |
| N.A.C. | 16.00% | 8.30% | 17.20% | 5.90% | 0–457.2 [0–1500] |
| University | 20.00% | 25.00% | 17.20% | 23.50% | 15.24–4828.0 [50–15840, 3 miles] |
| Rec. Center | 16.00% | 8.30% | 17.20% | 17.60% | 15.24–304.8 [50–1000] |
Table 2.
Percent impervious surface surrounding high-priority GSI implementation sites.
| Percent Impervious | |||||
|---|---|---|---|---|---|
| Zone | 0–25% | 25–50% | 50–75% | 75–100% | Cannot Determine |
| Streetside structure | 0.00% | 21.62% | 27.03% | 51.35% | 0.00% |
| Adjacent lots | 5.41% | 18.92% | 27.03% | 48.65% | 0.00% |
| Institutional lots | 5.41% | 24.32% | 8.11% | 32.43% | 29.73% |
Table 3.
Alignment of anticipated use with observed suitability from virtual field observation.
| Observed Suitability (Virtual Field Observation/Validation) | ||||
|---|---|---|---|---|
| Type of GSI | Tree Trench | Pervious Pavement | Green Roof | Rain Garden |
| Tree trench | 100.00% | 90.00% | 90.00% | 100.00% |
| Pervious pavement | 20.00% | 100.00% | 40.00% | 42.86% |
| Green roof | 10.00% | 30.00% | 90.00% | 14.29% |
| Rain garden | 30.00% | 20.00% | 20.00% | 85.71% |
© 2018 by the authors. Licensee MDPI, Basel, Switzerland. This article is an open access article distributed under the terms and conditions of the Creative Commons Attribution (CC BY) license (http://creativecommons.org/licenses/by/4.0/).
Share and Cite
MDPI and ACS Style
Christman, Z.; Meenar, M.; Mandarano, L.; Hearing, K. Prioritizing Suitable Locations for Green Stormwater Infrastructure Based on Social Factors in Philadelphia. Land 2018, 7, 145. https://doi.org/10.3390/land7040145
AMA Style
Christman Z, Meenar M, Mandarano L, Hearing K. Prioritizing Suitable Locations for Green Stormwater Infrastructure Based on Social Factors in Philadelphia. Land. 2018; 7(4):145. https://doi.org/10.3390/land7040145
Chicago/Turabian StyleChristman, Zachary, Mahbubur Meenar, Lynn Mandarano, and Kyle Hearing. 2018. "Prioritizing Suitable Locations for Green Stormwater Infrastructure Based on Social Factors in Philadelphia" Land 7, no. 4: 145. https://doi.org/10.3390/land7040145
Note that from the first issue of 2016, this journal uses article numbers instead of page numbers. See further details here.