Forest Carbon Gain and Loss in Protected Areas of Uganda: Implications to Carbon Benefits of Conservation


Norwegian Institute of Bioeconomy Research (NIBIO), Høgskoleveien 8, 1431 Ås, Norway
*
Author to whom correspondence should be addressed.
Land 2018, 7(4), 138; https://doi.org/10.3390/land7040138
Submission received: 26 September 2018
/
Revised: 1 November 2018
/
Accepted: 13 November 2018
/
Published: 16 November 2018
(This article belongs to the Special Issue Land-Use Change and Ecosystem Carbon Dynamics)
Abstract
:Uganda designated 16% of its land as Protected Area (PA). The original goal was natural resources, habitat and biodiversity conservation. However, PAs also offer great potential for carbon conservation in the context of climate change mitigation. Drawing on a wall-to-wall map of forest carbon change for the entire Uganda, that was developed using two Digital Elevation Model (DEM) datasets for the period 2000–2012, we (1) quantified forest carbon gain and loss within 713 PAs and their external buffer zones, (2) tested variations in forest carbon change among management categories, and (3) evaluated the effectiveness of PAs and the prevalence of local leakage in terms of forest carbon. The net annual forest carbon gain in PAs of Uganda was 0.22 ± 1.36 t/ha, but a significant proportion (63%) of the PAs exhibited a net carbon loss. Further, carbon gain and loss varied significantly among management categories. About 37% of the PAs were “effective”, i.e., gained or at least maintained forest carbon during the period. Nevertheless, carbon losses in the external buffer zones of those effective PAs significantly contrast with carbon gains inside of the PA boundaries, providing evidence of leakage and thus, isolation. The combined carbon losses inside the boundaries of a large number of PAs, together with leakage in external buffer zones suggest that PAs, regardless of the management categories, are threatened by deforestation and forest degradation. If Uganda will have to benefit from carbon conservation from its large number of PAs through climate change mitigation mechanisms such as REDD+, there is an urgent need to look into some of the current PA management approaches, and design protection strategies that account for the surrounding landscapes and communities outside of the PAs.
1. Introduction
Forest lands designated as Protected Areas (PA) are often referred to as conservation areas in the form of national parks and forest reserves, where activities leading to forest loss are either illegal or highly regulated. In PAs, the rates of habitat and biodiversity loss are lower than that of the unprotected areas [1,2,3,4,5]. As a result, establishing PA has become one of the most important policy tools to halt biodiversity loss and ensure sustainable management of natural resources. Consequently, the United Nations Convention on Biological Diversity [6] recommends each country to establish and manage protected areas to conserve biological diversity. Following a progress towards Aichi Biodiversity Target 11 to protect at least 17% of the planet’s terrestrial areas, the World Database on Protected Areas (WDPA 2014) recorded 209,000 PAs, designated as either National Parks, Forest Reserves, Wildlife-Sanctuary, Wildlife Reserve, Sanctuary or Community Wildlife Management Areas [7].
Historically, PA establishment in Uganda had the objective to appropriate and govern natural resources, and provide wildlife and timber for the colonial interests; in addition, protection had been based on excluding human access and settlements [8]. However, the dominant hard-edged fortress approach that excludes communities in decision making as well as resource use has since been debated leading to the emergence of centralized and decentralized conservation approaches, particularly since the mid-1980s [9]. Recent protection efforts in Uganda identified natural resources and biodiversity conservation, as well as ecosystem services as key objectives of PA management [10]. Uganda is one of the most biologically diverse countries in Africa [11], where PAs account for more than 95% of the animal and plant species in the country. Currently, most of the Ugandan biodiversity are represented in its 722 PAs, covering 16% of the country’s land area [12]. These PAs are being managed under five protection categories, namely, National Parks (NP), Wild Life Reserves (WLR), Central Forest Reserves (CFR), Local Forest Reserves (LFR), and Dual Joint Management (DJM) [13]. NPs and WLs are primarily managed by the Ugandan Wildlife Authority (UWA), a semi-autonomous government agency; however, there are other stakeholders such as district authorities and local communities with limited responsibilities in different activities, and are provided with limited wildlife use rights granted in the Uganda Wildlife Act [14]. The Wildlife Act mandates the UWA and stakeholders ensure sustainable management of wildlife resources and supervise wildlife activities in Uganda both within and outside the PAs. In addition to UWA, national and international NGOs and bilateral aid support conservation activities in the region, and in collaboration with local communities, work to improve biodiversity conservation, undertake research and attempt to improve conservation [15]. A history of NPs and WLRs in Uganda are described in Reference [16].
The Central Forest Reserves (CFRs) have been centrally managed by the National Forest Authority (NFA) since 2004, following the National Forestry and Tree Planting Act 8/2003. CFRs comprise natural forest and forest plantations, where NFA is primarily responsible for the management. However, many other institutions are also involved, including local government, universities, and a wide range of different NGOs to a lesser degree, with limited activities including conservation and research. In addition, the NFA manages nine PAs jointly with UWA, which are called Dual Joint Management (DGM), collectively.
Local Forest Reserves (LFRs) represent community conservation, an alternative natural resource management approach that has been advocated since the mid-1980s, based on a premise that local community management is more efficient in delivering conservation objectives while improving local livelihoods [8]. In Uganda, district local governments and urban authorities manage about 190 LFRs as decentralized forestry services in partnership with communities and private investors, as well as liaise with the NFA and other lead agencies on activities related to forestry.
The United Nations Climate Agreement [17] on reducing emissions from deforestation and degradation, plus forest management, conservation, and enhancement of carbon stock (REDD+) provides an unprecedented opportunity for conservation of tropical forests. In addition to reducing deforestation and forest degradation, REDD+ recognizes conservation as one of its major activities [18] and promises results-based economic incentives to encourage conservation. Therefore, among the most important immediate strategies in implementing REDD+ can be intensive conservation of existing protected areas and establishing new protected areas of high carbon benefits. In many cases, however, effective protection inside the boundaries of PAs may displace impacts along PA buffer zones, just outside PA boundaries. Such displacement, also known as leakage, has gained attention in the context of REDD+ [19,20], in the sense that emissions prevented by avoiding deforestation in one area can be offset by increased emissions due to increased deforestation elsewhere. Local leakage in the context of conservation, thus refers to situations where activities (example deforestation and forest degradation) that would have occurred within the boundaries of PAs are displaced to the surrounding unprotected buffer zones [21]. Leakage, which potentially displaces the outputs of conservation efforts, is particularly common among national parks and forest reserves in the tropics [22,23,24,25].
The Ministry of Water and Environment of Uganda [13] indicates that the country’s protected areas are under increasing threat from deforestation and forest degradation, owing to an increasing human population and thus increased demands for forest-based products and services. As part of its commitment to climate change mitigation actions, such as the Intended Nationally Determined Contribution (INDC) [26] and REDD+ [13], Uganda has the potential to benefit from effective management of its large number of PAs. National-level carbon emissions associated with forest cover changes were estimated in the recently developed Forest Reference Level (FRL) report to the UNFCCC [13]. The Ugandan FRL claims for the reference period of 2000–2015 that deforestation was insignificant in areas managed by Ugandan Wildlife Authorities and that the forest reserves have shown lower forest losses than that of private lands. The report, however, did not provide quantitative evidence regarding the effectiveness of the PAs in promoting carbon gain and avoiding carbon losses, particularly on the buffer zones of PAs. Few quantitative studies exist, if any, on the carbon benefits of the large number of Ugandan PAs. Such studies, when available, are limited to case studies on biodiversity and PA management, considering one or few national parks or forest reserves (e.g., [8,27,28,29]).
Quantitative assessment of carbon conservation in all PAs, in addition to advancing the science and practice of conservation, will support policy makers and practitioners in designing effective conservation strategies. This study draws on a wall-to-wall forest carbon change (above and below- ground) map of Uganda for the period 2000–2012 [30], which in turn was derived from two medium-resolution Digital Elevation Model (DEM) datasets, namely the SRTM acquired in 2000 and TanDEM-X acquired around 2012 based on Interferometric SAR (InSAR). The study explores, for the first time, the performance of PA management in Uganda, in terms of forest carbon change within the boundaries and buffer zones surrounding the PAs. The specific objectives are: (1) to analyze carbon changes (gain and loss) within protected areas of Uganda during 2000–2012, (2) test variations in carbon loss and gain among and within PAs management categories, and (3) evaluate the effectiveness of PAs and the prevalence of local leakage in the buffer zones of PAs.
2. Materials and Methods
2.1. Study Area
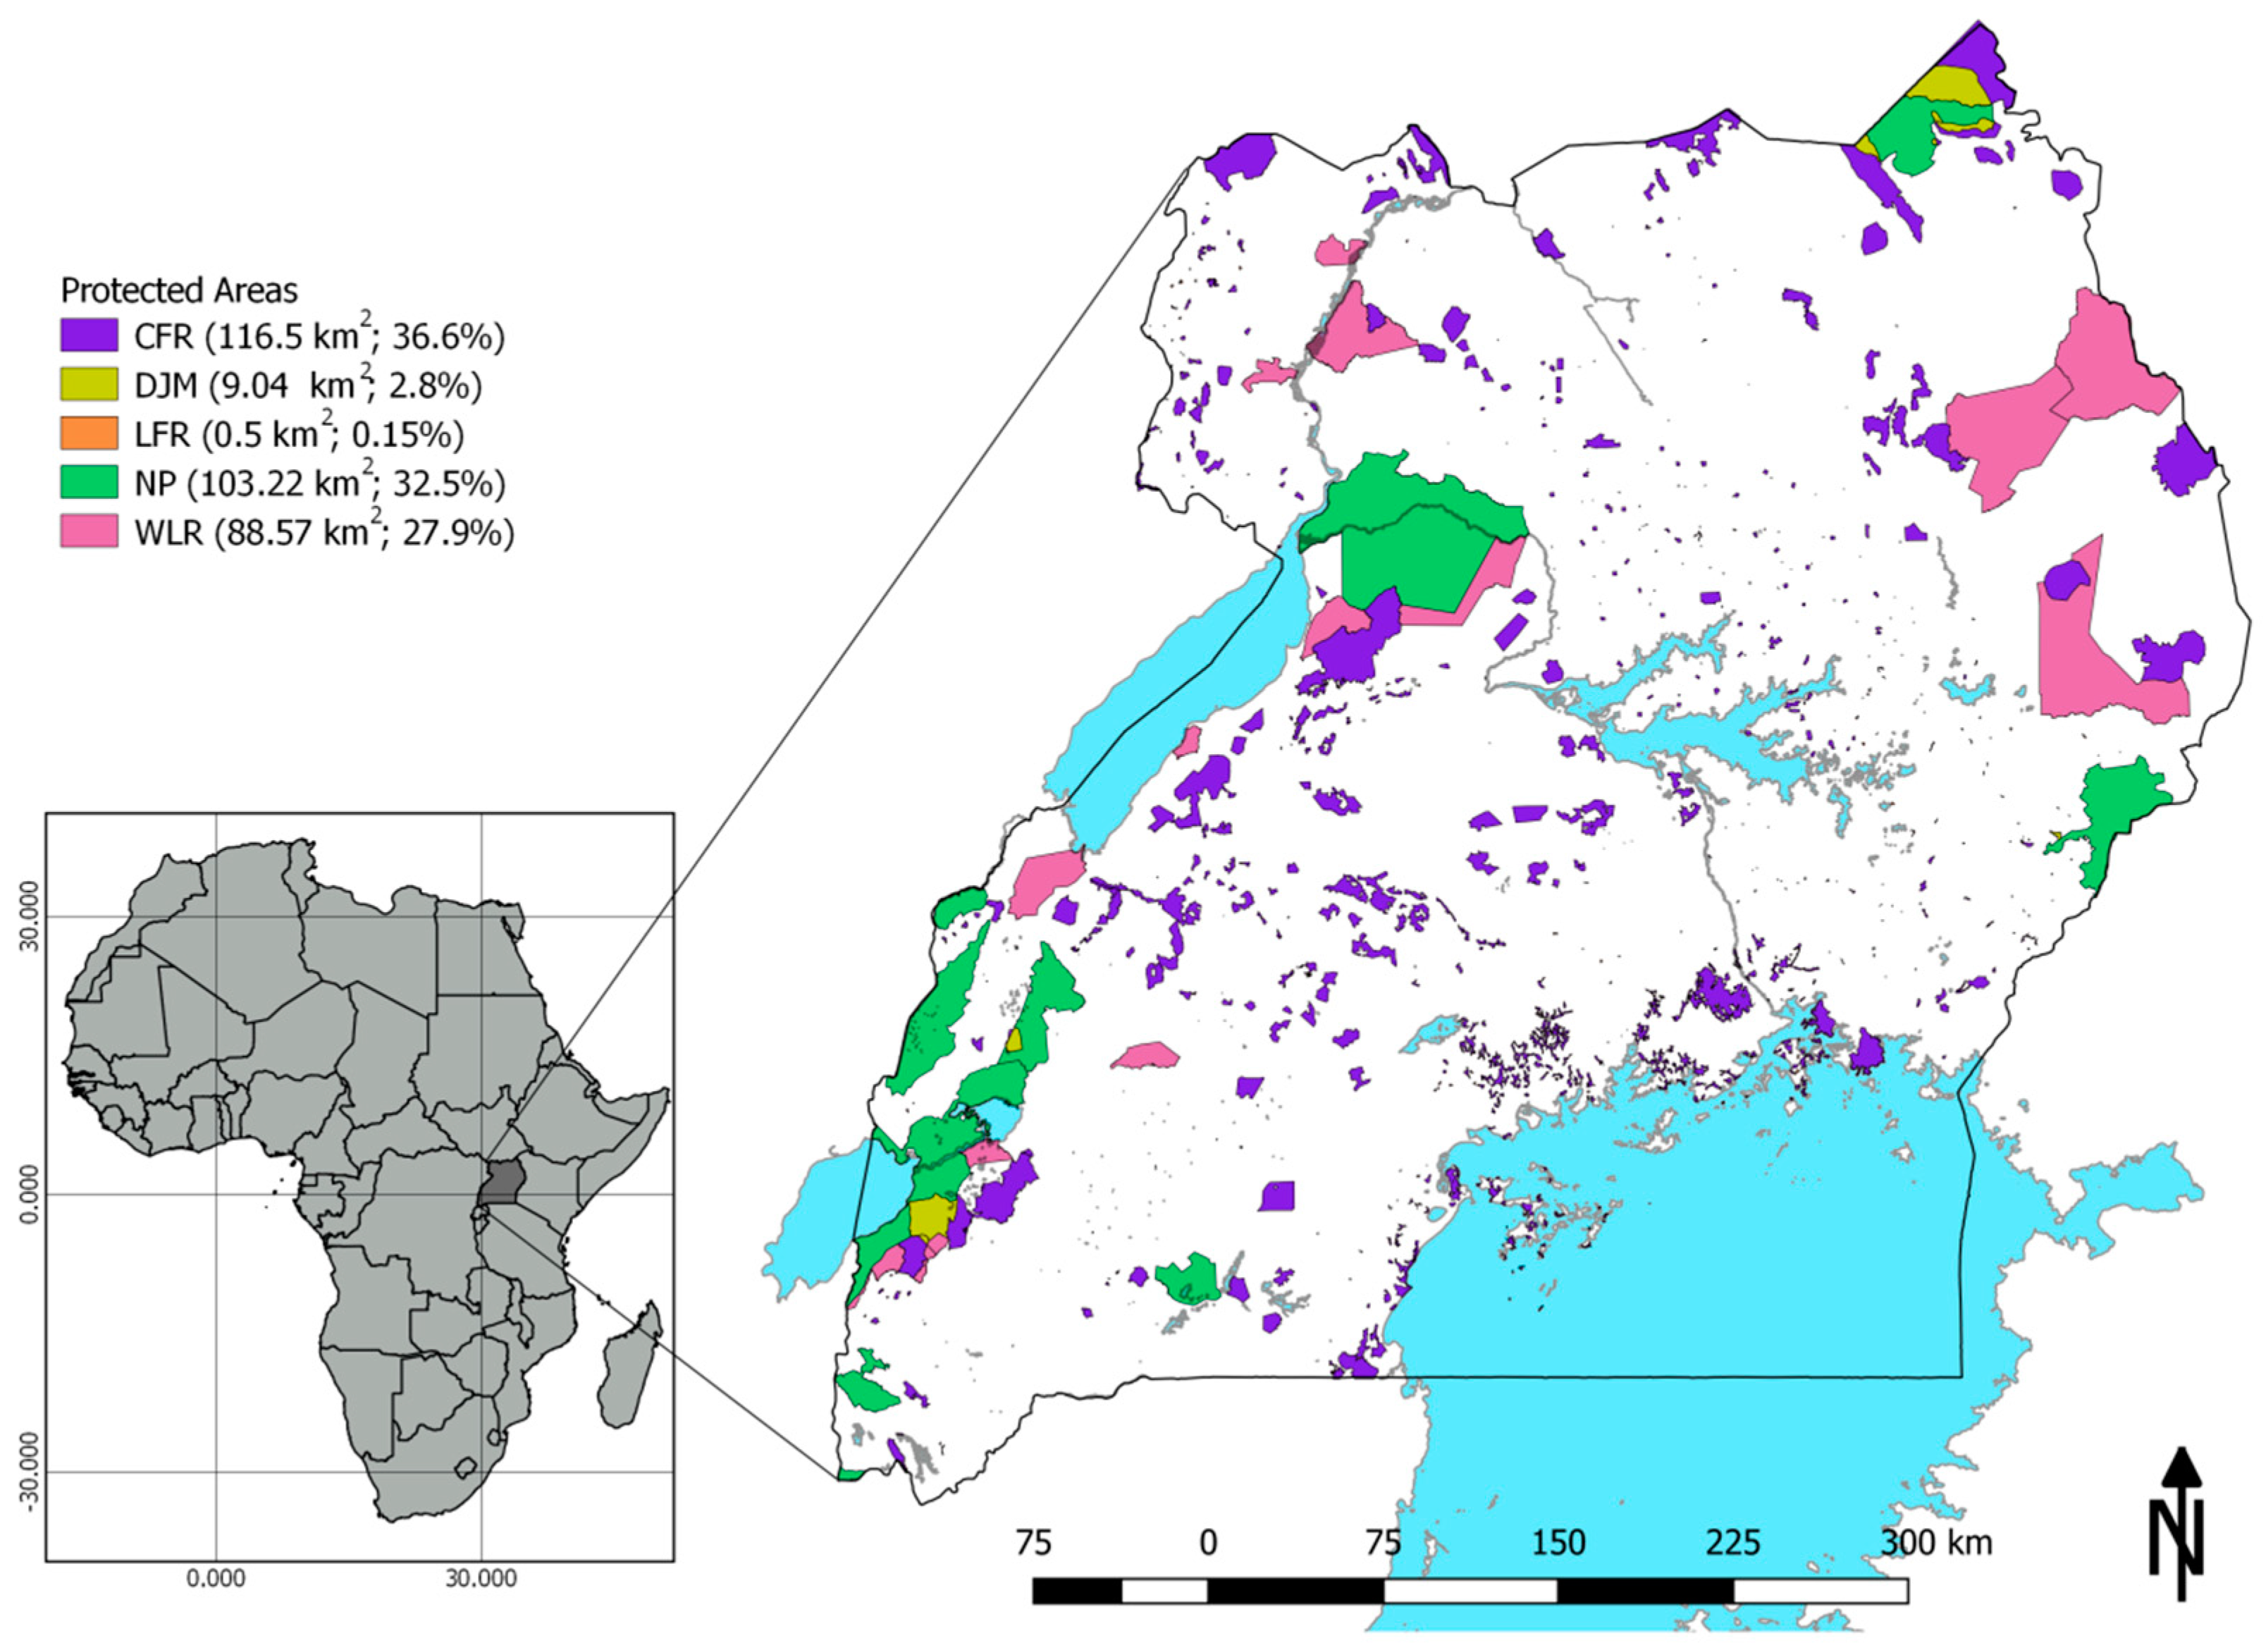
The study covers 722 PAs with a total area of 34,000 km2, and the surrounding buffer zones of each PA. The PAs are grouped into five management categories, based on the managing authorities. These include 493 Central Forest Reserves (CFR), 9 reserved areas under Dual Joint Management (DJM), 191 Local Forest Reserves (LFR), 10 National Parks (NP), and 14 Wild Life Reserves (WLR), (Figure 1). There were, however, nine small PAs (under the CFR management category) located within and around Lake Victoria that were eliminated from the study because carbon gain/loss data were not available. The subsequent analysis thus consists of 713 PAs, all of which were established earlier than the year 2007.
2.2. Data and Method
We obtained data for the location, shape and area of the 713 PAs from the World Resources Institute database, later used by the Ugandan National Forest Authority [13]. We extracted data on 12 years of forest carbon change as the sum of the above-ground and below-ground carbon for all PAs and their buffer zones from a wall-to-wall forest carbon change map of Uganda [30]. Svein et al. [30] estimated the below-ground carbon as 47% of the above-ground carbon, in reference to IPCC guidelines [31]. Unless specified, the forest carbon (the sum of above-ground and below-ground) will be hereafter referred to as carbon. The InSAR height changes were estimated from the SRTM X- and C-band DEMs acquired in year 2000 to a Tandem-X DEM based on acquisitions around 2012. Details of the processing and the product are described in Reference [30]. The wall-to-wall carbon change map had a 30 m spatial resolution, with the carbon change (gain or loss) (t/ha) estimated for each pixel. Carbon change was estimated from changes in the height of the scattering phase center in the forest canopy together with the land cover type. However, carbon gains for each pixel were not attributed to sources, i.e., the carbon map did not identify whether carbon gains for an individual pixel are due to forest growth (forest remaining forest) or due to area expansion (non-forest converted to forest). Similarly, carbon losses for each pixel were not attributed to potential sources, deforestation or forest degradation.
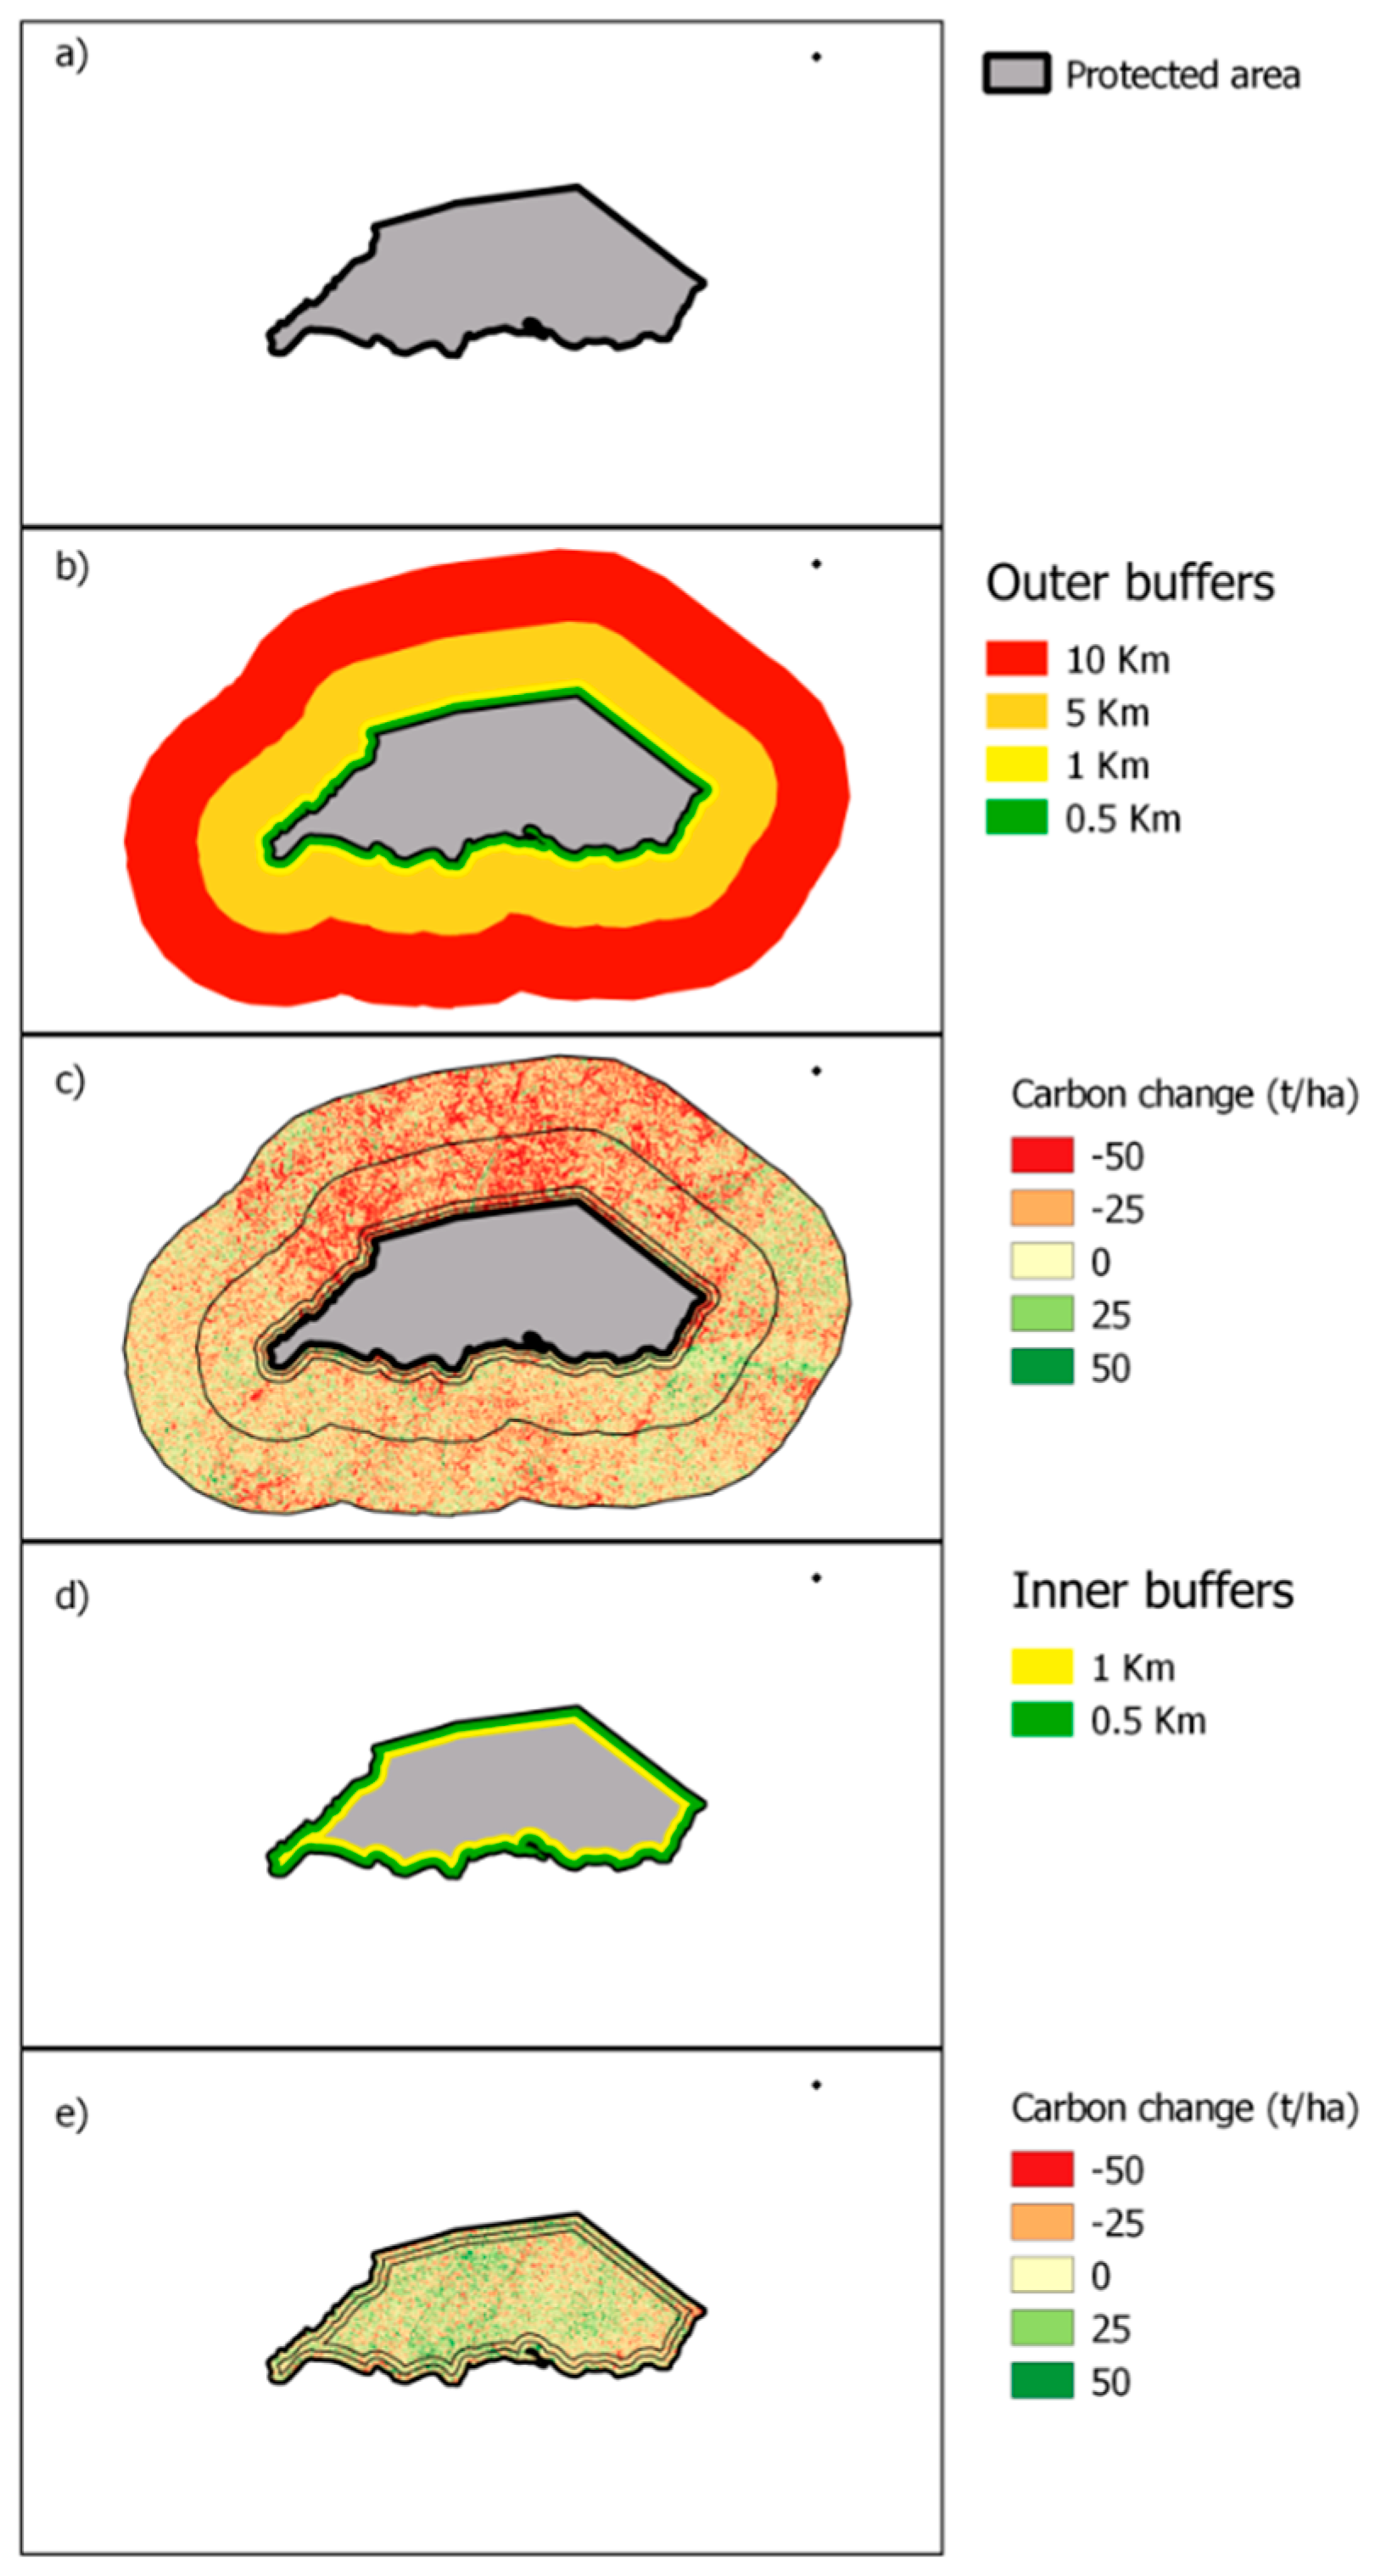
We extracted carbon change data for buffer zones from concentric bands of 0–0.5 km, 0.5–1 km, 1–5 km and 5–10 km surrounding the boundary of each PA. Similarly, mean carbon change was estimated for the same intervals inside the PA boundaries. Figure 2 illustrates the methodology adopted for the construction of the concentric bands, inside and outside PA boundaries, for calculation of mean carbon change. For the construction of the concentric bands in the external buffer zones, areas that fall either on another PA, water bodies, or outside of the territories of Uganda were excluded. For those PAs where the inner buffers were not possible to construct (i.e., size of the PA smaller than the concentric band area), the mean carbon change for that concentric band was estimated as the mean carbon change for the entire PA.
2.3. Statistical Analysis
Carbon change: Total carbon change (gain and loss) of each PA and within each concentric band for the period are estimated as the mean of individual pixel values scaled up to per ha (t/ha) multiplied by the area (ha) of each PA. We used one way analysis of variance (ANOVA) to test for differences in the mean carbon change among the five PA management categories (CFR, DJM, LFR, NP, WLR). Following ANOVA, we used Fisher’s Least Significant Difference (LSD) for a pairwise comparison of the mean carbon change between management categories.
Effectiveness of a PA: Ideally, information on carbon stock before and after establishment of a PA may be appropriate to determine effectiveness of a PA management. Furthermore, effectiveness could be quantitatively measured against the objectives of the establishment of a PA. Information before PA establishment is not available and the purpose of PA establishments is not carbon sequestration or conservation. For this particular analysis, we thus independently defined effectiveness as follows. A PA is “Effective” if carbon has increased or maintained carbon stock during the monitoring period (2000–2012), an approach similar to (e.g., [32]).
Local leakage: A local leakage is when the impact of a protection inside the effective PAs may be associated with significant carbon losses in the surrounding areas [21]. Accordingly, leakage in an effective PA was considered present if the surrounding buffer zones had lost considerable carbon. Statistically, in this study, leakage is evident if the mean differences between the carbon gain inside the boundary of an effective PA and the loss in the corresponding outside buffer zones are significant. To evaluate the possibility of local leakage, we used pairwise t-test by management category comparing the differences in the mean of carbon changes between the internal and the corresponding external concentric bands. Three of the five management categories, DJM, WLR and NP consisted of only a few effective PAs n = 6, n = 8 and n = 5, respectively. Due to a low number of observations in these three cases, the samples cannot be assumed to be normally distributed, in which case the paired t-test may not be robust. Therefore, for these three PA categories, we used the exact Wilcoxon rank-sum test [33], a non-parametric equivalent of the paired t-test.
3. Results
3.1. Carbon Changes in PAs of Uganda
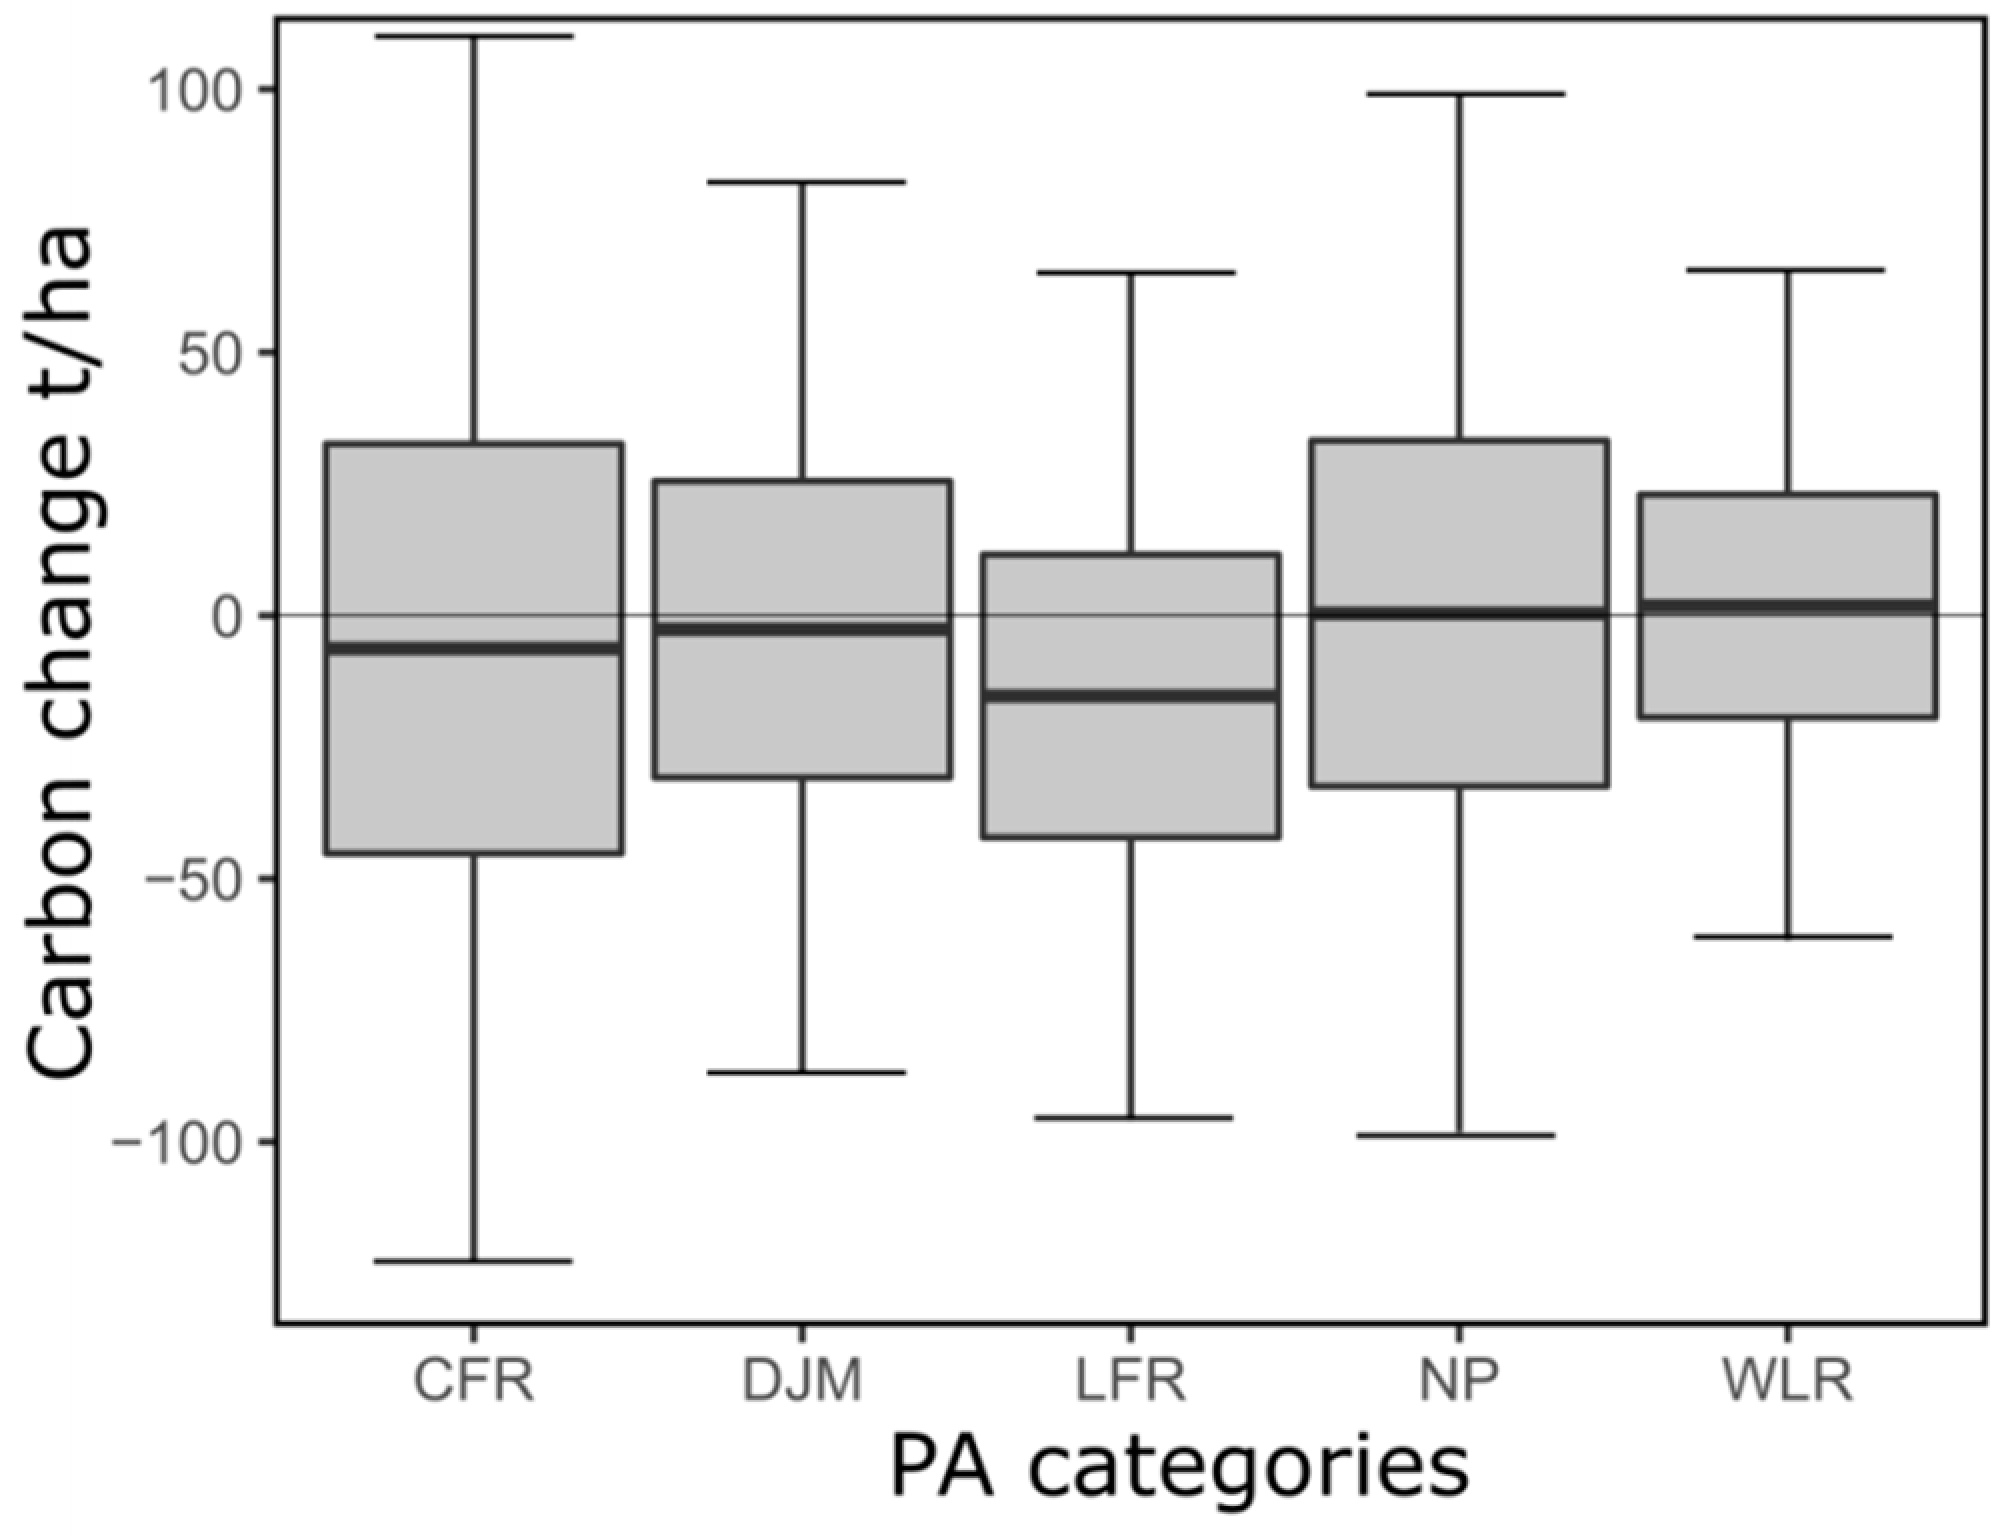
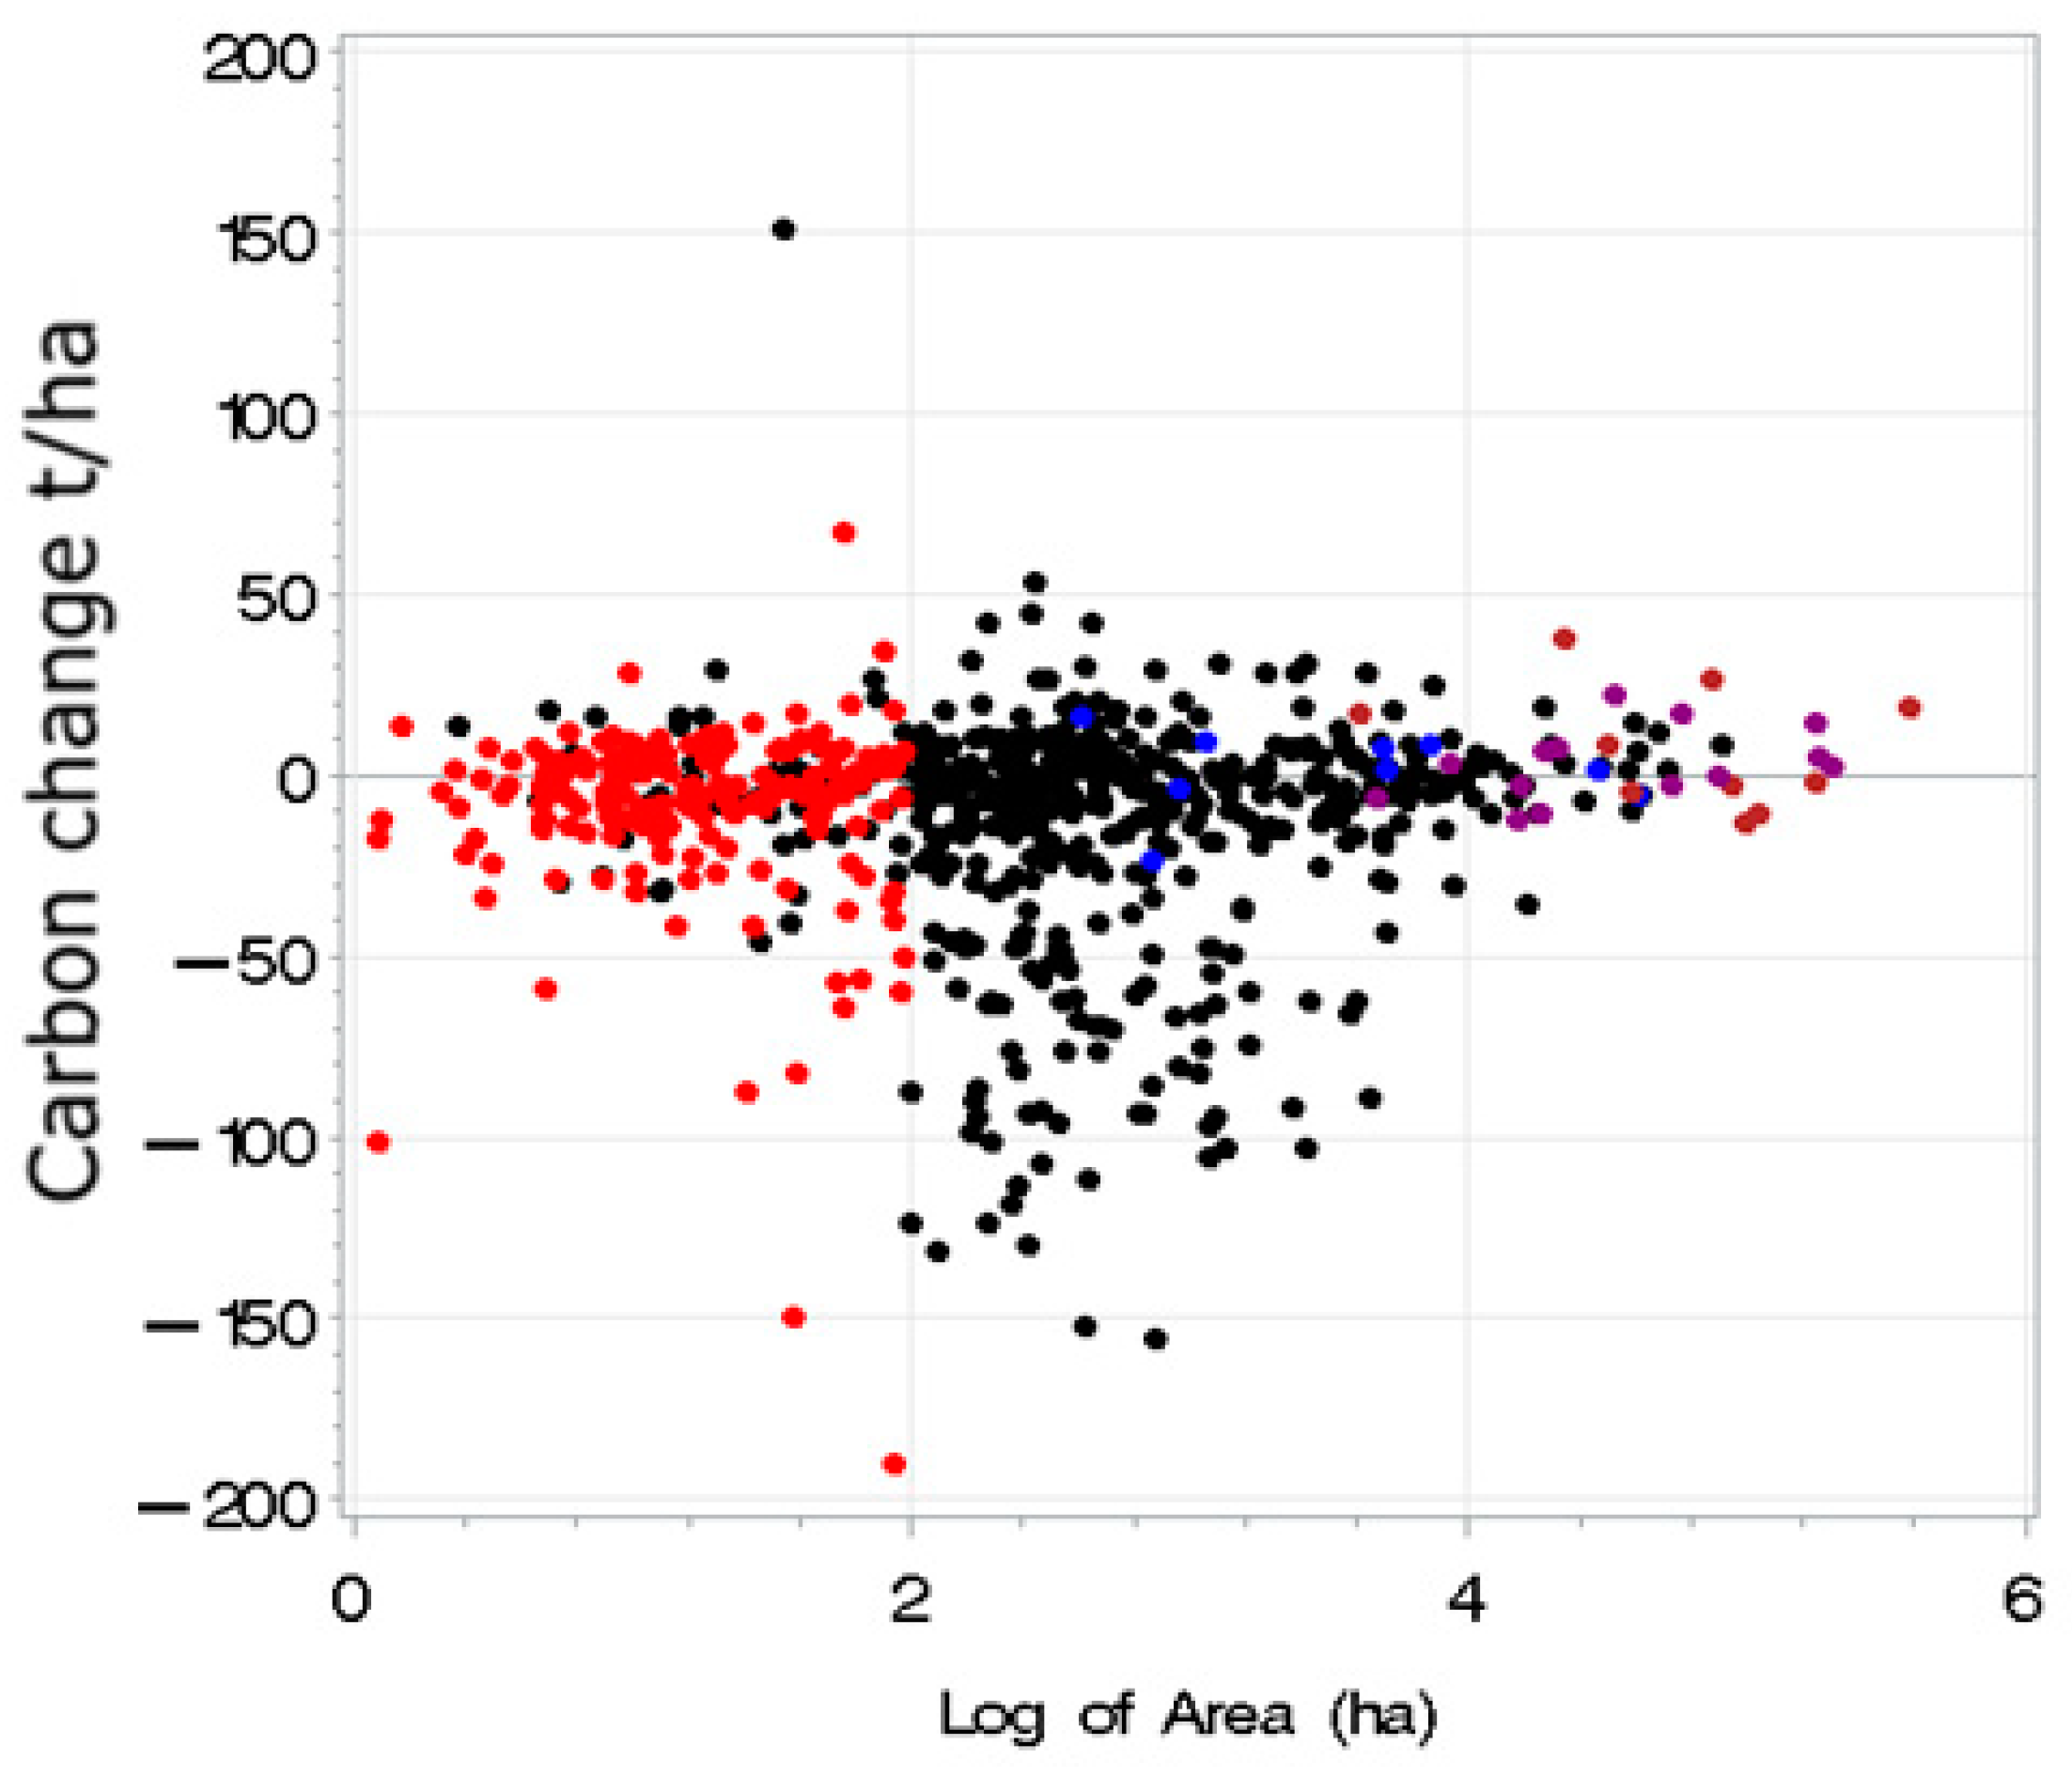
Table 1 summarizes the carbon changes in PAs of Uganda by management categories for the period 2000–2012. Owing to considerable differences in area size of the PAs (1–368,000 ha), we estimated an area-weighted mean annual carbon change. The area-weighted mean annual carbon change in PAs of Uganda for the period 2000–2012 was 0.22 ± 1.36 t/ha, estimated to a total carbon gain of 0.70 megatonnes (Mt) per year. Nevertheless, there is variation among management categories and among PAs within the same management category (Figure 3). With an annual carbon loss and gain ranging from −16 t/ha to 13 t/ha, on average, NPs and WLRs gained carbon, while the CFRs, LFRs and DJMs lost carbon. In terms of numbers of PAs, 63% of the PAs lost carbon during the period and the majority (70%) of these were CFRs. Although, PA area sizes varied considerably, the rate of carbon loss or gain did not appear to depend on PA size (Figure 4).
3.2. Variations in Carbon Changes among Management Categories
The results of ANOVA showed that the mean annual carbon change differed significantly (p = 0.007) among management categories. The LSD test for mean separation (Table 2) showed that the significant differences between management categories in carbon changes is largely due to differences between CFR and the rest of the management categories.
3.3. The Effectiveness of PAs
Effective PAs are those that have had stable or increased carbon during the monitoring period of 12 years (Figure 5, right panel). The characteristics and proportion in terms of numbers and areas of effective and ineffective PAs by management types are shown in Table 3. In terms of numbers of PAs, 263 PAs, (37% of total) were effective, and the majority of these are CFRs. In terms of area, however, effective PAs constitute 60% of the total PA area in Uganda, dominated by the management types WLR and NP (Table 3).
3.4. Local Leakage
We investigated local leakage for those effective PAs, namely PAs with net carbon gain inside their boundaries, and compared them with the net carbon losses detected in their corresponding external buffer zones (examples, Figure 6 and Figure 7). In all management categories, the external buffer zones of the effective PAs showed carbon losses (Table 4). Paired t-tests comparing corresponding internal and external concentric bands (0.5–10 km) for LFR and CFR showed significant differences (p < 0.01). This suggested a marked contrast between rates of changes in protected and unprotected areas just outside the boundaries of forest reserves, providing evidence of local leakage. The buffer zones of effective NP and WLR (e.g., Figure 6) have also shown carbon losses. For NP, mean differences are large, although not statistically significant (p > 0.05) (Table 4). On the contrary, those “ineffective” PAs, dominated by CFR (n = 333) and LFR (n = 128), lost as high as or even more carbon per unit area than their corresponding external buffer zones. Google Earth images for selected PAs were used to show the current status of selected PAs and extracts of Global Forest Watch forest cover change maps to show trends during the same period (Figure 6 and Figure 7).
4. Discussion
4.1. Carbon Gain and Loss in PAs of Uganda
The estimated net carbon gain per annum of 0.22 t/ha, totaling 0.70 Mt, contrasts with the annual forest carbon loss of 1.4 Mt for the entire Uganda, estimated from the same data [30], and a total annual carbon loss of 8.05 Mt estimated from forest areas excluding PAs [13]. This may suggest PAs in Uganda might have contributed to mitigations of carbon emissions during the period of 2000–2012, and that protection actually played an emission reduction role. Nevertheless, the wide range in annual carbon loss and gain (−16 to 13 t/ha) and also that only 37% of the PAs have gained carbon during the period, show that all PAs are not in a similar protection status. These suggest that the successes of PAs in terms of carbon conservation in Uganda are generally mixed. This is consistent with the results of a number of recent studies in rainforest areas and regions with a large number of protected area networks where protection produced mixed outcomes in terms of forest loss and gain [2,3,5,35,36,37]. The uncertainty of these estimates is dependent on the uncertainty arising from data, models and methodology as described in Reference [30]. Future research should therefore quantify such effects of the uncertainty that arise from the data and methodology.
At the level of protection categories, on average, forest reserves (CFR and LFR) lost carbon while National parks and wildlife reserves have gained carbon during the monitoring period. On a PA by PA basis, and in terms of absolute carbon gain and loss, it is perhaps not surprising to find forest reserves at the top since forest reserves are located in areas of high carbon density and that each unit of deforested area translates into high carbon loss. Yet, LFR and CFR as a major source of carbon loss are an indication to the ineffectiveness of the PA management in high carbon forest areas in Uganda. This is consistent with earlier studies in East Africa, including Uganda [32], which suggest that the other protection categories performed poorly as compared to national parks. MoWE [13] also reported that forest loss had been highest in forest reserves and almost nonexistent in wildlife reserves and national parks. The latter may have better protection than forest reserves, most likely because they benefited from tourism revenues that could be used to support and strengthen forest protections. Furthermore, some national parks and wildlife reserves had often been under “hard-edged fortress features” [38], following more strict protection denying any human access. Yet, the notion that forest loss is almost nonexistent in wildlife areas [13] is not supported by this study, because in the current study, 43% of the WLR and 50% of NP (see Table 3) have exhibited a net carbon loss during the period. These constitute about 55% of the total area of PAs that have lost carbon, showing protection being only partially “effective”.
The drivers of deforestation and forest degradation within and outside the PA territories are complex and require more detailed scrutiny, particularly from the context of natural resources governance structure in Uganda, land tenure, and the socio-economic contexts within which the PAs are being managed. There exist a number of evidences suggesting that PA management in Uganda is inefficient in forest conservation. For instance [8], about a third of all forests within the PAs of Mt. Elgon have been cleared between 1973–2013. The National Forest Authority of Uganda [13] also indicated that since recently, the threat against protected forests is greater than ever. The observed carbon losses are most likely attributed to lack of, or poor governance to manage an external pressure associated with the increasing human population in the country, where forest lands tend to serve as a source of new agricultural lands, and natural forests continue to be the single most important source of fuel wood and charcoal for household energy.
4.2. Prevalence of Local Leakage
A long history of forest conservation in Uganda has led to the establishment of a large number of PAs, typically housing the last remaining tropical rainforest and woodlands of biodiversity hotspots designated as forest reserves [11]. In terms of biodiversity conservation, this success may remain, but in terms of carbon conservation, the current study presented mixed results, with the majority (63%) of the PAs being ineffective. On the other hand, the remaining 37% of the PAs, 50% in terms of land area of all PAs, have gained carbon. Nevertheless, the carbon gain in those effective PAs, particularly that of CFR and LFR, contrasted strongly with the carbon losses in their buffer zones, indicating the prevalence of leakage. This evidence suggest that PAs, especially the forest reserves, regardless of PA size, are under pressure from manmade activities outside their territories, and these activities resulted in increasingly fragmented small-sized forest reserves that are increasingly surrounded by highly deforested and degraded landscapes. This further means that fortress type protection just inside PA boundaries might have caused clearing to concentrate just outside protected areas, making the overall net effect of protection uncertain. Other regional studies in East Africa [32], and also globally [39], have reported that human pressure is increasing faster and more forests are being lost in areas surrounding PAs.
We are aware that PAs are often established purposely in dense forests, higher elevations, steeper slopes or long distances to roads and settlements, particularly those that have been established many years ago. Our comparison of carbon changes inside of the boundaries with that of the corresponding buffer zones did not take into account the possible differences in land characteristics and possible biases of locations during establishment of PAs. Nevertheless, our personal experiences and recent observations of some selected PAs and discussions with forest authorities in Uganda suggest that due to high population growth and expansion in the surrounding landscapes, there are few PAs if any that are out of the reach of human activities. This is particularly so in Uganda, one of the most densely populated countries in sub-Saharan Africa. Most PAs in Uganda are characterized by high fragmentation and are surrounded by settlements and infrastructure as well as deforested agricultural landscapes [40]. Further evidence from the surroundings of Kibale national park [41], shows that with a decade of increasing human population near buffer zones of protected areas, neighboring communal forest patches were reduced by half, although the forest cover within the boundaries of the protected areas were maintained. It is thus more likely that protected areas could be under pressure from deforestation and forest degradation, and thus face increasing fragmentation and isolation.
4.3. Implications to the Climate Benefits of Conservation
Forest protection in Uganda has historically been intended, primarily, for habitat and biodiversity conservation. Nevertheless, an increased focus on emissions reductions from the forest sector, in the context of climate change, provided an additional opportunity for protected areas, recognizing conservation as one of the five activities of REDD+ [17]. This study provided the first quantitative assessment of carbon changes most likely due to pressures such as deforestation and forest degradation, and protection leading to forest growth, across all PA management categories in Uganda. Such knowledge will contribute to understanding the climate change mitigation potentials of PAs and the effects of protection on the unprotected neighboring landscapes.
The net carbon gain estimated from PAs in Uganda, may suggest that PAs remain effective policy tools to reduce carbon emissions. Nevertheless, a large number and size of PAs in Uganda have lost a substantial amount of carbon. Most of the carbon rich PAs designated as forest reserves (CFR and LFR) appeared either ineffective or are associated with local leakage, when effective. Therefore, whether PAs in Uganda have been effective at conserving carbon remain inconclusive, making the climate benefits of PAs uncertain.
Lack of field measurements for the monitoring period or lack of other comparable estimates limit quantitative validation. However, visual comparisons using Google Earth images and Global Forest Watch products (e.g., Figure 6 and Figure 7), in support of our results, show that many PAs in Uganda are highly threatened. Future studies including field inventory data and history of PA management, might improve the reliability of the present estimates in carbon changes inside PAs and their buffer zones. Moreover, a number of factors could be responsible as agents or the drivers of deforestation and forest degradation, undermining the carbon benefits of conservation. This study, if augmented with an investigation of the drivers of forest changes, may serve to inform conservation or policy-level decisions, for instance, the opportunities that PAs may offer for achieving nationally determined contributions (NDCs) through mechanisms such as REDD+.
Because of the large number and large area coverage of PAs, Uganda can benefit in climate actions through: (a) effective protection to enhance forest carbon and reduction of emissions from deforestation and forest degradation in forest reserves that are losing carbon within their boundaries, and (b) improvements in protection strategies of those effective PAs, where carbon is gained within boundaries but lost through leakage in their buffer zones. Both cases require the need to consider the landscapes and communities surrounding PAs, avoiding the pitfalls of the current management in which most of the forest reserves appear as islands surrounded by deforested or degraded landscapes.
Protection is particularly challenging in countries such as Uganda with an already dense and rapidly growing human population, where forests are the single most important sources of household energy, and forest lands the last remaining fertile lands available for agricultural expansion. Mechanisms such as REDD+ may provide an additional incentive for the respective authorities and to the local communities to conserve the last remaining forests and initiate restoration of deforested or degraded landscapes in the vicinities of PAs. Conservation of PAs should, therefore, be combined with activities in the buffer zones such as (a) restoration, for instance through community woodlots for sustainable supply of wood fuel and charcoal; (b) promoting agroforestry where feasible, to improve productivity of farmlands to halt expansion into protected areas; and (c) designing mechanisms for the neighborhood communities on the carbon benefit sharing from conservation of PAs and to initiate actions to enhance carbon stock in the surrounding landscapes.
5. Conclusions
This study analyzed the carbon conservation benefits of PAs in Uganda in terms of carbon change inside PA territories, and carbon losses as leakage outside of PA territories. Such analysis may support policy makers to better understand the impacts of human activities on protected areas and guide protection of PAs for climate-related benefits. A large number and size of PAs and buffer zones in Uganda exhibited carbon losses. In particular, the protection approach of some of the carbon-rich forest reserves appeared either ineffective or is associated with local leakage. The observed carbon losses in many of the carbon rich PAs, such as tropical forest reserves, questions whether PA management approaches have been effective. Respective authorities may need to assess the current management approaches and design a ‘win-win’ strategy for the PAs, while considering the landscapes and communities surrounding the PAs. On the other hand, the net carbon gain from a sizeable number of PAs, particularly the national parks, suggests that protection remains one of the most effective policy tools to reduce forest loss or promote forest carbon gain in addition to protecting valuable landscapes and biodiversity. A more confident recommendation that would directly support PA managers and stakeholders to adopt policies that help mitigate forest loss and promote forest growth can be made by augmenting this study with investigation of the drivers of deforestation and forest degradation within and outside PA boundaries.
Author Contributions
B.G.: Conceptualization, Methodology, Formal Analysis; Investigation, Writing—Original Draft Preparation, Writing—Review & Editing. S.S.: Data Curation, methodology, writing Review and Editing S.P.: Methodology, data curation, validation, writing review and Editing.
Funding
This research received no external funding.
Acknowledgments
Norwegian Institute of Bioeconomy Research (NIBIO) supported this research. Authors acknowledge the comments and reviews (on an earlier version) of four anonymous reviewers, which greatly improved the manuscript.
Conflicts of Interest
The authors declare no conflict of interest.
References
- Spracklen, B.D.; Kalamandeen, M.; Galbraith, D.; Gloor, E.; Spracklen, D.V. A Global Analysis of Deforestation in Moist Tropical Forest Protected Areas. PLoS ONE 2015, 10, e0143886. [Google Scholar] [CrossRef] [PubMed]
- Pfaff, A.; Robalino, J.; Herrera, D.; Sandoval, C. Protected Areas’ Impacts on Brazilian Amazon Deforestation: Examining Conservation-Development Interactions to Inform Planning. PLoS ONE 2015, 10, e0129460. [Google Scholar] [CrossRef] [PubMed]
- Forrest, J.L.; Mascia, M.B.; Pailler, S.; Abidin, S.Z.; Araujo, M.D.; Krithivasan, R.; Riveros, J.C. Tropical Deforestation and Carbon Emissions from Protected Area Downgrading, Downsizing, and Degazettement (PADDD). Conserv. Lett. 2015, 8, 153–161. [Google Scholar] [CrossRef]
- Collins, M.B.; Mitchard, E.T.A. A small subset of protected areas are a highly significant source of carbon emissions. Sci. Rep. 2017, 7, 41902. [Google Scholar] [CrossRef] [PubMed] [Green Version]
- Blankespoor, B.; Dasgupta, S.; Wheeler, D. Protected areas and deforestation: New results from high-resolution panel data. Nat. Resour. Forum 2017, 41, 55–68. [Google Scholar] [CrossRef]
- UN. Convention on Biological Diveristy. 1992. Available online: https://www.cbd.int/doc/legal/cbd-en.pdf (accessed on 28 June 2017).
- UNEP-WCMC. Protected Area Profile for Uganda from the World Database of Protected Areas. June 2017. Available online: www.protectedplanet.net (accessed on 3 November 2017).
- Petursson, J.G.; Vedeld, P.; Sassen, M. An institutional analysis of deforestation processes in protected areas: The case of the transboundary Mt. Elgon, Uganda and Kenya. For. Policy Econ. 2013, 26, 22–33. [Google Scholar] [CrossRef]
- Hutton, J.; Adams, W.; Murombedzi, J. Back to the barriers? Changing narratives in biodiversity conservation. Forum Dev. Stud. 2005, 32, 341–370. [Google Scholar] [CrossRef]
- UNEP. Protected Planet Report 2014. Tracking Progress Towards Global Targets for Protected Areas. 2014. Available online: http://wedocs.unep.org/handle/20.500.11822/9280 (accessed on 3 November 2017).
- Howard, P.C.; Davenport, T.R.B.; Kigenyi, F.W.; Viskanic, P.; Baltzer, M.C.; Dickinson, C.J.; Lwanga, J.; Matthews, R.A.; Mupada, E. Protected area planning in the tropics: Uganda’s national system of forest nature reserves. Conserv. Biol. 2000, 14, 858–875. [Google Scholar] [CrossRef]
- IUCN. World Database on Protected Areas. 2014. Available online: https://protectedplanet.net/c/world-database-on-protected-areas (accessed on 28 June 2017).
- MoWE. Proposed Forest Reference Level for Uganda. Republic of Uganda Ministry of Water and Environment. 2017. Available online: http://redd.unfccc.int/files/uganda_frel_final_version_16.01.pdf (accessed on 23 August 2017).
- Barrow, E.; Gichohi, H.; Infield, M. Rhetoric or Reality? A Review of Community Conservation Policy and Practice in East Africa. 2000. Available online: https://www.cabdirect.org/cabdirect/abstract/20023074367 (accessed on 15 October 2018).
- UWA. The Uganda Wildlife Act. Chapter 200. 2018. Available online: http://www.ugandawildlife.org/about-us/uganda-wildlife-act (accessed on 15 October 2018).
- Blomley, T.; Namara, A.; McNeilage, A.; Franks, P.; Rainer, H.; Donaldson, A.; Malpas, R.; Olupot, W.; Baker, J.; Sandbrook, C.; et al. Development and Gorillas? Assessing Fifteen Years of Integrated Conservation and Development in South-Western Uganda; Natural Resource Issues No. 23; IIED: London, UK, 2010. [Google Scholar]
- UNFCCC. Adoption of the Paris Agreement. Draft decision -/CP.21. Conference of the Parties Twenty-first session Paris, 30 November to 11 December 2015. 2015. Available online: http://unfccc.int/resource/docs/2015/cop21/eng/l09.pdf (accessed on 29 December 2015).
- UNFCCC. Decision 2/CP. 13: Reducing Emissions from Deforestation in Developing Countries: Approaches to Stimulate Action. United Nations Framework Convention on Climate Chgange, Bonn, Germany. 2007. Available online: http://unfccc.int/resource/docs/2007/cop13/eng/06a01.pdf (accessed on 19 September 2014).
- Atmadja, S.; Verchot, L. A review of the state of research, policies and strategies in addressing leakage from reducing emissions from deforestation and forest degradation (REDD plus). Mitig. Adapt. Strat. Glob. Chang. 2012, 17, 311–336. [Google Scholar] [CrossRef]
- Watson, R.T.; Bolin, B.N.I. (Eds.) Land Use, Land-Use Change, and Forestry: A Special Report of the Intergovernmental Panel on Climate Change; Cambridge University Press: Cambridge, UK, 2000. [Google Scholar]
- Ewers, R.M.; Rodrigues, A.S.L. Estimates of reserve effectiveness are confounded by leakage. Trends Ecol. Evol. 2008, 23, 113–116. [Google Scholar] [CrossRef] [PubMed]
- Wittemyer, G.; Elsen, P.; Bean, W.T.; Burton, A.C.; Brashares, J.S. Accelerated human population growth at protected area edges. Science 2008, 321, 123–126. [Google Scholar] [CrossRef] [PubMed]
- Vuohelainen, A.J.; Coad, L.; Marthews, T.R.; Malhi, Y.; Killeen, T.J. The Effectiveness of Contrasting Protected Areas in Preventing Deforestation in Madre de Dios, Peru. Environ. Manag. 2012, 50, 645–663. [Google Scholar] [CrossRef] [PubMed]
- Oestreicher, J.S.; Benessaiah, K.; Ruiz-Jaen, M.C.; Sloan, S.; Turner, K.; Pelletier, J.; Guay, B.; Clark, K.E.; Roche, D.G.; Meiners, M.; et al. Avoiding deforestation in Panamanian protected areas: An analysis of protection effectiveness and implications for reducing emissions from deforestation and forest degradation. Glob. Environ. Chang. Hum. Policy Dimens. 2009, 19, 279–291. [Google Scholar] [CrossRef]
- Jusys, T. Quantifying avoided deforestation in Para: Protected areas, buffer zones and edge effects. J. Nat. Conserv. 2016, 33, 10–17. [Google Scholar] [CrossRef]
- MoWE. Ministry Of Water and Environment. Uganda’s Intended Nationally Determind Contribution (INDC). 2015. Available online: http://www4.unfccc.int/ndcregistry/PublishedDocuments/Uganda%20First/INDC%20Uganda%20final%20%2014%20October%20%202015.pdf (accessed on 13 November 2017).
- Olupot, W.; Mugabe, H.; Plumptre, A.J. Species conservation on human-dominated landscapes: The case of crowned crane breeding and distribution outside protected areas in Uganda. Afr. J. Ecol. 2010, 48, 119–125. [Google Scholar] [CrossRef]
- Nakakaawa, C.; Moll, R.; Vedeld, P.; Sjaastad, E.; Cavanagh, J. Collaborative resource management and rural livelihoods around protected areas: A case study of Mount Elgon National Park, Uganda. For. Policy Econ. 2015, 57, 1–11. [Google Scholar] [CrossRef]
- MacKenzie, C.A.; Salerno, J.; Hartter, J.; Chapman, C.A.; Reyna, R.; Tumusiime, D.M.; Drake, M. Changing perceptions of protected area benefits and problems around Kibale National Park, Uganda. J. Environ. Manag. 2017, 200, 217–228. [Google Scholar] [CrossRef] [PubMed]
- Solberg, S.; May, J.; Bogren, W.; Breidenbach, J.; Torp, T.; Gizachew, B. Interferometric SAR DEMs for Forest Change in Uganda 2000–2012. Remote Sens. 2018, 10, 228. [Google Scholar] [CrossRef]
- IPCC. Guidelines for National Greenhouse Gas Inventories–Volume 4–Agriculture, Forestry and Other Land Use; Institute for Global Environmental Strategies; IPCC: Hayama, Japan, 2006. [Google Scholar]
- Pfeifer, M.; Burgess, N.D.; Swetnam, R.D.; Platts, P.J.; Willcock, S.; Marchant, R. Protected Areas: Mixed Success in Conserving East Africa’s Evergreen Forests. PLoS ONE 2012, 7, 0039337. [Google Scholar] [CrossRef] [PubMed]
- Lam, F.C.; Longnecker, M.T. A Modified Wilcoxon Rank Sum Test for Paired Data. Biometrika 1983, 70, 510–513. [Google Scholar] [CrossRef]
- Hansen, M.C.; Potapov, P.V.; Moore, R.; Hancher, M.; Turubanova, S.A.; Tyukavina, A.; Thau, D.; Stehman, S.V.; Goetz, S.J.; Loveland, T.R.; et al. High-Resolution Global Maps of 21st-Century Forest Cover Change. Science 2013, 342, 850–853. [Google Scholar] [CrossRef] [PubMed]
- Rodriguez, N.; Armenteras, D.; Retana, J. Effectiveness of protected areas in the Colombian Andes: Deforestation, fire and land-use changes. Reg. Environ. Chang. 2013, 13, 423–435. [Google Scholar] [CrossRef]
- Eklund, J.; Blanchet, F.G.; Nyman, J.; Rocha, R.; Virtanen, T.; Cabeza, M. Contrasting spatial and temporal trends of protected area effectiveness in mitigating deforestation in Madagascar. Biol. Conserv. 2016, 203, 290–297. [Google Scholar] [CrossRef]
- Cuenca, P.; Arriagada, R.; Echeverria, C. How much deforestation do protected areas avoid in tropical Andean landscapes? Environ. Sci. Policy 2016, 56, 56–66. [Google Scholar] [CrossRef]
- Hartter, J.; Goldman, A. Local responses to a forest park in western Uganda: Alternate narratives on fortress conservation. Oryx 2011, 45, 60–68. [Google Scholar] [CrossRef]
- Allan, J.R.; Venter, O.; Maxwell, S.; Bertzky, B.; Jones, K.; Shi, Y.; Watson, J.E.M. Recent increases in human pressure and forest loss threaten many Natural World Heritage Sites. Biol. Conserv. 2017, 206, 47–55. [Google Scholar] [CrossRef]
- Salerno, J.; Chapman, C.A.; Diem, J.E.; Dowhaniuk, N.; Goldman, A.; MacKenzie, C.A.; Omeja, P.A.; Palace, M.W.; Reyna-Hurtado, R.; Ryan, S.J.; et al. Park isolation in anthropogenic landscapes: Land change and livelihoods at park boundaries in the African Albertine Rift. Reg. Environ. Chang. 2018, 18, 913–928. [Google Scholar] [CrossRef]
- Naughton-Treves, L.; Alix-Garcia, J.; Chapman, C.A. Lessons about parks and poverty from a decade of forest loss and economic growth around Kibale National Park, Uganda. Proc. Natl. Acad. Sci. USA 2011, 108, 13919–13924. [Google Scholar] [CrossRef] [PubMed] [Green Version]
Figure 1.
Location of Uganda in Africa, and protected areas (PAs) by management categories. The different colors (except the blue which are water bodies) represent management categories, namely: Central Forest Reserves (CFR), Dual Joint Management (DJM), Local Forest Reserves (LFR), National Parks (NP), and Wild Life Reserves (WLR). In parenthesis of the legend are the values of total area (km2) and area as percentage of the total protected area (%).

Figure 2.
Schematic representation of the methodology adopted for constructing concentric bands of 0–0.5 km, 0.5–1 km, 1–5 km, and 5–10 km within and the outer buffers of PAs for estimating mean carbon change.
Figure 2.
Schematic representation of the methodology adopted for constructing concentric bands of 0–0.5 km, 0.5–1 km, 1–5 km, and 5–10 km within and the outer buffers of PAs for estimating mean carbon change.

Figure 3.
Area-weighted mean (dark horizontal lines of each box) of carbon change (t/ha) (2000–2012) of the five management categories. The upper and lower limits of the boxes are the 75th and 25th percentile, respectively, while that of the whiskers is the maximum and minimum values excluding outliers.

Figure 4.
Carbon change (loss and gain) during 2000–2012 against the log of PA size. Each scattered dot represents a PA (n = 713), and management categories (red = LFR; black = CFR; blue = DJM; purple = WLR and brown = NP).
Figure 4.
Carbon change (loss and gain) during 2000–2012 against the log of PA size. Each scattered dot represents a PA (n = 713), and management categories (red = LFR; black = CFR; blue = DJM; purple = WLR and brown = NP).

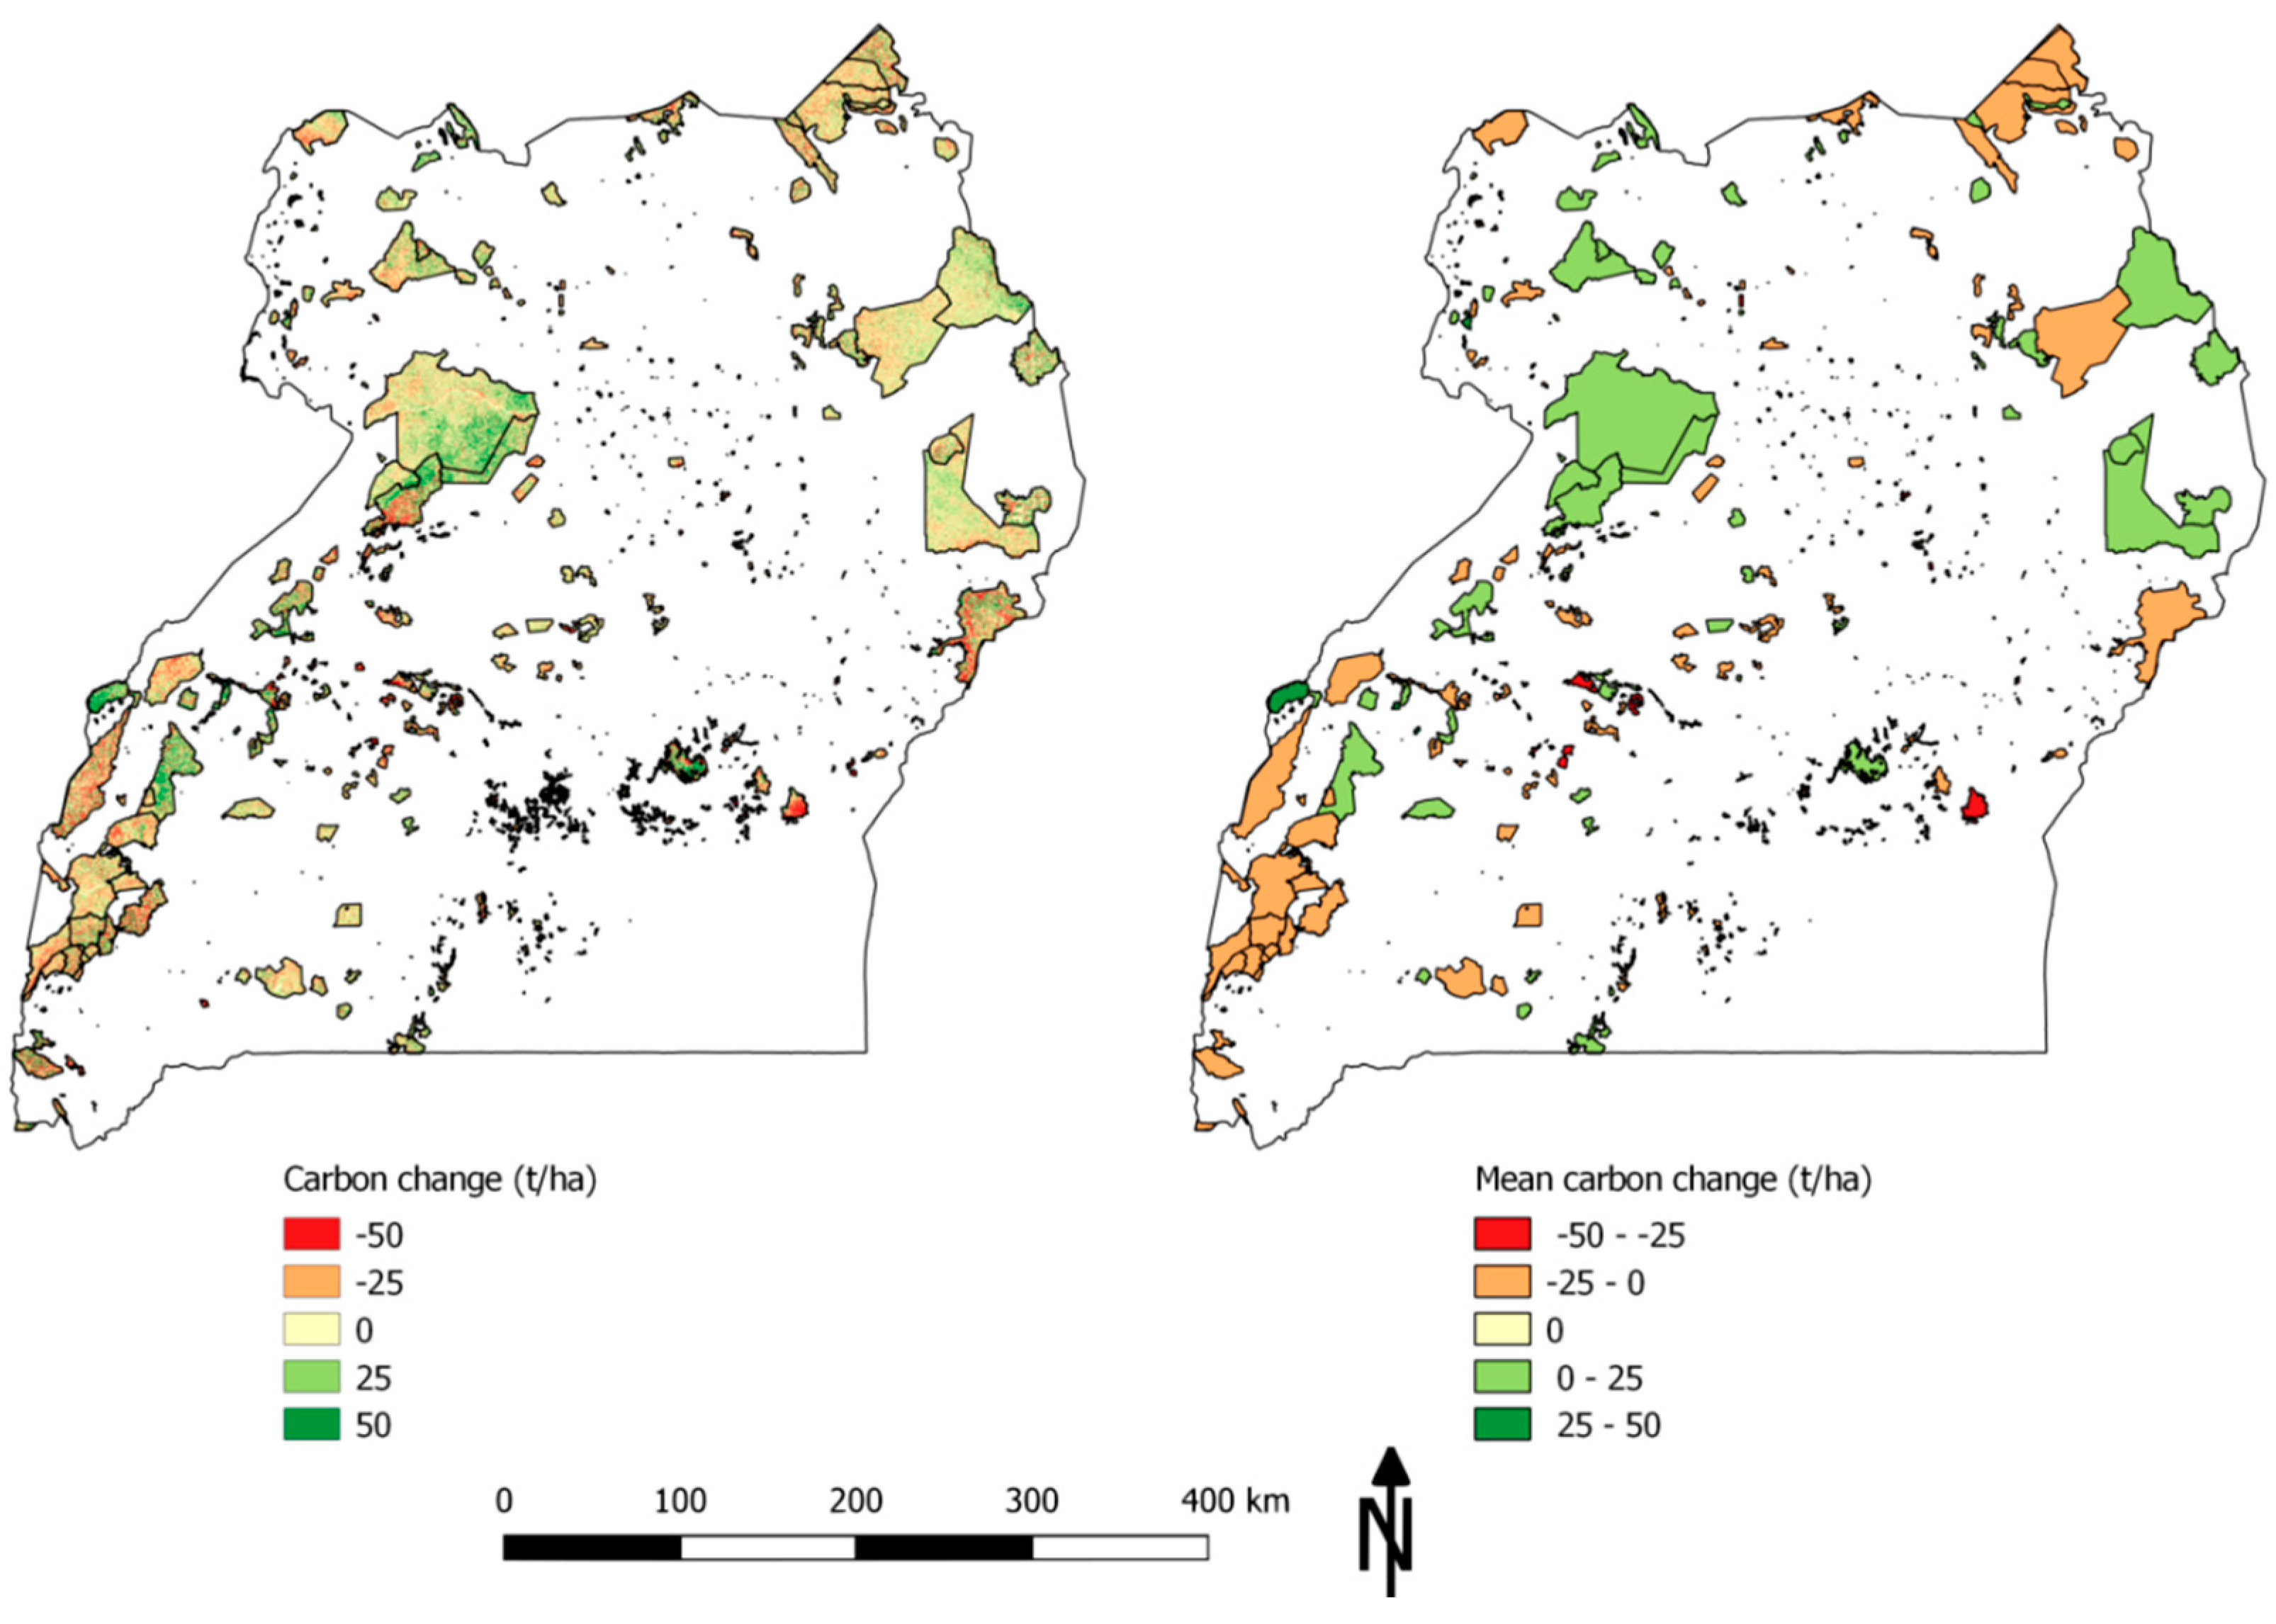
Figure 5.
Carbon gain and loss range (green–red, respectively) in PAs of Uganda, (left panel). In the right panel, effective PAs (green), gained or maintained carbon; and ineffective PAs (orange and red), lost carbon during the period 2000–2012.
Figure 5.
Carbon gain and loss range (green–red, respectively) in PAs of Uganda, (left panel). In the right panel, effective PAs (green), gained or maintained carbon; and ineffective PAs (orange and red), lost carbon during the period 2000–2012.

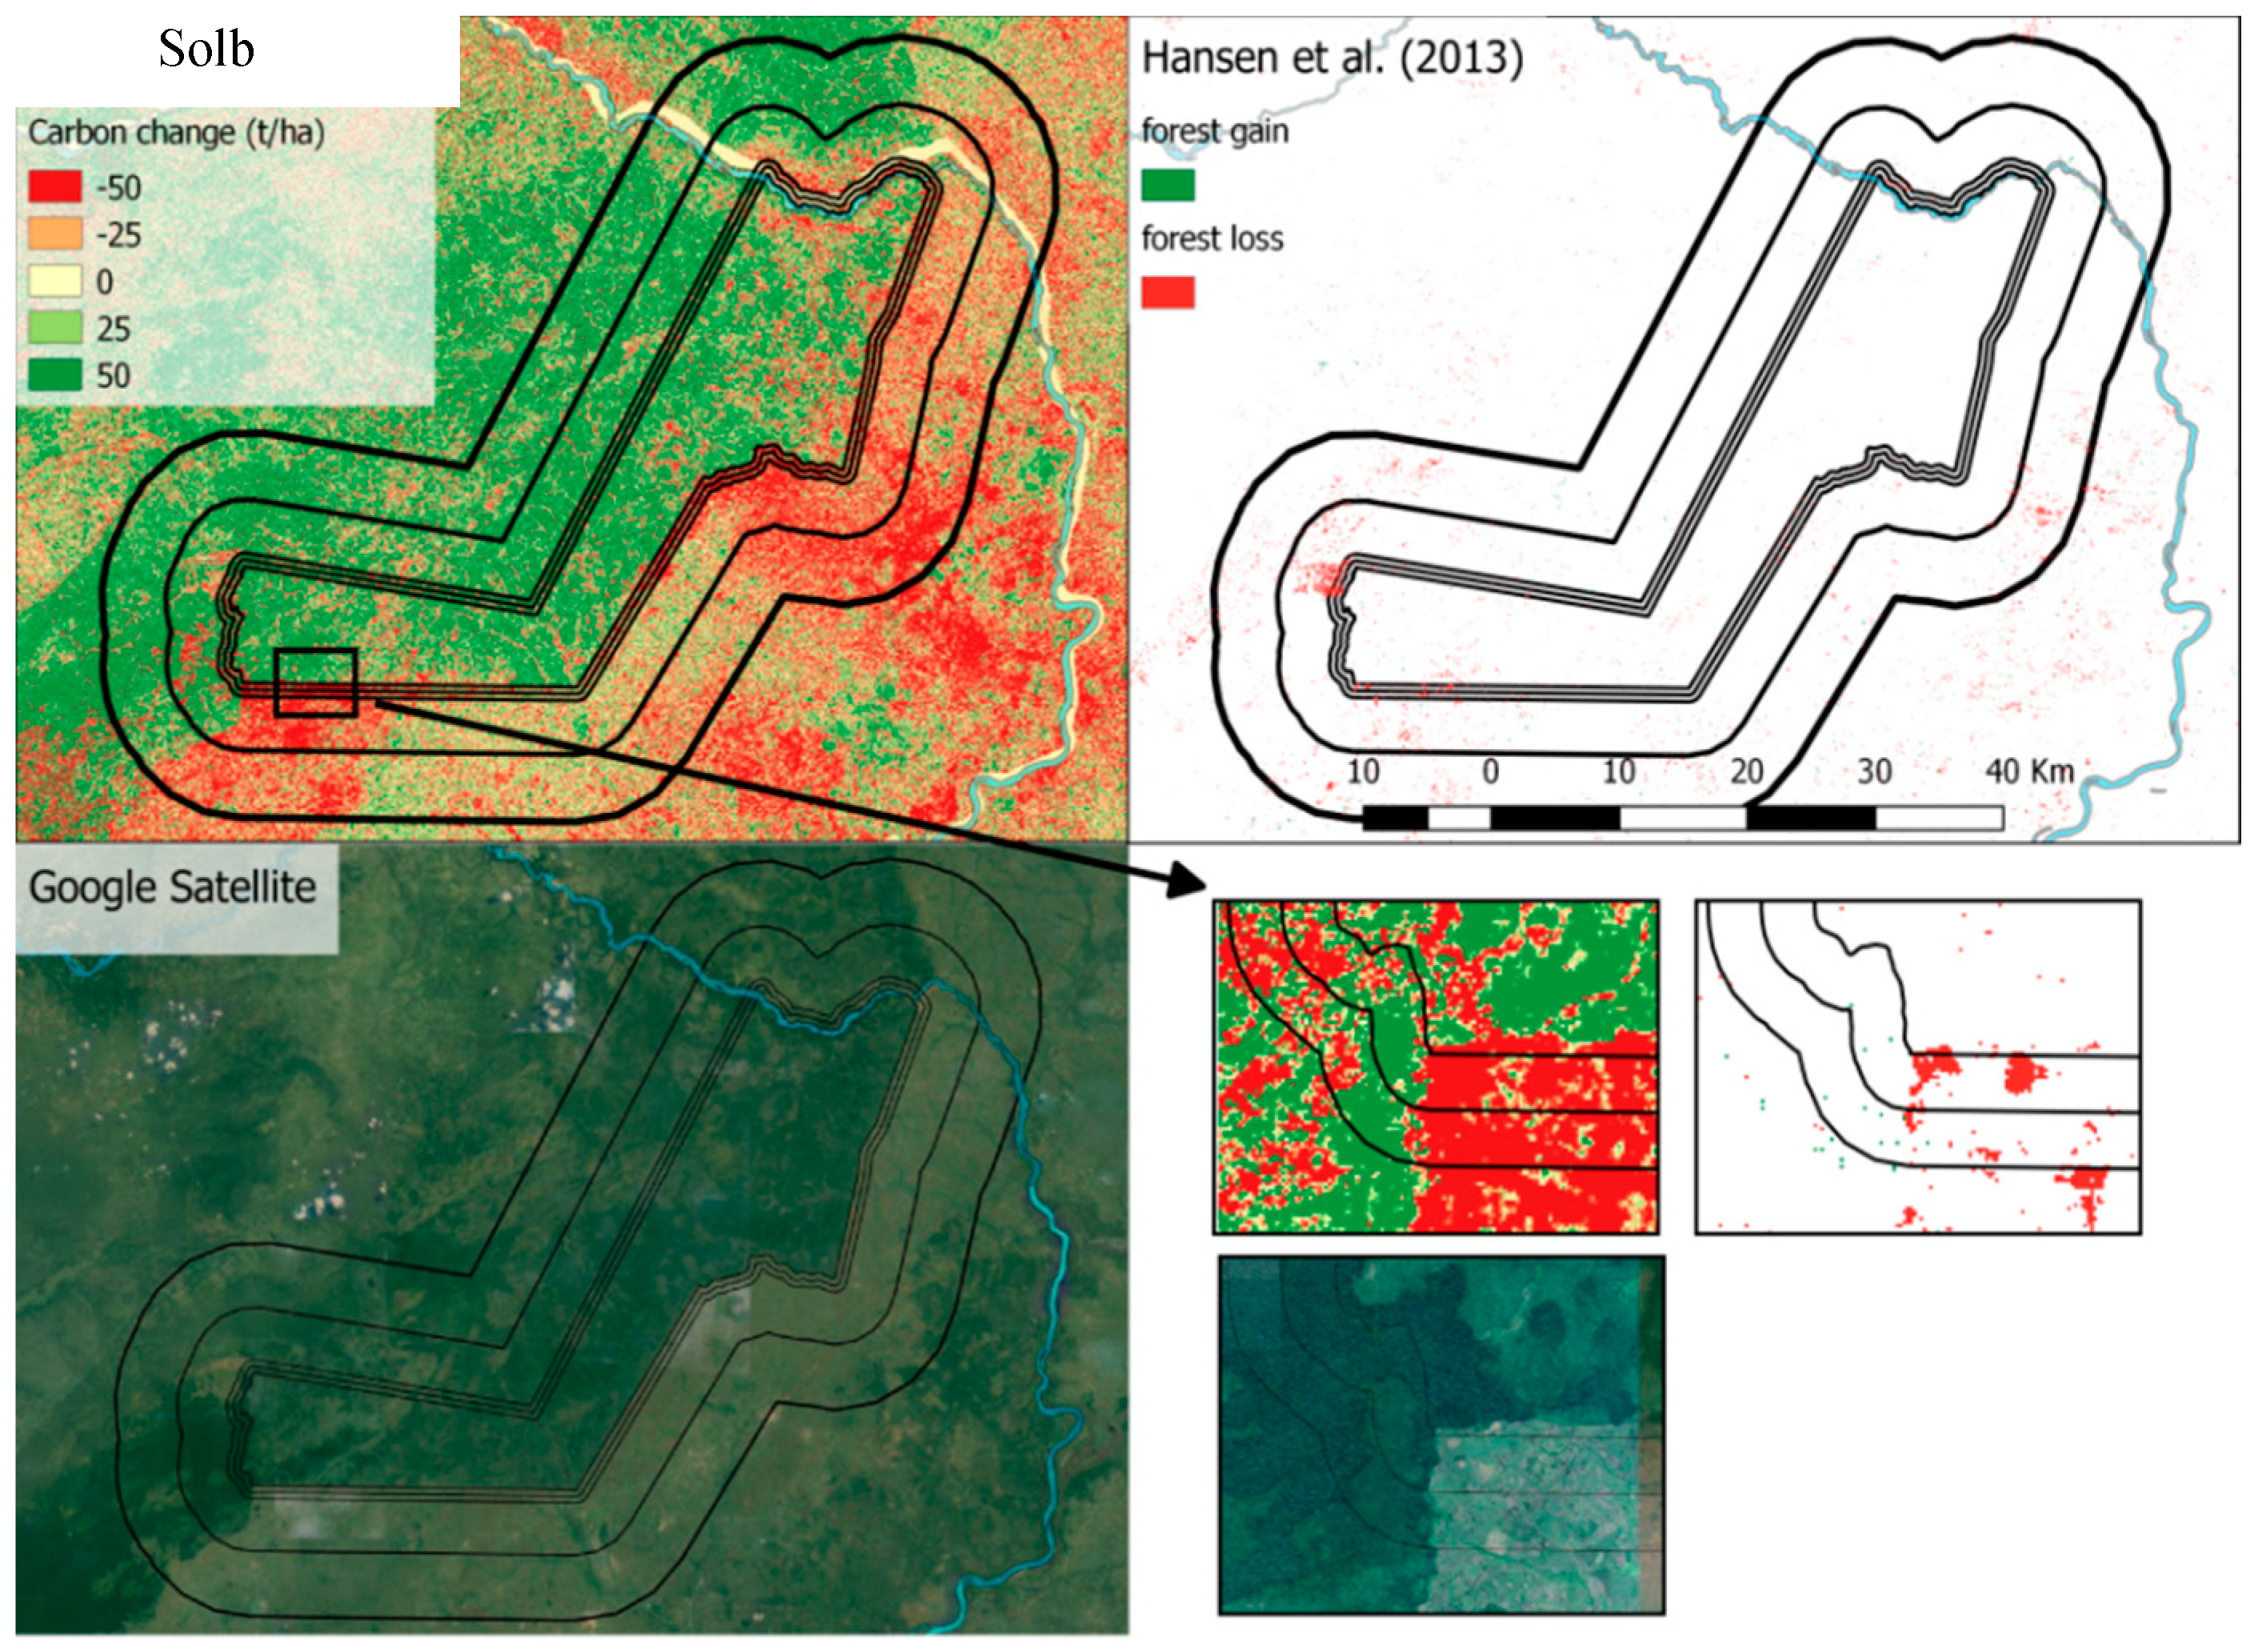
Figure 6.
Leakage in “Effective” PA (Karuma WLR, area = 57,000 ha), upper left panel, demonstrating a sharp contrast in carbon change between inside PA (carbon gain) and external buffer zones (carbon loss). Additional figures are for visual comparison, extracts of Google Earth images and Global Forest watch, and forest cover change for the same period (2000–2012) [34].

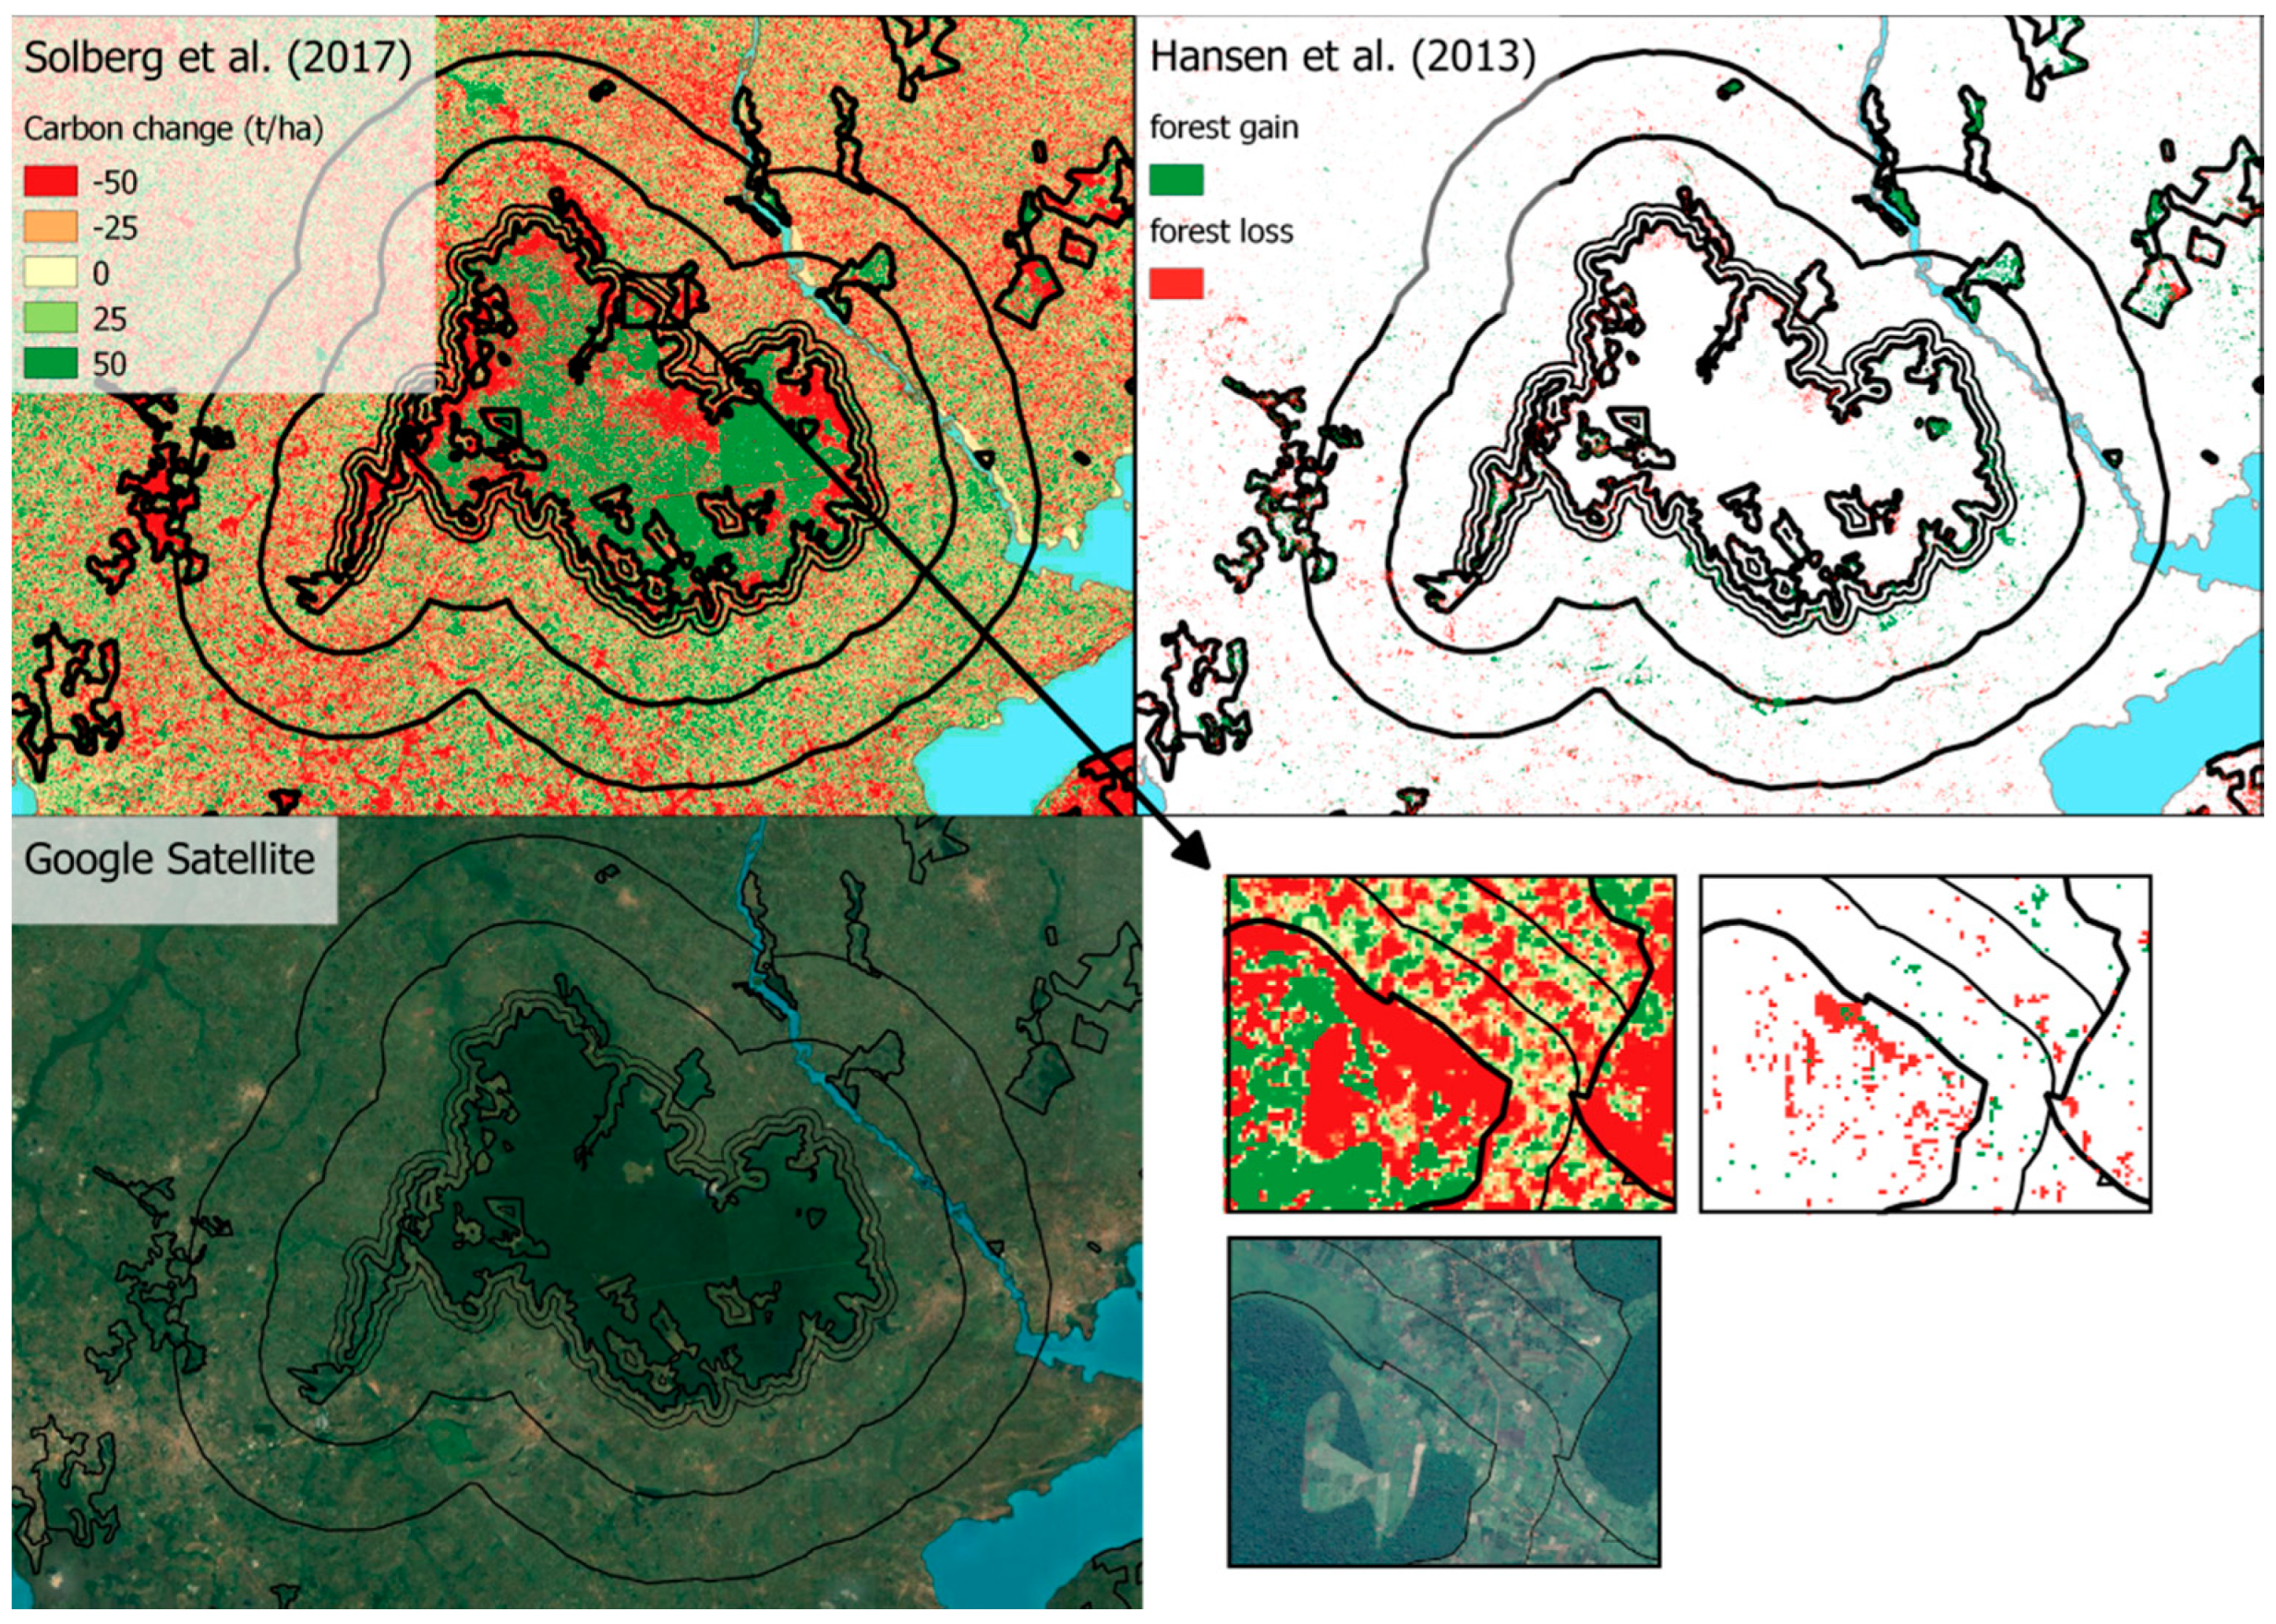
Figure 7.
Carbon change in ineffective PA, Mabira Central Forest Reserve, and carbon losses (red) inside PA boundary and the external buffer zones. Other figures are, for visual comparison, extracts of Google Earth images and Global Forest Watch forest cover change for the same period (2000–2012) [34].


Table 1.
Summary of PA characteristics: number of PAs, total PA size, area-weighted mean carbon loss or gain. Numbers in parenthesis with area-weighted mean are standard deviations.
Table 1.
Summary of PA characteristics: number of PAs, total PA size, area-weighted mean carbon loss or gain. Numbers in parenthesis with area-weighted mean are standard deviations.
| Management Category | No. of PAs | Total Area (1000 ha) | Area-Weighted Mean (t/ha/year) |
|---|---|---|---|
| CFR | 489 | 1165 | −0.30 (1.72) |
| DJM | 9 | 90 | −0.06 (0.45) |
| LFR | 191 | 5 | −1.05 (2.94) |
| NP | 10 | 1032 | 0.59 (1.18) |
| WLR | 14 | 886 | 0.51 (0.64) |
Table 2.
Results of the least significance difference test (LSD) for the mean difference for pairwise comparison in the mean of carbon change (t/ha) for the period 2000–2012 between PA management categories. Comparisons significant at the 0.05 level are indicated by ***.
Table 2.
Results of the least significance difference test (LSD) for the mean difference for pairwise comparison in the mean of carbon change (t/ha) for the period 2000–2012 between PA management categories. Comparisons significant at the 0.05 level are indicated by ***.
| PA Management | DJM | LFR | NP | WLR |
|---|---|---|---|---|
| CFR | −15.64 | −5.40 *** | −21.92 *** | −17.56 *** |
| DJM | 10.24 | −6.28 | −1.926 | |
| LFR | −16.53 | −12.166 | ||
| NP | 4.36 |
Table 3.
Summary of PA effectiveness, in terms of number and area, and corresponding proportion (%).
Table 3.
Summary of PA effectiveness, in terms of number and area, and corresponding proportion (%).
| CFR | LFR | DJM | WLR | NP | |
|---|---|---|---|---|---|
| Effective PAs, number (%) | 174 (36) | 70 (37) | 6 (67) | 8 (57) | 5 (50) |
| Ineffective PAs, number (%) | 315 (64) | 121 (63) | 3 (33) | 6 (43) | 5 (50) |
| Effective area, ha, (%) | 632,525 (54) | 1886 (38) | 48,101 (53) | 700,116 (79) | 519,256 (50) |
| Ineffective area, ha, (%) | 532,138 (46) | 3070 (62) | 42,285 (47) | 185,551 (21) | 519,256 (50) |
Table 4.
Leakage: Mean differences in carbon change (t/ha) and the significance level of the paired-test between external buffer zones and a corresponding internal zones of effective PAs by management categories, (p < 0.01) highly significant. For the categories DJM, WLR and NP, p values are results of Wilcoxon paired test.
| Concentric Bands (km) | CFR (n = 174) Mean Difference (Paired t-Test) | LFR (n = 70) Mean Difference (Paired t-Test) | DJM (n = 6) Mean Difference (Wilcoxon Exact Test) | WLR (n = 8) Mean Difference (Wilcoxon Exact Test) | NP (n = 5) Mean Difference (Wilcoxon Exact Test) |
|---|---|---|---|---|---|
| 0–0.5 | −10.64 (p < 0.01) | −4.80 (p < 0.01) | −2.70 (p = 0.15) | −5.45 (p = 0.14) | −14.4 (p = 0.007) |
| 0.5–1 | −12.48 (p < 0.01) | −5.76 (p < 0.01) | −3.36 (p = 0.2) | −7.10 (p = 0.07) | −17.47 (p = 0.04) |
| 1–5 | −11.30 (p < 0.01) | −6.82 (p < 0.01) | −8.55 (p = 0.02) | −7.02 (p = 0.04) | −17.45 (p = 0.02) |
| 5–10 | −12.37 (p < 0.01) | −7.95 (p < 0.01) | −9.04 (p = 0.004) | −9.24 (p < 0.02) | −18.82 (p = 0.004) |
© 2018 by the authors. Licensee MDPI, Basel, Switzerland. This article is an open access article distributed under the terms and conditions of the Creative Commons Attribution (CC BY) license (http://creativecommons.org/licenses/by/4.0/).
Share and Cite
MDPI and ACS Style
Gizachew, B.; Solberg, S.; Puliti, S. Forest Carbon Gain and Loss in Protected Areas of Uganda: Implications to Carbon Benefits of Conservation. Land 2018, 7, 138. https://doi.org/10.3390/land7040138
AMA Style
Gizachew B, Solberg S, Puliti S. Forest Carbon Gain and Loss in Protected Areas of Uganda: Implications to Carbon Benefits of Conservation. Land. 2018; 7(4):138. https://doi.org/10.3390/land7040138
Chicago/Turabian StyleGizachew, Belachew, Svein Solberg, and Stefano Puliti. 2018. "Forest Carbon Gain and Loss in Protected Areas of Uganda: Implications to Carbon Benefits of Conservation" Land 7, no. 4: 138. https://doi.org/10.3390/land7040138
Note that from the first issue of 2016, this journal uses article numbers instead of page numbers. See further details here.