Modeling Urban Encroachment on the Agricultural Land of the Eastern Nile Delta Using Remote Sensing and a GIS-Based Markov Chain Model

1
Department of Earth and Environment, Boston University, 685 Commonwealth Avenue, Boston, MA 02215, USA
2
Department of Earth and Ocean Sciences, University of North Carolina Wilmington, 601 South College Road, Wilmington, NC 28403-5944, USA
*
Author to whom correspondence should be addressed.
Land 2018, 7(4), 114; https://doi.org/10.3390/land7040114
Submission received: 19 August 2018
/
Revised: 27 September 2018
/
Accepted: 29 September 2018
/
Published: 1 October 2018
Abstract
:Historically, the Nile Delta has played an integral part in Egyptian civilization, as its fertile soils have been cultivated for centuries. The region offers a lush oasis among the expansive arid climate of Northern Africa; however, in recent decades, many anthropogenic changes to the environment have jeopardized Egypt’s agricultural productivity. Political instability and lack of sufficient regulations regarding urban growth and encroachment have put agricultural land in the area at risk. Advanced geospatial techniques were used to assess the rate at which urban areas are increasing within the region. A hybrid classification of Landsat satellite imagery for the eastern sector of the Nile Delta, between the years 1988 and 2017, was conducted to map major land-use and land-cover (LULC) classes. The statistical change analysis revealed that urban areas increased by 222.5% over the study period (29 years). Results indicated that urban areas are encroaching mainly on established agricultural lands within the Nile Delta. Most of the change has occurred within the past nine years, where approximately 235.60 km2 of the cultivated lands were transitioned to urban. Nonetheless, at the eastern delta flank, which is bordered by desert, analysis indicated that agricultural lands have experienced a considerable growth throughout the study period due to a major desert reclamation effort. Areas most at risk from future urban expansion were identified. A simulation of future urban expansion, using a Markov Chain algorithm, indicated that the extent to which urban area is simulated to grow in the region is 16.67% (277.3 km2) and 37.82% (843 km2) by the year 2026, and 2050, respectively. The methods used in this study are useful in assessing the rate of urban encroachment on agricultural lands and can be applied to similar at-risk areas in the regions if appropriate site-specific modifications are considered.
1. Introduction
In the latter half of the twentieth century, anthropogenically induced environmental land-use and land-cover changes (LULCC) emerged as a predominant driver in global environmental vicissitude [1,2]. The rapid rate of modern landscape change has surpassed what is capable from natural forces, suggesting additional drivers of change [3,4,5] identifies urbanization as the predominant driver in pervasive LULCC. The global decline in arable land, vegetative cover, natural habitat, and biodiversity demonstrate the far-reaching effects of urbanization [2,6,7,8]. Furthermore, urbanization is significantly affecting the functionality of the Earth System by critically altering ecosystems and contributing to global effects such as climate change [2,9,10,11]. The global urban population is on the rise, and its action is reciprocal with urbanization [12]. The number of individuals residing in an urban setting approximately doubled between the years 1950 (30%) and 2014 (54%). By the year 2050, the global urban population is predicted to reach 66% [13].
Africa is expected to experience one of the highest rates of urbanization in the years leading up to 2050 [13]. In Egypt specifically, more than 43% of the country’s 104.2 million individuals reside in urban areas as of 2017 [14,15]. Similar to global trends, this percentage is expected to grow to 57% by the year 2050. Overall, the Egyptian population is expected to double by the year 2100, with nearly the entire population residing within the Nile Delta (ND). Although it makes up a mere 4% of the country, the delta contains one of the largest population densities globally. Barren desert makes up the remaining 96% of the country [16]. The anthropomorphic environmental pressures that result from urban growth pose a threat on the fragile geomorphic features of the ND [17]. In a healthy state, deltas have the potential to be greatly ecologically productive by offering water quality improvement, freshwater storage, and agriculture [17,18]. As it stands today, the functionality of the ND has been limited by anthropological transformations of the landscape [3,19]. The once-active braided channels of the Nile River have been reduced to only two artificially maintained river branches [3]. The massive altering of natural flow patterns has prevented any water from reaching the Mediterranean Sea. The diminutive amount of water that still flows near the coastline has been severely polluted from agricultural runoff and industrial municipal waste, rendering it nearly useless [19].
In developing nations alone, it is estimated that 10 to 20 thousand square kilometers of cropland are converted annually to cope with urban pressures. Prime agricultural land located within fertile river valleys and coastal plains are the most susceptible to LULCC [20]. Egypt specifically is losing an estimated 252 km2 of fertile cropland annually because of expanding urban landscapes [21]. Recently, these impacts have gained heed among scholars and governments as a predominant cause of environmental concern [22]. In 2016, the African Economic Outlook declared that urbanization is having a direct impact on Egypt’s food security [23]. Another 2007 study conducted by the Food and Agriculture Organization of the United Nations indicated that the northern region of Africa is one of the lowest globally in arable land per capita [24].
To cope with the increased food scarcity and high urban density population, the Egyptian government has invested in converting the arid landscape that lines the ND into cultivatable land. Over the past 50 years, many governmental desert reclamation plans have been implemented, and as a result, the total additions to agricultural land from desert conversion exceeds 12,000 km2 [25]. Although this action may lead to short-term positive externalities (e.g., addition to the food supply, job creation, and population dispersal), the overwhelming consequences from converting to such water-dependent land is alarming. Transforming the land requires complete modification of the landscape. Overall soil fertility and texture need to be artificially created to provide an adequate medium for crop production. These costs, although extremely high, can be met; however, the demand for water may not be supplied. Maintaining reclaimed desert area is highly water-intensive in an area that is already restricted in water supplies. Increasing the amount of water pumping can lead to shortages, thus adding to the already increasing tension among all water stakeholders in the region (e.g., established farmers within the ND, surrounding countries with similar arid environments [25,26].
Not only are the negative impacts of agricultural expansion onto the infertile lands of the Egyptian desert increasing, but also the recent eastward sprawl of urban development in Cairo fosters further environmental plight. Desert urban expansion is similar to urban expansion on agricultural lands in that it can lead to groundwater contamination, groundwater overuse, and increased overall pollution [27].
Many drivers, both socioeconomic and environmental in nature, contribute to the increase in urbanization within the ND. Since the 1950′s, Egyptian agricultural policy has inadvertently contributed to the recent spike in urban growth. Many policies encourage obtaining rurally grown produce at prices far below global values. Furthermore, the Egyptian government also provides food to urban areas at lower subsidized prices. This low profitability in rural farming, along with the decrease in urban food prices, are major factors in net migration to urban areas [28]. Additionally, it is worth nothing, that there has been a massive influx of unlicensed building on the scarce farmland of the ND during the Arab Revolution (also referred to as the Arab Spring) since 2011. The overthrow of the Egyptian Government during this period led to a security vacuum. The combination of inadequate Egyptian government action regarding LULCC, population growth, poverty, and the resulting negative impacts of urbanization, have led to an uncertain future. Determining the rate and trend of urbanization and overall land conversion is necessary to establish essential land-use policy [29].
Conventional methods of surveying urban growth are monetarily and temporally expensive. Many developing countries lack the adequate funds to employ such studies, thus a major shift towards using GIS (Geographic Information Science) and remote sensing techniques has recently occurred due to their cost-effective nature [30]. LULCC detection is examined with remote sensing by using an image-to-image comparison. Such analysis aims to compare differentiation among satellite images of varying timestamps, typically through a classification procedure of some kind [31]. Remote sensing data is highly advantageous, for the high frequency of satellite imagery output leads to an up-to-date, accurate, synoptic view of a desired environment [32].
The objective of this study is to analyze the LULCC between the years 1988 and 2017 within the eastern part of the ND (Al Qahirah, Al Qalyubiyah, and Ash Sharqiyah governorates) to gain a better understanding of the severity, speed, trend, and pattern of urban growth. It aims to effectively showcase the usefulness of geospatial technology as a predictive tool for monitoring and predicting urban encroachment on the fertile agricultural land by using the eastern flank of the ND as an example case. For that, three questions will be addressed in the present study: First, what was the trend of LULC change within the eastern sector of the ND in the past (1988–2017)? Second: which LULC class was mostly affected by urbanization and where? Third: Where can urban growth be expected in the near (2026) and far (2050) future?
2. Study Area
The eastern part of the ND encompasses an area approximately 9377 km2. The region is located between the longitudes 31°12′ E and 32°18′ E and latitudes 29°54′ N and 31°0′ N (Figure 1). The region was split into two distinct study areas (i.e., ND cultivated lands flank, and ND flank including desert) to facilitate future modeling. The boundary of the ND flank including desert was selected based on the preexisting boundaries of the three aforementioned governorates. The boundary for the ND cultivated lands flank was determined by individually selecting the districts that were predominately composed of vegetation in the 1988 image. Districts were excluded if they were mainly urban (e.g., many of the districts within the Greater Cairo Region), and if the district visually appeared to have less than 80% vegetation cover.
The ND holds great significance both culturally and environmentally. The agricultural lands surrounding the Nile are some of the oldest in the world, for they have been continuously cultivated for over 7000 years [29]. The megacity of Cairo is located within the Al Qahirah governorate, and as a result, this area has one of the highest populations in terms of density and quantity within Egypt. The Mediterranean climate of the ND offers minimal annual rainfall, strikingly hot, arid summers, and mild, wet winters within the study region. A majority of agriculture production occurs within the mid-delta region. Farm-holdings are 0.015 km2 on average, and they typically cultivate yields such as cotton, maize, rice, and wheat [33]. The most frequently used irrigation method involves incrementally flooding fields.
3. Materials and Methods
3.1. Data
To investigate the impacts of urbanization on the eastern ND region, three cloud-free Landsat images were analyzed. Landsat-5 (LS-5) images were acquired for 9 June 1988 and 2 June 2008, and Landsat-8 (LS-8) imagery was acquired for 11 June 2017 (LS path 176 and raw 39). All multispectral images were explicitly selected during the same season to avoid excessive variation in land-cover reflectance. LS-5 offers seven spectral channels that have a spatial resolution of 30 m for the Visible, Near-Infrared (NIR), and Mid-Infrared (MIR) bands, and 120 m for the Thermal-Infrared (TIR) band. LS-8 offers 11 spectral channels with a resolution of 30 m for the Visible, NIR, and Shortwave-Infrared (SWIR), 100 m for the TIR, and 15 m for the panchromatic band. All spectral channels of both satellites were used in this study, excluding bands 8 and 9 in the 2017 LS-8 image (i.e., the panchromatic and cirrus detection bands, respectively). The LS-8 and LS-5 imagery were obtained from the USGS Global Visualization Viewer (GloVis, http://glovis.usgs.gov/), at no cost. All images were atmospherically and geometrically corrected in fine course of pre-processing. Due to the variance in image resolution, all images were resampled to the resolution of the coarsest data. Auxiliary data including Digital Elevation Model (DEM), road networks, population, and Google Earth maps were also used. Here, the 30-m resolution Shuttle Radar Topography Mission (SRTM) DEM, from the USGS (https://earthexplorer.usgs.gov/) was used to obtain the physiographic properties of the study area. The 100-m resolution gridded population datasets, from the WorldPop Project, were used to identify areas with high population density.
3.2. LULC Maps Production and Accuracy Assessment
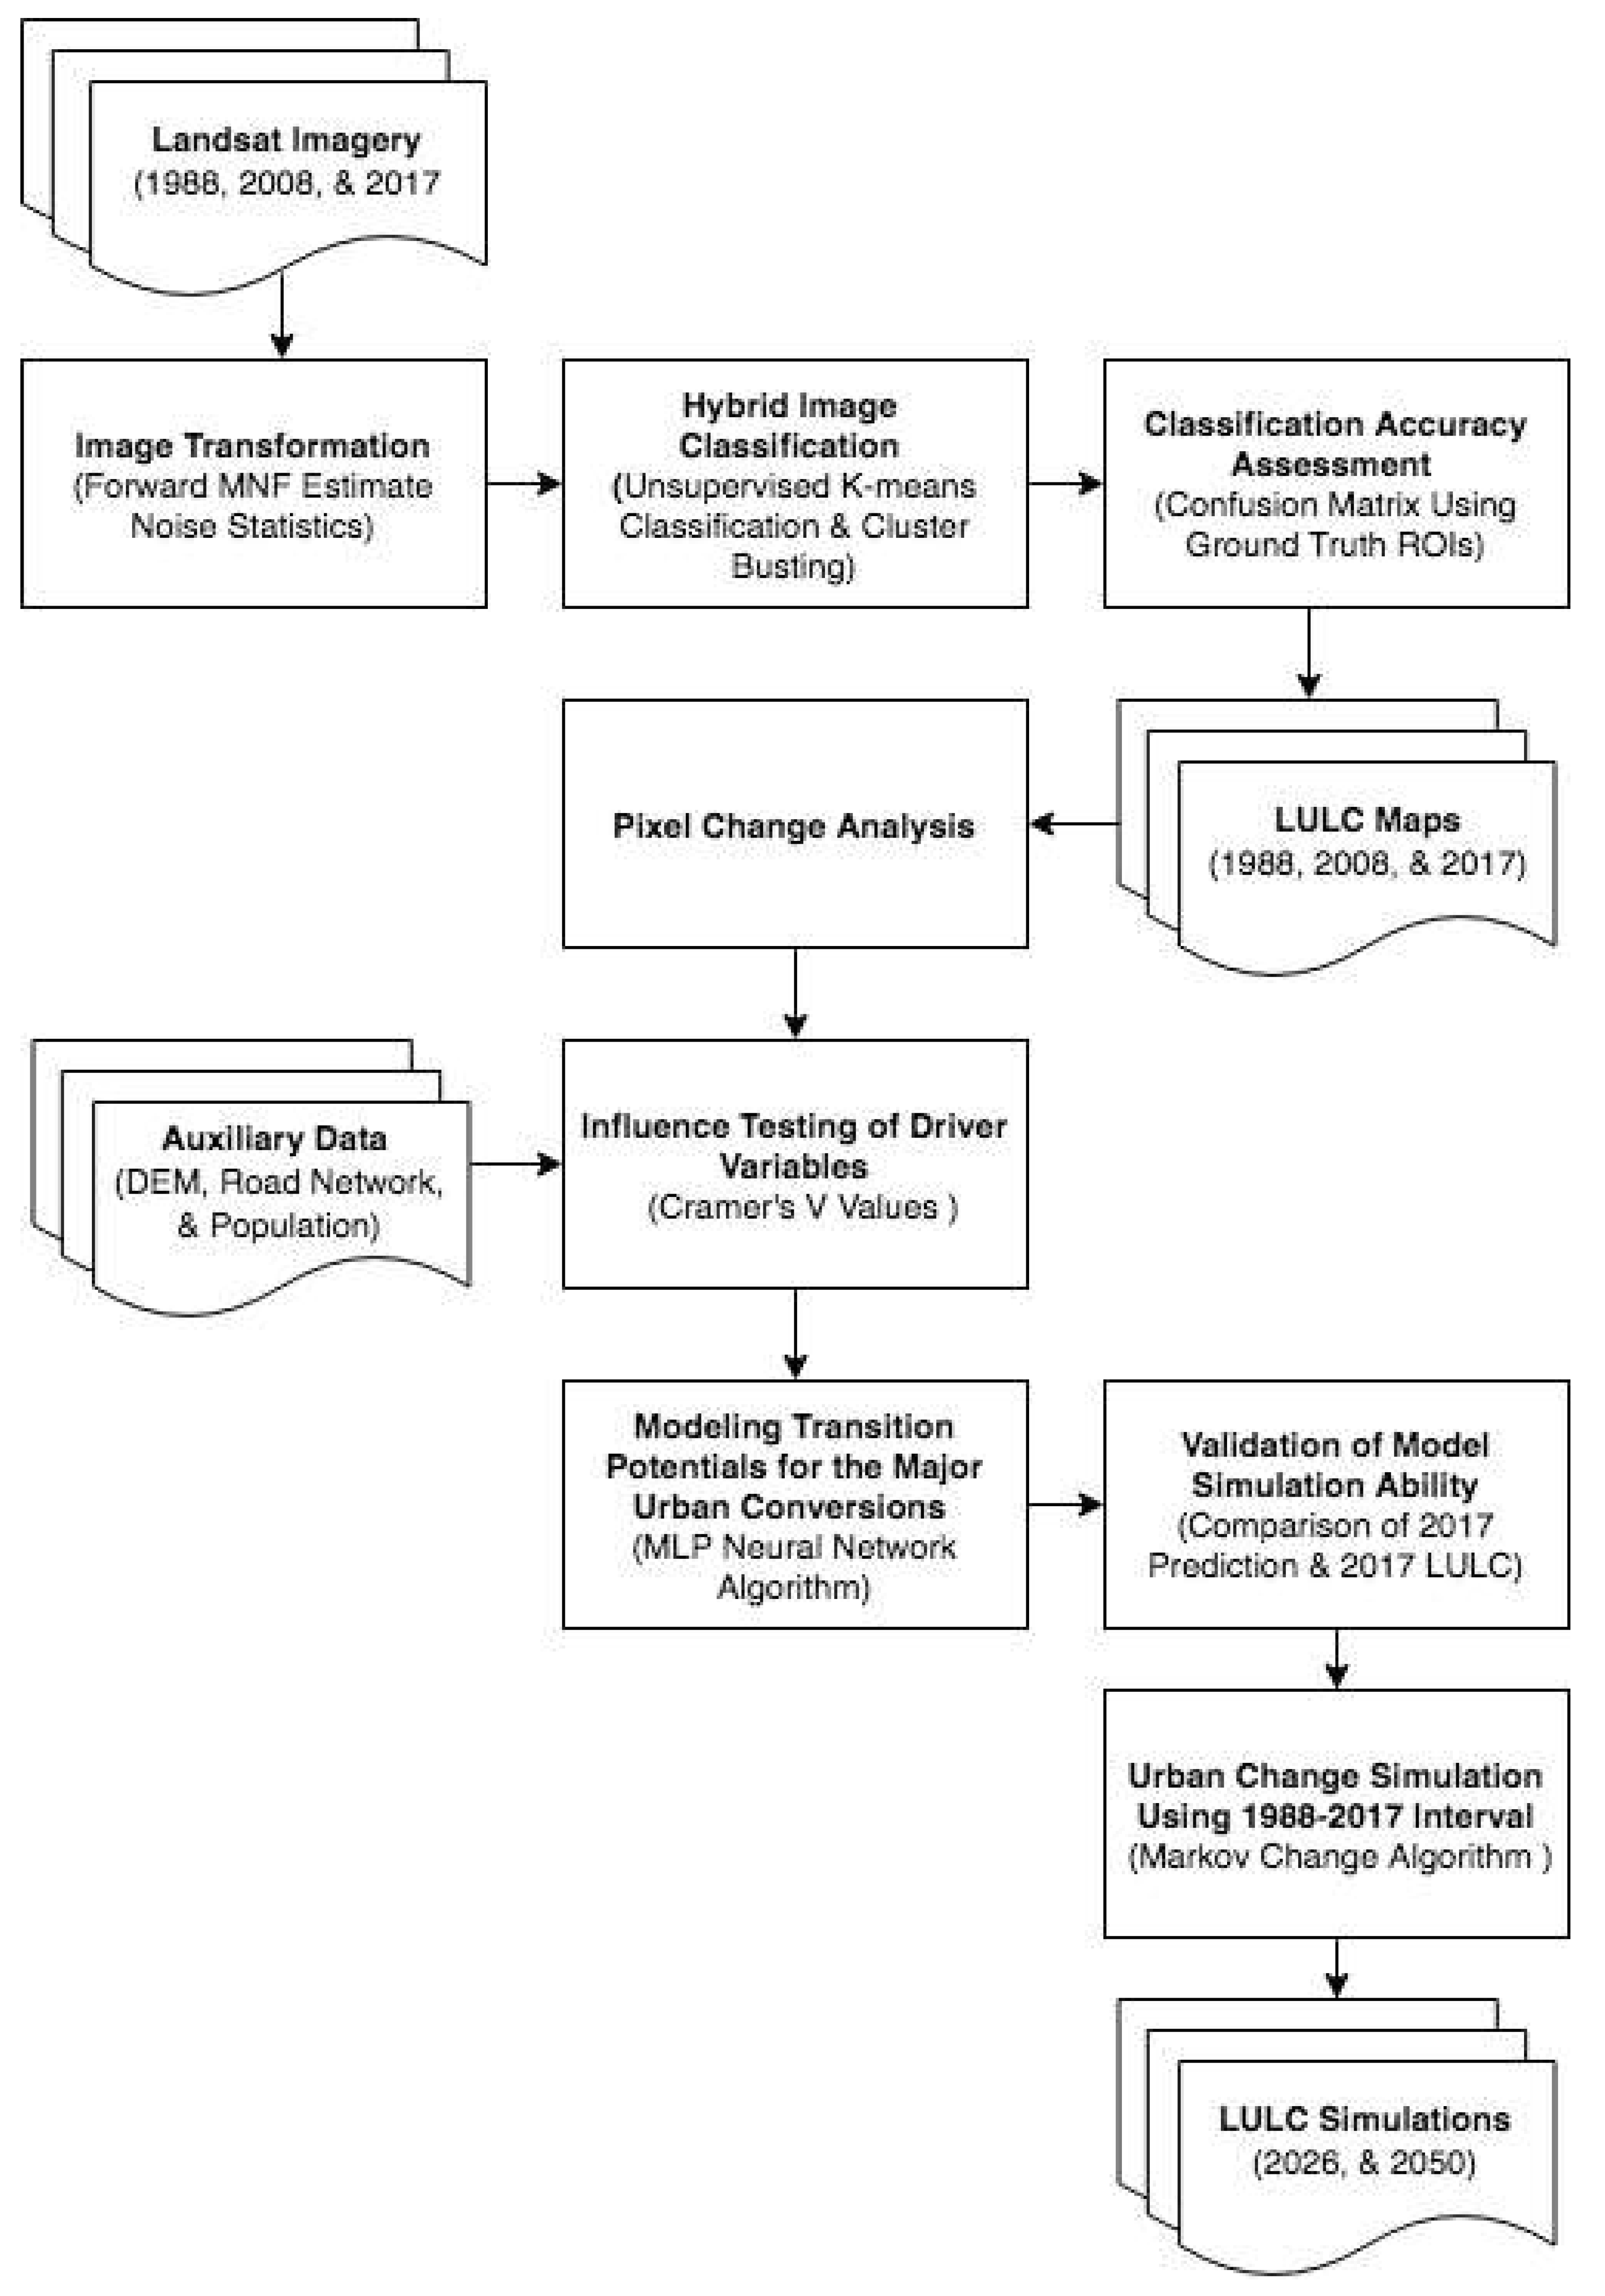
Multiple satellite scenes from various timestamps (1988, 2008, and 2017) covering the same subset of the ND were classified using a hybrid classification technique (Figure 2). The three images were subjected to a multipart classification procedure. Prior to classifying, each image was processed by using the Minimum Noise Fraction Rotation (MNF) transform. Specifically, by using the Forward MNF Estimate Noise Statistics transform, the dimensionality of the Landsat spectral bands was reduced, thus yielding reduced computational requirements and increased image accuracy [34,35]. The MNF transform implements a two-part principal component analysis (PCA). The first step involves running a process known as noise whitening; in this application, the principle components of the noise covariance matrix are used to disassociate and rescale overall noise in the data. The second step subjects the now noise-reduced data to an additional standard PCA [34]. The final output can contain the same number of bands that were used in the input; however, the data variance increases starting from band one onward. In most scenarios, only the first few bands are necessary for further processing. Additionally, an eigenvalue for each spectral band was assigned in the final output. The larger the value, the greater the amount of information contained in a spectral band, and values close to one contain mostly noise [36]. Overall, MNF transform is an effective technique for producing an output of increased accuracy [35,37]. The first 5 MNF bands were used in this study with MNF variances at 96%.
Once noise was minimized in each of the images, further processing was conducted by using a hybrid unsupervised K-means classification technique. K-means classification is one of the most widely used classification techniques, largely because of its high accuracy and minimal processing requirements [38,39]. Overall, four LULC classes were produced using the hybrid K-means classification technique: Urban, Agricultural Lands, Bare Ground, and Water. Urban areas include all areas of built-up land including city and rural infrastructure (e.g., buildings, roads). The road networks were combined with the corresponding urban LULC class for each subsequent study year to ensure accurate assessment of road development. Agricultural Lands includes all areas of active cropland, fallow land, and aquaculture cultivation. Bare Ground includes all areas of undeveloped land including desert land. Water includes all areas covered by the ND, branching canals, and retention ponds.
During the image classification process, if the derived output from the K-means classification resulted in overlapping or mixed LULC class types (e.g., fallow land that is mistakenly classified as urban, agricultural lands that is mistakenly classified as water), the technique of cluster-busting was implemented. This method involves separating the indistinguishable remaining clusters from the rest of the image and then reclassifying them by using the unsupervised K-means classification once more [40]. This process of cluster-busting was repeated until no further separation between clusters was discernable, and the overall remaining LULC map was deemed visually accurate. Once classified, all final LULC outputs were validated through an accuracy assessment. Cluster accuracy was continually assessed throughout this process by comparing both Google Earth images and the original Landsat image to each iteration of the K-means output. A minimum of 1000 random points per LULC class for each time step were generated, and an accuracy assessment was performed. By using the confusion matrix using ground truth regions of interest (ROIs) assessment, the randomly selected points were compared to the previously classified image. The ratio to which the classified points matched the classified image determined the overall accuracy of the hybrid classification output. The confusion matrix specifically measures accuracy by employing the Kappa Coefficient.
3.3. Model Implementation
The Land Change Modeler (LCM) within the TerrSet Geospatial Monitoring and Modeling Software v 18.31 (clarklabs.org) was used for the remainder of the analysis. The LCM is an empirically driven multipart tool that is used to assess land-cover change and predict areas of future change. The module is programmed to be used in a step-like manner and consists of four main mechanisms: a change analysis assessment, a transition potential modeling procedure, a change simulation output, and a final model validity assessment.
A change analysis was performed on the three classified images (1988, 2008 and 2017) to discern the overall amount of land that had undergone a transition. Here, a change analysis was conducted for the entire study area for each period in the evaluation (i.e., 1988 to 2008, 2008 and 2017, and 1988 and 2017). This step analyzes the pixels within each of the entered classifications and identifies total pixels that have undergone a classification change. Due to the derived observational nature of the final simulation, identification of the initial change is essential for functionality of the module [41].
Additionally, a second analysis was conducted on the area encompassing only the cultivated lands flank of the ND. Modeling on a smaller scale yields results more representational of change occurring throughout the rest of the ND, for extraneous growth influences that are not characteristic of growth patterns occurring within the ND are eliminated. Excluding variables such as the desert reclamation in the north-eastern region and the addition of New Cairo in the southern desert region allows for an in-depth analysis on urban growth that is more representative of the entire ND.
3.3.1. Transition Potential Modeling and Driving Forces Determination
The second facet of the model aims to identify the likelihood a pixel will succumb to urbanization. It does so by producing transition potential maps for each of the major transitions found within the generated sub-model. Components were included in the sub-model if their fundamental sources of conversion, termed driving forces, were equivalent. Land class transitions caused by the same driving forces were grouped into the same sub-model and driving variables of change were determined and implemented. Of the 12 types of pixel transformations, bare ground to urban land and agricultural land to urban land transitions had the greatest contribution to urban growth, thus were the only transitions included in the final sub-group. Visual examination of the urban area spatial trend map aided in further concluding that the selected transitions had synonymous underlying drivers of change.
The determination of viable driving forces was modeled after recent similar studies [41,42,43]. These studies included the variables elevation, slope, distance from roads, and distance to initial urban areas in their study due to their established historic influence on urbanization rates. Eastman [41], incorporated evidence likelihood and distance to total disturbance as main drivers. Disturbance is defined as any pixel undergoing any type of conversion to another LULC type. Analyses of these proven potential drivers were conducted before and after model execution to thoroughly examine individual power within this particular study area.
Specifically, LCM offers an informal quantitative assessment of each driver variable’s potential explanatory power of change represented as a Cramer’s V. These values are statistically measured values that represent the strength of association after a final chi-squared has been determined. Cramer’s V value is shown in the following equation:
where “c” represents chi2 and “k” represents the number of rows or columns in the cross-classification table generated by the tool [44]. These values, although not completely representative of true performance power, were useful in a general prior measurement of each driver’s utility. Final driver variable determination was the result of two-sided assessment and a model trial and error application process. Initial assessment of the variable’s Cramer’s V values, although not the final determinant, greatly indicated the role each variable would play in the model regarding influence. Typically, if a driver’s Cramer’s V value is above 0.4, it is a good indicator of potential model influence, whereas values below 0.15 should be dismissed due to an unlikely correlation [41]. Additionally, driver variables were further subject to exclusion after the model had completed. As a result, of the specific mathematical requirements of the modeling approach and the driver relationship to the transition, the model provided definitive driver influence value measurements. Only drivers exhibiting a high influence on the accuracy of the potential transitions model were included in the final modeling.
Variables used in the final simulation model include: Distance to urban areas specific to 1988, evidence likelihood, distance to total urban disturbances, and elevation. Of selected driver variables, evidence likelihood had the highest Cramer’s V values of 0.56 (Table 1). Other driver variables (i.e., slope, 1988 distance to bare ground, 1988 distance to water, and population), were considered, but were omitted due to either their low Cramer’s V value or total influence in the model (Table 1). The same driver variables used in the full simulation were included in the smaller simulation that included only the cultivated lands (Table 2).
The distance to urban areas driver represents the spatial proximity a pixel has with the established urban areas in 1988. The distance to urban areas will vary as urban areas develop over time, thus the driver was categorized as dynamic. Similarly, the distance to disturbance driver was set as dynamic for its similar dependent nature. This driver represents the spatial proximity of a pixel relative to all pixels that transitioned to urban in the 1988 to 2008 interval. The evidence likelihood driver represents a statistical assessment on the likelihood of transformation. The driver was created within the TerrSet software, and it is a continuous map derived from the relative frequency of pixel change within the varying categories of the classified image. The evidence likelihood driver was additionally set as dynamic, for its likelihood of changing through time was parallel. Lastly, the population driver represents the number of individuals residing in each pixel of the study area. Population is naturally dynamic due to its fluctuating nature over time; however, limitations in the model resulted in the driver being set to static for the simulation.
Final potential maps were generated using a Multi-Layer Perceptron (MLP) neural network algorithm. Neural networks easily forecast and model trends, thus their functionality is well-suited for solving complex real-world issues [45]. Moreover, beyond just its high scientific backing, the MLP algorithm was chosen because of its inherent ability to model multiple transitions at once (i.e., all major transitions to urban). MLP is a feedforward neural network that acts by filtering pixels through a series of layers—input, hidden, and output—each with an equal set of neurons. The algorithm works by first evenly distributing observed variables of change across neurons within the input layer. From there, a weight-based constant value is added to each neuron containing a driver variable amount. The resulting value is then fed through a series of weight-based neuron multiplications within the hidden layers, until it reaches the final output layer. Because weight values for each neuron are determined in the model training process, setting a representative initial parameter is crucial for increasing the accuracy of the outputs. The final accuracy value output represents the total precision and efficiencies the driver variables cumulatively have in the final simulations. Accuracy values above 75% are commonly deemed proficient enough for further modeling [45].
3.3.2. Change Simulation
Creating the simulation maps required the implementation of the Markov Chain algorithm as a function for modeling urban growth. Such method is an appropriate way for simulating LULC change in places where understanding landscape relations are difficult. The Markov series is representative of any moment in time, thus t1 < t2 < tn < tn + 1, where “n” represents any point in time. The random nature of the algorithm is represented in the following equation:
Applying the previous condition of time, represents the present time (or the most recent LULC inputted), and represents any point in the predicted future [46]. Markovian models are an effective tool for mapping land-cover transition simulations, and they have frequently been used to map dynamic change models [47]. Their accuracy has been meticulously affirmed, thus resulting in their general acceptance as a valid means for generating change simulations [48]. The Markov Chain functions by using the immediate state of the inputs along with a spatially representative base of potential pixel transformations to dynamically extrapolate a simulation. For the purposes of this study, both earlier and later land-cover maps, in conjunction with the transition potentials maps created by the MLP neural network, function as inputs in the simulation. The final model output results in two map simulations: a soft and hard simulation. Each model offers a unique change prediction map for the study area. The hard simulation represents specific pixels that will change, whereas a soft simulation is similar to a transition potential map, in that it displays vulnerability of change in a continuous format.
In fact, the soft simulation is the combination of all produced transition potential maps (i.e., agricultural lands to urban transition and bare ground to urban transition) [41]. The Markov Chain analysis was individually performed on both the ND flank including desert and the ND cultivated lands flank.
3.3.3. Model Validation
A validation process was executed to assess the predictive ability of the software. A multipart cross-tabulation was conducted using the 2008 land-cover map, the 2017 simulated map, and the actual 2017 LULC map as inputs. The output resulted in a map bearing three classes: hits, misses, and false alarms. Hits represent areas where the model simulated change and it actually occurred. Misses represent areas where the model simulated land class persistence, but in reality, it changed. False alarms represent areas that the model simulated would change to urbanization, but in reality, it persisted.
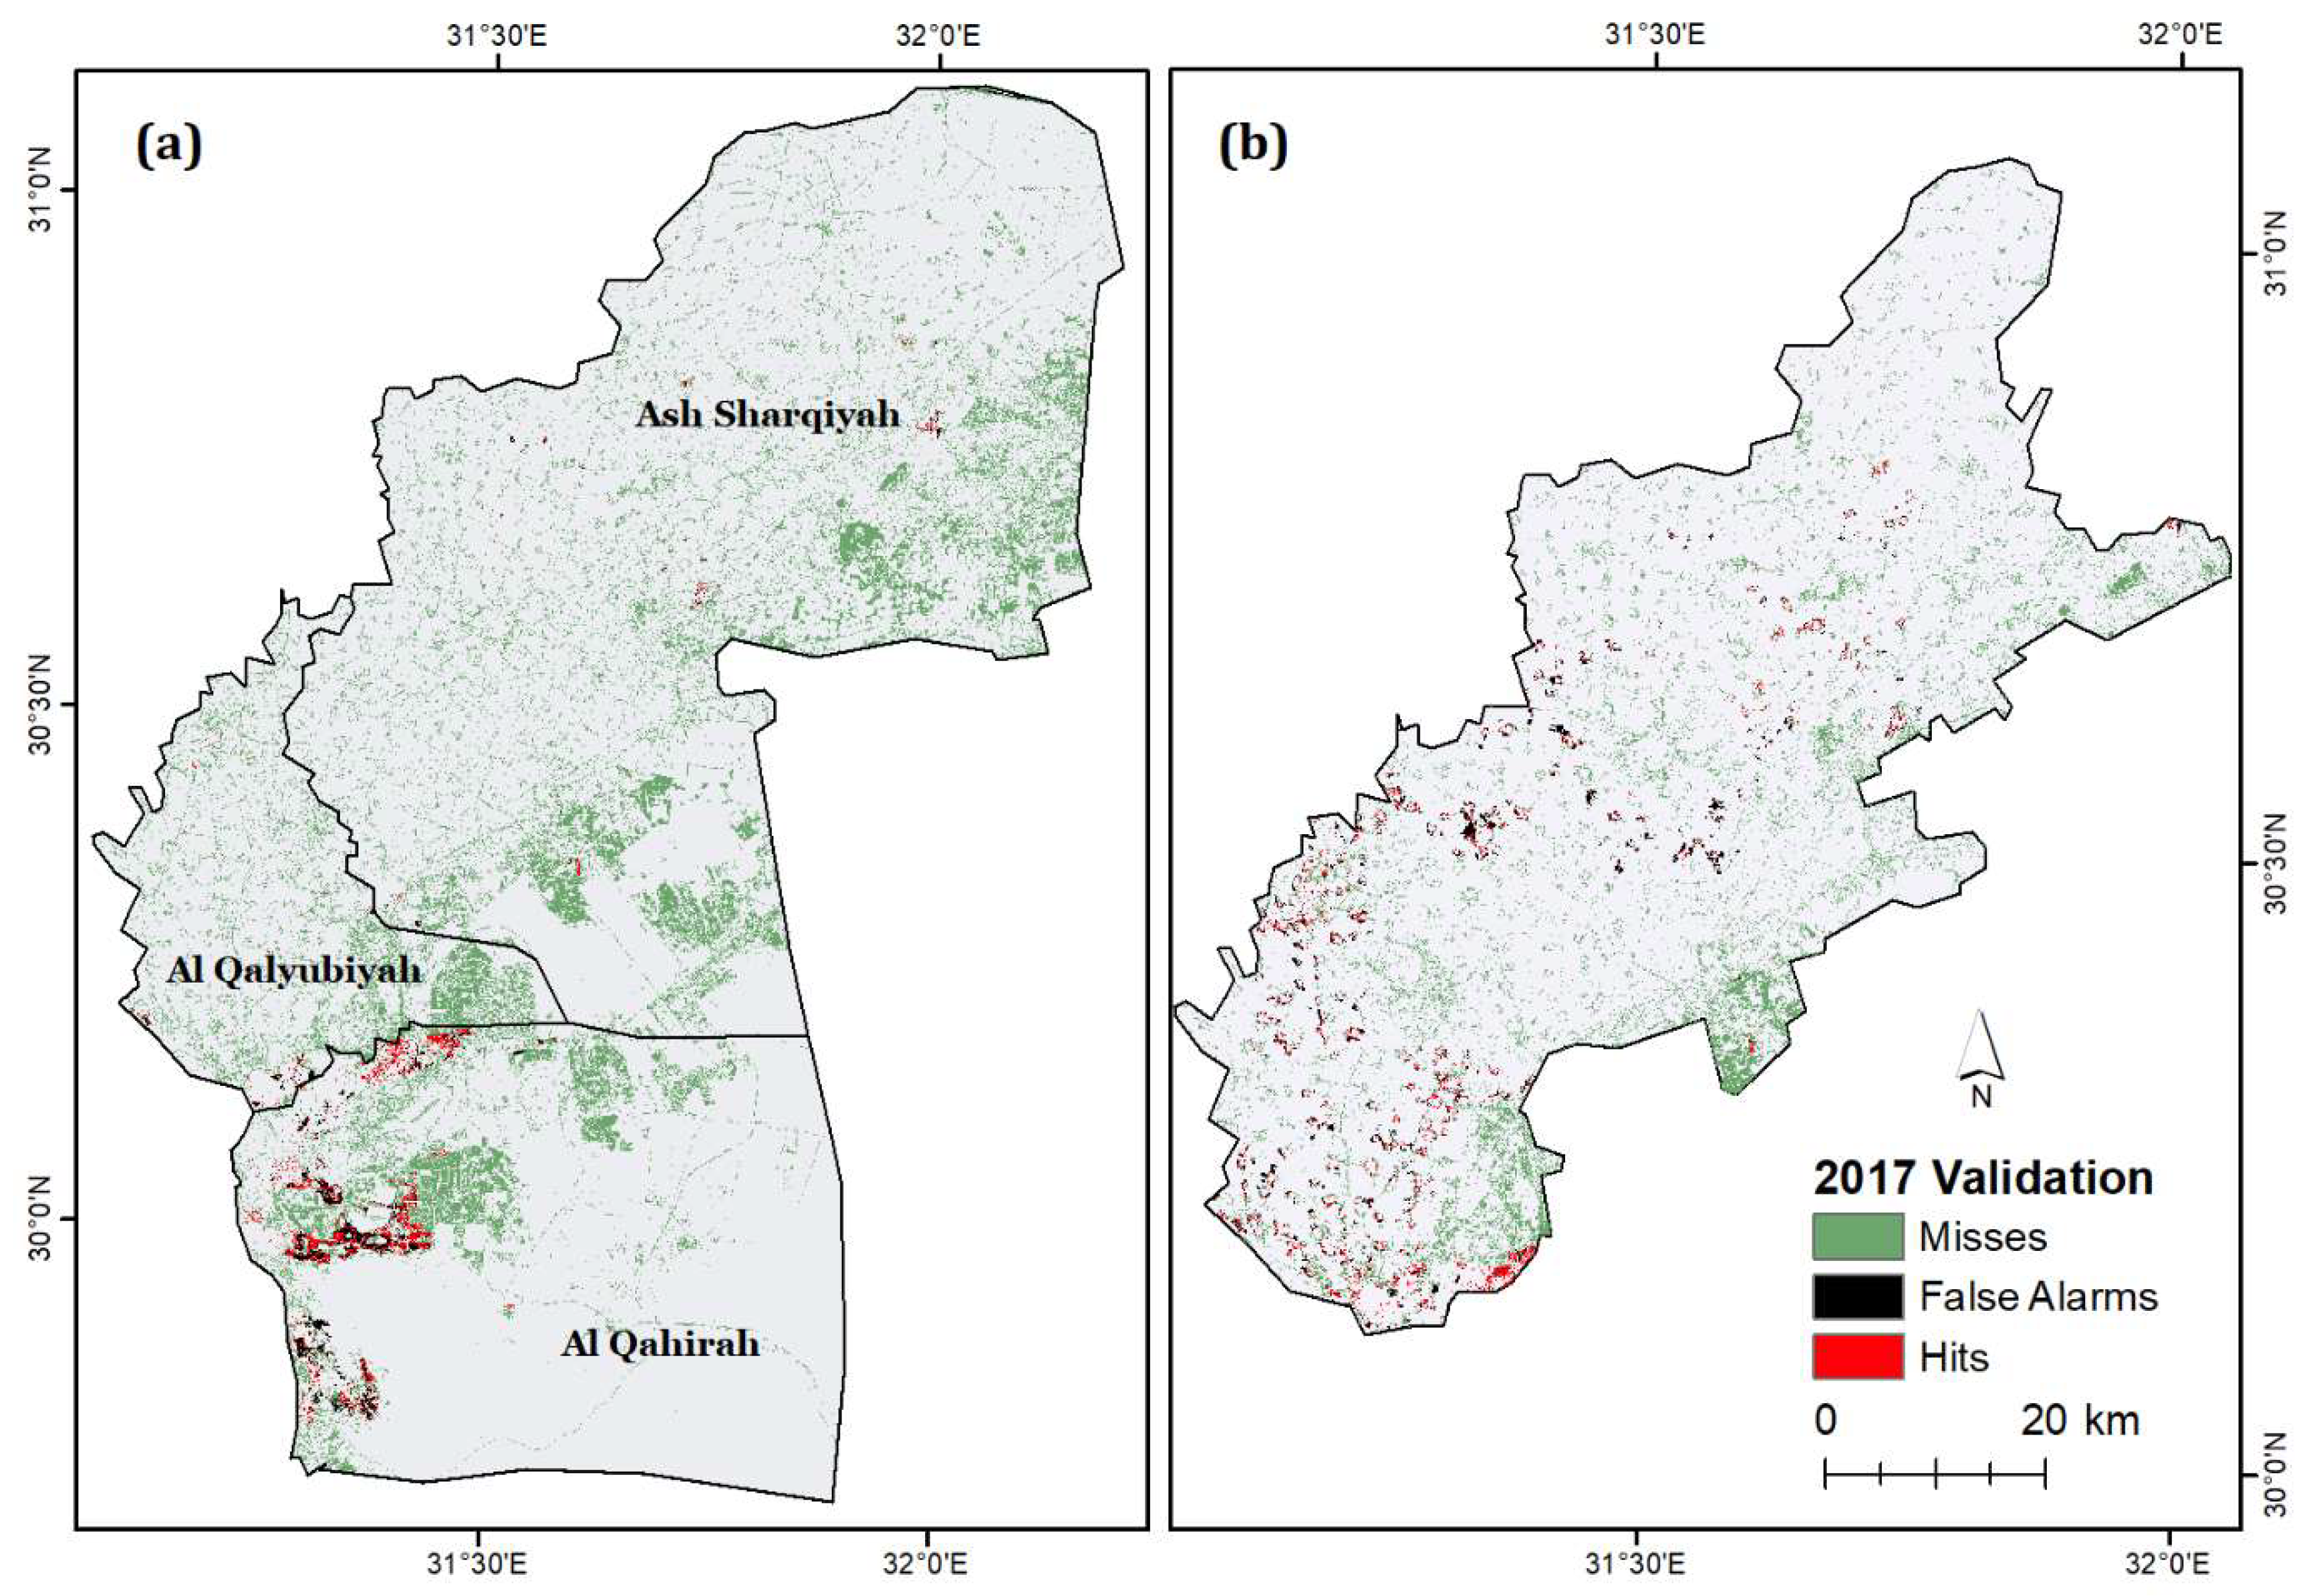
Total simulation accuracy for the hard classification was calculated by deriving the ratio of hits to false alarms. The validation output for the 1988:2008 simulation included 3.71% hits, 3.53% false alarms, and 92.75% misses (Figure 3). A cross-tabulation analysis assessing data similarity and association between the actual 2017 LULC and the 2017 LULC simulation reveal a Kappa value of 93.02%. The high statistical value is mostly likely caused by the high percent of land area that did not undergo a transition.
Many of the model’s simulations, although inaccurate in the exact pixel transformations, were consistently modeled in areas that were in close proximity to actual change. Despite the low numerical representation of the model’s accuracy, the simulated changes were actually fairly spatially representative. Examining additional socioeconomic variables, beyond population, within the model, (e.g., average household income and spatially represented economic incentives) has the potential to increase the overall accuracy of the simulation. The soft simulation was verified by using a Receiver Operating Characteristic Curve (ROC) analysis. The method used the soft simulation output in conjunction with the Boolean map of all changes that occurred between 1988 and 2017 to measure model performance. The final quantitative ROC value represents the accuracy in which the continuous surface of the soft simulation assesses risk given the spatial distribution of the Boolean map pixels [41]. The ROC statistical analysis is accepted as the best technique for detecting algorithm performance [49]. Results of the analysis were 86%, thus indicating a strong statistical similarity and overall high model performance.
Once the model’s predictive abilities were verified for the 1988 and 2008 interval, the simulation was repeated to model the changes between the years 1988 and 2017. The same driver variables were included in the simulation because of their proven influence; however, both distance to disturbances and evidence likelihood were updated to account for the additional acquired disturbances.
The second simulation conducted on only the cultivated lands flank of the study area has a validation with 8.43% hits, 11.25% false alarms, and 80.32% misses. (see Figure 3), and a cross-tabulation Kappa value of 93.29%. The soft simulation had an ROC value of 88%. The higher output values from the smaller analysis are higher likely due to the smaller size and overall elimination of atypical growth patterns that occurred in the desert flank. A simulated map matching the same previously modeled period of 9 years was used to produce a 2026 simulation. Additionally, a LULCC forecast was produced for the year 2050 as a representation of a potential urban expansion worst-case scenario.
4. Results
4.1. LULC Maps Production and Accuracy Assessment
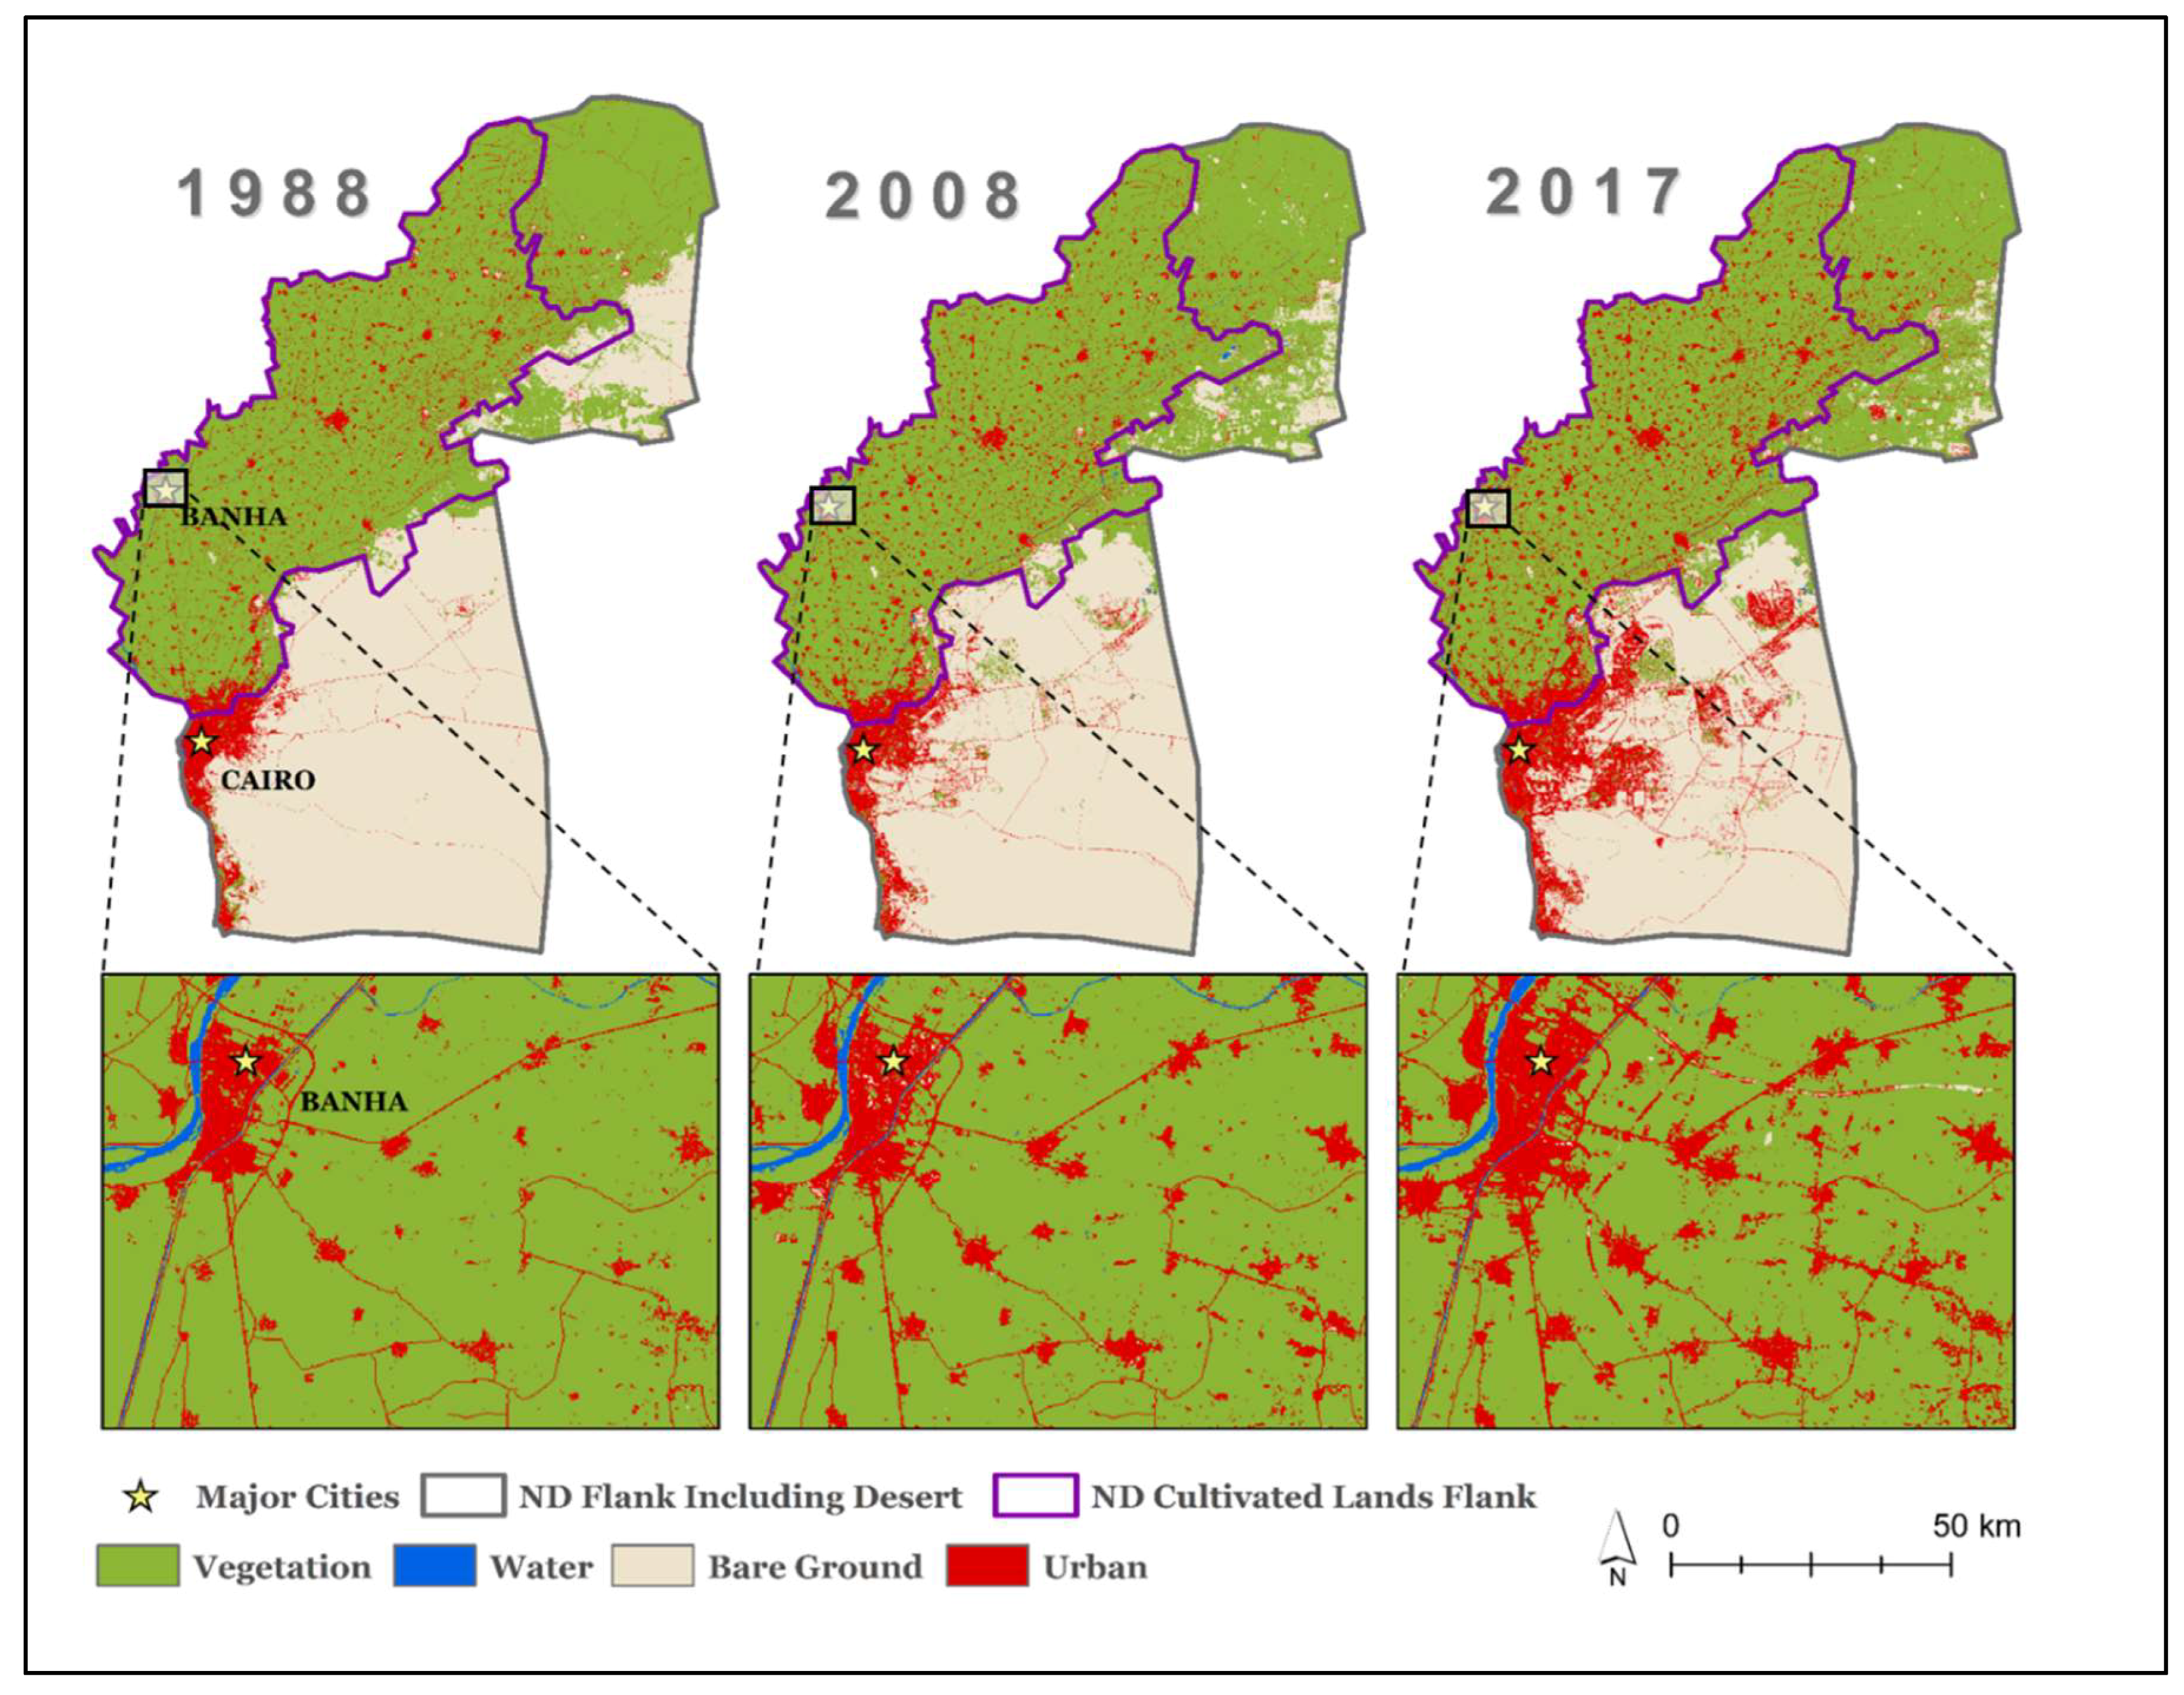
Throughout the entire study period (1988–2017), the transformations from agricultural lands and bare ground to urban were the greatest. Of the total urban transformations, 452.10 km2 were from bare ground and 323.3 km2 were from agricultural lands. Most changes occurred between 2008 and 2017; specifically, 77.46% (350.2 km2) of all bare ground to urban transitions and 72.86% (235.6 km2) of all agricultural lands to urban transitions occurred during this time. Comparison of net urban transformations for both time periods showed that urban transformations tripled (309.8%) in the 9 years since 2008. This considerable difference in urban growth patterns confirms that the rate of urbanization is increasing within the study area (Figure 4).
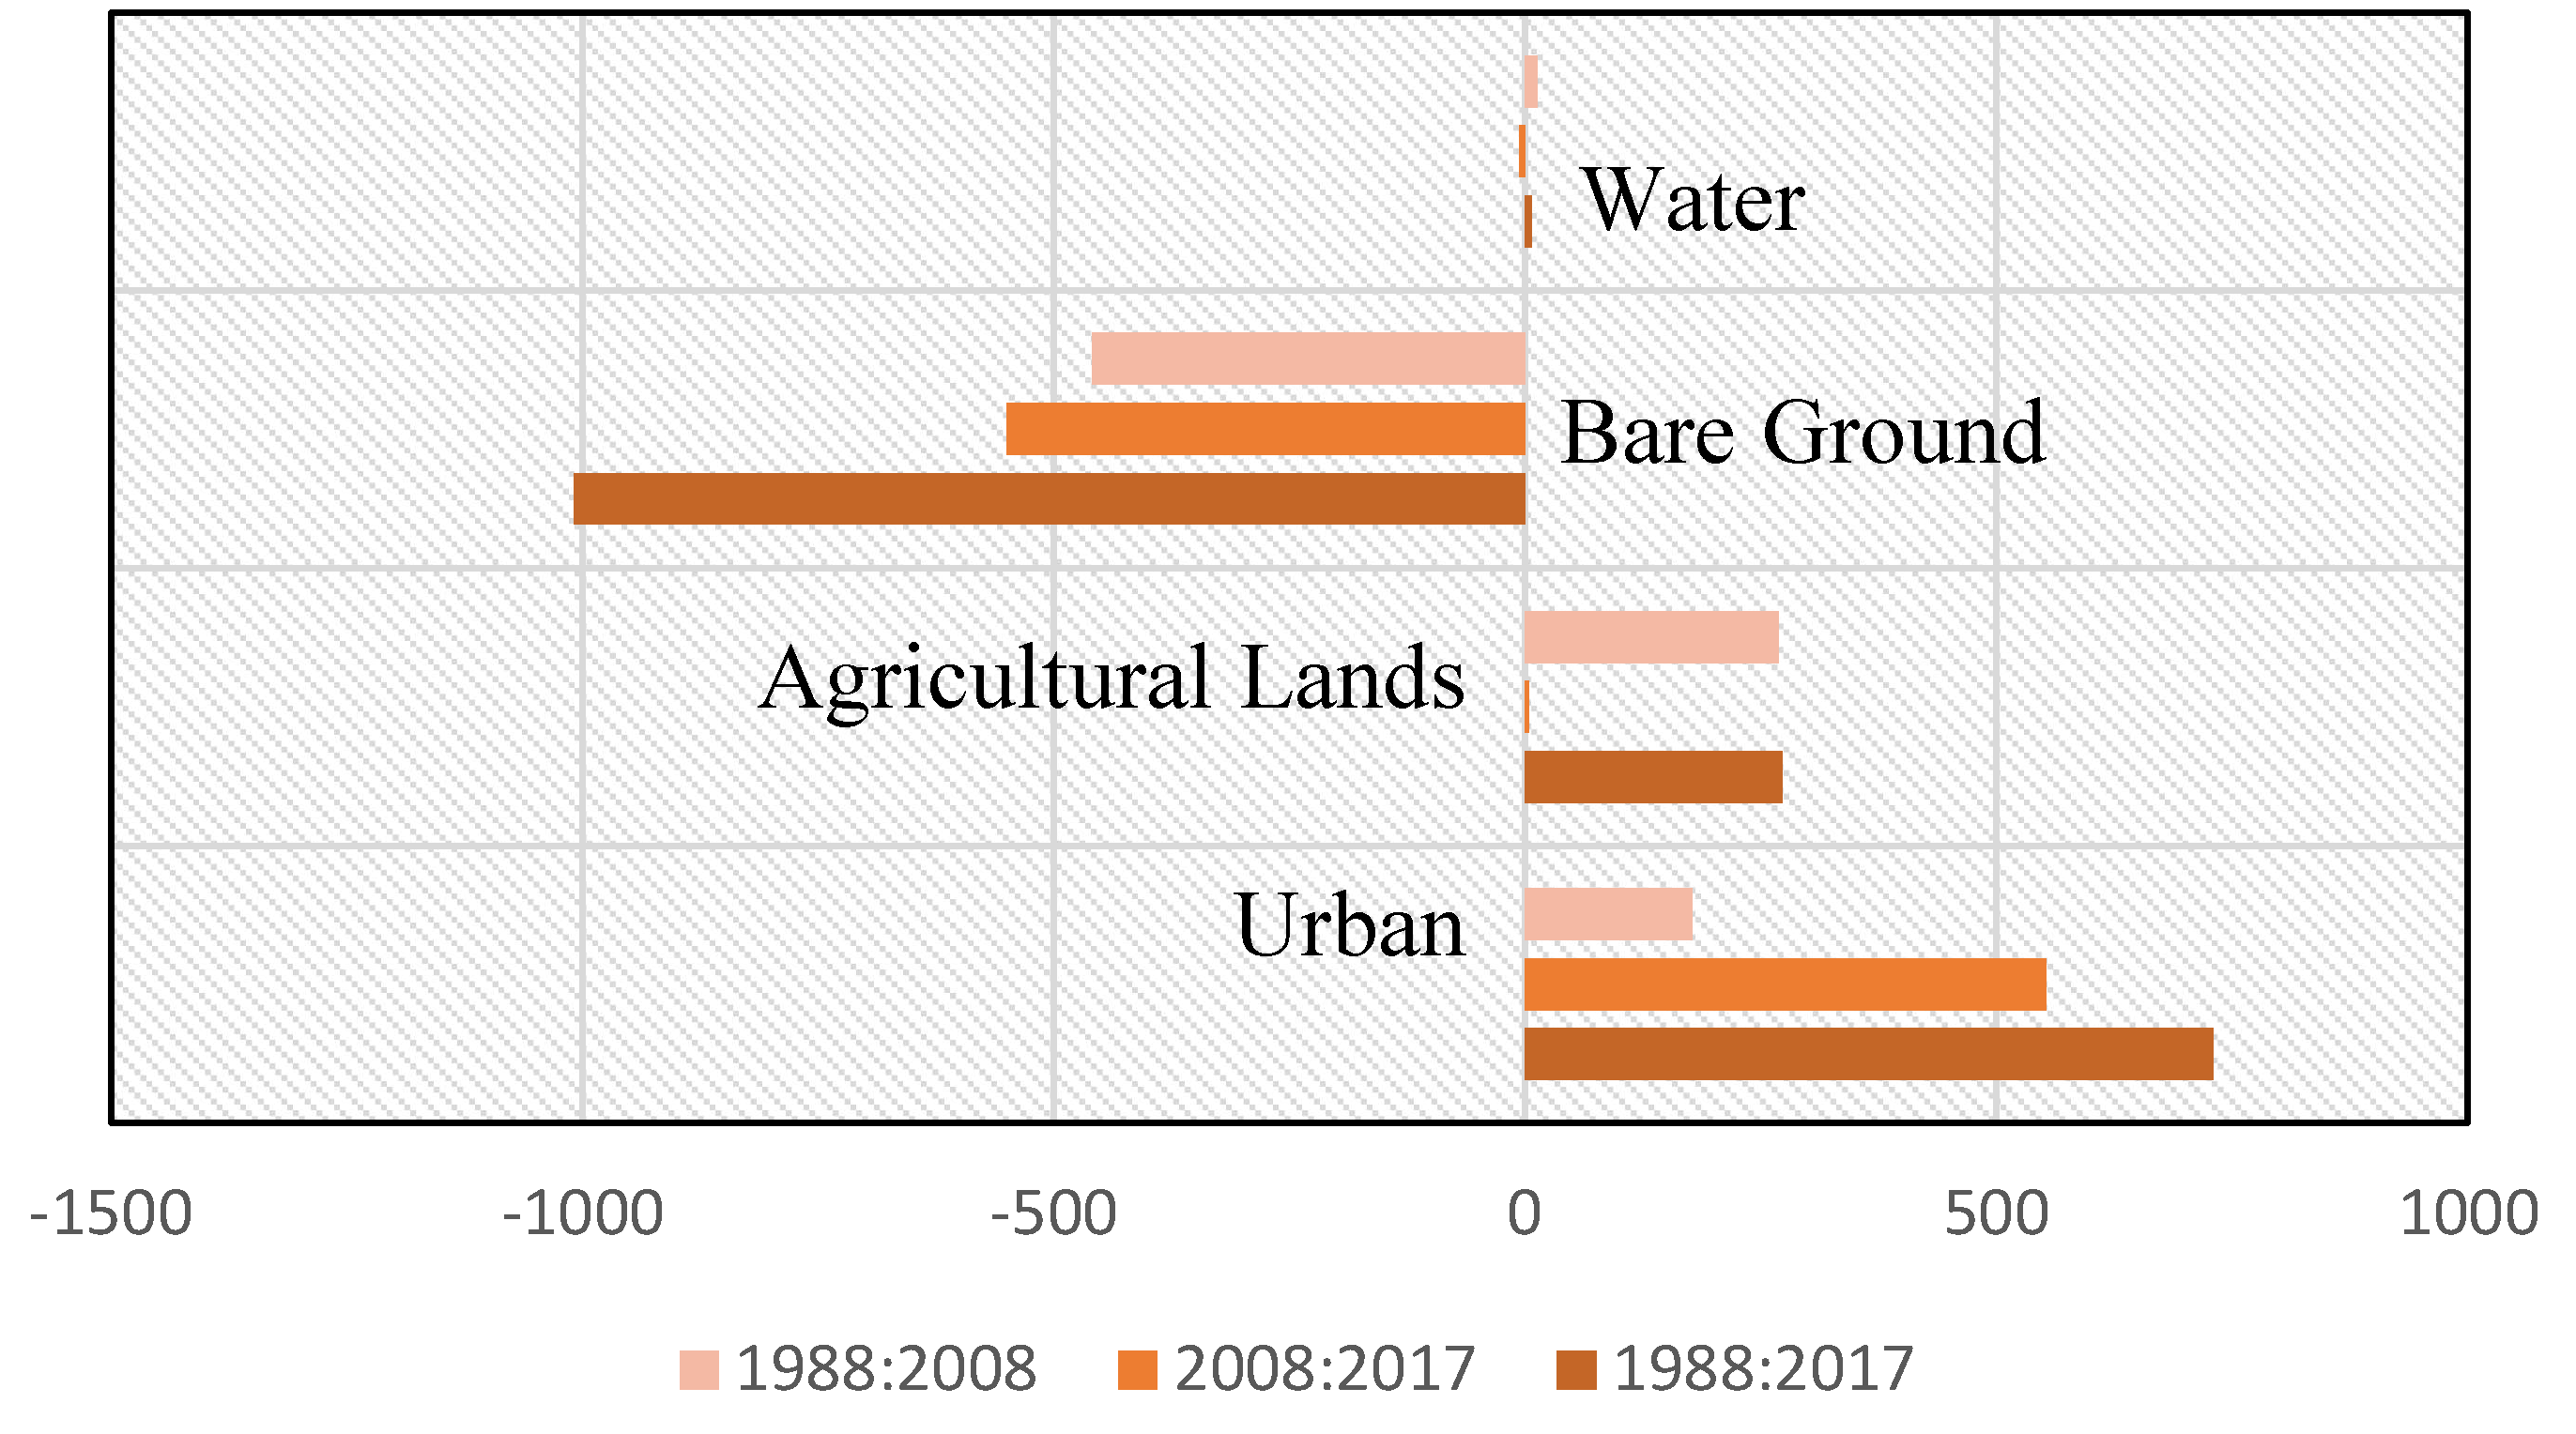
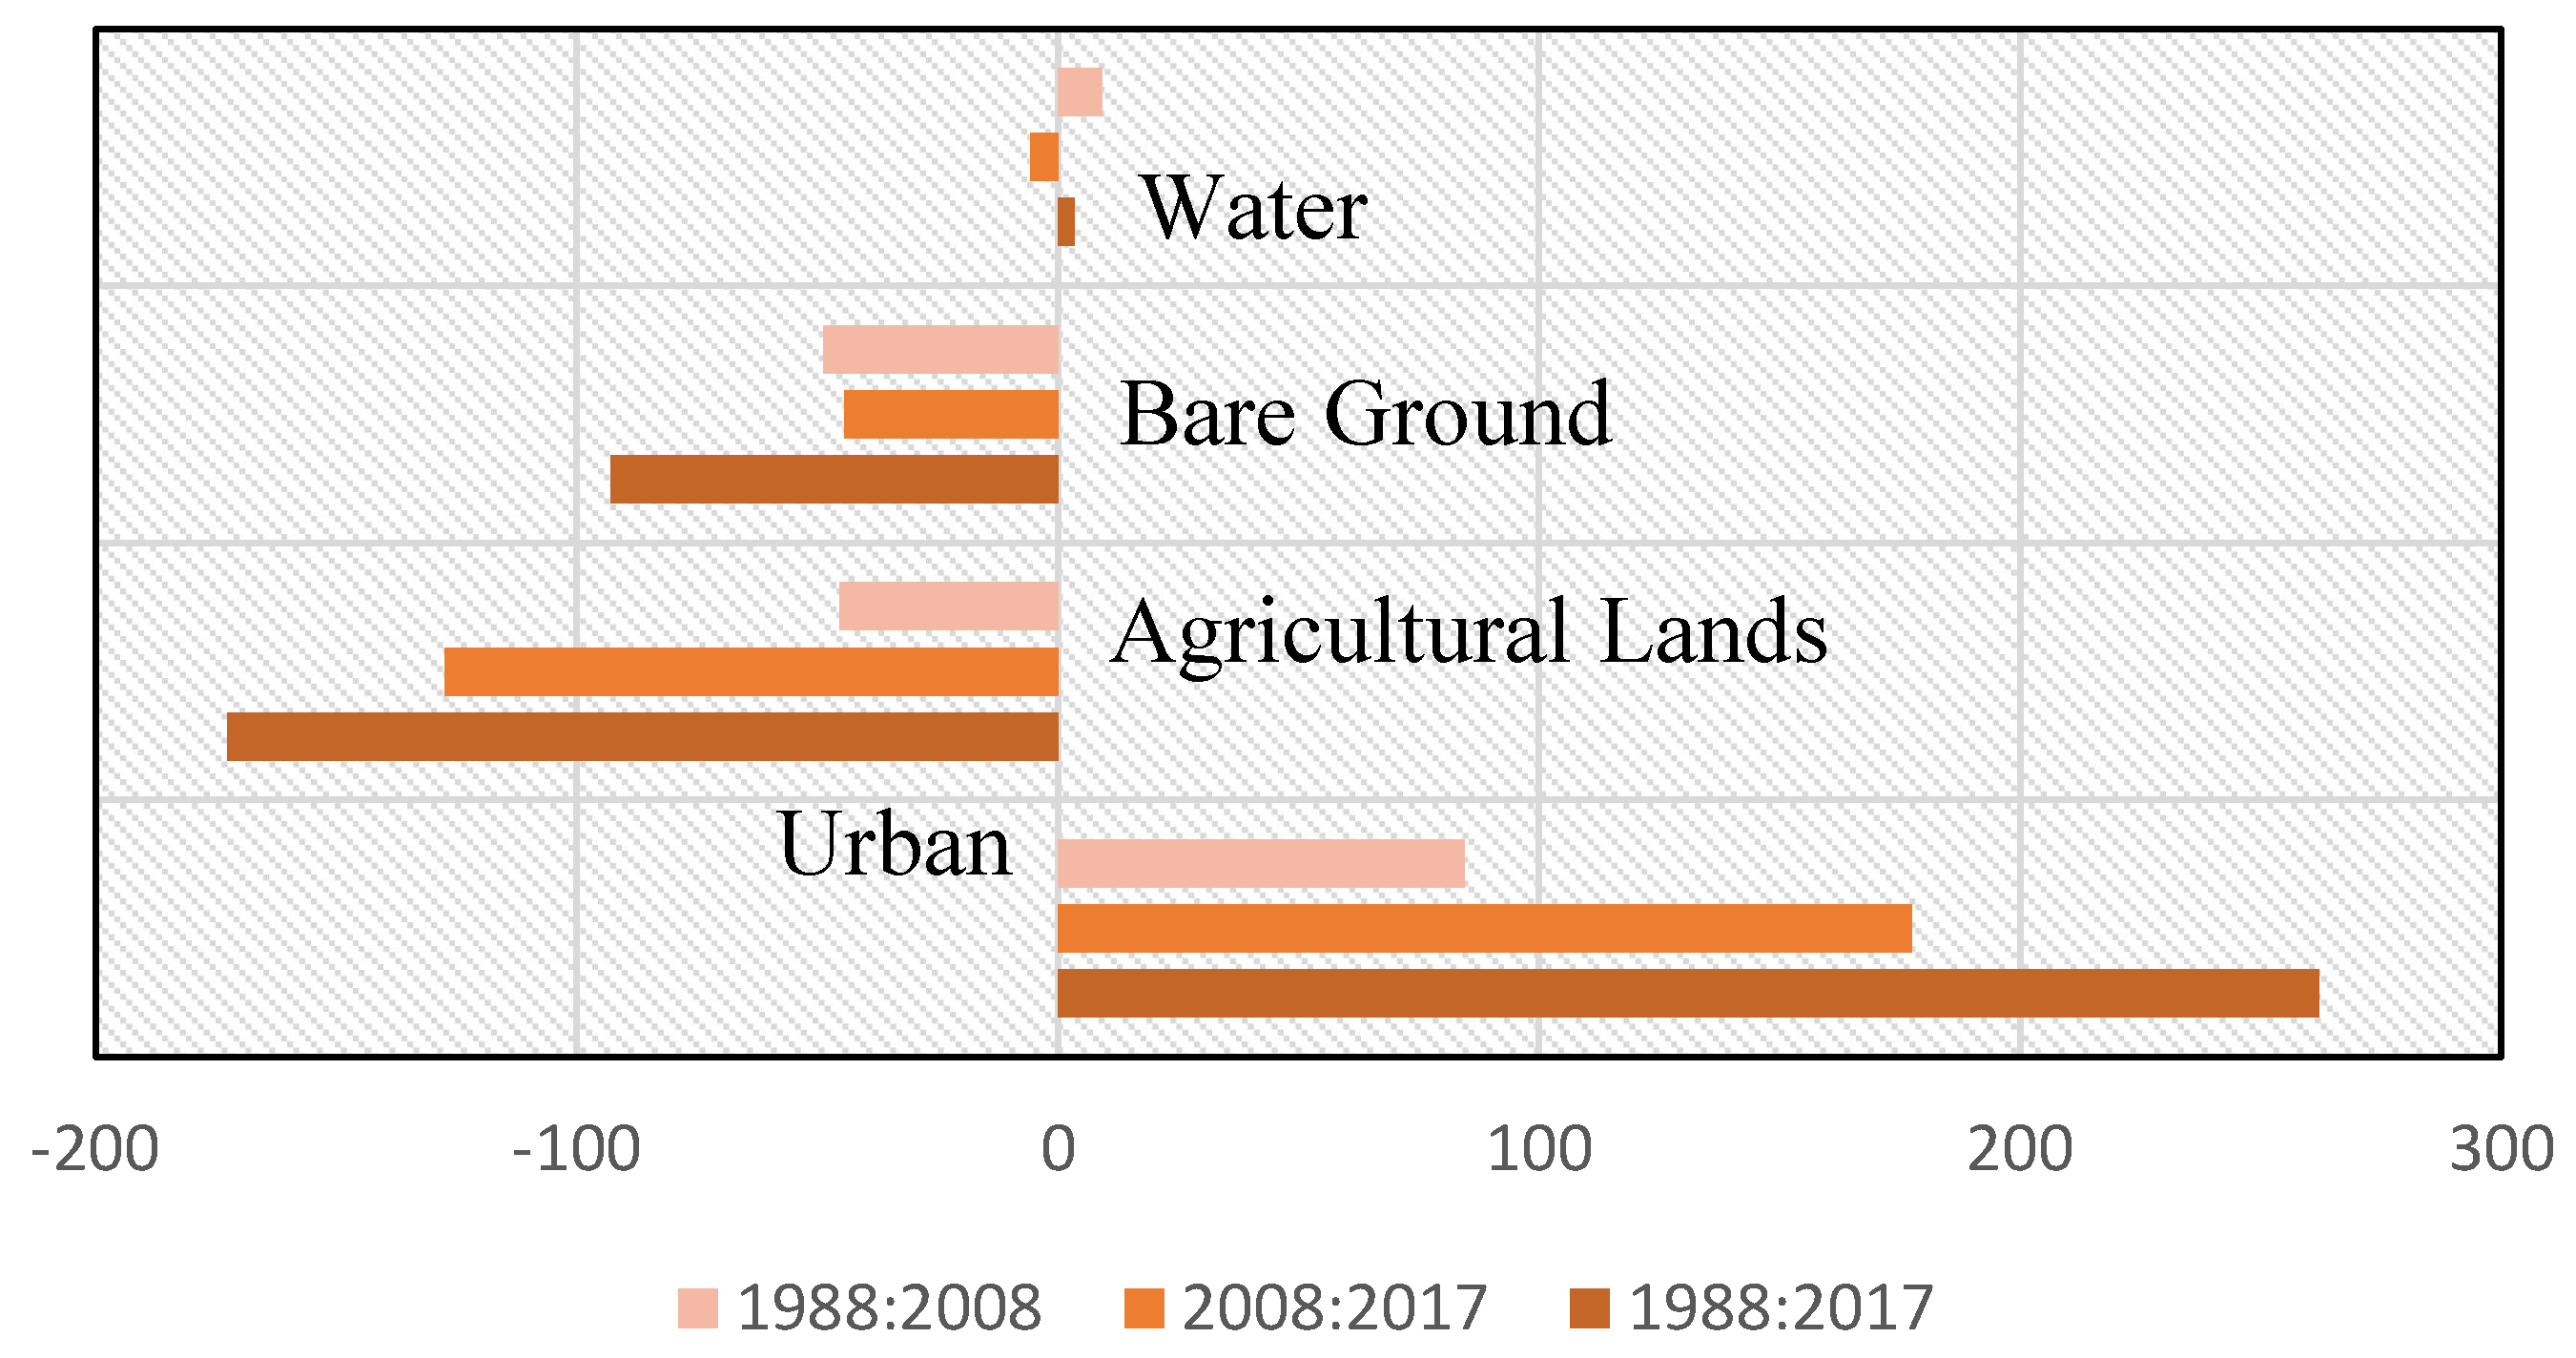
The nature of LULC transformations varied across the study region. Results from the analysis of the transformations that occurred in the ND flank including desert lands display an overall trend of urban growth and bare ground decline (Figure 5). Notably, there has been a net growth in agricultural areas, despite the massive agricultural lands to urban transitions that occurred. Visual examination of the classified maps and the change analysis results indicate that a large percentage of agricultural lands conversion occurred on bare ground—540.66 km2 for the entire study period. This transformation is presumably the result of desert reclamation efforts. Overall, despite the efforts being taken to minimize net cropland loss, urban areas continue to encroach on both vegetative and bare grounds.
Analyzing the transitions that occurred in the ND flank that only included cultivated lands indicated that net agricultural lands per km2 decreased, and that urban growth was the only LULC class that increased (Figure 6). In total since 1988, 276.33 km2 (68,282.6 acres (Feddans in Arabic) and 2.63% of total area) of agricultural lands has converted to urban within the cultivated lands of the ND. Bare ground transitions to urban were very minimal (16.99 km2) and could be predicted due to the low amount of preexisting bare ground areas within the ND. The results from the analysis that included only the cultivated lands of the ND are more representative of the urbanization patterns occurring throughout the rest of the ND. Influences uncharacteristic of the central ND, such as those in the ND flank including desert lands (i.e., desert reclamation efforts and policy implemented urban expansion into desert lands), were excluded.
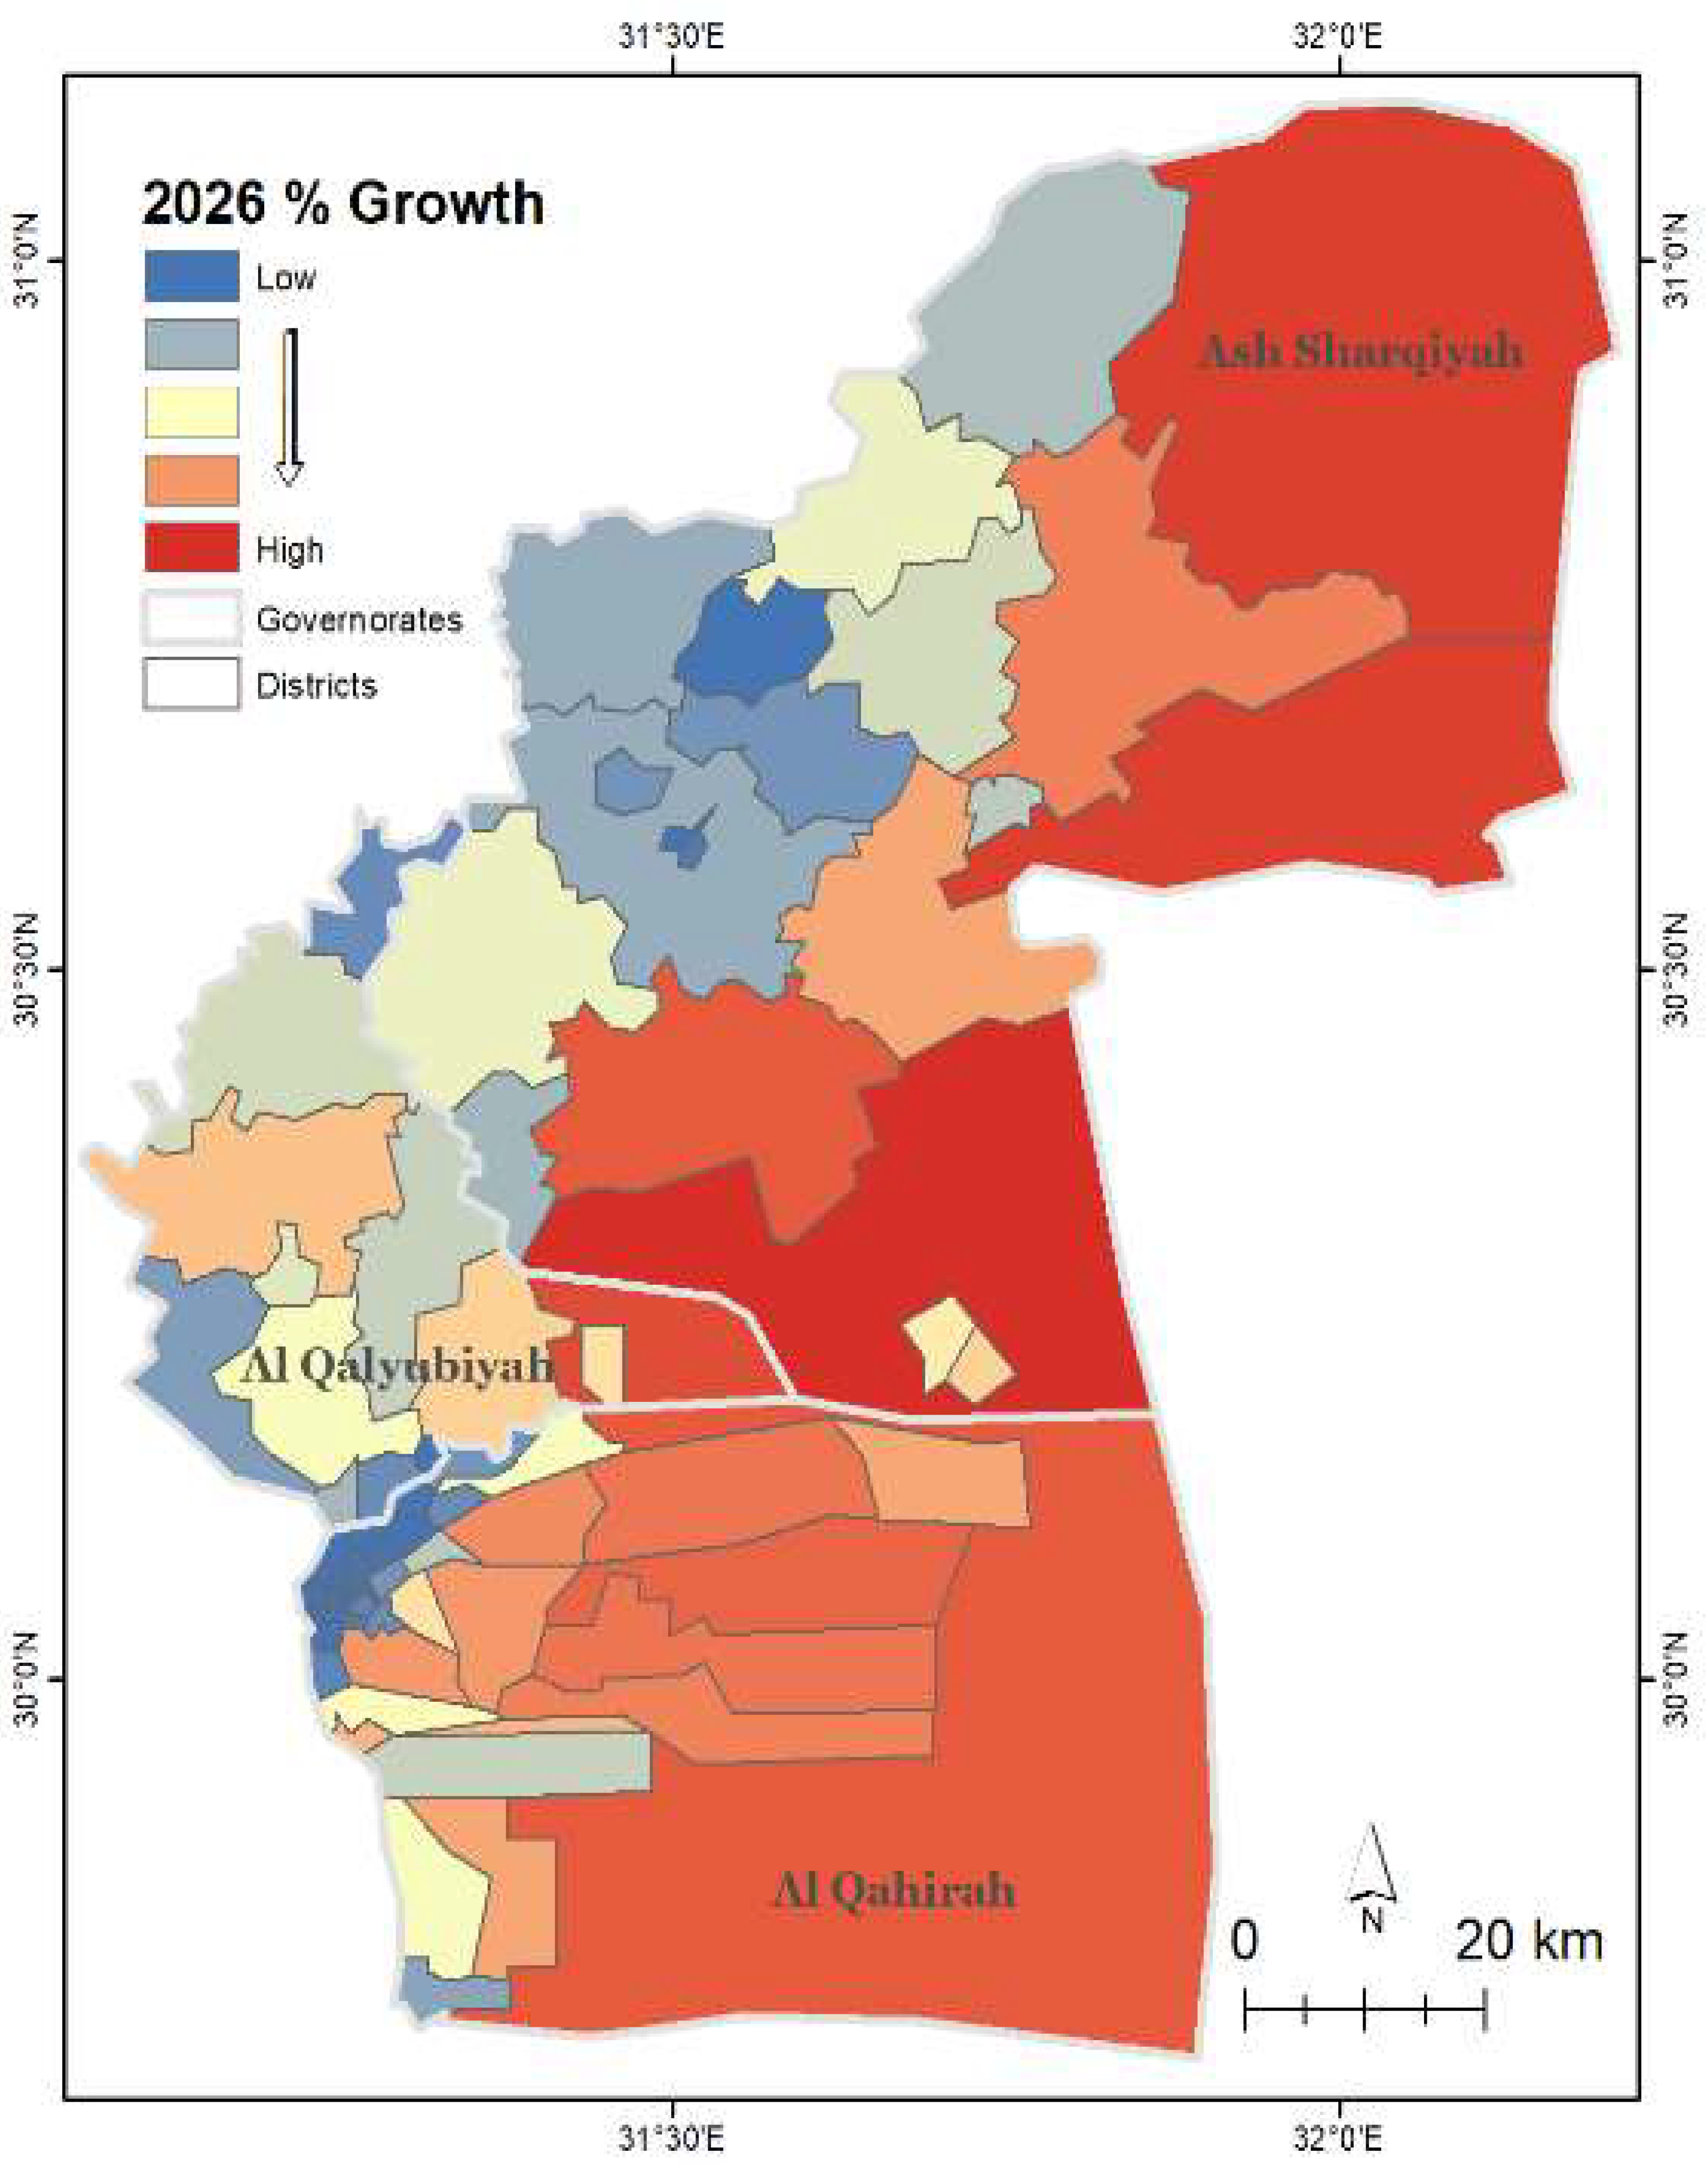
A predicted growth analysis using the Markov Chain algorithm reveals that districts lying within the desert flank of the study area are expected to experience the greatest percent of growth in the years leading up to 2026 (Figure 7). Specifically, western lying districts (e.g., Ash Sharqiyah, Al-Husayniyah, and Salhiyah districts) are simulated to experience the greatest percent of urban growth. Districts simulated to receive minimal to no urban growth are predominately located in the cultivated lands flank of the study area and provide ample space for expansion. Areas of highest minimal percent growth will occur within the Greater Cairo Region. Districts lying within this area, (e.g., Abdin, Al-Azbakiyah, and Al-Matariyah) are either completely or nearly completely allotted to the urban LULC, thus verifying the minimal growth potential.
4.2. Model Implementation
Final simulations for the study area including both the desert and cultivated lands flanks were created using the transition potentials generated in the 1988:2017 MLP neural network model. The overall MLP neural network model accuracies were 85.67% for the 1988:2008 transition potentials development, and 79.30% for the 1988:2017 transition potentials development. Both MLP values were above 75%, thus the specific driver variables inputted were deemed sufficient for further processing.
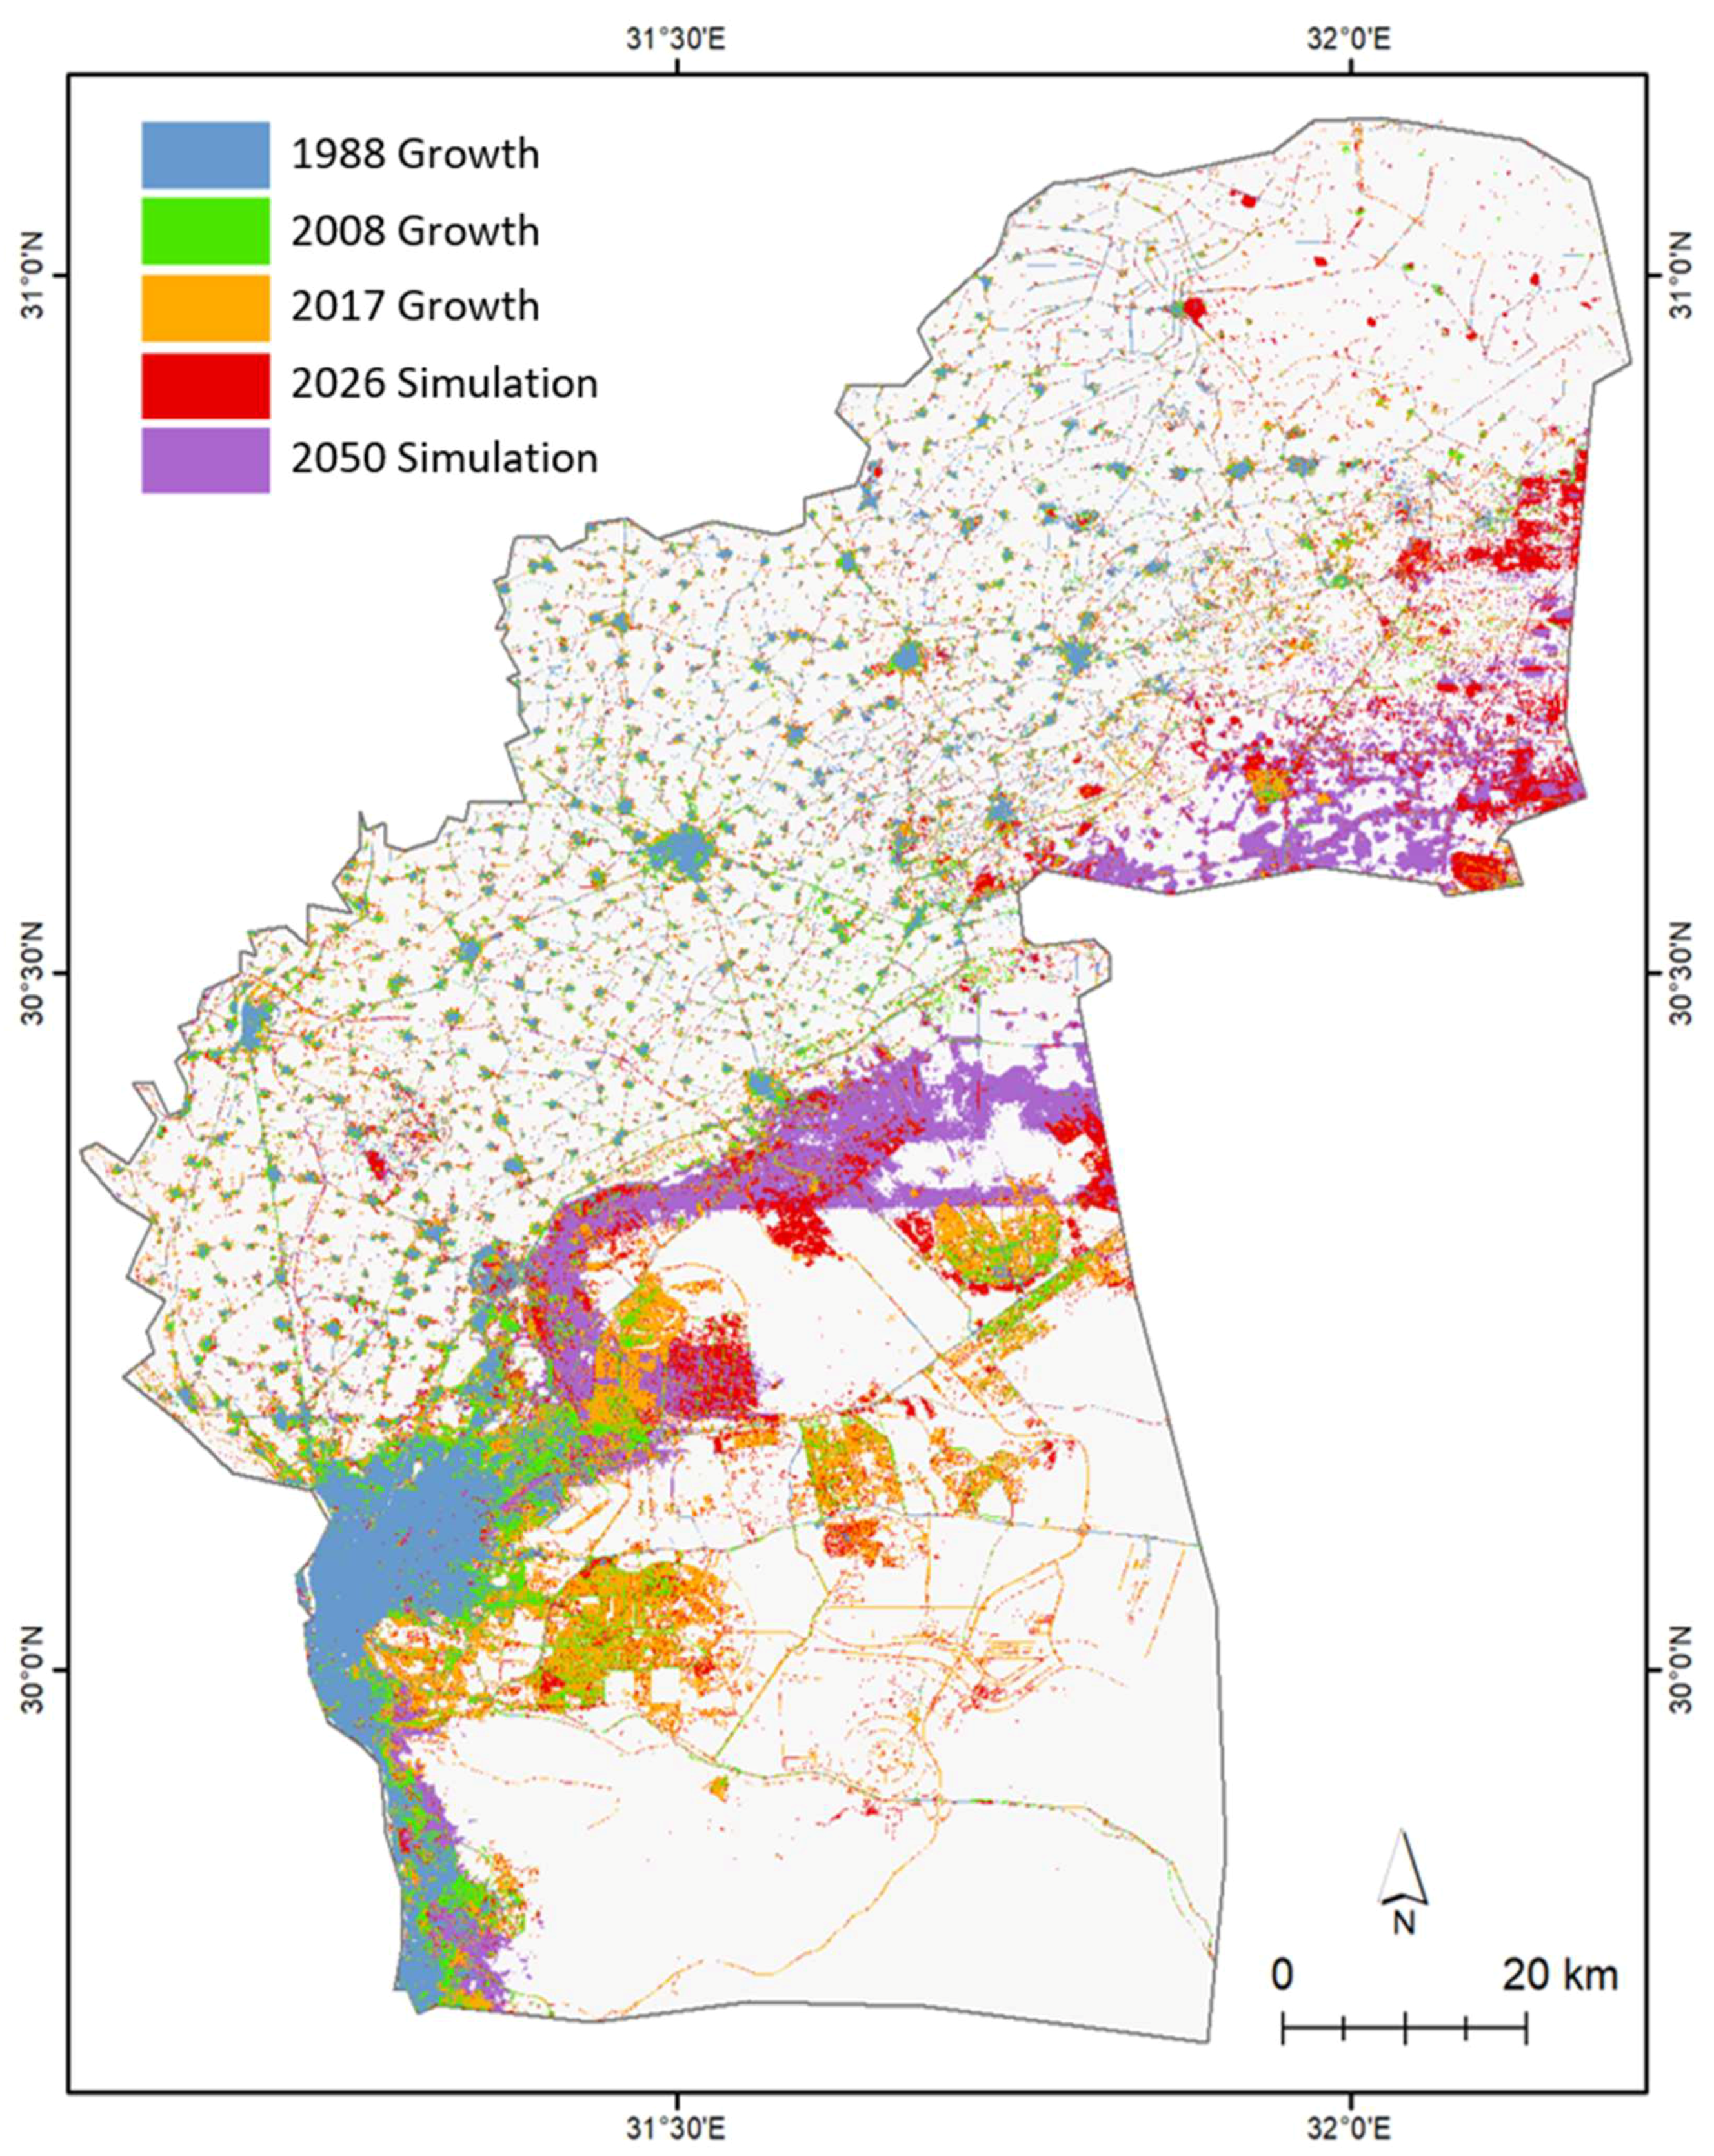
In the 2026 and 2050 hard simulations, urban areas increased by 16.67% (277.27 km2 or 68,515 acres) and 37.82% (843.03 km2 or 208,317.2 acres), respectively, from 2017. Figure 8 displays the growth of urban areas from 1988, 2008, 2017 and the subsequent simulations for 2026, and 2050. In both simulations, most of the urban growth is centered on the recent desert urban development east of the city of Cairo. Urban areas in 1988, 2008, and 2017 represented 6.56%, 8.43%, and 14.56% of the total study area, respectively. In 2026 and 2050, urban areas are expected to represent 17.52% and 20.57% of the region, respectively.
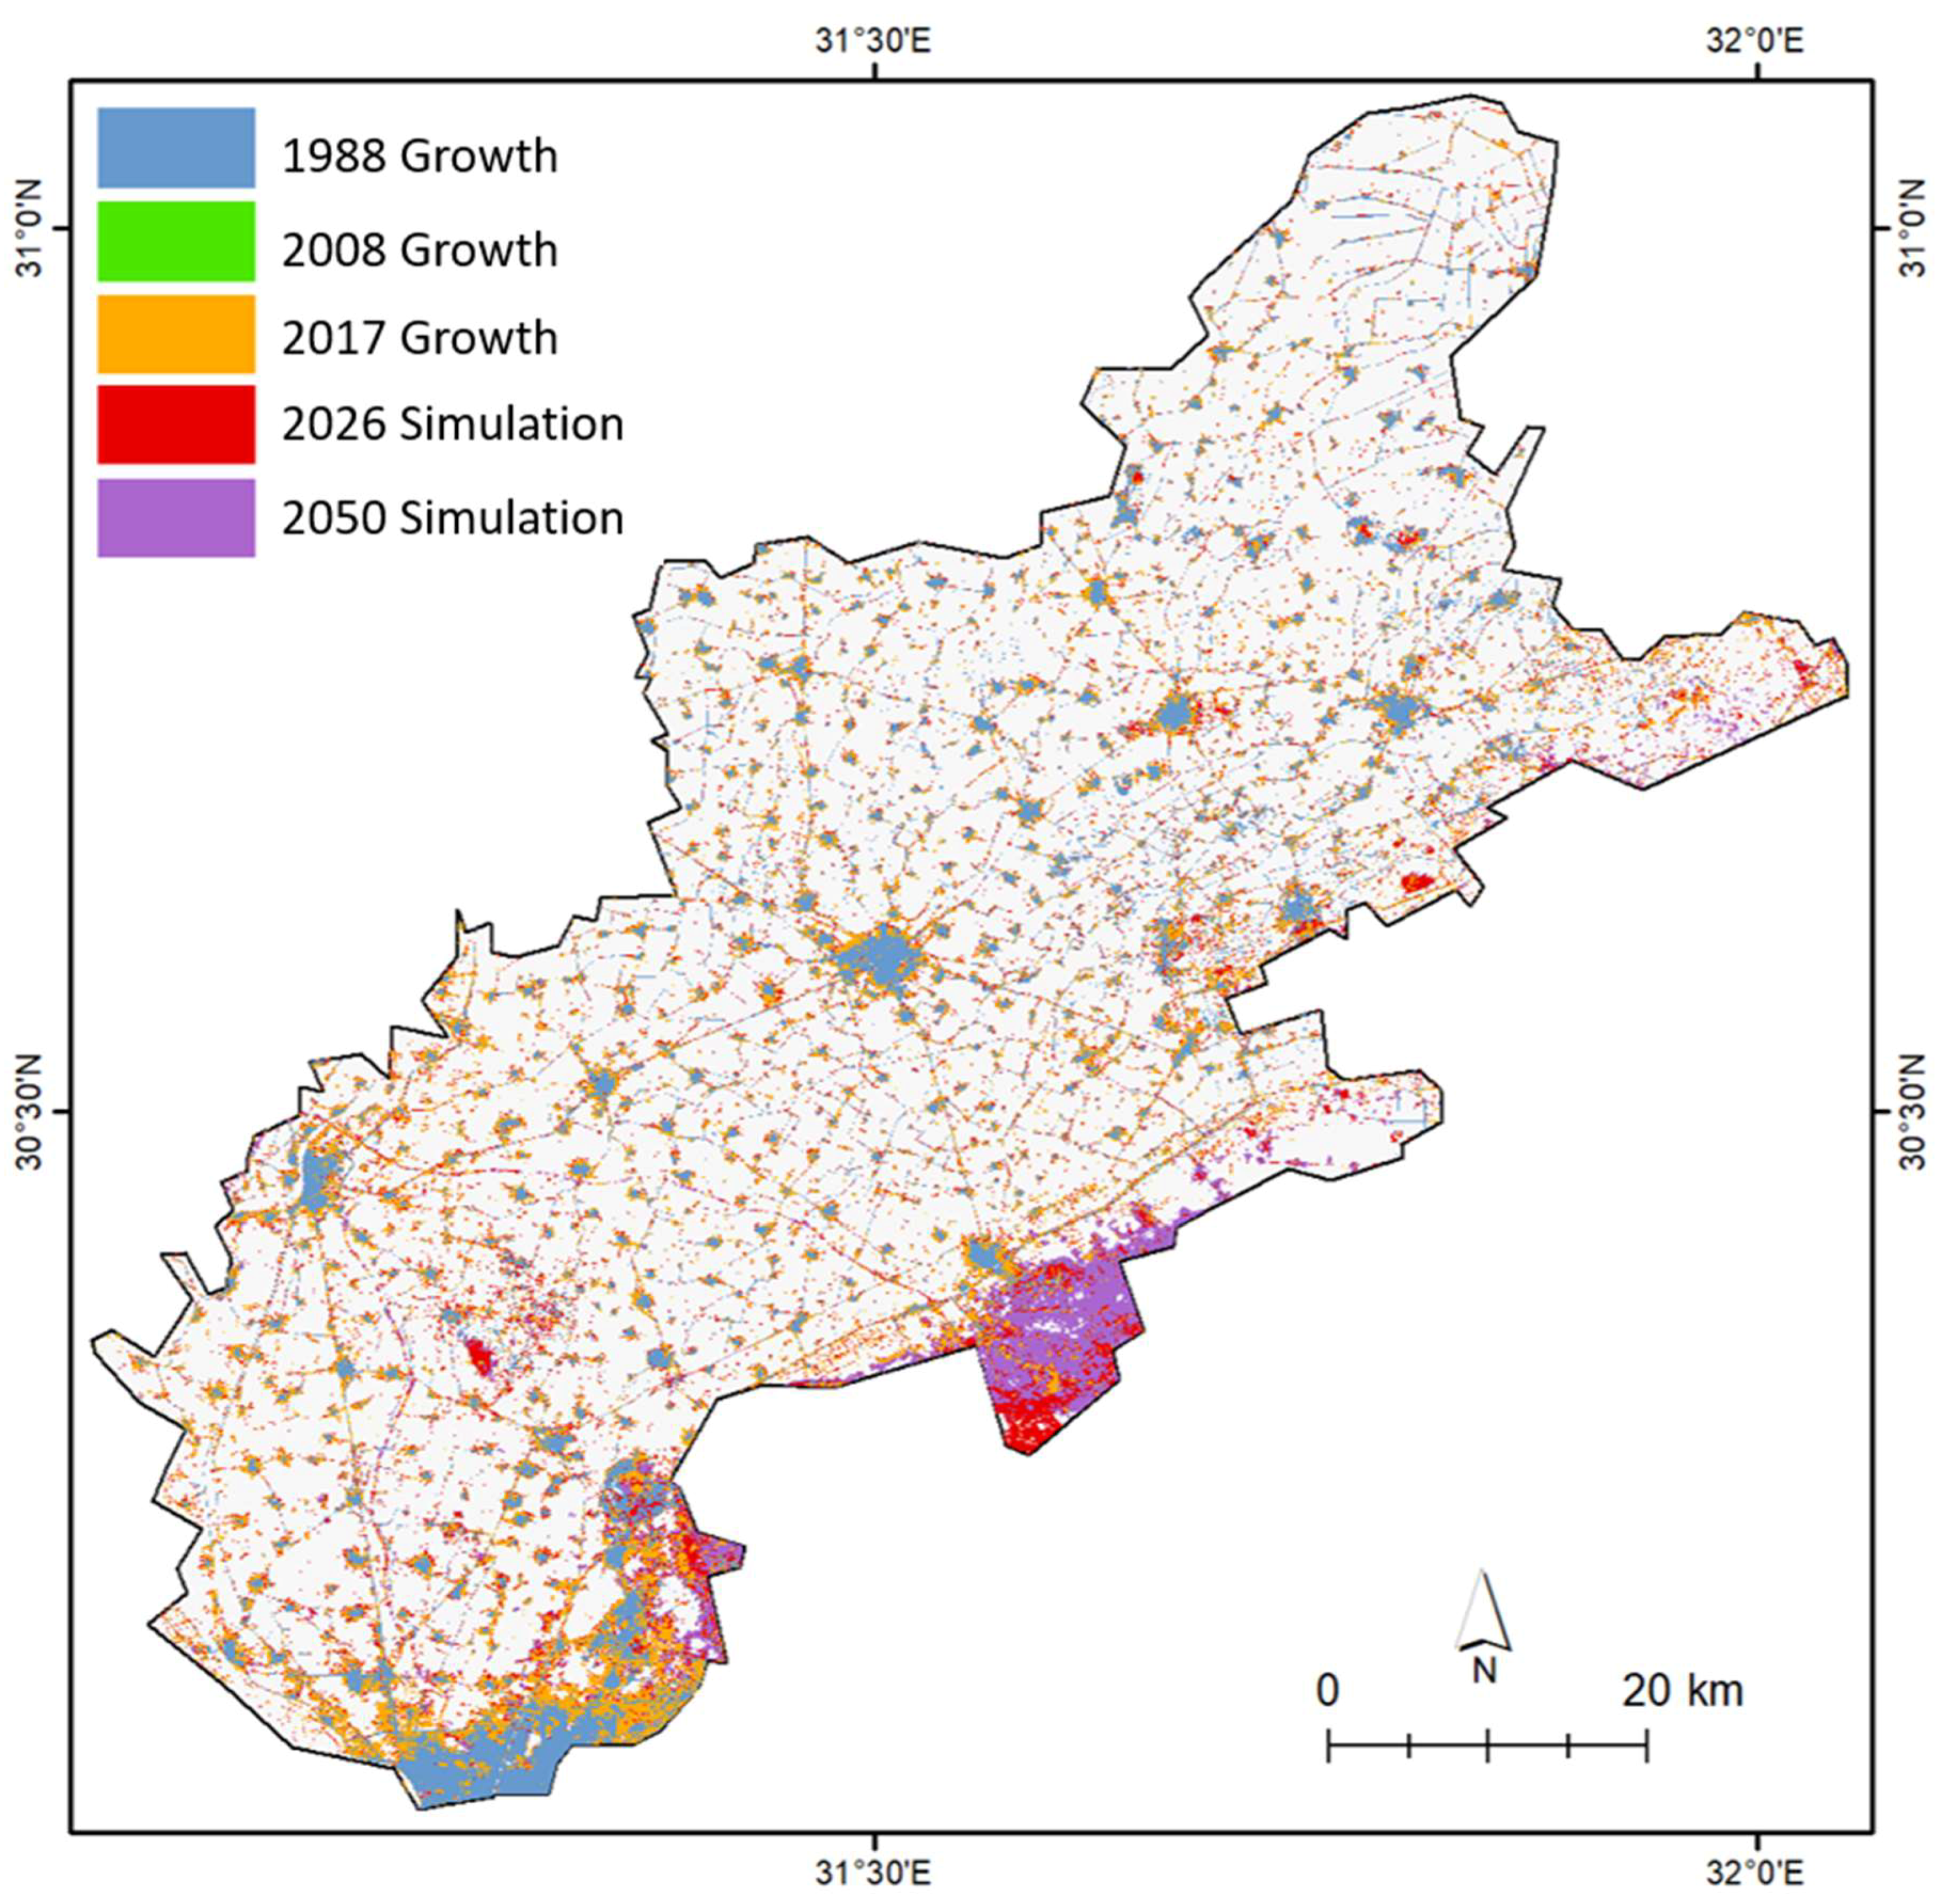
The simulated assessment for the smaller study area including only the cultivated land flank were also generated using the transition potentials generated in the 1988:2017 MLP neural network model for the smaller subset. Overall MLP neural network accuracies for the 1988:2008 transition potentials were 87.85%, and 79.68% for the 1988:2017 transition potentials. In the 2026 and 2050 hard simulations, urban areas increased by 13.81% (104.11 km2 or 25,723.8 acres) and 32.93% (319.03 km2 or 78,834 acres), respectively, from 2017. Figure 9 displays the growth of urban areas from 1988, 2008, 2017 and the subsequent simulations for 2026, and 2050 for the smaller cultivated lands flank. Throughout the 29-year study period, it is evident that urban areas are also increasing within the smaller cultivated lands flank as well. Furthermore, a majority of the previous and predicted growth is concentrated around and expanding upon existing urban areas.
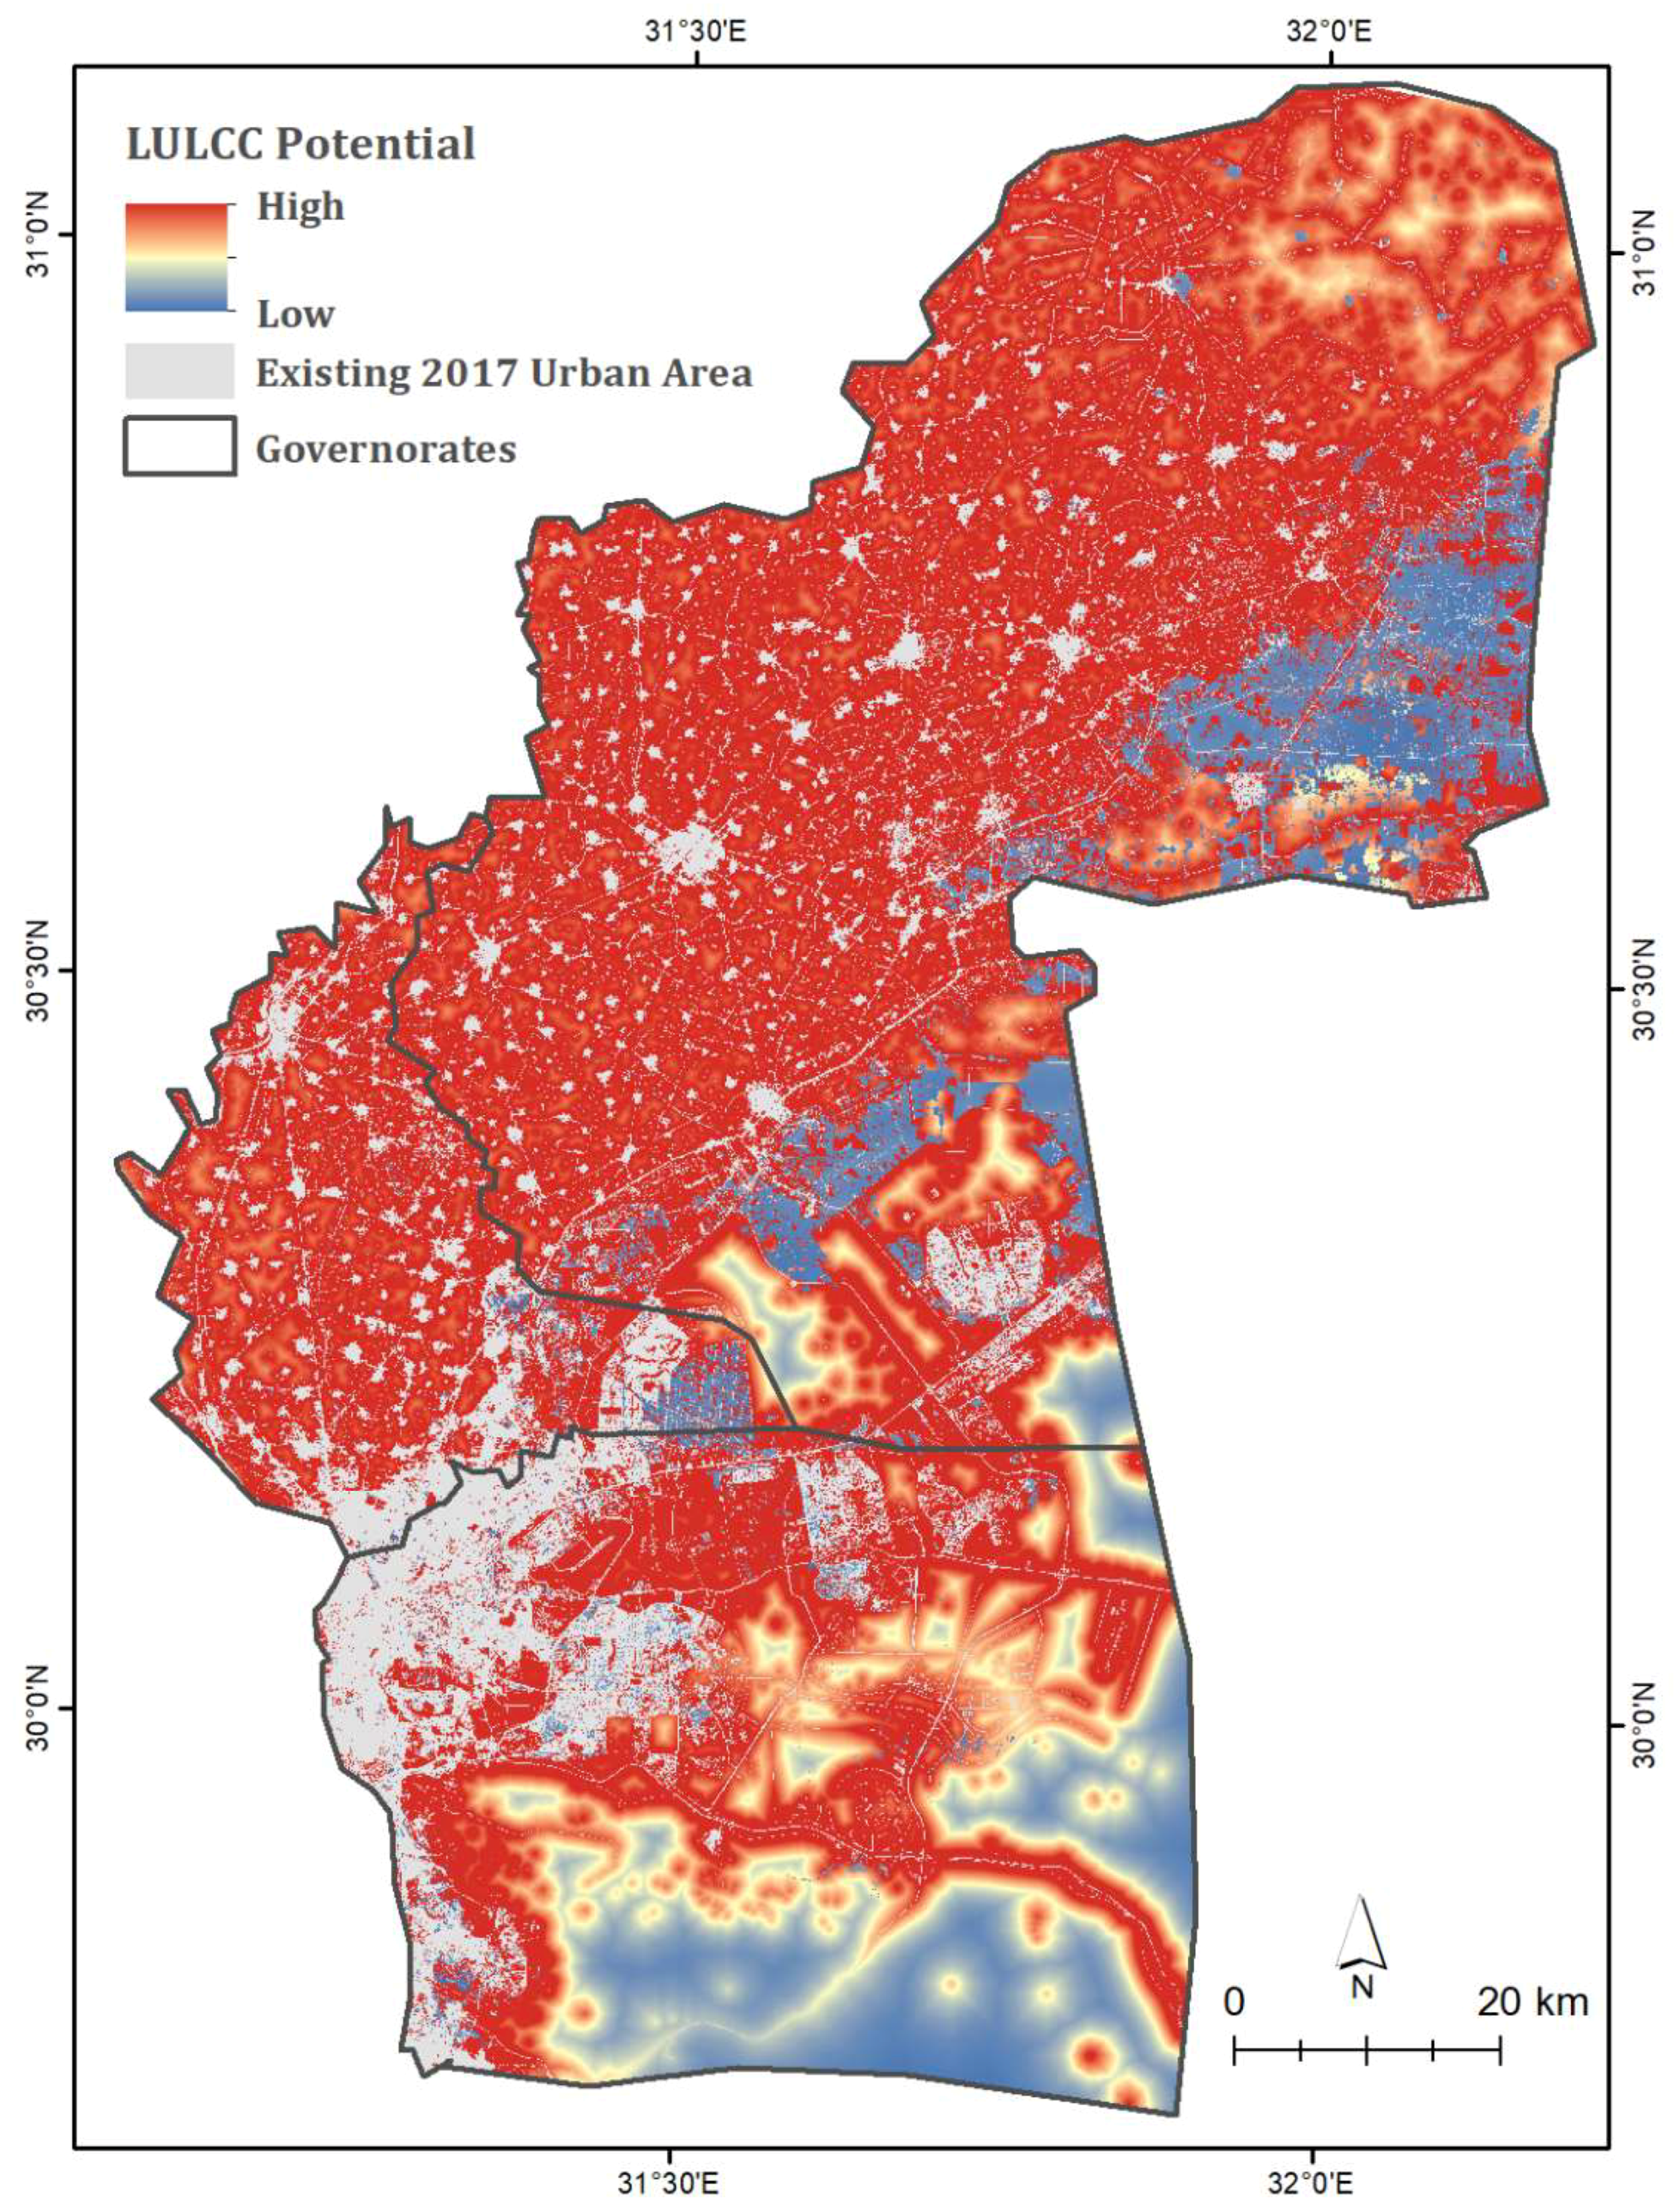
A soft simulation of urban growth was also generated by the map simulation model and serves as better guide for determining areas at risk in comparison to the restrictive hard simulation. As shown in Figure 10, the soft simulation identifies areas most susceptible to urbanization using a gradient scale. This result is more helpful in a broad planning sense, as it allows for entire regions to be considered for change instead of individual pixels.
4.3. Future Impacts of Urbanization and Potential State of the ND
Negative impacts of urbanization on the ND are currently widespread, and with the increase in urban growth arises a further concern for ecological protection. The expanding nature of urban growth in this region demands regulation. The current regulations, which are inadvertently increasing urban areas, must be counteracted with new, evidence-based action. Failure to reduce the current exponential rate of urbanization promptly and efficiently could be detrimental to Egypt, as well as other Middle Eastern nations that depend on Egypt’s stability. Furthermore, the results from this specific region are important because the aggregation of all local LULCC, including changes mapped in this project, are representative of change on a global scale, and their effects cumulatively contribute to the alteration of the Earth system.
5. Discussion
This study showcases the variability of urban growth within this region of Egypt, and it highlights the need for different urban growth management techniques for each region (i.e., the central ND, and the perimeter of the ND). Although the two study areas are spatially close, this study reveals that the regions yield two distinctly different patterns of growth. As seen in the ND flank including desert lands, urban growth along the perimeter of the ND experienced a high rate of growth that sprawled eastward into the desert during the 2008–2017 period. In comparison, urban areas that are landlocked within the ND, such as the ND cultivated lands flank, had less area to expand during this period due to the high density of surrounding agricultural farms. This region as a result had a lower growth rate, with most of the expansion occurring around previously developed areas. Simulation of change scenarios such as this provide useful information about potential transitions, and it can serve as a starting point in enabling policy makers and land planning officials to share opinions and reach agreements on various management plans.
Essentially, the present study serves as an insight into what could potentially occur in this region of the ND if the examined conditions were to hold. Similar studies, [32,42,43,50] have identified that built-up land has drastically increased since the beginning of the 21st century, and will continue to increase in the future. Although urbanization has been noted to be the greatest contributor to LULCC [32], the overall landscape of the ND has been significantly transformed on several fronts. Natural habitat and preexisting agriculture fields have been converted to water-intensive, yet monetarily beneficial crops [50]. Increased irrigation and resulting water availability has been identified as a likely driver in increased agricultural expansion within this area [51].These findings are analogous with the discoveries incurred within the present study, thus signifying the high likelihood of LULCC in the future within the ND as the country continues to develop.
The impacts of urbanization, and general anthropogenic impacts at large, can have a multitude of negative consequences on the environment. Degradation in water resources in terms of both quality and quantity have been documented in areas of the Middle East and Mediterranean that have experienced rapid urbanization [52]. This phenomenon is directly correlated with the increased availability to modern agriculture technology, such as canal construction and chemical fertilizer use, coupled with the general switch to more water-intensive cash crops (e.g., olives and grapes) and urban storm-water runoff [43,52]. Furthermore, many biodiverse habitats have been converted because of the increasing pressures from urban growth. Specifically, many Mediterranean wetlands are being converted into aquaculture facilities to meet the needs of the growing population and consequent food scarcities [53]. Urbanization will exasperate climate change impacts within the region, thus contributing to increased temperatures, biodiversity loss, reduced precipitation in an already arid region, and recurrent climate extremes [54].
Many studies within the Middle East and North African region are limited in the relevancy of their data. Most are limited to imagery obtained from the early 2010’s, thus are inadequate in showcasing the change that occurred after the Arab Revolution. The present study showcases the drastic expansion that occurred in the early 2000’s, while also highlighting the change that occurred during a more turbulent governmental period.
It is worth mentioning that the transition probability in the Markov Chain model is assumed to be uniform and, hence, it is hard to accommodate for the unforeseeable influence of some important variables, such as the governmental strategy, climate conditions, or anthropogenic disturbance [55] With that being said, there are some limitations in which the present study can expand. For example, only three images were used in this study to scrutinize the land-cover change. More images should be used to capture and forecast the land change with more detail. Moreover, the accuracy of the model’s output is a function of the accuracy of the individual input land-cover maps which derived from medium resolution satellite (e.g., Landsat). Uncertainties in these classification maps will be propagated through the LCM model and produce problems in historic change quantification, future scenario output and the potential to transition map. Such limitation should be taken into consideration when interpreting the derived simulation maps. Therefore, incorporating more spatial and temporal satellite data, (e.g., very high-resolution WorldView-2 or -3 images) into the simulation of LULCC can yield more accurate long-term forecasts of future change.
Another limitation of future modeling is derived from the stationary distribution of the Markov Chain analysis. The method determines a rate of change based on previous evidence of LULC disturbance, and then subsequently uses that rate to simulate future change. Typically, past information does not always explain future modeling. Land-cover change can vary depending on decisions made by local authorities or the government [56]. The structure of the Markov model prevents it from anticipating potential economic or political crises, which have been prevalent in this region recently. Additionally, the Markov model within TerrSet software does not explicitly reveal the steady state estimation (i.e., equilibrium year) of the simulation. The model is only capable of adequately simulating change for a certain amount of years in the future, thus the first prediction of 2026 holds more weight.
Fragmentizing the already established driver variables within the modeling to have greater detail, has the potential to increase the overall accuracy of the simulation. Specifically, distinguishing the various types of urban use (e.g., commercial, residential, social) and creating continuous distance-based maps could help accuracy. Additionally, transportation routes could specifically be identified apart from the urban LULC class, and distance-based maps could be made for each type (i.e., primary and secondary roads). More socioeconomic variables also need to be analyzed, such as: average gross domestic product (GDP) per district, race/ethnic group densities, average household size and income, and employment activity.
6. Conclusions
The present study reaffirms the integration of remote sensing, GIS, and statistical models as valuable and practical tools for exploring spatiotemporal changes of LULC and predicting urban encroachment on agricultural lands, particularly in relatively data scarce regions. The tools used in this study measured the amount of urbanization within an eastern sector of the ND revealing that urban areas increased in size by 222.51% over a period of 29 years. Most of the change has occurred within the past 9 years, where transitions of approximately 350.2 km2 of bare ground and 235.6 km2 of agricultural lands to built-up area occurred.
This study concluded that the fertile cultivated lands of the eastern ND have been severely decreased due to severe urban pressures; however, they have also experienced considerable growth along the outer edge of the delta due to desert reclamation. Although this process may offer short-term benefits, its existence threatens the region’s already low water supply and leads to other negative externalities. Simulation analysis of future urban sprawl indicated that the extent to which urban area is simulated to grow from 2017 is 16.67% by the year 2026, and 37.82% by the year 2050 for the entire study area. Yet, within the ND alone, it is simulated that built-up area will grow to nearly 104 km2 by 2026. This figure will be tripled to 319 km2 by the year 2050.
The findings from this study conclude that urban areas are directly consuming agricultural lands within the ND, and their growth is increasing. Government-implemented actions intended to preserve the fertile lands, such as desert reclamation and desert directed urban development, may offer short-term relief. In addition, the resulting negative externalities are highly destructive. Further environmentally positive planning needs to be implemented to reduce the destructive impacts of urbanization, and in turn protect the well-being of the Egyptian condition. The method adopted in the present study enables a rapid identification of urban encroachment hotspots and highlights agricultural areas that are prone to such destructive activities. This type of information is vital for future urban planning purposes and could be used to help decision makers enact appropriate protection measures in the region.
Author Contributions
K.B. and E.G. have equally developed the research framework, designed the experiment, processed and analyzed the data, created the figures and wrote the manuscript.
Funding
This research received no external funding.
Acknowledgments
This research was supported by the UNCW Remote Sensing Research Laboratory (RSRL). The authors would like to express their appreciation for the three anonymous reviewers and journal editor whose comments have helped to improve the overall quality of this paper.
Conflicts of Interest
The authors declare no conflict of interest.
References
- Fresco, L.; Leemans, R.; Turner, B.L.; Skole, D.; Van Zeijl-Rozema, A.G.; Haarmann, V. Land Use and Cover Change (LUCC) Open Science Meeting Proceedings; Institut Cartogràfic de Catalunya: Catalonia, Spain, 1997. [Google Scholar]
- Turner, B.L. Local faces, global flows: The role of land use and land cover in global environmental change. Land Degrad. Dev. 1994, 5, 71–78. [Google Scholar] [CrossRef]
- Stanley, D.J.; Warne, A.G. Nile delta: Recent geological evolution and human impact. Science 1993, 260, 628–634. [Google Scholar] [CrossRef] [PubMed]
- Ye, D.; Fu, C. Major issues of global change sciences. Chin. J. Atmos. Sci. 1994, 18, 498–512. [Google Scholar]
- Clarke, K.C.; Hoppen, S.; Gaydos, L. A self-modifying cellular automaton model of historical urbanization in the San Francisco bay area. Environ. Plan. B Plan. Des. 1997, 24, 247–261. [Google Scholar] [CrossRef]
- Alphan, H. Land-use change and urbanization of adana, Turkey. Land Degrad. Dev. 2003, 14, 575–586. [Google Scholar] [CrossRef]
- López, T.D.; Aide, T.M.; Thomlinson, J.R. Urban expansion and the loss of prime agricultural lands in Puerto Rico. Ambio 2001, 30, 49–54. [Google Scholar] [CrossRef]
- Mckinney, M.L. Urbanization, biodiversity, and conservation. Bioscience 2002, 52. [Google Scholar] [CrossRef]
- Dewan, A.M.; Yamaguchi, Y. Land use and land cover change in greater Dhaka, Bangladesh: Using remote sensing to promote sustainable urbanization. Appl. Geogr. 2009, 29, 390–401. [Google Scholar] [CrossRef]
- Herold, M.; Goldstein, N.C.; Clarke, K.C. The spatiotemporal form of urban growth: Measurement, analysis and modeling. Remote Sens. Environ. 2003, 86, 286–302. [Google Scholar] [CrossRef]
- Lambin, E.F.; Baulies, X.; Bockstael, N.; Fischer, G.; Krug, T.; Leemans, R.; Moran, E.F.; Rindfuss, R.R.; Sato, Y.; Skole, D.; et al. Land-Use and Land-Cover Change (LUCC): Implementation Strategy; IGBP Report Stockholm: Bonn, Gremany, 1999. [Google Scholar]
- Work, I.S. Urbanization and urban development. Sage J. 1966, 9, 7–11. [Google Scholar]
- UNDESA. World Urbanization Prospects: The 2014 Revision; Department of Economic and Social Affairs: New York, NY, USA, 2014; pp. 1–32. [Google Scholar]
- Ahram. Egypt’s Population Reaches 104.2 Million: Census. Available online: http://english.ahram.org.eg/NewsContent/1/64/278013/Egypt/Politics-/Egypt%E2%80%99s-population-reaches--million-Census.aspx (accessed on 30 September 2017).
- UNDESA. World Population Prospects: The 2017 Revision. Population and Development Review; United Nations: New York, NY, USA, 2017. [Google Scholar]
- El-Kawy, O.A.; Rød, J.; Ismail, H.; Suliman, A. Land use and land cover change detection in the western Nile Delta of Egypt using remote sensing data. Appl. Geogr. 2011, 31, 483–494. [Google Scholar] [CrossRef]
- Overeem, I.; Syvitski, J.; Brakenridge, R.; Weichselgartner, J. Dynamics and Vulnerability of Delta Systems; LOICZ Reports & Studies; GKSS Research Center: Geesthacht, Germany, 2009; p. 54. [Google Scholar]
- Coleman, J.M.; Huh, O.K. Major World Deltas: A Perspective from Space. Coastal Studies Institute; Louisiana State University: Baton Rouge, LA, USA, 2003. [Google Scholar]
- Postel, S. Last Oasis: Facing Water Scarcity; Norton: New York, NY, USA, 1997. [Google Scholar]
- Döös, B.R. Population growth and loss of arable land. Glob. Environ. Chang. 2002, 12, 303–311. [Google Scholar] [CrossRef]
- El-Hefnawi, A.I. Protecting Agricultural Land from Urbanization or Managing the Conflict between Informal Urban Growth while Meeting the Demands of the Communities: Lessons Learnt from the Egyptian Policy Reforms; World Bank Urban Research Symposium: Brazil, 2005. Available online: https://pdfs.semanticscholar.org/0ae6/2e12ee59fc06d649d08c55c25c659004a38c.pdf (accessed on 1 September 2018).
- Ghar, M.A.; Shalaby, A.; Tateishi, R. Agricultural land monitoring in the egyptian nile delta using landsat data. Int. J. Environ. Studies 2004, 61, 651–657. [Google Scholar] [CrossRef]
- African, E.O. Sustainable Cities and Structural Transformation; AfDB; OECD; UNDP: Paris, France, 2016. [Google Scholar]
- FAO-UN. Statistical Pocketbook. Oecd-fao Agricultural Outlook 2015 OECD-FAO Agricultural Outlook. Available online: http://www.fao.org/3/a-i4738e.pdf (accessed on 1 September 2018).
- Barnes, J. Pumping possibility: Agricultural expansion through desert reclamation in Egypt. Soc. Stud. Sci. 2012, 42, 517–538. [Google Scholar] [CrossRef]
- Kamel, S.; Dahl, C. The economics of hybrid power systems for sustainable desert agriculture in Egypt. Fuel Energy Abstr. 2006, 47, 36. [Google Scholar] [CrossRef]
- Gober, P. Desert urbanization and the challenges of water sustainability. Curr. Opin. Environ. Sustain. 2010, 2, 144–150. [Google Scholar] [CrossRef]
- Parker, J.B.; Coyle, J.R. Urbanization and Agricultural Policy in Egypt; U.S. Department of Agriculture, Economic Research Service: Washington, DC, USA, 1981.
- Shalaby, A.; Tateishi, R. Remote sensing and gis for mapping and monitoring land cover and land-use changes in the northwestern coastal zone of Egypt. Appl. Geogr. 2007, 27, 28–41. [Google Scholar] [CrossRef]
- Liu, M.H.Q.; Tian, G.S.; Chen, W.; Ren, W.; Zhang, C.; Liu, J. Effects of land use and land cover change on evapotranspiration and water yield in China during the 20th century. J. Am. Water Resour. Assoc. 2008, 44, 1193–1207. [Google Scholar] [CrossRef]
- Radke, R.; Andra, S.; Al-Kofahi, O.; Roysam, B. Image change detection algorithms: A systematic survey. IEEE Trans. Image Process. 2005, 14, 294–307. [Google Scholar] [CrossRef] [PubMed]
- Hegazy, I.R.; Kaloop, M.R. Monitoring urban growth and land use change detection with gis and remote sensing techniques in Daqahlia Governorate Egypt. Intern. J. Sus. Built Environ. 2015, 4, 117–124. [Google Scholar] [CrossRef]
- Shalaby, A.; Ali, R.R.; Gad, A. Urban sprawl impact assessment on the agricultural land in egypt using remote sensing and GIS: A case study, Dalubiya Governorate. J. Land Use Sci. 2012, 7, 261–273. [Google Scholar] [CrossRef]
- Green, A.; Berman, M.; Switzer, P.; Craig, M. A transformation for ordering multispectral data in terms of image quality with implications for noise removal. IEEE Trans. Geosci. Remote Sens. 1988, 26, 65–74. [Google Scholar] [CrossRef] [Green Version]
- Harris, J.R.; Rogge, D.; Hitchcock, R.; Ijewliw, O.; Wright, D. Mapping lithology in Canadas Arctic: Application of hyperspectral data using the minimum noise fraction transformation and matched filtering. Canadian J. Earth Sci. 2005, 42, 2173–2193. [Google Scholar] [CrossRef]
- Jensen, J.R. Introductory Digital Image Processing: A Remote Sensing Perspective; Prentice-Hall: Upper Saddle River, NJ, USA, 2005; Volume 3. [Google Scholar]
- Pournamdari, M.; Hashim, M.; Pour, A.B. Application of ASTER and Landsat TM data for geological mapping of Esfandagheh Ophiolite Complex, southern Iran. Resour. Geol. 2014, 64, 233–246. [Google Scholar] [CrossRef]
- Piloyan, A.; Konečný, M. Semi-automated classification of landform elements in armenia based on SRTM dem using k-means unsupervised classification. Quaest. Geogr. 2017, 36, 93–103. [Google Scholar] [CrossRef]
- Gelbukh, A.; Morales, E.F. Micai 2008: Advances in Artificial Intelligence, Proceedings of the 7th Mexican International Conference on Artificial Intelligence, Atizapán de Zaragoza, Mexico, 27–31 October 2008; Springer: Berlin, Germany, 2008. [Google Scholar]
- Ozesmi, S.L.; Bauer, M.E. Satellite remote sensing of wetlands. Wetlands Ecology and Management 2014, 10, 381–402. [Google Scholar] [CrossRef]
- Eastman, J.R. Terrset Manual; Clark Labs, Clark University: Worcester, MA, USA, 2016. [Google Scholar]
- Megahed, Y.; Cabral, P.; Silva, J.; Caetano, M. Land cover mapping analysis and urban growth modelling using remote sensing techniques in greater cairo region, egypt. ISPRS Int. J. Geo-Inf. 2015, 4, 1750–1769. [Google Scholar] [CrossRef]
- Vaz, E.D.; Caetano, M.; Nijkamp, P. Trapped between antiquity and urbanism—A multi-criteria assessment model of the Greater Cairo metropolitan area. J. Land Use Sci. 2011, 6, 283–299. [Google Scholar]
- Dadhich, P.N.; Hanaoka, S. Markov Method Integration with Multi-Layer Perceptron Classifier for Simulation of Urban Growth of Jaipur City. In Proceedings of the 6th WSEAS International Conference on Remote Sensin, Iwate Prefectural University, Iwate, Japan, 6–8 October 2010. [Google Scholar]
- Sibanda, W.; Pretorius, P. Novel application of multi-layer perceptrons (mlp) neural networks to model hiv in South Africa using seroprevalence data from antenatal clinics. Int. J. Comput. Appl. 2011, 35, 26–31. [Google Scholar] [CrossRef]
- Khawaldah, H.A. A prediction of future land use/land cover in Amman area using GIS-based Markov Model and remote sensing. J. Geogr. Inf. Syst. 2016, 08, 412–427. [Google Scholar] [CrossRef]
- Hamdy, O.; Zhao, S.; Osman, T.; Salheen, M.; Eid, Y. Applying a hybrid model of markov chain and logistic regression to identify future urban sprawl in Abouelreesh, Aswan: A case study. Geosciences 2016, 6, 43. [Google Scholar] [CrossRef]
- Falahatkar, S.; Soffianian, A.R.; Khajeddin, S.J.; Ziaee, H.R.; Nadoushan, M.A. Integration of remote sensing data and gis for prediction of land cover map. Int. J. Geomat. Geosci. 2011, 1, 847–864. [Google Scholar]
- Kerekes, J. Receiver operating characteristic curve confidence intervals and regions. IEEE Geosci. Remote Sens. Lett. 2008, 5, 251–255. [Google Scholar] [CrossRef]
- Halmy, M.W.A.; Gessler, P.E.; Hicke, J.A.; Salem, B.B. Land use/land cover change detection and prediction in the north-western coastal desert of egypt using markov-ca. Appl. Geogr. 2015, 63. [Google Scholar] [CrossRef]
- Salem, B.B. Assessing habitat fragmentation and its effect on plant biodiversity using multidate satellite imagery. Case study: Omayed biosphere reserve (obr), western coastal desert of Egypt. Egypt. J. Desert Res. 2003, 53, 1–17. [Google Scholar]
- Malek, Ž.; Verburg, P.H.; Geijzendorffer, I.R.; Bondeau, A.; Cramer, W. Global change effects on land management in the mediterranean region. Glob. Environ. Chang. 2018, 50, 238–254. [Google Scholar] [CrossRef]
- Ayache, F.; Thompson, J.R.; Flower, R.J.; Boujarra, A.; Rouatbi, F.; Makina, H. Environmental characteristics, landscape history and pressures on three coastal lagoons in the southern mediterranean region: Merja zerga (morocco), Ghar el melh (Tunisia) and lake Manzala (Egypt). Hydrobiologia 2009, 622, 15–43. [Google Scholar] [CrossRef]
- Benoit, G.; Comeau, A. A Sustainable Future for the Mediterranean: The Blue Plan’s Environment and Development Outlook, 1st ed.; Routledge: London, UK, 2012; p. 462. [Google Scholar]
- Congalton, R.G. A review of assessing the accuracy of classifications of remotely sensed data. Remote Sens. Environ. 1991, 37, 35–46. [Google Scholar] [CrossRef]
- Lizuka, K.; Johnson, B.; Onishi, A.; Magcale-Macandog, D.; Endo, I.; Bragais, M. Modeling future urban sprawl and landscape change in the Laguna de bay area, Philippines. Land 2017, 6, 26. [Google Scholar]
Figure 1.
A map of the study area covering the eastern flank of the Nile Delta (ND) in Egypt. It shows the eastern ND flank including desert lands (indicated in black) and the cultivated lands flank of the ND (indicated in blue).
Figure 1.
A map of the study area covering the eastern flank of the Nile Delta (ND) in Egypt. It shows the eastern ND flank including desert lands (indicated in black) and the cultivated lands flank of the ND (indicated in blue).

Figure 2.
Simplified project workflow.

Figure 3.
Validation map of the 2017 simulation (a) for the ND flank including desert, and (b) for the cultivated lands flank of the ND. The final output determines the overall accuracy of the model and confirms its use for further simulations.
Figure 3.
Validation map of the 2017 simulation (a) for the ND flank including desert, and (b) for the cultivated lands flank of the ND. The final output determines the overall accuracy of the model and confirms its use for further simulations.

Figure 4.
Land-use and land-cover (LULC) hybrid classifications for 1988, 2008, and 2017.

Figure 5.
Total LULC net change for the entire study area including desert lands. Agricultural Lands are seen to be growing presumably due to government reclamation efforts, thus the results are not entirely representative of what is occurring throughout the rest of the ND.
Figure 5.
Total LULC net change for the entire study area including desert lands. Agricultural Lands are seen to be growing presumably due to government reclamation efforts, thus the results are not entirely representative of what is occurring throughout the rest of the ND.

Figure 6.
Total LULC net change within the ND flank including only cultivated lands. Urban areas are increasing in area, whereas both agricultural lands and bare ground are decreasing in area. These results are depictive of what is occurring in the ND, for they exclude the outlying perimeter influences.

Figure 7.
The simulated percent growth in urban areas for the year 2026. Areas in red are simulated to experience the highest growth rates, whereas areas in blue are expected to experience the lowest. Most of the blue districts are areas that were nearly 100% urban, thus there was minimal possibility for expansion.

Figure 8.
Actual urban growth (1988, 2008 and 2017) and simulated urban growth (2026 and 2050) are modeled within a subset of the ND. It is evident that urban areas are growing, with most of the urban growth concentrated in the desert flank of the ND.
Figure 8.
Actual urban growth (1988, 2008 and 2017) and simulated urban growth (2026 and 2050) are modeled within a subset of the ND. It is evident that urban areas are growing, with most of the urban growth concentrated in the desert flank of the ND.

Figure 9.
Actual urban growth and simulated urban growth are modeled including only the smaller cultivated lands flank within the ND. Most of the urban growth is mainly expanding from existing urban areas.
Figure 9.
Actual urban growth and simulated urban growth are modeled including only the smaller cultivated lands flank within the ND. Most of the urban growth is mainly expanding from existing urban areas.

Figure 10.
Soft prediction of urban growth for the year 2026. Areas in red and orange indicate a high likelihood of transitioning into urban. Areas in blue represent areas unlikely to convert to urban, for they are mainly either preexisting urban or remote desert surfaces.
Figure 10.
Soft prediction of urban growth for the year 2026. Areas in red and orange indicate a high likelihood of transitioning into urban. Areas in blue represent areas unlikely to convert to urban, for they are mainly either preexisting urban or remote desert surfaces.


Table 1.
Examined driver variable’s Cramer’s V values for 1988:2017 model including the desert and the cultivated lands flanks.
Table 1.
Examined driver variable’s Cramer’s V values for 1988:2017 model including the desert and the cultivated lands flanks.
| Driver Variable | Cramer’s V Value |
|---|---|
| Distance to Urban 1988 | 0.4844 |
| Elevation | 0.4415 |
| Distance to Disturbances 1988:2017 | 0.4077 |
| Distance to Bare Ground 1988 | 0.4658 |
| Population | 0.2295 |
| Distance to Water 1988 | 0.0347 |
| Slope | 0.0256 |
Table 2.
Driver variable’s Cramer’s V values for final 1988:2017 model including only the cultivated lands flank.
Table 2.
Driver variable’s Cramer’s V values for final 1988:2017 model including only the cultivated lands flank.
| Driver Variable | Cramer’s V Value |
|---|---|
| Evidence Likelihood | 0.3628 |
| Distance to Urban 1988 | 0.3462 |
| Elevation | 0.0238 |
| Distance to Disturbances 1988:2017 | 0.3548 |
© 2018 by the authors. Licensee MDPI, Basel, Switzerland. This article is an open access article distributed under the terms and conditions of the Creative Commons Attribution (CC BY) license (http://creativecommons.org/licenses/by/4.0/).
Share and Cite
MDPI and ACS Style
Bratley, K.; Ghoneim, E. Modeling Urban Encroachment on the Agricultural Land of the Eastern Nile Delta Using Remote Sensing and a GIS-Based Markov Chain Model. Land 2018, 7, 114. https://doi.org/10.3390/land7040114
AMA Style
Bratley K, Ghoneim E. Modeling Urban Encroachment on the Agricultural Land of the Eastern Nile Delta Using Remote Sensing and a GIS-Based Markov Chain Model. Land. 2018; 7(4):114. https://doi.org/10.3390/land7040114
Chicago/Turabian StyleBratley, Kelsee, and Eman Ghoneim. 2018. "Modeling Urban Encroachment on the Agricultural Land of the Eastern Nile Delta Using Remote Sensing and a GIS-Based Markov Chain Model" Land 7, no. 4: 114. https://doi.org/10.3390/land7040114
Note that from the first issue of 2016, this journal uses article numbers instead of page numbers. See further details here.