Coastal Hazard Vulnerability Assessment Based on Geomorphic, Oceanographic and Demographic Parameters: The Case of the Peloponnese (Southern Greece)


Abstract
:1. Introduction
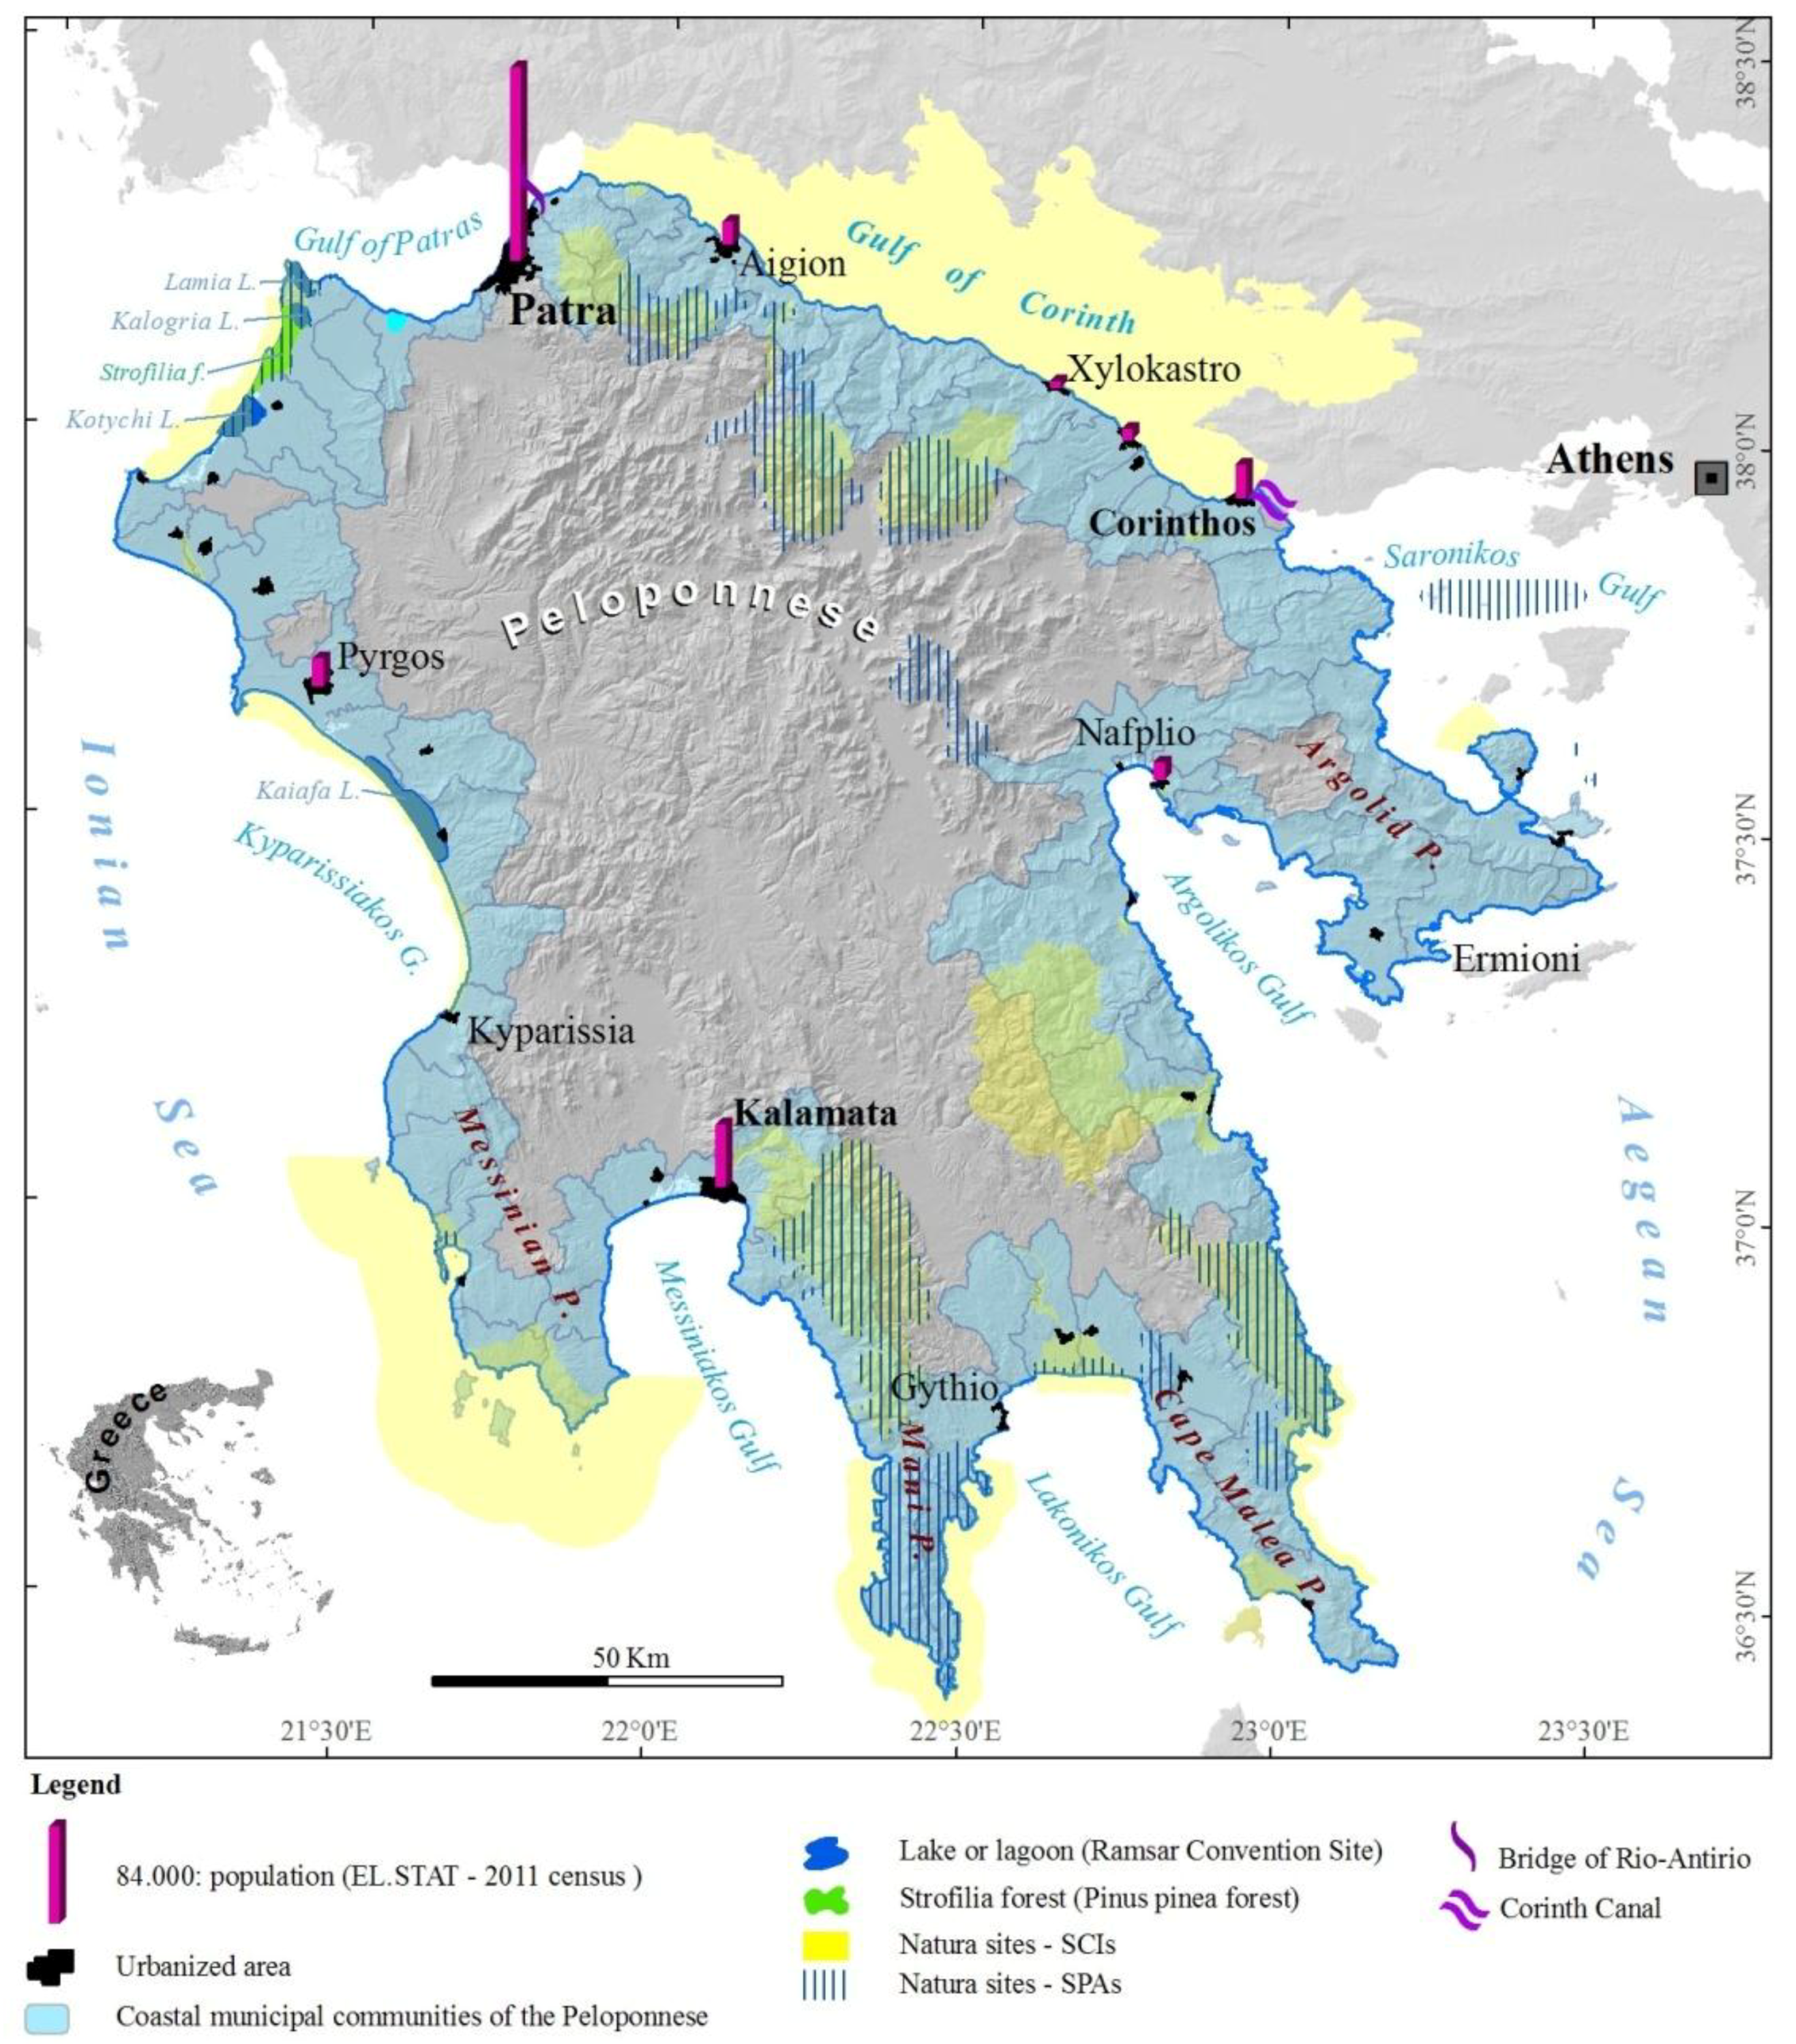
2. Study Area
3. Materials and Methods
3.1. Physical Vulnerability
3.2. Social Vulnerability
4. Results and Discussion
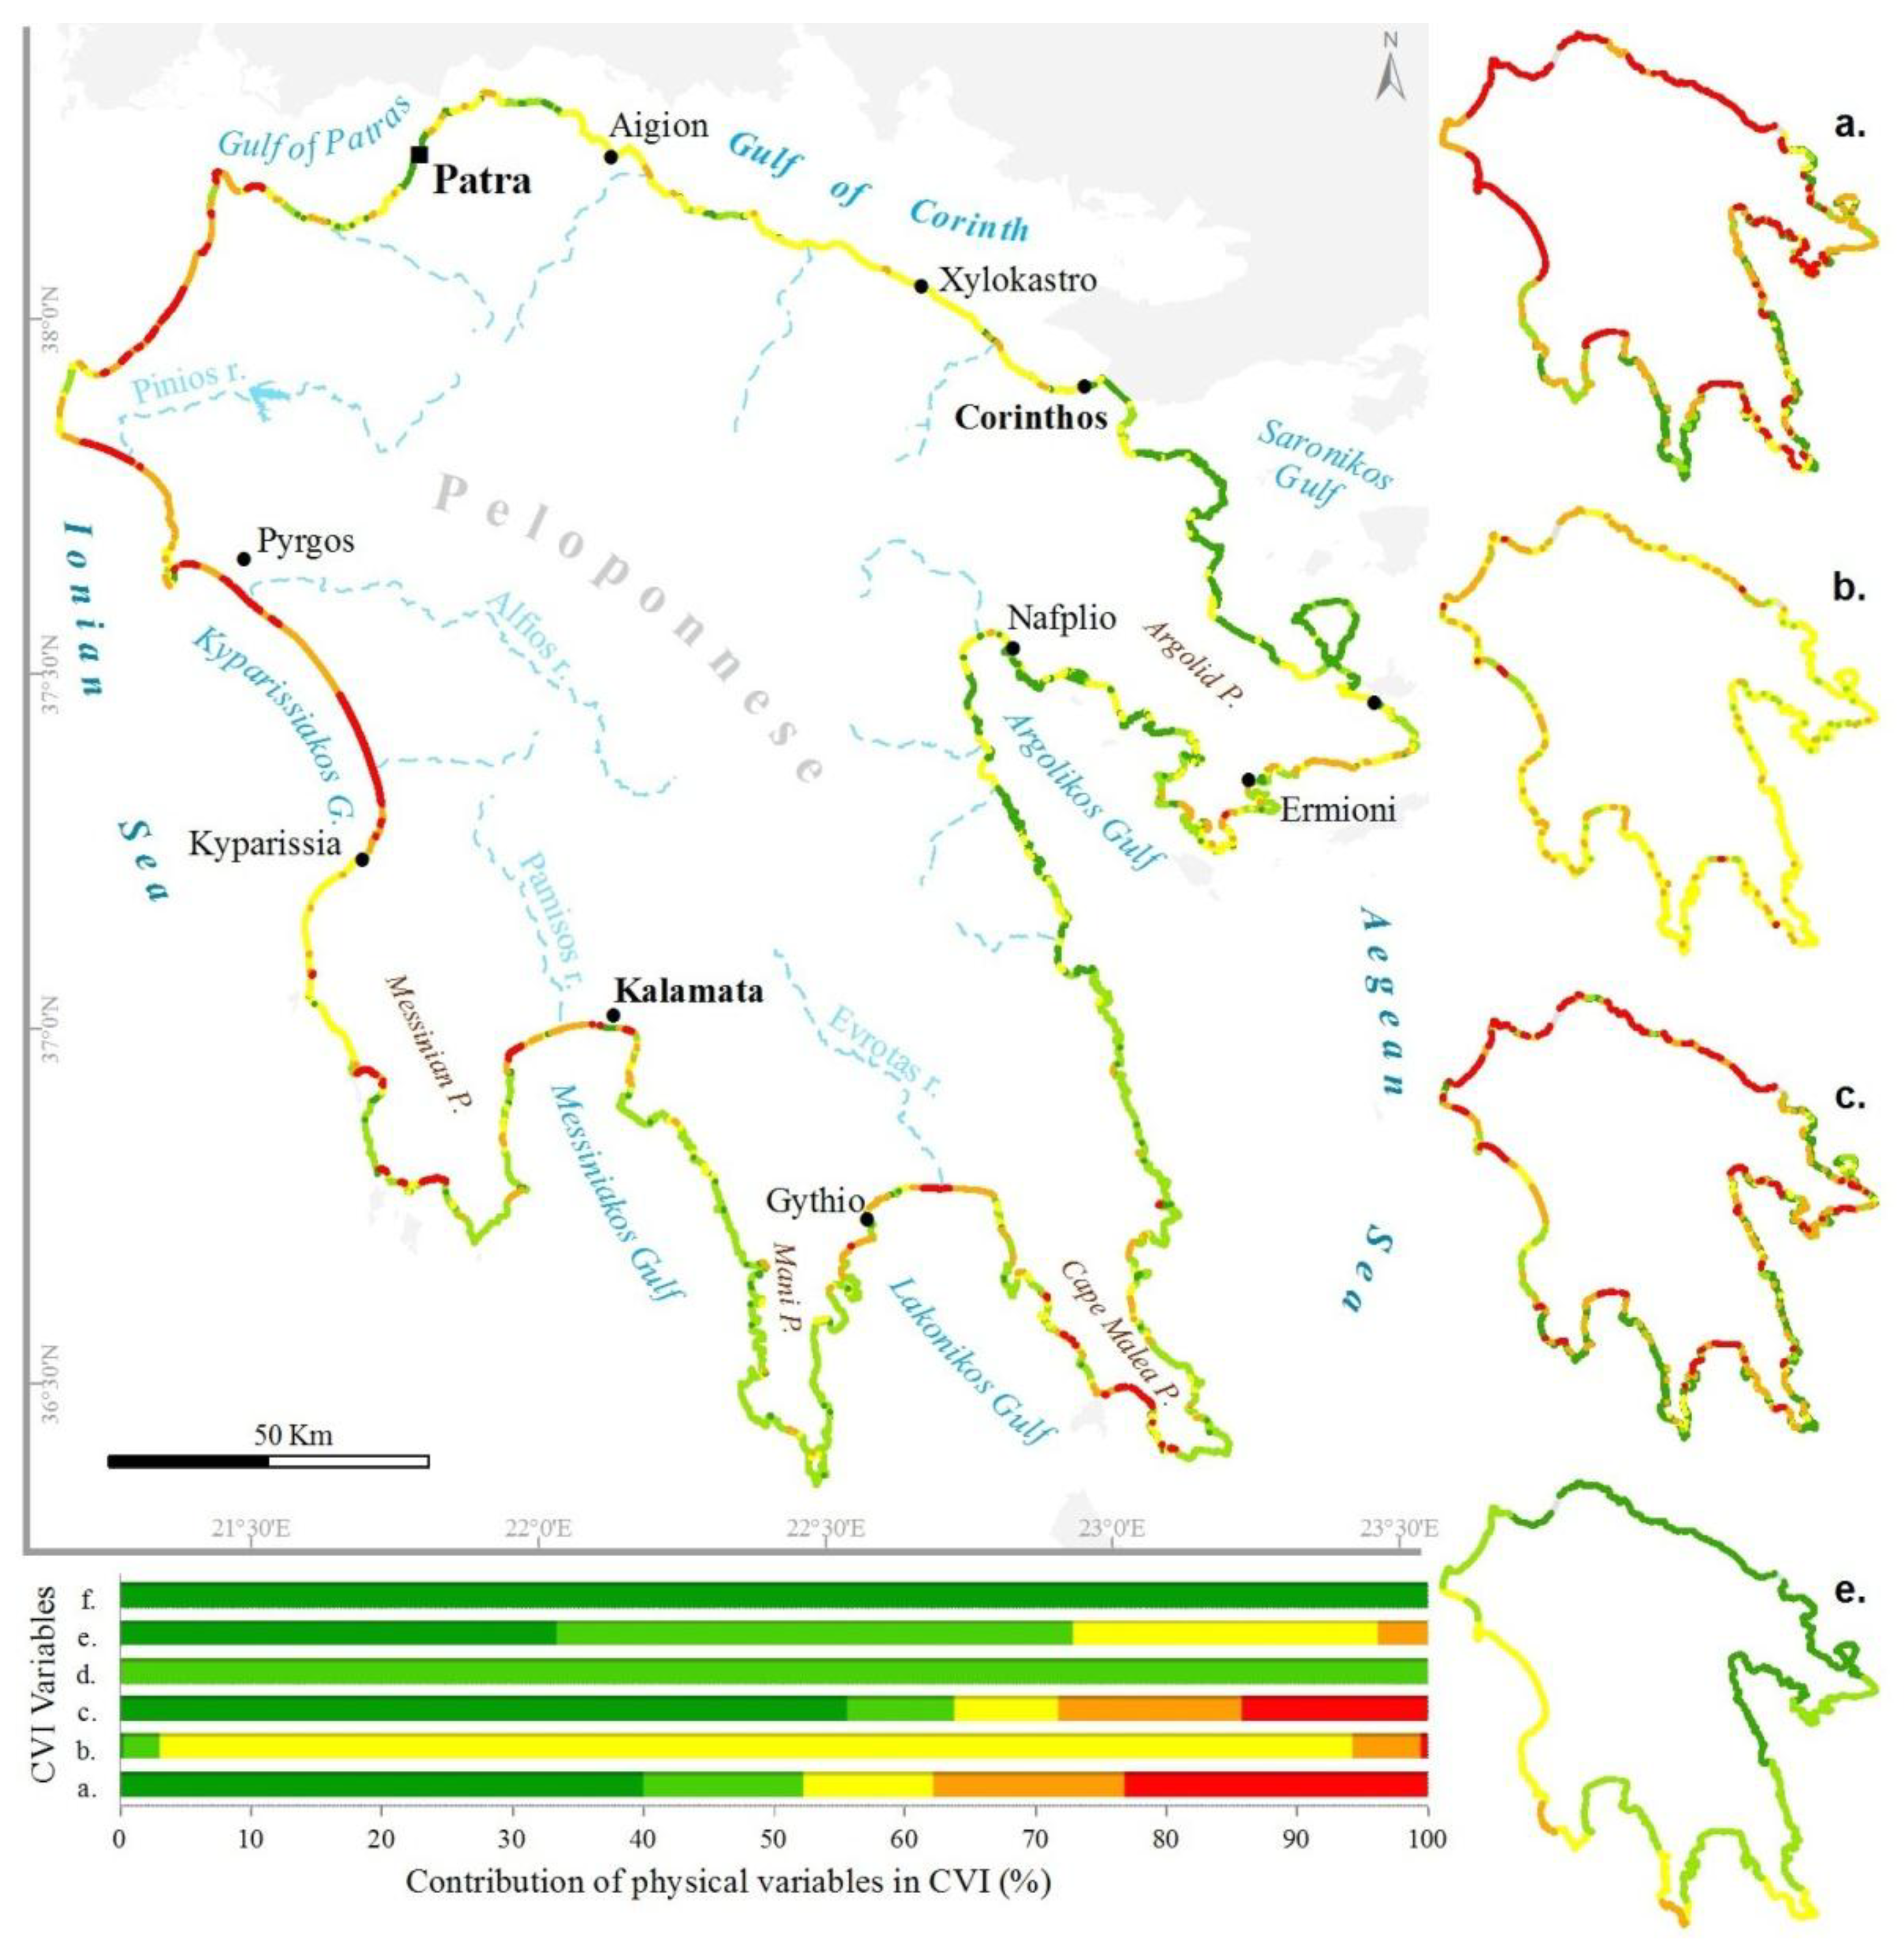
4.1. Coastal Vulnerability Index
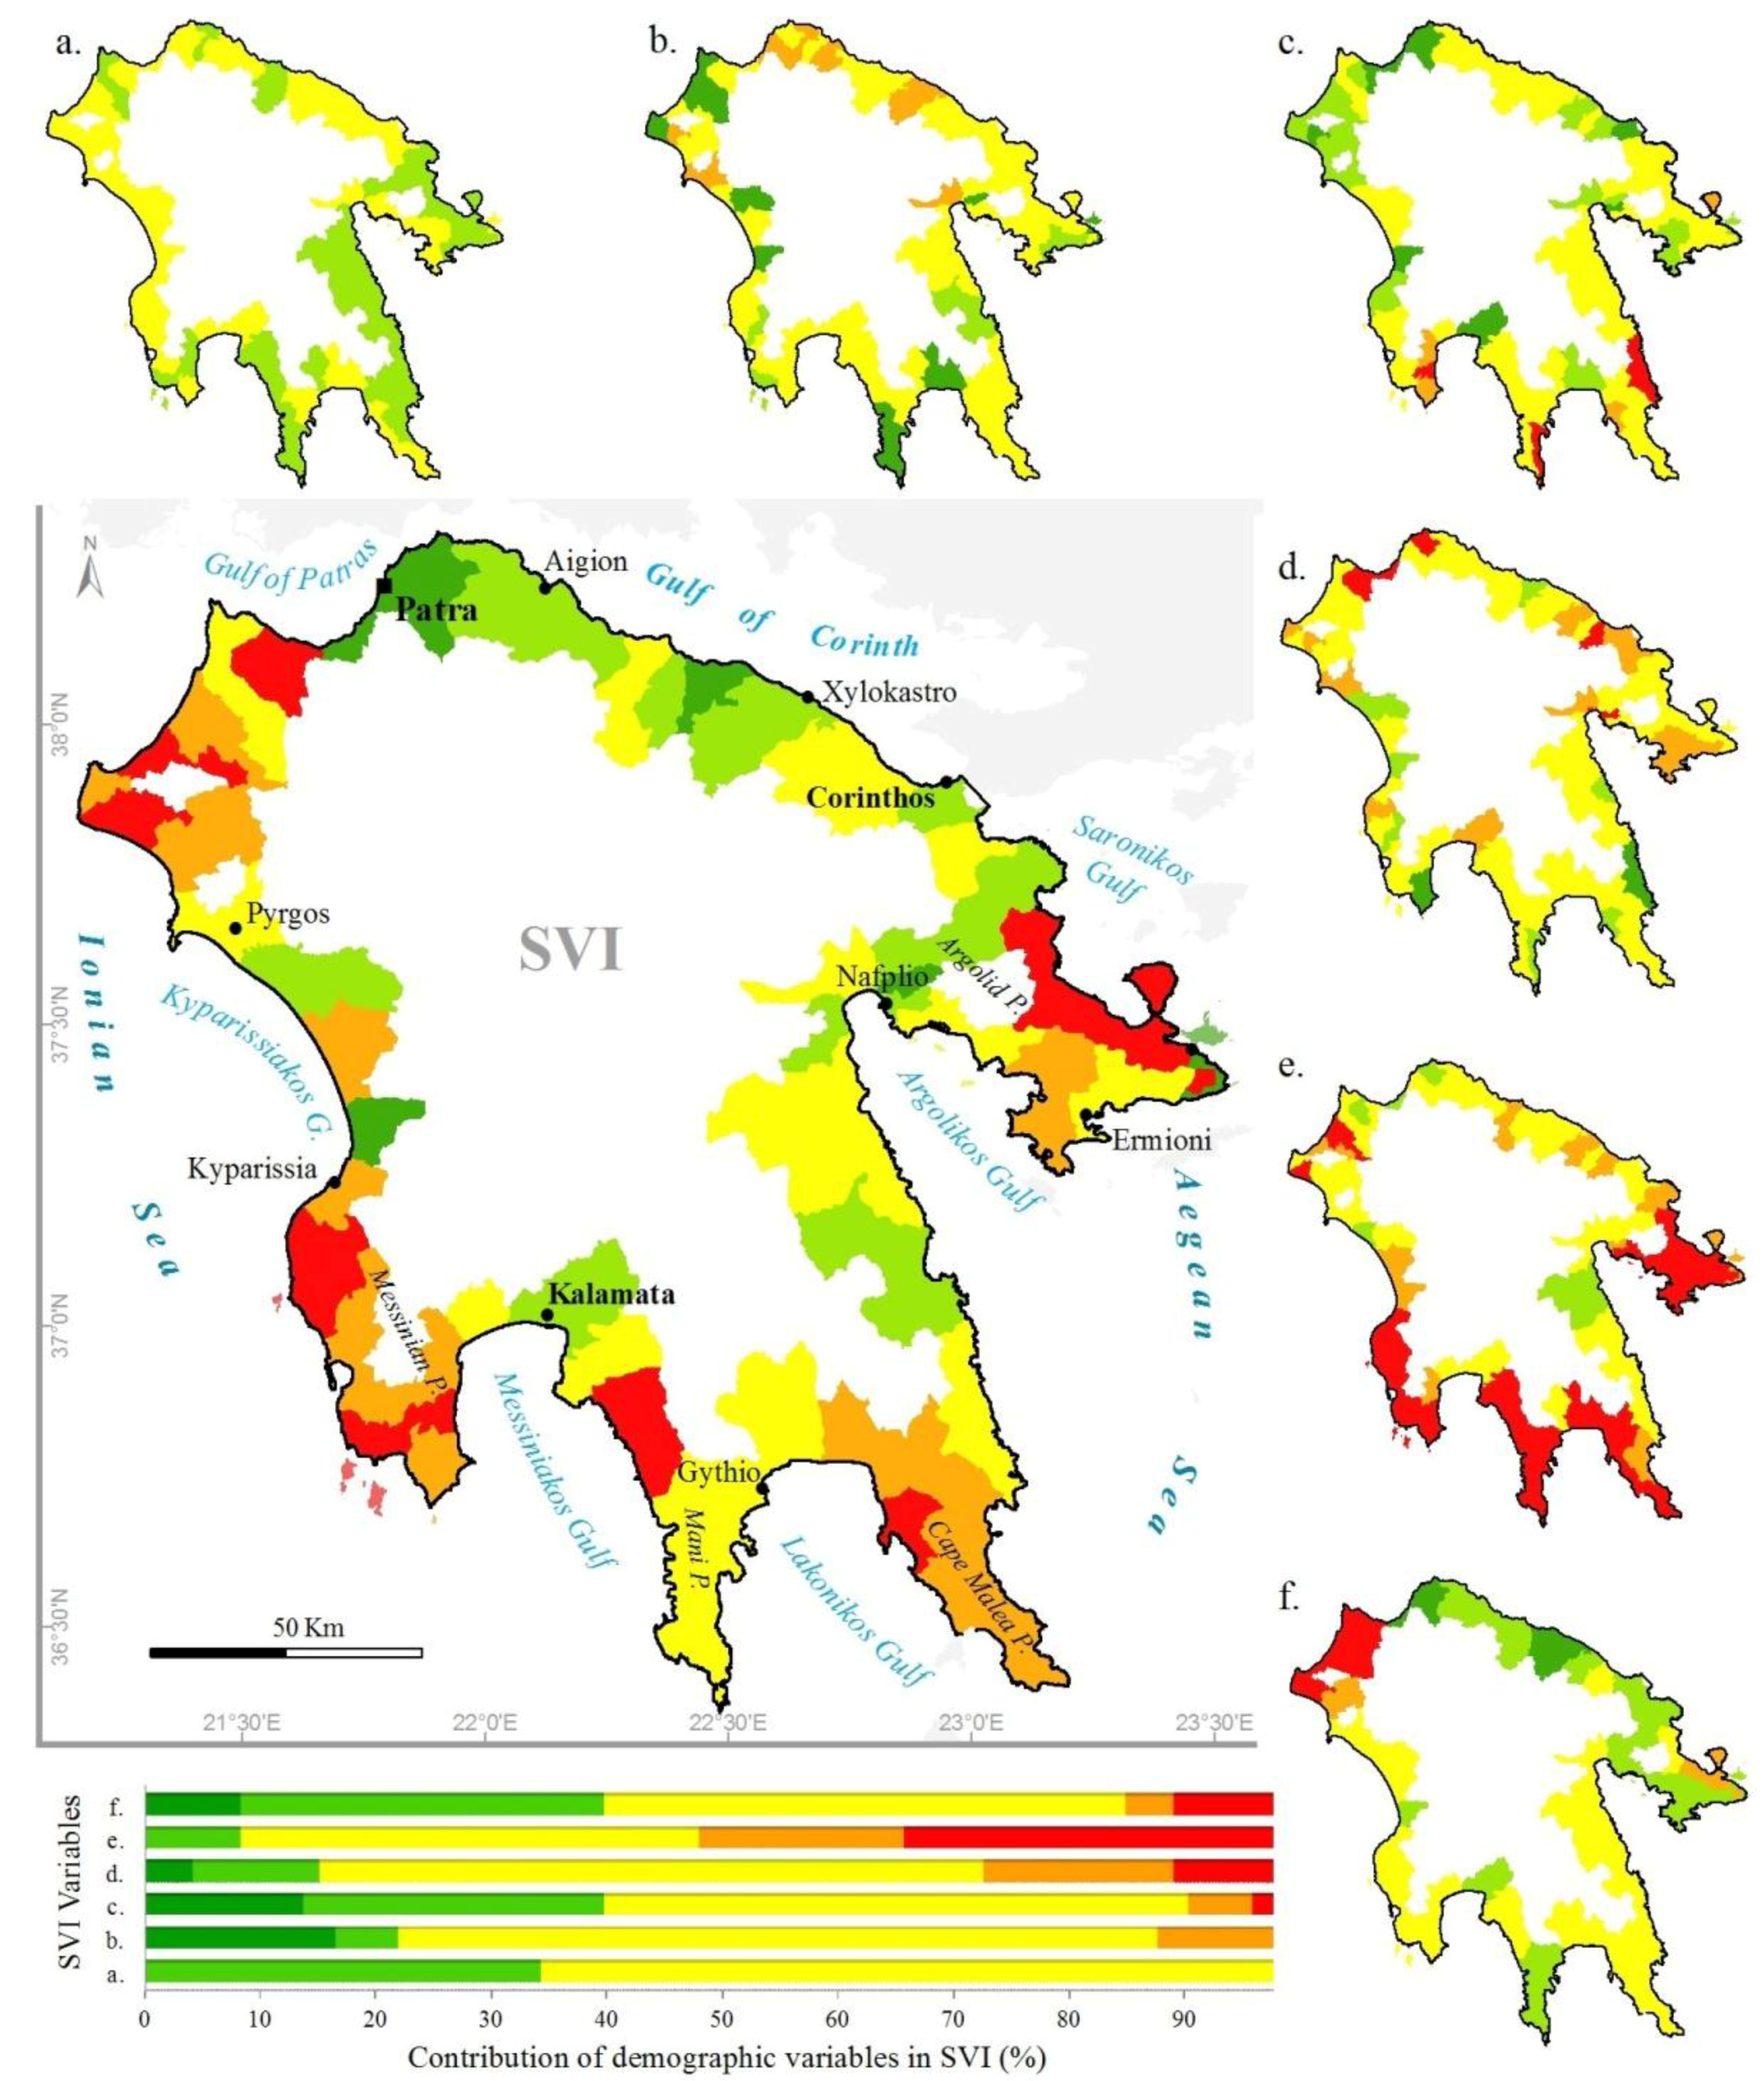
4.2. Social Vulnerability Index (SVI)
5. Conclusions
Author Contributions
Acknowledgments
Conflicts of Interest
References
- Costanza, R. The ecological, economic, and social importance of the oceans. Ecol. Econ. 1999, 31, 199–213. [Google Scholar] [CrossRef]
- Bellot, J.; Bonet, A.; Pena, J.; Sánchez, J. Human impacts on land cover and water balances in a Coastal Mediterranean county. Environ. Manag. 2007, 39, 412–422. [Google Scholar] [CrossRef] [PubMed]
- Chalkias, C.; Papadopoulos, A.; Ouils, A.; Karymbalis, E.; Detsis, V. Land cover changes in the coastal peri-urban zone of Corinth, Greece. In Proceedings of the Tenth International Conference on the Mediterranean Coastal Environment, Rhodes, Greece, 25–29 October 2011; Volume 2, pp. 913–923. [Google Scholar]
- Salvati, L.; Munafò, M.; Morelli, V.G.; Sabbi, A. Lowdensitysettlementsand land use changes in a Mediterranean urban region. Landsc. Urban Plan. 2012, 105, 43–52. [Google Scholar] [CrossRef]
- Catalán, B.; Saurí, D.; Serra, P. Urban sprawl in the Mediterranean? Patterns of growth and change in the Barcelona metropolitan region 1993–2000. Landsc. Urban Plan. 2008, 85, 174–184. [Google Scholar] [CrossRef]
- Romano, B.; Zullo, F. The urban transformation of Italy’s Adriatic Coast Strip: Fifty years of unsustainability. Land Use Policy 2014, 38, 26–36. [Google Scholar] [CrossRef]
- Satta, A.; Puddu, M.; Venturini, S.; Giupponi, C. Assessment of coastal risks to climate change related impacts at the regional scale: The case of the Mediterranean region. Int. J. Disaster Risk Reduct. 2017, 24, 284–296. [Google Scholar] [CrossRef]
- Church, J.; White, N. Sea-level rise from the late 19th to the early 21st century. Surv. Geophys. 2011, 32, 585–602. [Google Scholar] [CrossRef]
- Losada, I.J.; Reguero, B.G.; Méndez, F.J.; Castanedo, S.; Abascal, A.J.; Mínguez, R. Long-term changes in sea-level components in Latin America and the Caribbean. Glob. Planet. Chang. 2013, 104, 34–50. [Google Scholar] [CrossRef]
- Hinkel, J.; Lincke, D.; Vafeidis, A.T.; Perrette, M.; Nicholls, R.J.; Tol, R.S.J.; Marzeion, B.; Fettweis, X.; Ionescu, C.; Levermann, A. Coastal flood damage and adaptation costs under 21st century sea-level rise. Proc. Natl. Acad. Sci. USA 2014, 111, 3292–3297. [Google Scholar] [CrossRef] [PubMed]
- Hogarth, P. Preliminary analysis of acceleration of sea level rise through the twentieth century using extended tide gauge data sets (August 2014). J. Geophys. Res. Oceans 2014, 119, 7645–7659. [Google Scholar] [CrossRef]
- Hoggart, S.P.G.; Hanley, M.E.; Parker, D.J.; Simmonds, D.J.; Bilton, D.T.; Filipova-Marinova, M.; Franklin, E.L.; Kotsev, I.; Penning-Rowsell, E.C.; Rundle, S.D.; et al. The consequences of doing nothing: The effects of seawater flooding on coastal zones. Coast. Eng. 2014, 87, 169–182. [Google Scholar] [CrossRef]
- Jevrejeva, S.; Moore, J.C.; Grinsted, A.; Matthews, A.P.; Spada, G. Trends and acceleration in global and regional sea levels since 1807. Glob. Planet. Chang. 2014, 113, 11–22. [Google Scholar] [CrossRef] [Green Version]
- Allen, J.C.; Komar, P.D. Climate controls on US west coast erosion processes. J. Coast. Res. 2006, 22, 511–529. [Google Scholar] [CrossRef]
- IPCC. Summary for policy makers. In Climate Change 2013: The Physical Science Basis; Stocker, T.F., Qin, D., Plattner, G.K., Tigno, M., Allen, S.K., Boschung, J., Nauels, A., Xia, Y., Bex, V., Midgley, P.M., Eds.; Cambridge University Press: Cambridge, UK, 2013. [Google Scholar]
- Pfeffer, W.T.; Harperand, J.T.; O’Neel, S. Kinematic constraints on Glacier Contributions to 21st Century Sea-Level Rise. Science 2008, 321, 1340–1343. [Google Scholar] [CrossRef] [PubMed]
- Rohling, E.J.; Grant, K.; Bolshaw, M.; Roberts, A.P.; Siddall, M.; Hemleben, C.H.; Kucera, M. Antarctic temperature and global sea-level closely coupled over the past five glacial cycles. Nat. Geosci. 2009, 2, 500–504. [Google Scholar] [CrossRef]
- Grinsted, A.; Moore, J.C.; Jevrejeva, S. Reconstructing sea-level from paleo and projected temperatures 200 to 2100 AD. Clim.Dyn. 2010, 34, 461–472. [Google Scholar] [CrossRef]
- Lowe, J.A.; Woodworth, P.L.; Knutson, T.; McDonald, R.E.; McInnes, K.L.; Woth, K.; von Storch, H.; Wolf, J.; Swail, V.; Bernier, N.B.; et al. Past and Future Changes in Extreme Sea Levels and Waves. Understanding Sea-Level Rise and Variability; Wiley-Blackwell: London, UK, 2010. [Google Scholar]
- Ullmann, A.; Monbaliu, J. Changes in atmospheric circulation over the North Atlantic and sea-surge variations along the Belgian coast during the twentieth century. Int. J. Climatol. 2010, 30, 558–568. [Google Scholar] [CrossRef]
- Izaguirre, C.; Méndez, F.J.; Espejo, A.; Losada, I.J.; Reguero, B.G. Extreme wave climate changes in Central-South America. Clim. Chang. 2013, 119, 277–290. [Google Scholar] [CrossRef]
- Wang, X.L.; Feng, Y.; Swail, V.R. Changes in global ocean wave heights as projected using multimodel CMIP5 simulations. Geophys. Res. Lett. 2014, 41, 1026–1034. [Google Scholar] [CrossRef]
- Weisse, R.; Bellafiore, D.; Menéndez, M.; Méndez, F.; Nicholls, R.J.; Umgiesser, G.; Willems, P. Changing extreme sea levels along European coasts. Coast. Eng. 2014, 87, 4–14. [Google Scholar] [CrossRef]
- Vousdoukas, M.; Voukouvalas, E.; Annunziato, A.; Giardino, A.; Feyen, L. Projections of extreme storm surge levels along Europe. Clim. Dyn. 2016, 47, 3171–3190. [Google Scholar] [CrossRef]
- Marcos, M.; Tsimplis, M.N. Coastal sea-level trends in Southern Europe. Geophys. J. Int. 2008, 175, 70–82. [Google Scholar] [CrossRef]
- Marcos, M.; Jordà, G.; Gomis, D.; Pérez, B. Changes in storm surges in southern Europe from a regional model under climate change scenarios. Glob. Planet. Chang. 2011, 77, 116–128. [Google Scholar] [CrossRef]
- Jordà, G.; Gomis, D.; Álvarez-Fanjul, E.; Somot, S. Atmospheric contribution to Mediterranean and nearby Atlantic sea level variability under different climate change scenarios. Glob. Planet. Chang. 2012, 80–81, 198–214. [Google Scholar] [CrossRef] [Green Version]
- Conte, D.; Lionello, P. Characteristics of large positive and negative surges in the Mediterranean Sea and their attenuation in future climate scenarios. Glob. Planet. Chang. 2013, 111, 159–173. [Google Scholar] [CrossRef]
- Androulidakis, Y.; Kombiadou, K.; Makris, C.; Baltikas, V.; Krestenitis, Y. Storm surges in the Mediterranean Sea: Variability and trends under future climatic conditions. Dyn. Atmos. Oceans 2015, 71, 56–82. [Google Scholar] [CrossRef]
- Gornitz, V. Global coastal hazards from future sea-level rise. Glob.Planet. Chang. 1991, 89, 379–398. [Google Scholar] [CrossRef]
- Thieler, E.R.; Hammar-Klose, E.S. National Assessment of Coastal Vulnerability to Sea-Level Rise; U.S. Atlantic Coast; U.S. Geological Survey: Reston, VA, USA, 1999.
- Pendleton, E.A.; Thieler, E.R.; Williams, S.J. Coastal Vulnerability Assessment of Cape Hatteras National Seashore (CAHA) to Sea-Level Rise; USGS Open File Report; US Geological Society: Reston, VA, USA, 2008.
- Diez, P.G.; Perillo, G.M.E.; Piccolo, C.M. Vulnerability to sea-level rise on the coast of the Buenos Aires Province. J. Coast. Res. 2007, 23, 19–126. [Google Scholar] [CrossRef]
- Rao, K.N.; Subraelu, P.; Rao, T.V.; Malini, B.H.; Ratheesh, R.; Bhattacharya, S.; Rajawat, A.S. Sea-level rise and coastal vulnerability: An assessment of Andhra Pradesh coast, India through remote sensing and GIS. J. Coast. Conserv. 2008, 12, 195–207. [Google Scholar] [CrossRef]
- Gaki-Papanastassiou, K.; Karymbalis, E.; Poulos, S.; Seni, A.; Zouva, C. Coastal vulnerability assessment to sea-level rise based on geomorphological and oceanographical parameters: The case of Argolikos Gulf, Peloponnese, Greece. Hell. J. Geosci. 2011, 45, 109–121. [Google Scholar]
- Karymbalis, E.; Chalkias, C.; Chalkias, G.; Grigoropoulou, E.; Manthos, G.; Ferentinou, M. Assessment of the sensitivity of the southern coast of the Gulf of Corinth (Peloponnese, Greece) to sea-level rise. Cent. Eur. J. Geosci. 2012, 4, 561–577. [Google Scholar] [CrossRef]
- Karymbalis, E.; Chalkias, C.; Ferentinou, M.; Chalkias, G.; Magklara, M. Assessment of the Sensitivity of Salamina and Elafonissos islands to Sea-level Rise. J. Coast. Res. 2014, 70, 378–384. [Google Scholar] [CrossRef]
- Gornitz, V.; Daniels, R.C.; White, T.W.; Birdwell, K.R. The development of a coastal vulnerability assessment database: Vulnerability to sea-level rise in the U.S. southeast. J. Coast. Res. 1994, 12, 327–338. [Google Scholar]
- Boruff, B.; Emrich, C.; Cutter, S.L. Erosion hazard vulnerability of US coastal countries. J. Coast. Res. 2005, 21, 932–942. [Google Scholar] [CrossRef]
- Lichter, M.; Felsenstein, D. Assessing the costs of sea-level rise and extreme flooding at the local level: A GIS-based approach. Ocean Coast. Manag. 2012, 59, 47–62. [Google Scholar] [CrossRef]
- Flanagan, B.E.; Gregory, E.W.; Hallisey, E.J.; Heitgerd, J.L.; Lewis, B. A Social Vulnerability Index for Disaster Management. J. Homel. Secur. Emerg. Manag. 2011, 8. [Google Scholar] [CrossRef]
- Szlafsztein, C.; Sterr, H. A GIS-based vulnerability assessment of coastal natural hazards, state of Pará, Brazil. J. Coast. Conserv. 2007, 11, 53–66. [Google Scholar] [CrossRef]
- Gorokhovich, Y.; Leiserowitz, A.; Dugan, D. Integrating Coastal Vulnerability and Community-Based Subsistence Resource Mapping in Northwest Alaska. J. Coast. Res. 2014, 30, 158–169. [Google Scholar] [CrossRef]
- Satta, A.; Puddu, M.; Firth, J.; Lafitte, A. Climate Risk Management Tools: Towards a Multi-Scale Coastal Risk Index for the Mediterranean; Plan Bleu Report; Plan Bleu: Valbonne, France, 2015. [Google Scholar]
- Mavromatidi, A.; Briche, E.; Claeys, C. Mapping and analyzing socio-environmentalvulnerability to coastal hazards induced by climate change: An application to coastal Mediterranean cities in France. Cities 2018, 72, 189–200. [Google Scholar] [CrossRef]
- Lambeck, K. Sea-level change and shore-line evolution in Aegean Greece since Upper Palaeolithic time. Antiquity 1996, 70, 588–611. [Google Scholar] [CrossRef]
- Soukisian, T.; Hatzinaki, M.; Korres, G.; Papadopoulos, A.; Kallos, G.; Anadranistakis, E. Wave and Wind Atlas of the Hellenic Seas; Hellenic Centre for Marine Research Publication: Anavyssos, Greece, 2007. [Google Scholar]
- Tsimplis, M.N. Tidal oscillations in the Aegean and Ionian Seas. Estuar. Coast. Shelf Sci. 1994, 39, 201–208. [Google Scholar] [CrossRef]
- Pendleton, E.A.; Thieler, E.R.; Williams, S.J. Importance of coastal change variables in determining vulnerability to sea- and lake-level change. J. Coast. Res. 2010, 26, 176–183. [Google Scholar] [CrossRef]
- Abuodha, P.A.O.; Woodroffe, C.D. Assessing vulnerability to sea-level rise using a coastal sensitivity index: A case study from southeast Australia. J. Coast. Conserv. 2010, 14, 189–205. [Google Scholar] [CrossRef]
- Dwarakish, G.S.; Vinay, S.A.; Natesan, U.; Asano, T.; Kakinuma, T.; Venkataramana, K.; Jagedeesha, B.; Badita, M.K. Coastal vulnerability assessment of the future sea-level rise in Udupi coastal zone of Karnataka state, west coast of India. Ocean Coast. Manag. 2009, 52, 467–478. [Google Scholar] [CrossRef]
- Parcharidis, I.; Kourkouli, P.; Karymbalis, E.; Foumelis, M.; Karathanassi, V. Time Series Synthetic Aperture Radar Interferometry for Ground Deformation Monitoring over a Small Scale Tectonically Active Deltaic Environment (Mornos, Central Greece). J. Coast. Res. 2013, 29, 325–338. [Google Scholar] [CrossRef]
- Alexandrakis, G.; Karditsa, A.; Poulos, S.; Ghionis, G.; Kampanis, N.A. Vulnerability assessment for to erosion of the coastal zone to a potential sea-level rise: The case of the Aegean Hellenic coast. In Environmental Systems in Encyclopedia of Life Support Systems (EOLSS); Sydow, A., Ed.; Eolss Publisher: Oxford, UK, 2009. [Google Scholar]
- Enarson, E.; Morrow, B.H. A gendered perspective: The voices of women. In Hurricane Andrew: Ethnicity, Gender, and the Sociology of Disasters; Peacock, W.G., Morrow, B.H., Gladwin, H., Eds.; International Hurricane Center, Laboratory for Social and Behavioral Research: Miami, FL, USA, 1997; pp. 116–140. [Google Scholar]
- Rygel, L.; O’Sullivan, D.; Yarnal, B. A method for constructing a Social Vulnerability Index: An application to hurricane storm surges in a developed country. Mitig. Adapt. Strateg. Glob. Chang. 2006, 11, 741–764. [Google Scholar] [CrossRef]
- Cutter, S.L.; Mitchell, J.T.; Scott, M.S. Revealing the vulnerability of people and places: A case study of Georgetown county, South Carolina. Ann. Assoc. Am. Geogr. 2000, 90, 713–737. [Google Scholar] [CrossRef]


| Variables | Vulnerability Categories | ||||
|---|---|---|---|---|---|
| 1 | 2 | 3 | 4 | 5 | |
| Geomorphology | Rocky, cliffed coasts | Medium cliffs, indented coasts | Low cliffs, alluvial plains | Cobble Beaches, Lagoons | Sandy beaches, deltas |
| Shoreline Erosion (−)/ Accretion (+) rate (m/year) | >(+1.5) | (+1.5)–(+0.5) | (+0.5)–(−0.5) | (−0.5)–(−1.5) | <(−1.5) |
| Coastal Slope (%) | >12 | 12–9 | 9–6 | 6–3 | <3 |
| Relative Sea-Level rise (mm/year) | <1.8 | 1.8–2.5 | 2.5–3.0 | 3.0–3.4 | >3.4 |
| Mean Wave Height (m) | <0.3 | 0.3–0.6 | 0.6–0.9 | 0.9–1.2 | >1.2 |
| Mean Tide Range (m) | <0.2 | 0.2–0.4 | 0.4–0.6 | 0.6–0.8 | >0.8 |
| Physical Vulnerability | very low | low | moderate | high | very high |
| Variables | Physical Vulnerability Classes | |||||
|---|---|---|---|---|---|---|
| 1 | 2 | 3 | 4 | 5 | ||
| Very Low | Low | Moderate | High | Very High | ||
| a. | Geomorphology | 40.0 | 12.2 | 10.0 | 14.6 | 23.2 |
| b. | Shoreline Change | 0.2 | 2.8 | 91.2 | 5.3 | 0.5 |
| c. | Coastal Slope | 55.5 | 8.3 | 7.9 | 14.1 | 14.3 |
| d. | Relative Sea-level Rise | 0.0 | 100.0 | 0.0 | 0.0 | 0.0 |
| e. | Significant Wave Height | 33.4 | 39.4 | 23.4 | 3.8 | 0.0 |
| f. | Tidal Range | 100.0 | 0.0 | 0.0 | 0.0 | 0.0 |
| CVI values | <1.2 | 1.2–3.2 | 3.2–5.2 | 5.2–7.1 | >7.1 | |
| CVI (%) | 46.5 | 18.7 | 17.5 | 12.0 | 5.2 | |
| Variables | Social Vulnerability Classes | |||||
|---|---|---|---|---|---|---|
| 1 | 2 | 3 | 4 | 5 | ||
| Very Low | Low | Moderate | High | Very High | ||
| a. | Population Density | 0.0 | 34.2 | 65.8 | 0.0 | 0.0 |
| b. | Share of Women in t.p. | 16.4 | 5.5 | 65.8 | 12.3 | 0.0 |
| c. | Share of Persons above 65 in t.p. | 13.7 | 26.0 | 50.7 | 5.5 | 4.1 |
| d. | Share of Children below 5 in t.p. | 4.1 | 11.0 | 57.5 | 16.4 | 11.0 |
| e. | Share of foreign-born in t.p. | 0.0 | 8.2 | 39.7 | 17.8 | 34.2 |
| f. | Share of Low Educated in t.p. | 8.2 | 31.5 | 45.2 | 4.1 | 11.0 |
| SVI | Number of Communities | 8 | 15 | 22 | 14 | 14 |
| (%) | 11.0 | 20.5 | 30.1 | 19.2 | 19.2 | |
© 2018 by the authors. Licensee MDPI, Basel, Switzerland. This article is an open access article distributed under the terms and conditions of the Creative Commons Attribution (CC BY) license (http://creativecommons.org/licenses/by/4.0/).
Share and Cite
Tragaki, A.; Gallousi, C.; Karymbalis, E. Coastal Hazard Vulnerability Assessment Based on Geomorphic, Oceanographic and Demographic Parameters: The Case of the Peloponnese (Southern Greece). Land 2018, 7, 56. https://doi.org/10.3390/land7020056
Tragaki A, Gallousi C, Karymbalis E. Coastal Hazard Vulnerability Assessment Based on Geomorphic, Oceanographic and Demographic Parameters: The Case of the Peloponnese (Southern Greece). Land. 2018; 7(2):56. https://doi.org/10.3390/land7020056
Chicago/Turabian StyleTragaki, Alexandra, Christina Gallousi, and Efthimios Karymbalis. 2018. "Coastal Hazard Vulnerability Assessment Based on Geomorphic, Oceanographic and Demographic Parameters: The Case of the Peloponnese (Southern Greece)" Land 7, no. 2: 56. https://doi.org/10.3390/land7020056