Article

Understanding Pollinator Habitat Conservation under Current Policy Using Economic Experiments

by
Chian Jones Ritten
1,*,
Christopher Bastian
1,
Jason F. Shogren
2,
Thadchaigeni Panchalingam
3,
Mariah D. Ehmke
1 and
Gregory Parkhurst
4
1
Department of Agricultural and Applied Economics, University of Wyoming, Laramie, WY 82071, USA
2
Department of Economics and Finance, University of Wyoming, Laramie, WY 82071, USA
3
Department of Agricultural, Environment, and Development Economics, Ohio State University, 2120 Fyffe Road, Columbus, OH 43210, USA
4
Independent Researcher, Ogden, UT 84401, USA
*
Author to whom correspondence should be addressed.
Submission received: 14 July 2017 / Revised: 17 August 2017 / Accepted: 18 August 2017 / Published: 24 August 2017
(This article belongs to the Special Issue Land, Environment, and Policy)

Abstract

:
Pollinators provide critical ecosystems services vital to the production of numerous crops in the United States’ agricultural sector. However, the U.S. is witnessing a serious decline in the abundance and diversity of domestic and wild pollinators, which threatens U.S. food security. In response, the U.S. Department of Agriculture has created the Pollinator Habitat Initiative (CP-42) to induce landowners to create quality habitat for pollinators by planting beneficial crops and wildflowers on Conservation Reserve Program (CRP)-eligible land. Landowners’ potential conservation decisions under CP-42 and the resulting impact on land use decisions regarding crop production are not well-understood. We examine these issues by designing an economic experiment that simulates landowners’ decisions to enroll in CP-42. As our motivating example, we focus on how CP-42 might affect crop production patterns and the resulting returns in Goshen County, Wyoming. The results indicate that about 16% of CRP-eligible land would be enrolled. Based on the relatively low CP-42 payment, our subjects remove only lower value crops from production. Our results suggest that (1) all dry wheat and sunflower production and a portion of barley, corn, and dry beans could be taken out of production when transferred to pollinator habitat, and (2) that habitat fragmentation would likely occur, which would reduce the efficacy of pollination. Overall, our results suggest that there are significant limits to the overall effectiveness of the CP-42 policy.

1. Introduction

Pollinators provide critical ecosystems services vital to the production of numerous crops in the United States’ agricultural sector [1,2,3]. It is estimated that more than 65 percent of the wild plants [4] and nearly 70 percent of the crops used for human consumption depend on animal pollination [1,5]. The absence of insect pollination would reduce crop production by up to 32 percent [6]. Due to its role in agriculture, pollination contributes nearly U.S. $215 billion annually to the global economy, and $24 billion to the U.S. economy [7].
Despite this critical role pollination plays in agriculture, we are witnessing a substantial decline in the abundance and diversity of domestic and wild pollinators [8,9]. The U.S. has seen drastic wild and managed (primarily honeybees) pollinator declines. Managed honeybees have had losses of more than 30 percent on average each year since 2006 [8]. The total number of managed honeybee colonies has decreased from five million in the 1940s to about 2.6 million in the 2000s [8]. Koh et al. [10] estimates that between 2008 and 2013, bee abundance declined across 23 percent of considered land area in the U.S. Several studies provide evidence for steep declines in wild North American bumble bee species [11,12]. In addition, 20 Lepidoptera species that provide pollination, including butterflies and moths, are on the list of endangered species [13]. Due to the dependence of nutritionally essential crops (e.g., fruits, nuts, and berries) on pollinators, the loss of pollinator species puts U.S. food security at risk [14].
Habitat loss and fragmentation are the primary factors causing declines for both managed and wild pollinators [3]. The transformation of natural landscapes into intensive agricultural landscapes fragments habitats crucial to many ecosystem services, including pollination [4,15]. Monoculture crops, field margin elimination, and the decline of crop rotations with pollinator-friendly crops are detrimental for many pollinator species. Most monoculture crops, such as corn and wheat that are prevalent in the Midwest, do not fulfill the pollen or nectar needs of many pollinator species [16]. As a result, large monoculture crop fields are associated with decreasing wild bee abundance, since more diversified landscapes offer diversified foraging sources for pollinators and an enhanced diversity of pollinators [10,17,18].
The spatial distribution of habitat resources is also a limiting factor for wild bees [19]. There is an increase in pollinator losses with increased fragmentation of landscapes [20]. Fragmented pollinator habitat results in smaller patches of forage, impairing the survival of many pollinators [2]. Several species of wild pollinators need undisturbed habitat for nesting and foraging [21]. The availability of forage sources that are interspersed throughout the landscape is necessary for pollinators that travel long distances for their nutritional requirements. Cross-boundary interconnectedness and the proximity of one native habitat to the next are critical for effective pollinator habitats [22].
In response to the dwindling population and habitat for pollinators, the U.S. has introduced policy to help mitigate declining numbers and promote diversity. In 2014, President Barack Obama released a presidential memorandum establishing the Pollinator Health Task Force and outlining actions across federal government agencies to increase and improve pollinator habitats [7]. The Environmental Protection Agency (EPA) focuses on actions to protect pollinators from pesticide exposure [23]. The 2008 Farm Bill also initiated programs to create, maintain, and protect habitat for pollinators [24].
One of the policies most likely to affect land use change to promote pollinator habitat is the U.S. Department of Agriculture Pollinator Habitat Initiative (CP-42) under the broader category of the Conservation Reserve Program (CRP). Established in 2008, CP-42 is a voluntary incentive mechanism in which landowners establish plots of wildflowers and legumes in exchange for a one-time payment of $150 per acre in addition to a 50 percent cost share for practice establishment and CRP payments [25]. Land is enrolled in CP-42 for ten years and must establish specific wildflowers and legumes that are vital for pollinator species [26]. Eligible land under CP-42 is required to have been cropland in four of the six previous years. This suggests that enrolled land will most likely be removed from agricultural production.
Because of how relatively recently CP-42 was established and a lack of enrollment data, landowners’ enrollment decisions and the resulting change in crop production and fragmentation of habitat have yet to be determined. Enrollment decisions by landowners depend on the value of the agricultural productivity of the land. In theory, if the payment received from enrollment exceeds the productive value of the land, the parcel of land will be enrolled. Once enrolled, the agricultural production of the land is removed, leading to reductions in crop production. The resulting decline in crop production can have far-reaching and unintended consequences. These consequences include a reduction in the quantity of crops produced resulting in a potential shortage of supply, price fluctuations of the specific and related crops, and impacts on related industries due to a potential lack of derived demand for seeds, chemicals, and fertilizers. It is critical to understand the nature of land taken out of production relative to the pollinator habitat potentially created by the program when evaluating this policy.
In addition to crop production changes, the resulting distribution of pollinator habitat established under CP-42 can influence the efficacy of the program. Even though the ecological literature is inconclusive about the desired spatial pattern that is beneficial for insect pollinators, cross-boundary habitats with proximity to each other are generally preferred over fragmented habitats [14,22]. Understanding the spatial pattern of habitat created under this policy becomes important when projecting the potential impact on the rebound and support of pollinator populations.
Even though the potential consequences of CP-42 could be immense for both pollinators and crop production, no reported study evaluates the land use changes, pollinator habitat creation, and habitat fragmentation resulting from this policy. A lack of actual detailed enrollment data precludes spatially explicit analyses of resulting cropping decisions and habitat creation under this program. Thus, we use economic experiments to understand impending program enrollment decisions and the resulting land use change to address this gap in the literature.
Past research shows that land use decisions are driven by landscape characteristics and the economic returns of alternate uses [27]. In addition, the spatial pattern of the land targeted by a conservation policy and the returns to habitat conservation compared to the returns to land production influence the efficacy of conservation policies [28]. To estimate enrollment decisions accurately under CP-42, the real incentives faced by landowners and the spatial heterogeneity of land targeted by the program need to be realistically modeled. We use Goshen County, Wyoming, as a motivating case study area to create realistic incentives that landowners would face when considering the decision to enroll in CP-42. Goshen County is an important cropping area in Wyoming, as it has the most CRP-eligible land. To accurately model land use and landowner returns to land, we use historical county data to develop a representative cropping pattern specific to Goshen County, Wyoming, including related profitability associated with actual crop production and program enrollment. Using this spatial data and related incentives from CP-42, economic experiments designed to elicit participants’ conservation enrollment decisions for cropland are conducted to measure changes in land use associated with the conversion of arable lands in the study area from agricultural production to pollinator habitat. We explore the data from our experiments to understand better the potential distribution of crop acreages enrolled and the level of pollinator habitat fragmentation resulting from CP-42.

2. Materials and Methods

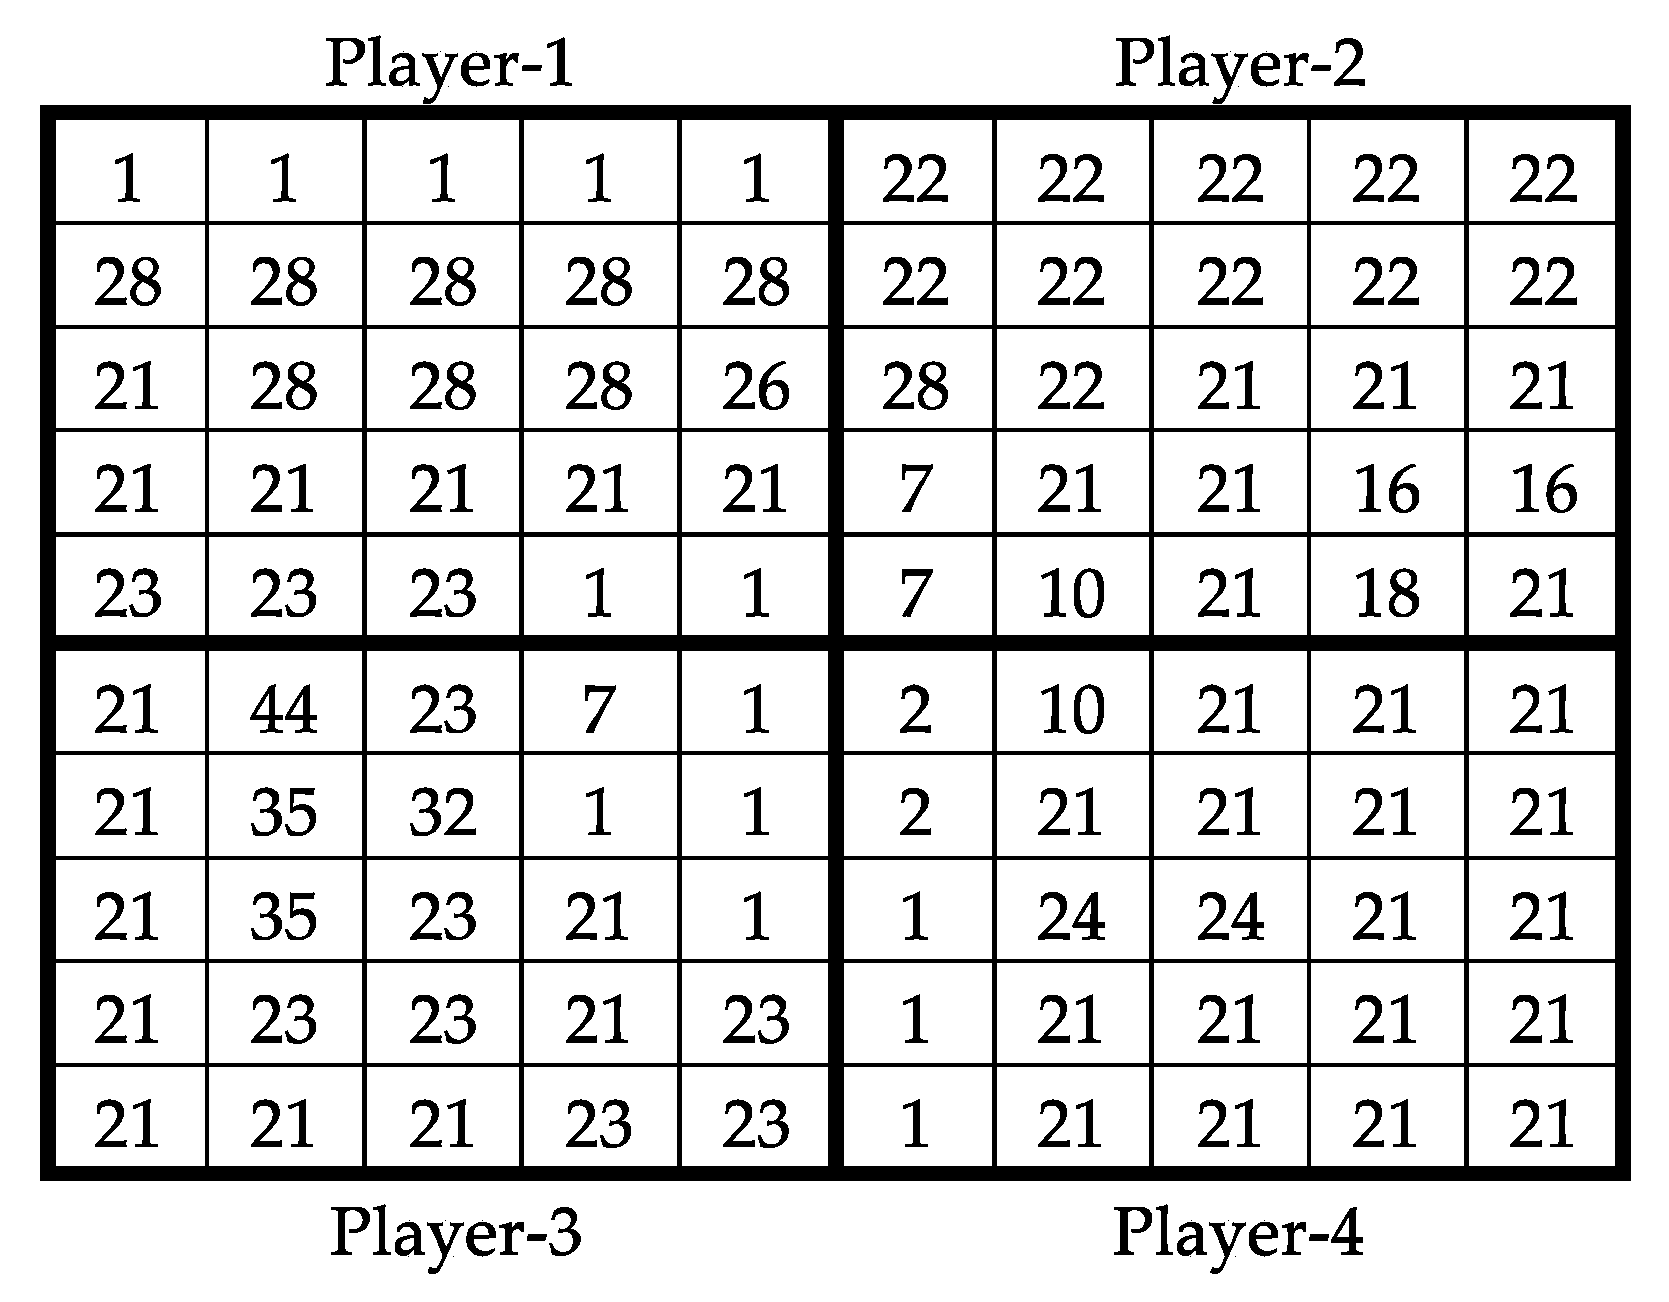
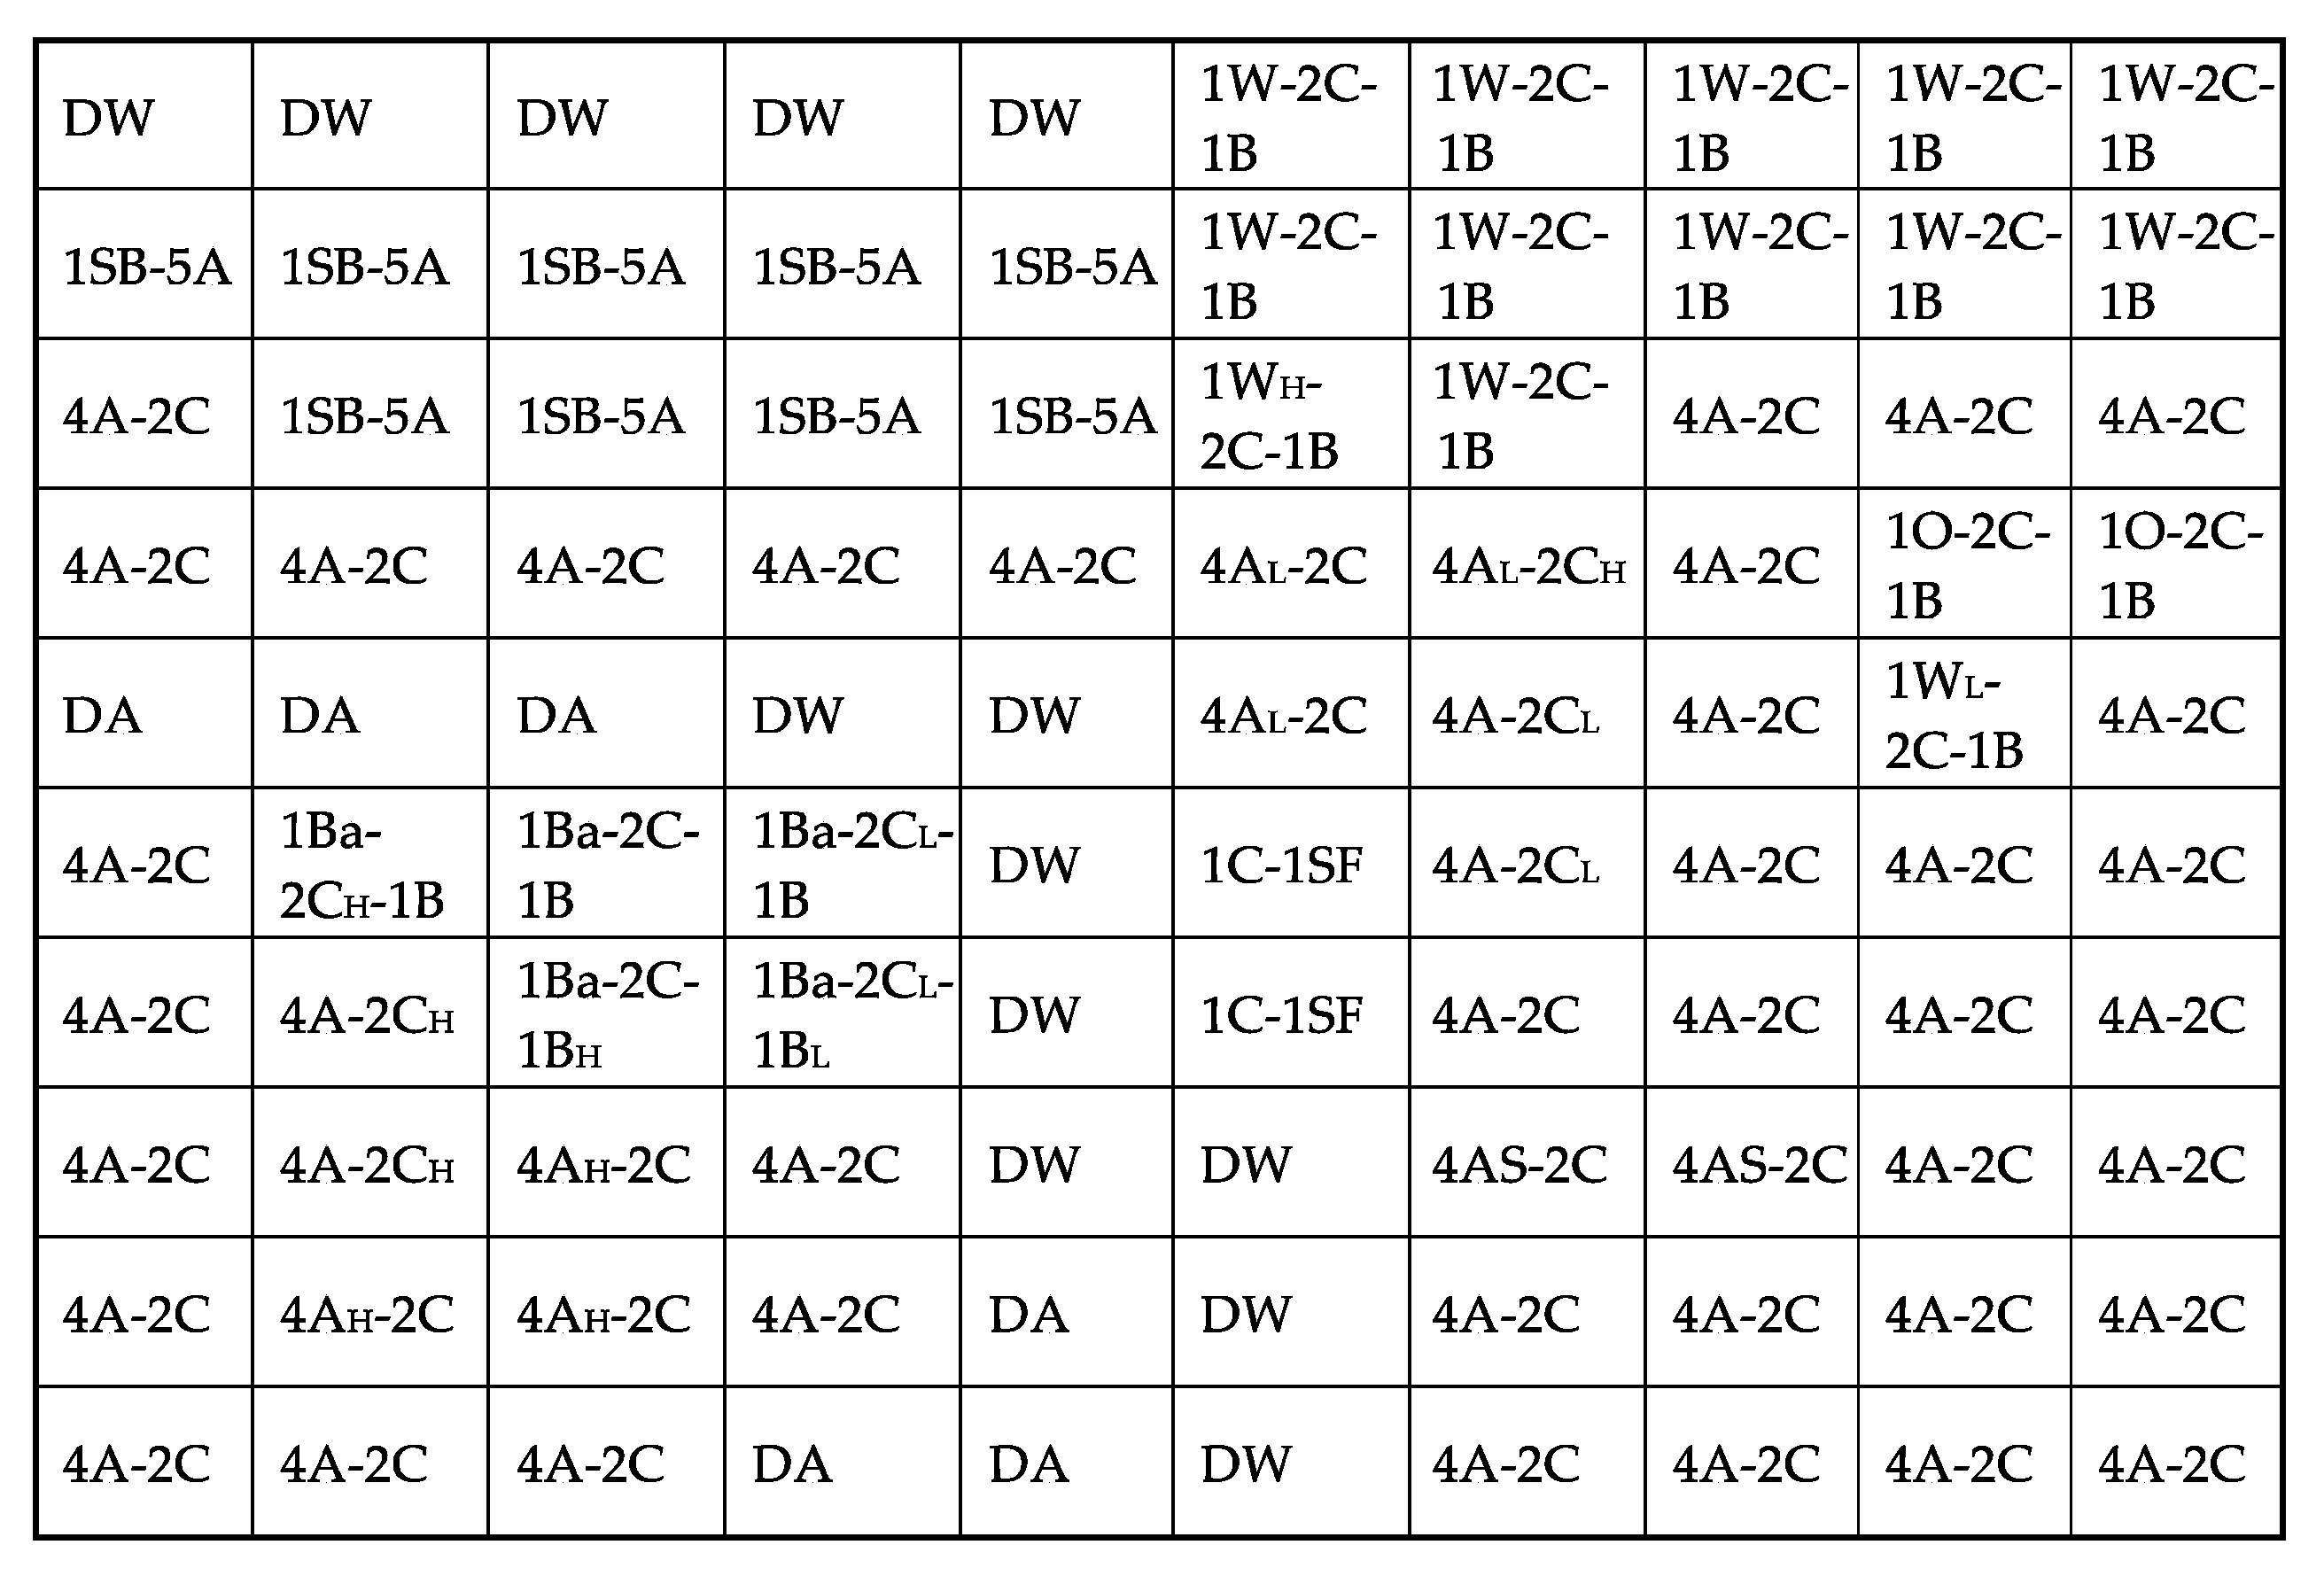
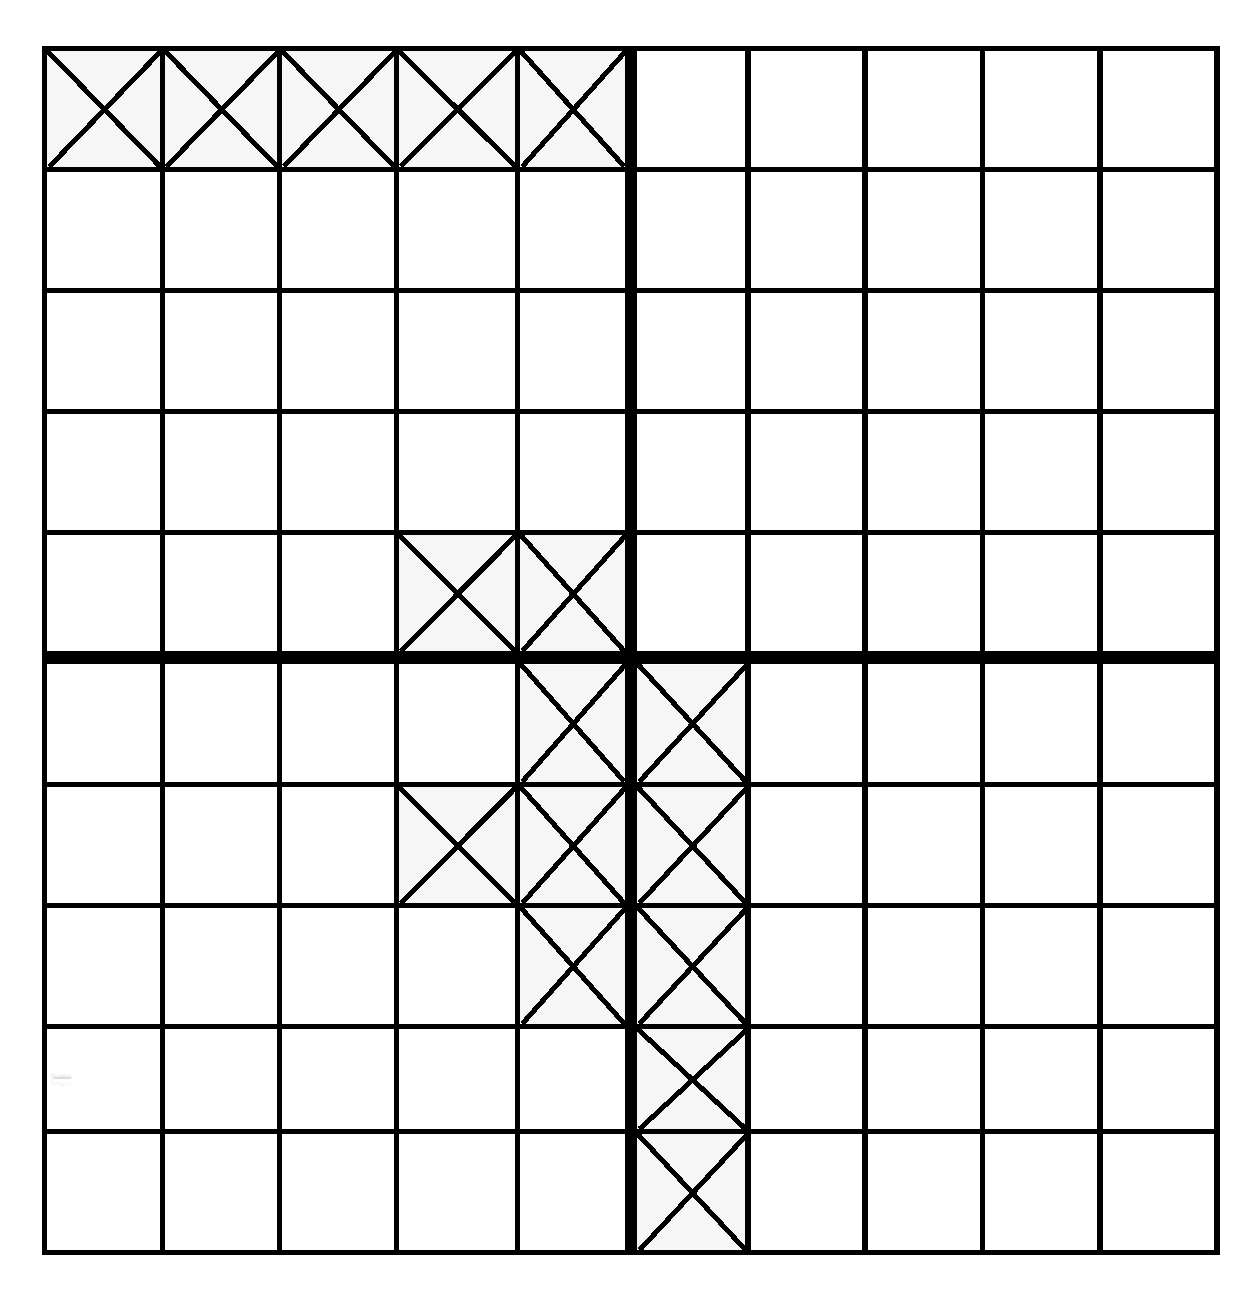
2.1. Land Use, Related Profit Values, and Creation of the Land Decision Grid

Enrollment under CP-42 requires land to meet all CRP requirements, including being historical cropland. To accurately model landowner decisions in CP-42, we created a representative land grid of actual cropping patterns and realistic returns or profits using Goshen County, Wyoming, as a model. Goshen County has the most CRP-eligible land of all counties in Wyoming, and has the highest total value of agricultural products sold, including both crops and livestock [29]. Located in Southeast Wyoming, bordering Nebraska, Goshen County included the cultivation of a range of crops in 536 farms consisting of 241,491 acres in 2012 [22].
The model grid was delineated into a ten by ten land grid, where each land parcel in the grid represents an eighth section equivalent to 80 acres of land. The entire land grid represented a total of 8000 acres, and is modeled to represent four landowners each owning 2000 acres. These values are similar to the average farm size in Goshen County of 1735 acres [29].
To determine the cropping patterns of CRP-eligible land for the model, we obtained data on harvested crops in Goshen County from the agricultural census reports for Wyoming in 2012 [30]. We also gathered information on typical crop rotations practiced in Goshen County from extension specialists in the County. Table 1 reports the nature of the crop rotations and the prevalence of their practice. We used this information to calculate the prevalence of individual crops and crop rotations in the land grid model.
Landowner decisions should depend on the relative enrollment incentives under CP-42 compared to the value of crop production. If CP-42 payments exceed the profitability of land, it is expected that a landowner will decide to enroll the land and remove it from agricultural production. In contrast, if the profitability of the land remaining in agricultural production exceeds the value of CP-42 and CRP payments, then the landowner is expected not to enroll the land. Determining the profitability of crop rotations prevalent in Goshen County was necessary to create the proper incentives for experiment participants. The profitability of each cropping rotation was determined using calculated per acre profits per year for single crops with data from the Wyoming Agricultural Statistics 2012, University of Nebraska-Lincoln (UNL) crop budgets 2013 [30,31], and from Lee et al.’s [32] profit estimates. To allow for variations in the profitability of crops, we adopted the method outlined by Lee et al. [32]. Allowing for variability in crop profitability, Table 2 shows the average profits generated for individual crops based on the 2012 prices. High and low profit were obtained at the 95th and 5th percentiles of individual crops. Dry beans yield the highest profits at $883.22 per acre, followed by sugar beets with a profit of $829.31, and corn with a profit of $807.21. Marginal lands provide negative profits for certain crops, such as corn, oats, sunflower, and winter wheat.
Since the objective of creating the profitability of cropping land is to model landowner enrollment decisions, profitability measures had to reflect the ten-year enrollment period under CP-42. To compare productive profitability to enrollment payments, we calculated the net present value (NPV) of profits and potential enrollment payments over a ten-year period. A discount rate of five percent was used, as this was representative of a standard operating loan for the case study area in 2012. Table 3 reports these net present value estimates of crop profits for relevant crop rotations. In addition, we report the net present value for an eighth section, since it provides the profitability of the land patterns used in the created land grid. Although some individual crops may have negative profits, all crop rotations have positive average profits.
Even within the same county, there is strong heterogeneity in profitability of the land. Land that is amenable to a barley, high profit corn, and dry beans rotation generates the highest profit per year at over $570 per acre. In contrast, marginal land that is suitable for only dry wheat production will generate an average of three dollars per acre. Based on the CP-42 payment ($150 per acre) in addition to the $26 per acre average yearly CRP payment in Wyoming, the average payment over the ten-year enrollment period is $410. When properly discounted, the NPV of enrolled land is approximately $400. These values provide the realistic incentives associated with crop production versus program enrollment.
From the profitability of the crop rotations listed in Table 3 along with the prevalence of each crop in Goshen County, Wyoming, provided in Table 1, a representative model of crop pattern was developed for the study area (see Figure 1). This spatial distribution of cropping patterns was developed in consultation with crop extension specialists in Goshen County to best model the County. We assume lower productive land with lower profits is on the border of individually held land. In addition, more productive land is assumed to be grouped together in relatively small patches that are scattered throughout the landscape. Specialty crops, such as oats, sunflowers, alfalfa seed, and sugar beets, are assumed to be grown by only one landowner. Each of these assumptions is based on current cropping patterns in Goshen County.
The values in Figure 1 were used to assign the various cropping rotations values in the created experimental land grid. This spatially explicit experimental land grid was the basis for participant decisions regarding whether land would be enrolled in CP-42. Note that this approach of making actual land profitability values endogenous in the experimental land grid has not been done previously in these types of reported experiments.

2.2. Experimental Economics Methods

To understand landowner enrollment decisions under CP-42, we use economic experiments designed to elicit conservation behavior from participants. This type of laboratory experiment has been used previously in the literature and shown to work well to test incentive mechanisms for land conservation decisions [33,34,35]. Since CP-42 is a relatively new policy and actual detailed enrollment data are unavailable, we use these economic experiments to predict behavior under the implementation of this policy. Economic experiments reduce the need for expensive policy trial and error, and they have been shown to provide valuable information that can be less expensive than field or pilot data [36,37]. Moreover, the use of laboratory experiments eliminates selection bias (as subjects are randomly assigned), allows for better control over variables and influencing factors, and full control over information available to participants [38].
We conducted the experiments in the fall of 2015 at the University of Wyoming. The experiments received approval by the Institutional Review Board, #20150406CR00732. Eight sessions were conducted with four participants each, generating a sample of 28 participants. We used a software program designed by Dr. Gregory Parkhurst to run the experiments. At the beginning of each session, participants were given an information packet that included a copy of printed instructions and a record sheet to record earnings. Participants were asked to read and sign a human subjects’ consent form that followed standard experiment protocol. Participants were informed that their participation was completely voluntary and they could leave the experiment at any time.
Following standard economic experiment procedure, the instructions were read aloud by the experimenter. The monitor gave the instructions to participants in both printed form and on the computer. Participants were informed they would be presented with a grid of land cells and be making decisions to either cross out (enroll) their land cells (representing a parcel of land in their grid) or not (leave in production). The instructions did not include information on the context of crossing a cell out. Participants were not told the context of their decisions in the experiment (enrolling in CP-42), since this type of parallelism can lead to loss of control over experimental outcomes [39]. The experiment used the created ten by ten land grid model, consistent with previous studies (e.g., [33,40]). Four participants were included in each experimental session representing landowners from Goshen County, Wyoming. Each one of these landowners managed 25 land parcels in a five by five sub-grid and identified as Player-1, Player-2, Player-3, and Player-4 (Figure 2). The numerical values in each cell were reported in a currency called tokens (100 tokens = $1.00), and each value represented the profitability of eighth sections of different crop rotations in Goshen County. Profitability in each cell was scaled down by a factor of 100 (rounded) to give values that were easily understandable to participants, but retained their relative values previously described for creating the land grid.
The participants were told that they would be paid at the end of the session based on their decisions in the experiment. They were then told the numerical values listed in each cell were the values (in tokens) that they would earn if they did not cross a cell out. Next, they were instructed that if they decided to cross a cell out, they would not earn the productive value but would earn a set value. The set value for crossed out cells represented the net present value of enrollment under CP-42, which was determined at a value of four in the experiment. Lastly, participants were told that their payment would be based on the sum of the productive value of those cells not crossed out plus the enrollment value for each crossed out cell.
Prior to the actual experiment, the participants participated in three practice rounds. Then, each session consisted of up to ten rounds [33]. To avoid end-game-effects, the participants were informed that the experiment had a random number of rounds [41]. As CP-42 requires a minimum of ten years of enrollment, ten rounds equated to 100 years in real time, a reasonable estimate for the length of time of farm ownership in Goshen County.
The computer randomly assigned each participant to one of the four positions (i.e., Player-1 through Player-4). Each participant saw his or her five by five sub-grid in a dark green color on the computer screen, and was able to determine his or her position in relation to the other participants. The grid positions for all participants were constant for all rounds to allow for repeated interactions among the same participants. Repeated interactions more accurately describe reality, as landowners do not typically change locations within such a small geographic area at such small time periods.
The participants had access to an on-screen calculator to determine the estimated payment of their choices before making a decision. The participants could select different configurations of enrolled land parcels and determine the estimated value before the actual choices were submitted. The calculator assured that no participant would make incorrect decisions due to manual computational errors.
A chat window appeared at the bottom of the screen to allow the participants to communicate with one another (we allowed participants to communicate with all other participants, but we limited the number of chats to three per participant per round). This option was designed to recreate real-life situations in which landowners can communicate with each other regarding policy implementation prior to their enrollment deadline. The chat component is important as, outside of the laboratory, decisions to conserve land can impact neighbors. In the real world, neighbors have the ability to discuss their decisions with each other when these decisions may affect one another. In addition, the chat option is also consistent with previous economic experiments modeling land use conservation decisions (e.g., [40]).
Each participant had three minutes to make a decision and submit his or her choices per round. The time remaining in a round was displayed on the computer screen for the participants to see. If a participant ran out of time, the computer submitted the choice representing the configuration of parcels conserved on the computer at the moment time lapsed. In case a participant had not chosen any parcels to conserve by the end of a round, the computer submitted the choices with no conserved parcels.
At the end of each round, the participants could see their enrollment decisions and the number of tokens earned. In addition, the participants could see the decisions made by the other participants. A history box also appeared on the computer screen that displayed a record of the parcels that each participant in the group conserved in previous rounds. The players could use this information to make decisions in future rounds. The players were also told that the provided record sheets were an optional method to record choices and earnings in each round.
During the experiment, we expect each participant to make decisions that maximize his or her own payoffs. Based on the experimental design, we expect each participant to make enrollment decisions based on the following:
max π = i = 1 25 P i x i + 4 ( 1 x i )
where i represents one of the 25 parcels each participant has control over in the experiment, xi is equal to one if parcel i is not enrolled (left in production) and zero if enrolled, and Pi is the productive value of parcel i when left in production. If parcel i is not conserved, then xi is equal to one and the payoff from that parcel will be its associated productive value, Pi. Conversely, if parcel i is enrolled, then xi is equal to zero, and the payoff is four tokens (the value of a crossed-out cell) for that particular parcel.
The experiment lasted an average of an hour and a half. Participant earnings accumulated over the rounds and were paid in cash at the end of the experiment. The cash payouts averaged between $22 and $26 per person.

3. Results

We expect the crops to be taken out of production that have lower productive values. Since most cropland in Goshen County is devoted to crop rotations, assuming that the lowest value crops will be taken out of production can lead to erroneous conclusions. The crop rotations that have the lowest values are more accurately those that will be taken out of production for program enrollment. These expectations are confirmed in our data analysis.
Based on the enrollment decisions of participants in the experiment, the projected spatial distribution of pollinator habitat is 16 percent of eligible agricultural land in Goshen County, Wyoming. This amounts to 1280 acres conserved within each 8000 acres of agricultural land. Table 4 shows the projected crop rotations taken out of production and the number of acres enrolled.
Our analysis of the experimental results indicates that all dry wheat and sunflower acres will likely be converted to pollinator habitat. Additionally, reductions of 20% barley acreage, nine percent of dry beans acreage, and four percent of corn acreage are expected to occur from enrollment decisions under CP-42. All crop rotations taken out of production and enrolled are lower profitability rotations. Enrolled land is most likely marginal land and associated with lower profit from the production of corn and dry beans. These results show that although some of the lowest value crops are projected to be taken out of production, such as low profit corn and sunflowers (see Table 2), this is not always the case. Some crops that generate negative profits (oats or low profit winter wheat) on average are expected to stay in production, while other higher value crops are removed (e.g., barley) given the overall profitability of the rotation these crops are in.
The experimental results appear to be relatively robust. All eight experimental sessions reached the same outcome by the last round in terms of amount and contiguity of conservation, and about 80 percent of the sessions found the economically optimal outcome from the first round itself (Figure 3).
Only slight deviations in participant decisions were witnessed in rounds one, six, and seven of the ten rounds in the experimental sessions (Figure 4). Figure 4 shows the average percentage of parcels conserved by the group of four participants in each round for the eight sessions.
Not surprisingly, given the spatial distribution of lower value crop rotations, the resulting spatial pattern of enrollment expected under CP-42 produces some level of fragmentation of pollinator habitat (Figure 3). The contiguity of conserved parcels, measured by the number of common borders between eighth sections, was 16, which represents nine percent of the total number of common borders. Since deviations from this amount of conservation and contiguity would lead to a decrease in payments, any desire from an agency to change these amounts would have to further compensate landowners to achieve this goal.

4. Discussion

Under the current Pollinator Habitat Initiative, CP-42, our results suggest that an agricultural landscape similar to that in Goshen County, Wyoming, could result in nearly one-sixth of CRP-eligible land enrolled. The land that is expected to be enrolled, however, will be marginal land with lower production values. In regions with more marginal land, the enrollment rate of CRP-eligible land will most likely be higher. However, in regions with higher value land and higher value production, the rate of enrollment will be much lower. The efficacy of CP-42 in creating suitable habitat for pollinators depends on the ability for marginal land to produce quality habitat, since it is most likely this type of land that will be enrolled. Also, the effectiveness of the policy may vary across the U.S. as the productive value of land varies. In areas with high value agriculture, the rate of enrollment will most likely be minimal, resulting in little additional pollinator habitat under CP-42. However, the policy is expected to be most effective, in term of enrollment rates, in areas with lower agricultural productivity.
The spatial pattern of enrollment from the experiment also suggests that CP-42 may produce fragmented landscapes given the spatial distribution of land productivity for cropping. Since fragmentation is a primary cause of declining pollinator populations, the efficacy of CP-42 to produce quality habitat for pollinators may be hindered. The resulting habitat fragmentation under the policy will likely hinder the rebound and support of pollinator populations. (The resulting fragmentation in other areas will vary based on the heterogeneity of productive values in those areas. Areas with little heterogeneity will most likely have limited fragmentation, while regions with much more diversity in productive values will experience more fragmentation.)
The results from the experiment suggest many obstacles in the incentive mechanism that currently exists under CP-42 to create quality pollinator habitat. To reach desired pollinator outcomes, additional incentives may be needed under CP-42. Future policy may consider increasing payments to encourage higher rates of enrollment. To combat fragmentation, augmented policy may need to include an agglomeration-type bonus that offers landowners an additional payment for enrolled land that borders other enrolled land, either within their own land or between landowners. Previous studies show the potential effectiveness of this bonus in creating habitat continuity (e.g., [33,40]).
In addition to the limited effectiveness of CP-42 producing suitable pollinator habitat, other obstacles may exist. The consequences of relatively low value land parcels being taken out of production could be a reduction in the quantity produced of certain crops in the case study area. If this were to be true nationally, widespread reductions in some of these crops could impact supplies and prices, but the overall heterogeneity of land quality and related crop rotations would likely mitigate much of this risk. The overall impacts from enrollment could create some price fluctuations of those and related crops that are substitutes or complements. Related impacts are also expected for industries supporting this crop production through derived demand for seeds, chemicals, and fertilizers. Yet, these direct and indirect impacts would likely be more local or regional in nature. This concentration of potential economic impacts could create political opposition to this program from constituents in heavily enrolled areas. Depending on the magnitude of the effects on crop production and related sectors, such conservation promotions could be criticized by stakeholders such as farmers, ranchers, agricultural input suppliers, animal feed processors, and consumers, further inhibiting the efficacy of the policy.
Although laboratory experiments can help inform policy, we understand and appreciate their limits. One assumption when using laboratory experiments to understand and predict real-world decisions is that the insight gained can be extrapolated outside the lab to the general world, which may fail to hold [42]. Yet, in the absence of field data and to gain control over extemporaneous factors, laboratory experiments are a powerful tool to improve knowledge [37]. Since the current experiment, along with many others, uses college students as the main source of participants, one potential question is whether their responses are representative of the general population. On net, evidence exists to support the idea that students can be representative. For instance, Nagler et al. [41] find that student participants respond to experimental incentives in the same way as agricultural producers, the population of interest in the current study, which adds support to the generalizability of laboratory experiments (also see Falk and Heckman [37]).
Overall, this study contributes to our understanding of the potential land use and pollinator habitat impacts of CP-42. Proponents of biodiversity conservation espouse the need to understand actual land values and economic incentives in land markets [43]. This research helps to explore the incorporation of actual land profitability estimates in creating the economic incentives for experimental participants faced with land conservation decisions. Moreover, these results illustrate the importance of the actual spatial distribution of land productivity and related returns when evaluating this and other conservation policies. Further research associated with pollinator habitat conservation and related land use decision-making remains if the goal of improved pollinator populations is to be achieved.

Acknowledgments

The authors appreciate the generous funding for this project from the Wyoming Open Spaces Initiative Competitive Grants Program. The funds received from this grant funded the experimental study. No funds were given for the costs to publish in open access.

Author Contributions

Chian Jones Ritten, Christopher Bastian, Jason Shogren, Mariah Ehmke, and Gregory Parkurst conceived and designed the experiments; Gregory Parkhurst wrote the experimental computer program; Chian Jones Ritten and Thadchaigeni Panchalingam performed the experiments; Thadchaigeni Panchalingam, Chian Jones Ritten, Christopher Bastian, Jason Shogren, and Mariah Ehmke analyzed the data; Chian Jones Ritten, Christopher Bastian, and Jason Shogren led the paper drafting with comments and contributions from other coauthors.

Conflicts of Interest

The authors declare no conflict of interest. The founding sponsors had no role in the design of the study; in the collection, analyses, or interpretation of data; in the writing of the manuscript; and in the decision to publish the results.

References

  1. Aizen, M.; Harder, L. The global stock of domesticated honey bees is growing slower than agricultural demand for pollination. Curr. Biol. 2009, 19, 915–918. [Google Scholar] [CrossRef] [PubMed]
  2. Goulson, D. Effects of introduced bees on native ecosystems. Annu. Rev. Ecol. Evol. Syst. 2003, 34, 1–26. [Google Scholar] [CrossRef]
  3. Potts, S.; Biesmeijer, J.; Kremen, C.; Neumann, P.; Schweiger, O.; Kunin, W. Global pollinator declines: Trends, impacts and drivers. Trends Ecol. Evol. 2010, 25, 345–353. [Google Scholar] [CrossRef] [PubMed]
  4. Kearns, C.; Inouye, D.; Waser, N. Endangered mutualisms: The conservation of plant–pollinator interactions. Annu. Rev. Ecol. Evol. Syst. 1998, 29, 83–112. [Google Scholar] [CrossRef]
  5. Klein, A.; Vaissiere, B.; Cane, J.; Steffan-Dewenter, I.; Cunningham, S.; Kremen, C.; Tscharntke, T. Importance of pollinators in changing landscapes for world crops. Proc. R Soc. B. 2007, 274, 303–313. [Google Scholar] [CrossRef] [PubMed]
  6. Zulian, G.; Maes, J.; Paracchini, M.L. Linking land cover data and crop yields for mapping and assessment of pollination services in Europe. Land 2013, 2, 472–492. [Google Scholar] [CrossRef] [Green Version]
  7. The White House Fact Sheet: The Economic Challenge Posed by Declining Pollinator Populations. Available online: http://www.whitehouse.gov/the-press-office/2014/06/20/fact-sheet-economic-challenge-posed-declining-pollinator-populations (accessed on 5 August 2015).
  8. United States Department of Agriculture, Agricultural Research Service. Survey Reports Fewer Winter Honey Bee Losses. Available online: http://www.ars.usda.gov/is/pr/2014/140515.htm (accessed on 3 August 2015).
  9. Goulson, D.; Lye, G.; Darvill, B. Decline and conservation of bumble bees. Ann. Rev. Entomol. 2008, 53, 191–208. [Google Scholar] [CrossRef] [PubMed]
  10. Koh, I.; Lonsdorf, E.; Williams, N.; Brittain, C.; Isaacs, R.; Gibbs, J.; Ricketts, T. Modeling the Status, trends, and impacts of wild bee abundance in the United States. Proc. Natl. Acad. Sci. USA 2015, 113, 140–145. [Google Scholar] [CrossRef] [PubMed]
  11. Golick, D.; Ellis, M. An update on the distribution and diversity of Bombus in Nebraska (Hymenoptera: Apidae). J. Kans. Entomol. Soc. 2006, 79, 341–347. [Google Scholar] [CrossRef]
  12. Tommasi, D.; Miro, A.; Higo, H.; Winston, M. Bee diversity and abundance in an urban setting. Can. Entomol. 2004, 136, 851–869. [Google Scholar] [CrossRef]
  13. Committee on the Status of Pollinators in North America, National Research Council. Status of Pollinators in North America; The National Academies Press: Washington, DC, USA, 2007; Available online: http://www.nap.edu/catalog/11761.html (accessed on 8 June 2016).
  14. Vanbergen, A. Insect pollinators initiative. Threats to an ecosystem service: Pressures on pollinators. Front. Ecol. Environ. 2013, 11, 251–259. [Google Scholar] [CrossRef] [Green Version]
  15. Winfree, R.; Aguilar, R.; Vázquez, D.; LeBuhn, G.; Aizen, M. A meta-analysis of bees’ responses to anthropogenic disturbance. Ecology 2009, 90, 2068–2076. [Google Scholar] [CrossRef] [PubMed]
  16. Cane, J.H.; Tepedino, V.J. Causes and extent of declines among native North American invertebrate pollinators: Detection, evidence, and consequences. Conserv. Ecol. 2001, 5, 1. [Google Scholar] [CrossRef]
  17. Blaauw, B.; Isaacs, R. Flower plantings increase wild bee abundance and the pollination services provided to a pollination-dependent crop. J. Appl. Ecol. 2014, 51, 890–898. [Google Scholar] [CrossRef]
  18. Peterseon, J.; Nault, B. Landscape diversity moderates the effects of bee visitation frequency to flowers on crop production. J. Appl. Ecol. 2014, 52, 1347–1356. [Google Scholar] [CrossRef]
  19. Roulston, T.; Goodell, K. The role of resources and risks in regulating wild bee populations. Ann. Rev. Entomol. 2011, 56, 293–312. [Google Scholar] [CrossRef] [PubMed]
  20. Naug, D. Nutritional stress due to habitat loss may explain recent honeybee colony collapses. Biol. Conserv. 2009, 142, 2369–2372. [Google Scholar] [CrossRef]
  21. Kluser, S.; Peduzzi, P. Global Pollinator Decline: A Literature Review; United Nations Environment Programme: Nairobi, Kenya, 2007. [Google Scholar]
  22. Goldman, R.; Thompson, B.; Daily, G. Institutional incentives for managing the landscape: Inducing cooperation for the production of ecosystem services. Ecol. Econ. 2007, 64, 333–343. [Google Scholar] [CrossRef]
  23. United States Environmental Protection Agency. Protecting Bees and Other Pollinators from Pesticides|US EPA. Available online: https://www.epa.gov/pollinator-protection (accessed on 13 July 2015).
  24. Using Farm Bill Programs for Pollinator Conservation: Technical Note No. 88. Available online: https://plants.usda.gov/pollinators/Using_Farm_Bill_Programs_for_Pollinator_Conservation.pdf (accessed on 17 March 2017).
  25. United States Department of Agriculture, Farm and Foreign Agricultural Services. Conservation Reserve Program. (CRP) Maintaining Beehives on CRP Acreage. Available online: http://www.fsa.usda.gov/Internet/FSA_File/7722287_honey_bees.pdf (accessed on 5 April 2015).
  26. United States Department of Agriculture, Farm Service Agency. Pollinators. Available online: https://www.fsa.usda.gov/programs-and-services/economic-and-policy-analysis/natural-resources-analysis/pollinators/index (accessed on 10 June 2017).
  27. Rashford, B.S.; Walker, J.A.; Bastian, C.T. Economics of grassland conversion to cropland in the Prairie Pothole Region. Conserv. Biol. 2010, 25, 276–284. [Google Scholar] [CrossRef] [PubMed]
  28. Rashford, B.S.; Bastian, C.T.; Cole, J.G. Agricultural land-use change in prairie Canada: Implications for wetland and waterfowl habitat conservation. Can. J. Agric. Econ. 2011, 59, 185–205. [Google Scholar] [CrossRef]
  29. United States Department of Agriculture, National Agricultural Statistics Service. Wyoming Agricultural Statistics; 2012. Available online: https://www.nass.usda.gov/Statistics_by_State/Wyoming/Publications/Annual_Statistical_Bulletin/ (accessed on 4 June 2016).
  30. United States Department of Agriculture, National Agricultural Statistics Service. Annual Statistical Bulletin; 2014. Available online: https://www.nass.usda.gov/Statistics_by_State/Wyoming/Publications/Annual_Statistical_Bulletin/WY_2014_Bulletin.pdf (accessed on 4 June 2015).
  31. University of Nebraska-Lincoln, Institute of Agriculture and Natural Resources. Nebraska Crop Budgets. 2013. Available online: http://cropwatch.unl.edu/economics/budgets (accessed on 11 June 2015).
  32. Lee, B.; Ritten, J.; Kniss, A.; Bastian, C. Profitability comparison for glyphosate-resistant and conventional sugarbeet production systems. J. Sugar Beet. Res. 2014, 51, 2–13. [Google Scholar] [CrossRef]
  33. Parkhurst, G.; Shogren, J. Spatial incentives to coordinate contiguous habitat. Ecol. Econ. 2007, 64, 344–355. [Google Scholar] [CrossRef]
  34. Banerjee, S.; Kwasnica, A.; Shortle, J. Agglomeration bonus in small and large local networks: A laboratory examination of spatial coordination. Ecol. Econ. 2012, 84, 142–152. [Google Scholar] [CrossRef]
  35. Banerjee, S.; de Vries, F.; Hanley, N.; van Soest, D. The impact of information provision on agglomeration bonus performance: An experimental study on local networks. Am. J. Agric. Econ. 2014, 96, 1009–1029. [Google Scholar] [CrossRef]
  36. Bastian, C.T.; Menkhaus, D.J.; Nagler, A.M.; Ballenger, N.S. Ex ante evaluation of alternative agricultural policies in laboratory posted bid markets. Am. J. Agric. Econ. 2008, 90, 1208–1215. [Google Scholar] [CrossRef]
  37. Falk, A.; Heckman, J.J. Lab experiments are a major source of knowledge in the social sciences. Science 2009, 326, 535–538. [Google Scholar] [CrossRef] [PubMed]
  38. Samuelson, L. Economic theory and experimental economics. J. Econ. Lit. 2005, 43, 65–107. [Google Scholar] [CrossRef]
  39. Friedman, D.; Sunder, S. Experimental Methods: A Primer for Economists; Cambridge University Press: New York, NY, USA, 1994. [Google Scholar]
  40. Parkhurst, G.; Shogren, J.; Bastian, C.; Kivi, P.; Donner, J.; Smith, R. Agglomeration bonus: An incentive mechanism to reunite fragmented habitat for biodiversity conservation. Ecol. Econ. 2002, 41, 305–328. [Google Scholar] [CrossRef]
  41. Nagler, A.M.; Menkhaus, D.J.; Bastian, C.T.; Ehmke, M.D.; Coatney, K.T. Subsidy incidence in factor markets: An experimental approach. J. Agric. Appl. Econ. 2013, 45, 17–33. [Google Scholar] [CrossRef]
  42. Levitt, S.D.; List, J.A. What do laboratory experiments measuring social preferences reveal about the real world? J. Econ. Perspect. 2007, 21, 153–174. [Google Scholar] [CrossRef]
  43. Armsworth, P.R.; Daily, G.C.; Kareiva, P.; Sanchirico, J.N. Land market feedbacks can undermine biodiversity conservation. Proc. Natl. Acad. Sci. USA 2006, 103, 5403–5409. [Google Scholar] [CrossRef] [PubMed]
Figure 1. Land pattern of crop rotations.
Land 06 00057 g001
Figure 2. Players and Land Grid.
Land 06 00057 g002
Figure 3. Pattern of enrolled land.
Land 06 00057 g003
Figure 4. Average percentage of enrolled land per round.
Land 06 00057 g004
Table 1. Crop rotations and prevalence of their practice in Goshen County, Wyoming.
Crop RotationsPercentage of Total Cropland
4 years irrigated alfalfa, 2 years corn48
Dry wheat13
1 year winter wheat, 2 years corn, 1 year dry bean13
1 year sugar beet, 5 years irrigated alfalfa9
Dry alfalfa6
1 year barley, 2 years corn, 1 year dry beans5
1 year oats, 2 years corn, 1 year dry beans2
1 year corn, 1 years sunflower2
4 years alfalfa seed, 2 years corn2
Table 2. Profits for single crops.
CropsProfits per Year ($ per Acre)
Dry beans (high profit)883.22
Sugar beets829.31
Corn (high profit)807.21
Winter wheat (high profit)507.20
Dry beans 409.45
Alfalfa (high profit)307.97
Dry alfalfa293.40
Alfalfa 273.66
Barley267.10
Corn262.47
Winter wheat188.18
Dry beans (low profit)54.14
Dry wheat3.00
Alfalfa (low profit)0.00
Winter wheat (low profit)−0.30
Sun flower−14.49
Oats−119.74
Corn (low profit)−137.53
Source: Wyoming Agricultural Statistics 2013, UNL crop budgets 2013 for Nebraska, and Lee et al., 2015.
Table 3. Net present values (NPVs) of the crop rotations for ten years.
Crop RotationsProfits per Year ($ per Acre)NPVs per Eighth Section ($)
1 year barley, 2 years high profit corn, 1 year dry beans (1Ba-2CH-1B)5724423
4 years alfalfa, 2 years high profit corn (4A-2CH)4523487
1 year barley, 2 years corn, 1 year high profit dry beans (1Ba-2C-1BH)4193234
1 year sugar beet, 5 years alfalfa (1SB-5A)3662828
1 year high profit winter wheat, 2 years corn, 1 year beans (1WH-2C-1B)3602783
4 year alfalfa seed, 2 years corn (2AS-2C)3072372
1 year barley, 2 years corn, 1 year dry beans (1Ba-2C-1B)3002320
Always dry alfalfa (DA)2932266
4 years high profit alfalfa, 2 years corn (4AH-2C)2942261
1 years winter wheat, 2 years corn, 1 year beans (1W-2C-1B)2812167
4 years alfalfa, 2 years corn (4A-2C)2702085
4 years low profit alfalfa, 2 years high profit corn (4AL-2CH)2692078
1 years low profit winter wheat, 2 years corn, 1 year beans (1WL-2C-1B)2341803
1 year oats, 2 years corn, 1 year beans (1O-2C-1B)2041573
4 years alfalfa, 2 years low profit corn (4A-2CL)1371055
1 year barley, 2 years low profit corn 1 year dry beans (1Ba-2CL-1B)100775
4 years low profit alfalfa, 2 years corn (4AL-2C)87675
1 year corn, 1 year sunflowers (1C-1S)22174
1 year barley, 2 years low profit corn, 1 year low profit dry beans (1Ba-2CL-1BL)1289
Always dry wheat (DW)323
Table 4. Projected crop rotations and number of acres taken out of production.
Crop Rotations Practiced Prior to EnrollmentNumber of Acres Enrolled per 8000 Acres Cropland
Dry wheat1040
1 year barley, 2 years low profit corn, 1 year low profit dry bean80
1 year corn, 2 years sun flower160

